
OH - KY | MIDWEST | MULTIFAMILY
QUARTERLY REVIEW
QUARTER 4 2024

STATS AND INFO SOURCED BY


4TH QUARTER SNAPSHOT
MIDWEST MARKETS LOCATIONS
CINCINNATI, OHIO
LOUISVILLE, KENTUCKY
DAYTON, OHIO
LEXINGTON, KY
COLUMBUS, OHIO
NATIONALLY
Quarterly Rent Growth- 1.1%
Rent- $1,828
Rent/SF- $2.011
Occupancy- 94.2%
Units Completed in last 4 quarters-
Annual Supply Growth- 2.7%
Units under construction- 628,649
Projected Supply growth- 3.2%
Annual Job Change- 2.7mm

Rent Growth- (0.6)%
$1,437
$1.540 Occupancy- 96.1%
Units Completed in last 4 quarters3,049 Annual Supply Growth- 1.8% Units under construction- 4,904
Projected Supply growth- 2.86% Annual Job Change- 4,700


LEXINGTON LOUISVILLE DAYTON COLUMBUS


NATIONAL OUTLOOK

Since the global pandemic, apartment demand has swung between highs and lows. Demand temporarily plummeted in the early days of the pandemic, only to come roaring back to reach record highs in late 2021 and early 2022. During that time, pent-up demand pulled forward considerable volumes of apartment absorption, essentially capturing two years’ worth of demand in just a couple of quarters. As such, demand started cooling in 2nd quarter 2022 and plummeted for more than a year. More recently, demand has rebounded nationwide to a near record level in 2024’s 4th quarter. In the October to December time frame, the core 150 markets posted demand for 230,819 units, far exceeding the 4th quarter average in the 10 years leading THE OUTLOOK


THE ECONOMY
• U.S. economic growth generally followed along a slow trajectory in the 10 years leading up to the pandemic, with real gross domestic product (GDP) growing at an average annual rate of just under 2.5% from 2010 to 2019. The economic fallout from the pandemic caused the economy to contract nearly 30% in 2nd quarter 2020 before rebounding around 35% in 3rd quarter 2020.
• Most recently, GDP expanded at seasonally adjusted annual rate of 2.3% in 4th quarter 2024, based on an advance estimate from the Bureau of Economic Analysis. That recent expansion was below the 3.1% growth seen in 3rd quarter 2024 but an improvement from the 1.6% expansion in 1st quarter 2024.
• Meanwhile, in the year-ending November 2024, the nation’s job base expanded 1.4% year-over-year with the net addition of nearly 2.2 million jobs, according to not seasonally adjusted data from the Bureau of Labor Statistics. That contrasts with the annual job base contraction of roughly 12% to 13% in April and May 2020, when year-over-year job losses got as deep as 20 million.
• By comparison, the nation’s employment base grew roughly 1.0% to 2.5% annually from early 2011 through early 2020, adding an average of about 2.3 million jobs annually during that period.
• Despite job losses stemming from the pandemic, the current employment base in the U.S. now sits nearly 9.6 million jobs or 6.3% above the pre- pandemic level in February 2020. As the economy continues to expand beyond its pre-pandemic employment base, job growth is expected to ease over the coming year.
• Among individual markets, New York-White Plains recorded the nation’s strongest annual job growth performance during the year-ending November 2024, with a net increase of roughly 107,300 jobs.
• Four other markets gained more than 40,000 jobs: Houston-The Woodlands-Sugar Land (62,500 jobs), Los Angeles-Long Beach-Glendale (46,200 jobs), Dallas-Plano-Irving (43,200 jobs) and Phoenix-Mesa-Scottsdale (42,900 jobs).
• For proportional change, Boise City and Stockton-Lodi led with job base expansions of 4.3%, followed by Richmond with annual job growth of 3.4%.
CINCINNATI


supply occupancy
1| New apartment completions in Cincinnati were elevated by local standards recently, as 3,049 units delivered in 2024. Completions over the past year expanded the local inventory base by 1.8%.
In the past year, supply was greatest in Central Cincinnati and Boone County/Erlanger. 2| Annual new supply averaged 2,168 units, and annual inventory growth averaged 1.3% over the past five years. During that period, new supply was concentrated in Central Cincinnati and Campbell/Kenton Counties, which received 39% of the market’s total completions. 3| At the end of 2024, there were 4,904 units under construction with 2,958 of those units scheduled to complete in the next four quarters. 4| Scheduled deliveries in the coming year are expected to be concentrated in Central Cincinnati, receiving more than a third of new supply.
rent
1| Over the past five years, annual change in effective asking rents in Cincinnati ranged from 2.0% to 11.9%. In 4th quarter 2024, effective asking rents for new leases were up 2.6% year- over-year. 2| That annual rent performance was below the market’s five-year average of 5.6%. Looking at product classes in Cincinnati, Class B led for rent performance over the past five years. 3| In 4th quarter 2024, annual effective rent change registered at 2.4% in Class A units, 3.5% in Class B units and 1.3% in Class C units. Among submarkets, the strongest annual rent change performances over the past year were in Southeast Cincinnati (5.1%), North Cincinnati (4.2%) and West Cincinnati (4.2%). 4| The weakest performances were in Butler County (-1.3%) and North Central Cincinnati (0.2%). Over the past five years, rent growth was strongest in Southeast Cincinnati. 5| In the coming year, effective asking rent change in Cincinnati is expected to remain around the current level. 6| As of 4th quarter 2024, effective asking rental rates in Cincinnati averaged $1,437 per month, or $1.540 per square foot.
1| Occupancy in the Cincinnati apartment market has ranged from 94.6% to 98.1% over the past five years, averaging 96.2% during that period. Over the past year, occupancy gained 1.3 points, with the 4th quarter 2024 rate landing at 96.1%. 2| Looking at product classes in Cincinnati, 4th quarter 2024 occupancy registered at 94.2% in Class A units, 96.5% in Class B units and 96.9% in Class C units. Occupancy in the more affordable Class C product was generally tightest over the past five years. 3| Among submarkets, 4th quarter 2024 occupancy was strongest in North Cincinnati, Southeast Cincinnati and Northeast Cincinnati/Warren County at 97.1% to 97.3%. The weakest readings were seen in Central Cincinnati (92.8%) and North Central Cincinnati (94.3%). 4| Over the past five years, Campbell/Kenton Counties generally led for occupancy.
demand
1| Over the past five years, annual absorption in Cincinnati has ranged from net move-outs from 1,630 units to demand for 5,136 units, averaging 1,633 units annually during that time. 2| In 2024, the market recorded demand for 5,136 units. 3| Among submarkets, the strongest absorption over the past five years was seen in Campbell/Kenton Counties, Northeast Cincinnati/ Warren County and Central Cincinnati. Those areas accounted for 51% of the market’s total demand over the past five years. 4| In the past year, demand was greatest in Butler County, Central Cincinnati and Northeast Cincinnati/ Warren County.
economy
1| Prior to the pandemic, Cincinnati’s real gross metropolitan product grew at an average annual rate of 2.2% from 2015 to 2019. During that same fiveyear period, job growth averaged 1.4% annually, with roughly 15,200 jobs added on average each year. 2| In 2020, COVID-19 mitigation measures and limited business activity caused the local economy to contract as much as 8.0% year-over-year in 2nd quarter. 3| In 2024, the metro’s inflation-adjusted economic output expanded 1.8%. At the same time, the metro recorded a net gain of 4,700 jobs, expanding the employment base 0.4%. 4| As such, Cincinnati’s unemployment rate in November 2024 rose 0.9 points yearover-year to 3.9%, in line with the national average of 4.0%. 5| During the past year, job gains in Cincinnati were most pronounced in the Education/ Health Services sector followed by Leisure/Hospitality Services and Government. Despite job losses stemming from the pandemic, Cincinnati’s current employment base now sits roughly 58,800 jobs or about 5% above the pre-pandemic level in February 2020.
3,049 units completed in past 12 months 4,904 units currently in progress
LOWEST OVERALL PERFORMING SUBMARKETS

UNITS UNDER CONSTRUCTION
RENT GROWTH SECTOR


other highlights
• Chick-fil-A Supply, a product and supply subsidiary of Chick-fil-A, is constructing a $100 million, 270,000-square-foot distribution center in Elsmere, KY, located within Cincinnati’s Boone County/Erlanger submarket. Announced in December by Gov. Andy Beshear, this facility on 28 acres in Kenton County is expected to be operational by 2026 and will service about 150 regional restaurants and include rail access. Expected to create significant job opportunities, it represents part of Kentucky’s broader food and beverage industry growth. Chick-fil-A Inc. will donate $25,000 to a local Feeding America partner upon the facility’s launch, reports industry The Construction Broadsheet.
• Hillman Solutions Corp., a major hardware distributor, is planning to build a new $95 million corporate headquarters on the site of the former Forest Fair Mall in Forest Park in North Cincinnati. The project, revealed by the Butler County Land Bank in November, involves a 638,000-square-foot building with room for future expansion and additional parking. The development is expected to bring 900 jobs to the area and includes plans for mixed-use development with shopping and dining options. Construction is set to begin soon, with the new headquarters potentially operational by 2027, according to local news.
• The Mercantile Library in Cincinnati has recently reopened after a $5.3 million renovation and expansion project, reports Cincinnati Business Courier. The historic downtown library, which has been a favorite spot for readers since 1835, now features more than 30 new work and study areas, a members’ lounge, private study nooks, and over 20,000 new books. The renovation also includes a new haiku and poetry room, additional restrooms, and technological improvements to better serve its members.
• The Factory 52 entertainment district in North Central Cincinnati’s Norwood area is entering its second development phase, which includes adding
living spaces, townhomes and hotels. Local real estate management company PLK Communities, the developer behind Factory 52, aims to transform this area into a vibrant mixed-use hub with residential and commercial spaces, according to local news. The expansion is expected to bring significant economic benefits and new amenities to the community.
• The Northern Kentucky Area Development District released the results of a study in September, finding the eight-county region’s job creation is outpacing its housing availability. The 280-page report highlights a significant lack of affordable housing in Northern Kentucky and estimates a five-year need for 6,650 additional housing units to support economic development, according to local news.
• Local developer Fischer Homes is addressing the housing gap in Northern Kentucky by developing new residential communities in Independence, near the Cincinnati/Northern Kentucky International Airport (CVG). The project aims to provide more affordable housing options to meet the growing demand in the area. Construction has already begun, and the development is expected to offer a range of housing types, including single-family homes and townhomes, to cater to diverse needs, reports Cincinnati Business Courier.
• One of the largest transactions in the Cincinnati apartment market during calendar 2024 was the sale of Tapestry Ridge to Passco Companies. The property was appraised for $72.3 million, or roughly $270,800 per unit, according to data from Real Capital Analytics. In July, Arlington Properties sold this 267-unit community, which was built in 2022 on 38 acres off Dixie Highway in Covington, within the Campbell/Kenton Counties submarket. The development transformed Northern Kentucky University’s former Covington campus into luxury apartments with views of the Ohio River and downtown Cincinnati. Community amenities include a resort-style saltwater pool with sun deck, an outdoor kitchen with dining terrace, a paw spa, a
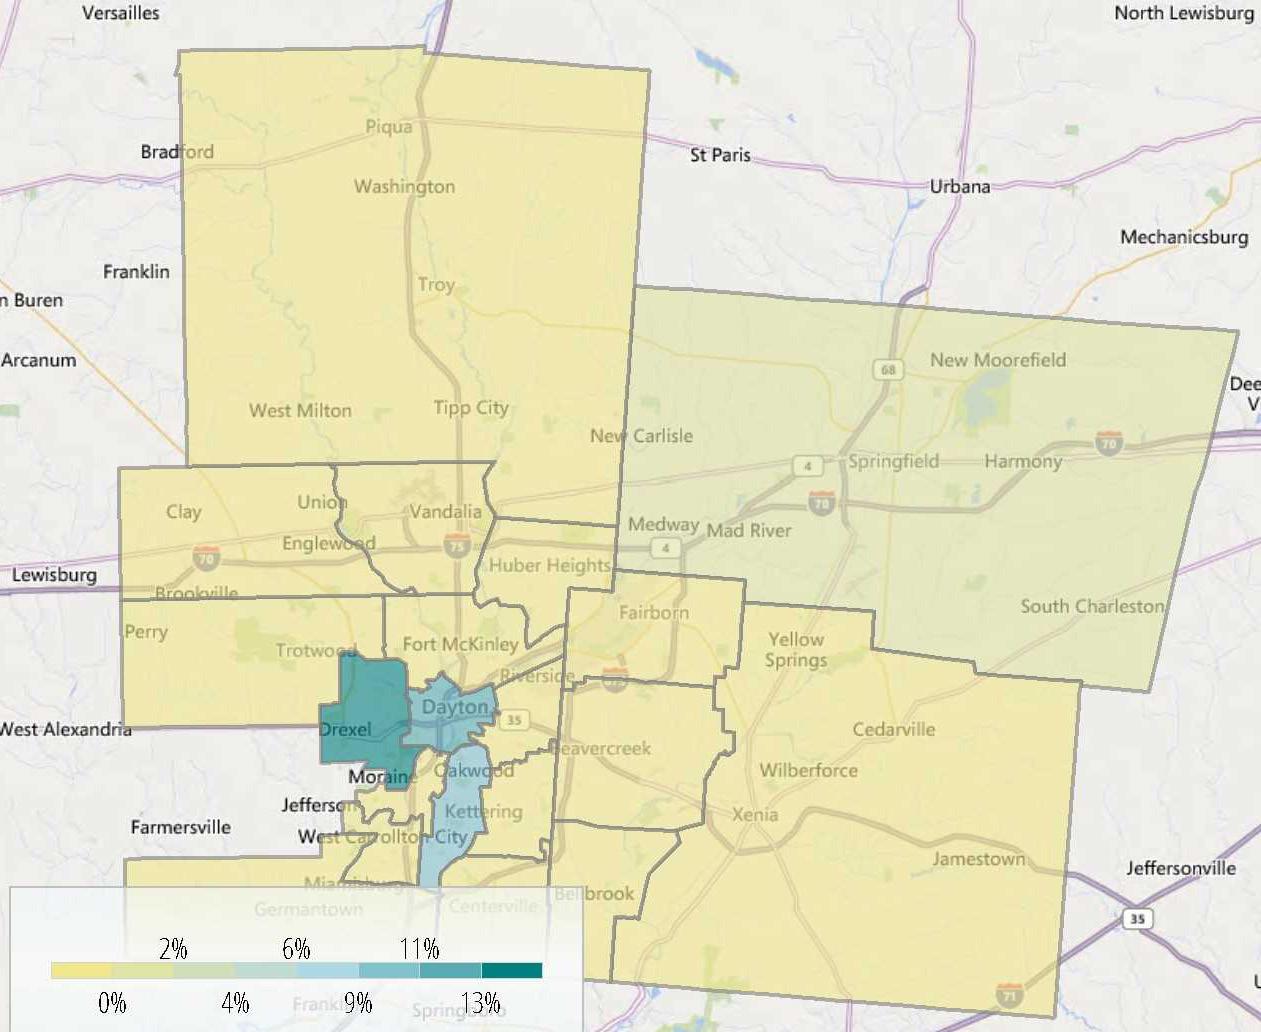
DAYTON
4 quarters- 830 Annual Supply Growth- 1.4%
Units under construction- 593
Projected Supply growth- 1.01% Annual Job Change- 600 QUARTER 4

supply occupancy
1| New apartment completions in Dayton were moderate by local standards recently, as 681 units delivered in 2024. Completions over the past year expanded the local inventory base 1.2%. In the past year, supply was greatest in Central Dayton/Kettering. 2| Annual new supply averaged 654 units, and annual inventory growth averaged 1.2% over the past five years. During that period, new supply was concentrated in Central Dayton/Kettering, which received 37% of the market’s total completions. 3| At the end of 2024, there were 550 units under construction with 393 of those units scheduled to complete in the next four quarters. 4| Scheduled deliveries in the coming year are expected to be limited to Central Dayton/Kettering and North Dayton/Miami County.
rent
1| Over the past five years, annual change in effective asking rents in Dayton ranged from 2.2% to 10.1%. 2| In 4th quarter 2024, effective asking rents for new leases were up 3.9% year-over-year. That annual rent performance was below the market’s five-year average of 5.6%. 3| Looking at product classes in Dayton, Class A led for rent performance over the past five years. 4| In 4th quarter 2024, annual effective rent change registered at 4.2% in Class A units, 4.3% in Class B units and 3.4% in Class C units. 5| Among submarkets, the strongest annual rent change performances over the past year were in Greene County (5.2%) and South Montgomery County (4.1%). The weakest performances were in North Dayton/Miami County (-0.7%) and Central Dayton/Kettering (3.8%). 6| Over the past five years, rent growth was strongest in South Montgomery County. 7| In the coming year, samestore effective asking rent change in Dayton is expected to slow from the current level. 8| As of 4th quarter 2024, effective asking rental rates in Dayton averaged $1,209 per month, or $1.307 per square foot.
1| Occupancy in the Dayton apartment market has ranged from 95.1% to 98.0% over the past five years, averaging 96.3% during that period. 2| Over the past year, occupancy gained 0.8 points, with the 4th quarter 2024 rate landing at 95.9%. 3| Looking at product classes in Dayton, 4th quarter 2024 occupancy registered at 94.5% in Class A units, 95.6% in Class B units and 97.3% in Class C units. Occupancy in Class C product was generally tightest over the past five years. 4| Among submarkets, 4th quarter 2024 occupancy was strongest in Greene County (97.9%) and South Montgomery County (96.0%). The weakest readings were seen in Northwest Dayton (93.0%) and North Dayton/Miami County (93.5%). 5| Over the past five years, Greene County generally led for occupancy. 6| During the coming year, occupancy in Dayton is expected to register around 96%.
the economy
1| Prior to the pandemic, Dayton’s real gross metropolitan product grew at an average annual rate of 1.4% from 2015 to 2019. During that same five-year period, job growth averaged 1.0% annually, with roughly 3,700 jobs added on average each year. 2| In 2020, COVID-19 mitigation measures and limited business activity caused the local economy to contract as much as 9.2% year-over-year in 2nd quarter. 3| In the year-ending 4TH quarter 2024, the metro’s inflation-adjusted economic output expanded 1.4%. At the same time, the metro recorded a net gain of 600 jobs, expanding the employment base 0.2%. 4| Dayton’s unemployment rate in August 2024 rose 0.6 points year-over-year to 4.4%, matching the national average of 4.4%. 5| During the past year, job gains in Dayton were most pronounced in the Education/ Health Services sector followed by Mining/Logging/Construction. 6| Despite job losses stemming from the pandemic, Dayton’s current employment base now sits roughly 1,500 jobs above the pre-pandemic level in February 2020.

681 units completed in past 12 months 550 units currently in progress
RENT GROWTH SECTOR


LOUISVILLE


1| New apartment completions in Louisville/Jefferson County were elevated recently, as 2,906 units delivered in 2024. With 198 units removed from existing stock over the past year, the local inventory base grew 2.8%. 2| In the past year, supply was greatest in Southwest Louisville. 3| Annual new supply averaged 2,157 units, and annual inventory growth averaged 2.3% over the past five years. During that period, new supply was concentrated in Northeast Louisville, Northwest Louisville and Southwest Louisville, which received 80% of the market’s total completions. 4| At the end of 2024, there were 1,970 units under construction with 1,629 of those units scheduled to complete in the next four quarters. 5| Scheduled deliveries in the coming year are expected to be concentrated in Northwest Louisville, Northeast Louisville and South Central Louisville.
supply occupancy rent
1| Over the past five years, annual change in effective asking rents in Louisville/Jefferson County ranged from a decline of 0.1% to an increase of 12.0%.
2| In 4th quarter 2024, effective asking rents for new leases were up 2.5% year-over-year. That annual rent performance was below the market’s fiveyear average of 5.1%. 3| Looking at product classes in Louisville/Jefferson County, Class A led for rent performance over the past five years. In 4th quarter 2024, annual effective rent change registered at 3.7% in Class A units, 2.5% in Class B units and 0.8% in Class C units. 4| Among submarkets, the strongest annual rent change performances over the past year were in Northeast Louisville (3.7%) and Central Louisville (3.2%). The weakest performances were in South Central Louisville (1.2%) and Northwest Louisville (1.3%). 5| Over the past five years, rent growth was strongest in South Central Louisville.
1| Occupancy in the Louisville/Jefferson County apartment market has ranged from 94.0% to 97.3% over the past five years, averaging 95.2% during that period. 2| Over the past year, occupancy gained 1.2 points, with the 4th quarter 2024 rate landing at 95.2%. 3| Looking at product classes in Louisville/Jefferson County, 4th quarter 2024 occupancy registered at 95.4% in Class A units, 94.7% in Class B units and 96.0% in Class C units. Occupancy in Class C product was generally tightest over the past five years. 4| Among submarkets, 4th quarter 2024 occupancy was strongest in Northwest Louisville (96.0%) and Northeast Louisville (95.8%). The weakest readings were seen in Southwest Louisville (93.3%) and Central Louisville (95.1%).
the economy
1| Prior to the pandemic, Louisville/Jefferson County’s real gross metropolitan product grew at an average annual rate of 2.2% from 2015 to 2019. During that same five-year period, job growth averaged 1.5% annually, with roughly 9,800 jobs added on average each year. 2| In 2020, COVID- 19 mitigation measures and limited business activity caused the local economy to contract as much as 7.8% year-over-year in 2nd quarter. 3| In 2024, the metro’s inflation-adjusted economic output expanded 1.8%. At the same time, the metro recorded a net gain of 8,500 jobs, expanding the employment base 1.2%. 4| As such, Louisville/Jefferson County’s unemployment rate in November 2024 rose 0.9 points year-over-year to 4.3%, above the national average of 4.0%. 5| During the past year, job gains in Louisville/Jefferson County were most pronounced in the Education/Health Services sector. 6| Despite job losses stemming from the pandemic, Louisville/Jefferson County’s current employment base now sits roughly 39,600 jobs or about 6% above the pre-pandemic level in February 2020.

2,906 units completed in past 12 months
HIGHEST OVERALL PERFORMING SUBMARKET
1,970 units currently in progress
LOWEST OVERALL PERFORMING SUBMARKETS
RENT GROWTH
SECTOR

EMPLOYMENT


Q4 2024 MARKET SNAPSHOT
LEXINGTON
Quarterly Rent Growth- 3.4%
Rent- $1,264 Rent/SF- $1.373
Occupancy- 95.6%
Units Completed in last 4 quarters- 731
Annual Supply Growth- 1.5%
Units under construction- 560
Projected Supply growth- 1.15%
Annual Job Change- 5,800 QUARTER 4


1| New apartment completions in Lexington-Fayette were moderate recently, as 807 units delivered in 2024. 2| Completions over the past year expanded the local inventory base 1.7%. 3| In the past year, supply was greatest in North Lexington. Annual new supply averaged 483 units, and annual inventory growth averaged 1.0% over the past five years. 4| During that period, new supply was concentrated in North Lexington, which received 47% of the market’s total completions. 5| At the end of 2024, there were 484 units under construction with all of those units scheduled to complete in the next four quarters. 6| Scheduled deliveries in the coming year are expected to be concentrated in South Lexington (412 units), with Downtown Lexington/University capturing the remainder of new supply.
supply occupancy rent
1| Over the past five years, annual change in effective asking rents in Lexington-Fayette ranged from a decline of 0.2% to an increase of 15.4%. 2| In 4th quarter 2024, effective asking rents for new leases were up 4.6% yearover-year. That annual rent performance was below the market’s five-year average of 6.7%. 3| Looking at product classes in Lexington- Fayette, Class A led for rent performance over the past five years. 4| In 4th quarter 2024, annual effective rent change registered at 6.1% in Class A units, 4.8% in Class B units and 1.6% in Class C units. 5| Among submarkets, the strongest annual rent change performance over the past year was in Downtown Lexington/University (5.0%). The weakest performance was in North Lexington (3.8%). Over the past five years, rent growth was strongest in South Lexington. 6| In the coming year, effective asking rent change in Lexington-Fayette is expected to slow from the current level. 7| As of 4th quarter 2024, effective asking rental rates in Lexington-Fayette averaged $1,266 per month, or $1.378 per square foot.
cOccupancy in the Lexington-Fayette apartment market has ranged from 94.3% to 97.6% over the past five years, averaging 95.8% during that period.
2| Over the past year, occupancy gained 0.5 points, with the 4th quarter 2024 rate landing at 95.9%. 3| Looking at product classes in Lexington-Fayette, 4th quarter 2024 occupancy registered at 96.9% in Class A units, 96.0% in Class B units and 94.7% in Class C units. 4| Occupancy in Class A and B product was generally tighter than Class C product over the past five years. 5| Among submarkets, 4th quarter 2024 occupancy was strongest in South Lexington (96.5%). The weakest reading was seen in Downtown Lexington/ University (94.2%). Over the past five years, North Lexington generally led for occupancy.
the economy
1| Prior to the pandemic, Lexington-Fayette’s real gross metropolitan product grew at an average annual rate of 1.9% from 2015 to 2019. During that same five-year period, job growth averaged 1.2% annually, with roughly 3,100 jobs added on average each year. In 2020, COVID-19 mitigation measures and limited business activity caused the local economy to contract as much as 8.0% year-over-year in 2nd quarter. 2| In 2024, the metro’s inflation-adjusted economic output expanded 2.4%. 3| At the same time, the metro recorded a net gain of 4,700 jobs, expanding the employment base 1.6%. 4| As such, Lexington-Fayette’s unemployment rate in November 2024 rose 0.9 points year-over-year to 4.0%, matching the national average. 5| During the past year, job gains in Lexington-Fayette were most pronounced in the Education/Health Services sector followed by Government. Despite job losses stemming from the pandemic, Lexington-Fayette’s current employment base now sits roughly 25,400 jobs or about 9% above the pre-pandemic level in February 2020.

RENT GROWTH


COLUMBUS
Quarterly Rent
(1.2)%
$1,353
$1.432 Occupancy- 94.6% Units Completed in last 4 quarters- 6,864
Supply Growth- 3.1% Units under construction- 10,827 Projected Supply growth- 5.13% Annual Job Change - (5,000) QUARTER 4


1| New apartment completions in Columbus were elevated recently, as 6,864 units delivered in 2024. With 609 units removed from existing stock over the past year, the local inventory base grew 3.1%. 2| In the past year, supply was greatest in Downtown Columbus/University District and Westerville/New Albany/Delaware at more than 1,600 units apiece. 3| Annual new supply averaged 5,224 units, and annual inventory growth averaged 2.6% over the past five years. During that period, new supply was concentrated in Downtown Columbus/University District and Westerville/New Albany/ Delaware, which received 46% of the market’s total completions. 4| At the end of 2024, there were 10,827 units under construction with 8,217 of those units scheduled to complete in the next four quarters.
supply occupancy rent
1| Over the past five years, annual change in effective asking rents in Columbus ranged from 1.1% to 11.4%. 2| In 4th quarter 2024, effective asking rents for new leases were up 2.9% year- over-year. That annual rent performance was below the market’s five-year average of 5.0%. 3| Looking at product classes in Columbus, Class B led for rent performance over the past five years. 4| In 4th quarter 2024, annual effective rent change registered at 2.8% in Class A units, 3.3% in Class B units and 2.4% in Class C units. Among submarkets, the strongest annual rent change performances over the past year were in Southeast Columbus (5.3%) and Reynoldsburg/ Far East Columbus (3.9%). The weakest performances were in Downtown Columbus/University District (0.1%) and West Columbus (2.3%). 5| Over the past five years, rent growth was strongest in North Central Columbus. In the coming year, same-store effective asking rent change in Columbus is expected to increase slightly from the current level. 6| As of 4th quarter 2024, effective asking rental rates in Columbus averaged $1,353 per month, or $1.432 per square foot.
1| Occupancy in the Columbus apartment market has ranged from 94.2% to 97.6% over the past five years, averaging 95.6% during that period.
2| Over the past year, occupancy gained 0.3 points, with the 4th quarter 2024 rate landing at 94.6%. 3| Looking at product classes in Columbus, 4th quarter 2024 occupancy registered at 94.3% in Class A units, 94.7% in Class B units and 94.7% in Class C units. Occupancy in the more affordable Class C product was generally tightest over the past five years. 4| Among submarkets, 4th quarter 2024 occupancy was strongest in Reynoldsburg/Far East Columbus (95.6%) and North Central Columbus (95.5%). The weakest readings were seen in Downtown Columbus/University District and Southeast Columbus, with both below 93%.
the economy
1| Prior to the pandemic, Columbus’ real gross metropolitan product grew at an average annual rate of 3.1% from 2015 to 2019. During that same five-year period, job growth averaged 1.8% annually, with roughly 19,400 jobs added on average each year. 2| In 2020, COVID-19 mitigation measures and limited business activity caused the local economy to contract as much as 6.9% year-over-year in 2nd quarter. 3| In 2024, the metro’s inflation-adjusted economic output expanded 2.2%. 4| At the same time, the metro recorded a net loss of 5,000 jobs, shrinking the employment base 0.4%. 5| As such, Columbus’ unemployment rate in November 2024 rose 1.0 point year-over-year to 3.7%, below the national average of 4.0%. 6| During the past year, job gains in Columbus were most pronounced in the Education/Health Services sector followed by Mining/Logging/Construction. 7| Despite job losses stemming from the pandemic, Columbus’ current employment base now sits roughly 51,600 jobs or about 5% above the pre-pandemic level in February 2020.
COLUMBUS

6,864 units completed in past 12 months
10,827 units currently in progress
LOWEST OVERALL PERFORMING SUBMARKETS
RENT GROWTH SECTOR

EMPLOYMENT


2024 MARKET SNAPSHOT
other highlights
• Intel’s semiconductor plant in New Albany is finally moving forward with the long-awaited CHIPS Act funding, according to local news. The plant will receive $1.5 billion in federal funding, ending a two-year stalemate since the groundbreaking ceremony. The facility is expected to be operational by 2030, creating thousands of jobs and reducing reliance on foreign semiconductor production. The CHIPS Act, signed by President Biden in August 2022, aims to boost American innovation and technology, with Intel playing a significant role in the U.S. semiconductor industry’s expansion.
• Locally based Big Lots, which filed for bankruptcy in September 2024, announced a deal with Gordon Brothers Retail Partners and Variety Wholesalers to save 200 to 400 stores from closing. The deal, struck in December 2024 but subject to bankruptcy court approval, will transfer Big Lots’ assets, including intellectual property and distribution centers, to Variety Wholesalers, which plans to operate the stores under the Big Lots brand. This agreement aims to preserve jobs and maintain the brand’s continuity, reports local news.
• Several large real estate projects made progress in the Dublin/Hilliard submarket in 2024. Columbus Business First reports that Connect Real Estate’s $90 million Water and Light Development in downtown Marysville is set to include housing, dining, entertainment, event space, coworking and office space, along with recreational facilities. The 17- acre site, featuring old grain silos and a vacant water and light plant, will be redeveloped. Full buildout will occur over four to five phases, with completion expected by 2030. The $282 million TruePointe development under way in Hilliard is set to include 15 buildings offering retail, restaurant, lodging, office and residential spaces. The development is expected to be completed by the end of 2025. Riverview Village aims to turn a section of North Riverview Street in Historic Dublin into a vibrant coworking and entrepreneurship hub with public amenities like restaurants, bars and event space. Final development plan and incentives were approved by the city in November, construction
is slated to begin in fall 2025, and project completion is planned for the end of 2026.
• Amazon Web Services (AWS) plans to invest an additional $10 billion to expand its data center infrastructure across greater Ohio by the end of 2030, according to Governor Mike DeWine’s website. This investment aims to create hundreds of new, well-paying jobs and solidify Ohio’s position as a major technology hub. The new data centers will support cloud computing, including artificial intelligence and machine learning. Since 2015, AWS has invested over $23 billion in Ohio, contributing significantly to the state’s economy and job market.
• Other significant investments have been made recently in Central Ohio’s data center infrastructure, reports Columbus Business First. Google has pledged an additional $1.7 billion, bringing its total investment to $3.7 billion for three data centers in New Albany, Lancaster and Columbus. Microsoft has purchased a 184-acre site in New Albany but hasn’t confirmed specific plans yet. Vantage Data Centers is also entering the market with a $2 billion investment in a campus in New Albany, which will provide secure and reliable infrastructure for cloud technologies and artificial intelligence.
• The largest apartment transaction to take place in Columbus during 2024 was the sale of The Gardens apartments for approximately
• $203.5 million, or $191,200 per door, according to transactional data from Real Capital Analytics. Located along Governors Club Boulevard, the property was built in 2000. The property has a total of 68 two-story buildings with 1,064 units. This property sale was part of an eight- property portfolio that Blackstone Real Estate Income Trust, a real estate investment trust sponsored by private equity giant The Blackstone Group sold in November to New York-based Brookfield Properties for a total of $845 million. This was the only Ohio property in the portfolio that also included properties in Arizona, Nevada and North Carolina, according to industry sources.


UNRIVALED SUCCESS IN THE MIDWEST
YOUR TEAM
JORDAN DICKMAN
FIRST VICE PRESIDENTS DIRECTOR, NMHG
NICK ANDREWS
FIRST VICE PRESIDENTS DIRECTOR, NMHG
AUSTIN SUM
FIRST VICE PRESIDENTS DIRECTOR
AUSTIN Hall
INVESTMENT ASSOCIATE
ALDEN SIMMS
INVESTMENT ASSOCIATE
JACK STAVA
INVESTMENT ASSOCIATE
CHUCK COMBS
INVESTMENT ASSOCIATE
BROKER SUPPORT
SAM PETROSINO
VALUATION & RESEARCH
BRETT MARTIN
INTERNAL ACCOUNTANT
CORPORATE SUPPORT
LIZ POPP
MIDWEST OPERATIONS MANAGER
JOSH CARUANA
VICE PRESIDENT
REGIONAL MANAGER
INDIANAPOLIS | CINCINNATI | LOUISVILLE | ST LOUIS | KANSAS CITY
Peter Stanley
National Director
National Multi Housing Group
MICHAEL GLASS
SENIOR VICE PRESIDENT
MIDWEST DIVISION MANAGER
NATIONAL DIRECTOR, MANUFACTURED HOME COMMUNITIES GROUP
PROPERTY SHOWINGS ARE BY APPOINTMENT ONLY.
PLEASE CONTACT ANDREWS | DICKMAN FOR MORE DETAILS.
ALEX PAPA
MARKETING COORDINATOR

OH - KY | MIDWEST | MULTIFAMILY
Our commitment is to help our clients create and preserve wealth by providing them with the best real estate investment sales, financing, research and advisory services available