QUARTERLY REVIEW
QUARTER

OH - KY | MIDWEST | MULTIFAMILY
1 2023

QUARTER
1| A planned 650-acre live-work-play mixed-use development is set to be the largest development built in Cincinnati in decades. Locally based commercial real estate developer Corporex plans to construct the CirclePoint development in Boone County, in a location that has formerly served as a business park, according to Cincinnati Business Courier. Roughly 200 acres of the surrounding property is not yet developed. Plans include 270 apartments and a 20,000-square-foot retail center at the intersection of I-275 and Mineola Pike and a second retail center focusing on restaurants and entertainment options, which aims to be a nighttime hotspot. The project is currently awaiting approval but if given the green light, construction could start sometime in 2023.
2| American professional soccer club FC Cincinnati started work in February on the new 8.5-acre, $300 million West End mixed-use district, demolishing three buildings to make way for the project. Located just outside of the TQL Stadium, the team’s home field, the new district will feature multifamily housing, restaurants, office space, retail, green space and a hotel. Local news reports the inspiration for the entertainment district was rooted in developments like Gallagher Way at Wrigleyville in Chicago, The Wharf in Washington, D.C. and Titletown in Green Bay, WI.

CINCINNATI, OHIO
LOUISVILLE, KENTUCKY
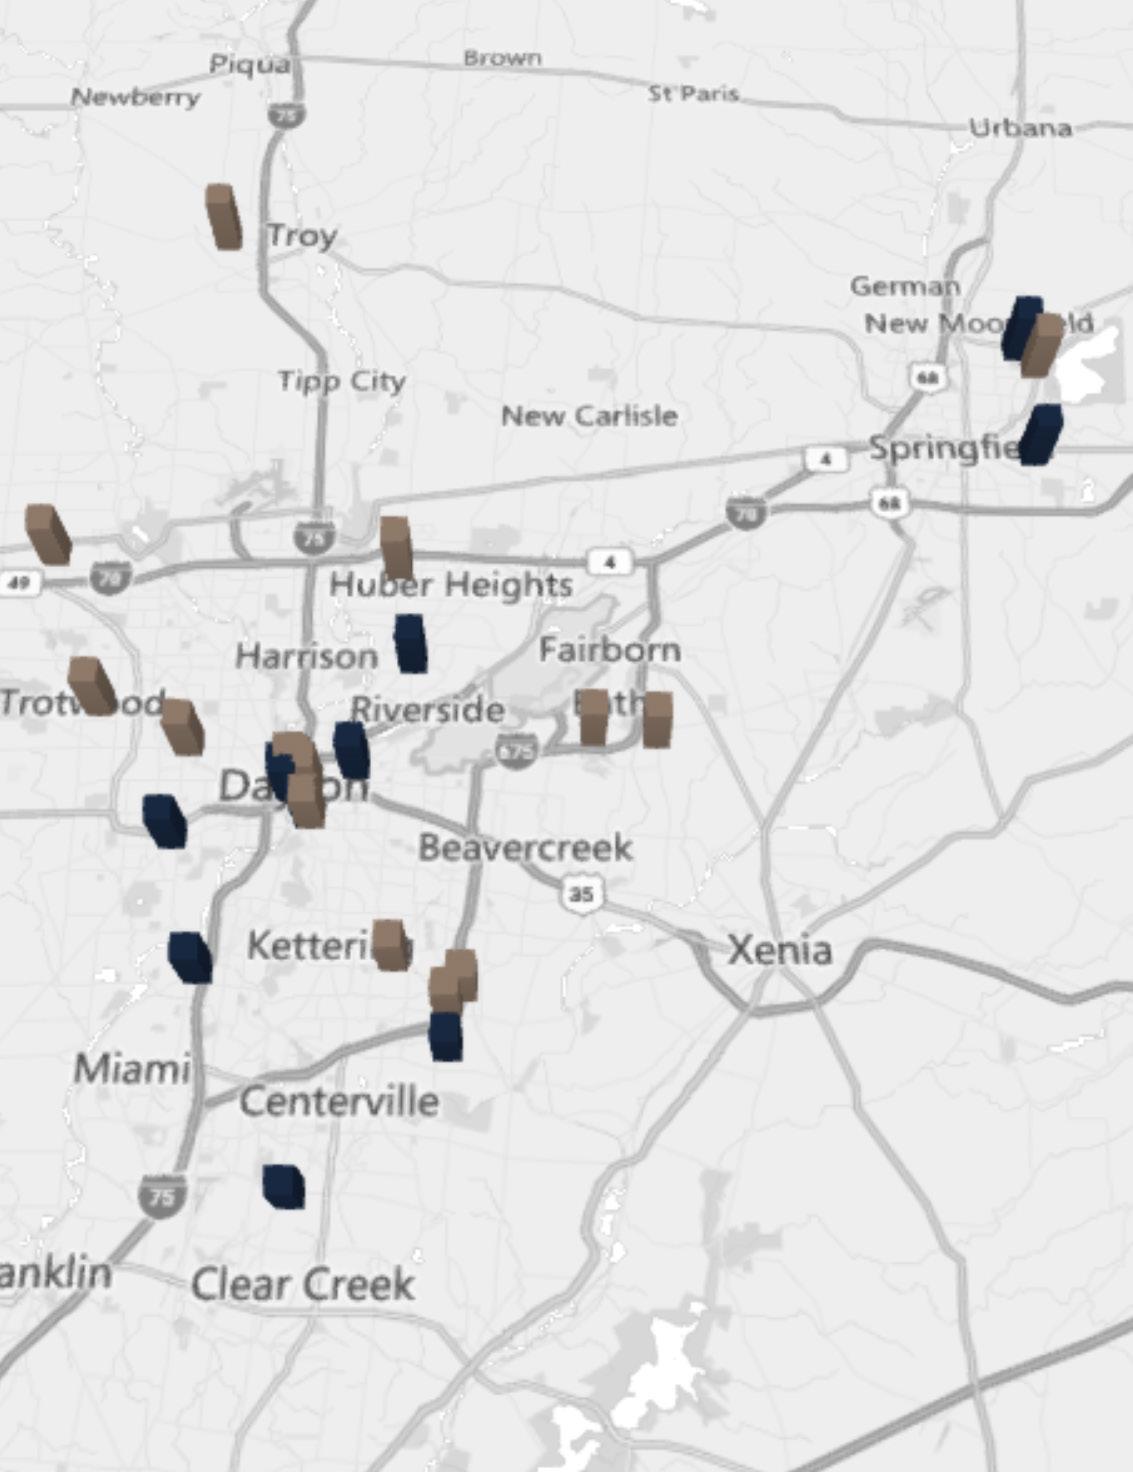
DAYTON, OHIO
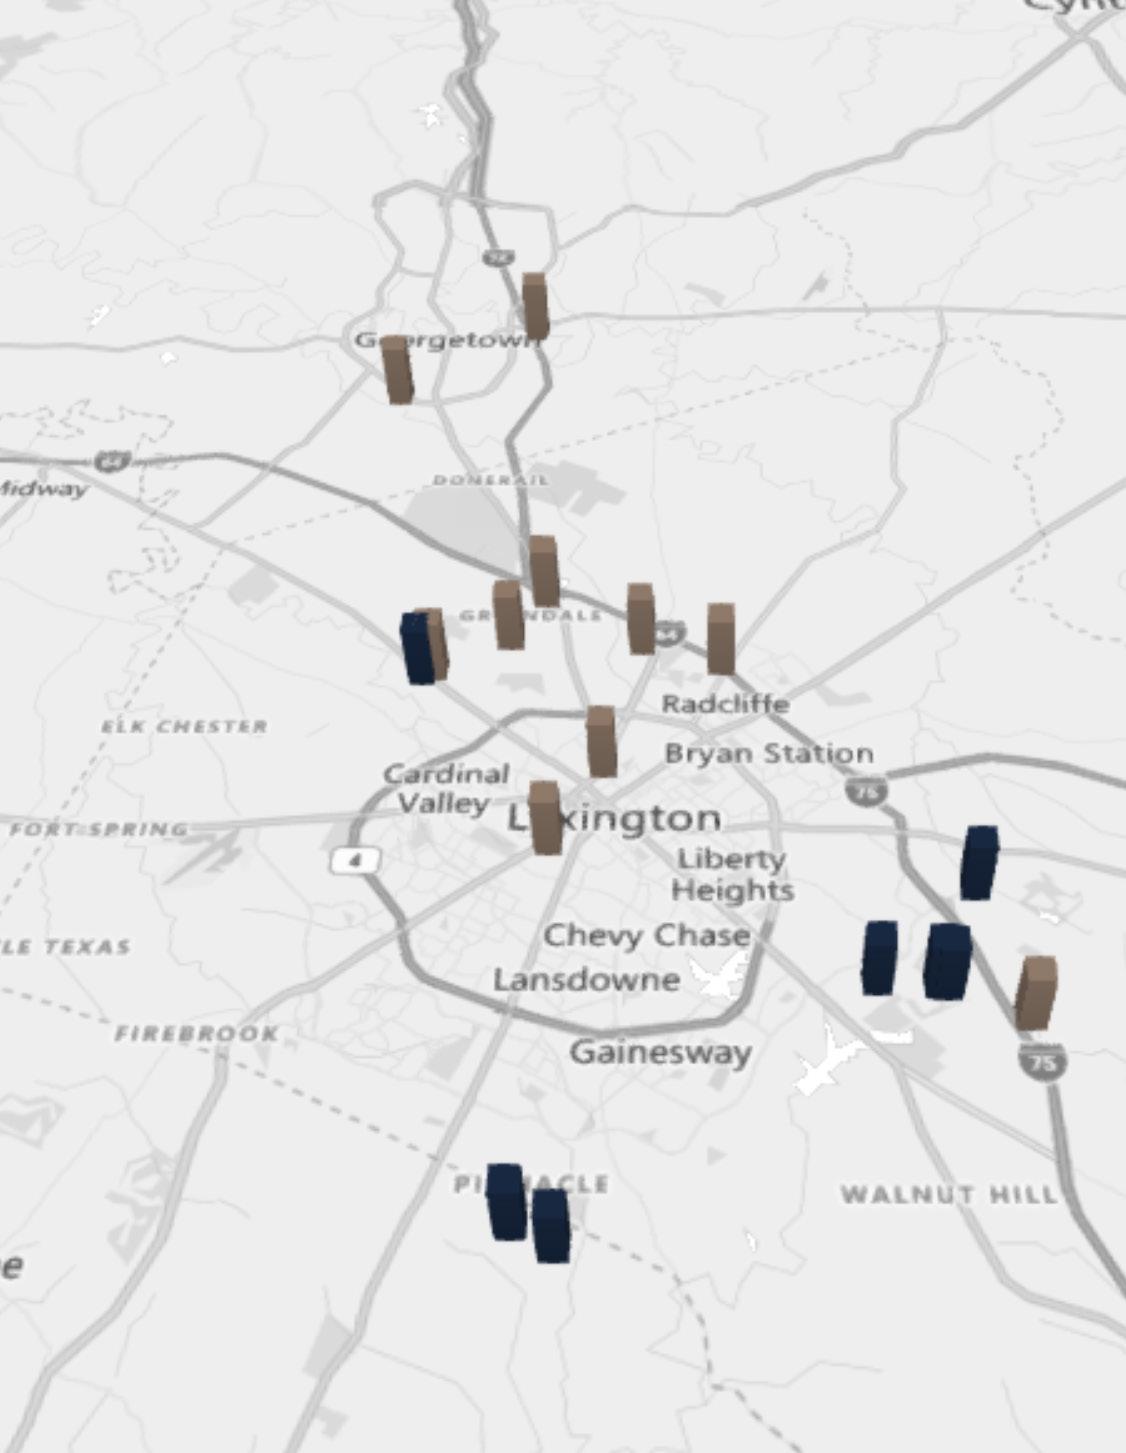
LEXINGTON, KY
Quarterly Rent Growth- 0.7%
Rent- $1,315
Rent/SF- $1.417
Occupancy- 95.7%
Units Completed in last 4 quarters2,596
Annual Supply Growth- 1.6%
Units under construction- 6,625
Projected Supply growth- 2.55%
YTD 2022 Job Change- 26,000
Quarterly Rent Growth- 0.5%
Rent- $1,158
Rent/SF- $1.225

Occupancy- 94.9%
Units Completed in last 4 quarters2,030
Annual Supply Growth- 2.2%
Units under construction- 1,519
Projected Supply growth- 1.58%
YTD 2022 Job Change- 9,800
Quarterly Rent Growth: -0.6%
Rent- $1,134
Rent/SF- $1.235
Occupancy- 95.1%
Units Completed in last 4 quarters424
Annual Supply Growth- 0.9%
Units under construction- 1,139
Projected Supply growth- 2.42%
YTD 2022 Job Change- 10,800
Quarterly Rent Growth – 0.3%
Rent- $1,078
Rent/SF- $1.183
Occupancy- 95.8%
Units Completed in last 4 quarters650
Annual Supply Growth- 1.2%
Units under construction- 1,310
Projected Supply growth- 1.87%
YTD 2022 Job Change- 9,100
1| The Cincinnati apartment market is normalizing back toward historical norms after record highs were achieved in market fundamentals in 2021 and early 2022. 2| Moderate employment gains and solid young adult population growth continued to drive apartment demand in Queen City. 3| Cincinnati evaded some of the worst impacts of the economic fall-out of the global pandemic and likewise did not see demand plummet to the same degree as other, larger apartment markets. 4 | AnnuaL rent growth here remains among the stronger readings nationwide as of 1st quarter 2023.


1| In the year-ending 1st quarter 2023, the metro’s inflation-adjusted economic output expanded 0.5%. At the same time, the metro recorded a net gain of 26,000 jobs, expanding the employment base 2.3%. 2| Cincinnati’s unemployment rate in February 2023 declined 0.2 points year-over-year to 3.6%, below the national average of 3.9%. 3| During the past year, job gains in Cincinnati were most pronounced in the Leisure/Hospitality Services sector followed by Education/Health Services, Trade/Transportation/Utilities and Manufacturing. 4| Despite job losses stemming from the pandemic, Cincinnati’s current employment base now sits roughly 25,500 jobs or about 2% above the pre-pandemic level in February 2020.
1| Over the past five years, the annual change in effective asking rents in Cincinnati ranged from 1.6% to 11.9%. In 1st quarter 2023, same-store effective asking rents for new leases were up 8.2% year- over-year. 2| That annual rent performance was above the market’s five-year average of 5.3%. 3| Product classes in Cincinnati, Class B led for rent performance over the past five years. In 1st quarter 2023, annual effective rent change registered at 6.7% in Class A units, 8.8% in Class B units and 9.3% in Class C units. 4| Among submarkets, the strongest annual rent change performances over the past year were in North Cincinnati and Butler County. 5| The weakest performances were in North Central Cincinnati and Central Cincinnati. 6| As of 1st quarter 2023, effective asking rental rates in Cincinnati averaged $1,315 per month, or $1.417 per square foot.
1| Transaction dollar volumes in Cincinnati totaled roughly $673.9 million in the year-ending 1st quarter 2023, up about 9% year-over-year. 2| Transactions in the year-ending 1st quarter 2023 yielded an average cap rate of 5.36%, down 37 basis points year-over year. By comparison, cap rates averaged 5.15% in the Midwest region and 4.59% nationally. 3| Meanwhile, the average price per unit in Cincinnati came in at roughly $173,800, up 66.3% annually. Cincinnati’s average price per unit landed above the norm for the Midwest region ($163,000) but below the U.S. average ($234,000).


1| The total number of residents in Cincinnati increased 3.5% from 2016 to 2021, a change rate which was in line with the U.S. average of 3.5%. The fastest growing population niche in Cincinnati was the 55 years and over age segment which grew 11.4% from 2016 to 2021. 2| The metro’s 20- to 34-year-old cohort – a crucial component of the apartment market – grew 3.1% from 2016 to 2021, compared to 1.4% growth nationally. Young adults made up 19.8% of Cincinnati’s total population in 2021, smaller than the national norm of 20.3%. 3| Cincinnati’s median household income of about $70,700 was in line with the national average of roughly $69,000.
1| New apartment completions in Cincinnati were elevated by historical standards recently, as 2,596 units delivered in the year-ending 1st quarter 2023. 2| Annual new supply averaged 1,585 units, and annual inventory growth averaged 0.9% over the past five years. 3| During that period, new supply was concentrated in Central Cincinnati, Campbell/Kenton Counties and Northeast Cincinnati/ Warren County, which received 63% of the market’s total completions. At the end of 1st quarter 2023, there were 6,625 units under construction with 4,237 of those units scheduled to complete in the next four quarters. 4| Scheduled deliveries in the coming year are expected to be concentrated in Butler County and North Central Cincinnati.
2,596 units completed in past 12 months
6,625 units currently in progress


1| In 2020, COVID-19 mitigation measures and limited business activity caused the local economy to contract as much as 9.6% year-over-year in 2nd quarter. 2| In the year-ending 1st quarter 2023, the metro’s inflation- adjusted economic output expanded 0.2%. 3| At the same time, the metro recorded a net gain of 9,100 jobs, expanding the employment base 2.4%. 4| As such, Dayton’s unemployment rate in February 2023 declined 0.4 points year-over-year to 3.9%, in line with the national average of 3.9%. 5| Due to job losses stemming from the pandemic, Dayton’s current employment base now sits roughly 1,800 jobs or about 1% below the pre-pandemic level in February 2020.
1| In 1st quarter 2023, effective asking rents for new leases were up 6.8% year-over-year. That annual rent performance was above the market’s five-year average of 5.1%. 2| Looking at product classes in Dayton, Class A led for rent performance over the past five years. In 1st quarter 2023, annual effective rent change registered at 7.7% in Class A units, 6.2% in Class B units and 6.7% in Class C units. 3| Among submarkets, the strongest annual rent change performances over the past year were in Greene County (9.1%) and North Dayton/Miami County (8.9%). 4| The weakest performances were in Northwest Dayton (5.2%) and Central Dayton/Kettering (5.5%). 5| As of 1st quarter 2023, effective asking rental rates in Dayton averaged $1,078 per month, or $1.183 per square foot.


1| Occupancy in the Dayton apartment market has ranged from 95.2% to 98.0% over the past five years, averaging 96.6% during that period. Over the past year, occupancy lost 2.2 points, with the 1st quarter 2023 rate landing at 95.8%. 2| Looking at product classes in Dayton, 1st quarter 2023 occupancy registered at 94.7% in Class A units, 96.1% in Class B units and 96.2% in Class C units.

3| Occupancy in Class C product was generally tightest over the past five years. Among submarkets, 1st quarter 2023 occupancy was strongest in Greene County and Central Dayton/Kettering (both at 96.6%). 4| The weakest reading was seen in Northwest Dayton (92.6%). 5| During the coming year, occupancy in Dayton is expected to register around 95.5%.
1| New apartment completions in Dayton were modest recently, as 650 units delivered in the yearending 1st quarter 2023. Completions over the past year expanded the local inventory base 1.2%.

2| In the past year, supply was greatest in Central Dayton/Kettering and Greene County. Annual new supply averaged 544 units, and annual inventory growth averaged 1.0% over the past five years. 3| At the end of 1st quarter 2023, there were 1,310 units under construction with 1,061 of those units scheduled to complete in the next four quarters. 4| Scheduled deliveries in the coming year are expected to be concentrated in Central Dayton/Kettering.
650 units completed in past 12 months
1,310 units currently in progress

1| Prior to the pandemic, Lexington-Fayette’s real gross metropolitan product grew at an average annual rate of 1.6% from 2015 to 2019. 2| In the year-ending 1st quarter 2023, the metro’s inflation-adjusted economic output was unchanged. At the same time, the metro recorded a net gain of 10,800 jobs, expanding the employment base 3.9%. 3| As such, Lexington-Fayette’s unemployment rate in February 2023 rose 0.3 points year-over-year to 3.5%, below the national average of 3.9%. 4| During the past year, job gains in Lexington-Fayette were most pronounced in the Leisure/Hospitality Services sector followed by Manufacturing and Government.
1| In 1st quarter 2023, effective asking rents for new leases were up 7.9% year-over-year. That annual rent performance was above the market’s five-year average of 5.9%. 2| Looking at product classes in Lexington-Fayette, Class A led for rent performance over the past five years. 3| In 1st quarter 2023, annual effective rent change registered at 8.8% in Class A units, 6.9% in Class B units and 8.7% in Class C units. 4| Among submarkets, the strongest annual rent change performance over the past year was in North Lexington (11.6%). 5| The weakest performance was in South Lexington (6.2%). 6| As of 1st quarter 2023, effective asking rental rates in Lexington-Fayette averaged $1,134 per month, or $1.235 per square foot.
1| Occupancy in the Lexington-Fayette apartment market has ranged from 93.3% to 97.6% over the past five years, averaging 95.5% during that period. Over the past year, occupancy lost 2.5 points, with the 1st quarter 2023 rate landing at 95.1%. 2| Looking at product classes in Lexington-Fayette, 1st quarter 2023 occupancy registered at 94.8% in Class A units, 95.1% in Class B units and 95.7% in Class C units. 3| Among submarkets, 1st quarter 2023 occupancy was strongest in North Lexington (96.4%). The weakest reading was seen in Downtown Lexington/University (93.8%). 4| During the coming year, occupancy in Lexington-Fayette is expected to register around 94.5%.


1| New apartment completions in Lexington-Fayette were modest recently, as 424 units delivered in the year-ending 1st quarter 2023. 2| Completions over the past year expanded the local inventory base 0.9%. In the past year, supply was greatest in North Lexington. Annual new supply averaged 378 units, and annual inventory growth averaged 0.7% over the past five years. 3| During that period, new supply was concentrated in South Lexington, which received 60% of the market’s total completions. 4| At the end of 1st quarter 2023, there were 1,139 units under construction with 175 of those units scheduled to complete in the next four quarters. 5| Scheduled deliveries in the coming year are expected to continue to be concentrated in North Lexington.
424 units completed in past 12 months
1,139 units currently in progress


1| In the year-ending 1st quarter 2023, the metro’s inflation-adjusted economic output contracted 0.3%. 2| At the same time, the metro recorded a net gain of 9,800 jobs, expanding the employment base 1.5%. 3| As such, Louisville/Jefferson County’s unemployment rate in February 2023 rose 0.1 points year-over-year to 4.0%, in line with the national average of 3.9%.

4| During the past year, job gains in Louisville/Jefferson County were most pronounced in the Trade/Transportation/Utilities sector followed by Manufacturing. 5| Despite job losses stemming from the pandemic, Louisville/Jefferson County’s current employment base now sits roughly 7,400 jobs or about 1% above the pre-pandemic level in February 2020.
1| In 1st quarter 2023, same-store effective asking rents for new leases were up 7.2% yearover-year. That annual rent performance was above the market’s five-year average of 4.7%. 2|
In 1st quarter 2023, annual effective rent change registered at 8.5% in Class A units, 7.4% in Class B units and 4.9% in Class C units. 3| Among submarkets, the strongest annual rent change performances over the past year were in Southeast Louisville (9.0%) and South Central Louisville (8.3%). 4| The weakest performances were in Central Louisville (4.7%) and Northwest Louisville (6.5%). 5| In the coming year, same-store effective asking rent change in Louisville/Jefferson County is expected to slow from the current level. 6| As of 1st quarter 2023, effective asking rental rates in Louisville/Jefferson County averaged $1,158 per month, or $1.225 per square foot.

1| Over the past year, occupancy lost 2.5 points, with the 1st quarter 2023 rate landing at 94.9%. 2| Looking at product classes in Louisville/Jefferson County, 1st quarter 2023 occupancy registered at 93.3% in Class A units, 94.8% in Class B units and 96.7% in Class C units. 3| Among submarkets, 1st quarter 2023 occupancy was strongest in Northwest Louisville and South Central Louisville, both at 95.8%. 4| The weakest reading was seen in Central Louisville at just 93.1%. 5| During the coming year, occupancy in Louisville/ Jefferson County is expected to register around 95%.

1| New apartment completions in Louisville/Jefferson County were moderate recently, as 2,030 units delivered in the year-ending 1st quarter 2023. 2| Completions over the past year expanded the local inventory base 2.2%. 3| At the end of 1st quarter 2023, there were 1,519 units under construction with 828 of those units scheduled to complete in the next four quarters. 4| Scheduled deliveries in the coming year are expected to be concentrated in Southwest Louisville.
2,030 units completed in past 12 months
1,519 units currently in progress
QUARTER 1


JORDAN DICKMAN
FIRST VICE PRESIDENTS DIRECTOR, NMHG
NICK ANDREWS
FIRST VICE PRESIDENTS DIRECTOR, NMHG
AUSTIN SUM
SENIOR INVESTMENT ASSOCIATE
BRIAN JOHNSTON
INVESTMENT ASSOCIATE
AUSTIN Hall
INVESTMENT ASSOCIATE
ALDEN SIMMS
INVESTMENT ASSOCIATE
SAM PETROSNIO
VALUATION & RESEARCH
LIZ POPP
MIDWEST OPERATIONS MANAGER
JOSH CARUANA
VICE PRESIDENT
REGIONAL MANAGER
INDIANAPOLIS | CINCINNATI | LOUISVILLE | ST LOUIS | KANSAS CITY
JOHN SEBREE
SENIOR VICE PRESIDENT
NATIONAL DIRECTOR
NATIONAL MULTI HOUSING GROUP
MICHAEL GLASS
SENIOR VICE PRESIDENT
MIDWEST DIVISION MANAGER
NATIONAL DIRECTOR, MANUFACTURED HOME COMMUNITIES GROUP
PROPERTY SHOWINGS ARE BY APPOINTMENT ONLY. PLEASE CONTACT ANDREWS | DICKMAN FOR MORE DETAILS.
BRITTANY CAMPBELL-KOCH
DIRECTOR OF OPERATIONS
SKylER WILSON
CLIENT RELATIONS MANAGER
ALEX PAPA
MARKETING COORDINATOR
Our commitment is to help our clients create and preserve wealth by providing them with the best real estate investment sales, financing, research and advisory services available