LEFFERSON
2024 OFFERING MEMORANDUM 1900 Aaron Drive, Middletown, Ohio
QUARTERS


Austin Hall Associate
Cincinnati
D. 513.878.7712
austin.hall@marcusmillichap.com
Austin Sum Senior
Cincinnati
D. 513.878.7747
austin.sum@marcusmillichap.com
Jordan Dickman
Cincinnati
D. 513.878.7735
jordan.dickman@marcusmillichap.com
Nick
Cincinnati
D. 513.878.7741
nicholas.andrews@marcusmillichap.com
CONTENTS
LEAD AGENTS
Vice President Investments
Andrews First
Office
First Vice President Investments
Office
Associate
Office
Office
The Asset Local Market Local Competitors Financials 06 20 34 40 SECTIONS


“OUR COMMITMENT IS TO HELP OUR CLIENTS CREATE AND PRESERVE WEALTH BY PROVIDING THEM WITH THE BEST REAL ESTATE INVESTMENT SALES, FINANCING, RESEARCH AND ADVISORY SERVICES AVAILABLE.” 300 WEST 4TH STREET, CINCINNATI, OH

GLOBAL REACH, LOCAL EXPERTISE
$86.3B
VALUE OF RECENTLY CLOSED TRANSACTIONS

12,272
CLOSED SALES IN MOST RECENT YEAR
$12.8B
TOTAL VALUE OF RECENT LISTINGS
2,143
CLOSED FINANCINGS IN MOST RECENT YEARS
CALABASAS, CALIFORNIA | HQ 2,500 | EMPLOYEES 80+ | OFFICES
CINCINNATI
DAYTON
LEXINGTON LOUISVILLE
YOUR TEAM

JORDAN DICKMAN
FIRST VICE PRESIDENTS DIRECTOR, NMHG
NICK ANDREWS
FIRST VICE PRESIDENTS DIRECTOR, NMHG
AUSTIN SUM
SENIOR INVESTMENT ASSOCIATE
AUSTIN Hall
INVESTMENT ASSOCIATE
ALDEN SIMMS
INVESTMENT ASSOCIATE
CORPORATE SUPPORT
LIZ POPP
MIDWEST OPERATIONS MANAGER
JOSH CARUANA
VICE PRESIDENT
REGIONAL MANAGER
INDIANAPOLIS | CINCINNATI | LOUISVILLE | ST LOUIS | KANSAS CITY
JOHN SEBREE
SENIOR VICE PRESIDENT
NATIONAL DIRECTOR
NATIONAL MULTI HOUSING GROUP
MICHAEL GLASS
SENIOR VICE PRESIDENT
MIDWEST DIVISION MANAGER
NATIONAL DIRECTOR, MANUFACTURED HOME COMMUNITIES GROUP
BROKER SUPPORT
SAM PETROSino
VALUATION & RESEARCH
BRETT MARTIN
INTERNAL ACCOUNTANT
BRITTANY CAMPBELL-KOCH DIRECTOR OF OPERATIONS
ALEX PAPA
MARKETING
COORDINATOR

DATA SUMMARY
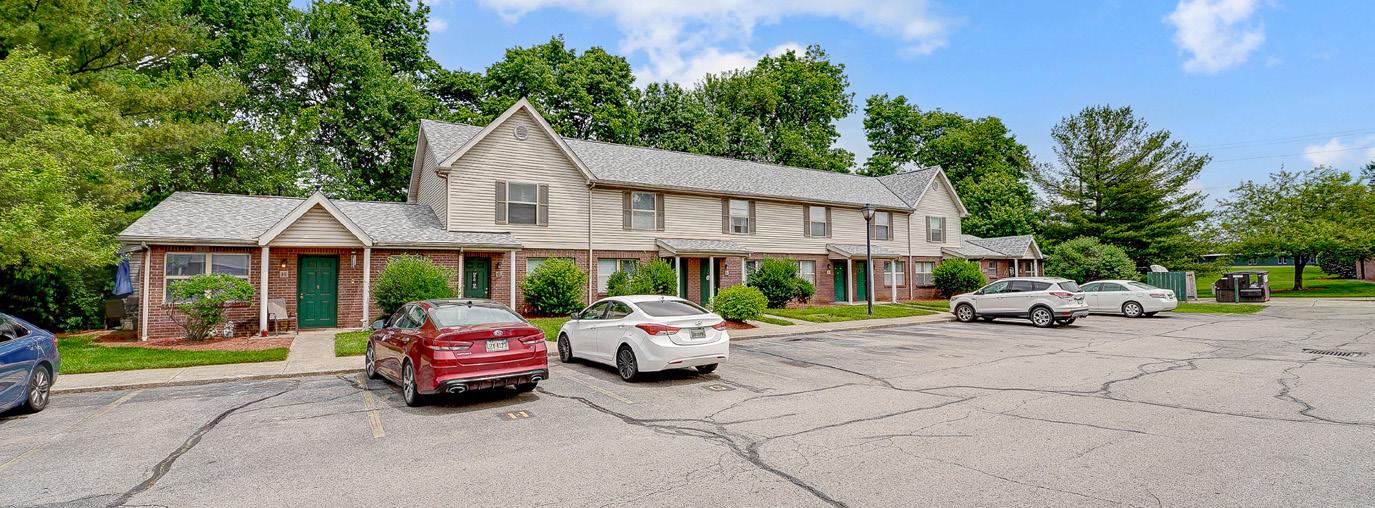
Property Address: 1900 Aaron Drive
City, State, Zip: Middletown, OH, 45044
Submarket: Butler County
County: Butler
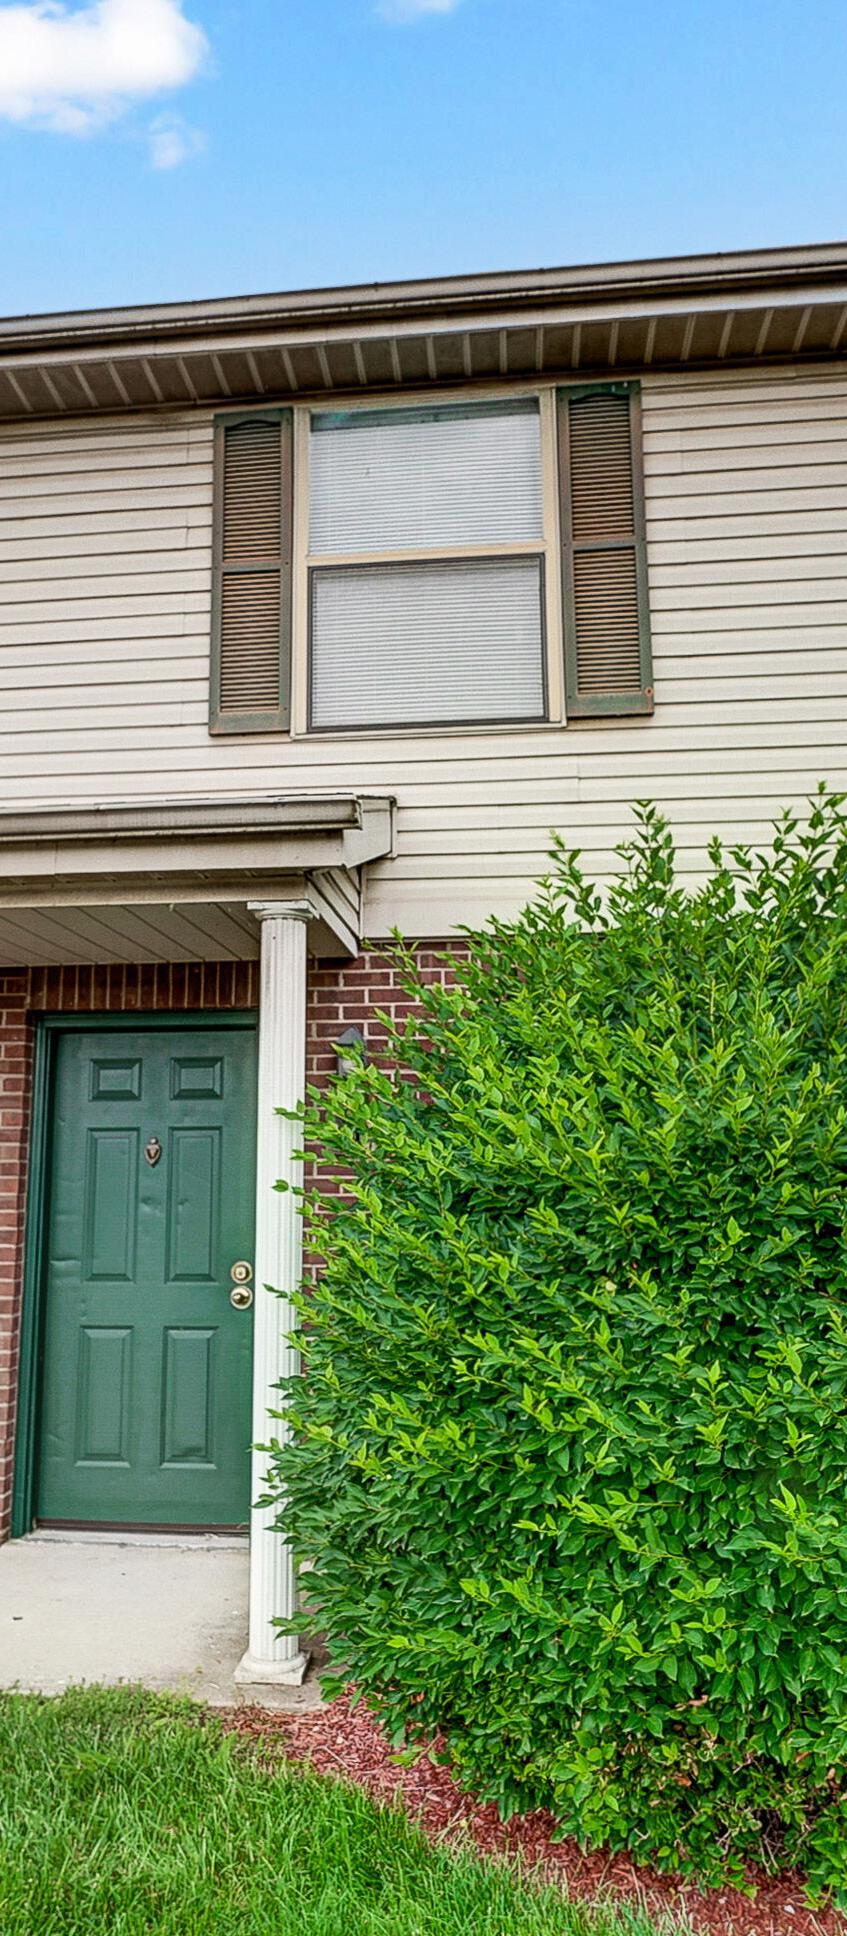
Year Built/Reno: 1995
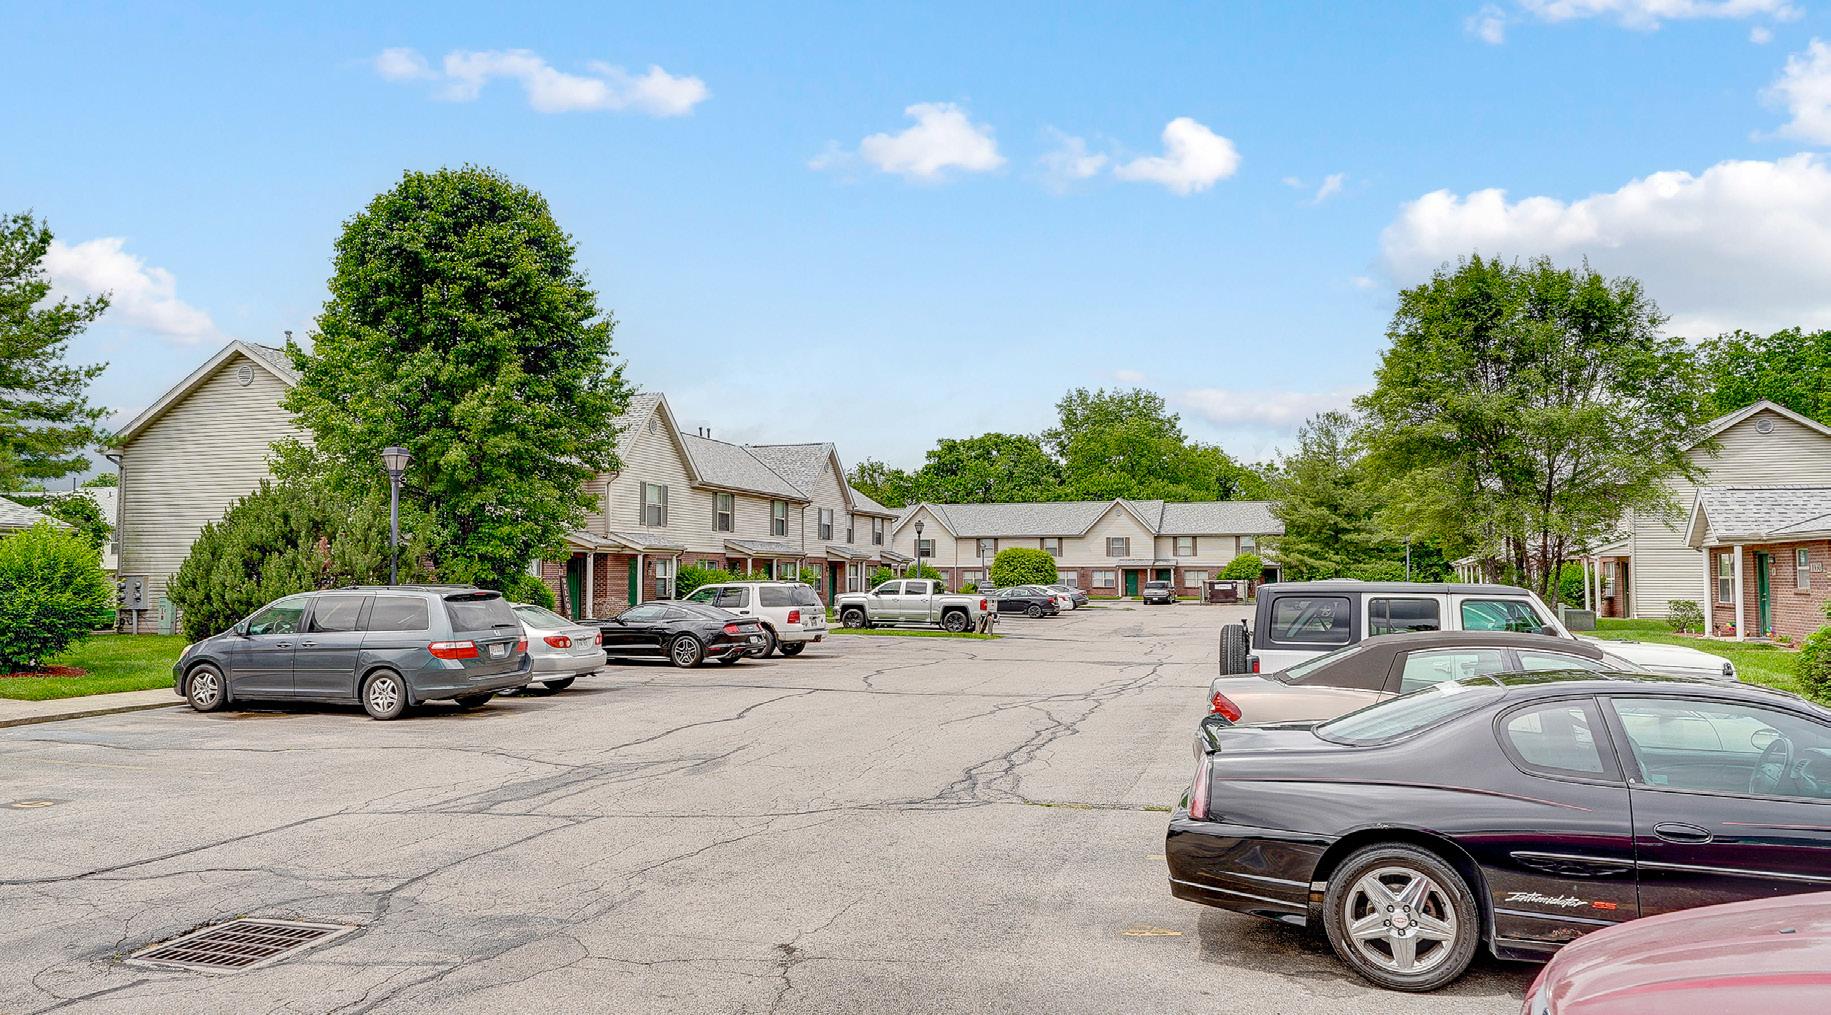
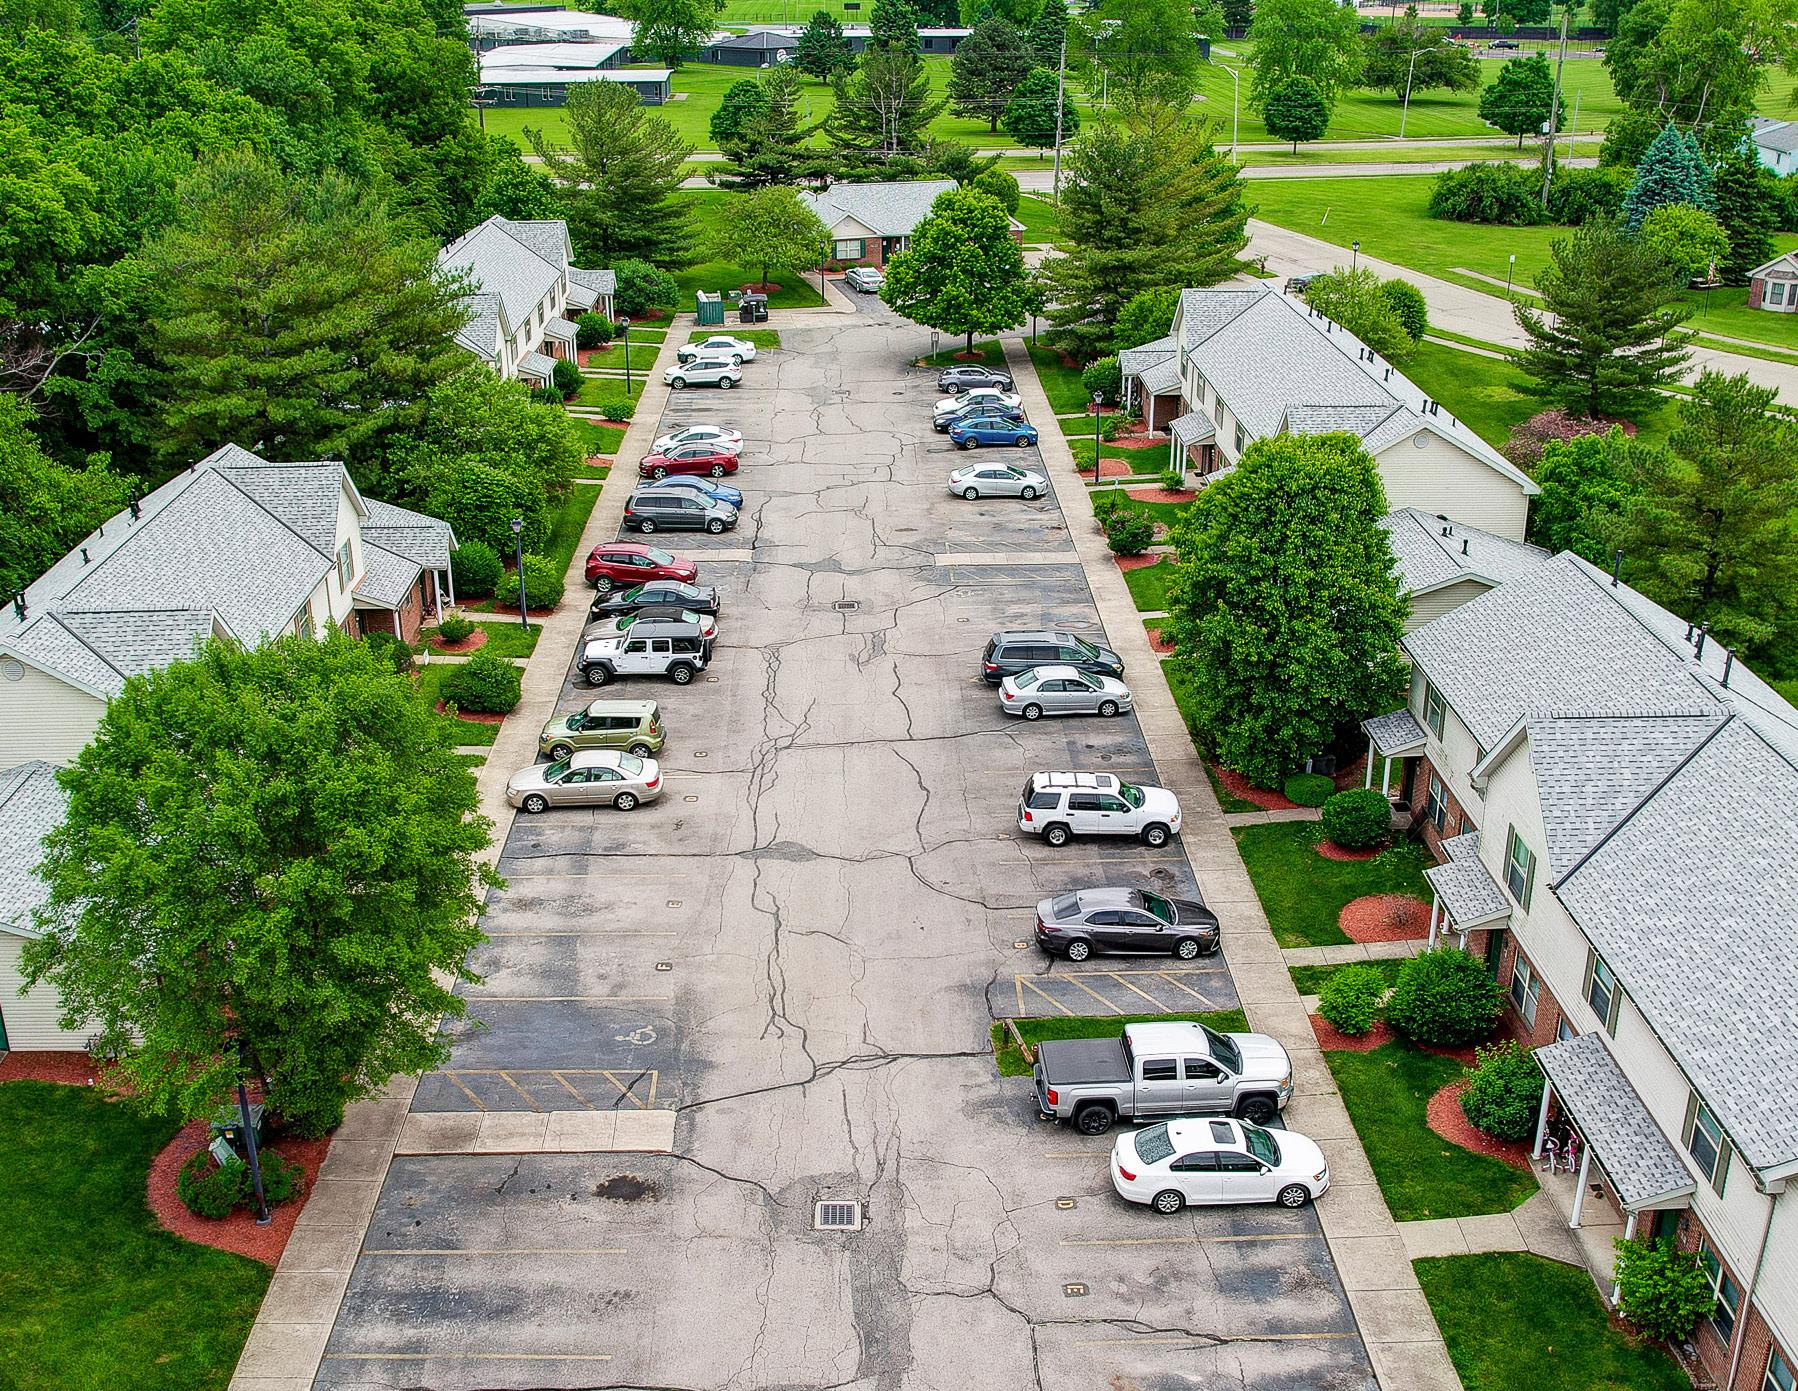
Number Of Units: 90
Avg Unit Size: 832
Rentable Sqft: 74,852
Number of Parcels: 1
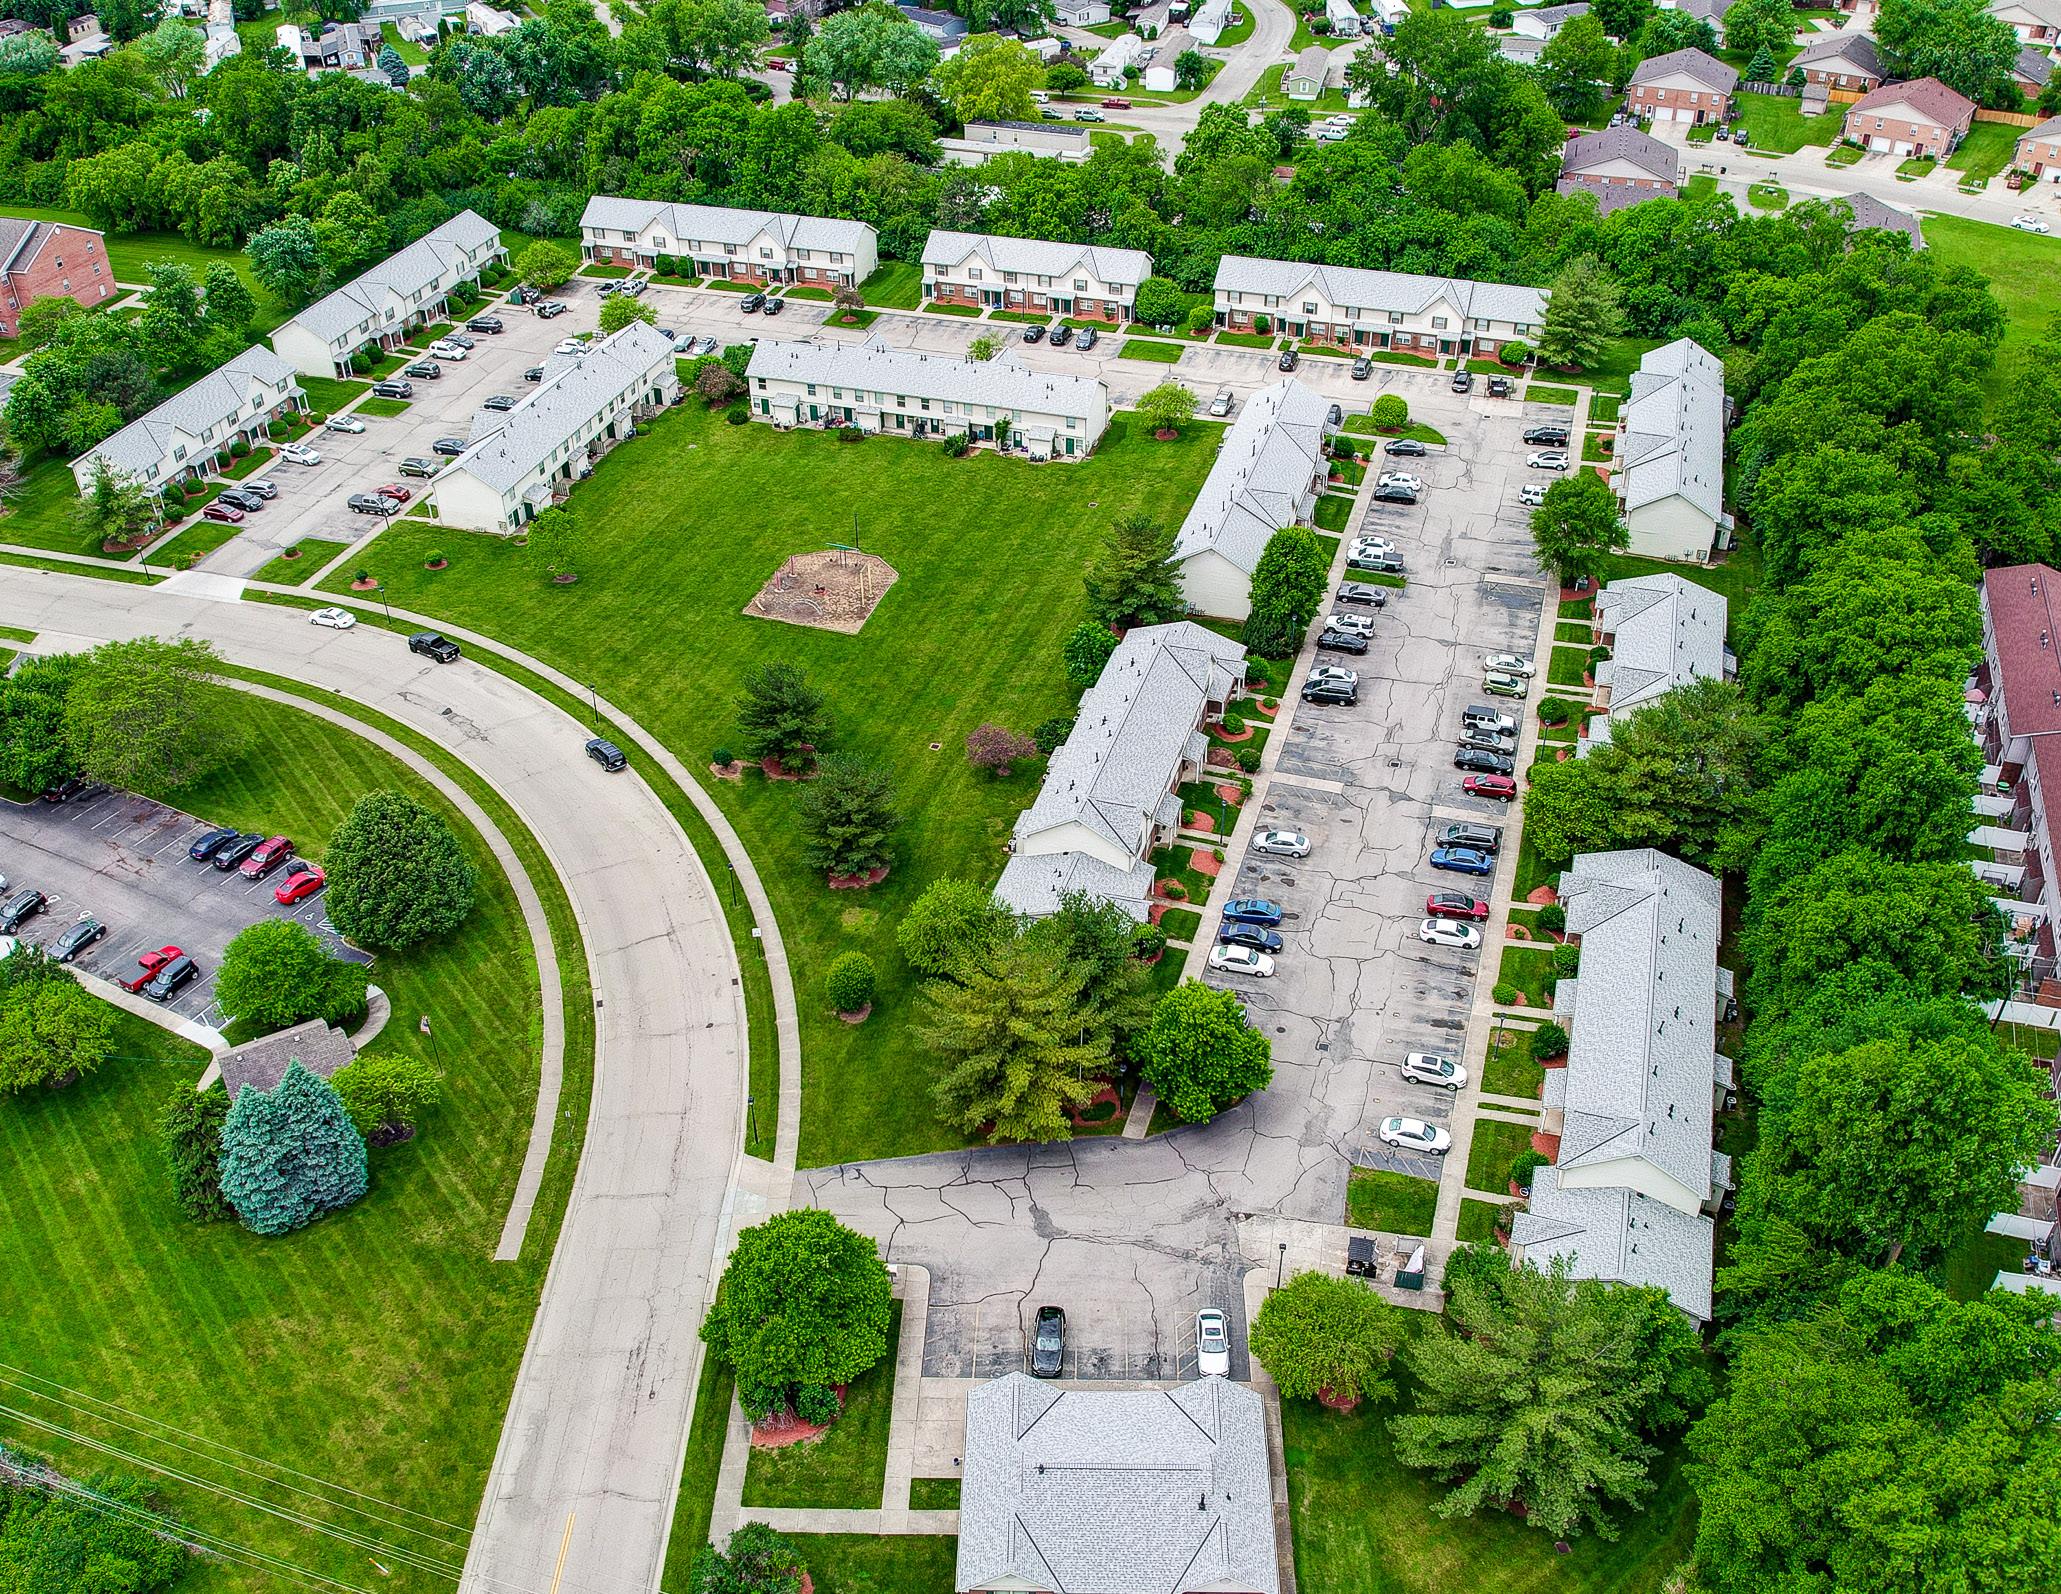
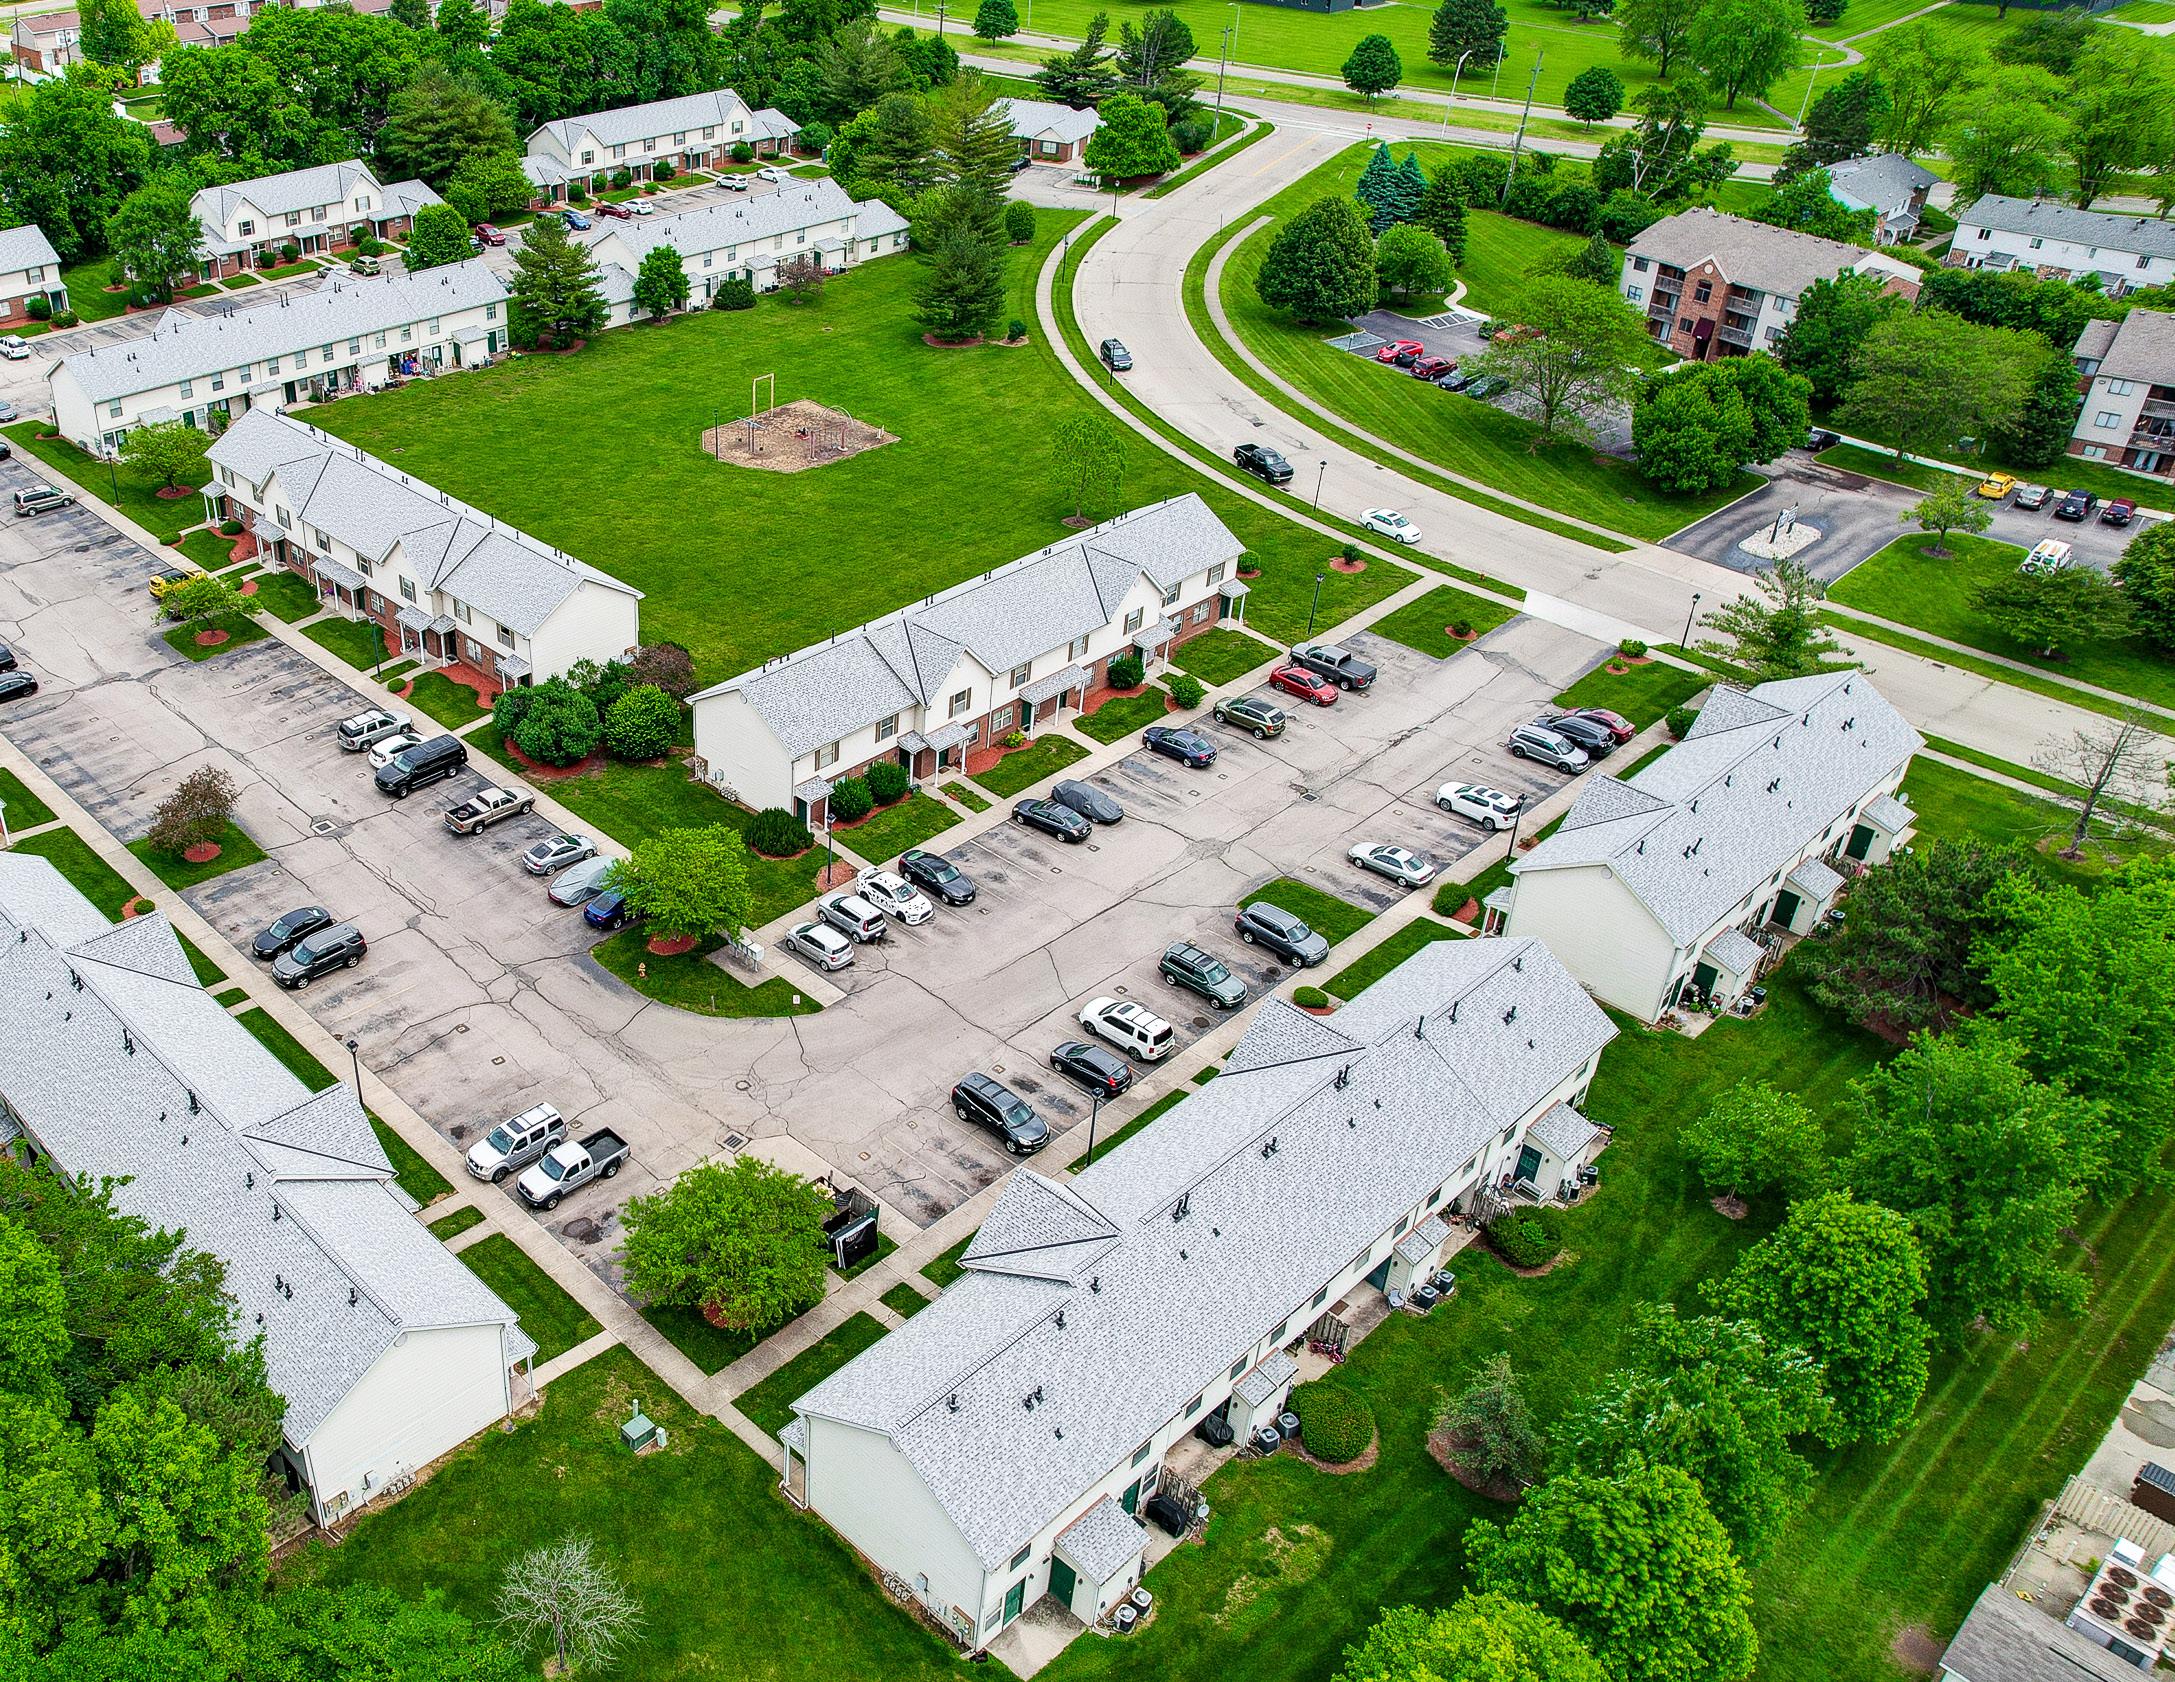
Lot Size (Acres): 7.56
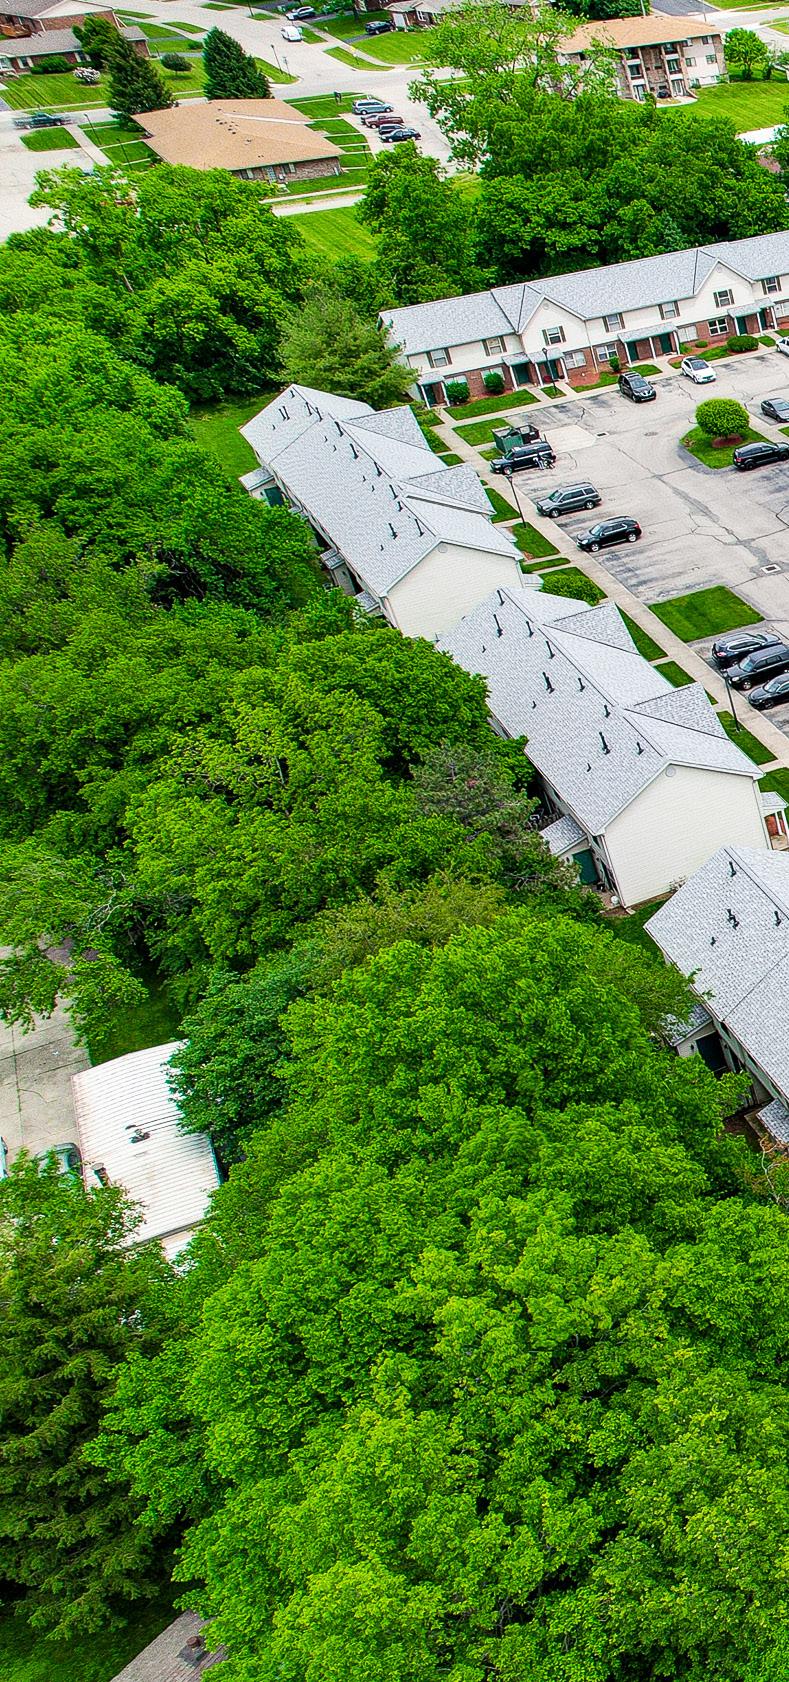
# of Buildings: 13
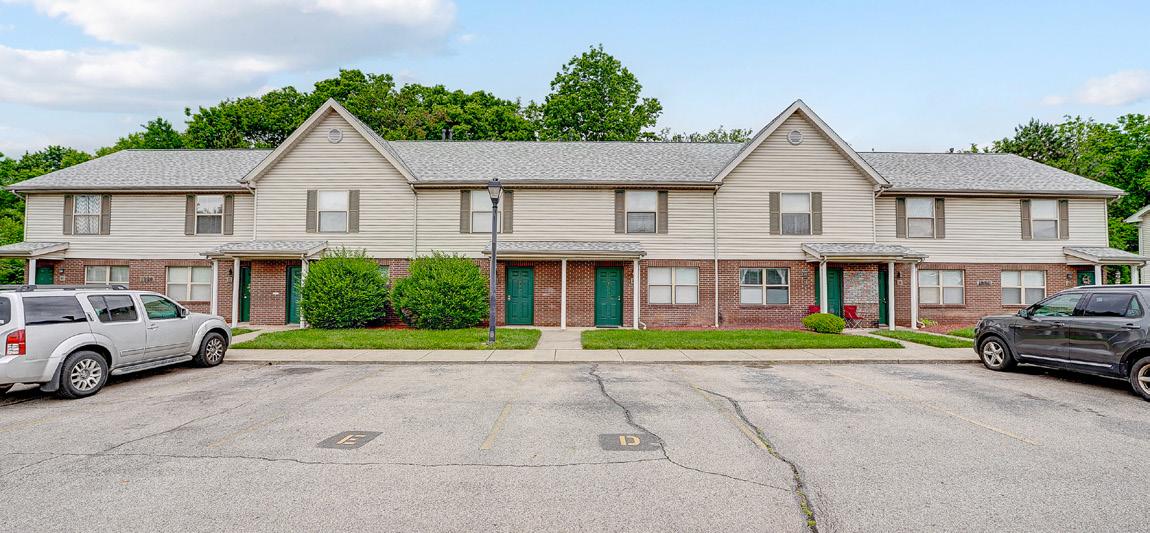
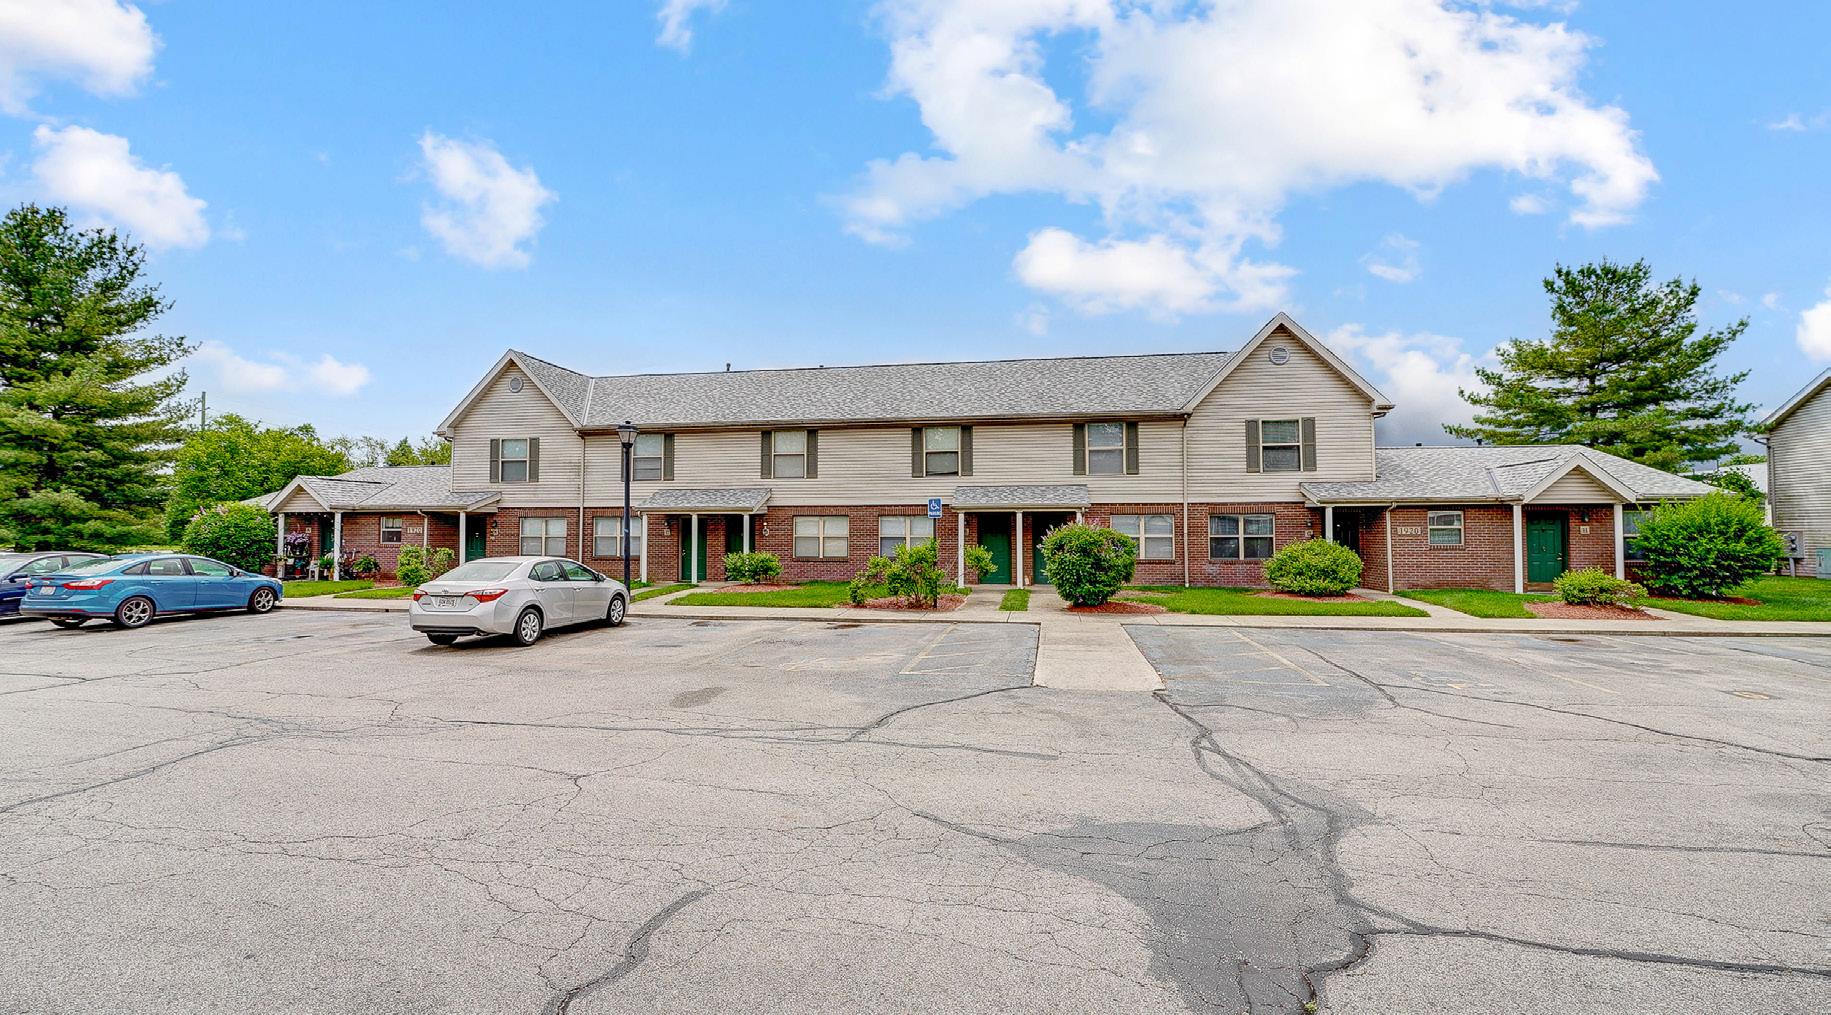
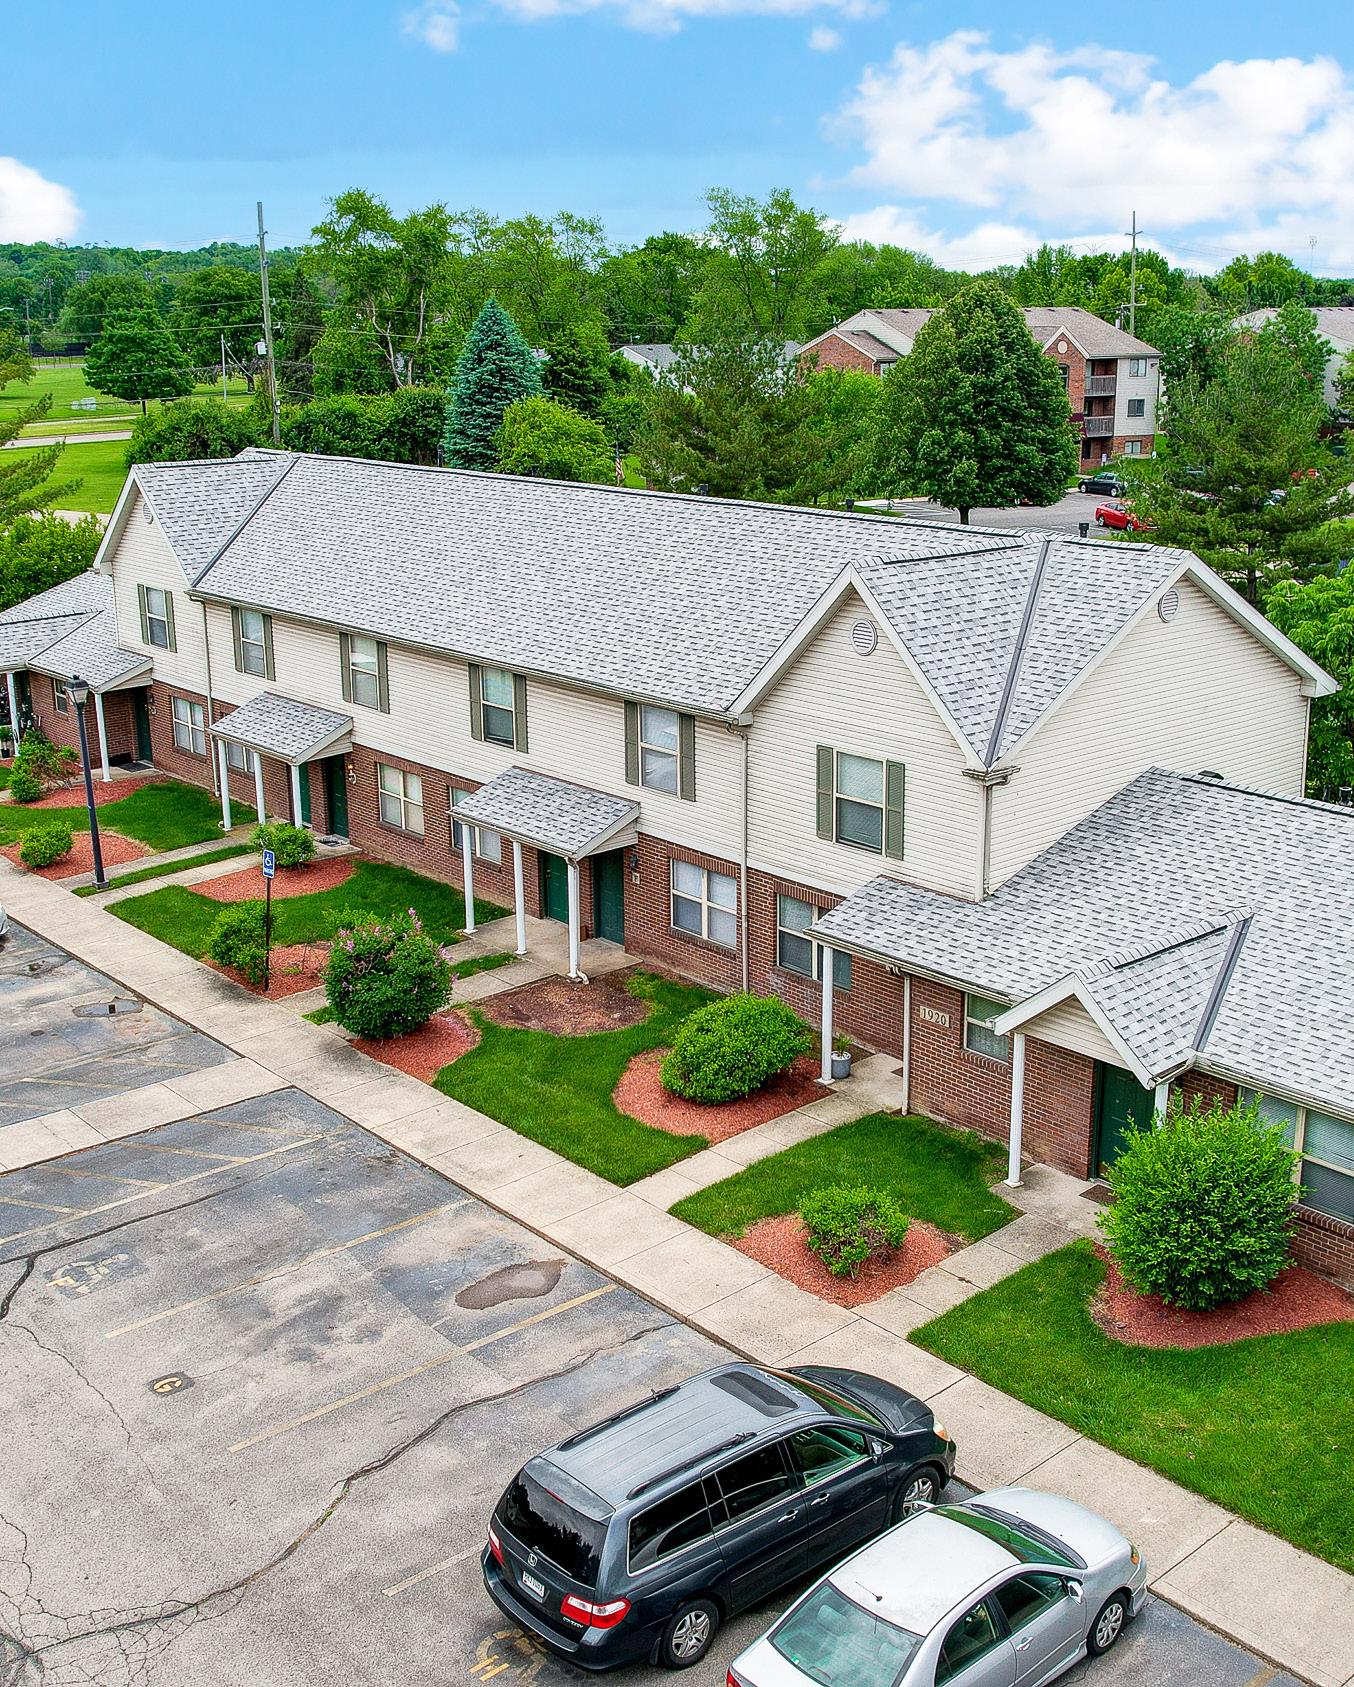
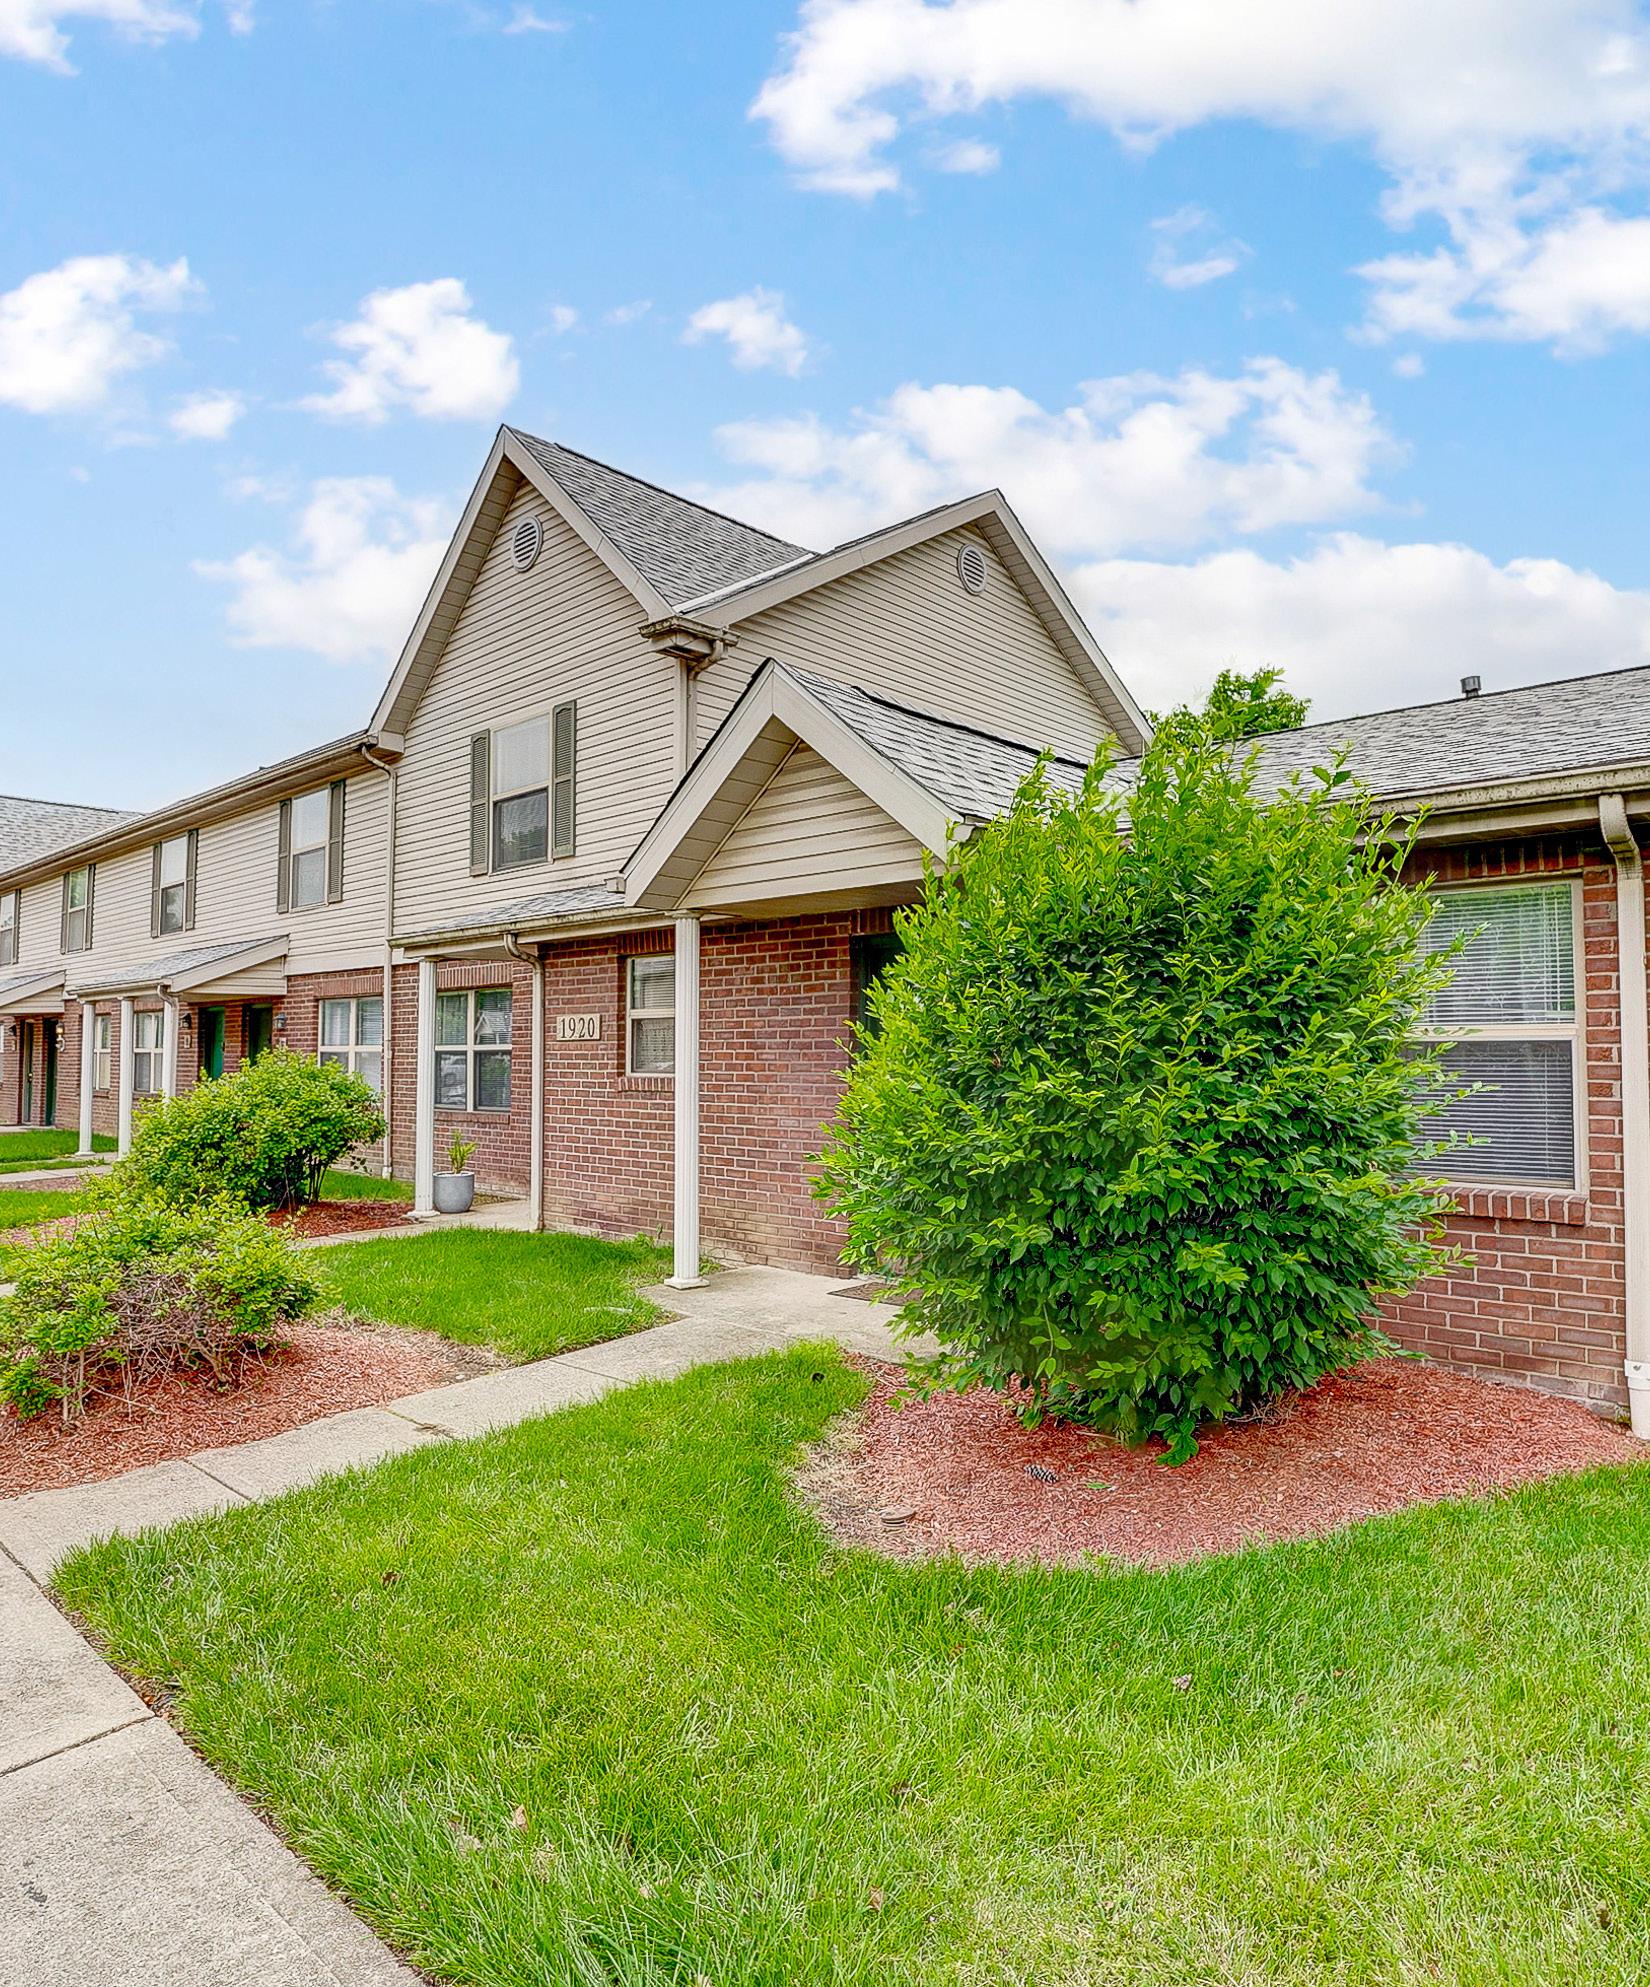
# of Stories: Two-Story Townhomes
Current Occupancy: 93%
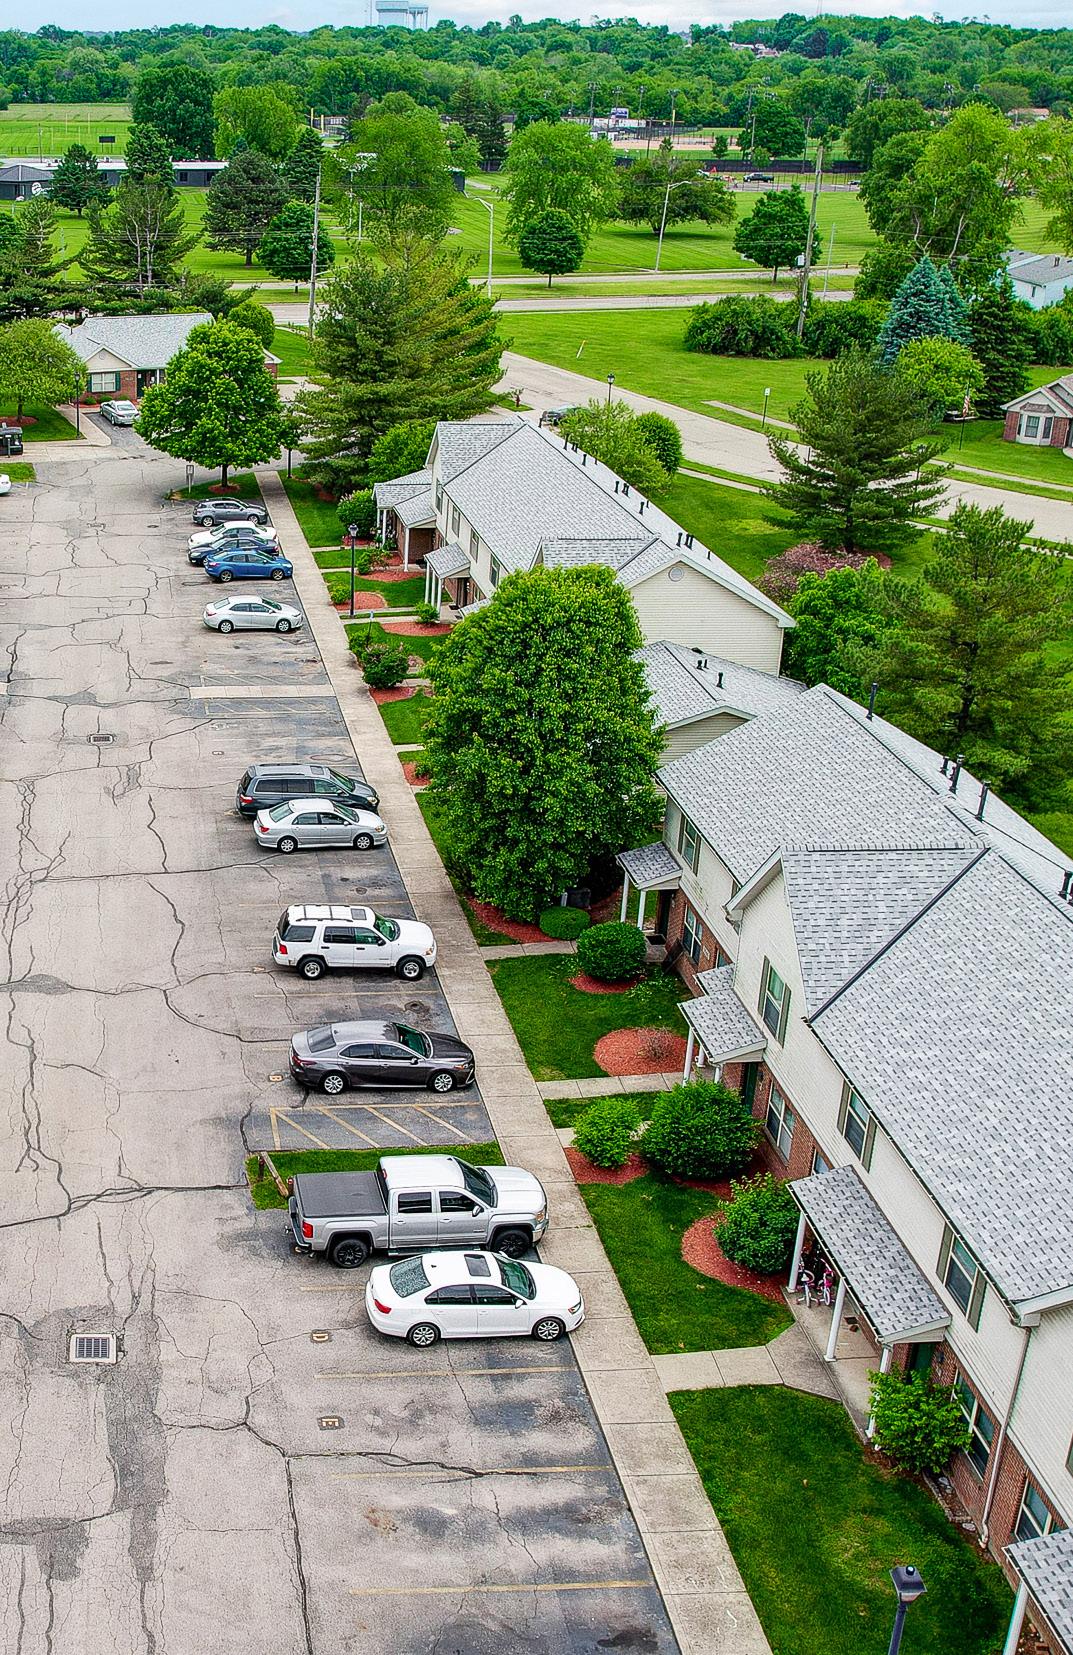
Parking Type: Parking Lot
Parking Surface: Paved
HVAC: Individual AC
Water Heater: Individual water heaters
Framing: Wood
Roofs: Pitched, New as of 2022
Exterior of Building: Brick and siding

SECTION - THE INVESTMENT
TENANT
PAYS: Electric, Gas, Water, Sewer
01


INVESTMENT HIGHLIGHTS
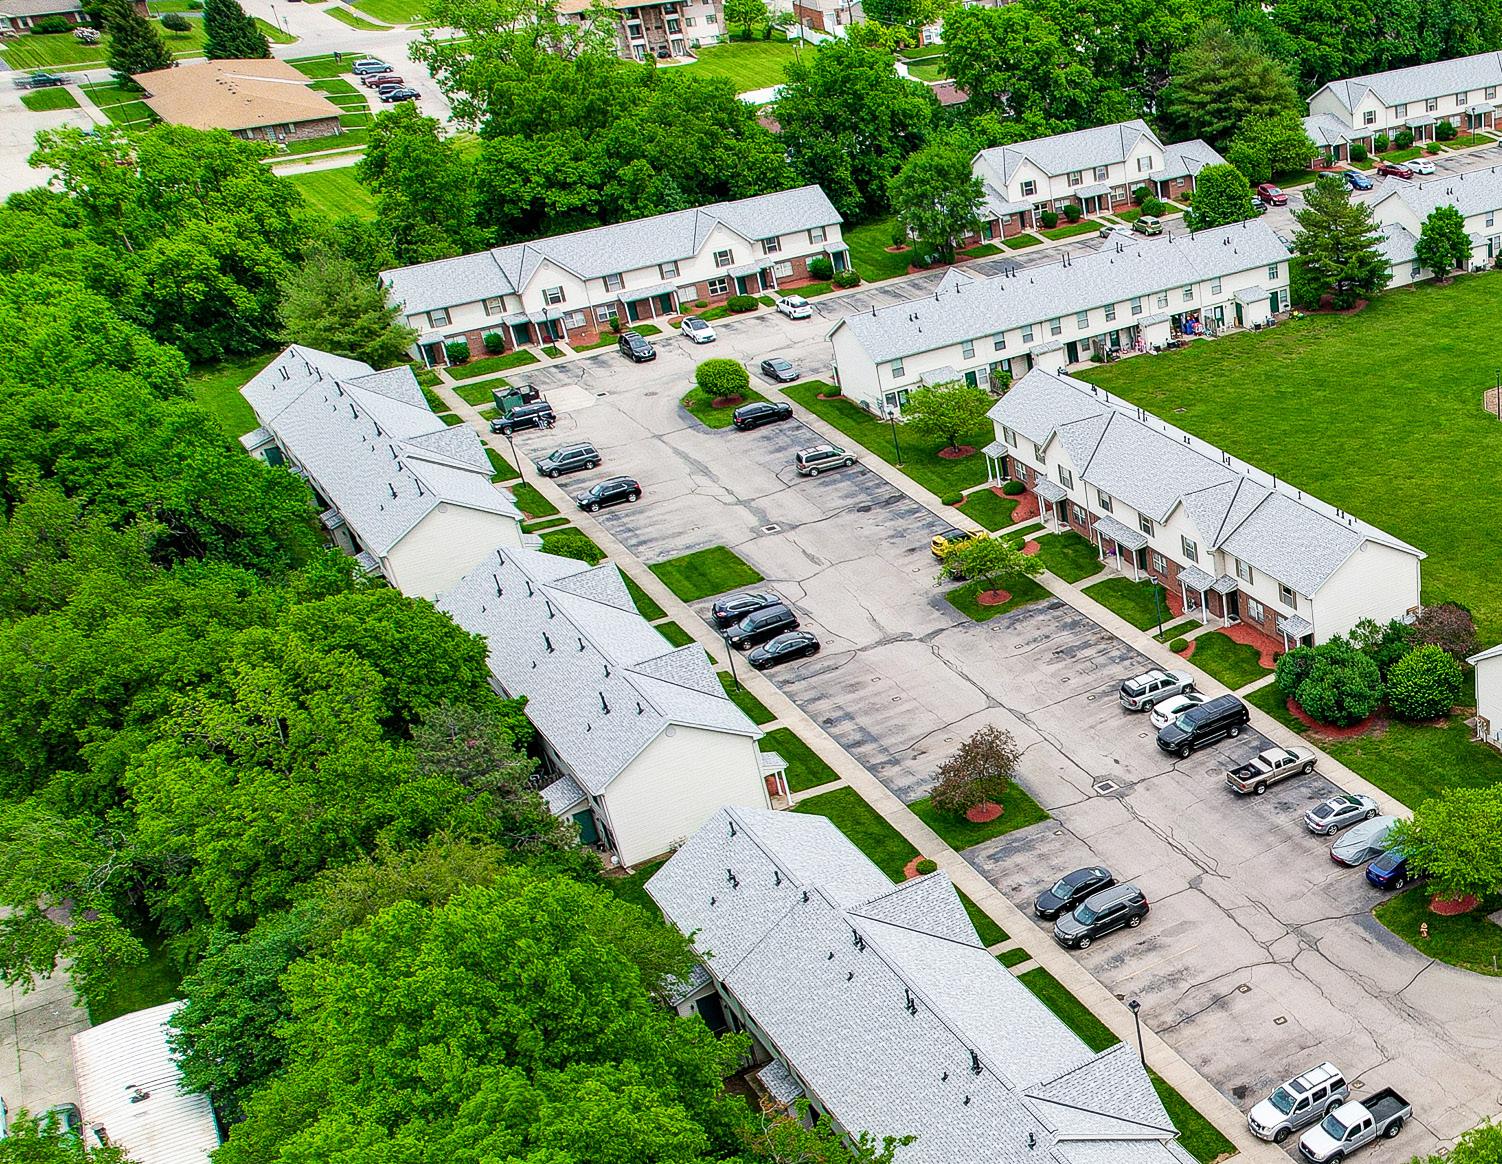
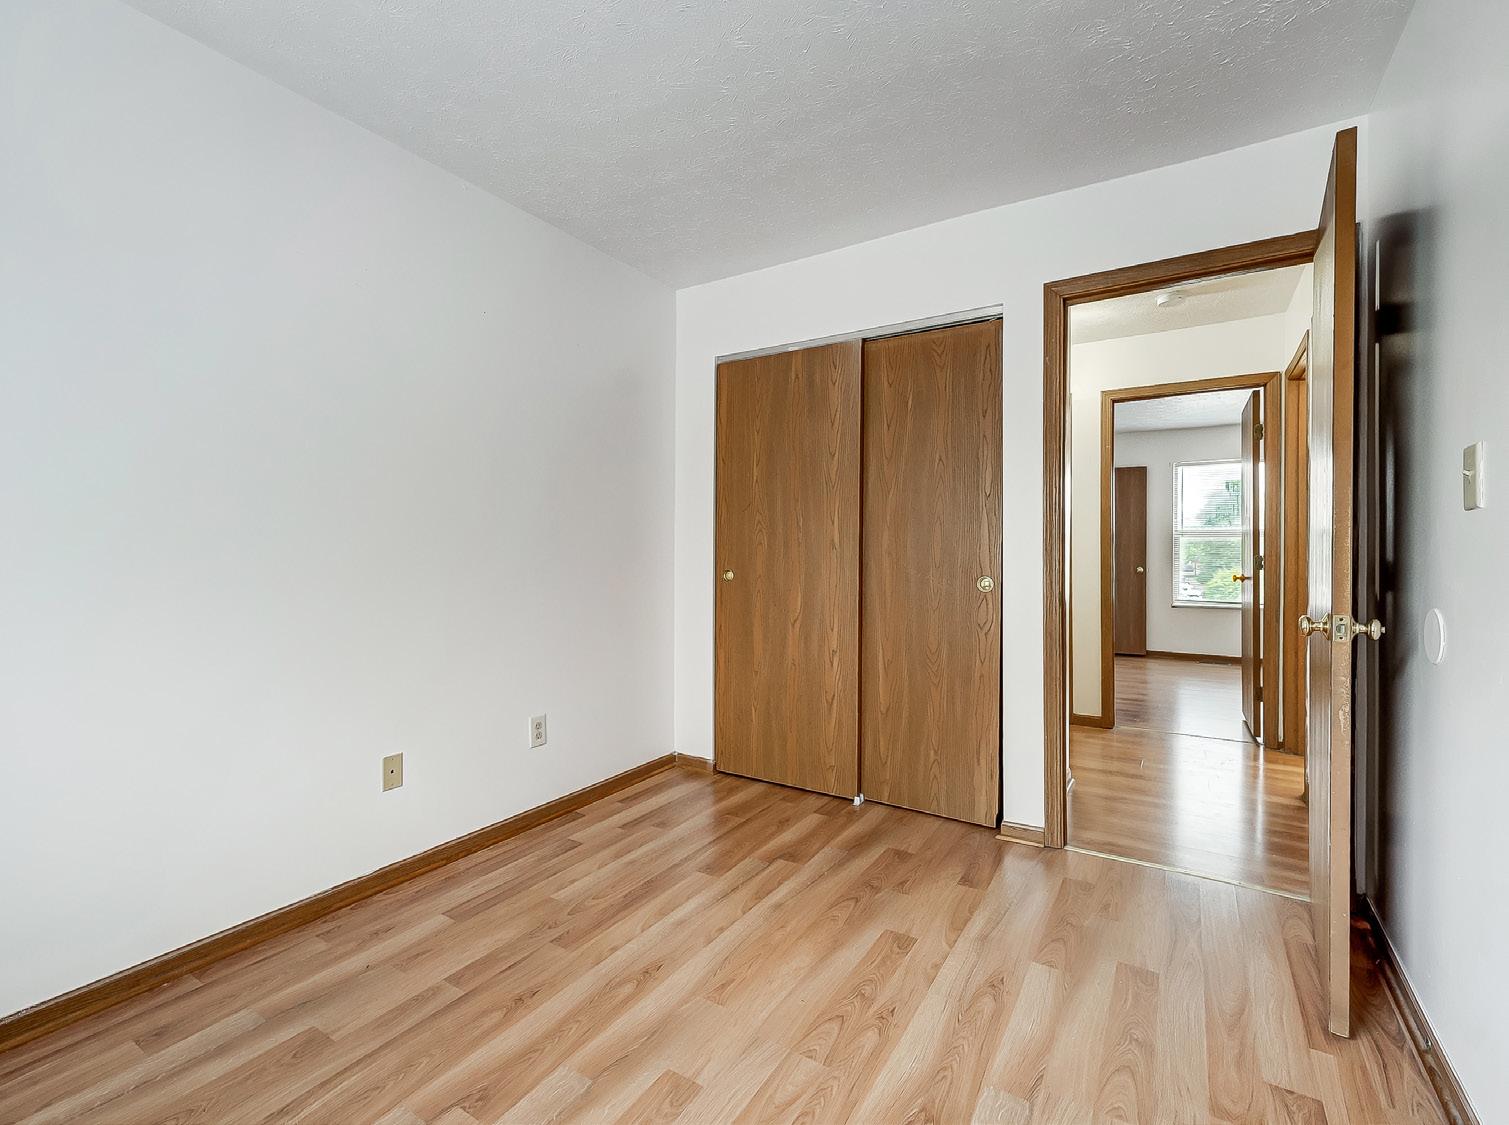
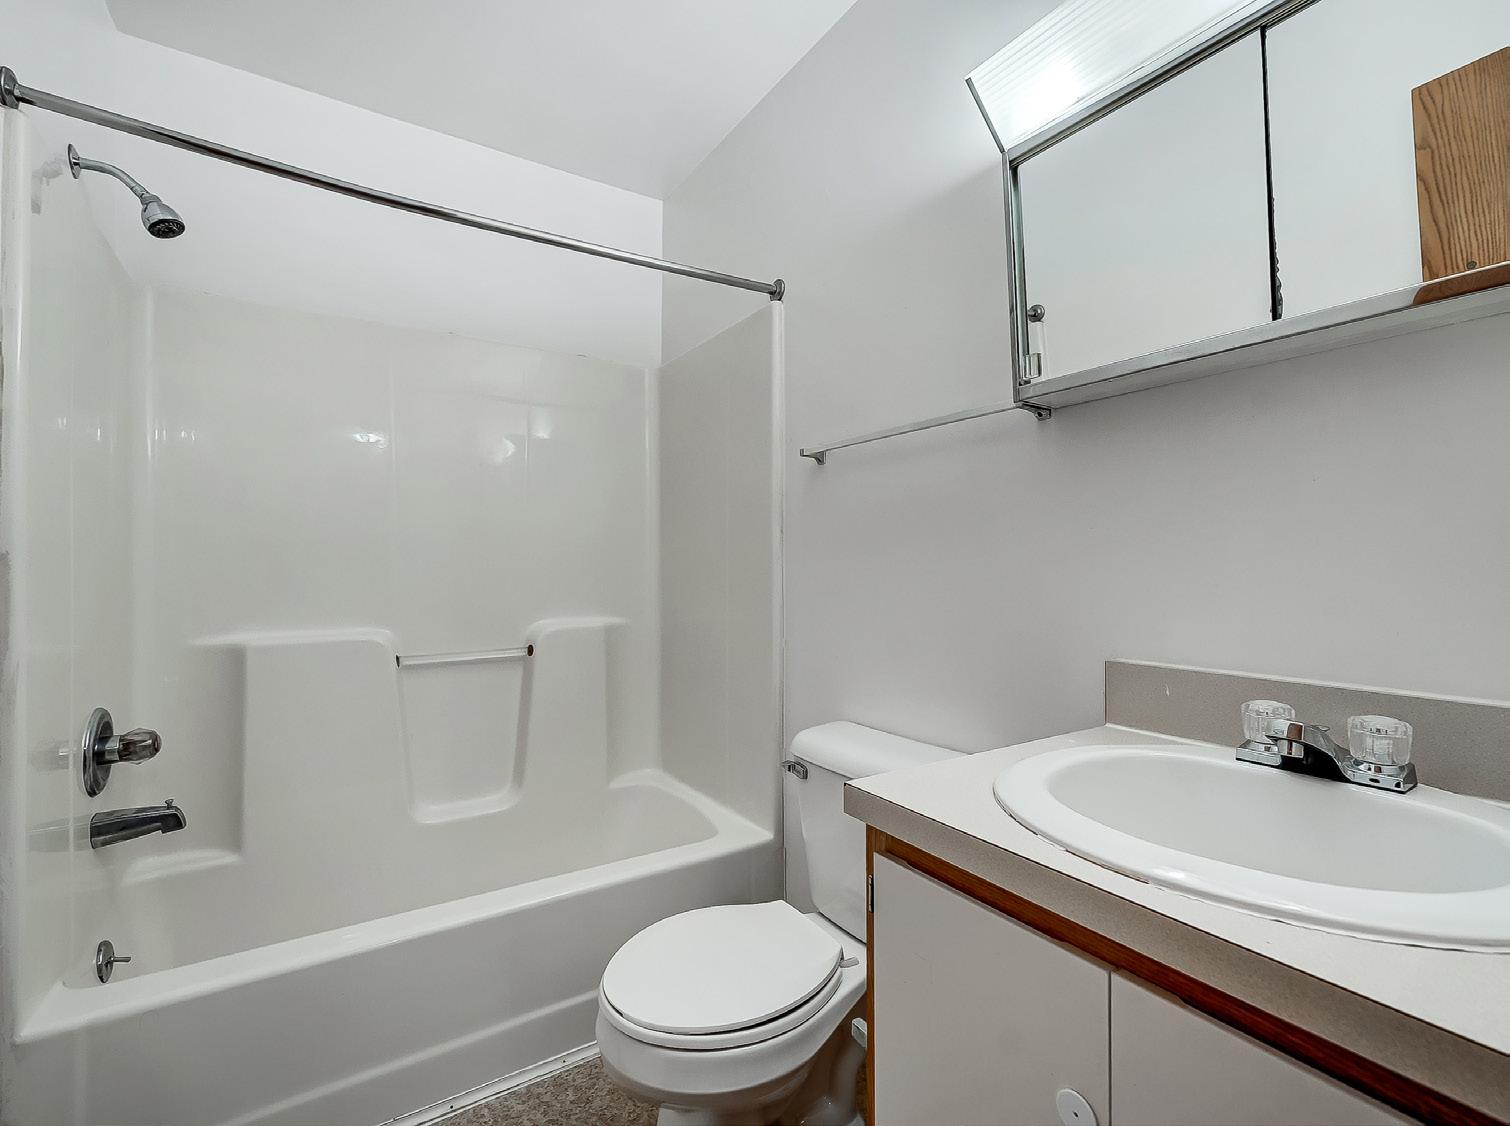
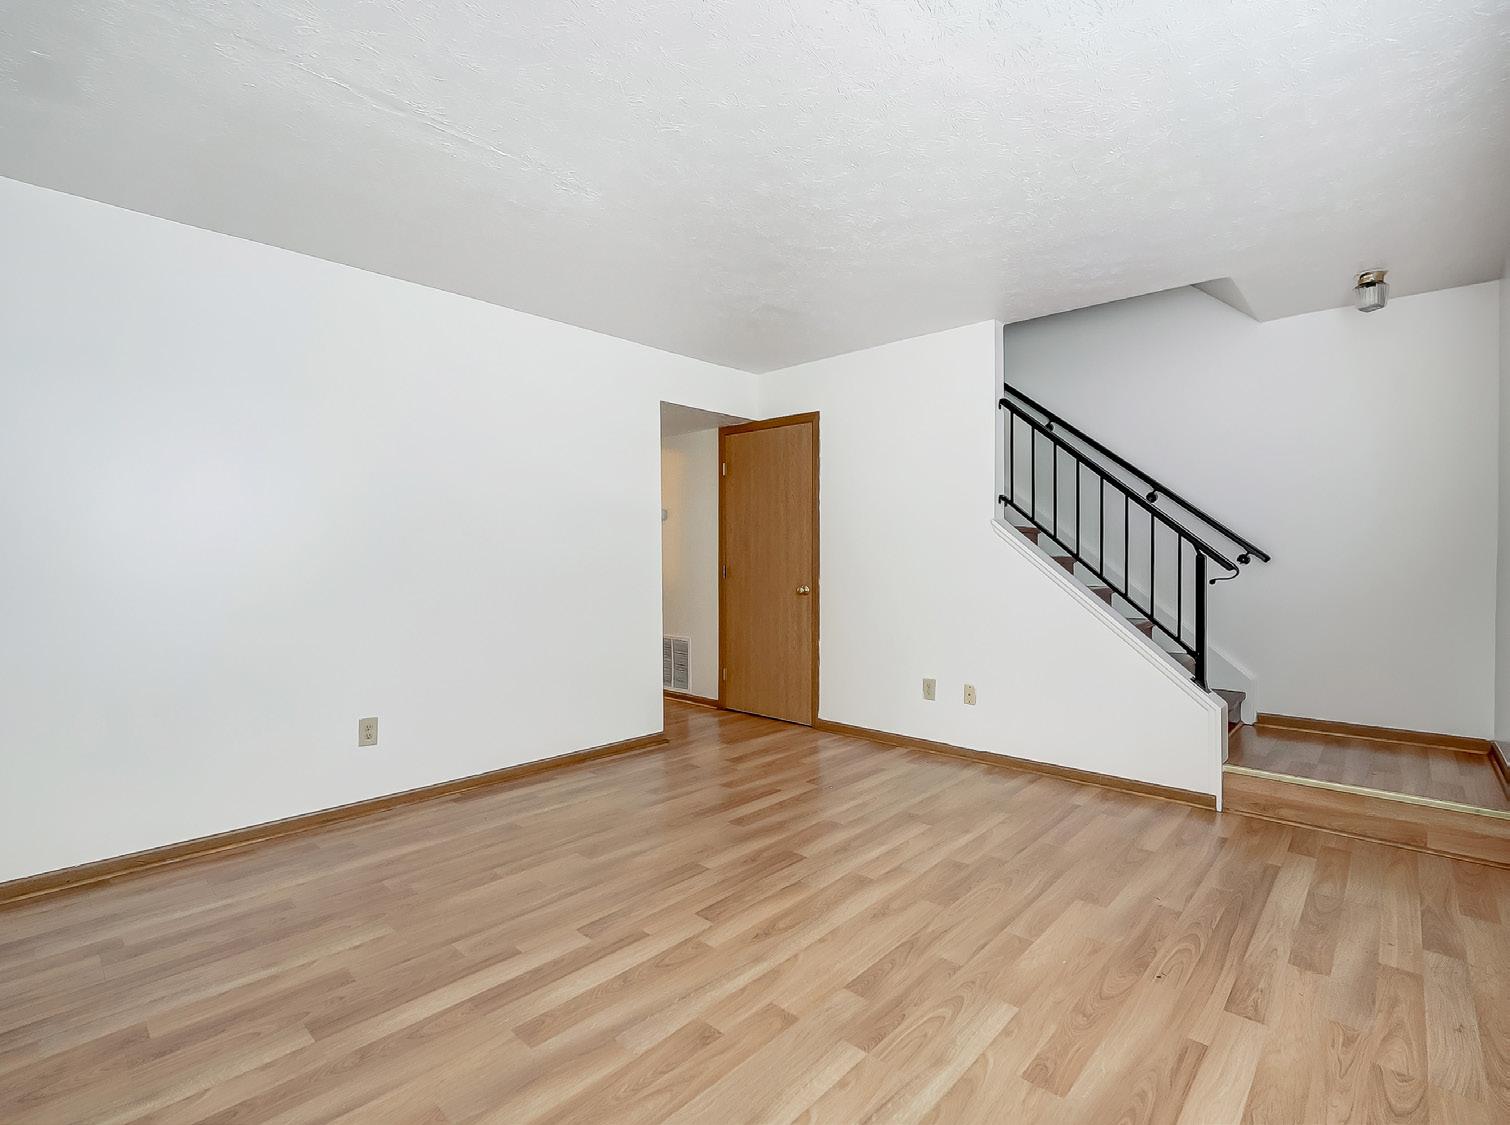
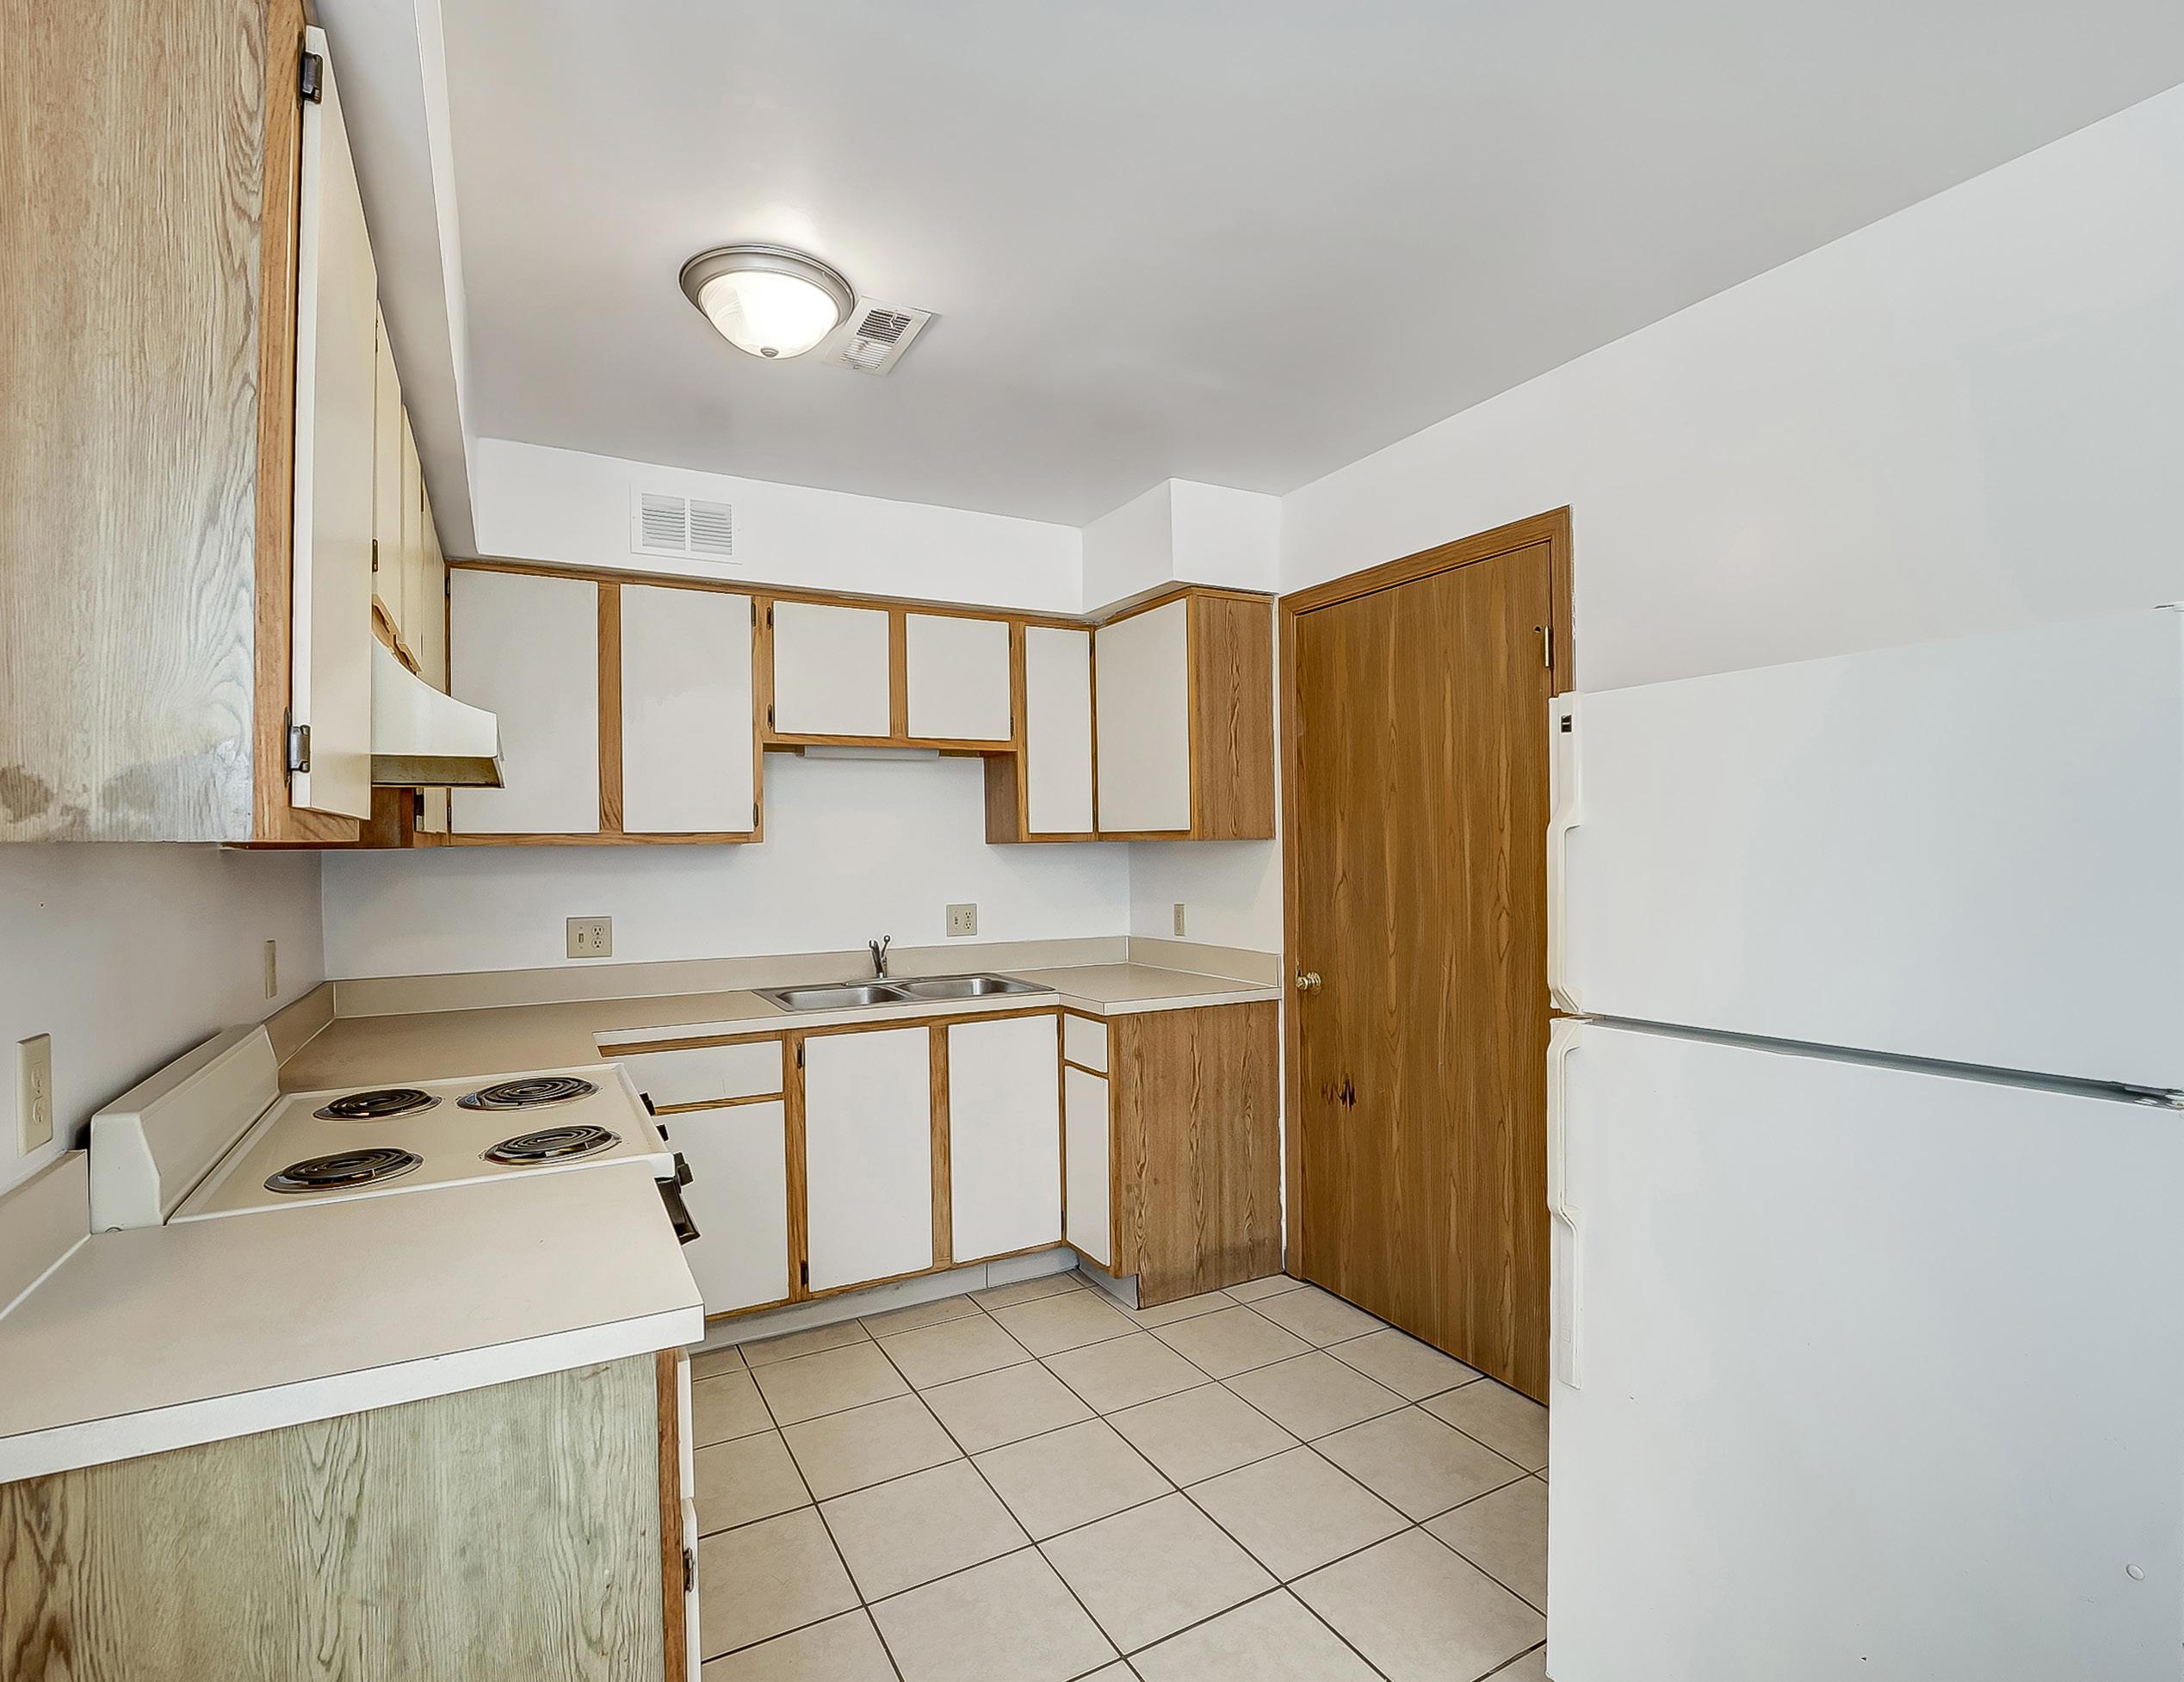
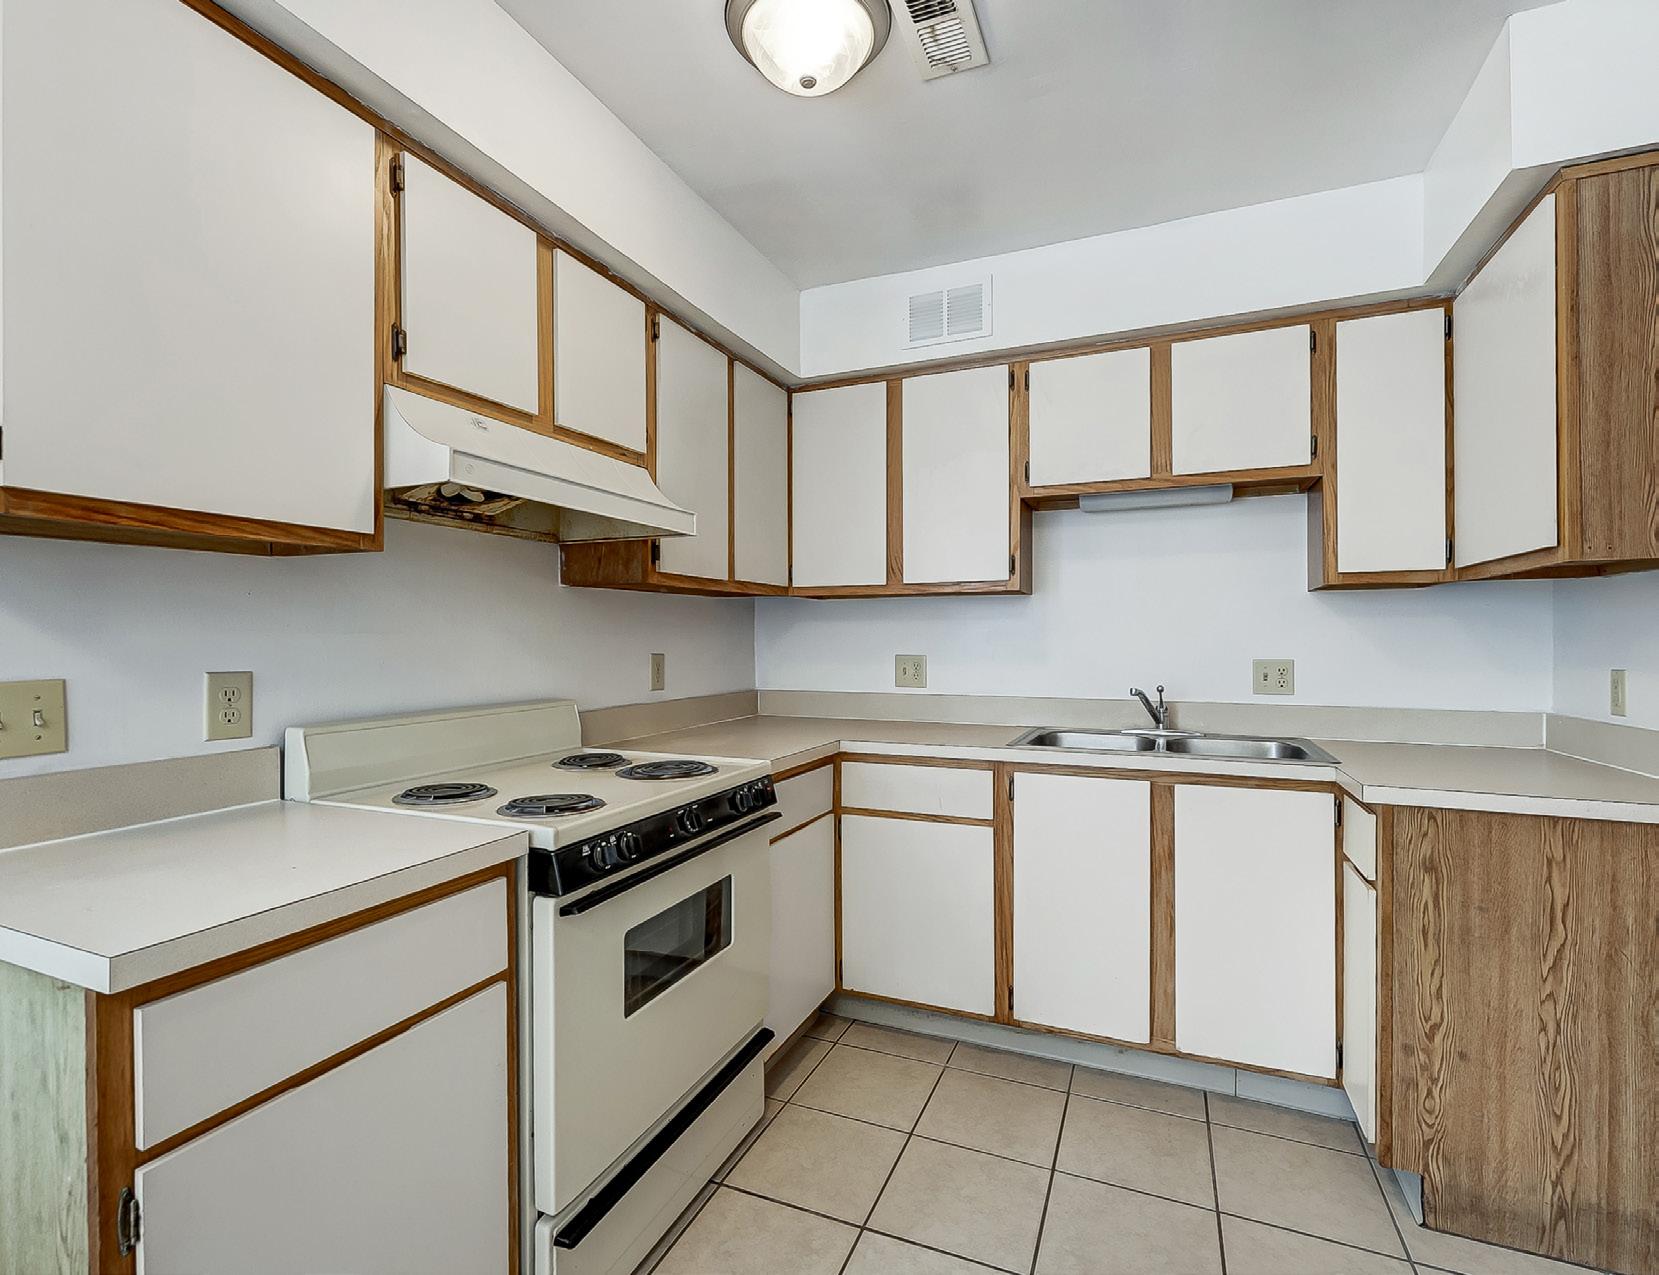
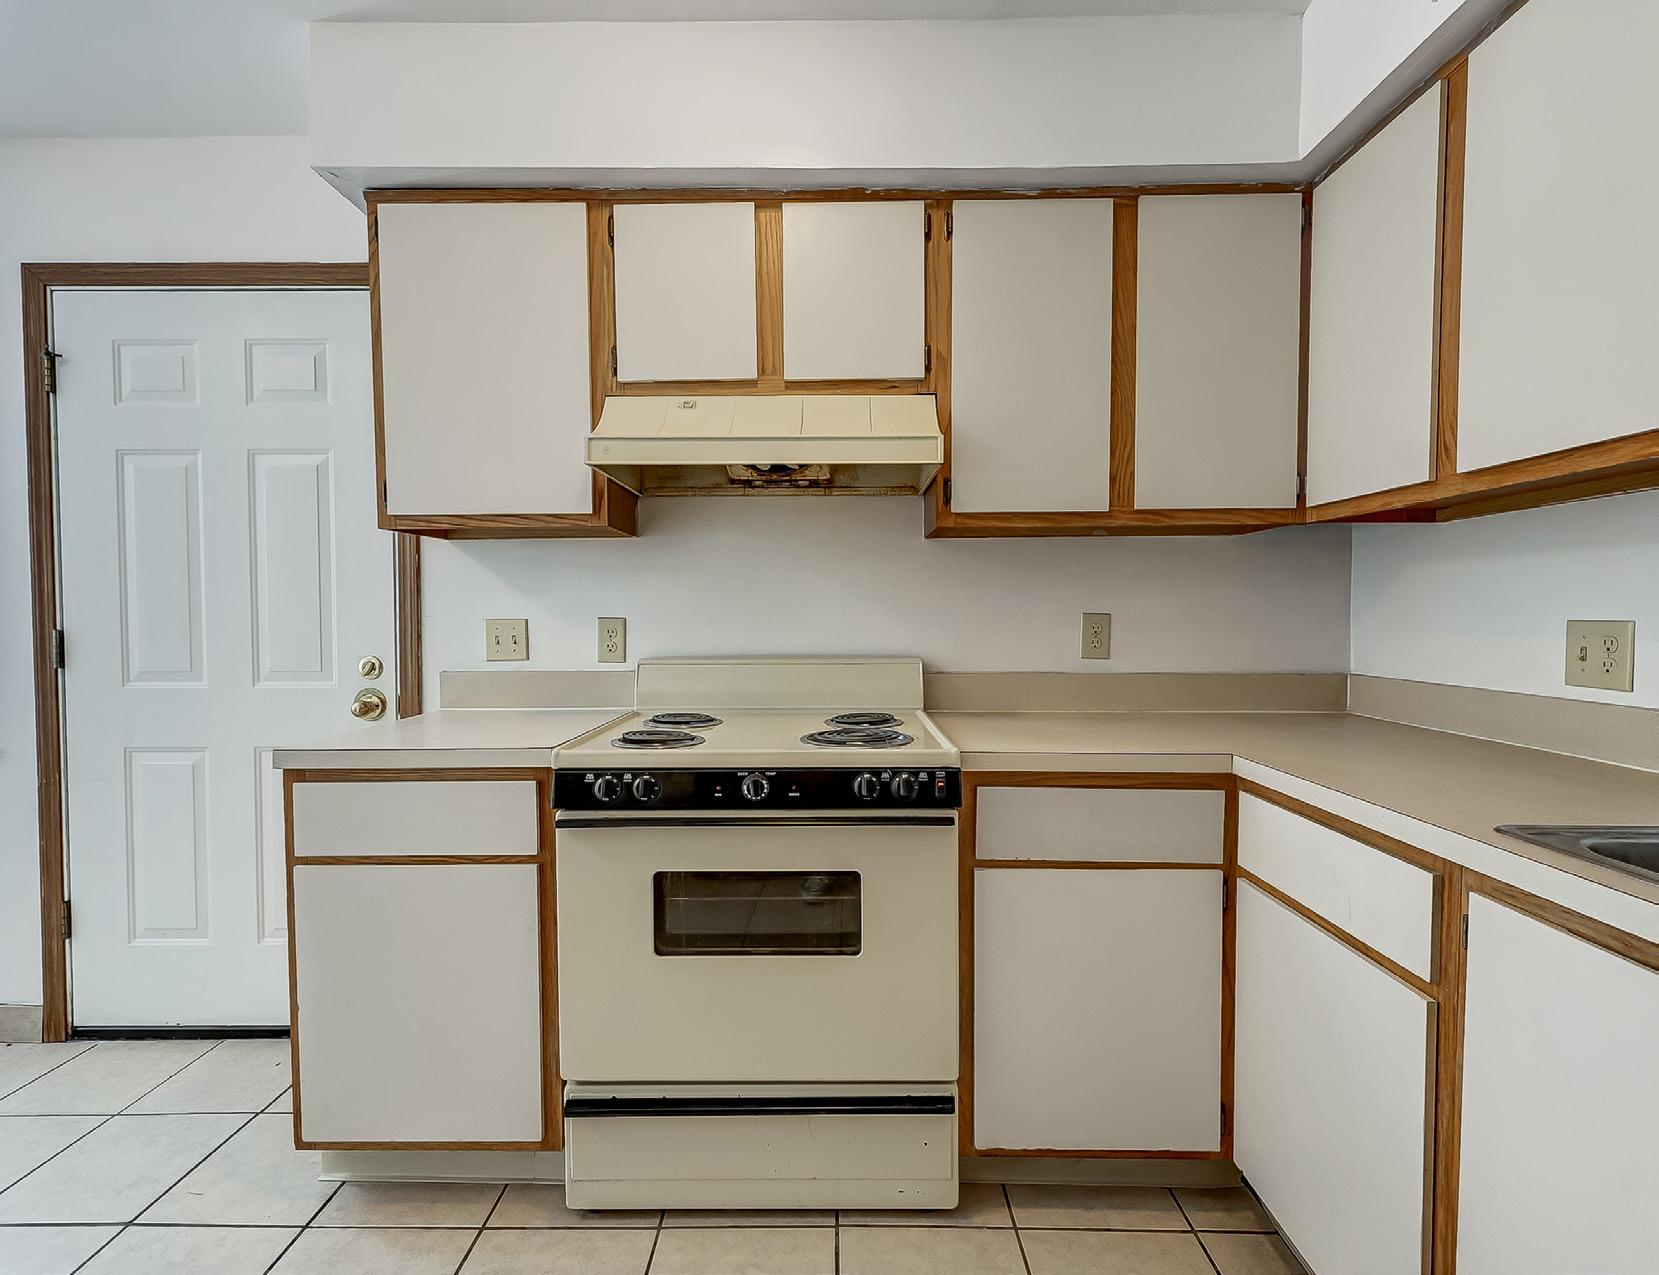
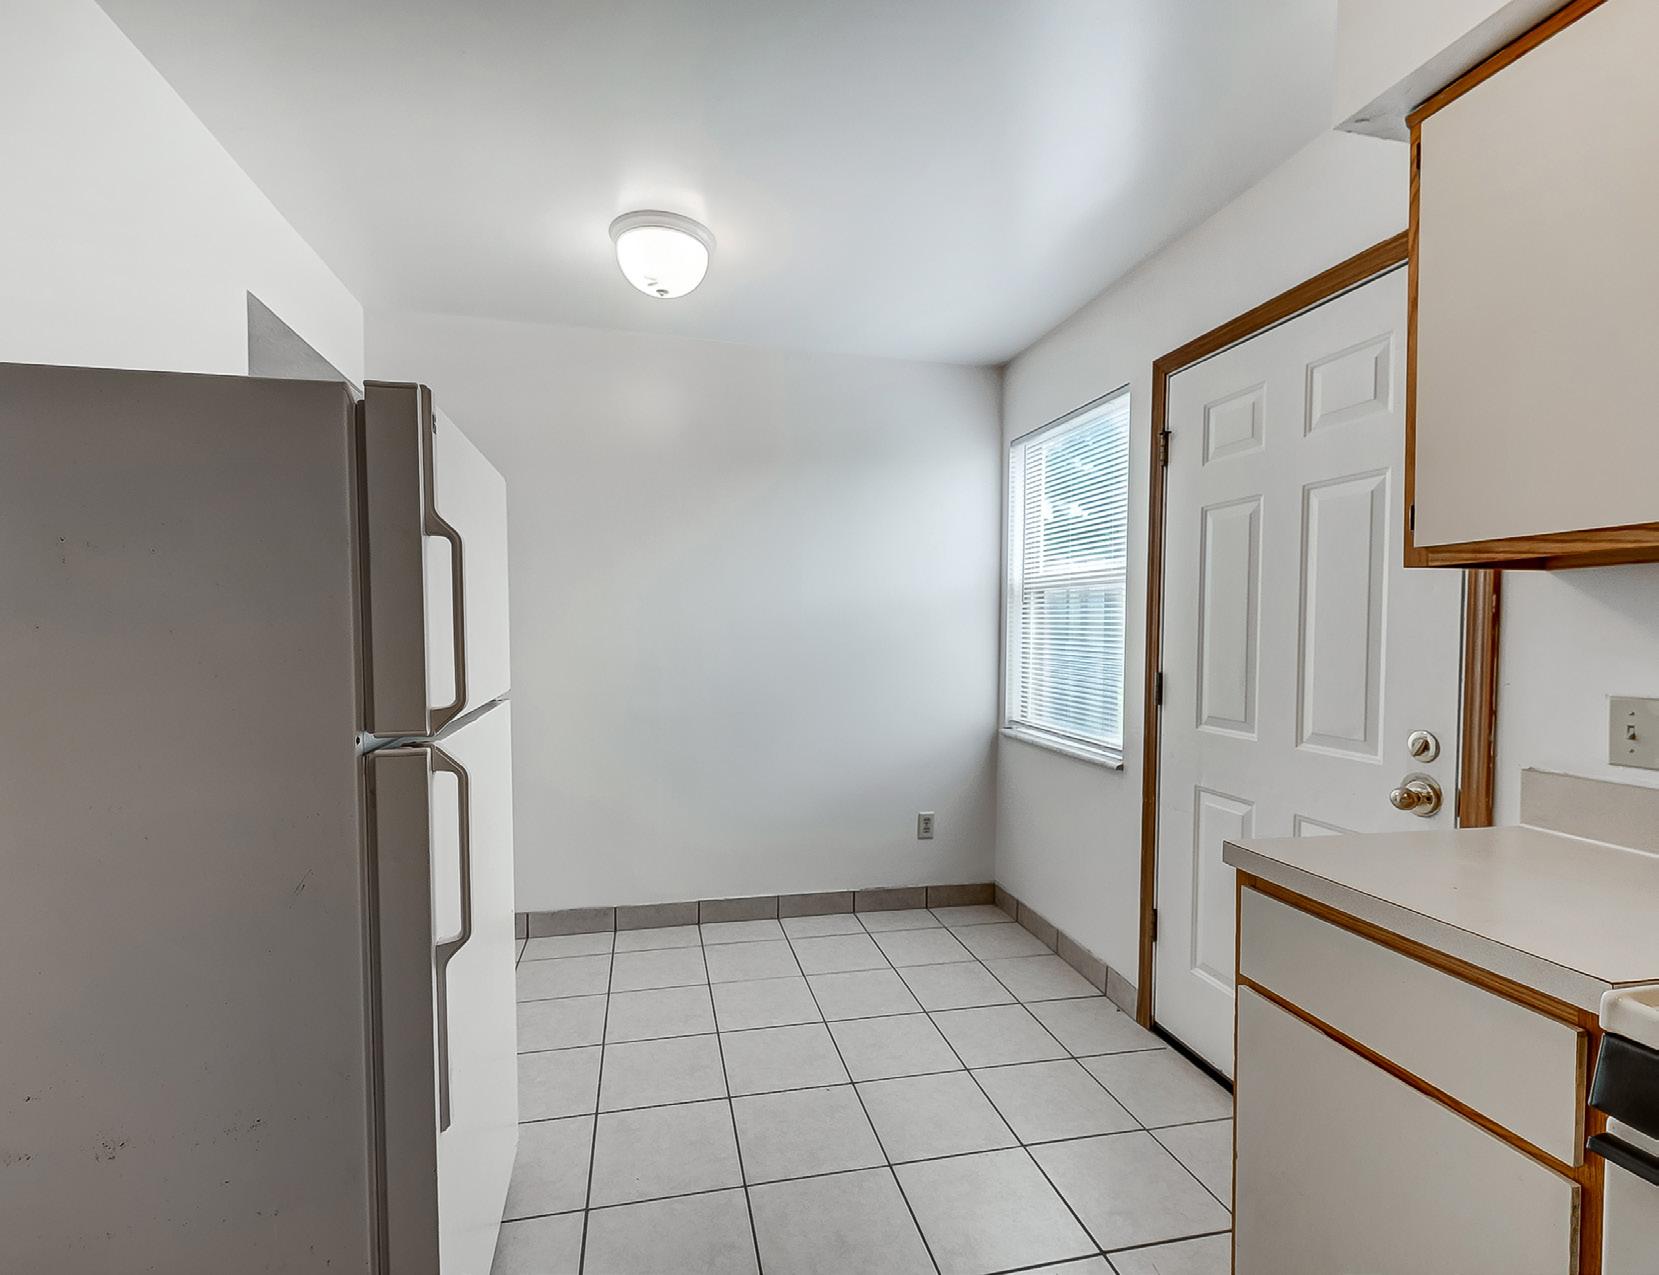
INDIVIDUAL HVAC systems
WASHER/DRYER HOOKUPS
1995 CONSTRUCTION
SUBMETERED WATER
SUBMETERED WATER
LONG TERM OWNERSHIP
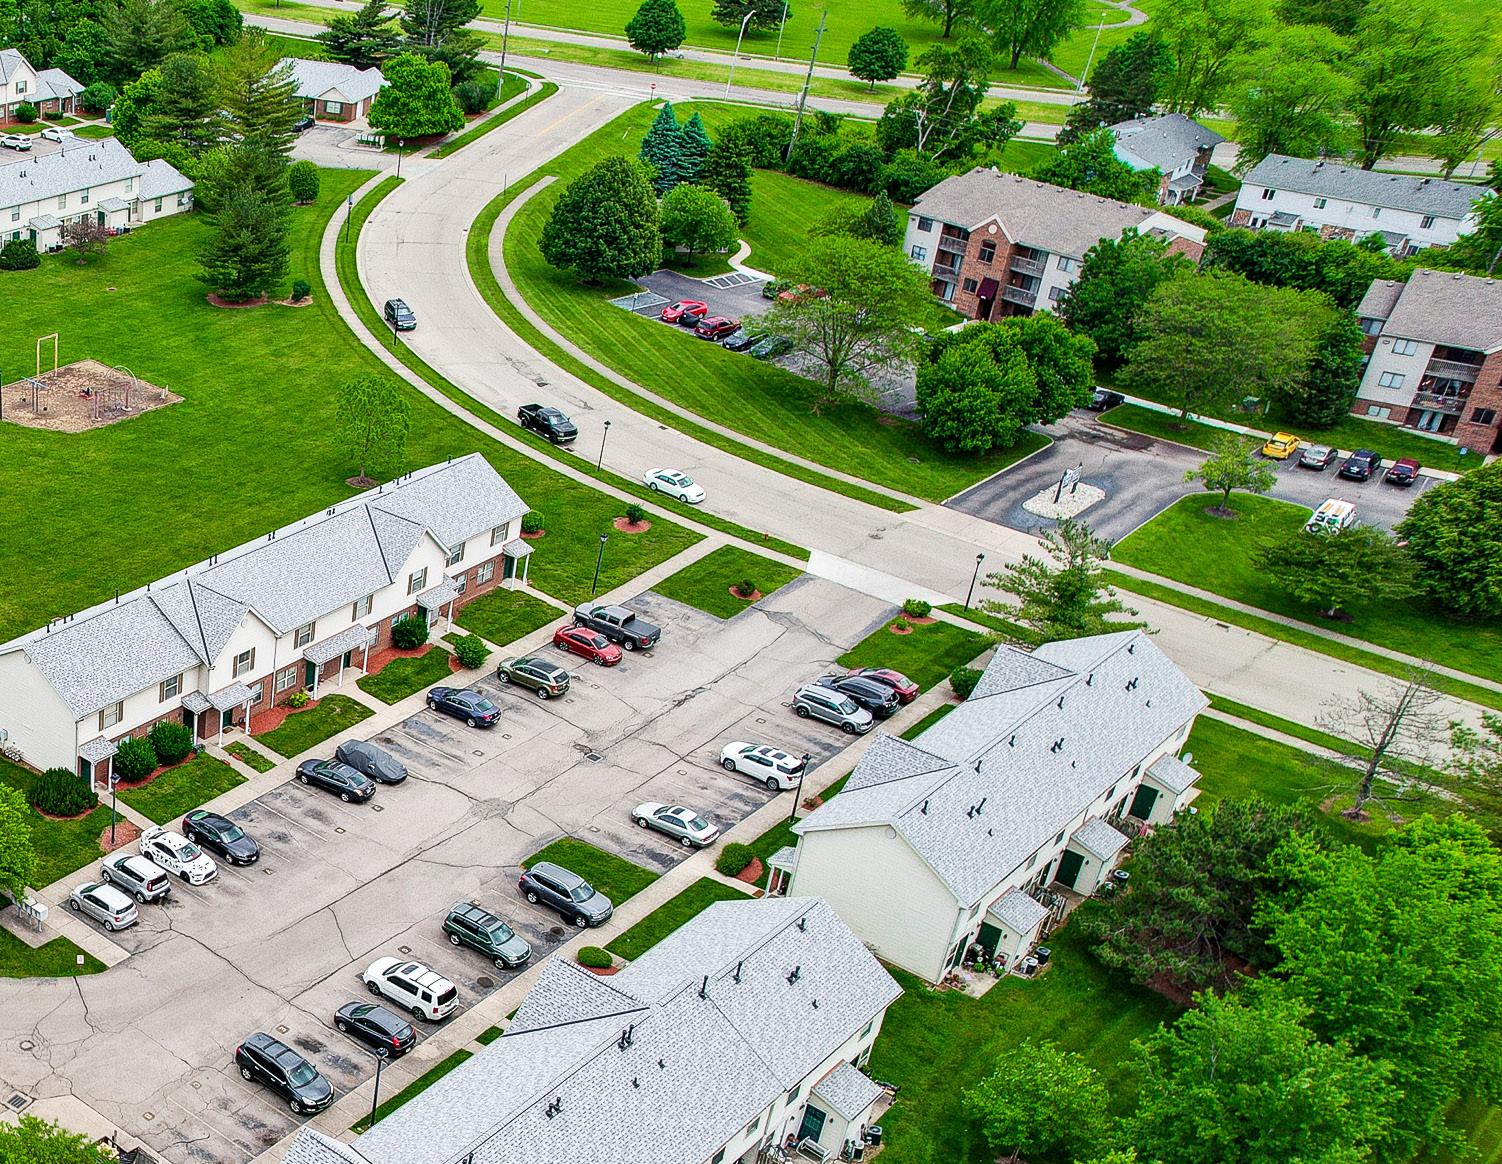
ALL ROOFS REPLACED SINCE 2022
ALL 2- & 3-BEDROOM UNITS

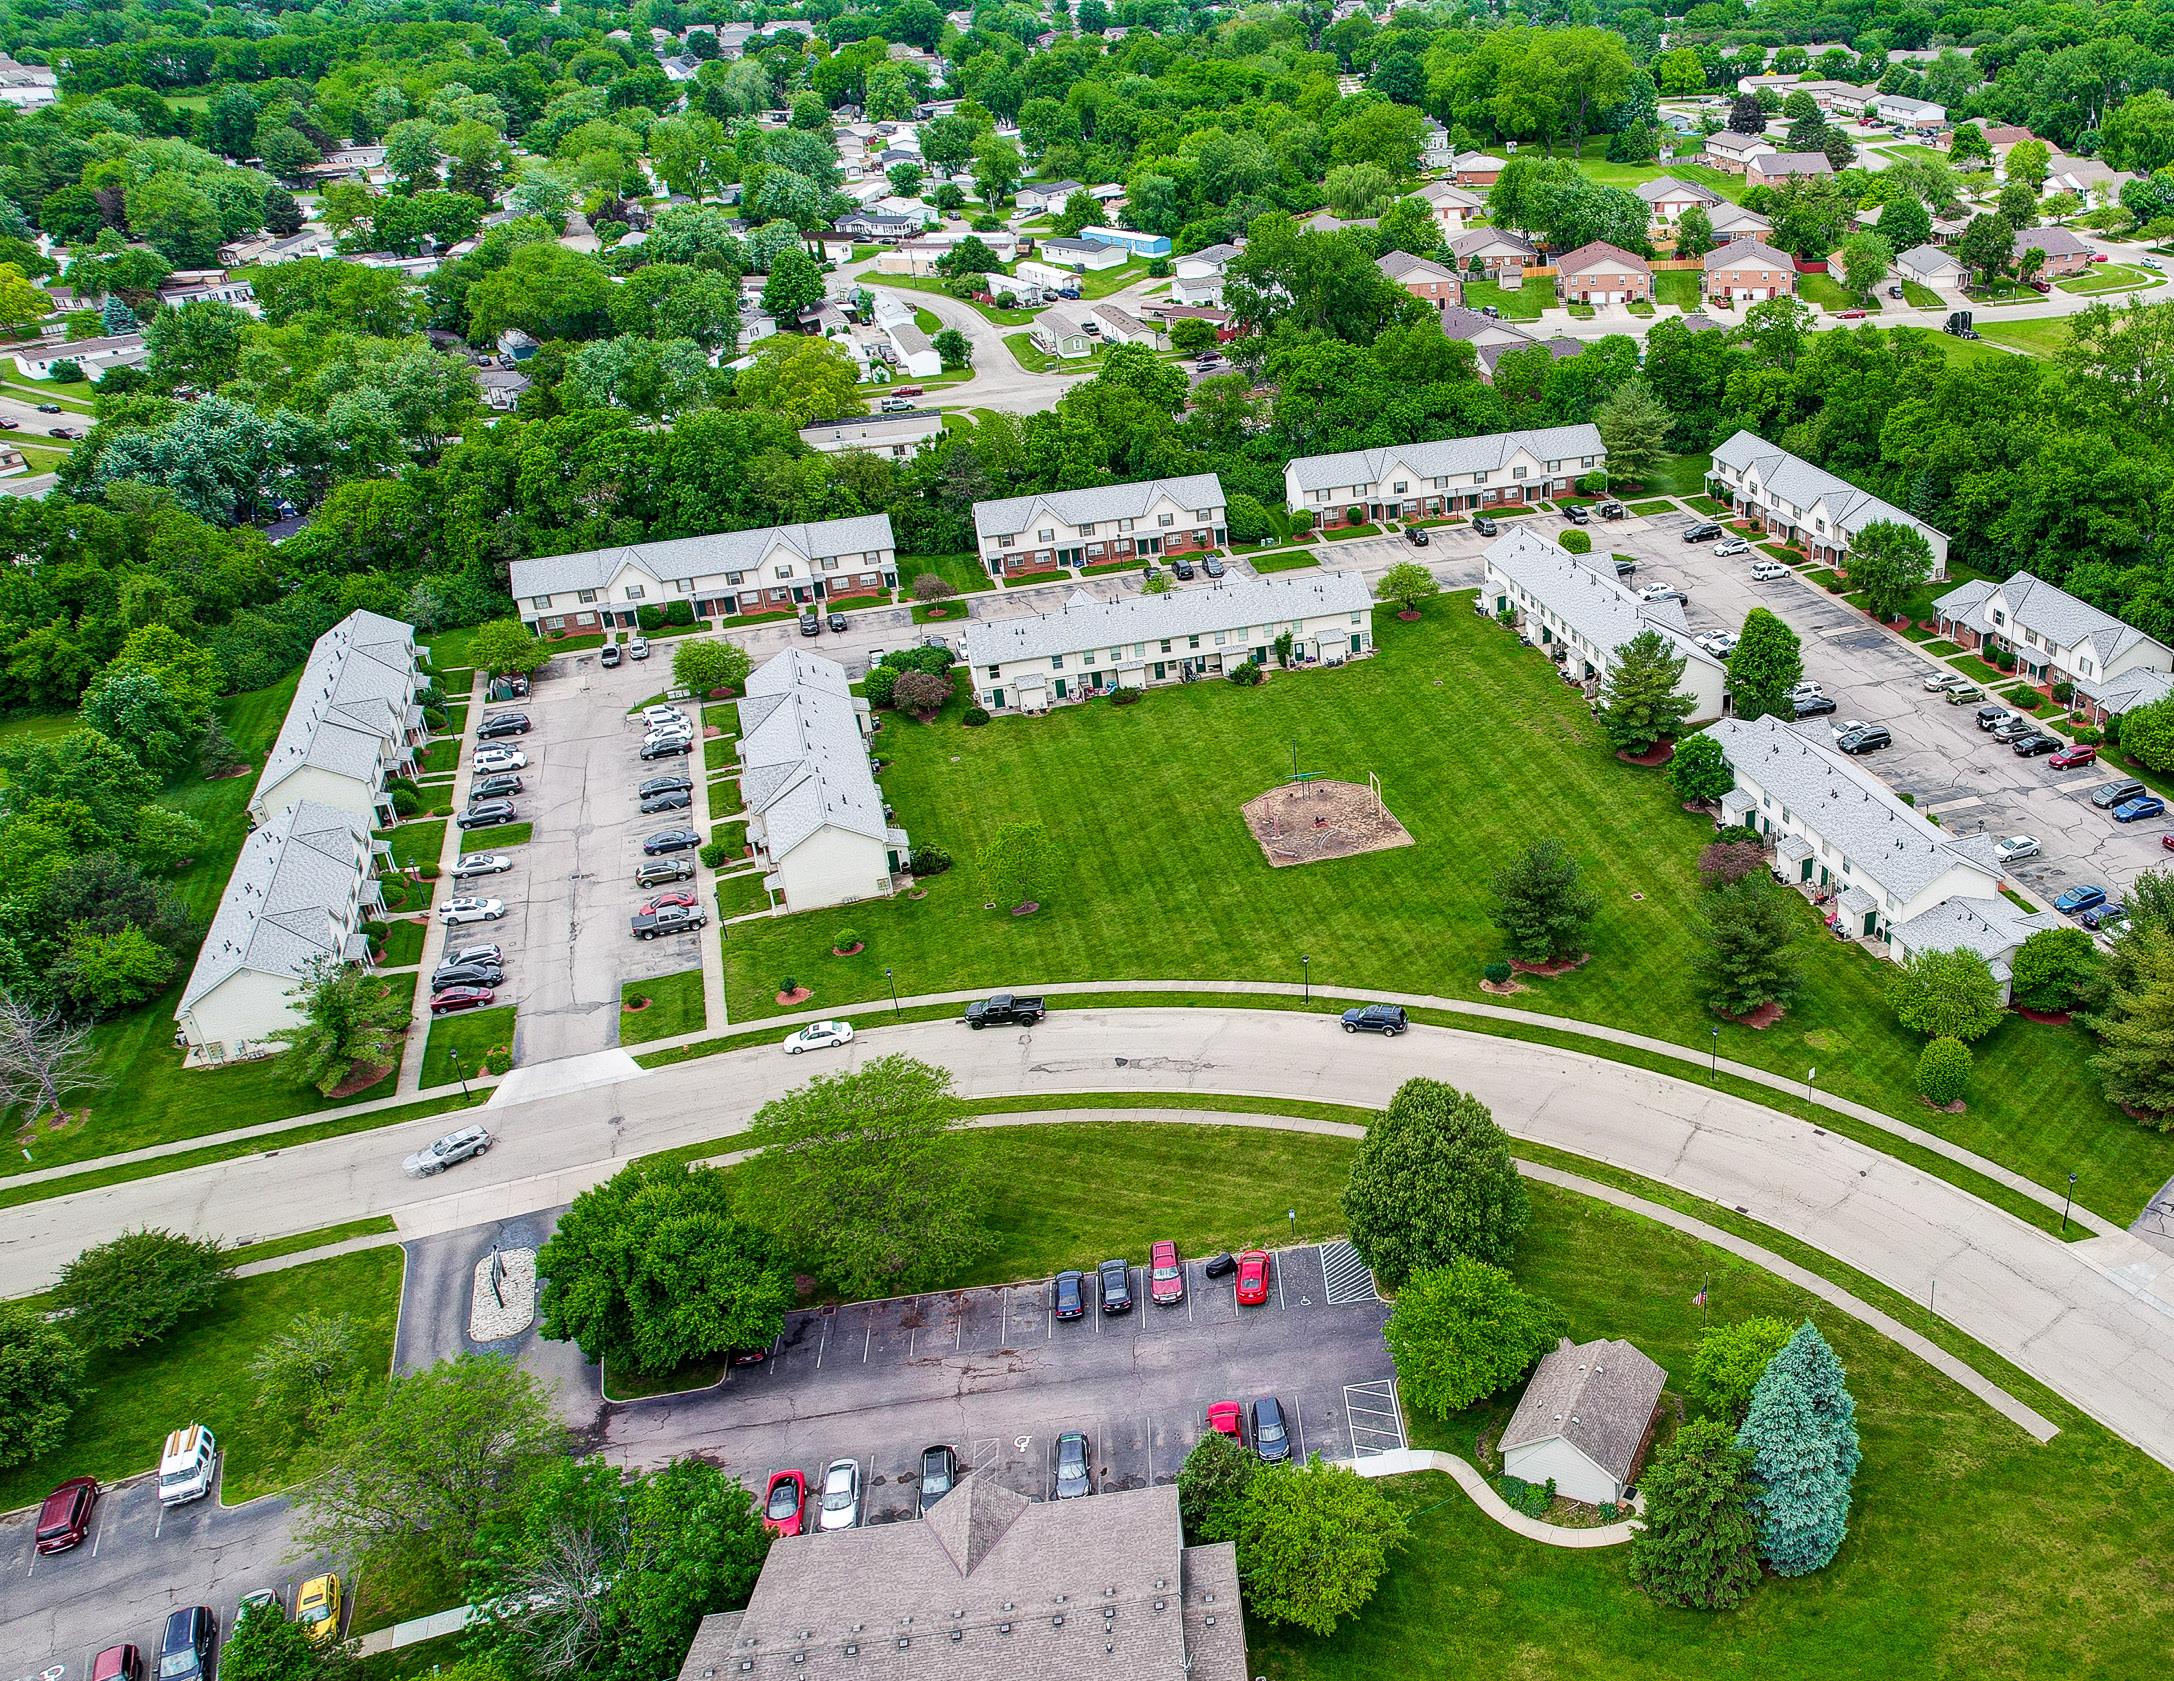
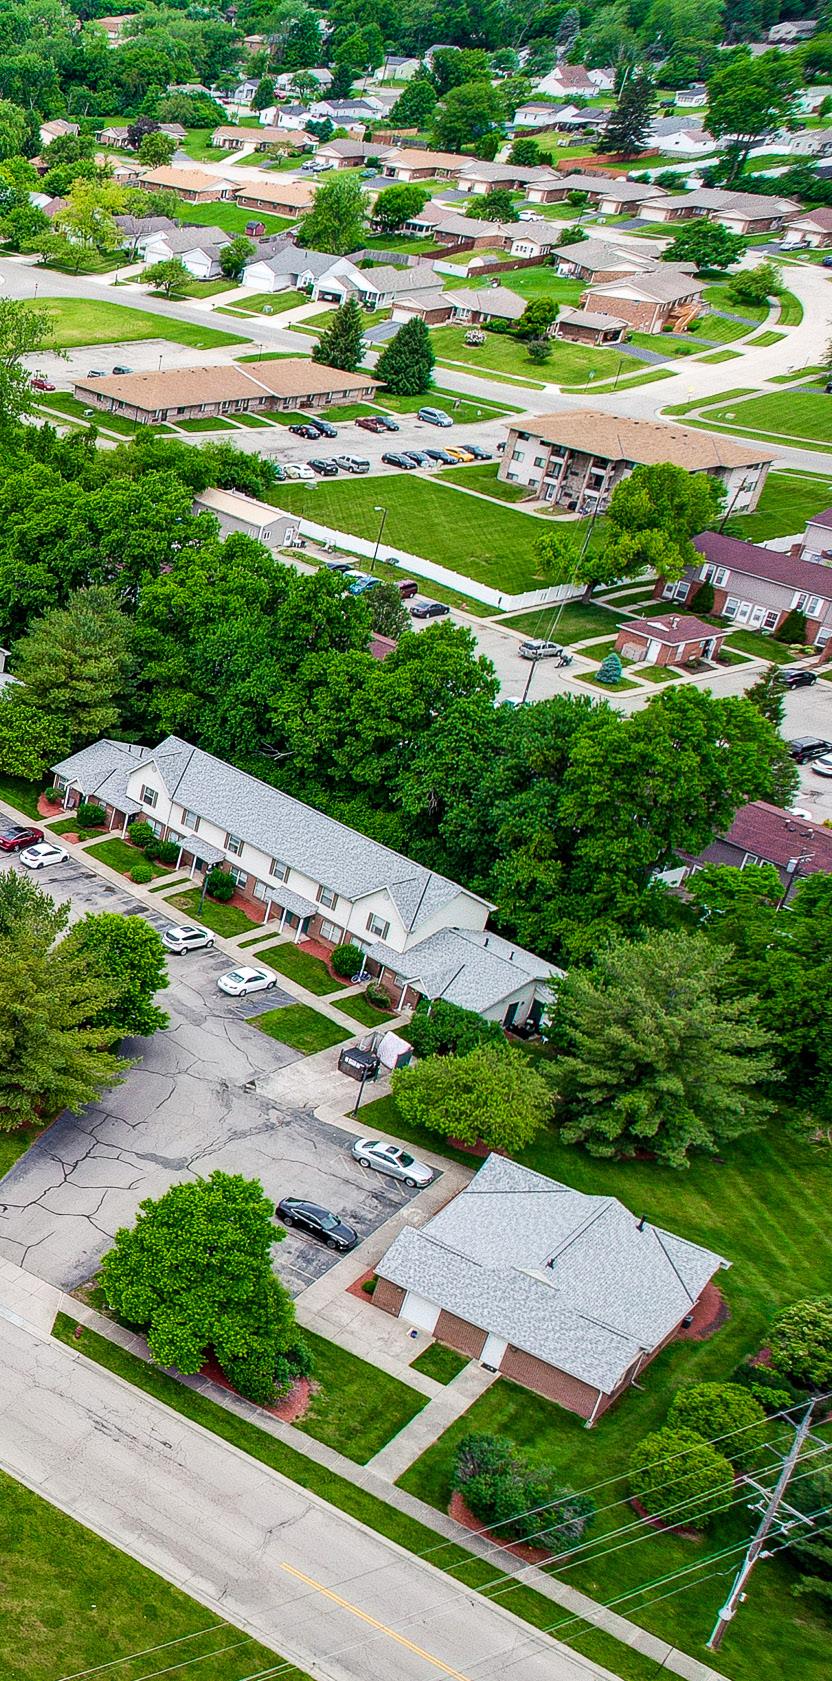

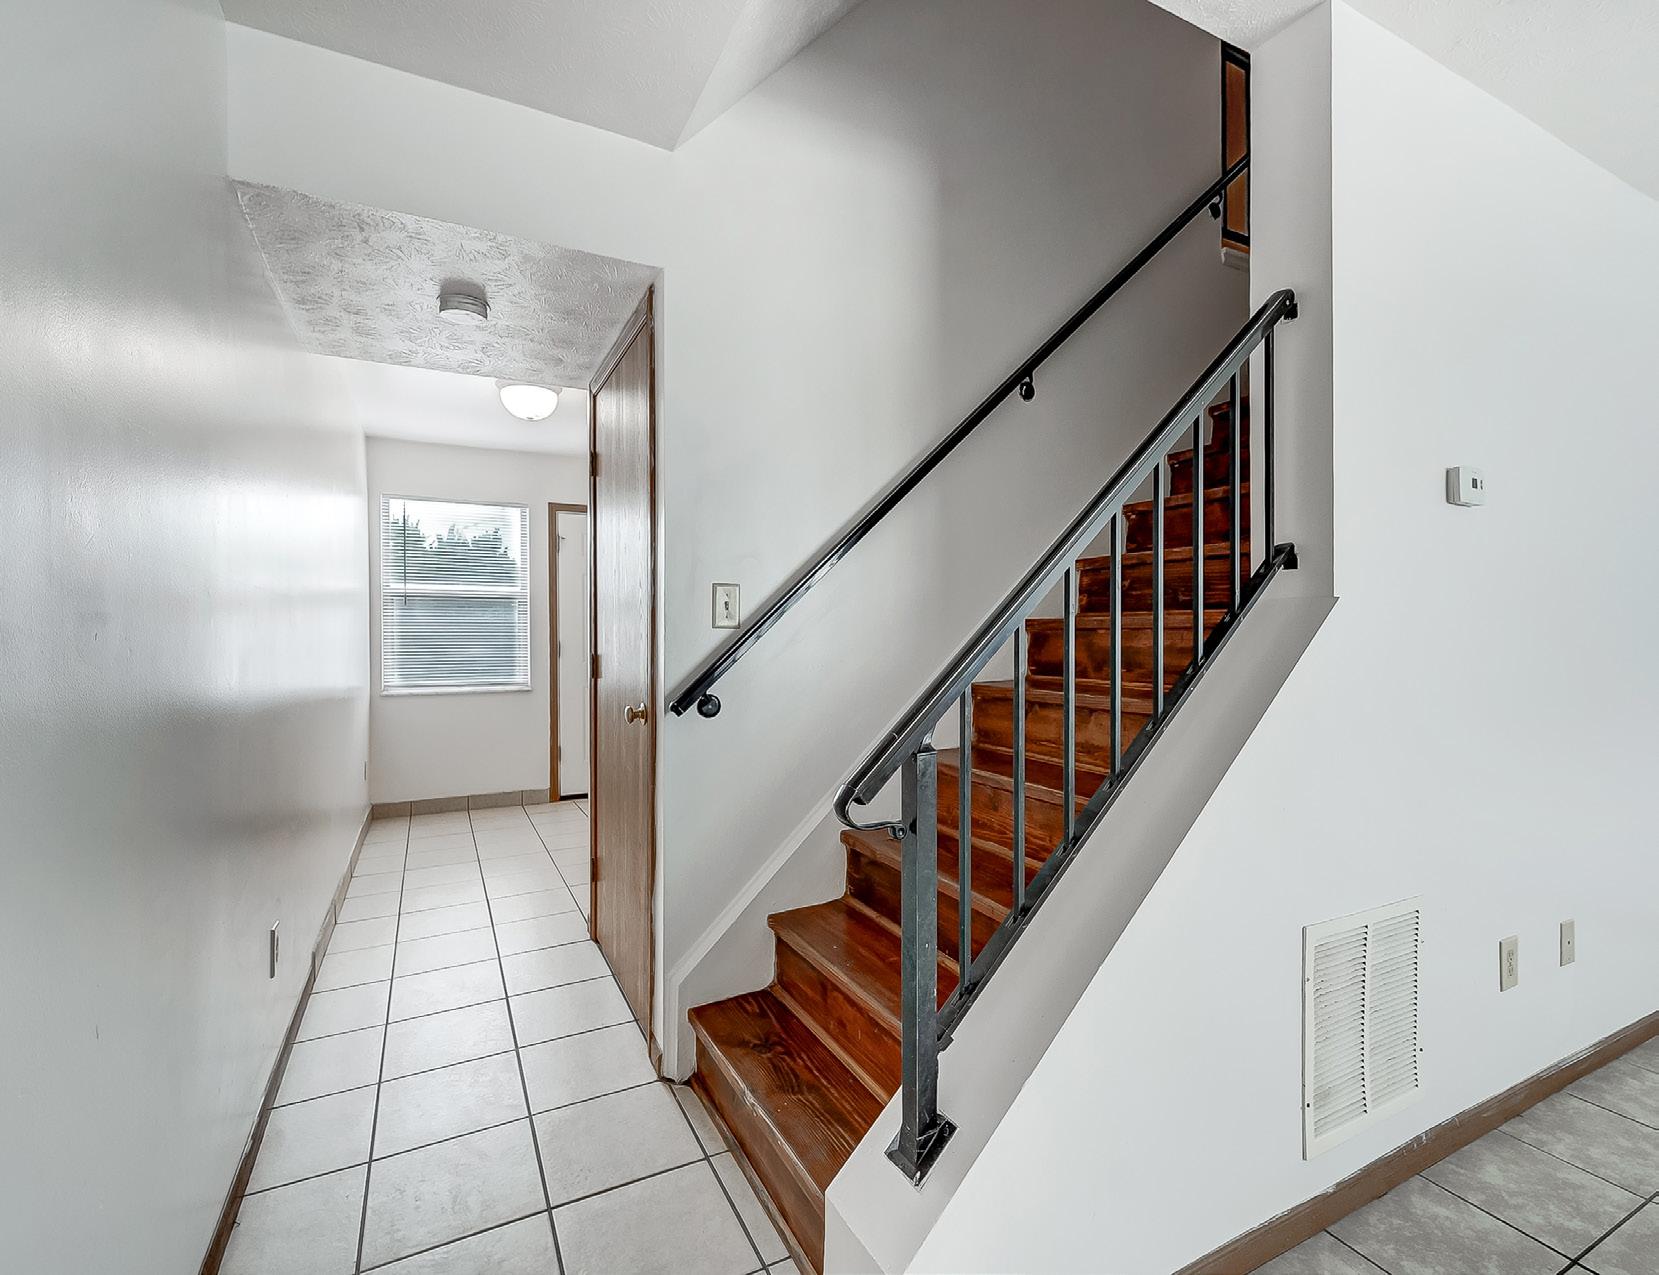
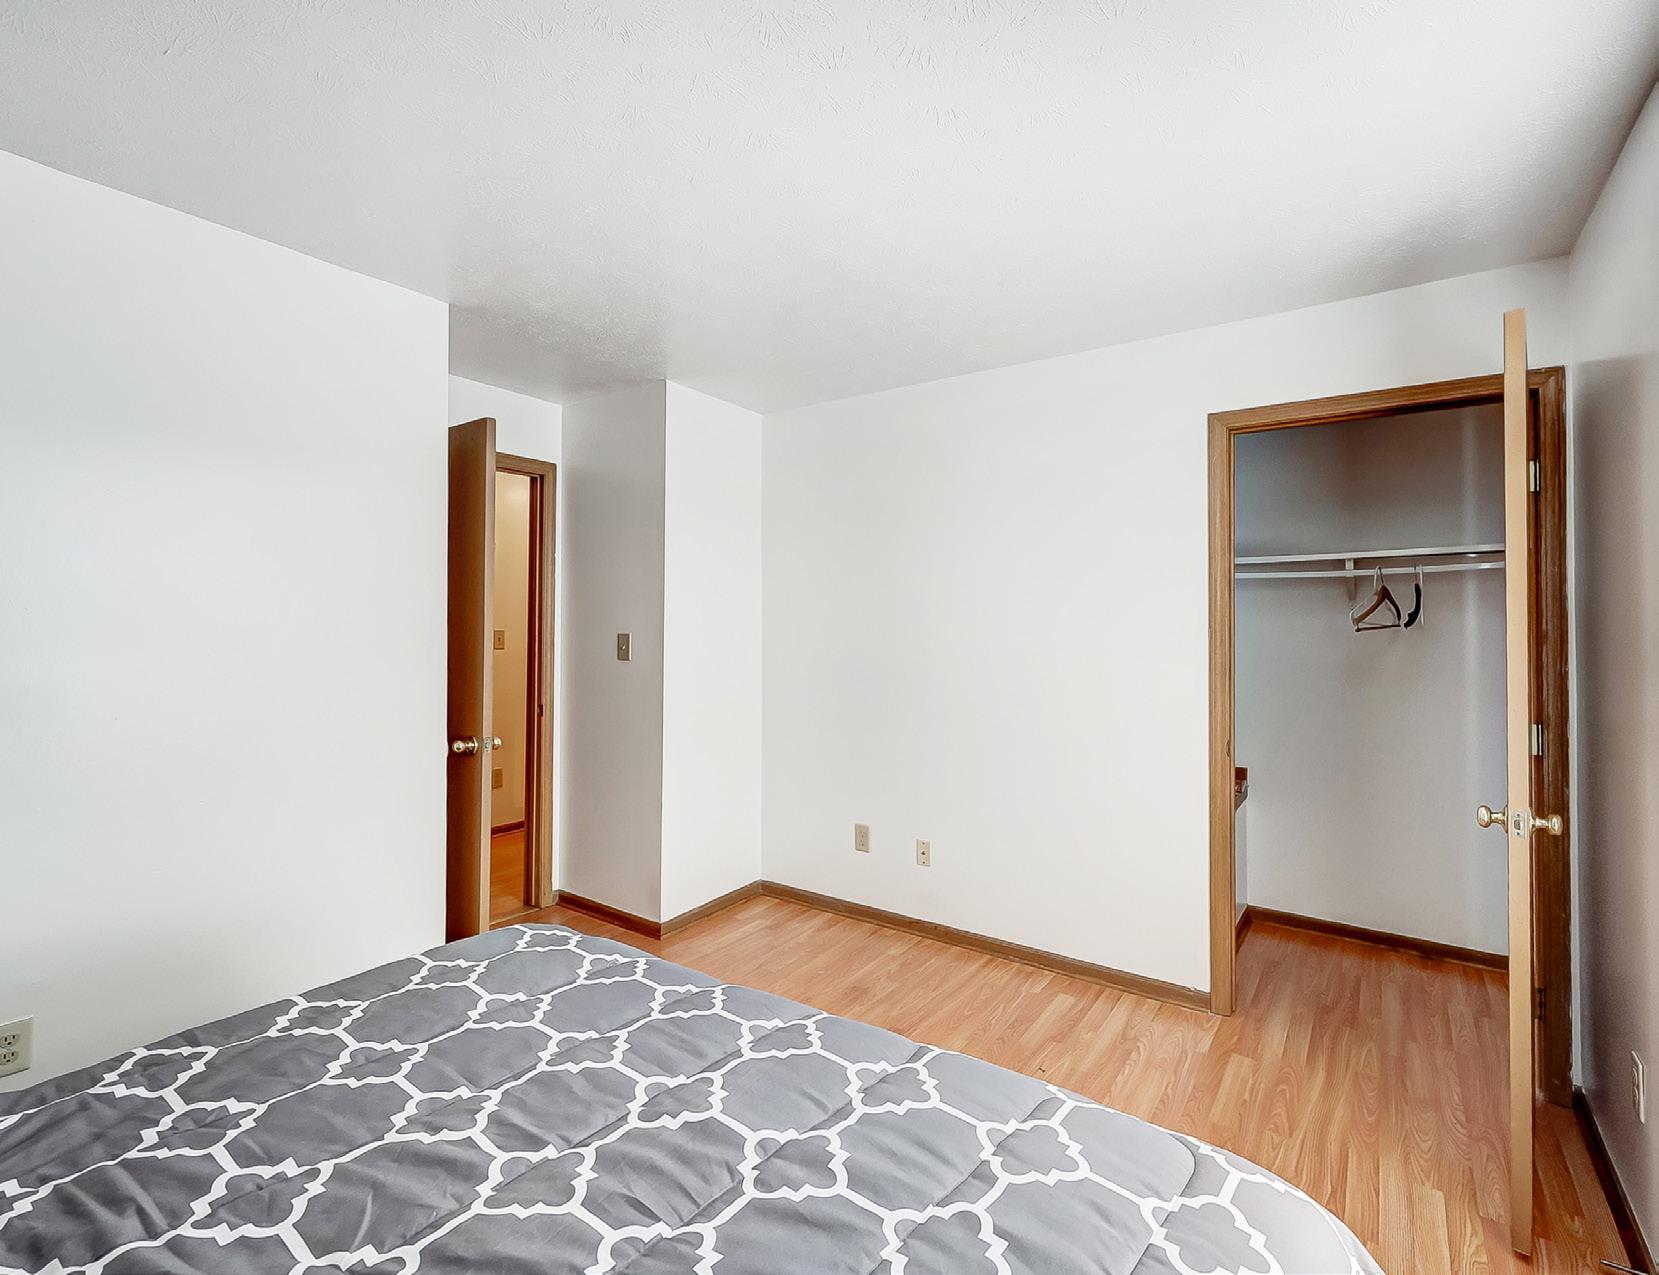

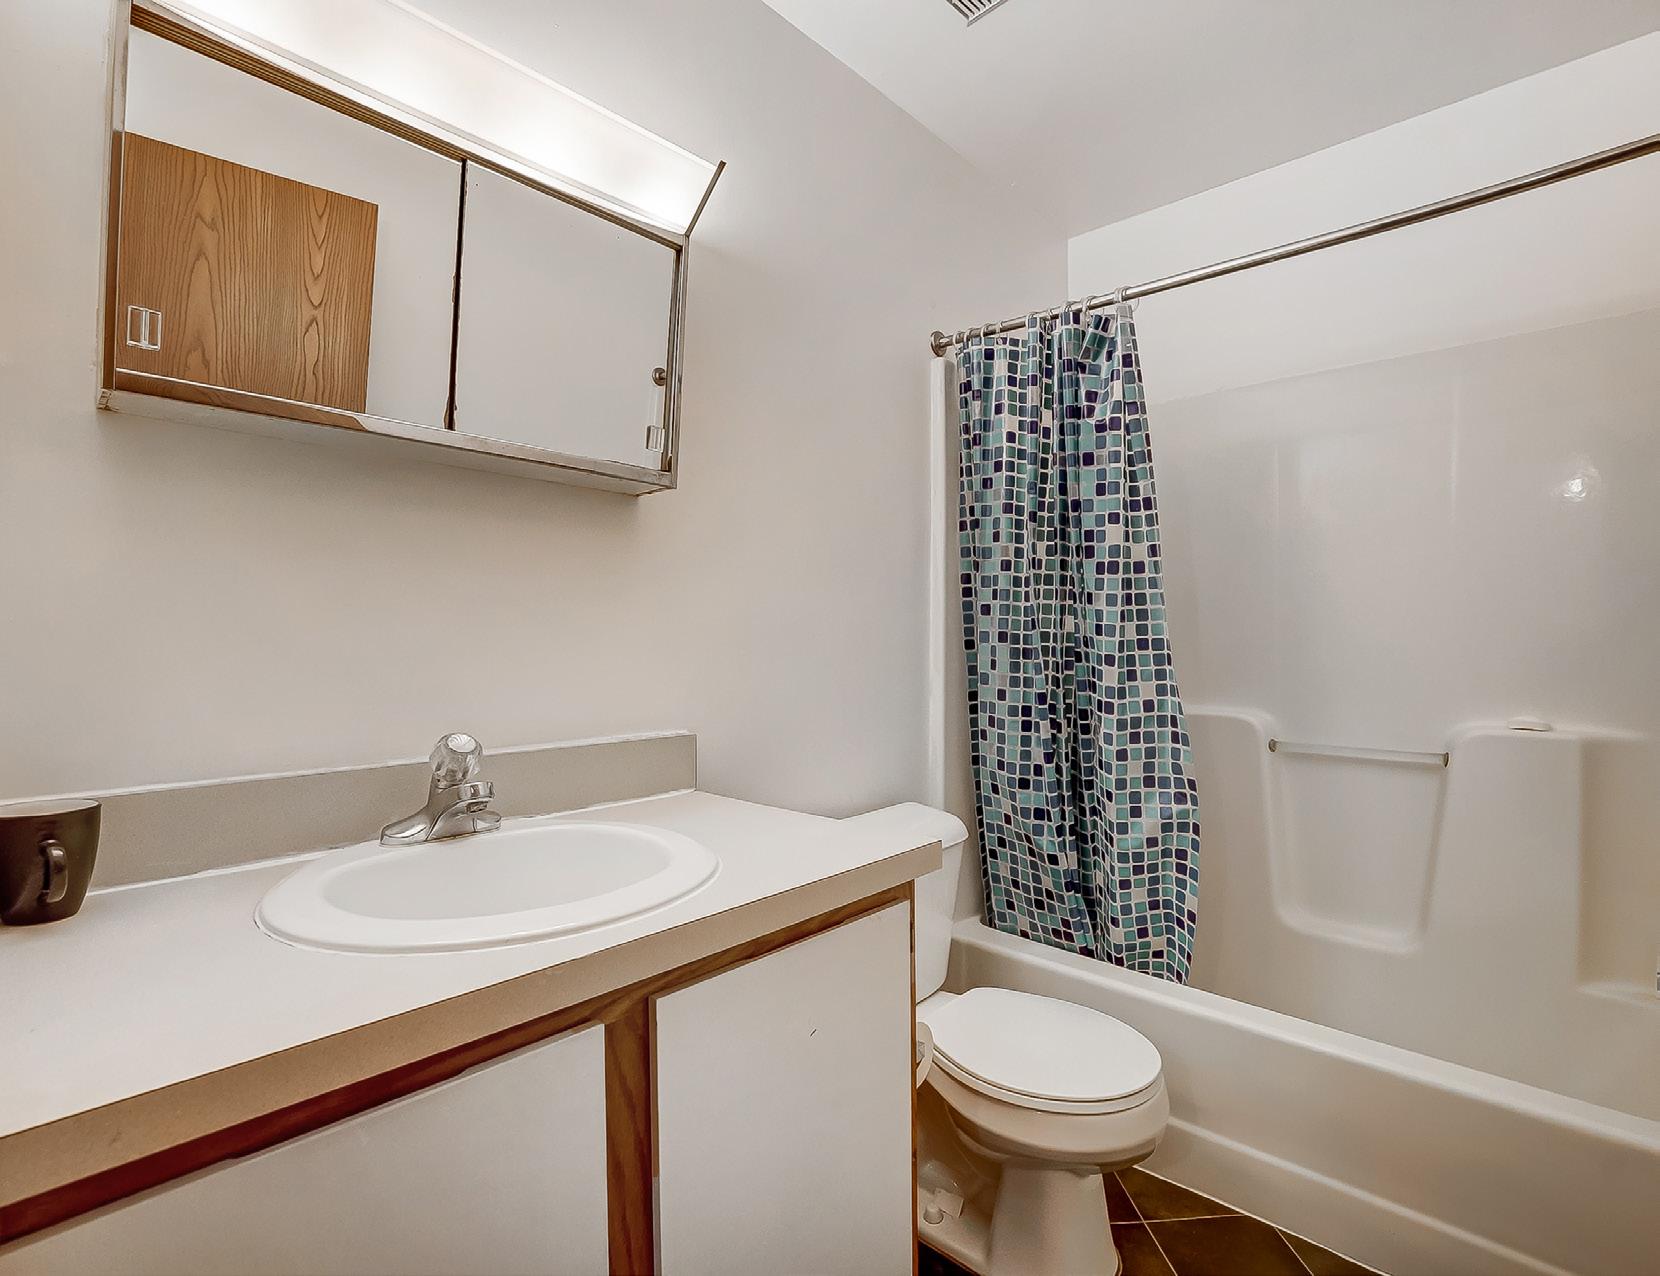
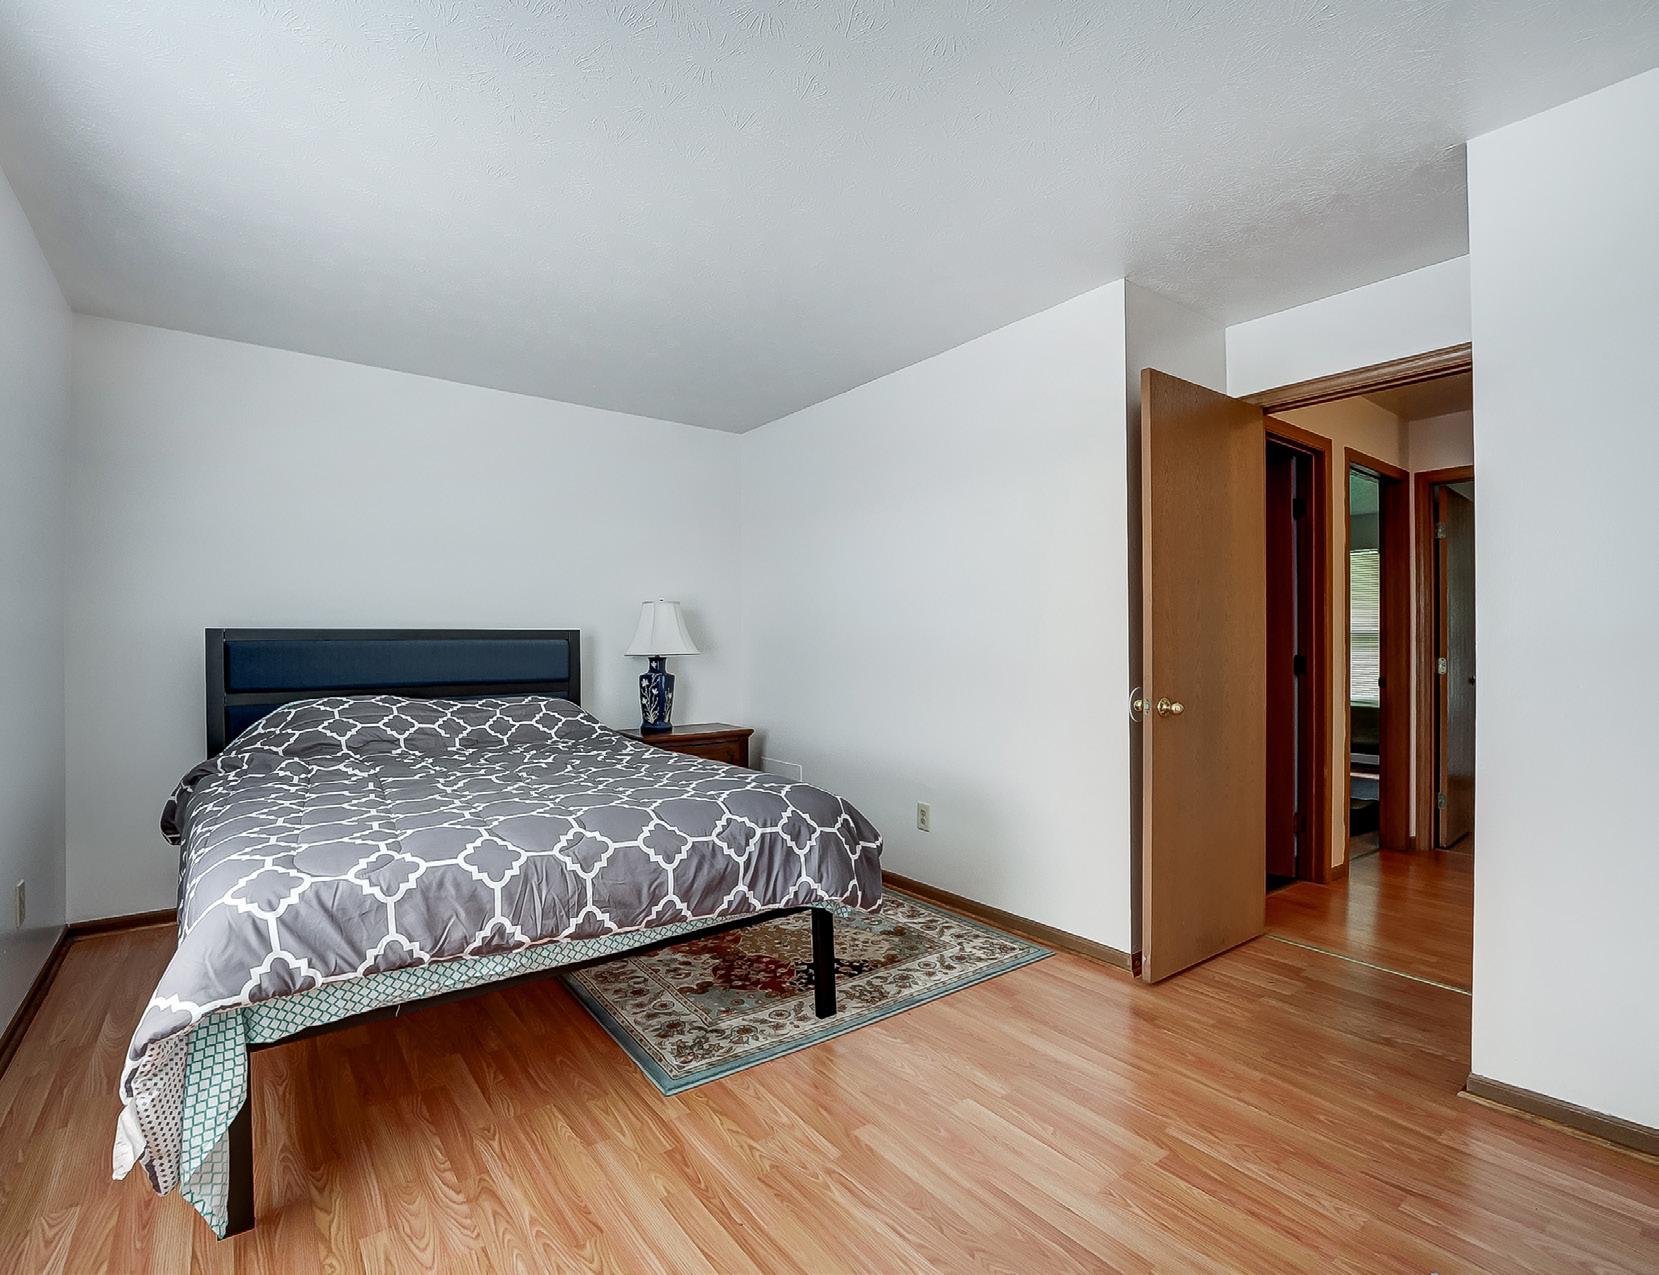
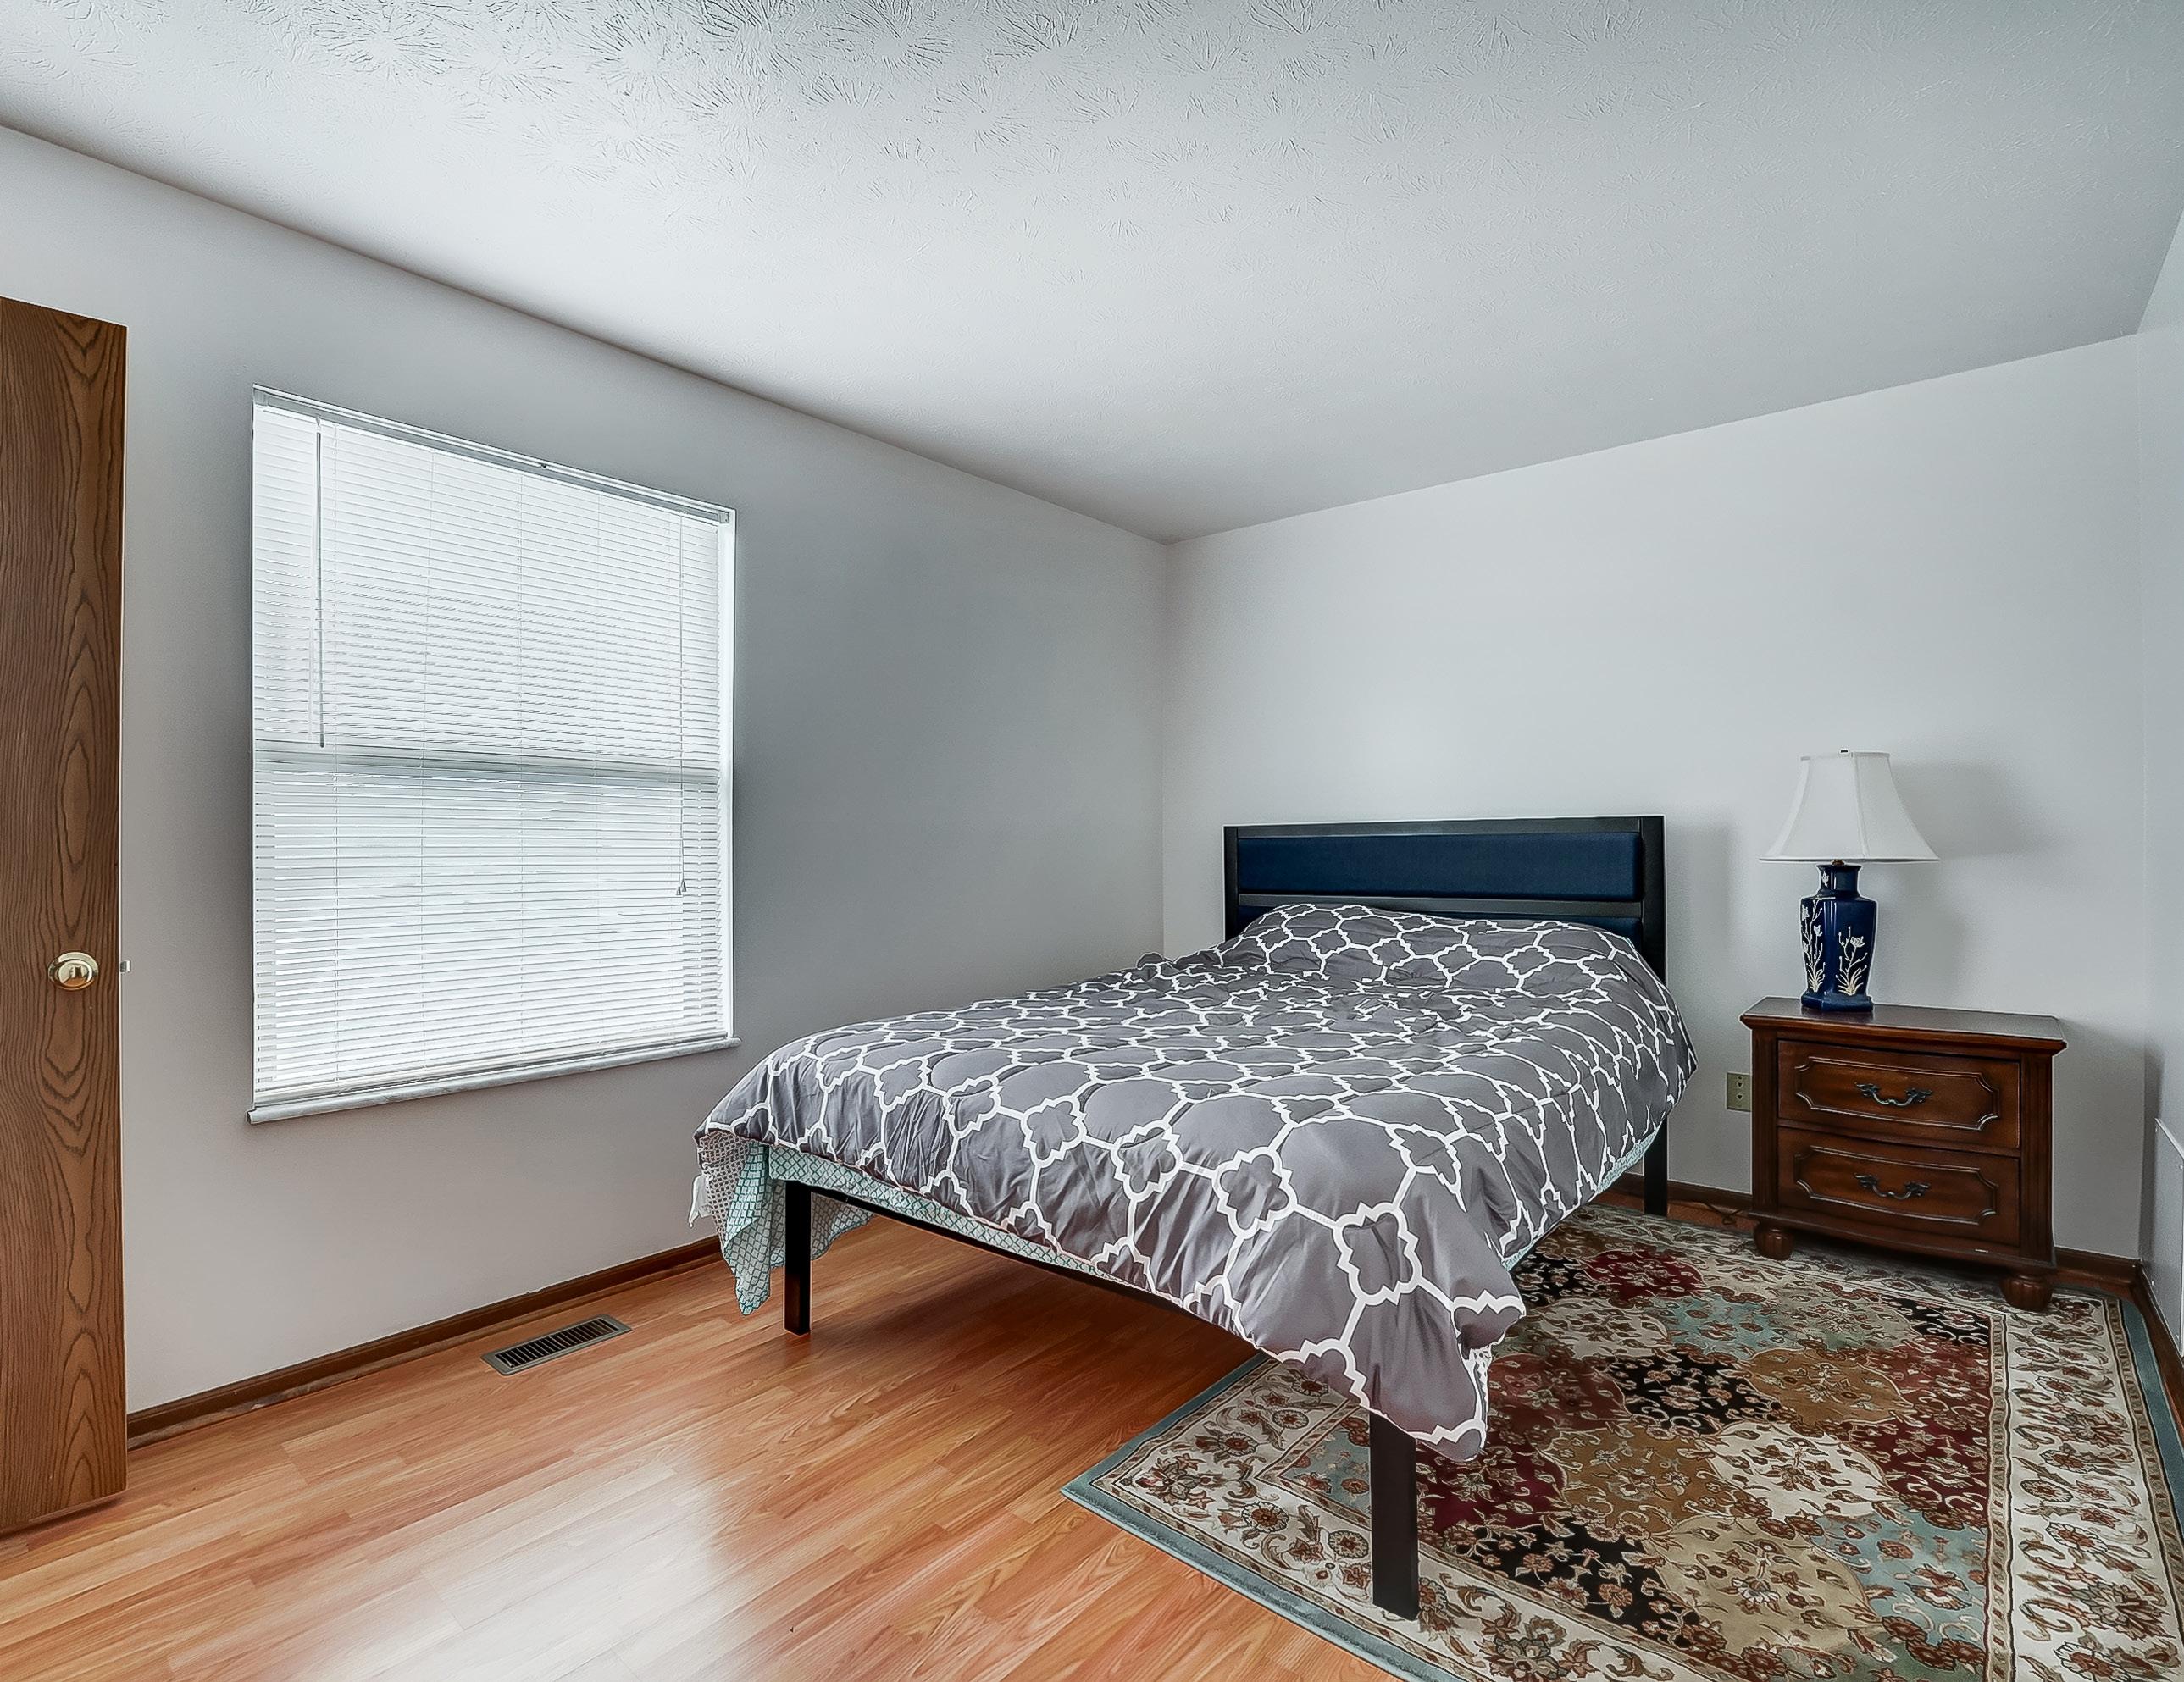
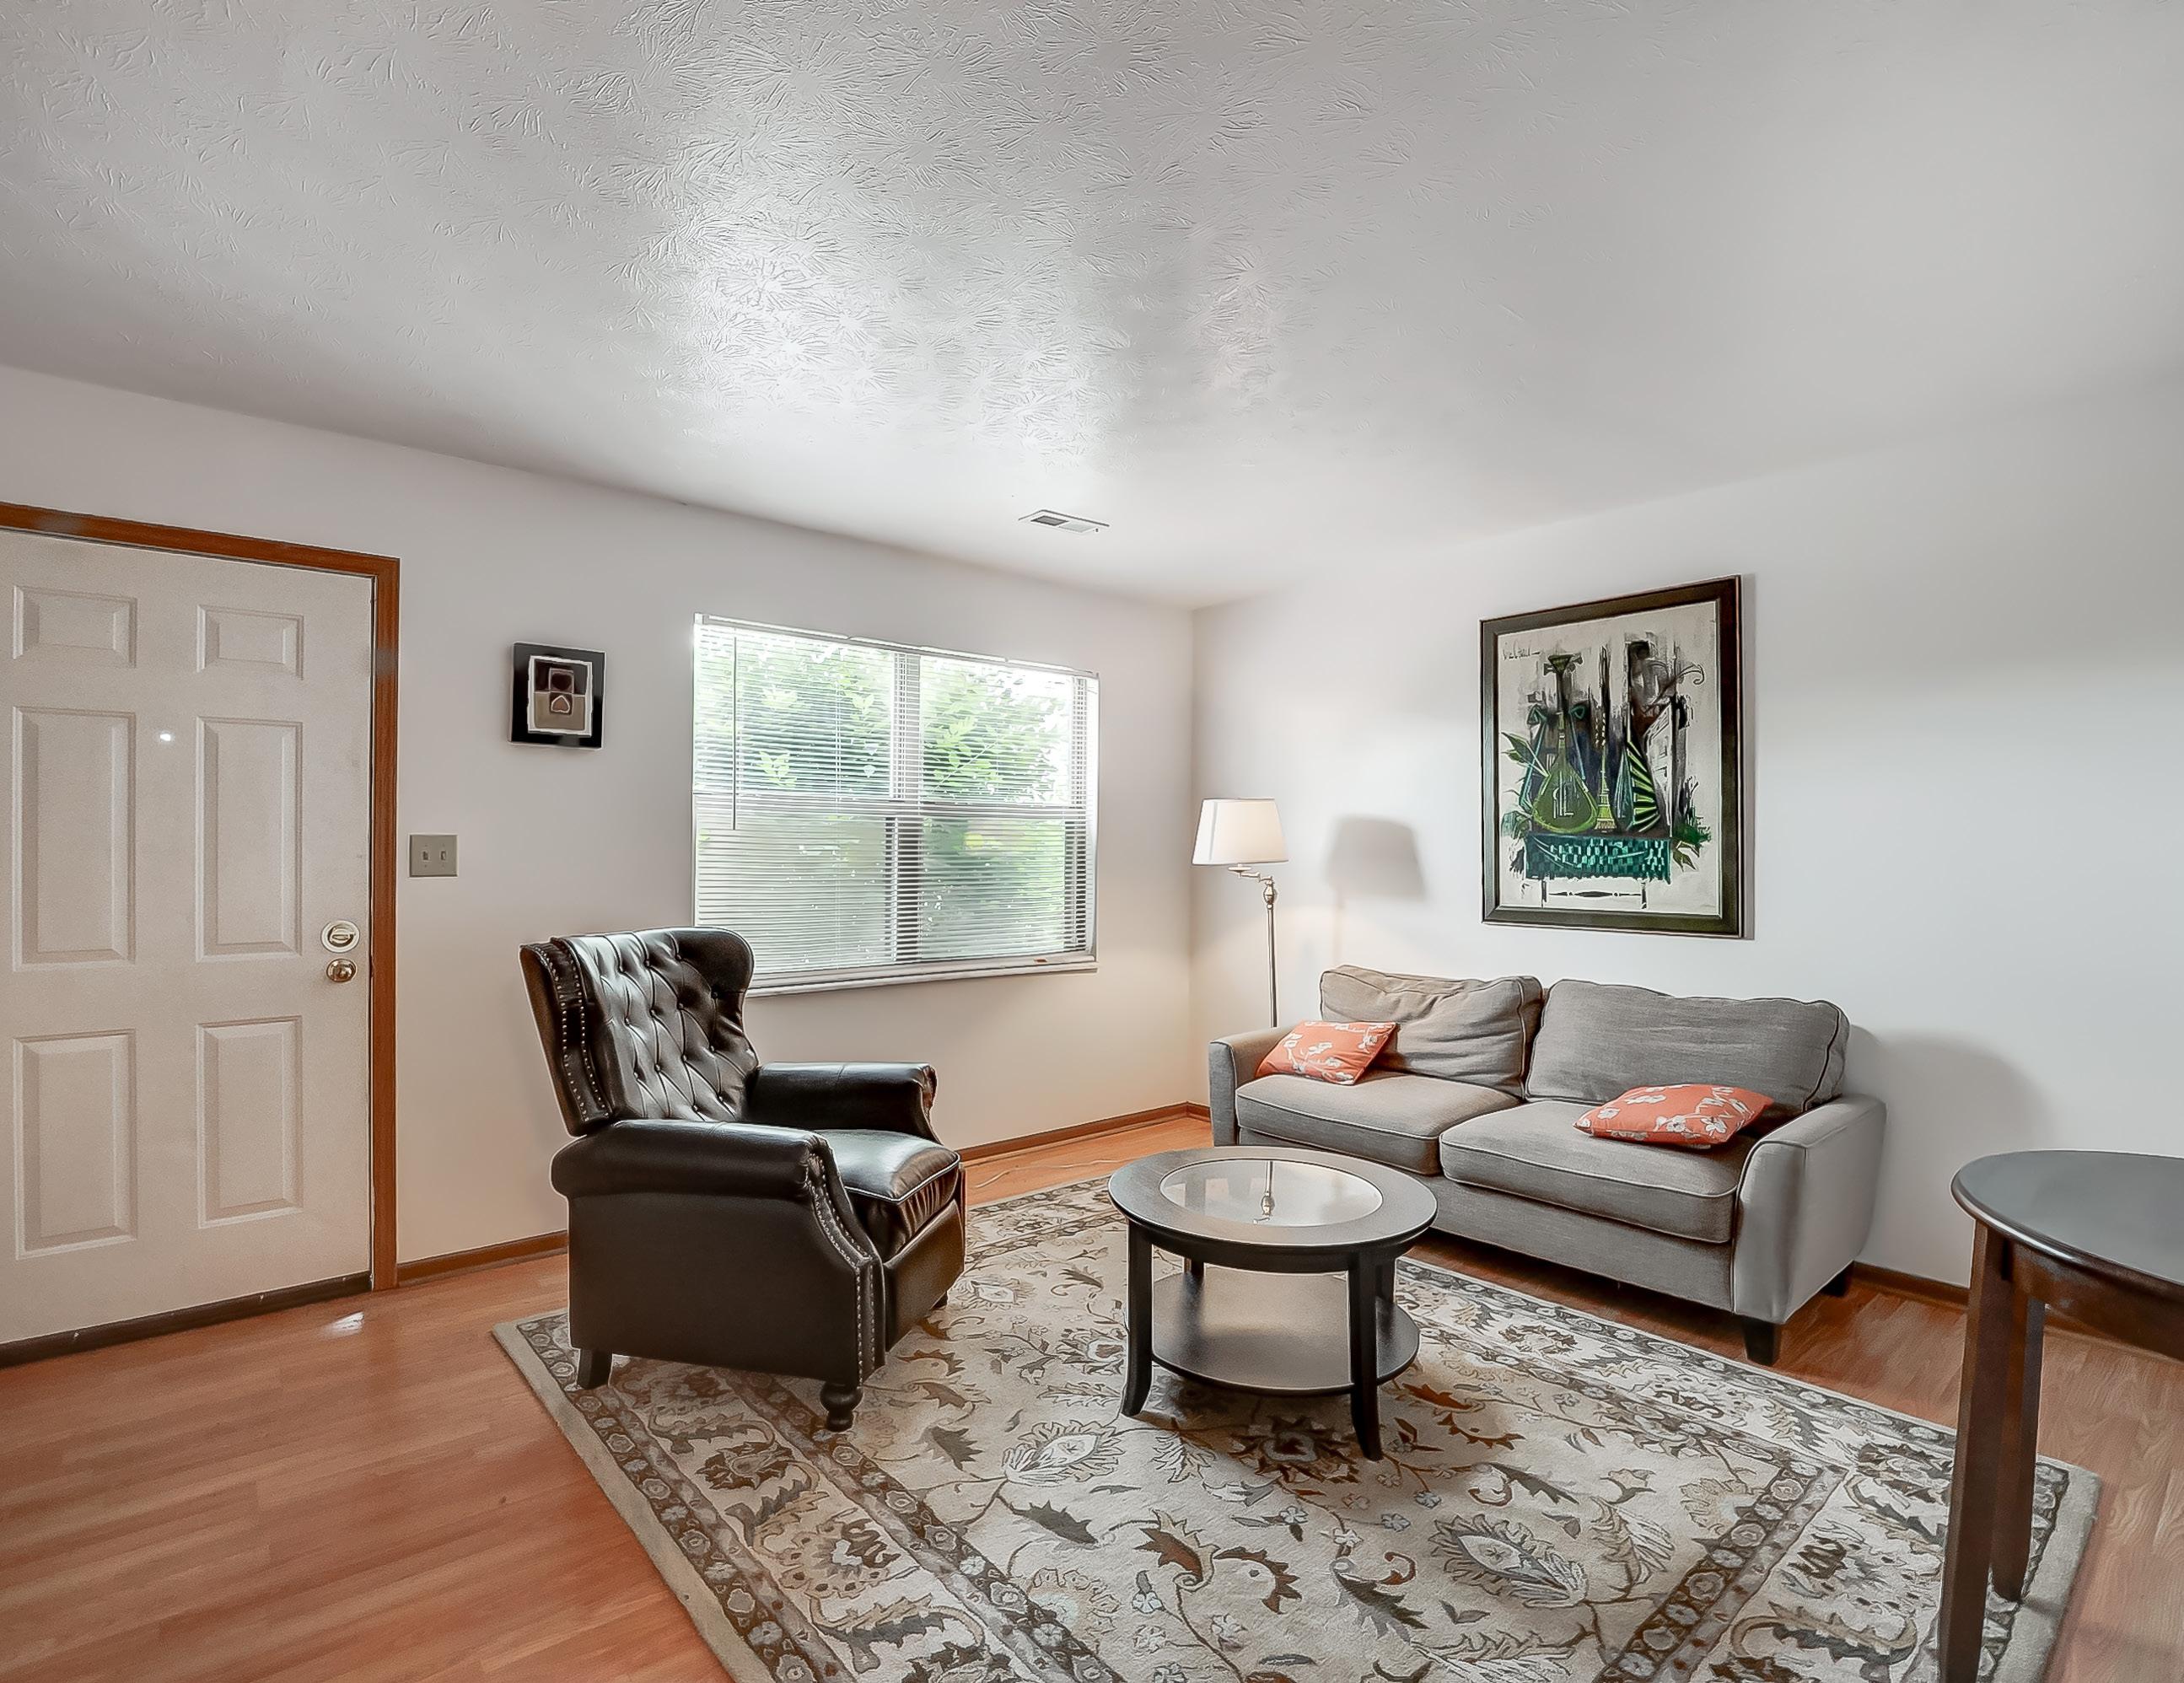
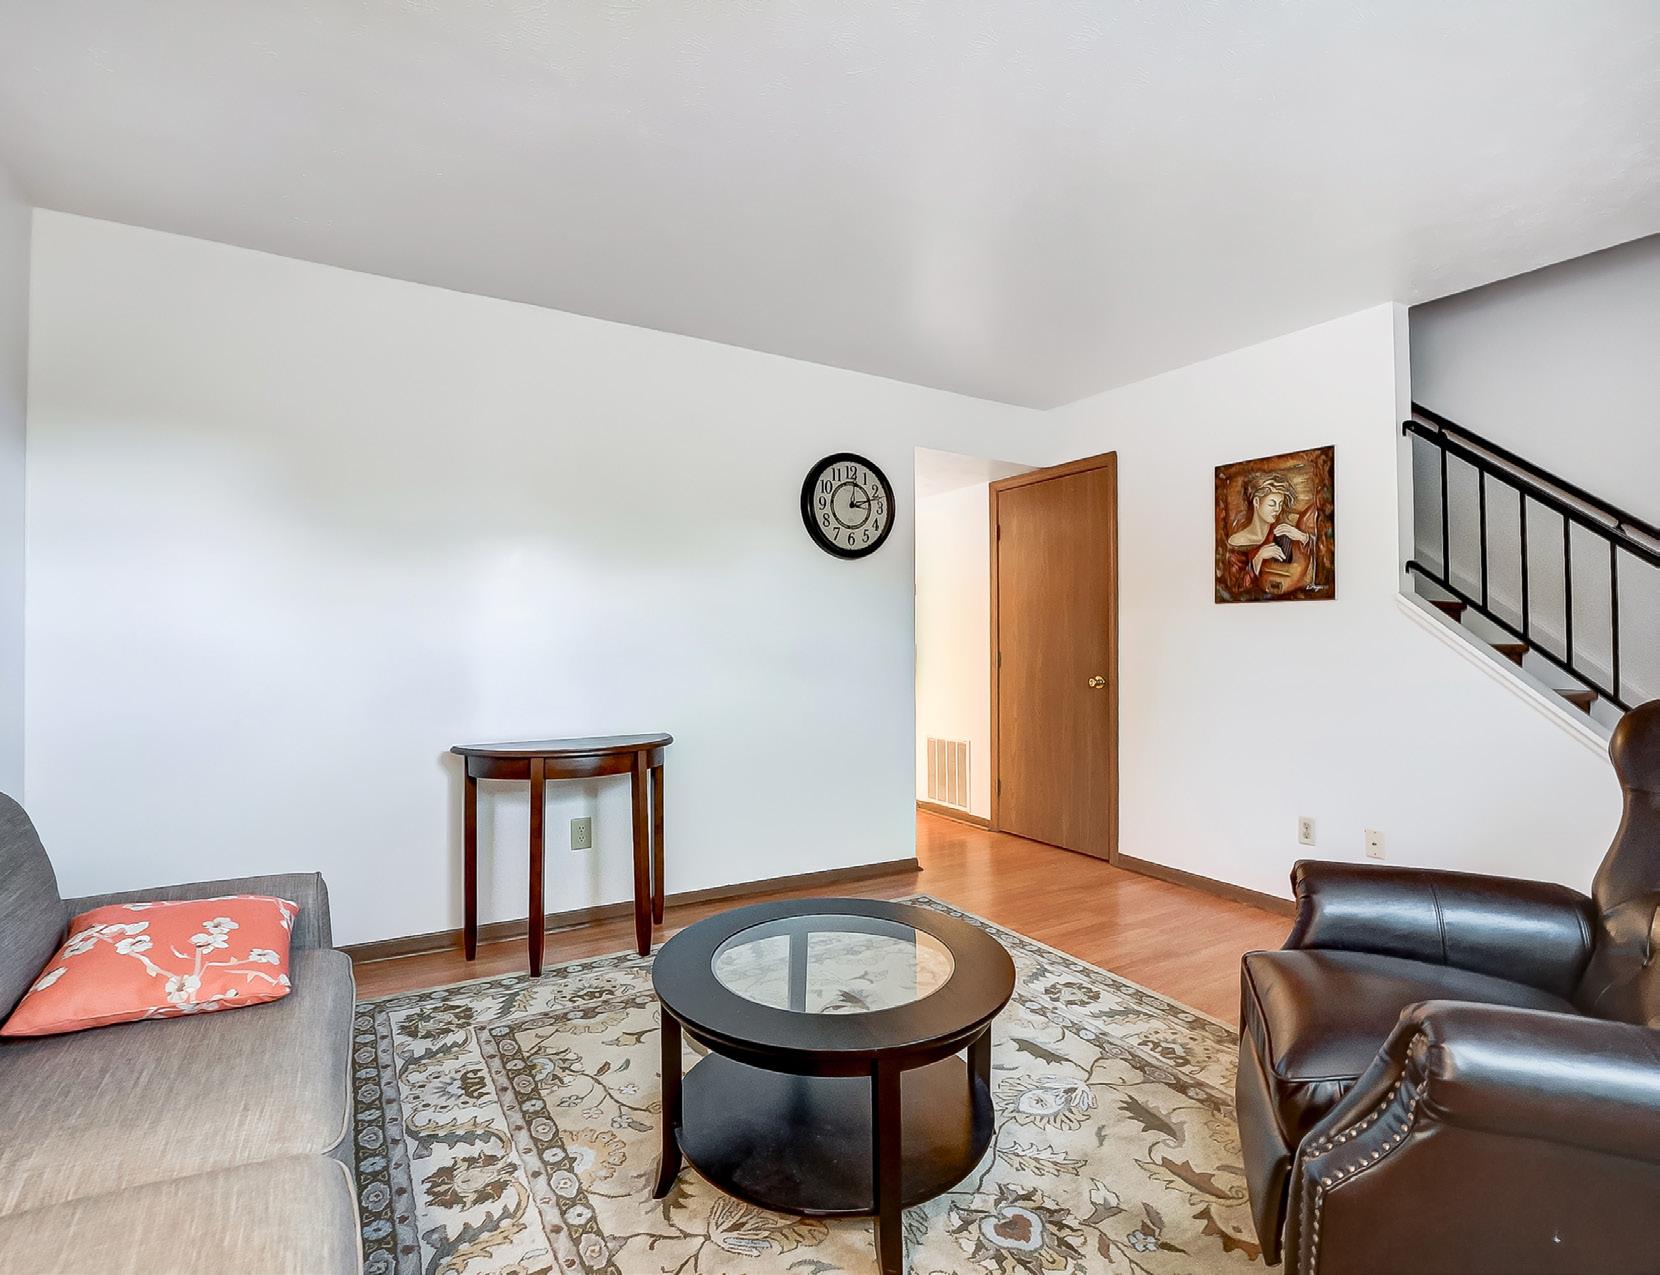
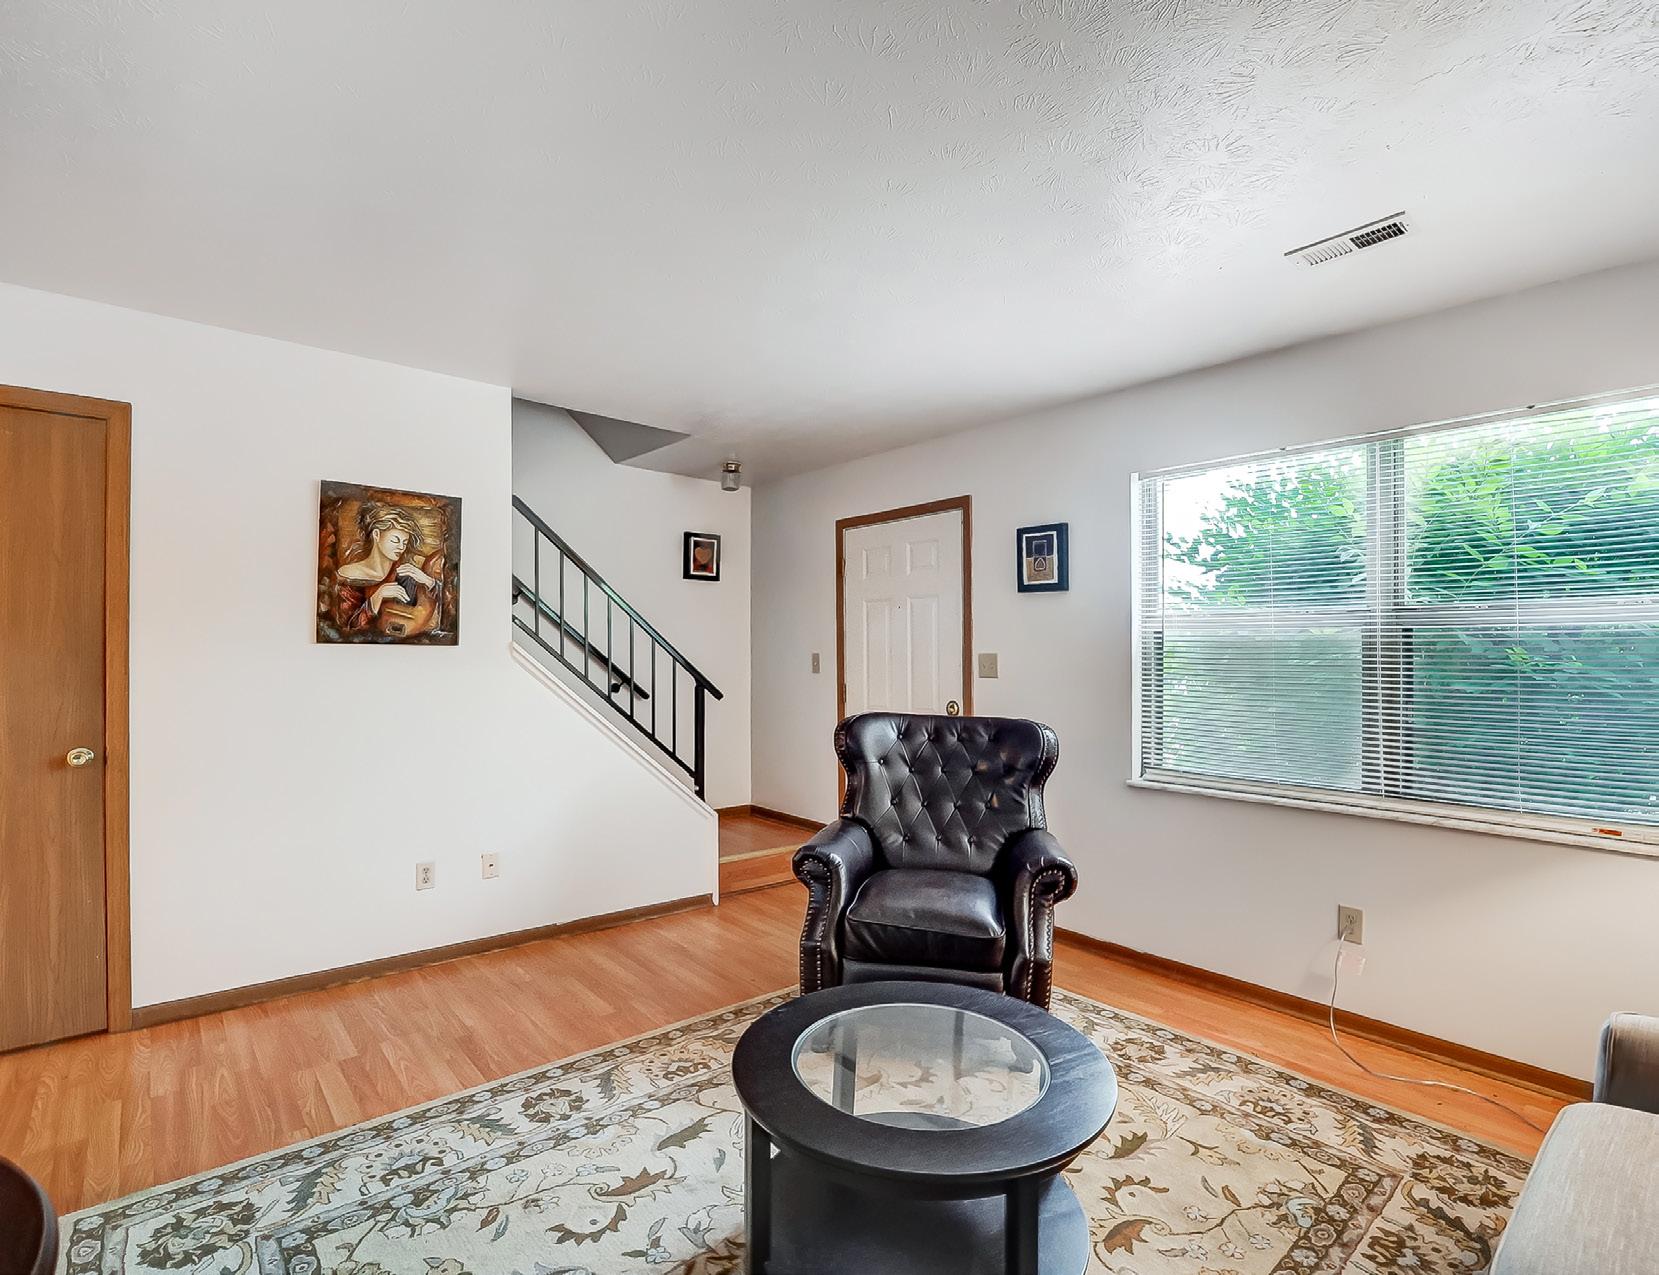
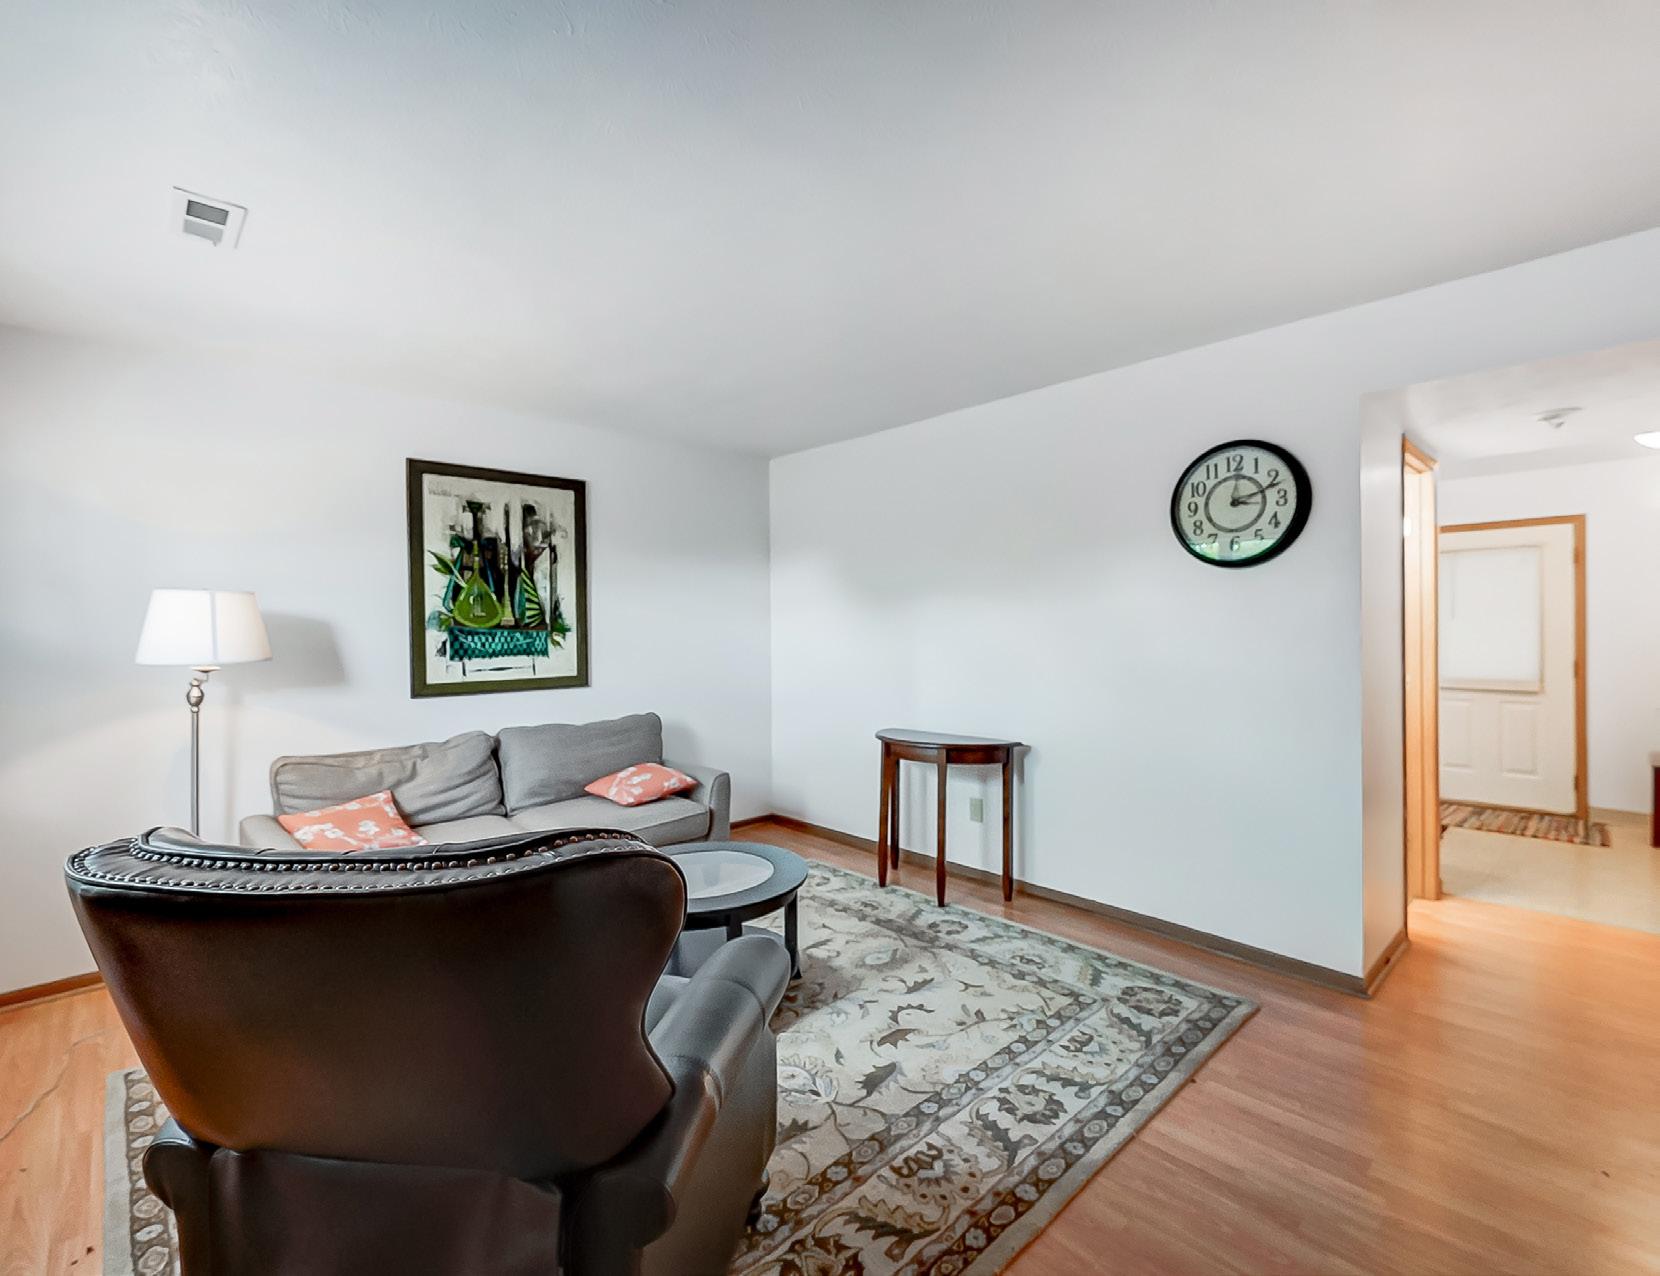
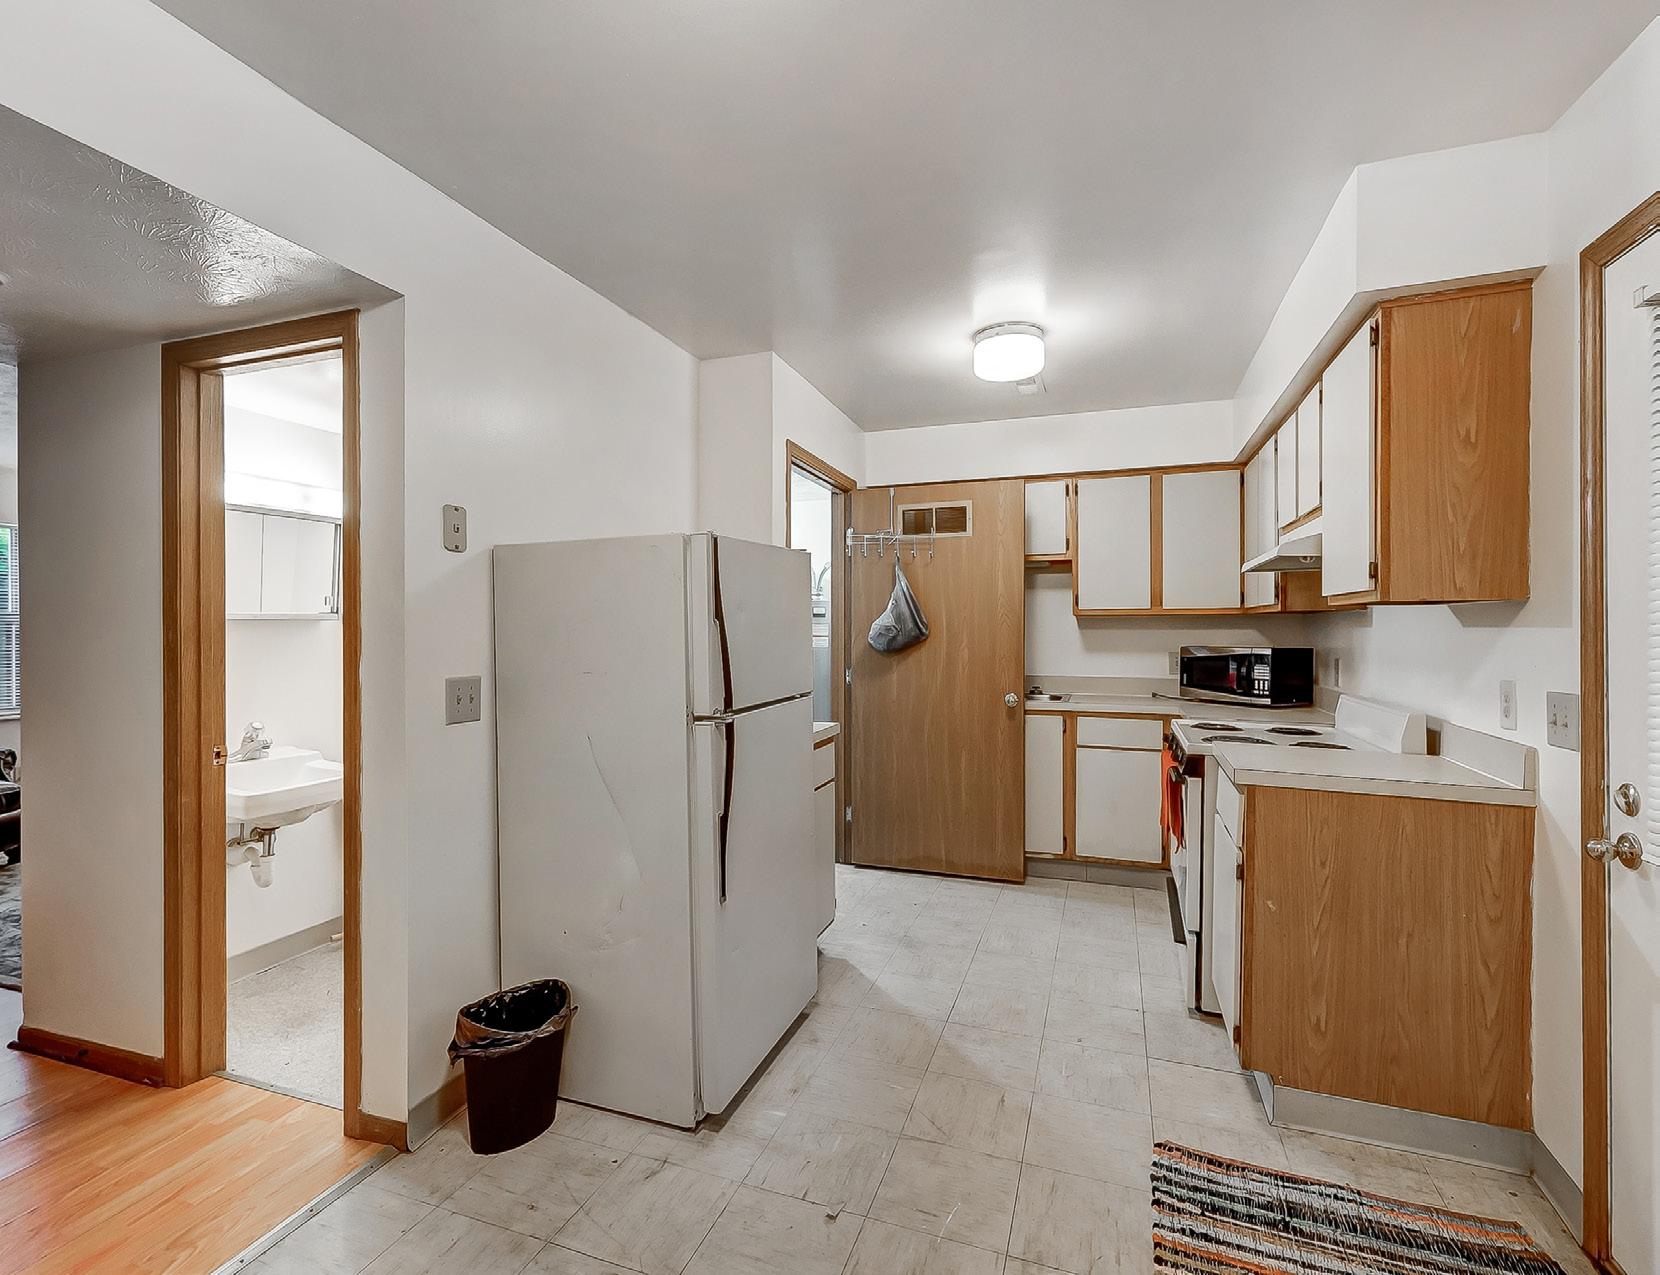
UNIT LAYOUTS
TWO BEDROOM ONE BATH TOWNHOUSE | 819 SQFT THREEBEDROOM ONE AND A

BATH
BEDROOM 2
10’ x 12.4’
KITCHEN/ DINING
8.8’ X 15.4’
BEDROOM 1
13’ x 11.5’
LIVING ROOM
15.4’ x 11’
x 12.4’
DINING
x 8.8’
LIVING ROOM 15.12’
17.4’
KITCHEN/
HALF TOWNHOME | 896 SQFT

BEDROOM 1
x 11.8’
TWOBEDROOM ONE BATH GARDEN | 650 SQFT
10’
12.6’
8.10‘
BEDROOM
10.3’
11.6’
14.1’ x 9.10’
13.8’ x 16.1’ DINNING ROOM 8.1’ x 6’
BATH BEDROOM 2
x 11.8’ BEDROOM 3
x 11’
3
x
BEDROOM 2
LIVING ROOM
KITCHEN BATHROOM CLOSET
MIDDLETOWN, OH
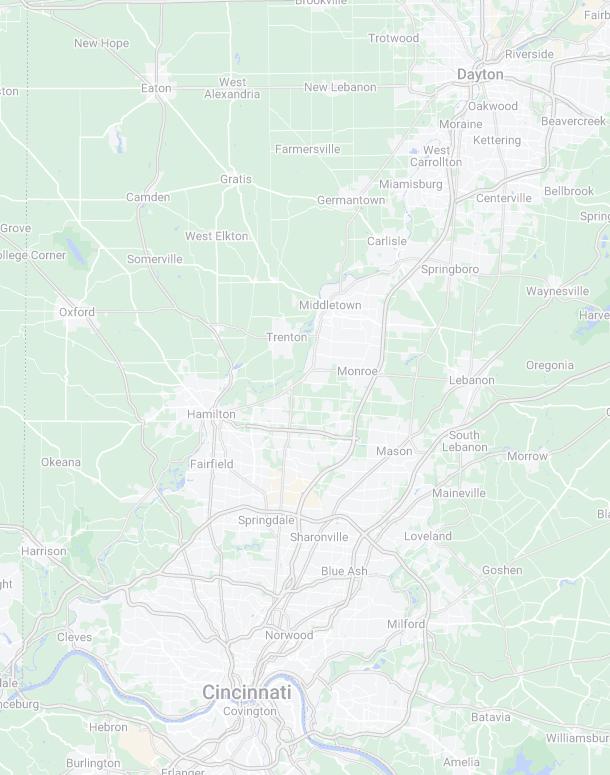
Middletown is a city located in Butler and Warren counties in the southwestern part of Ohio. The population as of the 2020 census was 50,987 and it is part of the Cincinnati metropolitan area, located 29 miles northeast of Cincinnati and 20 miles southwest of Dayton.

Formerly in Lemon, Turtlecreek, and Franklin townships, Middletown was incorporated by the Ohio General Assembly on February 11, 1833, and became a city in 1886. The city was the home of AK Steel Holding Corporation (formerly Armco), a major steel works founded in 1900. Although offices were moved to nearby West Chester Township in 2007, the AK Steel factory is still in Middletown. Middletown is also home to Hook Field Municipal Airport and a regional campus of Miami University is located in Middletown. In 1957, Middletown was designated as an All-America City. Middletown offers incoming investors a diversified economy conveniently located between Cincinnati and Dayton right off Interstate 75.
DOWNTOWN CINCINNATI
32
DOWNTOWN DAYTON MIDDLETOWN
MINS (26.1MI) 42 MINS (37.8MI)

EMPLOYERS IN THE NEWS
Cleveland-Cliffs Middletown Works
• $1.8 billion in upgrades that will add jobs and ensure the long term stability of its business
• $500 million in federal grants
• $1.3 billion in its own funds
• Will secure 2,500 jobs at this location
Kettering Health Middletown
• Nationally recognized for high-quality stroke care
Atrium Medical Center
• Middletown Atrium Hospital ranks among top 5 percent in nation
Cohen Recycling
• Cohen Recycling lays out plan for new Hamilton recycling facility
Middletown River Centre
• Signs Multiple businesses in $25M upgrade
Vasanth Tech
• Global engineering firms purchases 5 acres to expand operations
Employer Industry # of Employees Cleveland-Cliffs Manufacturing 2500 Carington Health Health Care 2000 Middletown City Schools Education 900 Atrium Medical Center Health Care 764 Cohen Recycling Environmental Services 375 Abilities First Foundation Education 360 Aeronca Manufacturing 350 City of Middletown Government 253 Akers Packaging Services Manufacturing 200
demographics


1 mile 3 mile
Population 1 Mile 3 Mile 5 Mile 2023 9,949 47,483 77,381 2028 10,173 5,1377 88,040 Population Growth 2010-2023 0.7 0.5 0.8 Projected Population Growth 2023-2028 0.5 0.4 0.6 2023 Average Age 37.7 39.5 39.3 Owner Occupied Households 1,994 11,948 22,206 Renter Occupied Households 2,427 93,27 12,758

RENTAL RATES YR-OVER-YR ROLLING CHANGE VS CINCINNATI MARKET

QUARTERLY YR-OVER-YR ROLLING CHANGE BY UNIT TYPE
5 mile
MIDDLETOWN/FRANKLIN SUBMARKET
APT. AGE BY UNITS
2022 2023 2024 UNIT TYPE # UNITS SQFT/UNIT Q2 Q3 Q4 Q1 Q2 Q3 Q4 Q1 ONE BED 1,377 580 13.2% 12.7% 11.9% 9.1% 7.8% 8.8% 6.7% 8.0% *TWO BED* 2,393 813 10.4% 10.3% 9.7% 7.5% 7.7% 7.2% 7.9% 9.9% THREE BED 483 1,070 9.1% 5.0% 7.2% 6.6% 8.1% 7.7% 5.3% 6.9% OTHER 264 685 4.4% 3.9% 2.0% -0.3% 2.2% 1.7% 3.4% 11.4% OVERALL 4,517 787 11.0% 10.3% 10.0% 7.9% 8.0% 7.9% 7.6% 9.3% Age (Years)
$995 Avg
24’
*LESS
*9.9 y-o-y change for 2 bedrooms* SOURCE: yardi April 2024 report
5th Rank out of 43 Submarkets 8.6% Y-o-Y Change
Rental Rate
MULTIFAMILY statistics
THAN 25% BUILT IN THE LAST 20 YEARS*

Regional employers

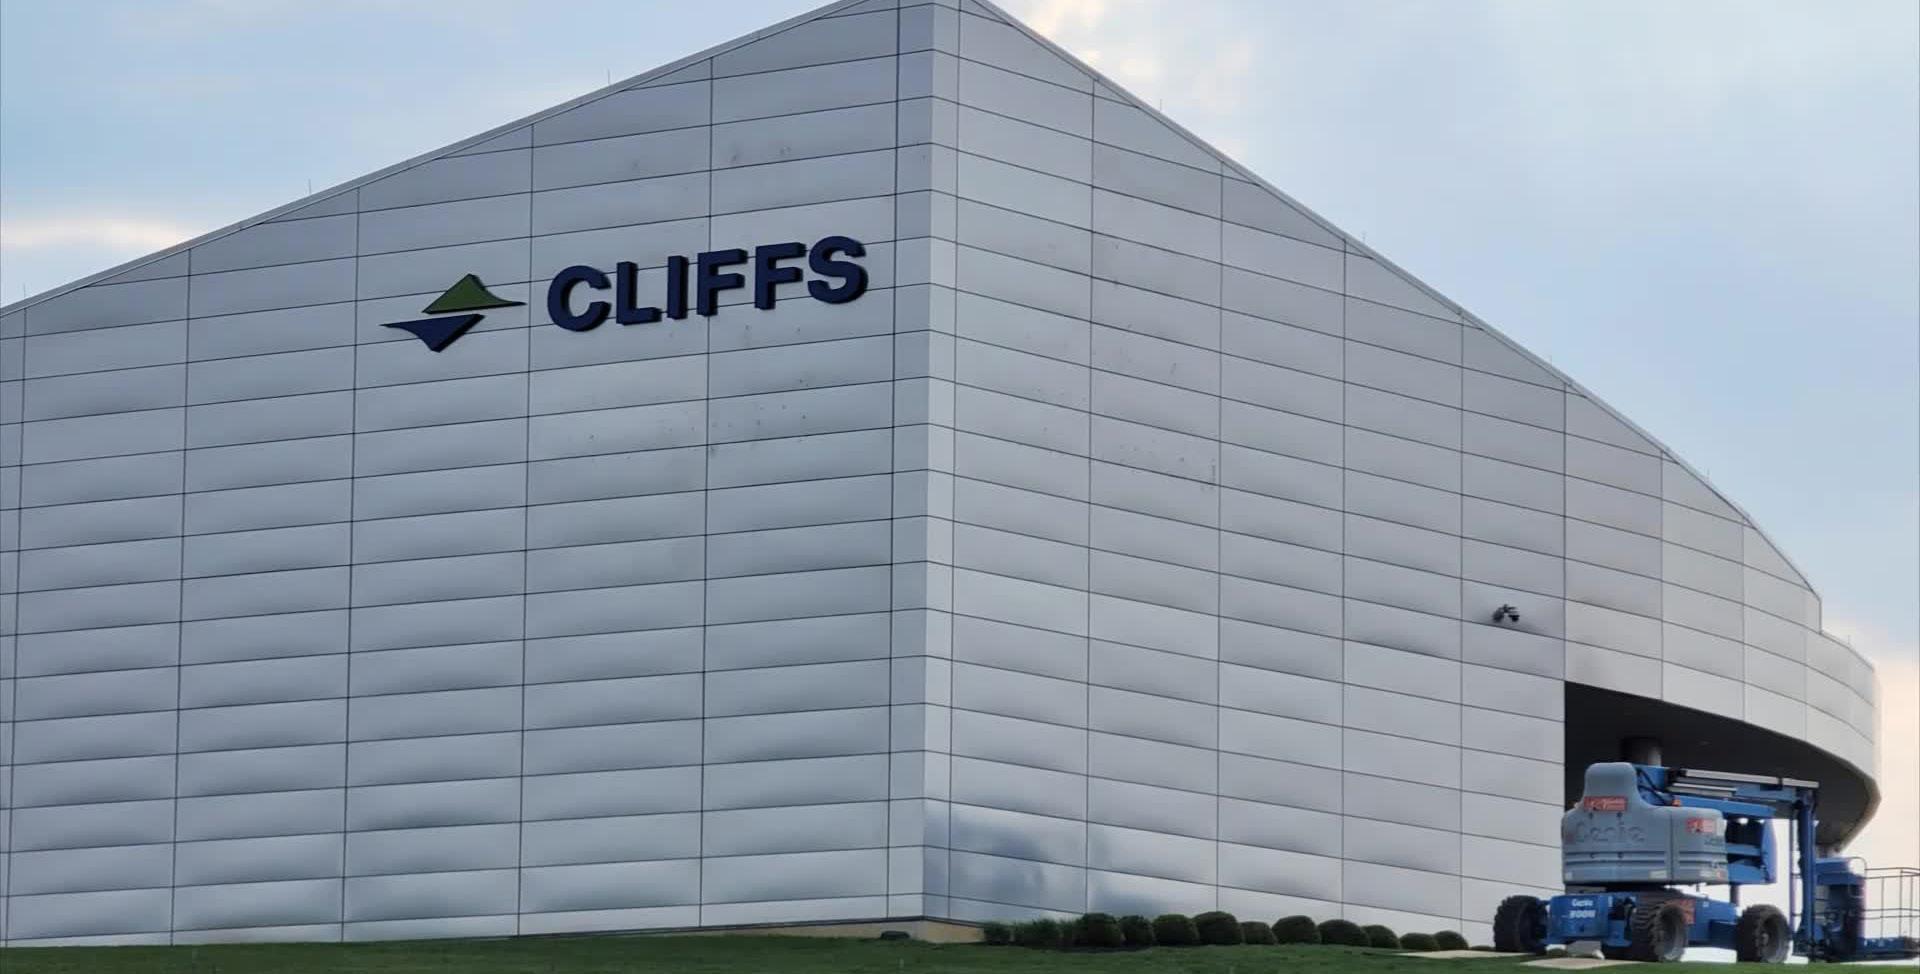
Cleveland-Cliffs is the largest flat-rolled steel producer in North America. We are vertically integrated from mined raw materials, direct reduced iron, and ferrous scrap to primary steelmaking and downstream finishing, stamping, tooling, and tubing. The Company serves a diverse range of markets due to its comprehensive offering of flat-rolled steel products and is the largest supplier of steel to the automotive industry in North America-headquartered in Cleveland, Ohio.
• 27,000+ employees
• 46 operating facilities, including 3 sites around Middletown, Ohio (Middletown Works, Research and Innovation Center, West Chester Regional Office)
• Middletown Works is an integrated steel operation with carbon steel melting, casting, hot-and cold-rolling and finishing operations
• Innovators of specialty grades of steel
• Sustainable business model focused on the best environmental, social and governance (ESG) practices and production of clean steel

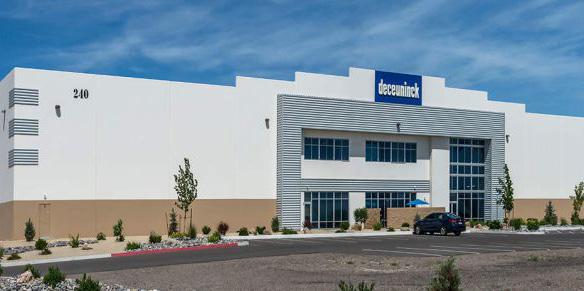
Deceuninck North America (part of the global Deceuninck Group) is a fully integrated design and PVC extrusion company that produces energy efficient PVC window and door systems. With over 500 employees, the Monroe location includes the North American headquarters, together with manufacturing, tooling and engineering functions.
• More than 1 million sq. ft. of combined production & warehouse facilities
• Over 500 employees in USA. 3,700+ worldwide
• 6 million+ windows built annually in the US by Deceuninck customers
• Innovators of specialty grades of steel
• 15 manufacturing locations worldwide, including Monroe, OH and Fernley, NV
• Winner Best Workplaces in Ohio 2019, 2020 & 2021


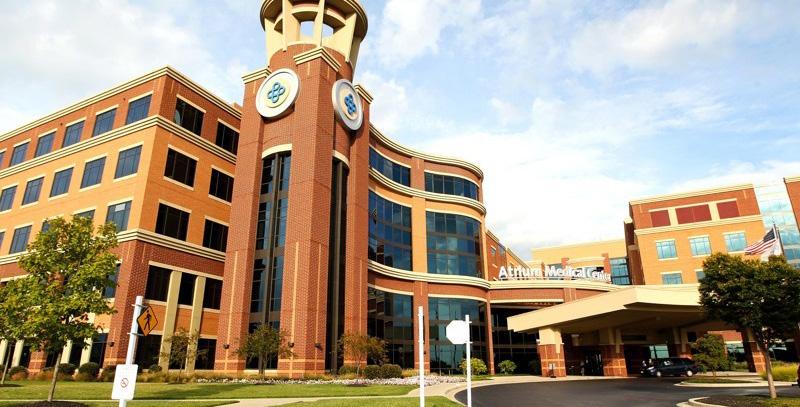
Atrium Medical Center has served Southwest Ohio from its Middletown campus since 1917. We are Warren County’s only Level III Trauma Center and Primary Stroke Center, providing immediate assessment and care for seriously injured or ill patients, and the only accredited Chest Pain Center in Warren County. We offer maternity, cancer, orthopedics, heart care, and much more as part of Premier Health. Leading national organizations regularly recognize Atrium’s quality care, including:
• “High Performing” in Heart Attack, Stroke, and Maternity Care (Uncomplicated Pregnancy) by U.S. News & World Report (2023)
• Two consecutive “A” safety grades by The Leapfrog Group (2023)
• Top 50 rehabilitation hospitals in the nation (2022-23) by U.S. News & World Report
• Women’s Center with comprehensive breast cancer services
• Surgical services, including minimally invasive, robotic options
• Accredited Level 3 Senior Emergency Center from the American College of Emergency Physicians - first hospital in the Cincinnati area to achieve the honor
• Family Birth Center with Level II special care nursery and Natural Beginnings - Cincinnati’s only natural birth center

regional employers

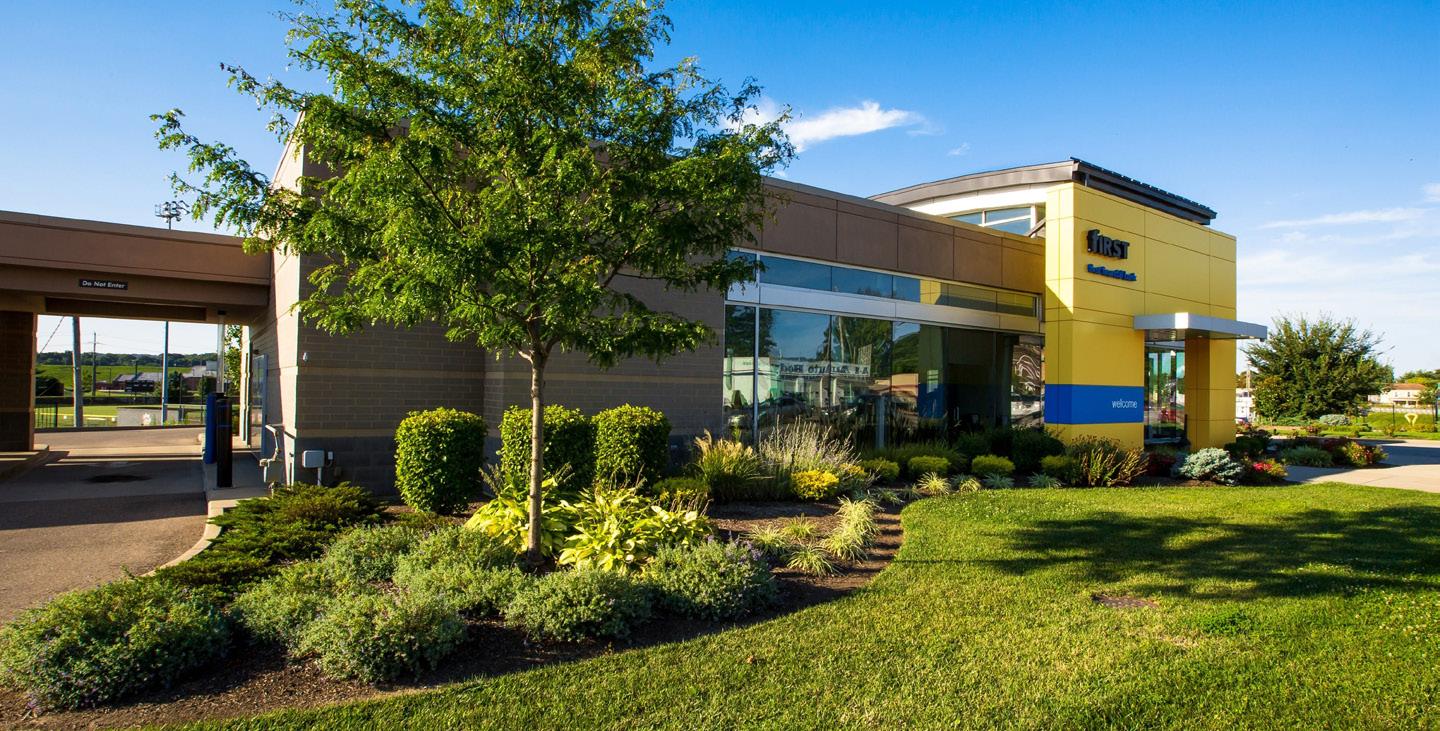
First Financial Bancorp, is a Cincinnati, Ohio based bank holding company. As of September 30, 2021, the Company had $16.0 billion in assets, $9.4 billion in loans, $12.7 billion in deposits and $2.2 billion in first financial bank shareholders’ equity. The Company’s subsidiary, First Financial Bank, founded in 1863, provides banking and financial services products through its six lines of business: Commercial, Retail Banking, Investment Commercial Real Estate, Mortgage Banking, Commercial Finance and Wealth Management. These business units provide traditional banking services to business and retail clients. Wealth Management provides wealth planning, portfolio management, trust and estate, brokerage and retirement plan services and had approximately $3.2 billion in assets under management as of September 30, 2021. The Company operated 139 full-service banking centers as of September 30, 2021, primarily in Ohio, Indiana, Kentucky and Illinois, while the Commercial Finance business lends into targeted industry verticals on a nationwide basis.

The Molson Coors Trenton, OH Brewery, which opened in 1991, is one of the company’s most modern breweries. Located between Cincinnati and Dayton, the brewery produces such brands as Miller Lite, Coors Light, Miller High Life.
• 1,056 acres, capacity to brew 11 million barrels of beer a year
• 494 employees; 399 technicians and 95 salaried
• Brewery locations in Milwaukee, WI; Albany, GA; Elkton, VA; Fort Worth, TX; Golden, CO
• Produced 2 million cans of water for humanitarian disasters
• Landfill free since 2009
• Healthy Worksite Award 2013-2020
• 2016 Duke Energy Power Partner
• 2017 Ohio EPA Gold Encouraging Environmental Excellence Award
• Healthy Worksite Platinum Award 2022
• Cancer Screen Excellence Award 2023

As a faith-based, nonprofit health system, Kettering Health strives to improve the lives of people in our communities through healthcare and education. Kettering Health is made up of 15 medical centers and more than 120 outpatient locations throughout western Ohio, as well as Kettering Health Medical Group- with more than 700 board-certified providers dedicated to elevating the health, healing, and hope of the community. Kettering College, a division of Kettering Health Main Campus, is a fully accredited college that specializes in health science education. Kettering Health opened its Middletown location in 2018, providing comprehensive care that is centered around the whole patient-mind, body, and spirit. Services include:
• 24/7 emergency care with MRI, CT, X-ray, ultrasound, and cardiac testing
• Behavioral health services
• Brain and spine care
• Heart and vascular care
• General surgery
• Orthopedic care

• Primary care
• Women’s health services
• Urology care
• 3D mammography with SensorySuite technology
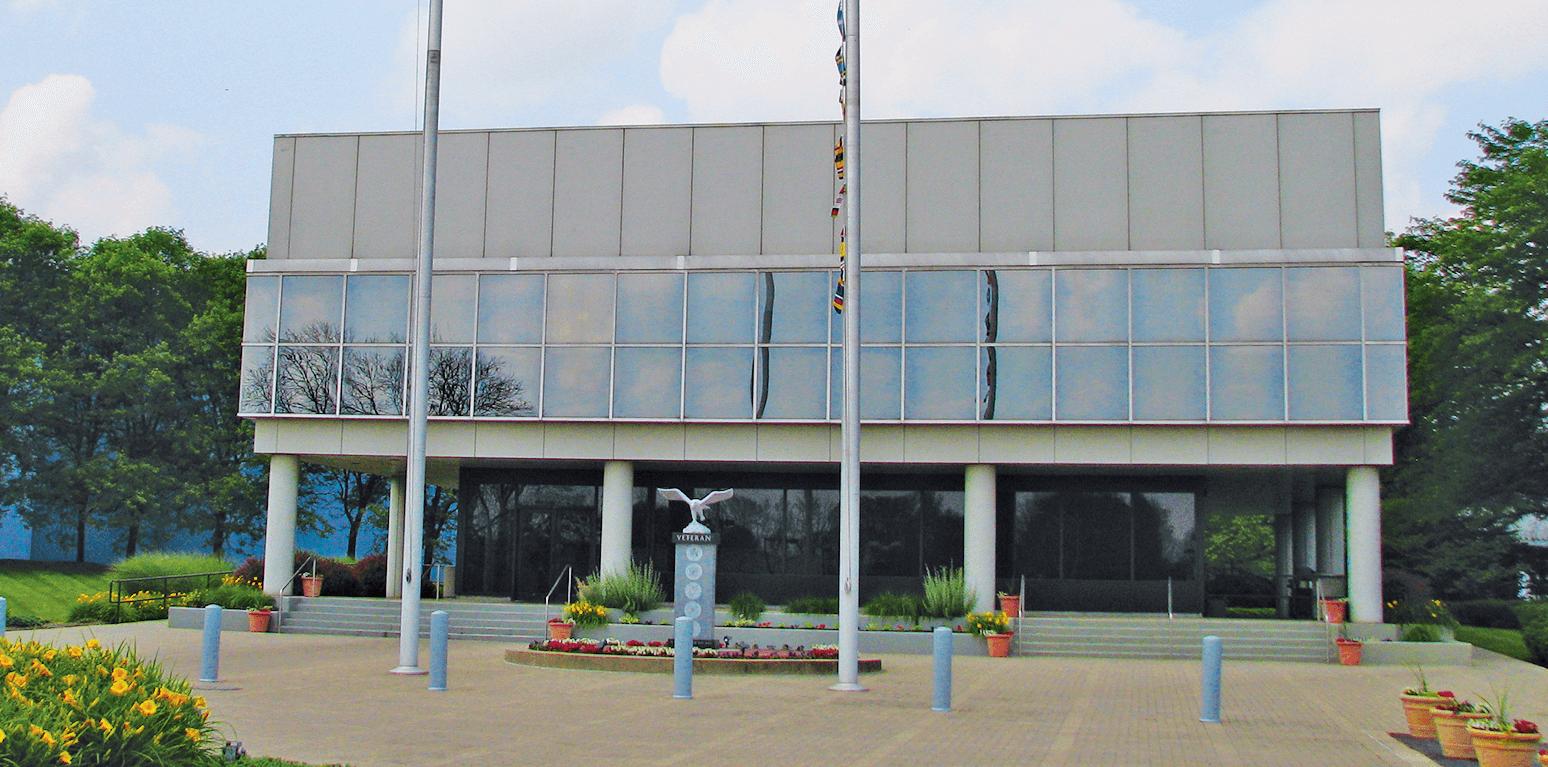
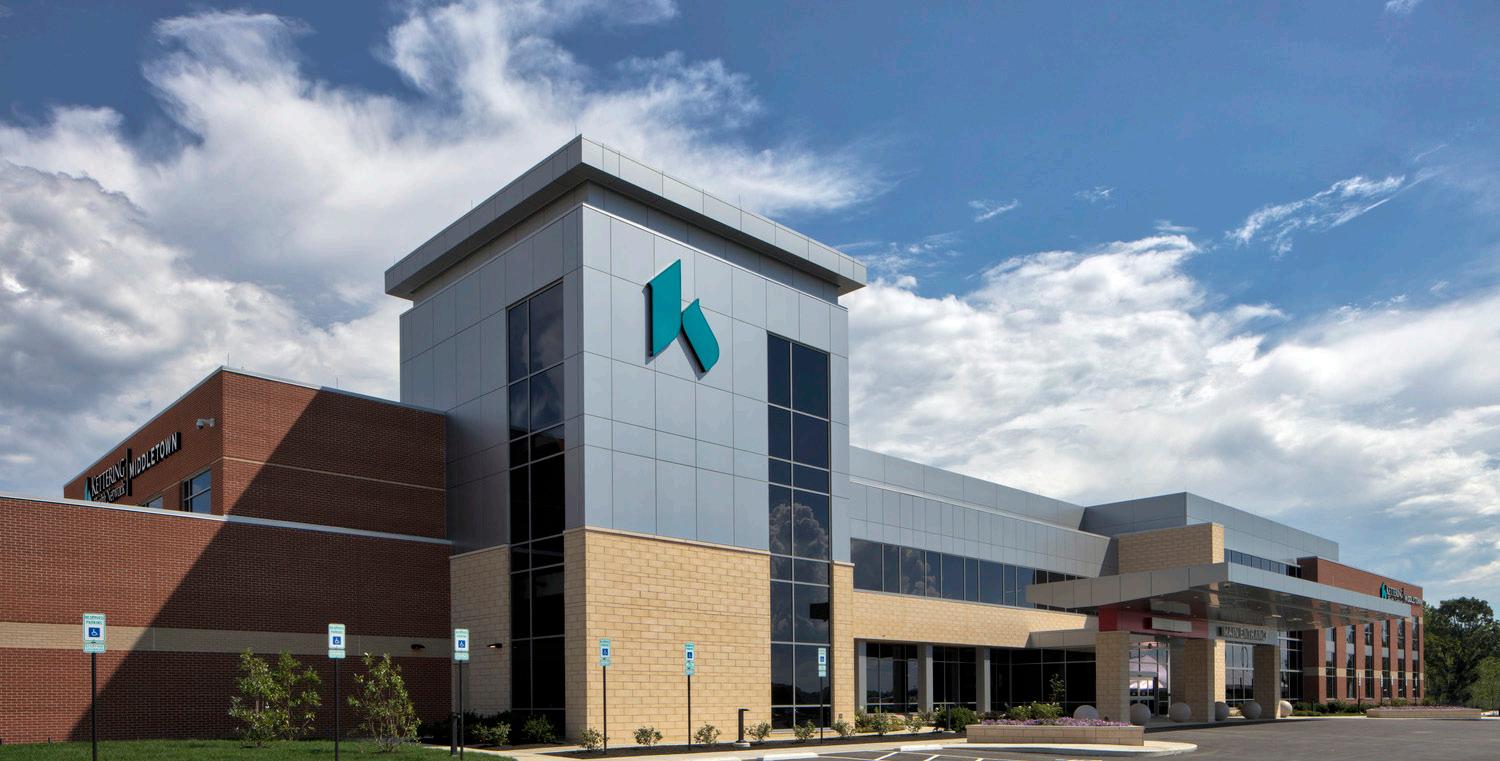
local developments
EAST END DEVELOPMENT
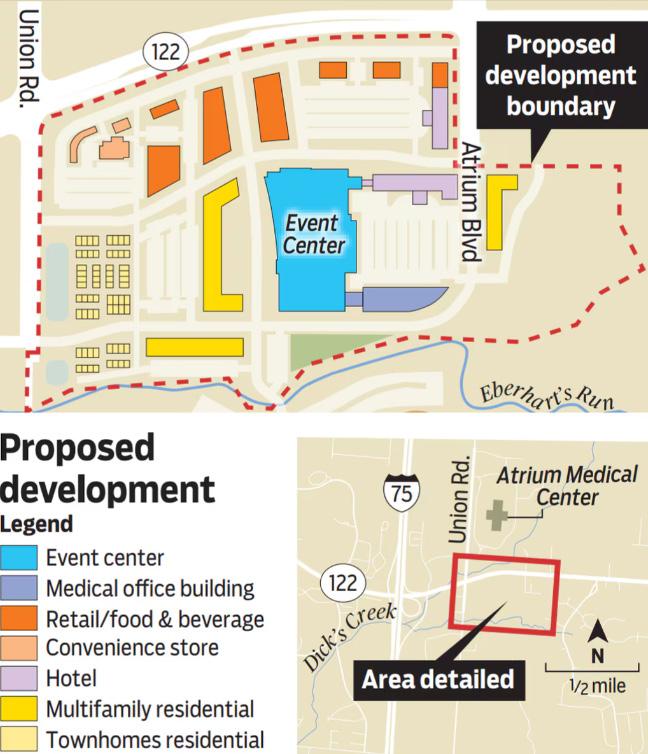
The project will include a 3,000-seat, multi-purpose Event Center, Class A retail and office, hotels, restaurants and a variety of residential products, according to developer Todd Duplain from Woodard Development, a Dayton-based commercial real estate firm.
Assistant City Manager Nathan Cahall said the timeline of Renaissance Pointe calls for bids on infrastructure improvements to be awarded in mid-February 2024 with a ground-breaking ceremony set for early March. The infrastructure improvements could be complete sometime in 2025, he said.
Since then, the city has created a new tax incrementing financing (TIF) district for the site and a new community authority to raise other supplemental revenues over time in support of the project, according to city documents.
The project would attract full-service, high-end hotels, premium and fastfood restaurants, townhomes that would sell in the $325,000 to $425,000 range and a medical complex that could complement the two East End hospitals, Atrium Medical Center and Kettering Health Middletown, according to Duplain.
While the Event Center won’t open for at least two years, Martin Russell, executive director of the Warren County Port Authority, has said it’s 65% booked, according to pre-lease agreements and letters of intent.
The project could improve the quality of life for local residents and generate sales and property taxes, according to Duplain, who added the Event Center has the potential to draw 425,000 visitors a year.
• 3,000 seat event center

HIGHLIGHTS
• 8 minute drive from Lefferson
• Class A retail
• Office, restaurants
• Ground breaking March 2024
• Project to both Woodard Development and Warren County Port Authority
• Potential to draw 425,000 visitors per year

EST. INVESTMENT: $200M
CLEVELAND CLIFFS

Cleveland-Cliffs Middletown Works, founded as Armco Steel in 1900, plans to invest more than $500 million in federal grants and $1.3 billion in its own funds over a five-year period to upgrade the Middletown plant.
This investment will secure 2,500 jobs at Middletown Works, where the unionized workforce is represented by the International Association of Machinists.
The plant will retire one blast furnace, install two electric melting furnaces and use hydrogen-based ironmaking technology. The project aims to eliminate 1 million tons of greenhouse gas emissions each year from the largest supplier of steel to the U.S. automotive industry, the company announced last week.
HIGHLIGHTS
• $1.8 billion in upgrades that will add jobs and ensure the long term stability of its business
• $500 million in federal grants
• $1.3 billion in its own funds
• Will secure 2,500 jobs at this location
INVESTMENT: $500M + $1.3B IN FUNDS

EST.
local developments
INNOVATION DRIVE APARTMENTS

$45M
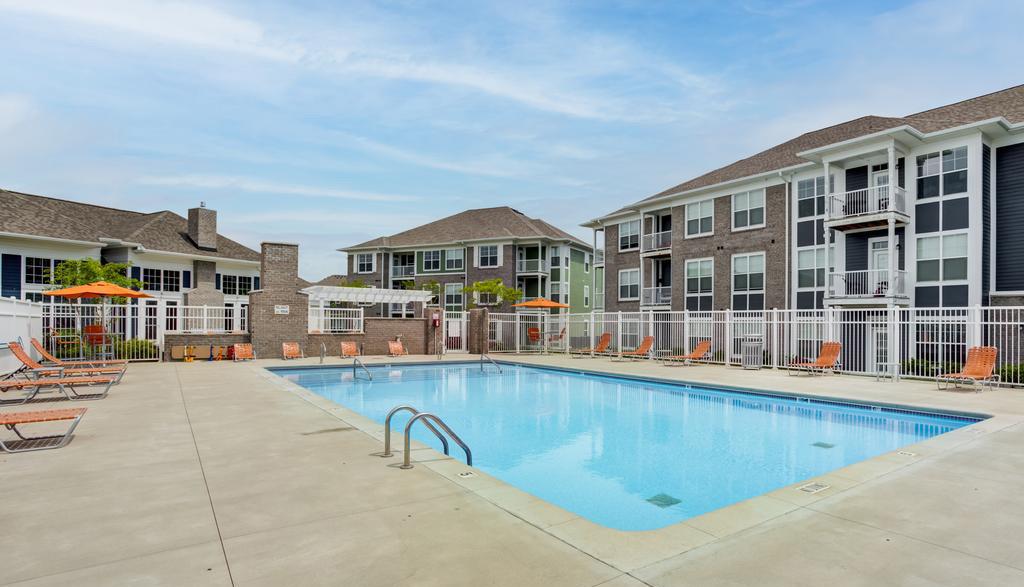
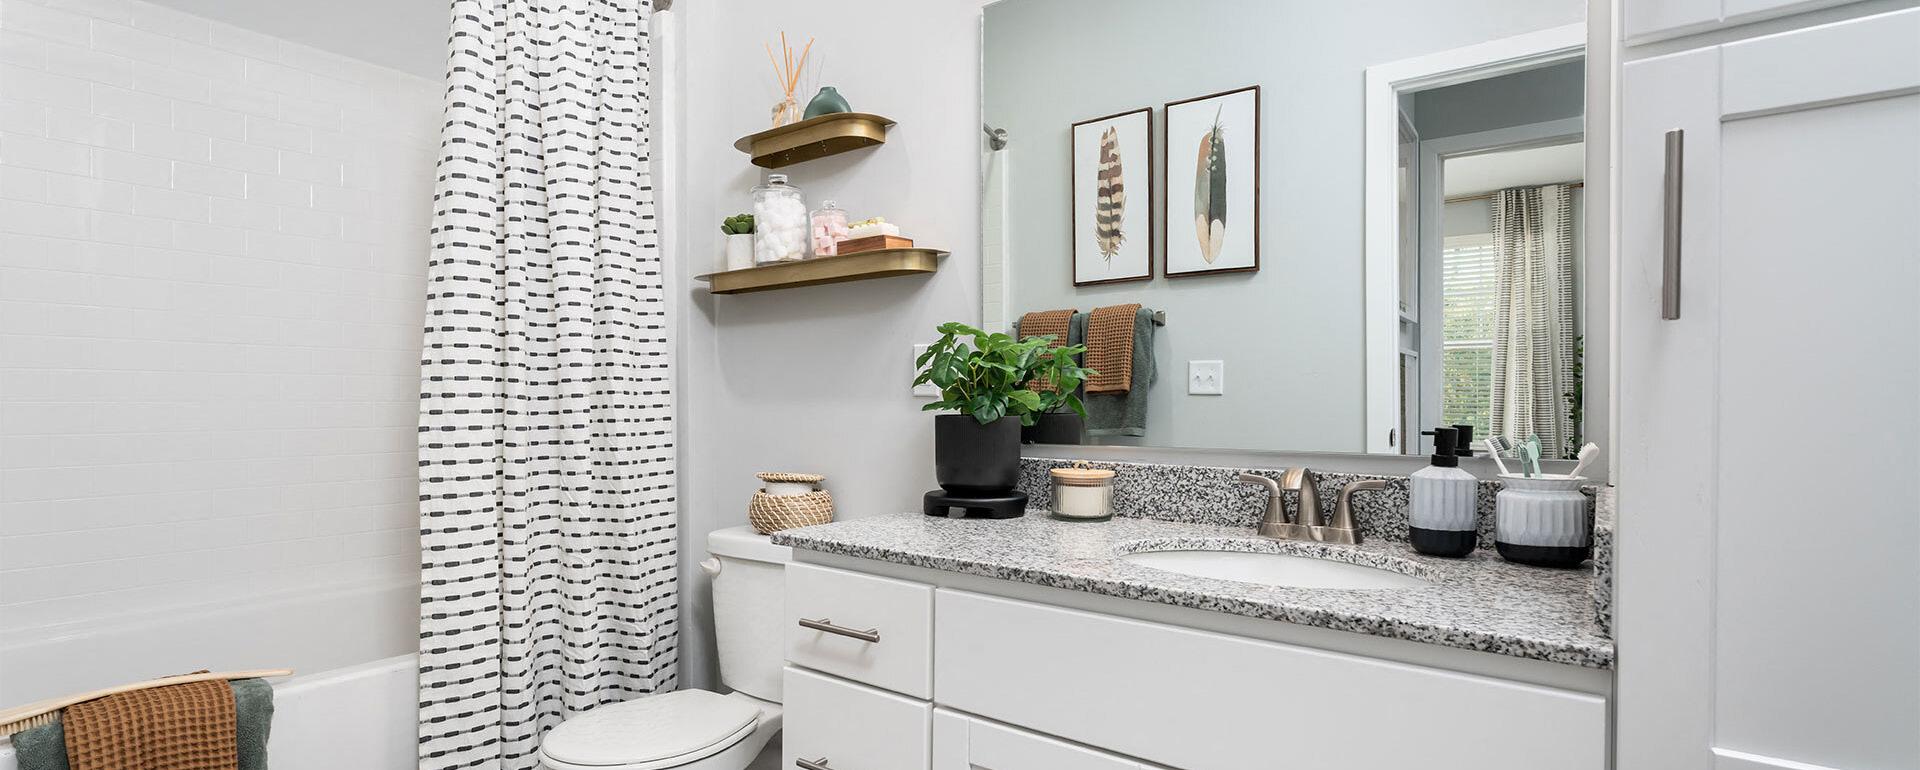
An Indiana development company has sets it sights on Ohio and the Dayton region. Indianapolis-based Kendall Property Group is plotting a luxury apartment complex south of Dayton. Its first Ohio project will be a 319-unit, luxury, market-rate apartment complex located near the intersection of Union Road and Innovation Drive near Interstate 75 in east Middletown. The estimated $45 million development is called “Innovation Way Apartments.” The Innovation Way Apartments will feature a mix of one-, two- and three-bedroom units. The complex will feature a large club house, pool, workout facility, dog park, business center and river and water views. The units will feature upscale amenities such as granite counter-tops, stainless steel appliances open kitchens and private balconies/patios.
HIGHLIGHTS
• 319 units, luxury, market rate apartments
• Developed by Indiana based Kendall property group
• Will have a mix of one-, two- and three-bedroom units
• Will feature upscale finishes like granite countertops, stainless steel appliances and open kitchens.
• Will have upscale amenities like a club house, pool, workout facility, dog park and business center

EST.
INVESTMENT:

CITY INFRASTRUCTURE DEVELOPMENT
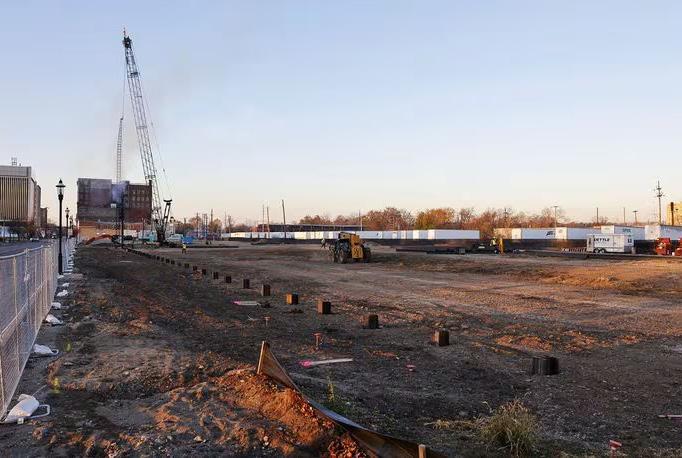
The city has started a $53 million project to install a five million-gallon storage tank reservoir underground that will help reduce the amount of combined sewer overflows, said Scott Tadych, the city’s public works and utilities director.
He said the concrete storage tank will hold the water there for 24 or 48 hours, then slowly pump it back to the main interceptor sewer line that goes to the wastewater treatment plant. That will “significantly reduce” the overflows into the hydraulic canal upstream of the Great Miami River, he said.
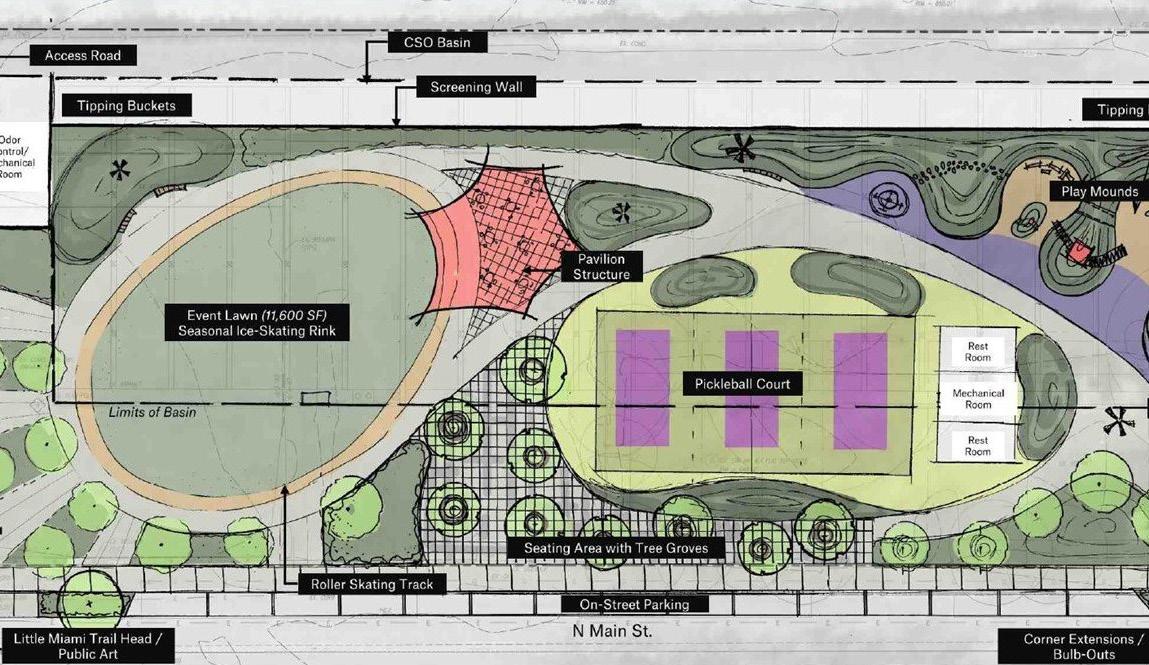
Eventually, once the reservoir is operational, the greenspace will be converted into a city park. While the amenities haven’t been finalized, they may include an event lawn, permanent home for the Holiday Whopla’s ice and roller rink and pickleball courts. Tadych said the park will have features similar to the Central Avenue project with benches, landscaping and trees.
EST. INVESTMENT: $53M


RENT MATRIX | TWO BED
 Lefferson Quarters
Garden - $808
Townhouse - $795
Maple Oaks
$1,585
$1,188
$1,375
$1,00
Olde Towne $1,200 Liberty
Manor
Village East
Vienna Forest
$1,209
$1,400
Bavarian Woods
Nicholas Place
$1,025
Chimney Hill
$1,150
Kensington Ridge
$965
Creek $950 Forest Creek $1,050
Williamsburg Place
Shady

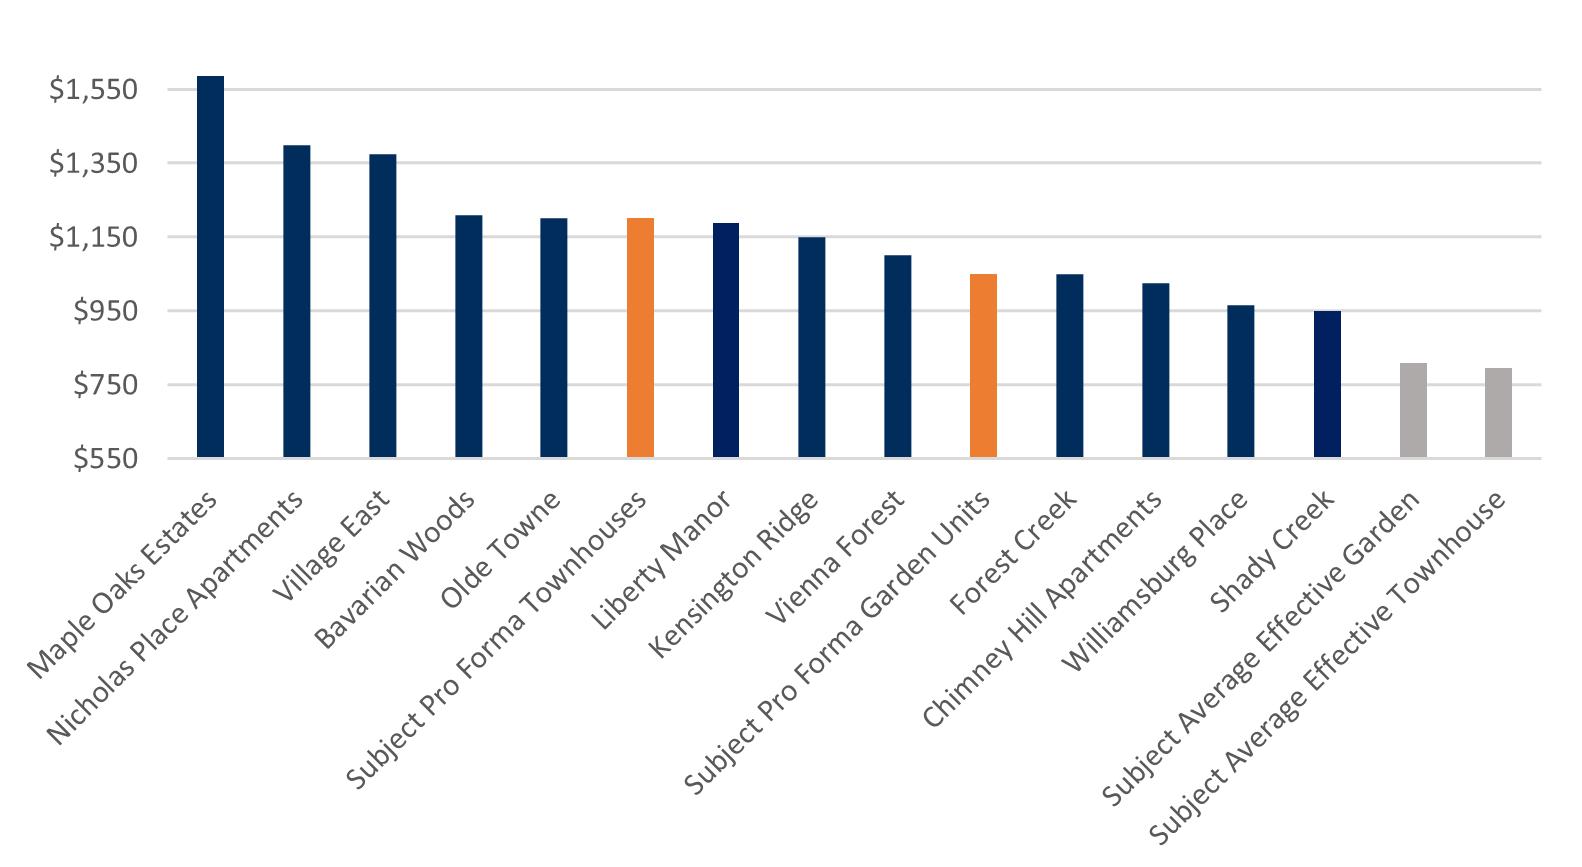
02 SECTIONLOCAL COMPETITORS Two Bedroom Property Year Built # Beds Avg SF Avg Rent Avg Rent/SF Maple Oaks Estates 1974 154 930 $1,585 $1.70 Nicholas Place Apartments 2016 108 1130 $1,400 $1.24 Village East 1971 247 1000 $1,375 $1.38 Bavarian Woods 1974 128 1120 $1,209 $1.08 Olde Towne 1969 95 980 $1,200 $1.22 Subject Pro Forma Townhouses 1995 57 819 $1,200 $1.47 Liberty Manor 1973 48 906 $1,188 $1.31 Kensington Ridge 1967 128 946 $1,150 $1.22 Vienna Forest 1993 41 900 $1,100 $1.22 Subject Pro Forma Garden Units 1995 6 650 $1,050 $1.62 Forest Creek 1986 84 825 $1,050 $1.27 Chimney Hill Apartments 1972 21 870 $1,025 $1.18 Williamsburg Place 1966 59 730 $965 $1.32 Shady Creek 1978 & 1993 48 875 $950 $1.09 Subject Average Effective Garden 1995 6 650 $808 $1.24 Subject Average Effective Townhouse 1995 57 819 $795 $0.97 Market Average 1983 80 884 $1,128 $1.28

RENT MATRIX | three BED
 Lefferson Quarters
$960
Maple Oaks
$1,474
Olde Towne
$1,415
Liberty Manor
$1,515
Village East
$1,470
Vienna Forest
$1,600
Bavarian Woods
$1,411
Nicholas Place
$1,650

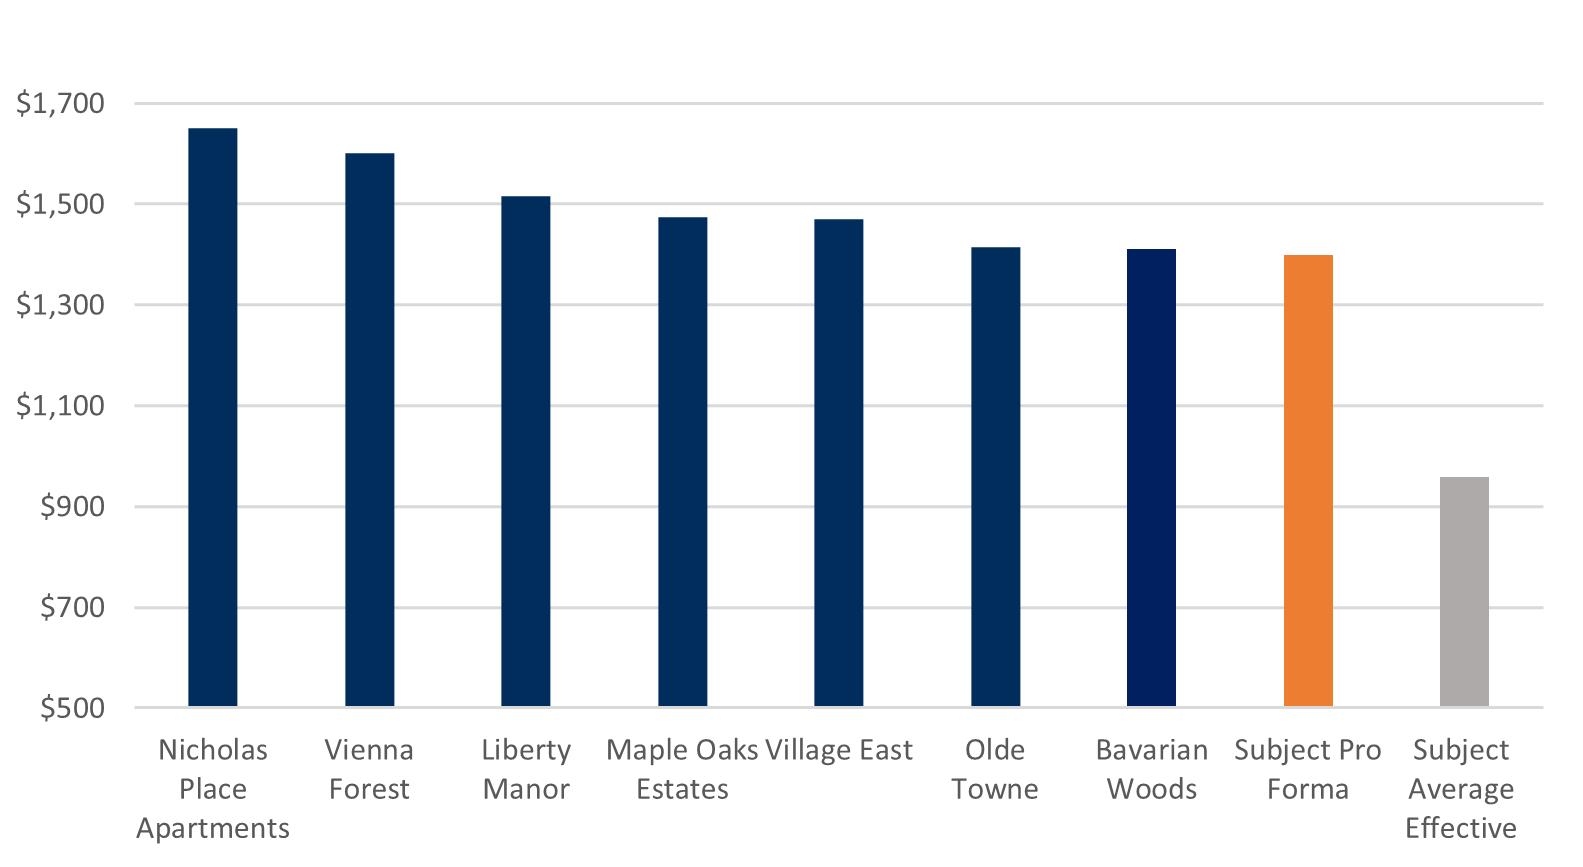
02 SECTIONLOCAL COMPETITORS Three Bedroom Property Year Built # Beds Avg SF Avg Rent Avg Rent/SF Nicholas Place Apartments 2016 108 1540 $1,650 $1.07 Vienna Forest 1993 28 1160 $1,600 $1.38 Liberty Manor 1973 12 1207 $1,515 $1.26 Maple Oaks Estates 1974 17 1004 $1,474 $1.47 Village East 1971 12 1380 $1,470 $1.07 Olde Towne 1969 33 1052 $1,415 $1.35 Bavarian Woods 1974 11 1480 $1,411 $0.95 Subject Pro Forma 1995 28 896 $1,400 $1.56 Subject Average Effective 1995 28 896 $960 $1.07 Market Average 1984 31 1179 $1,433 $1.24

UNITS 60 YEAR BUILT 1973 OCCUPANCY 95.0% UNIT MIX UNITS SQFT RENT RENT/SF Two Bedroom 48 906 $1,188 $1.31 Three Bedroom 12 1207 $1,515 $1.26 UNITS 144 YEAR BUILT 1986 OCCUPANCY 98.6% UNIT MIX UNITS SQFT RENT RENT/SF One Bedroom 60 600 $845 $1.41 Two Bedroom 84 825 $1,050 $1.27 4392 BONITA DR 3929 BONITA DRIVE Liberty manor Forest Creek

UNITS 110 YEAR BUILT 1993 OCCUPANCY 98.1% UNIT MIX UNITS SQFT RENT RENT/SF One Bedroom 41 676 $993 $1.47 Two Bedroom 41 900 $1,100 $1.22 Three Bedroom 28 1160 $1,600 $1.38 UNITS 150 YEAR BUILT 1967 OCCUPANCY 98.7% UNIT MIX UNITS SQFT RENT RENT/SF One Bedroom 22 575 $756 $1.31 Two Bedroom 128 946 $1,150 $1.22 496 BAVARIAN STREET 710 KENSINGTON COURT Vienna Forest Kensington Ridge

UNIT MIX BREAKDOWN
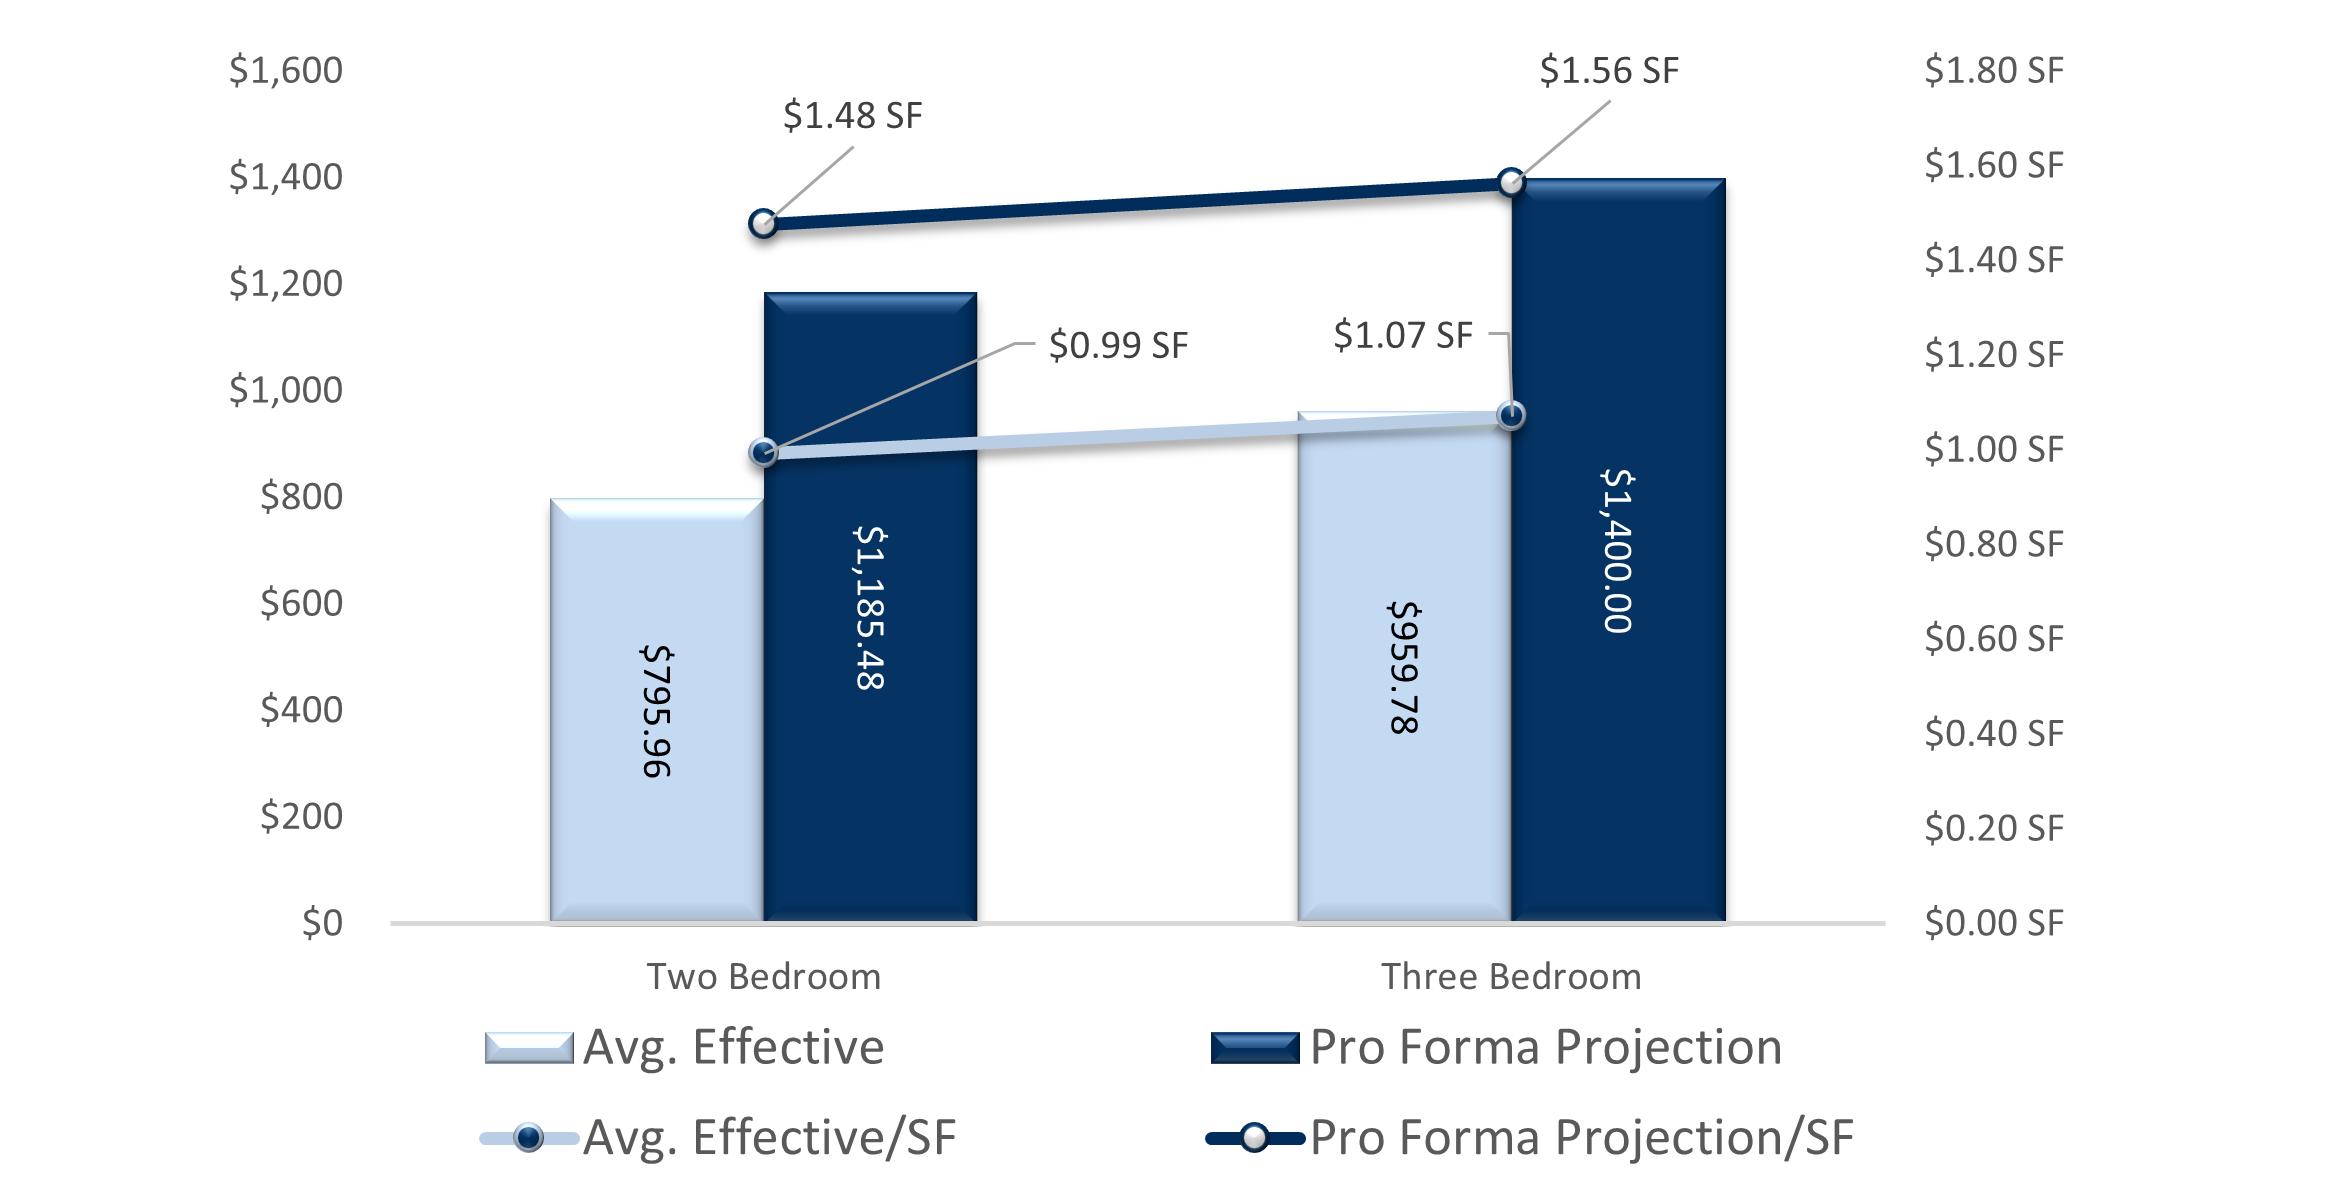
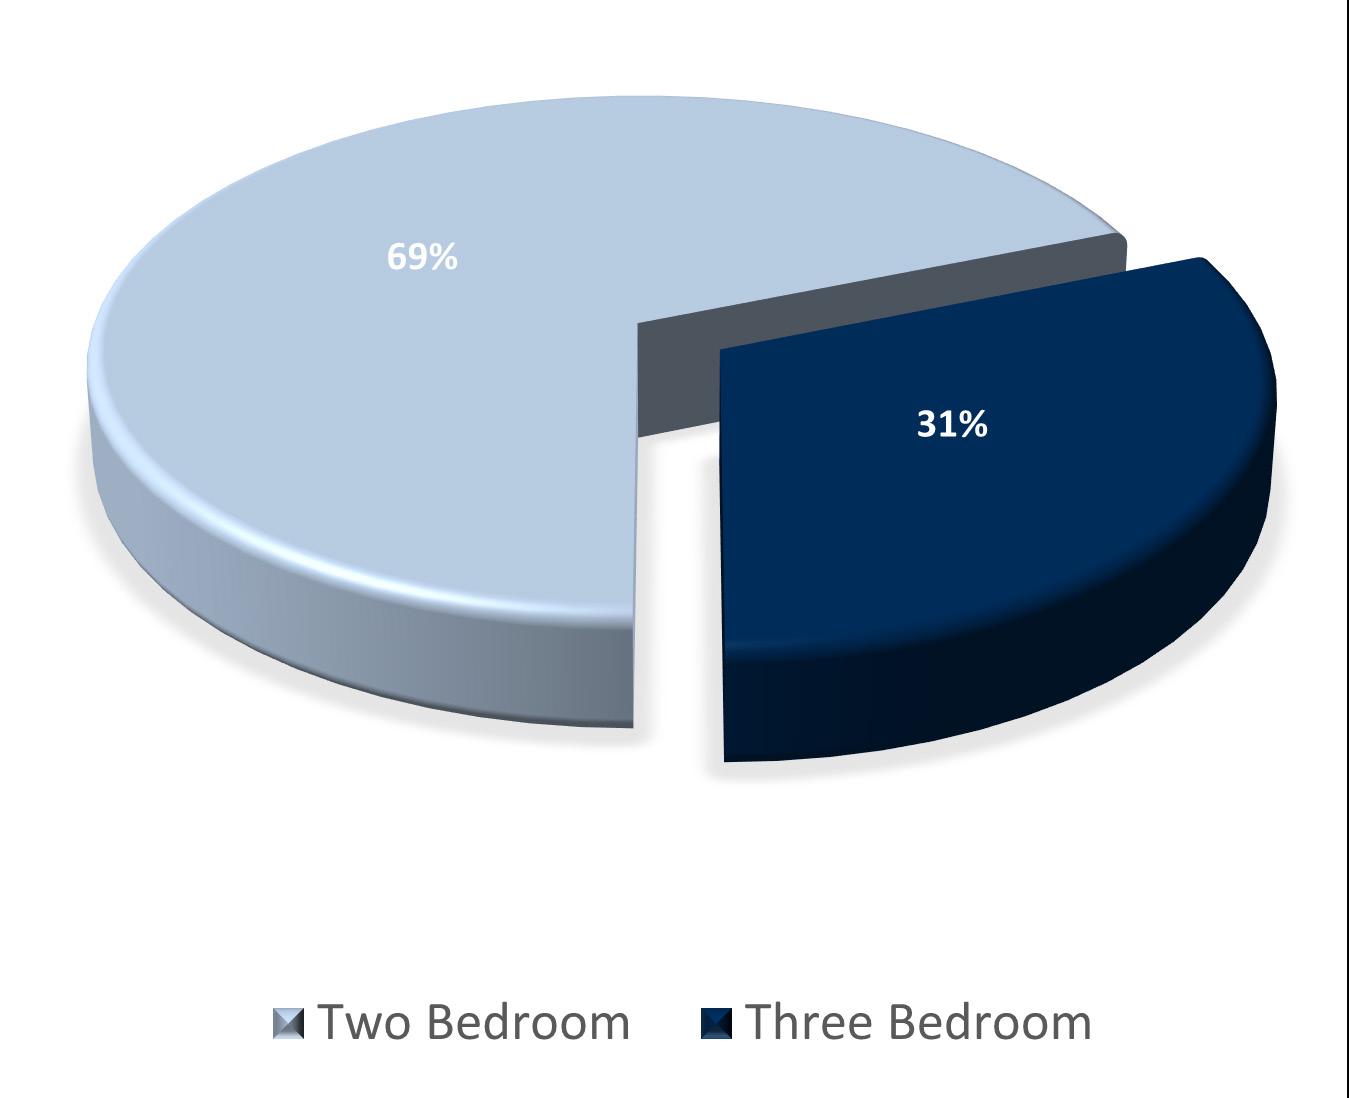
LEFFERSON QUARTERS - financials AVERAGE EFFECTIVE MARKET PROJECTED UNIT TYPE NO. OF UNITS RENTABLE SF TOTAL SF RENT/UNIT RENT/SF TOTAL RENT POTENTIAL RENT/UNIT RENT/SF TOTAL RENT POTENTIAL RENT/UNIT RENT/SF TOTAL RENT POTENTIAL Two Bedroom 2BR/1BA 56 Units 819 SF 45,864 SF $807.59 $0.99 SF $45,225 $950.00 $1.16 SF $53,200 $1,200.00 $1.47 SF $67,200 2BR/1BA - Garden ADA 6 Units 650 SF 3,900 SF $808.33 $1.24 SF $4,850 $895.00 $1.38 SF $5,370 $1,050.00 $1.62 SF $6,300 Totals / Wtd. Averages 62 Units 803 SF 49,764 SF $807.66 $1.01 SF $50,075 $944.68 $1.18 SF $58,570 $1,185.48 $1.48 SF $73,500 Three Bedroom 3BR/1.5BA 28 Units 896 SF 25,088 SF $991.73 $1.11 SF $27,768 $1,150.00 $1.28 SF $32,200 $1,400.00 $1.56 SF $39,200 Totals / Wtd. Averages 28 Units 896 SF 25,088 SF $991.73 $1.11 SF $27,768 $1,150.00 $1.28 SF $32,200 $1,400.00 $1.56 SF $39,200 Summary Two Bedroom 62 Units 803 SF 49,764 SF $807.66 $1.01 SF $50,075 $944.68 $1.18 SF $58,570 $1,185.48 $1.48 SF $73,500 Three Bedroom 28 Units 896 SF 25,088 SF $991.73 $1.11 SF $27,768 $1,150.00 $1.28 SF $32,200 $1,400.00 $1.56 SF $39,200 Totals / Wtd. Averages 90 Units 832 SF 74,852 SF $864.93 $1.04 SF $77,843 $1,008.56 $1.21 SF $90,770 $1,252.22 $1.51 SF $112,700 03 SECTION - THE FINANCIALS
UNIT RENTS
UNIT DISTRIBUTION


LEFFERSON QUARTERSfinancials


T12 RENT ROLL: AS OF MAY 2024 INCOME AND EXPENSES: MAY 2023 - APRIL 2024 GROSS POTENTIAL RENT % of GPR Per Unit All Units at Market Rent $1,089,240 RR 12,103 Gain (Loss) to Lease ($147,900) 13.58% (1,643) GROSS SCHEDULED RENT $941,340 RR 10,459 Total Other Income $69,616 7.40% 774 GROSS POTENTIAL INCOME $1,010,956 11,233 Physical Vacancy/Bad Debt ($122,200) T12 Economic 12.98% (1,358) Bad Debt $0 0.00% 0 EFFECTIVE GROSS INCOME $888,757 73.44% 9,875 NON-CONTROLLABLE Real Estate Taxes % of EGI Per Unit 2024 Taxes $72,494 Auditor 8.16% 805 Total Real Estate Taxes $72,494 8.16% 805 Insurance $4,960 T12 0.56% 55 Utilities Utilities $64,559 T12 7.26% 717 Trash Removal $5,640 Note2 0.63% 63 Utilities $70,199 7.90% 780 Total Non-Controllable $147,653 16.61% 1,641 CONTROLLABLE Contract Services Snow Removal $0 0.00% 0 Landscaping/Grounds $16,337 T12 1.84% 182 Pest Control $0 0.00% 0 Contract Services $16,337 1.84% 182 Repairs & Maintenance $65,986 T12 Note 2 & 3 7.42% 733 Marketing & Promotion $0 0.00% 0 On-Site Payroll $73,334 T12 8.25% 815 General & Administrative $13,809 T12 1.55% 153 Management Fee $0 0.00% 0 Telephone & Internet $1,655 T12 0.19% 18 Replacement & Reserves $27,000 Note 1 3.04% 300 Total Controllable $198,120 22.29% 2,201 TOTAL EXPENSES $345,774 38.91% 3,842 NET OPERATING INCOME $526,646 59.26% 5,852 EXPENSE INCOME UNDERWRITING NOTES # NOTE 1 Replacement & Reserves: added based on market norm of $300 per unit per year 2 Trash Removal/Repairs& Maint: $5,640 removed from Repairs due to Trash Removal being accounted for in ‘Cleaning & Maint’ on P&L 3 Repairs & Maint: $141,800 removed due to roof capital expense

T6 T3 YEAR 1 % of GPR Per Unit % of GPR Per Unit % of GPR Per Unit $1,089,240 RR 12,103 $1,089,240 RR 12,103 $1,352,400 15,027 ($147,900) 13.58% (1,643) ($147,900) 13.58% (1,643) ($27,048) 2.00% (301) $941,340 RR 10,459 $941,340 RR 10,459 $1,325,352 14,726 $70,097 7.45% 779 $75,238 7.99% 836 $77,495 5.85% 861 $1,011,437 11,238 $1,016,578 11,295 $1,402,847 15,587 ($123,453) T6 Economic 13.11% (1,372) ($109,553) T3 Economic 11.64% (1,217) ($66,268) 5.00% (736) $0 0.00% 0 $0 0.00% 0 ($13,254) 1.00% (147) $887,984 73.31% 9,866 $907,025 74.78% 10,078 $1,323,326 92.00% 14,704 % of EGI % of EGI Per Unit % of EGI $72,494 Auditor 8.16% 805 $72,494 Auditor 7.99% 805 $72,494 7.99% 805 $72,494 8.16% 805 $72,494 7.99% 805 $72,494 7.99% 805 $4,960 T12 0.56% 55 $4,960 T12 0.56% 55 $40,500 4.47% 450 $64,559 T12 7.26% 717 $64,559 T12 7.26% 717 $65,851 7.26% 732 $5,640 Note2 0.63% 63 $5,640 Note2 0.63% 63 $5,753 0.63% 64 $70,199 7.91% 780 $70,199 7.74% 780 $71,603 7.89% 796 $147,653 16.63% 1,641 $147,653 16.29% 1,641 $184,597 20.35% 2,051 $0 0.00% 0 $0 0.00% 0 $3,150 0.24% 35 $16,337 T12 1.84% 182 $16,337 T12 1.84% 182 $13,500 1.02% 150 $0 0.00% 0 $0 0.00% 0 $3,150 0.24% 35 $16,337 1.84% 182 $16,337 1.80% 182 $19,800 2.18% 220 $65,986 T12 Note 2 & 3 7.42% 733 $65,986 T12 Note 2 & 3 7.42% 733 $45,000 3.40% 500 $0 0.00% 0 $0 0.00% 0 $4,500 0.34% 50 $73,334 8.25% 815 $73,334 8.25% 815 $90,000 6.80% 1,000 $13,809 T12 1.55% 153 $13,809 T12 1.55% 153 $9,000 0.68% 100 $0 0.00% 0 $0 0.00% 0 $66,166 5.00% 735 $1,655 T12 0.19% 18 $1,655 T12 0.19% 18 $1,800 0.14% 20 $27,000 Note 1 3.04% 300 $27,000 Note 1 2.98% 300 $27,000 2.04% 300 $198,120 22.30% 2,201 $198,120 22.19% 2,201 $263,266 20.58% 2,925 $345,774 38.94% 3,842 $345,774 38.12% 3,842 $447,864 49.38% 4,976 $525,874 59.22% 5,843 $544,914 60.08% 6,055 $855,662 94.34% 9,507

T12 T6 T3 YR 1 YR 2 YR 3 YR 4 YR 5 YE MAY-2025 YE MAY-2026 YE MAY-2027 YE APR-2028 YE APR-2029 GROSS POTENTIAL RENT All Units at Market Rent $1,089,240 $1,089,240 $1,089,240 $1,352,400 $1,392,972 $1,434,761 $1,477,804 $1,522,138 Gain (Loss) to Lease ($147,900) ($147,900) ($147,900) ($27,048) ($27,859) ($28,695) ($29,556) ($30,443) GROSS SCHEDULED RENT $941,340 $941,340 $941,340 $1,325,352 $1,365,113 $1,406,066 $1,448,248 $1,491,695 TOTAL OTHER INCOME $69,616 $70,097 $75,238 $77,495 $79,045 $80,626 $82,238 $83,883 GROSS POTENTIAL INCOME $1,010,956 $1,011,437 $1,016,578 $1,402,847 $1,444,157 $1,486,692 $1,530,486 $1,575,578 Physical Vacancy ($122,200) ($123,453) ($109,553) ($66,268) ($68,256) ($70,303) ($72,412) ($74,585) Bad Debt $0 $0 $0 ($13,254) ($13,651) ($14,061) ($14,482) ($14,917) EFFECTIVE GROSS INCOME $888,757 $887,984 $907,025 $1,323,326 $1,362,251 $1,402,328 $1,443,591 $1,486,077 Real Estate Taxes $72,494 $72,494 $72,494 $72,494 $73,944 $75,423 $76,931 $78,470 Insurance $4,960 $4,960 $4,960 $40,500 $41,310 $42,136 $42,979 $43,839 Utilities $70,199 $70,199 $70,199 $71,603 $73,036 $74,496 $75,986 $77,506 Contract Services $16,337 $16,337 $16,337 $19,800 $20,196 $20,600 $21,012 $21,432 Repairs & Maintenance $65,986 $65,986 $65,986 $45,000 $45,900 $46,818 $47,754 $48,709 Marketing & Promotion $0 $0 $0 $4,500 $4,590 $4,682 $4,775 $4,871 On-Site Payroll $73,334 $73,334 $73,334 $90,000 $91,800 $93,636 $95,509 $97,419 General & Administrative $13,809 $13,809 $13,809 $9,000 $9,180 $9,364 $9,551 $9,742 Management Fee $0 $0 $0 $66,166 $68,113 $70,116 $72,180 $74,304 Replacement & Reserves $27,000 $27,000 $27,000 $27,000 $27,540 $28,091 $28,653 $29,226 TOTAL EXPENSES $345,774 $345,774 $345,774 $447,864 $457,444 $467,234 $477,240 $487,465 NET OPERATING INCOME $526,646 $525,874 $544,914 $875,462 $904,807 $935,093 $966,351 $998,611 INCOME EXPENSE LEFFERSON QUARTERSfinancials
FLOW Tax Breakdown Property Address Parcel ID Year Built Acres Market Value Assessed Value Tax Rate Taxes Payable Land Use Code 1900 Aaron Dr Q6542-082.000-003 1995 7.56 $3,451,060 $1,207,870 0.021000 $72,494.00 403 C Total 7.56 $3,451,060 $1,207,870 $72,494.00
CASH


CASH FLOW PROJECTION GROWTH RATE ASSUMPTIONS T12 T6 T3 YR 1 YR 2
Gross Potential Rent 24.16% 3.00% 3.00% 3.00% 3.00% (Loss) / Gain to Lease* 13.58% 13.58% 2.00% 2.00% 2.00% Other Income 3.00% 3.00% 3.00% 3.00% 3.00% EXPENSES Expenses 2.00% 2.00% 2.00% 2.00% Management Fee** 5.00% 5.00% 5.00% 5.00% 5.00% CASH FLOW PROJECTION GROWTH RATE ASSUMPTIONS T12 T6 T3 YR 1 YR 2 Physical Vacancy 13.11% 11.64% 5.00% 5.00% 5.00% Non-Revenue Units 0.00% 0.00% 0.00% 0.00% 0.00% Bad Debt 0.00% 0.00% 1.00% 1.00% 1.00% Concessions Allowance 0.00% 0.00% 0.00% 0.00% 0.00% Total Economic Loss 13.11% 11.64% 6.00% 6.00% 6.00%
INCOME
CINCINNATI
THE ECONOMY
1| Prior to the pandemic, Cincinnati’s real gross metropolitan product grew at an average annual rate of 2.1% from 2015 to 2019. During that same five-year period, job growth averaged 1.4% annually, with roughly 15,500 jobs added on average each year. In 2020, COVID-19 mitigation measures and limited business activity caused the local economy to contract as much as 8.4% year-over-year in 2nd quarter. 2| In 2023, the metro’s inflation-adjusted economic output expanded 2.3%. 3| The metro recorded a net gain of 21,100 jobs, expanding the employment base 1.8%. 4| Cincinnati’s unemployment rate in November 2023 was unchanged year-over-year at 3.0%, below the national average of 3.5%. 5| Despite job losses stemming from the pandemic, Cincinnati’s current employment base now sits roughly 63,700 jobs or about 6% above the pre-pandemic level in February 2020.

3,263 units completed in past 12 months 5,184 units currently in progress

HIGHEST OVERALL PERFORMING SUBMARKET
RENT
1| Over the past five years, annual change in effective asking rents in Cincinnati ranged from 2.0% to 11.9%. 2| In 4th quarter 2023, effective asking rents for new leases were up 3.6% year-over- year. That annual rent performance was below the market’s five-year average of 5.7%. 3| Cincinnati’s recent annual rent change performance ranked #10 in the Midwest region and #27 nationally. 4| Looking at product classes in Cincinnati, Class B led for rent performance over the past five years. In 4th quarter 2023, annual effective rent change registered at 2.5% in Class A units, 3.4% in Class B units and 5.8% in Class C units. 5| Among submarkets, the strongest annual rent change performances over the past year were in West Cincinnati and Southeast Cincinnati. 6| The weakest performances were in Central Cincinnati, Butler County and North Central Cincinnati. Over the past five years, rent growth was strongest in Southeast Cincinnati.
LOCAL MARKET
Q4 2023 MARKET SNAPSHOT Pre-1970s 1970s 1980s 1990s 2000+ Occupancy 93.8% 95.4% 96.2% 94.8% 94.7% Y-O-Y Rent Growth 5.2% 3.5% 3.4% 3.0% 3.5% Average Rent Per Unit $1,094 $1,148 $1,283 $1,367 $1,732
SUBMARKETS RENT OCCUPANCY YOY Dent/Harrison $1,147 97.6% 11.0% Roselawn $1,022 92.5% 8.5% Mt Washington $1,155 94.7% 8.3% Mt Healthy $1,123 96.7% 8.1% Middletown/Franklin $969 94.1% 7.3%
SCAN FOR MORE

1| New apartment completions in Cincinnati were moderate recently, as 3,263 units delivered in 2023. That annual completion volume was a 24-year high. 2| With 150 units removed from existing stock over the past year, the local inventory base grew 1.9%. In the past year, supply was greatest in North Central Cincinnati. 3| Annual new supply averaged 1,754 units, and annual inventory growth averaged 1.0% over the past five years. During that period, new supply was concentrated in Central Cincinnati and Campbell/Kenton Counties, which received 42% of the market’s total completions. 4| At the end of 2023, there were 5,184 units under construction with 3,531 of those units scheduled to complete in the next four quarters. Scheduled deliveries in the coming year are expected to be concentrated in Central Cincinnati.
OCCUPANCY
1| Occupancy in the Cincinnati apartment market has ranged from 94.9% to 98.2% over the past five years, averaging 96.4% during that period. 2| Over the past year, occupancy lost 1.2 points, with the 4th quarter 2023 rate landing at 94.9%. 3| Looking at product classes in Cincinnati, 4th quarter 2023 occupancy registered at 94.1% in Class A units, 94.9% in Class B units and 95.6% in Class C units. 4| Occupancy in Class C product was generally tightest over the past five years. 5| Among submarkets, 4th quarter 2023 occupancy was strongest in Southeast Cincinnati and Campbell/Kenton Counties. 6| The weakest readings were seen in Central Cincinnati and North Central Cincinnati. During the coming year, occupancy in Cincinnati is expected to register around 95%.
HIGHEST OVERALL PERFORMING SUBMARKET

LOWEST OVERALL PERFORMING SUBMARKETS
UNITS UNDER CONSTRUCTION
SECTOR UNITS Central Cincinnati 1,747 Northeast Cincinnati/Warren County 811 Boone County/Erlanger 769 Campbell/Kenton Counties 497 Butler County 482 TOTAL FUTURE INVENTORY GROWTH SUBMARKET CHANGE Central Cincinnati 11.9% Boon County/Erlanger 7.0% Northeast Cincinnati/Warren County 4.8% Campbell/Kenton Counties 2.9% Butler County 2.4%
SUBMARKETS RENT OCCUPANCY YOY Dent/Harrison $1,147 97.6% 11.0% Roselawn $1,022 92.5% 8.5% Mt Washington $1,155 94.7% 8.3% Mt Healthy $1,123 96.7% 8.1% Middletown/Franklin $969 94.1% 7.3%
SUBMARKETS RENT OCCUPANCY YOY Fort Mitchell/Crescent Springs $1,162 96.1% 1.0% Fairfield $1,291 94.2% 1.0% Covington/Newport $1,608 93.9% 0.8% Clifton $1,038 90.6% -0.5% Downtown $1,786 94.6% -0.8
SUPPLY

DAYTON
THE ECONOMY
1| Prior to the pandemic, Dayton’s real gross metropolitan product grew at an average annual rate of 1.3% from 2015 to 2019. During that same five-year period, job growth averaged 1.0% annually, with roughly 3,700 jobs added on average each year. 2| In 2020, COVID-19 mitigation measures and limited business activity caused the local economy to contract as much as 9.4% year-over-year in 2nd quarter. 3| In 2023, the metro’s inflation-adjusted economic output expanded 1.8%. At the same time, the metro recorded a net gain of 7,600 jobs, expanding the employment base 2.0%. 4| As such, Dayton’s unemployment rate in November 2023 declined 0.2 points year-over-year to 3.2%, below the national average of 3.5%. 5| During the past year, job gains in Dayton were most pronounced in the Professional/Business Services sector followed by Education/Health Services. 6| Despite job losses stemming from the pandemic, Dayton’s

956 units completed in past 12 months 955 units currently in progress HIGHEST OVERALL PERFORMING SUBMARKET
RENT
1| Over the past five years, annual change in effective asking rents in Dayton ranged from 2.2% to 10.3%. 2| In 4th quarter 2023, effective asking rents for new leases were up 4.1% year-over-year. That annual rent performance was below the market’s fiveyear average of 5.4%. 3| Product classes in Dayton, Class A led for rent performance over the past five years. 4| In 4th quarter 2023, annual effective rent change registered at 3.8% in Class A units, 3.4% in Class B units and 5.1% in Class C units. 5| Among submarkets, the strongest annual rent change performances over the past year were in Greene County (5.7%) and South Montgomery County (3.9%). 6| The weakest performance was in North Dayton/Miami County at 0.3%. As of 4th quarter 2023, effective asking rental rates in Dayton averaged $1,129 per month, or $1.232 per square foot.
LOCAL MARKET
Q4 2023 MARKET SNAPSHOT Pre-1970s 1970s 1980s 1990s 2000+ Occupancy 95.0% 94.1% 96.5% 95.5% 95.2% Y-O-Y Rent Growth 5.1% 6.5% 2.2% 5.8% 1.7% Average Rent Per Unit $913 $982 $1,031 $1,259 $1,464
SUBMARKETS RENT OCCUPANCY YOY Xenia $1,011 95.1% 14.9% Dayton – West $916 96.3% 14.2% Trotwood $971 95.5% 9.2% Kettering – East $999 96.2% 8.2% Bellbrook $1,5874 95.3% 6.8%

SCAN FOR MORE

1| New apartment completions in Dayton were moderate recently, as 956 units delivered in 2023. Completions over the past year expanded the local inventory base 1.7%. 2| In the past year, supply was greatest in Central Dayton/Kettering (389 units) and North Dayton/Miami County (229 units). 3| The only other submarket to receive any new supply in 2023 was South Montgomery County, though modest at 80 units.
4| Annual new supply averaged 557 units, and annual inventory growth averaged 1.0% over the past five years. During that period, new supply was concentrated in Central Dayton/Kettering and South Montgomery County, which received 65% of the market’s total completions. 5| At the end of 2023, there were 955 units under construction with 850 of those units scheduled to complete in the next four quarters.
OCCUPANCY
1| Occupancy in the Dayton apartment market has ranged from 95.2% to 98.0% over the past years, averaging 96.6% during that period. 2| Over the past year, occupancy lost 1.0 point, with the 4th quarter 2023 rate landing at 95.2%. 3| Looking at product classes in Dayton, 4th quarter 2023 occupancy registered at 94.3% in Class A units, 95.2% in Class B units and 95.8% in Class C units. Occupancy in Class C product was generally tightest over the past five years. 4| Among submarkets, 4th quarter 2023 occupancy was strongest in Greene County (96.5%) and North Dayton/Miami County (95.7%). The weakest readings were seen in Northwest Dayton (92.3%) and South Montgomery County (94.7%). 5| Over the past five years, Greene County and North Dayton/Miami County generally led for occupancy, both averaging occupancy of 97.2%.
UNITS UNDER CONSTRUCTION
SUPPLY
SECTOR UNITS Central Dayton / Kettering 549 North Dayton / Miami County 265 South Montgomery County 141 TOTAL FUTURE INVENTORY GROWTH SUBMARKET CHANGE Central Dayton / Kettering 3.4% North Dayton / Miami County 3.1% South Montgomery County 1.2% HIGHEST OVERALL PERFORMING SUBMARKET SUBMARKETS RENT OCCUPANCY YOY Xenia $1,011 95.1% 14.9% Dayton – West $916 96.3% 14.2% Trotwood $971 95.5% 9.2% Kettering – East $999 96.2% 8.2% Bellbrook $1,5874 95.3% 6.8% LOWEST OVERALL PERFORMING SUBMARKETS SUBMARKETS RENT OCCUPANCY YOY Downtown $1,299 92.1% 2.6% Kettering – West $1,126 93.6% 2.4% Miamisburg $1,236 95.7% 1.1% Huber Heights $1,125 96.4% -0.4% Miami $1,187 93.3% -0.5%
LEFFERSON QUARTERS


 Lefferson Quarters
Garden - $808
Townhouse - $795
Maple Oaks
$1,585


