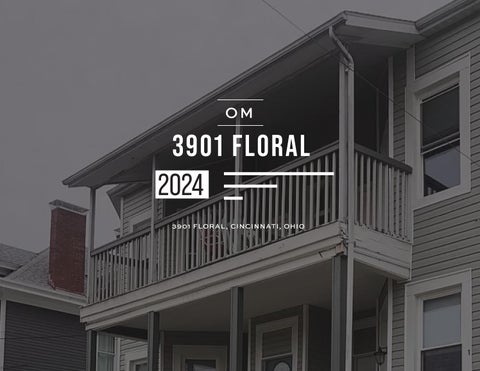
3901 FLORAL 2024
3901
OM 1
FLORAL, CINCINNATI, OHIO


CONTENTS LEAD AGENTS The Investment Local Competitors Financials 06 10 14 SECTIONS Austin Sum Senior Associate Cincinnati Office D. 513.878.7747 austin.sum@marcusmillichap.com Nick Andrews First Vice President Investments Cincinnati Office D. 513.878.7741 nicholas.andrews@marcusmillichap.com Jordan Dickman First Vice President Investments Cincinnati Office D. 513.878.7735 jordan.dickman@marcusmillichap.com 2


“OUR COMMITMENT IS TO HELP OUR CLIENTS CREATE AND PRESERVE WEALTH BY PROVIDING THEM WITH THE BEST REAL ESTATE
300
STREET,
OH 3
INVESTMENT SALES, FINANCING, RESEARCH AND ADVISORY SERVICES AVAILABLE.”
WEST 4TH
CINCINNATI,

GLOBAL REACH, LOCAL EXPERTISE
$86.3B
VALUE OF RECENTLY CLOSED TRANSACTIONS
12,272
CLOSED SALES IN MOST RECENT YEAR
$12.8B
TOTAL VALUE OF RECENT LISTINGS
2,143
CLOSED FINANCINGS IN MOST RECENT YEARS
CALABASAS, CALIFORNIA | HQ 2,500 | EMPLOYEES 80+ | OFFICES
CINCINNATI
DAYTON
4
LEXINGTON LOUISVILLE
YOUR TEAM
JORDAN DICKMAN
FIRST VICE PRESIDENTS DIRECTOR, NMHG
NICK ANDREWS
FIRST VICE PRESIDENTS DIRECTOR, NMHG
AUSTIN SUM
SENIOR INVESTMENT ASSOCIATE
AUSTIN Hall
INVESTMENT ASSOCIATE
ALDEN SIMMS
INVESTMENT ASSOCIATE
CORPORATE SUPPORT
LIZ POPP
MIDWEST OPERATIONS MANAGER
JOSH CARUANA
VICE PRESIDENT
REGIONAL MANAGER
INDIANAPOLIS | CINCINNATI | LOUISVILLE | ST LOUIS | KANSAS CITY
JOHN SEBREE
SENIOR VICE PRESIDENT
NATIONAL DIRECTOR
NATIONAL MULTI HOUSING GROUP
MICHAEL GLASS
SENIOR VICE PRESIDENT
MIDWEST DIVISION MANAGER
NATIONAL DIRECTOR, MANUFACTURED HOME COMMUNITIES GROUP
BROKER SUPPORT
SAM PETROSino
VALUATION & RESEARCH
BRETT MARTIN
INTERNAL ACCOUNTANT
BRITTANY CAMPBELL-KOCH DIRECTOR OF OPERATIONS ALEX PAPAMARKETING COORDINATOR

5
DATA SUMMARY
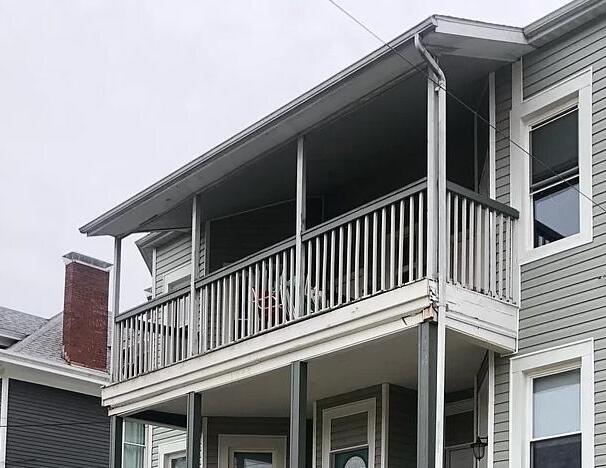
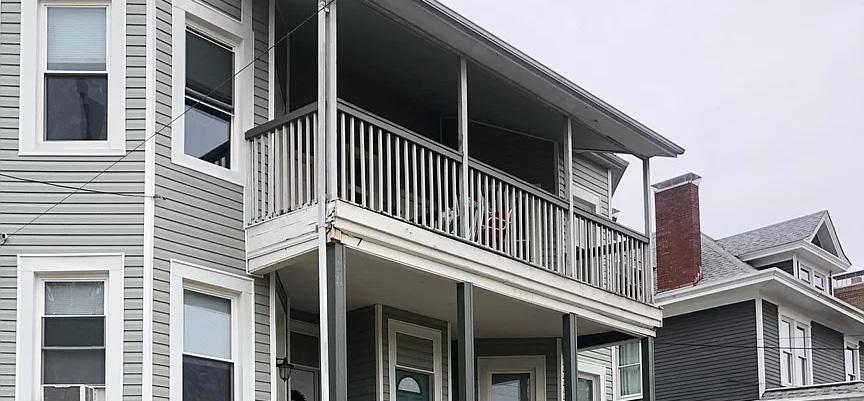
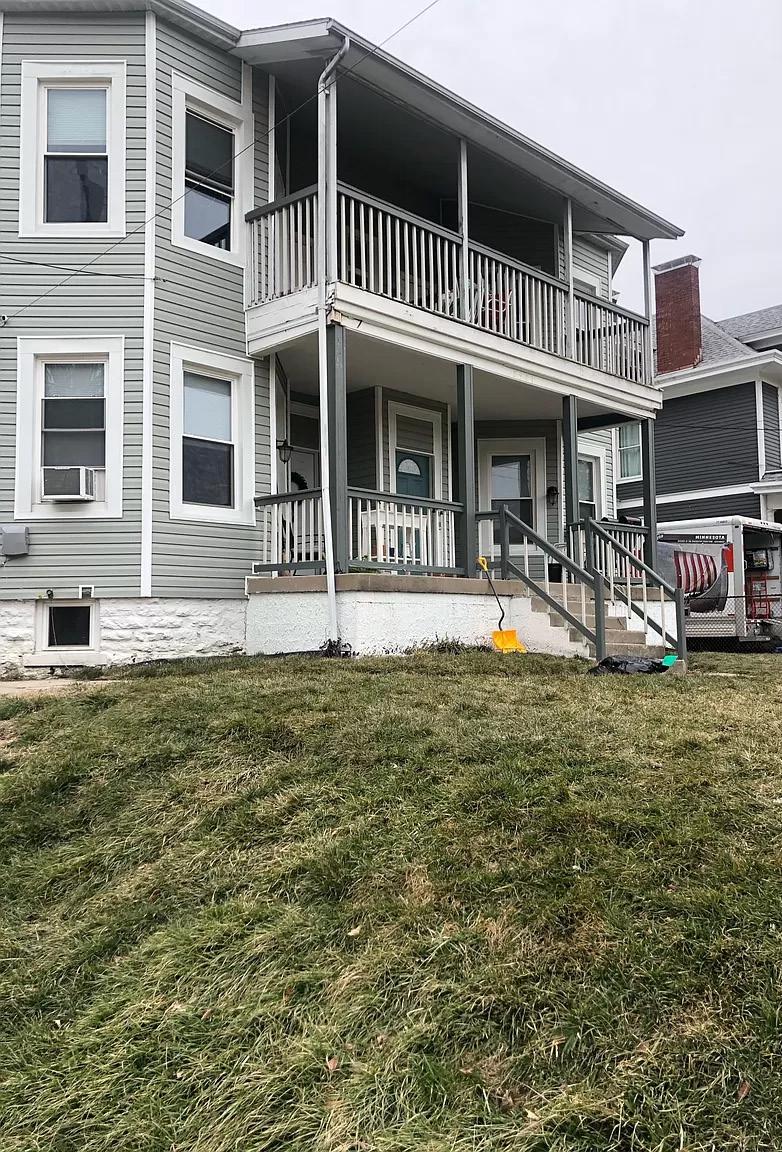
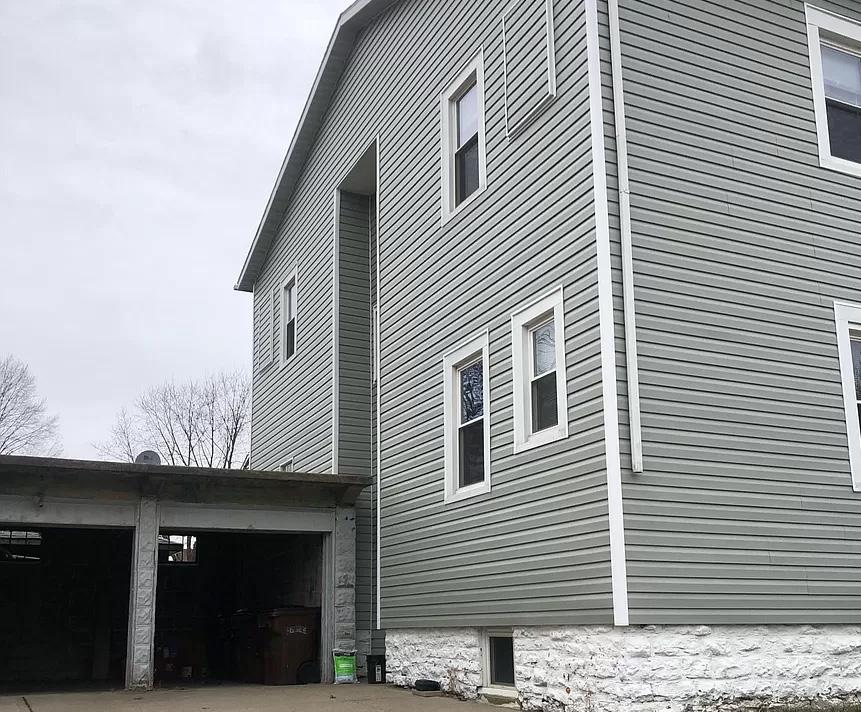
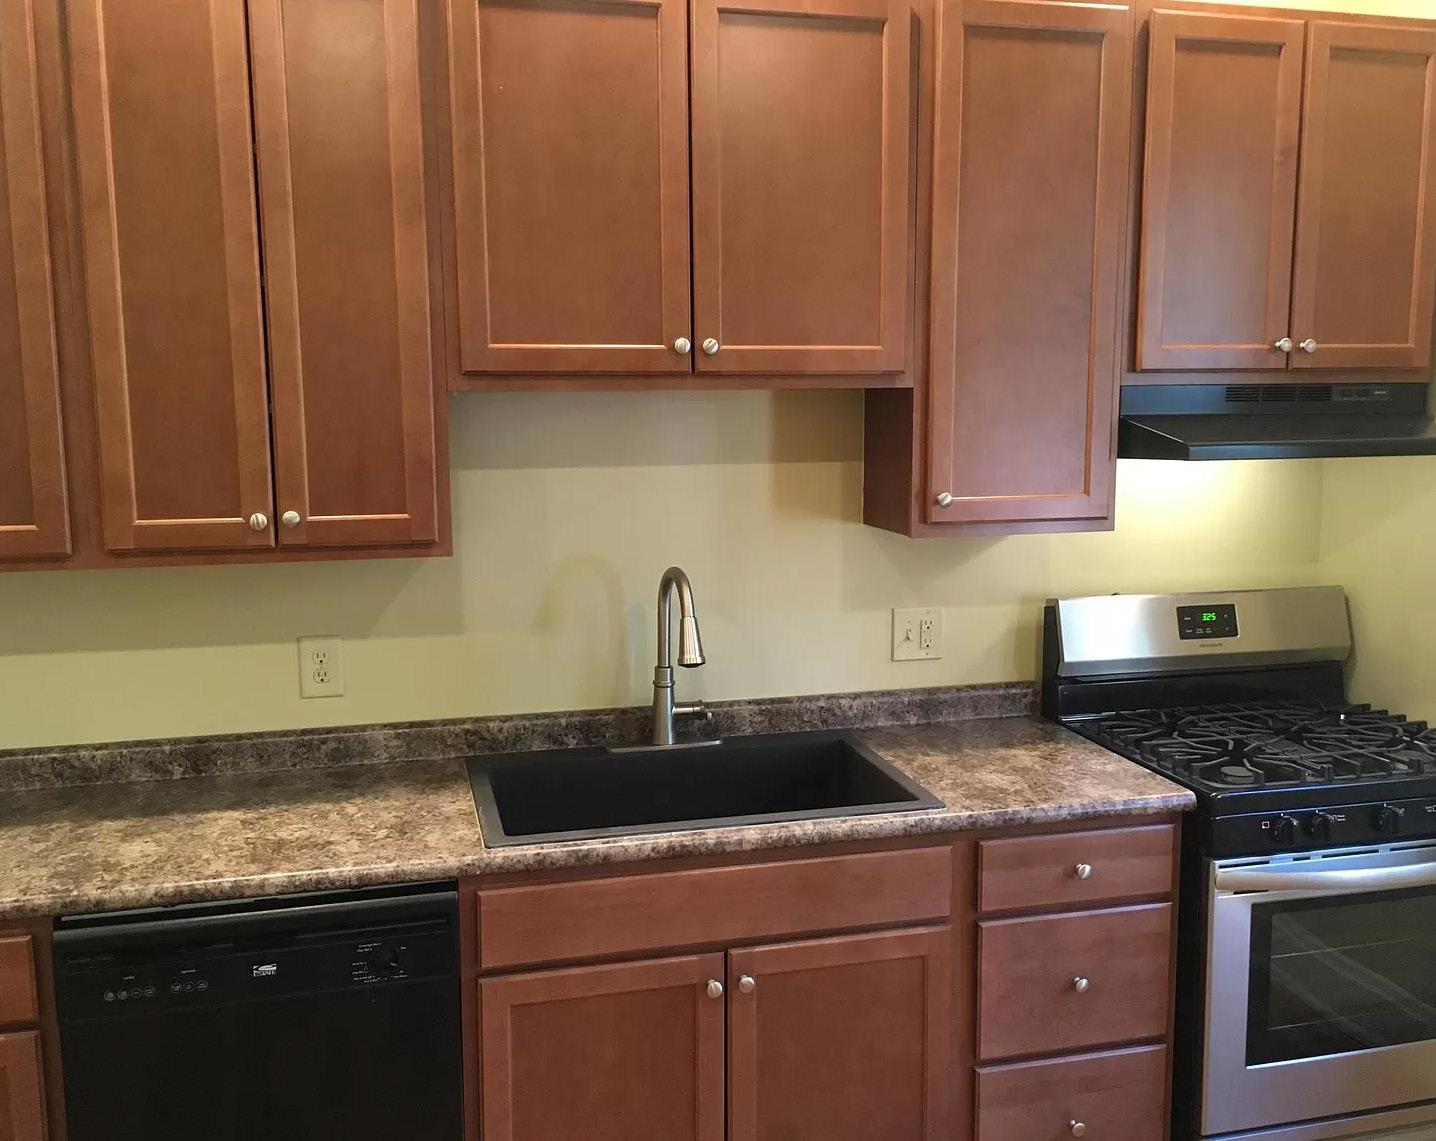
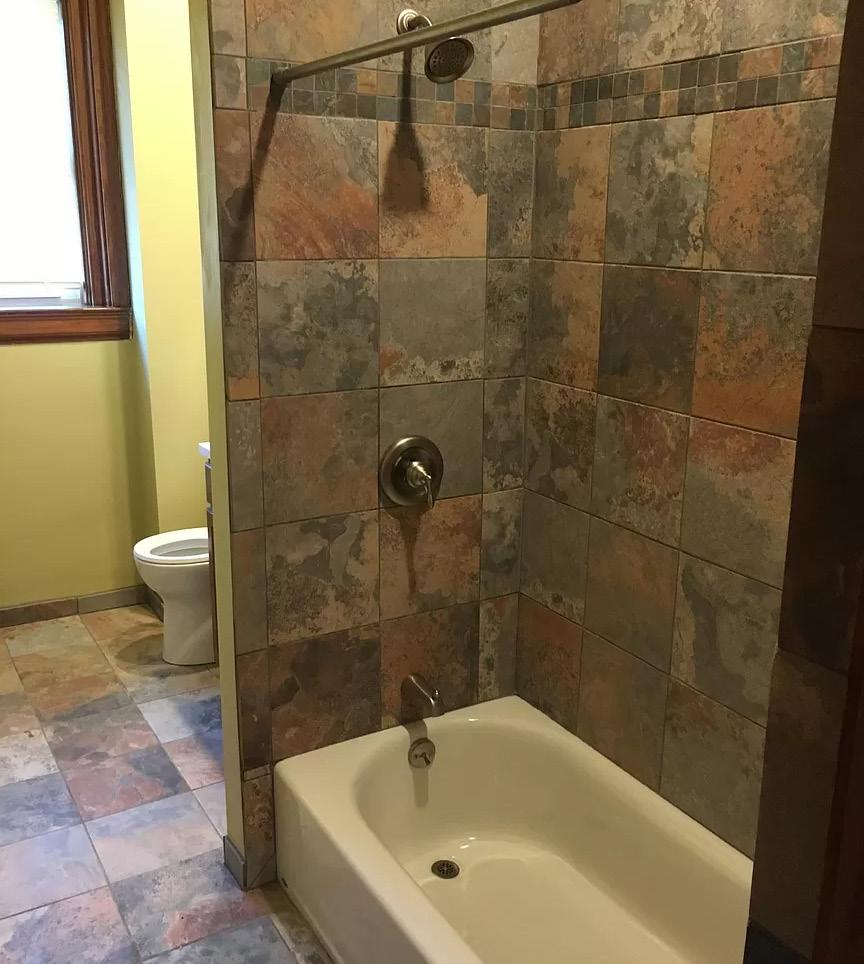
Property Address: 3901 Foral
City, State, Zip: Cincinnati, OH 45212
Submarket: Norwood
County: Hamilton
Year Built: 1900
Number Of Units: 4
Lot Size (Acres): .17
# of Buildings: 1
# of Stories: 2
# of Parcels: 1
Current Occupency: 100%
HVAC Type: Central
Parking Surface: Concrete Driveway
Garage/ Carport: 3
Parking Type: 3 Convered Off-Street
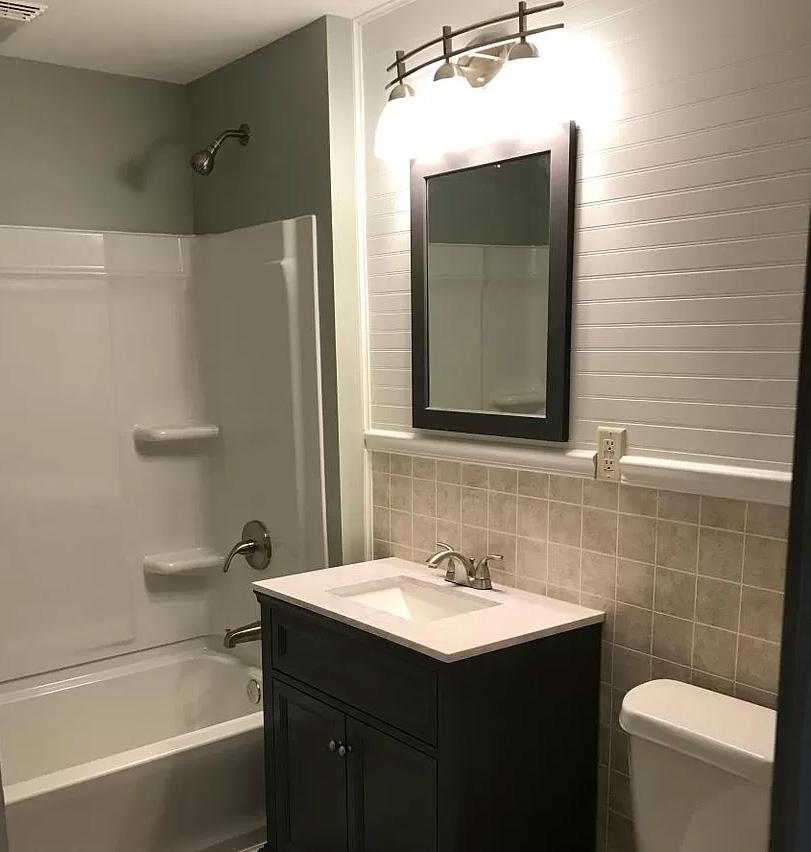
Average Unit Size: 1,500
Laundry: Community Laundry
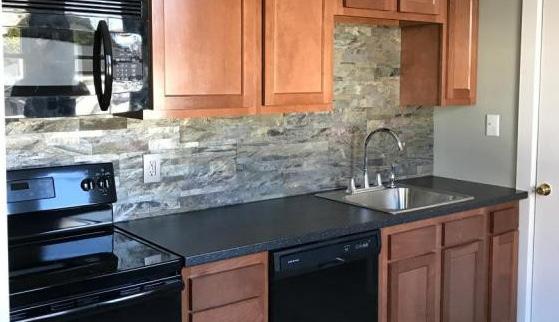
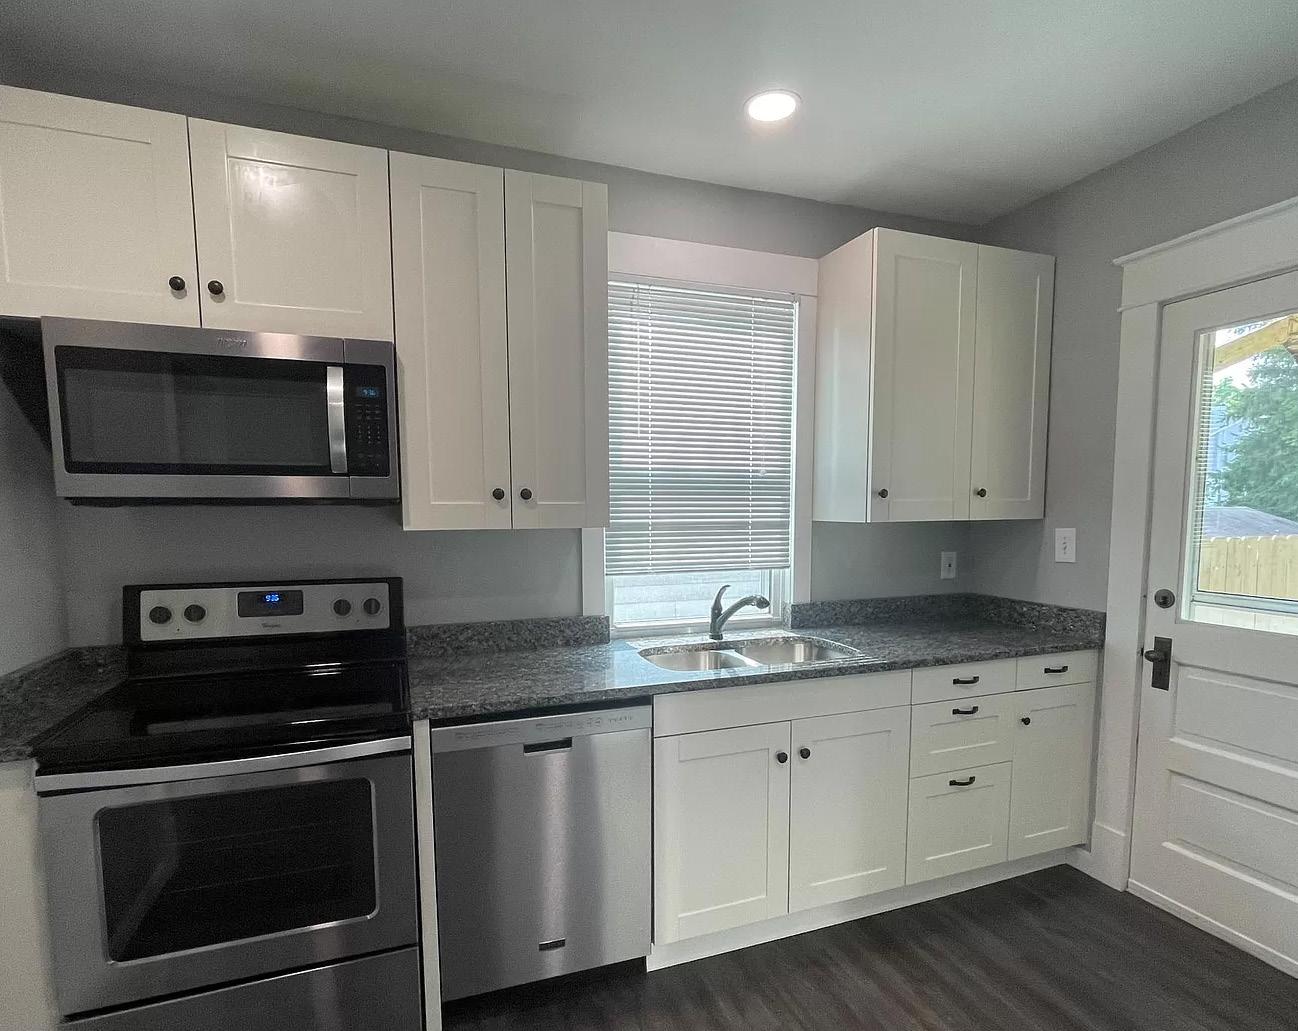
SECTION - THE INVESTMENT
01
Tenant
6
Pays: Owner Pays: Electric Gas Water/ Sewer with a $25 flat fee per Tenant Cable/ Internet
7
8

9
RENT MATRIX | Two Bedrooms

2617 Robertson Ave $1,350 2442 Robertson Ave $1,525 4329 Floral Ave $1,495 1826 Elm Ave $1,500 3901 Floral Ave $1,500 2241 Cleneay Ave $1,400 10
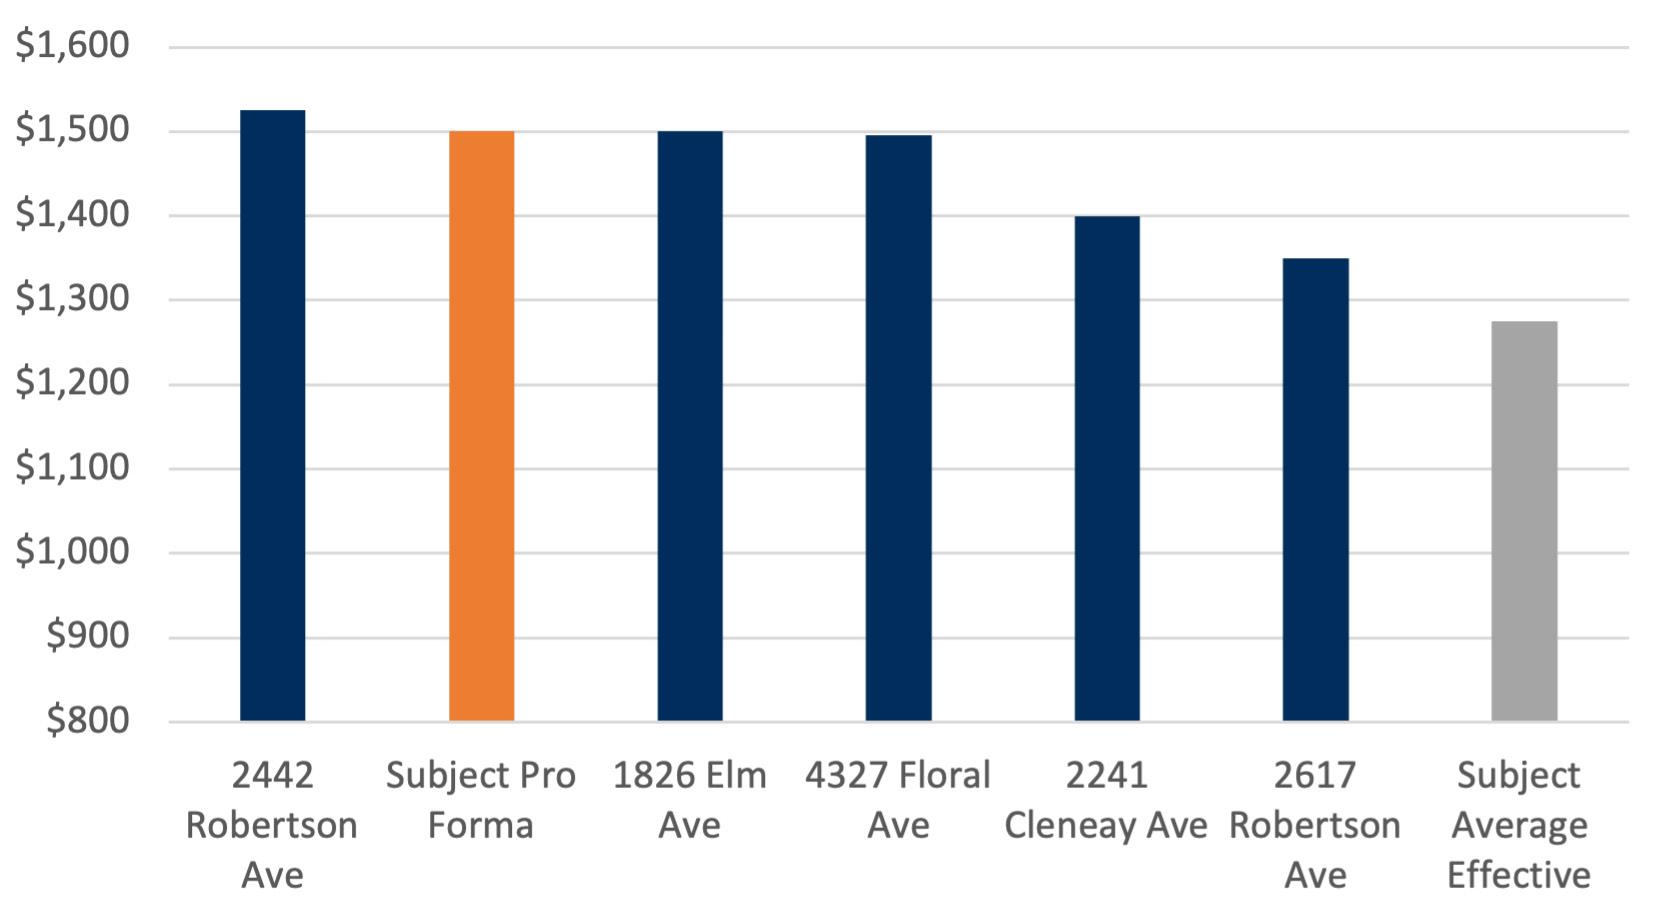
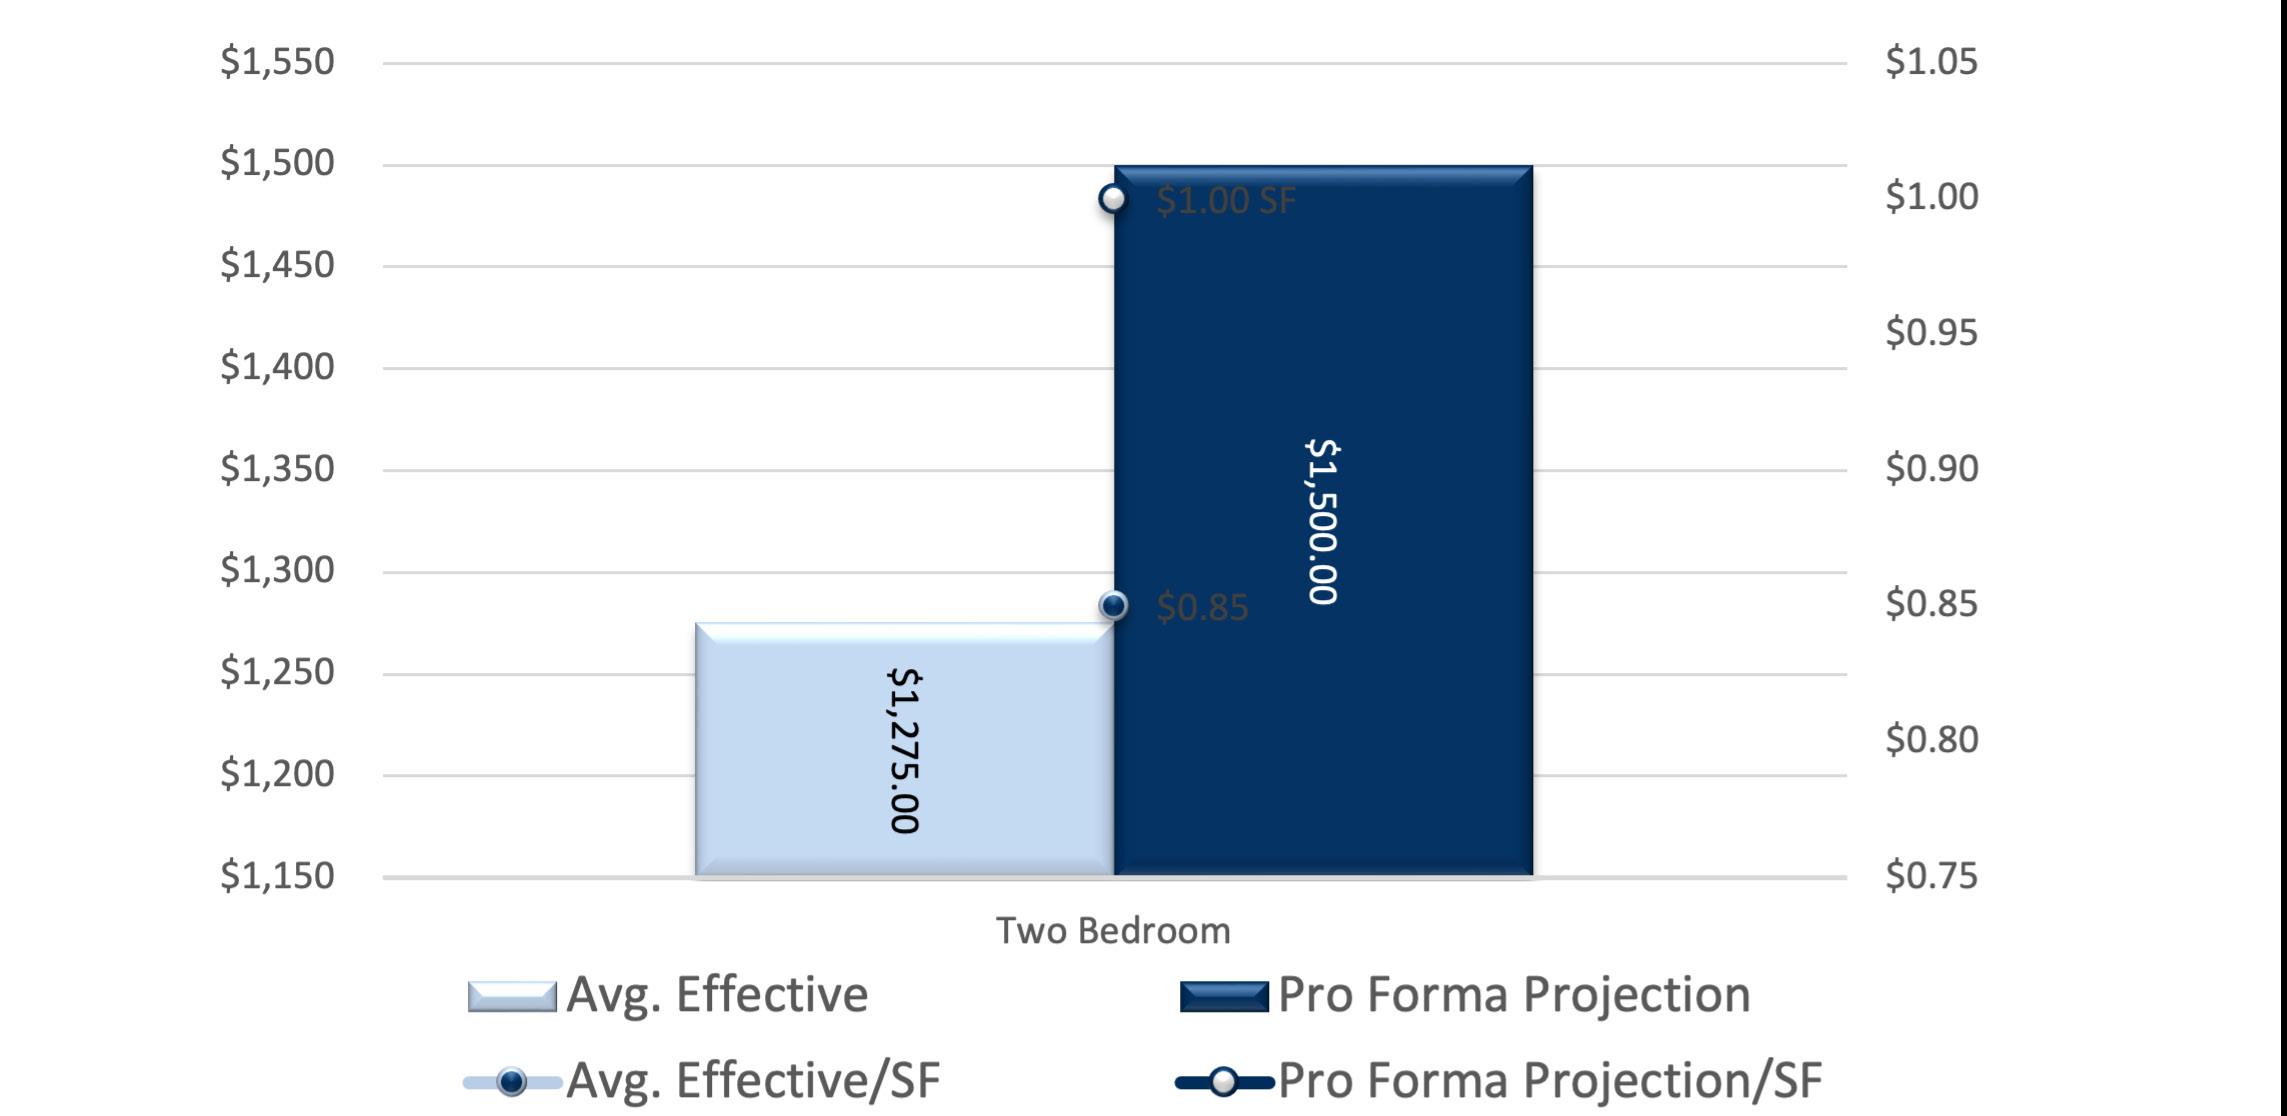
02 SECTIONLOCAL COMPETITORS Two Bedrooms Property Year Built # Units Avg SF Avg Rent Avg Rent/SF 2442 Robertson Ave 1912 2 1250 $1,525 $1.22 Subject Pro Forma 1900 4 1500 $1,500 $1.00 1826 Elm Ave 1900 2 950 $1,500 $1.58 4327 Floral Ave 2014 4 1600 $1,495 $0.93 2241 Cleneay Ave 1909 3 1000 $1,400 $1.40 2617 Robertson Ave 1914 2 800 $1,350 $1.69 Subject Average Effective 1900 4 1500 $1,275 $0.85 Market Average 1921 3 1229 $1,435 $1.17 11
UNITS 2 YEAR BUILT 1914 OCCUPANCY N/A UNIT MIX UNITS SQFT RENT RENT/SF Two Bedroom 2 800 $1,350 $1.69 UNITS 4 YEAR BUILT 2014 OCCUPANCY N/A UNIT MIX UNITS SQFT RENT RENT/SF Two Bedroom 4 1600 $1,495 $0.93 2617 Robertson Ave 4327 Floaral Ave 2617 Robertson 4327 Floral SECTION 2 - LOCAL COMPETITORS 12
13
UNIT MIX BREAKDOWN
3901 Floral - financials AVERAGE EFFECTIVE MARKET PROJECTED UNIT TYPE NO. OF UNITS RENTABLE SF TOTAL SF RENT/UNIT RENT/SF TOTAL RENT POTENTIAL RENT/UNIT RENT/SF TOTAL RENT POTENTIAL RENT/UNIT RENT/SF TOTAL RENT POTENTIAL
2BR/1BA 4 Units 1,500 SF 6,000 SF $1,275.00 $0.85 SF $5,100 $1,450.00 $0.97 SF $5,800 $1,500.00 $1.00 SF $6,000 Totals / Wtd. Averages 4 Units 1,500 SF 6,000 SF $1,275.00 $0.85 SF $5,100 $1,450.00 $0.97 SF $5,800 $1,500.00 $1.00 SF $6,000 Summary Two Bedroom 4 Units 1,500 SF 6,000 SF $1,275.00 $0.85 $5,100 $1,450.00 $0.97 SF $5,800 $1,500.00 $1.00 SF $6,000 Totals / Wtd. Averages 4 Units 1,500 SF 6,000 SF $1,275.00 $0.85 SF $5,100 $1,450.00 $0.97 SF $5,800 $1,500.00 $1.00 SF $6,000 03 SECTION - THE FINANCIALS 14
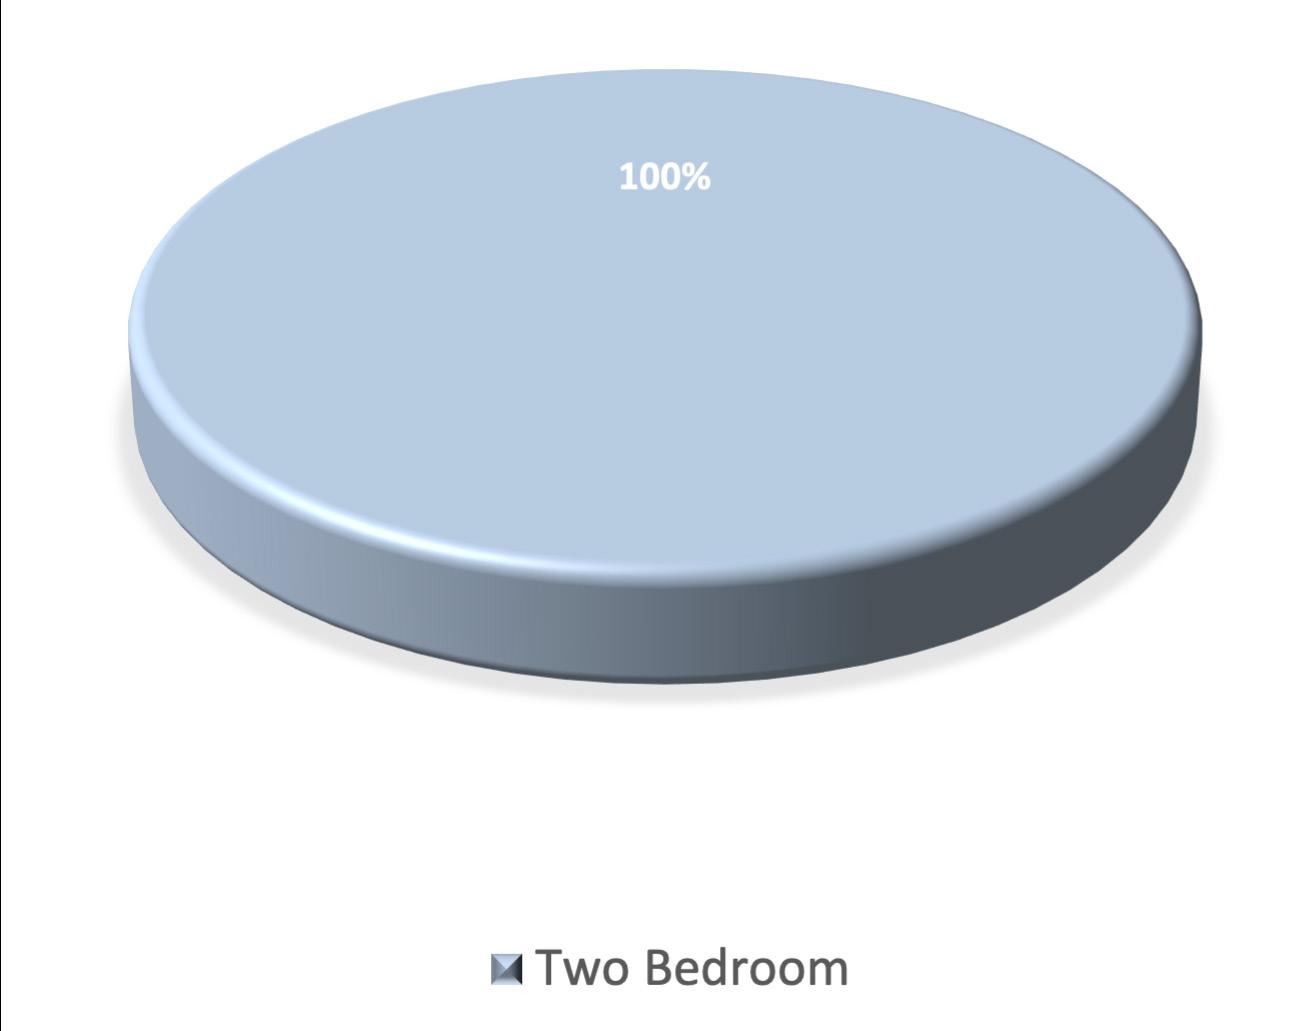
Two Bedroom
UNIT RENTS
UNIT DISTRIBUTION


15


3901 Floralfinancials EXPENSE INCOME UNDERWRITING NOTES # NOTE 1 Replacement & Reserves: added based on market norm of $255 per unit per year 2 100% occupancy on T12, added to reflect lender practices. CURRENT INCOME AND EXPENSES: JANUARY 2023 - DECEMBER 2023 GROSS POTENTIAL RENT % of GPR Per Unit All Units at Market Rent $69,600 RR 17,400 Gain (Loss) to Lease ($8,400) 12.07% (2,100) GROSS SCHEDULED RENT $61,200 RR 15,300 Other Income Laundry $2,400 T12 3.92% 600 Utility Income ($25/ $1,500 T12 2.45% 375 Total Other Income $3,900 6.37% 975 GROSS POTENTIAL INCOME $65,100 16,275 Economic Vacancy ($3,060) Added 5.00% (765) EFFECTIVE GROSS INCOME $62,040 82.93% 15,510 NON-CONTROLLABLE Real Estate Taxes % of EGI Per Unit 2023 Taxes $9,042 Auditor 14.57% 2,261 Adjustment for Sale $907 1.46% 227 Total Real Estate Taxes $9,950 16.04% 2,487 Insurance $2,890 T12 4.66% 723 Utilities Electric & Gas $2,179 T12 3.51% 545 Water & Sewage $4,949 T12 7.98% 1,237 Total Utilities $7,128 11.49% 1,782 Total Non-Controllable $19,968 32.19% 4,992 CONTROLLABLE Contract Services Landscaping/Grounds $1,000 1.61% 250 Pest Control $0 0.00% 0 Total Contract Services $1,000 1.61% 250 Repairs Maintenance & $0 0.00% 0 Replacement & Reserves $1,020 Note 1 1.64% 255 Total Controllable $2,020 3.26% 505 TOTAL EXPENSES $21,988 35.44% 5,497 NET OPERATING INCOME $40,052 64.56% 10,013 16
YEAR 1 YEAR 2 YEAR 3 % of GPR Per Unit % of GPR Per Unit % of GPR Per Unit $72,000 18,000 $74,160 18,540 $76,385 19,096 ($1,440) 2.00% (360) ($1,483) 2.00% (371) ($1,528) 2.00% (382) $70,560 17,640 $72,677 18,169 $74,857 18,714 $2,472 3.50% 618 $2,546 3.50% 637 $2,623 3.50% 656 $1,545 2.19% 386 $1,591 2.19% 398 $1,639 2.19% 410 $4,017 5.69% 1,004 $4,138 5.69% 1,034 $4,262 5.69% 1,065 $74,577 18,644 $76,814 19,204 $79,119 19,780 ($3,528) 5.00% (882) ($3,634) 5.00% (908) ($3,743) 5.00% (936) $71,049 93.00% 17,762 $73,180 93.00% 18,295 $75,376 93.00% 18,844 % of EGI % of EGI Per Unit % of EGI $9,042 12.73% 2,261 $9,042 12.36% 2,261 $9,042 12.36% 2,261 $907 1.28% 227 $907 1.24% 227 $907 1.24% 227 $9,950 14.00% 2,487 $9,950 13.60% 2,487 $9,950 13.60% 2,487 $2,200 3.10% 550 $2,244 3.07% 561 $2,289 3.13% 572 $2,222 3.13% 556 $2,267 3.10% 567 $2,312 3.16% 578 $5,048 7.11% 1,262 $5,149 7.04% 1,287 $5,252 7.18% 1,313 $7,271 10.23% 1,818 $7,416 10.13% 1,854 $7,564 10.34% 1,891 $19,420 27.33% 4,855 $19,610 26.80% 4,902 $19,803 27.06% 4,951 $1,000 1.41% 250 $1,020 1.39% 255 $1,040 1.42% 260 $140 0.20% 35 $143 0.20% 36 $146 0.20% 36 $1,140 1.60% 285 $1,163 1.59% 291 $1,186 1.62% 297 $4,000 5.63% 1,000 $4,080 5.58% 1,020 $4,162 5.69% 1,040 $1,040 1.46% 260 $1,061 1.45% 265 $1,082 1.48% 271 $6,180 8.70% 1,545 $6,304 8.61% 1,576 $6,430 8.79% 1,608 $25,601 36.03% 6,400 $25,914 35.41% 6,478 $26,233 35.85% 6,558 $45,448 63.97% 11,362 $47,267 64.59% 11,817 $49,143 67.15% 12,286 17
CURRENT YR 1 YR 2 YR 3 YR 4 YR 5 YR 6 YR 7 YE APR-2025 YE APR-2026 YE APR-2027 YE MAR-2028 YE MAR-2029 YE MAR-2030 YE MAR-2031 GROSS POTENTIAL RENT All Units at Market Rent $69,600 $72,000 $74,160 $76,385 $78,676 $81,037 $83,468 $85,972 Gain (Loss) to Lease ($8,400) ($1,440) ($1,483) ($1,528) ($1,574) ($1,621) ($1,669) ($1,719) GROSS SCHEDULED RENT $61,200 $70,560 $72,677 $74,857 $77,103 $79,416 $81,798 $84,252 OTHER
Laundry $2,400 $2,472 $2,546 $2,623 $2,675 $2,728 $2,783 $2,839 Utility Income ($25/person) $1,500 $1,545 $1,591 $1,639 $1,672 $1,705 $1,739 $1,774 TOTAL OTHER INCOME $3,900 $4,017 $4,138 $4,262 $4,347 $4,434 $4,522 $4,613 GROSS POTENTIAL INCOME $65,100 $74,577 $76,814 $79,119 $81,450 $83,850 $86,321 $88,865 Economic Vacancy ($3,060) ($3,528) ($3,634) ($3,743) ($3,855) ($3,971) ($4,090) ($4,213) EFFECTIVE GROSS INCOME $62,040 $71,049 $73,180 $75,376 $77,595 $79,879 $82,231 $84,653 Real Estate Taxes $9,950 $9,950 $9,950 $9,950 $10,149 $10,351 $10,559 $10,770 Insurance $2,890 $2,200 $2,244 $2,289 $2,335 $2,381 $2,429 $2,478 Utilities $7,128 $7,271 $7,416 $7,564 $7,716 $7,870 $8,027 $8,188 Contract Services $1,000 $1,140 $1,163 $1,186 $1,210 $1,234 $1,259 $1,284 Repairs Maintenance & Labor $0 $4,000 $4,080 $4,162 $4,245 $4,330 $4,416 $4,505 Replacement & Reserves $1,020 $1,040 $1,061 $1,082 $1,104 $1,126 $1,149 $1,172 TOTAL EXPENSES $21,988 $25,601 $25,914 $26,233 $26,758 $27,293 $27,839 $28,395 NET OPERATING INCOME $40,052 $45,448 $47,267 $49,143 $50,837 $52,586 $54,392 $56,257 INCOME EXPENSE 3901 Floralfinancials
Tax Breakdown Property Address Parcel ID Year Built Acres Market Value Assessed Value Tax Rate Taxes Payable Land Use Code 3901 Foral 651-0039-0369-00 1900 0.17 $374,880 $131,210 68.743551 $9,042.13 401 - APARTMENT, 4-19 UNITS Total 1.14 $1,946,790 $681,380 $55,979.29 18
INCOME
CASH FLOW

CASH FLOW PROJECTION GROWTH RATE ASSUMPTIONS YR 1 YR 2 YR 3 YR 4 YR 5
Gross Potential Rent 3.45% 3.00% 3.00% 3.00% 3.00% (Loss) / Gain to Lease* 2.00% 2.00% 2.00% 2.00% 2.00% Other Income 3.00% 3.00% 3.00% 3.00% 3.00% EXPENSES Expenses 2.00% 2.00% 2.00% 2.00% Management Fee** 0.00% 0.00% 0.00% 0.00% 0.00% CASH FLOW PROJECTION GROWTH RATE ASSUMPTIONS YR 1 YR 2 YR 3 YR 4 YR 5 Physical Vacancy 5.00% 5.00% 5.00% 5.00% 5.00% Non-Revenue Units 0.00% 0.00% 0.00% 0.00% 0.00% Bad Debt 0.00% 0.00% 0.00% 0.00% 0.00% Concessions Allowance 0.00% 0.00% 0.00% 0.00% 0.00% Total Economic Loss 5.00% 5.00% 5.00% 5.00% 5.00% 19
INCOME
CINCINNATI
THE ECONOMY
1| Prior to the pandemic, Cincinnati’s real gross metropolitan product grew at an average annual rate of 2.1% from 2015 to 2019. During that same five-year period, job growth averaged 1.4% annually, with roughly 15,500 jobs added on average each year. In 2020, COVID-19 mitigation measures and limited business activity caused the local economy to contract as much as 8.4% year-over-year in 2nd quarter. 2| In 2023, the metro’s inflation-adjusted economic output expanded 2.3%. 3| The metro recorded a net gain of 21,100 jobs, expanding the employment base 1.8%. 4| Cincinnati’s unemployment rate in November 2023 was unchanged year-over-year at 3.0%, below the national average of 3.5%. 5| Despite job losses stemming from the pandemic, Cincinnati’s current employment base now sits roughly 63,700 jobs or about 6% above the pre-pandemic level in February 2020.

3,263 units completed in past 12 months 5,184 units currently in progress

HIGHEST OVERALL PERFORMING SUBMARKET
RENT
1| Over the past five years, annual change in effective asking rents in Cincinnati ranged from 2.0% to 11.9%. 2| In 4th quarter 2023, effective asking rents for new leases were up 3.6% year-over- year. That annual rent performance was below the market’s five-year average of 5.7%. 3| Cincinnati’s recent annual rent change performance ranked #10 in the Midwest region and #27 nationally. 4| Looking at product classes in Cincinnati, Class B led for rent performance over the past five years. In 4th quarter 2023, annual effective rent change registered at 2.5% in Class A units, 3.4% in Class B units and 5.8% in Class C units. 5| Among submarkets, the strongest annual rent change performances over the past year were in West Cincinnati and Southeast Cincinnati. 6| The weakest performances were in Central Cincinnati, Butler County and North Central Cincinnati. Over the past five years, rent growth was strongest in Southeast Cincinnati.
LOCAL MARKET
Q4 2023 MARKET SNAPSHOT Pre-1970s 1970s 1980s 1990s 2000+ Occupancy 93.8% 95.4% 96.2% 94.8% 94.7% Y-O-Y Rent Growth 5.2% 3.5% 3.4% 3.0% 3.5% Average Rent Per Unit $1,094 $1,148 $1,283 $1,367 $1,732
SUBMARKETS RENT OCCUPANCY YOY Dent/Harrison $1,147 97.6% 11.0% Roselawn $1,022 92.5% 8.5% Mt Washington $1,155 94.7% 8.3% Mt Healthy $1,123 96.7% 8.1% Middletown/Franklin $969 94.1% 7.3% 20
SCAN FOR MORE

1| New apartment completions in Cincinnati were moderate recently, as 3,263 units delivered in 2023. That annual completion volume was a 24-year high. 2| With 150 units removed from existing stock over the past year, the local inventory base grew 1.9%. In the past year, supply was greatest in North Central Cincinnati. 3| Annual new supply averaged 1,754 units, and annual inventory growth averaged 1.0% over the past five years. During that period, new supply was concentrated in Central Cincinnati and Campbell/Kenton Counties, which received 42% of the market’s total completions. 4| At the end of 2023, there were 5,184 units under construction with 3,531 of those units scheduled to complete in the next four quarters. Scheduled deliveries in the coming year are expected to be concentrated in Central Cincinnati.
OCCUPANCY
1| Occupancy in the Cincinnati apartment market has ranged from 94.9% to 98.2% over the past five years, averaging 96.4% during that period. 2| Over the past year, occupancy lost 1.2 points, with the 4th quarter 2023 rate landing at 94.9%. 3| Looking at product classes in Cincinnati, 4th quarter 2023 occupancy registered at 94.1% in Class A units, 94.9% in Class B units and 95.6% in Class C units. 4| Occupancy in Class C product was generally tightest over the past five years. 5| Among submarkets, 4th quarter 2023 occupancy was strongest in Southeast Cincinnati and Campbell/Kenton Counties. 6| The weakest readings were seen in Central Cincinnati and North Central Cincinnati. During the coming year, occupancy in Cincinnati is expected to register around 95%.
HIGHEST OVERALL PERFORMING SUBMARKET

LOWEST OVERALL PERFORMING SUBMARKETS
UNITS UNDER CONSTRUCTION
SECTOR UNITS Central Cincinnati 1,747 Northeast Cincinnati/Warren County 811 Boone County/Erlanger 769 Campbell/Kenton Counties 497 Butler County 482 TOTAL FUTURE INVENTORY GROWTH SUBMARKET CHANGE Central Cincinnati 11.9% Boon County/Erlanger 7.0% Northeast Cincinnati/Warren County 4.8% Campbell/Kenton Counties 2.9% Butler County 2.4%
SUBMARKETS RENT OCCUPANCY YOY Dent/Harrison $1,147 97.6% 11.0% Roselawn $1,022 92.5% 8.5% Mt Washington $1,155 94.7% 8.3% Mt Healthy $1,123 96.7% 8.1% Middletown/Franklin $969 94.1% 7.3%
SUBMARKETS RENT OCCUPANCY YOY Fort Mitchell/Crescent Springs $1,162 96.1% 1.0% Fairfield $1,291 94.2% 1.0% Covington/Newport $1,608 93.9% 0.8% Clifton $1,038 90.6% -0.5% Downtown $1,786 94.6% -0.8
SUPPLY
21

3901 FLORAL

22