Broadleaf Arms OM

Page 1

Broadleaf arms OFFERING MEMORANDUM

CONTENTS

LEAD AGENTS

Jordan Dickman

First Vice President Investments

Cincinnati Office

D. 513.878.7735

jordan.dickman@marcusmillichap.com

Nick Andrews

First Vice President Investments

Cincinnati Office

D. 513.878.7741

nicholas.andrews@marcusmillichap.com

Austin Sum

Senior Associate

Cincinnati Office

D. 513.878.7747

austin.sum@marcusmillichap.com

“OUR COMMITMENT IS TO HELP OUR CLIENTS CREATE

AND PRESERVE WEALTH BY PROVIDING THEM WITH

THE BEST REAL ESTATE INVESTMENT SALES, FINANCING, RESEARCH AND ADVISORY SERVICES AVAILABLE.”

NON-ENDORSEMENT & DISCLAIMER NOTICE

CONFIDENTIALITY DISCLAIMER

THIS IS A BROKER PRICE OPINION OR COMPARATIVE MARKET ANALYSIS OF VALUE AND SHOULD NOT BE CONSIDERED AN APPRAISAL. This information has been secured from sources we believe to be reliable, but we make no representations or warranties, express or implied, as to the accuracy of the information. References to square footage or age are approximate. Buyer must verify the information and bears all risk for any inaccuracies.

NON-ENDORSEMENT NOTICE

Marcus & Millichap is not affiliated with, sponsored by, or endorsed by any commercial tenant or lessee identified in this marketing package. The presence of any corporation’s logo or name is not intended to indicate or imply affiliation with, or sponsorship or endorsement by, said corporation of Marcus & Millichap, its affiliates or subsidiaries, or any agent, product, service, or commercial listing of Marcus & Millichap, and is solely included for the purpose of providing tenant lessee information about this listing to prospective customers.

01 - THE INVESTMENT 02 - local competitors 03 - FINANCIALS 04 - LOCAL MARKET SECTIONS
06 26 34 46
CALABASAS, CALIFORNIA | HQ 2,500 | EMPLOYEES 80+ | OFFICES

UNRIVALED SUCCESS IN THE MIDWEST

YOUR TEAM

JORDAN DICKMAN

FIRST VICE PRESIDENTS DIRECTOR, NMHG

NICK ANDREWS

FIRST VICE PRESIDENTS DIRECTOR, NMHG

CORPORATE SUPPORT

LIZ POPP

MIDWEST OPERATIONS MANAGER

JOSH CARUANA

VICE PRESIDENT

REGIONAL MANAGER

INDIANAPOLIS | CINCINNATI | LOUISVILLE | ST LOUIS | KANSAS CITY

AUSTIN SUM

SENIOR INVESTMENT ASSOCIATE

BRIAN JOHNSTON

INVESTMENT ASSOCIATE

AUSTIN Hall

INVESTMENT ASSOCIATE

ALDEN SIMMS

INVESTMENT ASSOCIATE

BROKER SUPPORT

SAM PETROSino

VALUATION & RESEARCH

skyler WILSON

CLIENT RELATIONS MANAGER

JOHN SEBREE

SENIOR VICE PRESIDENT

NATIONAL DIRECTOR

NATIONAL MULTI HOUSING GROUP

MICHAEL GLASS

SENIOR VICE PRESIDENT

MIDWEST DIVISION MANAGER

NATIONAL DIRECTOR, MANUFACTURED HOME COMMUNITIES GROUP

BRITTANY CAMPBELL-KOCH

DIRECTOR OF OPERATIONS

ALEX PAPA

MARKETING COORDINATOR

THE INVESTMENT

01
broadleaf arms LOUISVILLE, KY 4519-4523 BROADLEAF DR, LOUISVILLE, KY UTILITY REIMBURSEMENT RENTAL GROWTH POTENTIAL DEVELOPMENT OPPORTUNITY IDEAL LOCATION WITH TOP-NOTCH EMPLOYMENT

Marcus & Millichap is pleased to present Broadleaf Arms, a 77-unit apartments complex in the Pleasure Ridge Park submarket. This property was purchased last year from long term owners of 50+ years. Current ownership has begun carving out a case to increase the bottom line, repositioning the asset to reflect the potential growth with rent increases, utility billbacks, and professional management.

Unit Mix Unit Type Number of Units Average Size In-Place Rents One Bedroom 53 800 $676 Two Bedroom 24 950 $775 All Units 77 875 $707

BROADLEAF ARMS INVESTMENT HIGHLIGHTS

THE OPPORTUNITY

An incoming investor can take advantage of the demand in the submarket and stabilize the property with a strategic marketing initiative using the following strategy:

THE MARKET

• Competitors in the immediate submarket are renting on average $925/mo ($845/mo utility adjusted) for 2-bedroom rents.

• Utility Transfer: Continue implementing a utility billback for water-sewer, and continue moving electric into tenants’ name upon lease-up and renewals.

• Area median income for the St Dennis submarket is on average $55,000, leaving rent to be 19% of household income, well-within the benchmark of investor tenant screening requirements.

• Loss-to-Lease Burn Off: $62/unit/month of loss to lease can be recaptured at lease renewals providing over $800k of value creation when factoring a 7 cap.

• The Pleasure Ridge Park submarket has experienced historically high occupancy, averaging 97.6%, over 220 bps above the Louisville market average. This points to the demand for rental units and further solidifies the opportunity available.

• Rental Growth Potential: Current owners purchased from long-term owners of 50+ years. They have raised rents 15% in June 2022 with rents being well-below market norms at that time. As ownership has focused on the utility billback and electric transfer upon renewals, there is an opportunity for a slight rent push to be more in line with market norms (see competive set).

DEAL SUMMARY

PROPERTY SUMMARY

#1 Bedrooms 53 #2 Bedrooms 24
68,358 77 847
RENTABLE SQUARE FEET TOTAL UNITS AVG SF BROADLEAF ARMS *

PROPERTY SNAPSHOT

BROADLEAF ARMS

Property Name: Broadleaf Arms

Property Address: 4519-4523 Broadleaf Dr

City, State, Zip: Louisville, KY 40216

County: Jefferson

Year Built/Reno: 1969/2022

Number Of Units: 77

Avg Unit Size: 847

Rentable Sqft: 68,358

Number of Parcels: 14

Lot Size (Acres): 2.8

# of Buildings: 7

# of Stories: 2

Parking: Paved Lot

Heating Boiler/ Baseboard Heat (2 Buildings)

Cooling Chiller (1 Building) / Window Units

Water Heater Gas Boiler System

Wiring Copper

Framing: Wood

Roofs Asphalt Shingles

Exterior of Building: Brick

Windows: Aluminum Frame single pane

UTILITIES

Electric: Tenant Paid

Gas: Tenant Paid

Water: Owner Paid*

Water billback implemented on lease renewals

Sewer: Owner Paid

Trash: Owner Paid

CASE STUDY UTILITY REIMBURSEMENT

Owners are implenting a $40 Water/Sewer billback on new leases and lease renewals. The schedule below shows an opportunity for an incoming investor to capture over $35,000 of additional income by implementing the billback.

WATER REIMBURSEMENT (RUB) Type Units Monthly RUB Monthly Income Gross Potential Income 1 Bed 53 $40 $2,120 $25,440 2 Bed 24 $40 $960 $11,520 Total 77 $3,080 $36,960
SCHEDULE Current Year 1 Year 2 Potential Annual Income $36,960 $36,960 Physical Vacancy 5% 5% % Implemented on New Leases and Lease Renewals 75% 100% Annual Water RUB Income $26,334 $35,112
IMPLEMENTATION

ELECTRIC MOVED TO RESIDENTS NAME

Electric was initially paid by owners. Over the past 12 months, owners have moved electric into residents’ name on new leases reducing electric expense by over 90% when comparing the T3 average electric expense to the first few months of ownership.

trendline

3-month rolling avg

3 MONTH ROLLING AVG MONTHLY ELECTRIC expense

.88 ACRES AVAILABLE FOR ADDITIONAL APARTMENT DEVELOPMENT

LAND DEVELOPMENT OPPORTUNITY

BOUNDARIES ARE APPROXIMATE

CASE STUDY RECENT CAPEX

1. Parking lot 2. new roof on two buildings 3. Security system installed
1 1 3 4
4. striped lots
2 4 3

BROADLEAF ARMS

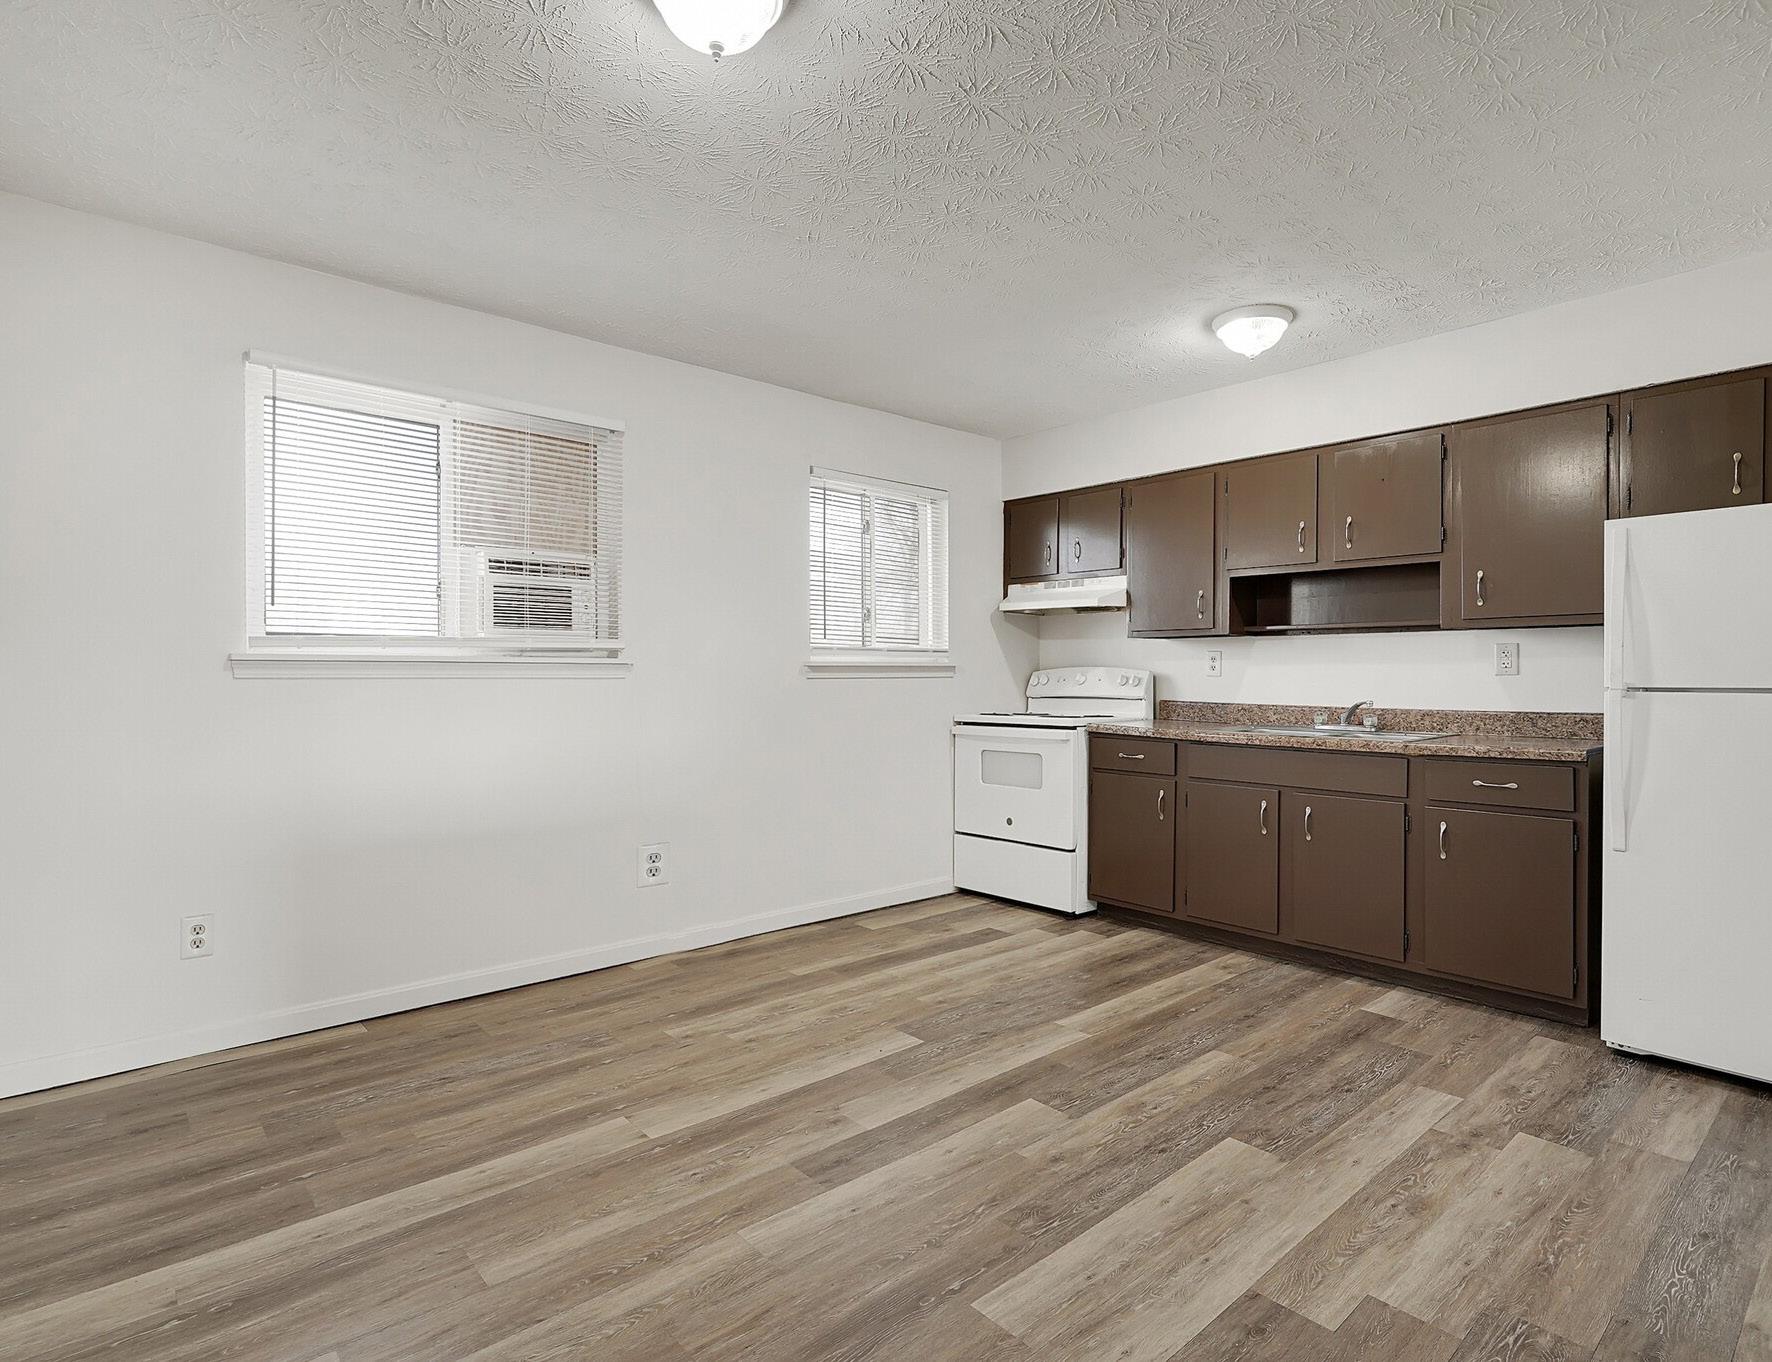
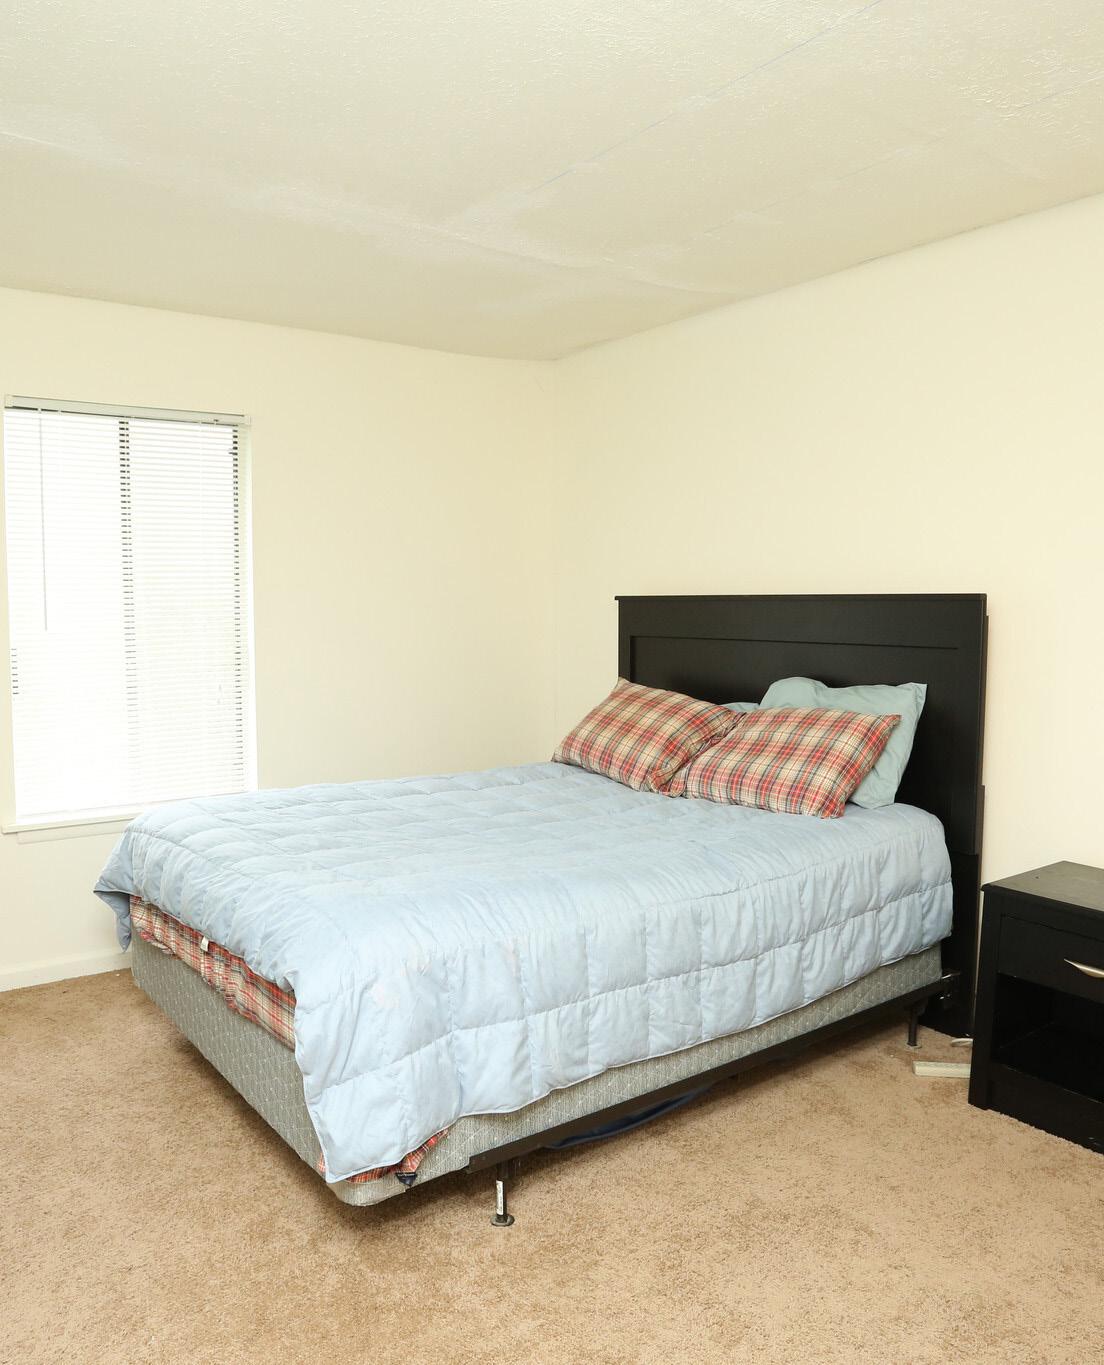
interior photos

BROADLEAF ARMS

exterior photos

BROADLEAF ARMS

EXTERIOR photos

rent competitors

02
1 SUMMITT APARTMENTS 2 GREENWOOD PLACE 3 3410 SHAGBARK ROAD 4 3404 SHAGBARK ROAD RENT COMPARABLES 2 4 1 3
COMPS * BROADL E AF ARMS 1 BED - $725 2 BED - $825 3410SH A GBARK R D 1 BED - $795 2 BED - $900 3404SH A GBARK R D 2 BED - $950 GREEWN WOOD AP T S 1 BED - $815 2 BED - $975
MITAPTS 1 BED - $830 2 BED - $999
LOCATION
THESUM

ONE BEDROOM

TWO BEDROOM

Property Year Built # of 1 Beds SF Market Rent Utility Adjustment/Month Net Rent/SF Occupancy Ashby Green Apartment Homes 2014 100 700 $1,020.00 $15 $1.44 95% Riverport Landing Family Apartments 2019 48 850 $871.00 $55 $0.96 97% Summit Apartments 1973 24 733 $830.00 $55 $1.06 100% Broadleaf Arms Pro Forma 1969 53 800 $825.00 $15 $1.03 95% Greenwood Place Apartments 1994 120 700 $815.00 $55 $1.09 100% 4806 Saddlebrook Lane 1960 12 470 $750.00 $0 $1.60 95% Walnut Grove Apartments 2003 16 750 $755.00 $15 $0.99 98% 3410 Shagbark 1970 20 850 $795.00 $85 $0.84 100% Broadleaf Arms Average Effective 1969 53 800 $675.00 $55 $0.84 83% Coventry Commons 2009 54 631 $660.00 $55 $0.96 100%
Property Year Built # of 2 Beds SF Market Rent Utility Adjustment/Month Net Rent/SF Occupancy Ashby Green Apartment Homes 2014 144 1157 $1,180.00 $15 $1.01 95% Kensington 1974 136 825 $1,094.00 $15 $1.31 100% Crawford Crossing Apartments 2011 30 963 $1,029.00 $0 $1.07 94% Riverport Landing Family Apartments 2019 144 1072 $1,046.00 $65 $0.92 97% Summit Apartments 1973 120 846 $999.00 $65 $1.10 100% Iroquois Terrace 1991 32 1100 $975.00 $65 $0.83 100% Greenwood Place Apartments 1994 160 1107 $975.00 $65 $0.82 95% 3404 Shagbark Rd 1970 14 900 $950.00 $65 $0.98 93% Broadleaf Arms Pro Forma 1969 24 950 $935.00 $15 $0.98 95% Walnut Grove Apartments 2003 96 859 $880.00 $15 $1.01 98% 4910-4914 Saddlebrook 1970 16 996 $850.00 $0 $0.85 95% 4806 Saddlebrook Lane 1960 2 850 $850.00 $0 $1.00 95% 3410 Shagbark 1970 10 750 $900.00 $105 $1.06 100% Safe Harbor 2004 40 950 $834.00 $65 $0.81 100% Coventry Commons 2009 117 817 $798.00 $65 $0.90 100% Braodleaf Arms Average Effective 1969 24 950 $775.00 $65 $0.82 83%
UNITS 144 YEAR BUILT 1973/ UNDER RENO OCCUPANCY 100% UNIT MIX # Units Unit SF Rent Rent/SF 1 Bed 24 733 $830 $1.13 2 Bed 120 846 $999 $1.18 AMENITIES Laundry Facilities Pool Maintenance on site Property Manager on Site Pet Play Area UNIT FEATURES Dining Room Tub/Shower Dishwasher Disposal Walk-In Closets Washer/Dryer Hookup High Speed Internet Access Window Coverings Air Conditioning Kitchen Cable Ready SUMMIT APARTMENTS

GREENWOOD PLACE APTS

AMENITIES Clubhouse Pool Laundry Facilities UNIT FEATURES Air Conditioning Disposal Cable Ready Heating Carpet High Speed Internet Access Ceiling Fans Walk-In Closets Dishwasher
UNITS 280 YEAR BUILT 1994 OCCUPANCY 100% UNIT MIX # OF UNITS SQFT RENT RENT/SF 1 Bed 120 700 $815 $1.16 2 Bed 160 1,107 $975 $0.88
UNITS 30 YEAR BUILT 1979 OCCUPANCY 100% UNIT MIX # Units Unit SF Rent Rent/SF 1 Bed 20 850 $795 $0.94 2 Bed 10 750 $900 $1.20 UNIT FEATURES Air Conditioning Range Kitchen Refrigerator UTILITIES Owner Pays Utilities 3410 SHAGBARK RD

3404 SHAGBARK RD

UNIT FEATURES

Air Conditioning Range Kitchen Refrigerator UTILITIES Owner Pays Water
UNITS 14 YEAR BUILT 1970 OCCUPANCY 93% UNIT MIX # OF UNITS SQFT RENT RENT/SF 2 Bed 14 900 $950 $1.06

the financials

03

BROADLEAF ARMS - FINANCIALS

UNIT MIX SUMMARY

AVERAGE EFFECTIVE MARKET PROJECTED UNIT TYPE NO. OF UNITS RENTABLE SF TOTAL SF RENT/UNIT RENT/SF TOTAL RENT POTENTIAL RENT/UNIT RENT/SF TOTAL RENT POTENTIAL RENT/UNIT RENT/SF TOTAL RENT POTENTIAL SUMMARY One Bedroom 53 Units 800 SF 42,400 SF $675.78 $0.84 $35,816 $725.00 $0.91 SF $38,425 $825.00 $1.03 SF $43,725 Two Bedroom 24 Units 950 SF 22,800 SF $774.89 $0.82 $18,597 $825.00 $0.87 SF $19,800 $935.00 $0.98 SF $22,440 Totals / Wtd. Averages 77 Units 847 SF 65,200 SF $706.67 $0.83 SF $54,414 $756.17 $0.89 SF $58,225 $859.29 $1.01 SF $66,165
VACANCY
NEW LEASES PRICE/SQFT APR 22 - FEB 23 APR 22 - FEB 23
LEASING TRENDS

BROADLEAF ARMS - FINANCIALS UNIT MIX BREAKDOWN

AVERAGE EFFECTIVE MARKET PROJECTED UNIT TYPE NO. OF UNITS RENTABLE SF TOTAL SF RENT/UNIT RENT/SF TOTAL RENT POTENTIAL RENT/UNIT RENT/SF TOTAL RENT POTENTIAL RENT/UNIT RENT/SF TOTAL RENT POTENTIAL One Bedroom 1BR/1BA 53 Units 800 SF 42,400 SF $675.78 $0.84 SF $35,816 $725.00 $0.91 SF $38,425 $825.00 $1.03 SF $43,725 Totals / Wtd. Averages 53 Units 800 SF 42,400 SF $675.78 $0.84 SF $35,816 $725.00 $0.91 SF $38,425 $825.00 $1.03 SF $43,725 Two Bedroom 2BR/1BA 24 Units 950 SF 22,800 SF $774.89 $0.82 SF $18,597 $825.00 $0.87 SF $19,800 $935.00 $0.98 SF $22,440 Totals / Wtd. Averages 24 Units 950 SF 22,800 SF $774.89 $0.82 SF $18,597 $825.00 $0.87 SF $19,800 $935.00 $0.98 SF $22,440

GROSS POTENTIAL RENT OPERATING EXPENSES

UNIT DISTRIBUTION UNIT RENTS

BROADLEAF ARMS - FINANCIALS

LOss TO LEASE BURN OFF

LOSS TO LEASE BURN-OFF

LEASE EXPIRATION SCHEDULE
BROADLEAF ARMSFINANCIALS CURRENT RENT ROLL: AS OF JULY 19, 2023 INCOME & EXPENSES: JULY 2022 - JUNE 2023 YEAR 1 GROSS POTENTIAL RENT % of GPR Per Unit % of GPR Per Unit All Units at Market Rent $696,900 T2 9,051 $793,980 10,311 Gain (Loss) to Lease ($37,602) T2 5.40% (488) ($39,699) 5.00% (516) GROSS SCHEDULED RENT $659,298 8,562 $754,281 9,796 Other Income Late Charges $19,180 T12 2.91% 249 $6,713 Note 2 0.89% 87 Miscellaneous Charges $10,922 T12 1.66% 142 $11,249 1.49% 146 Electric Reimbursement $9,076 T3 1.38% 118 $9,348 1.24% 121 Media/Licensing Contract $6,083 T12 0.92% 79 $6,265 0.83% 81 Water Reimbursement $4,846 T3 0.74% 63 $4,992 0.66% 65 Non Refundable Fees $2,990 T12 0.45% 39 $3,080 0.41% 40 Total Other Income $53,456 8.11% 694 $42,017 5.57% 546 GROSS POTENTIAL INCOME $712,754 9,257 $796,298 10,342 Physical Vacancy ($115,419) T2 17.51% (1,499) ($37,714) 5.00% (490) Employee Unit ($8,700) T2 1.32% (113) $0 0.00% 0 Bad Debt ($12,955) T2 1.96% (168) ($7,543) 1.00% (98) Concessions Allowance ($23,118) T2 3.51% (300) ($7,543) 1.00% (98) EFFECTIVE GROSS INCOME $552,562 70.31% 7,176 $743,499 88.00% 9,656 NON-CONTROLLABLE Real Estate Taxes % of EGI Per Unit % of EGI 2021 Taxes Paid $19,888 Auditor 3.60% 258 $19,888 2.67% 258 Adjustment for Sale $43,213 7.82% 561 $43,213 5.81% 561 Total Real Estate Taxes $63,101 11.42% 819 $63,101 8.49% 819 Insurance $22,062 T12 3.99% 287 $30,800 4.14% 400 Utilities Electric $12,123 Note 3 2.19% 157 $7,255 0.98% 94 Electric Vacant $11,939 Note 3 2.16% 155 $6,363 Note 5 0.86% 83 Gas $37,339 T12 6.76% 485 $38,086 5.12% 495 Gas Vacant $2,433 T12 0.44% 32 $2,482 0.33% 32 Water & Sewage $79,772 T12 14.44% 1,036 $50,820 Note 8 6.84% 660 Trash Removal $9,408 T12 1.70% 122 $9,596 1.29% 125 Total Utilities $153,015 27.69% 1,987 $114,602 15.41% 1,488 Total Non-Controllable $238,178 43.10% 3,093 $208,503 28.04% 2,708 CONTROLLABLE Contract Services Security Expense $5,128 Note 4 0.93% 67 $0 Note 4 0.00% 0 Snow Removal $0 0.00% 0 $2,695 Note 9 0.36% 35 Landscaping/Grounds $18,392 T12 3.33% 239 $11,550 Note 9 1.55% 150 Pest Control $15,749 T12 2.85% 205 $1,925 0.26% 25 Total Contract Services $39,269 7.11% 510 $16,170 2.17% 210 Repairs & Maintenance $40,351 T12 7.30% 524 $46,200 6.21% 600 Marketing & Promotion $11,636 T12 2.11% 151 $5,775 0.78% 75 On-Site Payroll $18,787 T12 3.40% 244 $69,300 9.32% 900 Payroll Taxes & Benefits $1,463 T12 0.26% 19 $7,700 1.04% 100 General & Administrative $17,673 T12 3.20% 230 $11,550 1.55% 150 Management Fee $22,800 T12 4.13% 296 $29,740 4.00% 386 Telephone & Cable $2,176 T12 0.39% 28 $1,925 0.26% 25 Replacement & Reserves $19,635 Note 1 3.55% 255 $20,028 2.69% 260 Total Controllable $173,790 31.45% 2,257 $208,388 28.03% 2,706 TOTAL EXPENSES $411,968 74.56% 5,350 $416,891 56.07% 5,414 NET OPERATING INCOME $140,594 25.44% 1,826 $326,608 43.93% 4,242 EXPENSE INCOME INCOME
& EXPENSES

# NOTE

UNDERWRITING NOTES

1 Replacement & Reserves: added based on market norm of $255 per unit per year

2 Late Charges: Not annualized. Normalized down 'Year 1' to 35% of trailing

3 Bad Debt: Not annualized

4 Electric: T3'd showing normal electric once elctric put in tenants name

5 Gas: T9 Normalized

6 Security: One-time expense, per owner conversation. Removed from trailing

7 Water/Sewer Reimbursement: $40/month RUB at 95% occup, implemented on lease

8 Water: Normalized down 'Year 1'

9 Snow/Land: Consolidated on trailing, broken out starting 'Year 1'

YEAR 2 YEAR 3 % of GPR Per Unit % of GPR Per Unit $817,799 10,621 $842,333 10,939 ($16,356) 2.00% (212) ($16,847) 2.00% (219) $801,443 10,408 $825,487 10,721 $6,914 0.86% 90 $7,122 0.86% 92 $11,587 1.45% 150 $11,934 1.45% 155 $9,629 1.20% 125 $9,918 1.20% 129 $6,453 0.81% 84 $6,647 0.81% 86 $5,141 0.64% 67 $5,296 0.64% 69 $3,172 0.40% 41 $3,267 0.40% 42 $43,278 5.40% 562 $44,576 5.40% 579 $844,721 10,970 $870,063 11,300 ($40,072) 5.00% (520) ($41,274) 5.00% (536) $0 0.00% 0 $0 0.00% 0 ($8,014) 1.00% (104) ($8,255) 1.00% (107) ($8,014) 1.00% (104) ($8,255) 1.00% (107) $788,620 91.00% 10,242 $812,279 91.00% 10,549 % of EGI Per Unit % of EGI Per Unit $19,888 2.52% 258 $19,888 2.52% 258 $43,213 5.48% 561 $43,213 5.48% 561 $63,101 8.00% 819 $63,101 8.00% 819 $31,416 3.98% 408 $32,044 4.06% 416 $7,400 0.94% 96 $7,548 0.96% 98 $6,490 0.82% 84 $6,620 0.84% 86 $38,848 4.93% 505 $39,625 5.02% 515 $2,531 0.32% 33 $2,582 0.33% 34 $51,836 6.57% 673 $52,873 6.70% 687 $9,788 1.24% 127 $9,984 1.27% 130 $116,894 14.82% 1,518 $119,232 15.12% 1,548 $211,411 26.81% 2,746 $214,378 27.18% 2,784 $0 0.00% 0 $0 0.00% 0 $2,749 0.35% 36 $2,804 0.36% 36 $11,781 1.49% 153 $12,017 1.52% 156 $1,964 0.25% 26 $2,003 0.25% 26 $16,493 2.09% 214 $16,823 2.13% 218 $47,124 5.98% 612 $48,066 6.10% 624 $5,891 0.75% 77 $6,008 0.76% 78 $70,686 8.96% 918 $72,100 9.14% 936 $7,854 1.00% 102 $8,011 1.02% 104 $11,781 1.49% 153 $12,017 1.52% 156 $31,545 4.00% 410 $32,491 4.00% 410 $1,964 0.25% 26 $2,003 0.25% 26 $20,428 2.59% 265 $20,837 2.64% 271 $213,765 27.11% 2,776 $218,356 27.57% 2,824 $425,177 53.91% 5,522 $432,734 54.87% 5,620 $363,443 46.09% 4,720 $379,545 48.13% 4,929
CURRENT YR 1 YR 2 YR 3 YR 4 YR 5 YR 6 YR 7 YR 8 YR 9 YR 10 YE FEB-2024 YE JAN-2025 YE JAN-2026 YE JAN-2027 YE JAN-2028 YE JAN-2029 YE JAN-2030 YE JAN-2031 YE JAN-2032 YE JAN-2033 GROSS POTENTIAL RENT All Units at Market Rent $696,900 $793,980 $817,799 $842,333 $867,603 $893,631 $920,440 $948,054 $976,495 $1,005,790 $1,035,964 Gain (Loss) to Lease ($37,602) ($39,699) ($16,356) ($16,847) ($17,352) ($17,873) ($18,409) ($18,961) ($19,530) ($20,116) ($20,719) GROSS SCHEDULED RENT $659,298 $754,281 $801,443 $825,487 $850,251 $875,759 $902,032 $929,093 $956,965 $985,674 $1,015,245 Total Other Income $53,456 $42,017 $43,278 $44,576 $45,468 $46,377 $47,304 $48,251 $49,216 $50,200 $51,204 GROSS POTENTIAL INCOME $712,754 $796,298 $844,721 $870,063 $895,719 $922,136 $949,336 $977,343 $1,006,181 $1,035,874 $1,066,448 Physical Vacancy ($115,419) ($37,714) ($40,072) ($41,274) ($42,513) ($43,788) ($45,102) ($46,455) ($47,848) ($49,284) ($50,762) Employee Unit ($8,700) $0 $0 $0 $0 $0 $0 $0 $0 $0 $0 Bad Debt ($12,955) ($7,543) ($8,014) ($8,255) ($8,503) ($8,758) ($9,020) ($9,291) ($9,570) ($9,857) ($10,152) Concessions Allowance ($23,118) ($7,543) ($8,014) ($8,255) ($8,503) ($8,758) ($9,020) ($9,291) ($9,570) ($9,857) ($10,152) EFFECTIVE GROSS INCOME $552,562 $743,499 $788,620 $812,279 $836,201 $860,833 $886,194 $912,307 $939,193 $966,877 $995,381 Real Estate Taxes $63,101 $63,101 $63,101 $63,101 $64,363 $65,650 $66,963 $68,303 $69,669 $71,062 $72,483 Insurance $22,062 $30,800 $31,416 $32,044 $32,685 $33,339 $34,006 $34,686 $35,380 $36,087 $36,809 Utilities $153,015 $114,602 $116,894 $119,232 $121,617 $124,049 $126,530 $129,061 $131,642 $134,275 $136,960 Contract Services $39,269 $16,170 $16,493 $16,823 $17,160 $17,503 $17,853 $18,210 $18,574 $18,946 $19,325 Repairs & Maintenance $40,351 $46,200 $47,124 $48,066 $49,028 $50,008 $51,009 $52,029 $53,069 $54,131 $55,213 Marketing & Promotion $11,636 $5,775 $5,891 $6,008 $6,128 $6,251 $6,376 $6,504 $6,634 $6,766 $6,902 On-Site Payroll $18,787 $69,300 $70,686 $72,100 $73,542 $75,013 $76,513 $78,043 $79,604 $81,196 $82,820 Payroll Taxes & Benefits $1,463 $7,700 $7,854 $8,011 $8,171 $8,335 $8,501 $8,671 $8,845 $9,022 $9,202 General & Administrative $17,673 $11,550 $11,781 $12,017 $12,257 $12,502 $12,752 $13,007 $13,267 $13,533 $13,803 Management Fee $22,800 $29,740 $31,545 $32,491 $33,448 $34,433 $35,448 $36,492 $37,568 $38,675 $39,815 Telephone & Cable $2,176 $1,925 $1,964 $2,003 $2,043 $2,084 $2,125 $2,168 $2,211 $2,255 $2,301 Replacement & Reserves $19,635 $20,028 $20,428 $20,837 $21,254 $21,679 $22,112 $22,554 $23,006 $23,466 $23,935 TOTAL EXPENSES $411,968 $416,891 $425,177 $432,734 $441,695 $450,846 $460,188 $469,728 $479,468 $489,413 $499,568 NET OPERATING INCOME $140,594 $326,608 $363,443 $379,545 $394,506 $409,987 $426,005 $442,579 $459,725 $477,464 $495,813 INCOME EXPENSE BROADLEAF
FINANCIALS
ARMS
CASH FLOW
CASH FLOW PROJECTION GROWTH RATE ASSUMPTIONS YR 1 YR 2 YR 3 YR 4 YR 5 YR 6 YR 7 YR 8 YR 9 Income Gross Potential Rent 13.93% 3.00% 3.00% 3.00% 3.00% 3.00% 3.00% 3.00% 3.00% (Loss) / Gain to Lease* 5.00% 2.00% 2.00% 2.00% 2.00% 2.00% 2.00% 2.00% 2.00% Other Income 3.00% 3.00% 3.00% 3.00% 3.00% 3.00% 3.00% 3.00% 3.00% Expenses Expenses 2.00% 2.00% 2.00% 2.00% 2.00% 2.00% 2.00% 2.00% Management Fee** 4.00% 4.00% 4.00% 4.00% 4.00% 4.00% 4.00% 4.00% 4.00% CASH FLOW PROJECTION GROWTH RATE ASSUMPTIONS YR 1 YR 2 YR 3 YR 4 YR 5 YR 6 YR 7 YR 8 YR 9 Physical Vacancy 5.00% 5.00% 5.00% 5.00% 5.00% 5.00% 5.00% 5.00% 5.00% Non-Revenue Units 0.00% 0.00% 0.00% 0.00% 0.00% 0.00% 0.00% 0.00% 0.00% Bad Debt 1.00% 1.00% 1.00% 1.00% 1.00% 1.00% 1.00% 1.00% 1.00% Concessions Allowance 1.00% 1.00% 1.00% 1.00% 1.00% 1.00% 1.00% 1.00% 1.00% Total Economic Loss 7.00% 7.00% 7.00% 7.00% 7.00% 7.00% 7.00% 7.00% 7.00% Tax Breakdown Property Address Parcel ID Year Built Acres Market Value Assessed Value Tax Rate Taxes Payable Land Use Code 4519-4527 Broadleaf Dr 139-800-010-000 1969 $122,550 $122,550 0.012900 $1,586.90 4519-4527 Broadleaf Dr 139-800-020-000 1969 $232,400 $232,400 0.012900 $3,009.34 4519-4527 Broadleaf Dr 139-800-030-000 1969 $38,500 $38,500 0.012900 $498.55 4519-4527 Broadleaf Dr 139-800-040-000 1969 $232,400 $232,400 0.012900 $3,099.34 4519-4527 Broadleaf Dr 139-800-050-000 1969 $34,650 $34,650 0.012900 $448.67 4519-4527 Broadleaf Dr 139-800-060-000 1969 $232,400 $232,400 0.012900 $3,009.34 4519-4527 Broadleaf Dr 139-800-070-000 1969 $34,650 $34,650 0.012900 $448.67 4519-4527 Broadleaf Dr 139-800-080-000 1969 $452,110 $452,110 0.012900 $5,854.38 4519-4527 Broadleaf Dr 139-800-090-000 1969 $34,650 $34,650 0.012900 $448.67 4519-4527 Broadleaf Dr 139-800-110-000 1969 $34,650 $34,650 0.012900 $448.67 4519-4527 Broadleaf Dr 139-800-130-000 1969 $20,000 $20,000 0.012900 $258.98 4519-4527 Broadleaf Dr 139-800-140-000 1969 $20,000 $20,000 0.012900 $258.98 4519-4527 Broadleaf Dr 139-800-150-000 1969 $20,000 $20,000 0.012900 $258.98 4519-4527 Broadleaf Dr 139-800-120-000 1969 $20,000 $20,000 0.012900 $258.98 Total $1,528,960 $1,528,960 $19,888.45

local market

04

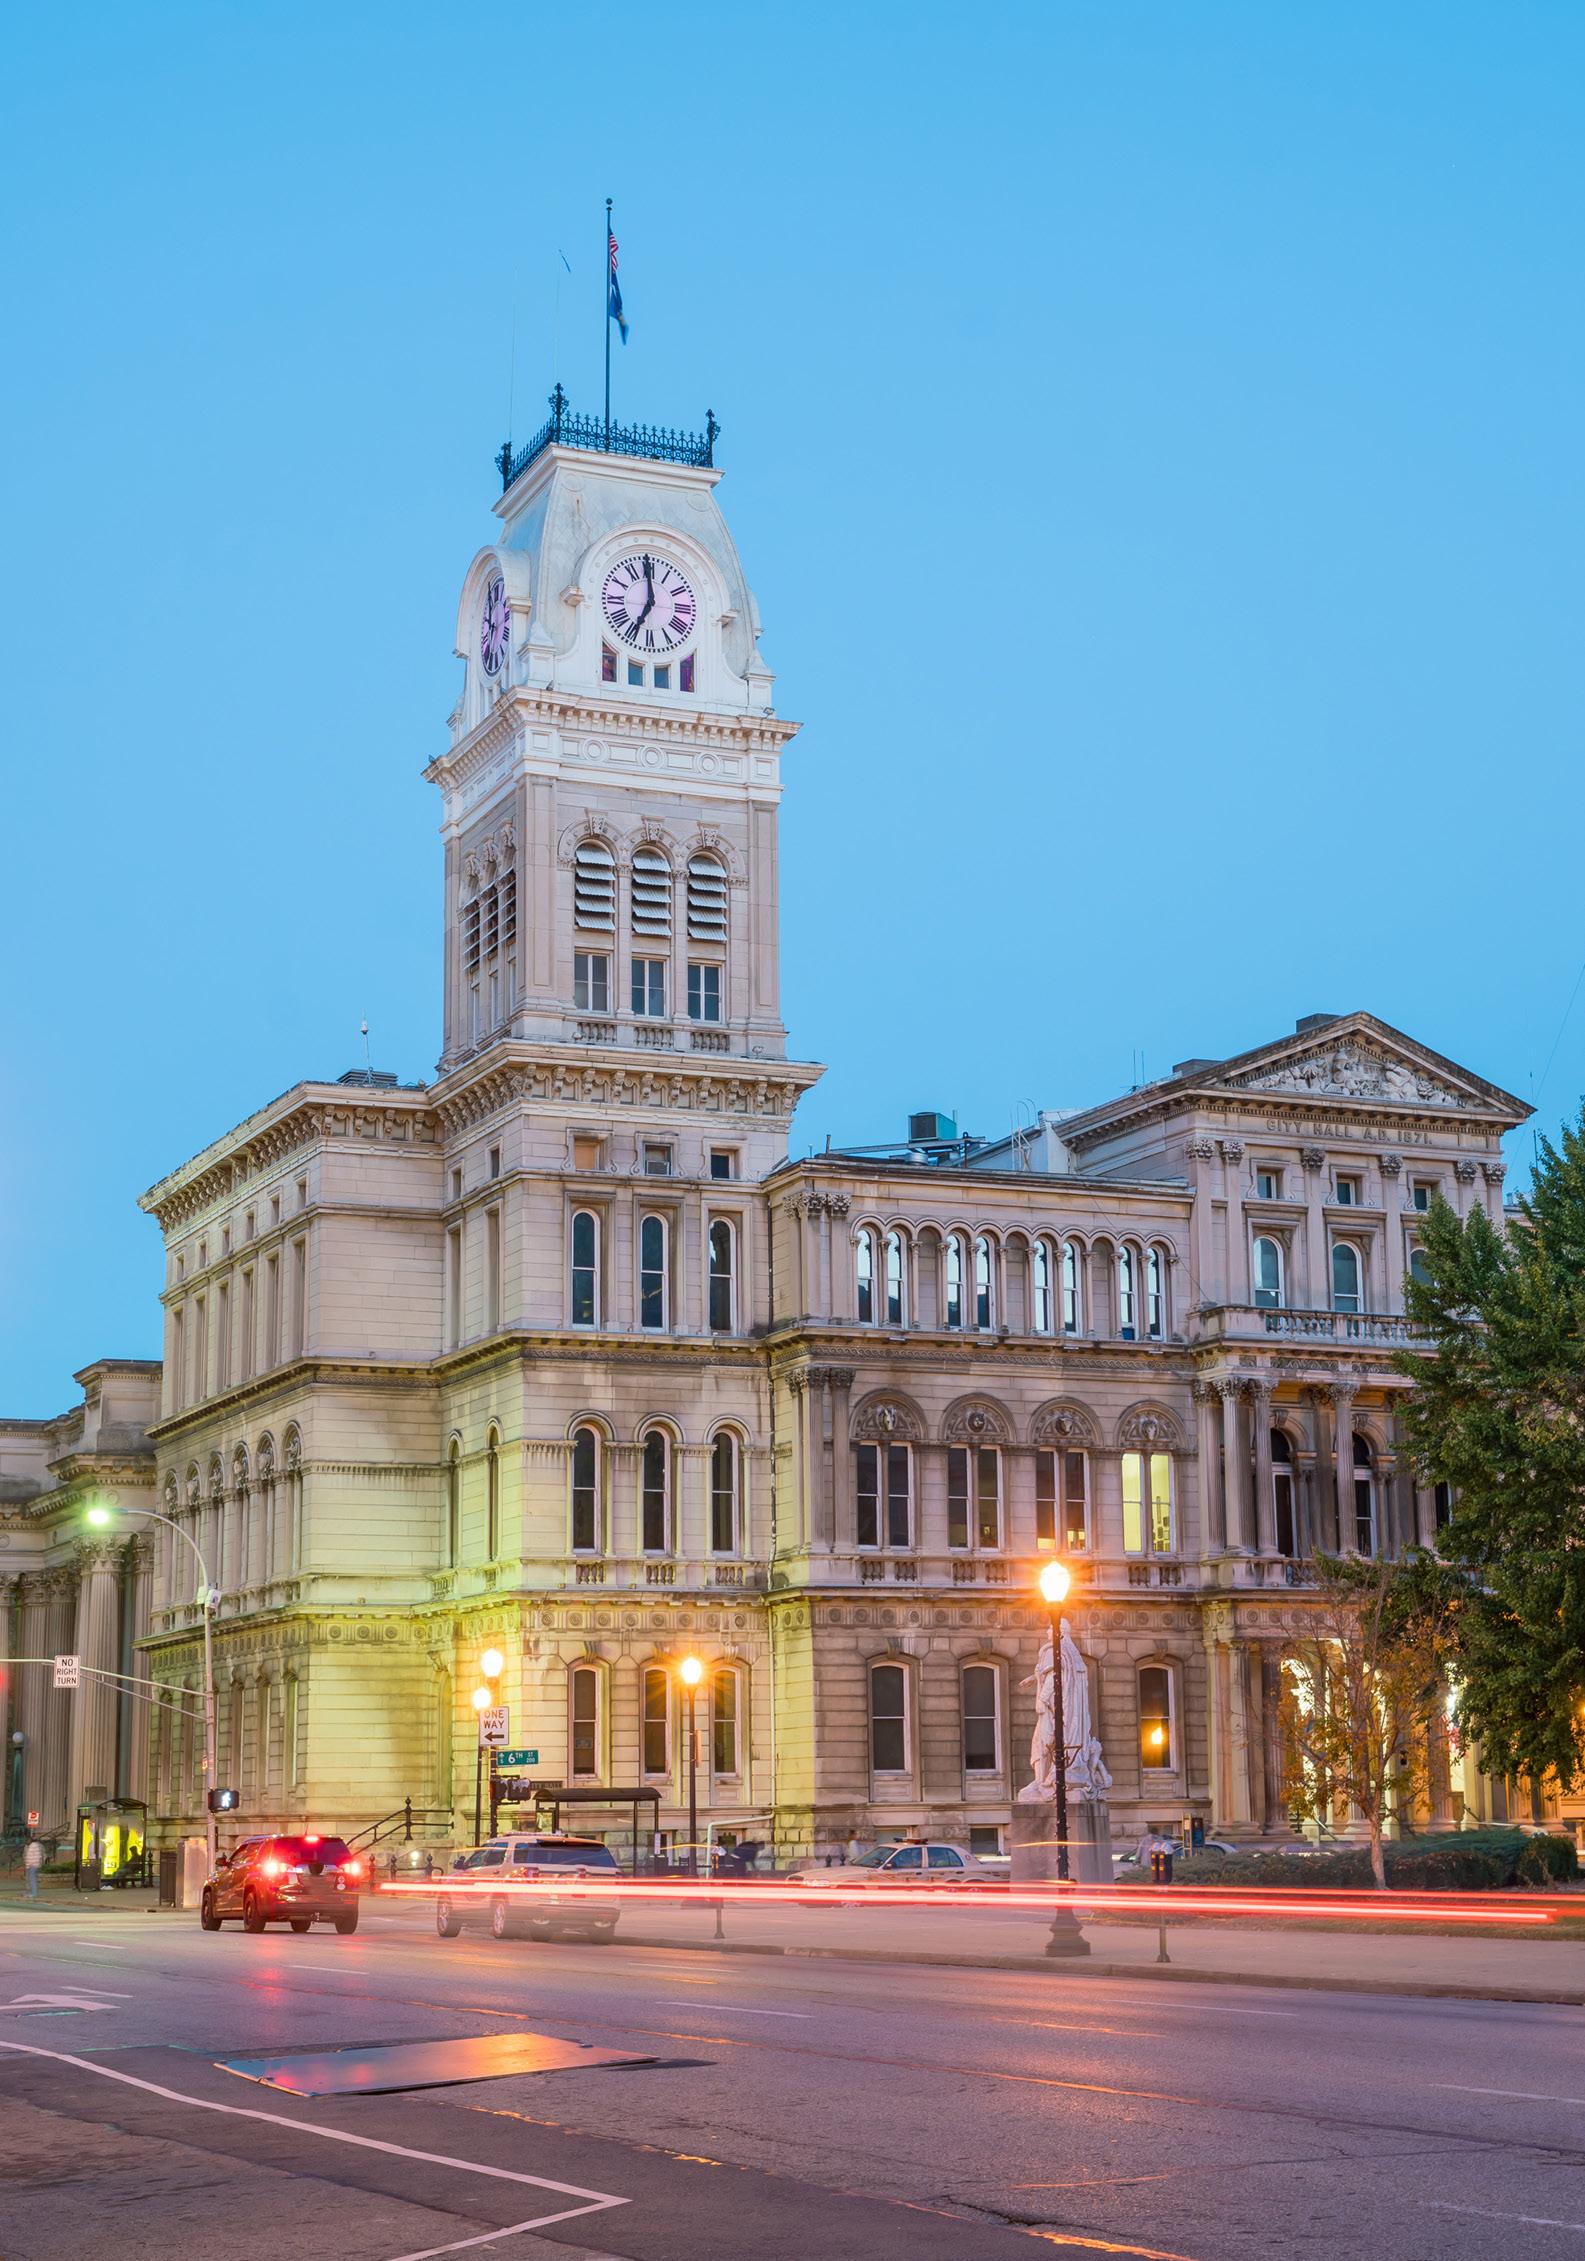
LOUISVILLE, Kentucky

Situated on the banks of the Ohio River, Louisville is a progressive community of 1.3 million people. Louisville is one of the most uniquely authentic destinations in the world. It is Kentucky’s largest city and offers hundreds of one-of-a-kind attractions. Whether you are north, south, east, or west – Louisville offers a slew of attractions and historic architecture in every direction. Three of the state’s six Fortune 500 companies call Louisville home – Humana, Kindred Health, and Yum! Brands.

The area provides an attractive business environment for companies due to its location and low cost of doing business, while allowing employees to enjoy a relatively affordable place to live. The economy has transitioned from traditional manufacturing and shipping to health-

care, tourism, and technology. Tourism in the state of Kentucky has a $3.5 billion economic impact from Louisville alone. While the economic impact is very significant, the results are even more so, as they positively affect the quality of life in Louisville. Through maintaining its commitment to the tourism industry, Louisville can enrich and nurture its infrastructure, allowing it to consistently rank as one of the top cities in the nation for quality of life. Foodies and food trucks, brew masters and bourbon, sports, tradition, and transformation - it’s all happening in Louisville. With such a vibrant quality of life, Louisville is a great place to call home.

EMPLOYERS IN THE NEWS

• Amazon building new $5.5MM last-mile delivery station at prime Louisville property adding close to 2,000 new jobs (March 2021).

• GE Appliances completes $60MM expansion adding 245 new jobs (July 2021)

• Ge Appliances set to invest $450MM at its Appliance park in the next 2 years adding over 2,000 new jobs (Oct 2021)

• QSR Automations opens new global headquarters in Louisville, KY (Nov 2021)

• KCC Manufacturing breaks ground on 700-job operation in Shelby County (Nob 2021)

• Republic National Distributing Co. breaks ground on a relocation and expansion project that will create 30 full-time jobs with a $50 million investment (Sep 2021).

• Baptist Health to build $42M rehabilitation hospital in Jeffersontown (Nov 2021)

AMAZON LAST MILE DELIVERY STATION

Population: 1,300,000

Median age: 39.2

the ECONOMY

• Prior to the pandemic, Louisville/Jefferson County’s real gross metropolitan product grew at an average annual rate of 1.8% from 2015 to 2019. During that same fiveyear period, job growth averaged 1.5% annually, with roughly 9,800 jobs added on average each year. In 2020, COVID· 19 mitigation measures and limited business activity caused the local economy to contract as much as 9.0% year-over-year in 2nd quarter.

• In 3rd quarter 2022, the metro’s inflation-adjusted economic output was unchanged year-over-year.

• At the same time, the metro recorded a net gain of 22,600 jobs, expanding the employment base 3.4%.

• During the past year, job gains in Louisville/Jefferson County were most pronounced in the Professional/Business Services sector followed by Education/Health Services.

• Despite job losses stemming from the pandemic, Louisville/Jefferson County’s current employment base now sits roughly 16,600 jobs or about 3% above the pre-pandemic level in February 2020.

DEMOGRAPHICS: STATISTICS

Msa median hhi: $57,405

1 - Year growth: 1.77%

Msa median home value: $173,500

1 - Year growth: 4.83%

Average occupancy: 96.4%

Rent growth:6%

SUPPLY

New apartment completions in Louisville/Jefferson County were moderate recently, as 1.958 units deliv ered in the year-ending 3rd quarter 2022. Completions over the past year expanded the local inventory base 2.1%. In the past year, supply was greatest in Northwest Louisville and Northeast Louisville. At the end of 3rd quarter 2022, there were 1,896 units under construc tion with 1,516 of those units scheduled to complete in the next four quarters. Scheduled deliveries in the com ing year are expected to be concentrated in Northwest Louisville and Southwest Louisville.

OCCUPANCY

Occupancy in the past year, occupancy lost 0.6 points, with the 3rd quarter 2022 rate landing at 95.8%. Look ing at product classes in Louisville/Jefferson County, 3rd quarter 2022 occupancy registered at 94.8% in Class A units, 95.8% in Class B units and 97.0% in Class C units. Among submarkets, 3rd quarter 2022 occupancy was strongest in Northwest Louisville and Southeast Lou isville. The weakest readings were seen in Central Louisville and Southwest Louisville. Over the past five years, Northwest Louisville generally led for occupancy. During the coming year, occupancy in Louisville/Jeffer son County is expected to register around 95.5%.
LOUISVILLE SLUGGER

Batter up! It takes a special place to craft the #1 Bat in Major League Baseball. At Louisville Slugger Museum & Factory, experience history-in-the-making as you stroll through the actual factory where world-famous Louisville Slugger bats are created. The award-winning factory tour is a highlight of the visit here, but there’s plenty more to enjoy along with it.

EVAN WILLAMS BOURON

In 1783, our namesake opened Kentucky’s First Distillery on the banks of the Ohio River. Many years and barrels later, we still produce Bourbon the right way, using the same time-honored methods.

ATTRACTIONS
Located on Louisville’s historic “Whiskey Row”, the Evan Williams Bourbon Experience features an artisanal distillery, tours, educational tastings, and more!

FOURTH STREET LIVE

Fourth Street Live! is Louisville’s premier dining and entertainment destination, located in the heart of downtown Louisville, Kentucky. A short walk from historic downtown hotels, the Kentucky International Convention Center, Waterfront Park, the KFC YUM Center, Slugger Field, and much more, Fourth Street Live!

ATTRACTIONS

the bourbon business

We are a city of hot browns and Ali, riverfront parks and Slugger bats. We throw parties for horse races and pronounce Louisville like we’ve already had a taste of bourbon.

We are a place of unique offerings and world-class attractions –and our Bourbon District is no exception.

Located in Downtown Louisville, the Bourbon District is a walkable urban experience for anyone looking for a taste of Kentucky. In the Bourbon District, you’re never more than 5 minutes away from the next attraction, so planning that group tour or birthday celebration just got a lot easier.

Attractions

that will quench your thirst for a taste of Kentucky.

Enjoy the Bourbon District, Downtown’s unique walkable experience. Whether you’re a Louisville native on an afternoon stroll, in town on business with a couple hours to spare, or a bourbon connoisseur looking to expand your palate, our Bourbon District distilleries will transport you through generations of history, community, and passion.

kentucky derby interesting stats

165,000 FACILITY CAPACITY

Located in South Louisville, Churchill Downs is a Thoroughbred racetrack known for hosting the annual Kentucky Derby. It is the world’s most legendary racetrack. The first Kentucky Derby and Kentucky Oaks were both held in 1875, which was the year that the racetrack opened. The racetrack at Churchill Downs is 147 acres and features a seven-furlong turf racecourse and a one-mile dirt, oval racetrack. The racetrack can accommodate over 165,000 guests on Derby Day.

147 ACRES OCCUPIED BY RACETRACK

$373M DIRECT ECONOMIC IMPACT

146 YEARS RUNNING

visit adgmultifamily.com to learn more.

Turn static files into dynamic content formats.

Create a flipbook
Issuu converts static files into: digital portfolios, online yearbooks, online catalogs, digital photo albums and more. Sign up and create your flipbook.