Aster Court OM

Page 1

ASTER COURT APARTMENTS OFFERING MEMORANDUM

CONTENTS

LEAD AGENTS

Austin Hall

Associate

Cincinnati Office

D. 513.878.7712

austin.hall@marcusmillichap.com

Jordan Dickman

First Vice President Investments

Cincinnati Office

D. 513.878.7735

jordan.dickman@marcusmillichap.com

Nick Andrews

First Vice President Investments

Cincinnati Office

D. 513.878.7741

nicholas.andrews@marcusmillichap.com

Austin Sum

Senior Associate

Cincinnati Office

D. 513.878.7747

austin.sum@marcusmillichap.com

“OUR COMMITMENT IS TO HELP OUR CLIENTS CREATE

AND PRESERVE WEALTH BY PROVIDING THEM WITH

THE BEST REAL ESTATE INVESTMENT SALES, FINANCING, RESEARCH AND ADVISORY SERVICES AVAILABLE.”

06 16 28 36

NON-ENDORSEMENT & DISCLAIMER NOTICE

CONFIDENTIALITY DISCLAIMER

THIS IS A BROKER PRICE OPINION OR COMPARATIVE MARKET ANALYSIS OF VALUE AND SHOULD NOT BE CONSIDERED AN APPRAISAL. This information has been secured from sources we believe to be reliable, but we make no representations or warranties, express or implied, as to the accuracy of the information. References to square footage or age are approximate. Buyer must verify the information and bears all risk for any inaccuracies.

NON-ENDORSEMENT NOTICE

Marcus & Millichap is not affiliated with, sponsored by, or endorsed by any commercial tenant or lessee identified in this marketing package. The presence of any corporation’s logo or name is not intended to indicate or imply affiliation with, or sponsorship or endorsement by, said corporation of Marcus & Millichap, its affiliates or subsidiaries, or any agent, product, service, or commercial listing of Marcus & Millichap, and is solely included for the purpose of providing tenant lessee information about this listing to prospective customers.

01 - THE INVESTMENT 02 - local competitors 03 - FINANCIALS 04 - LOCAL MARKET SECTIONS
CALABASAS, CALIFORNIA | HQ 2,500 | EMPLOYEES 80+ | OFFICES

UNRIVALED SUCCESS IN THE MIDWEST

YOUR TEAM

JORDAN DICKMAN

FIRST VICE PRESIDENTS DIRECTOR, NMHG

NICK ANDREWS

FIRST VICE PRESIDENTS DIRECTOR, NMHG

CORPORATE SUPPORT

LIZ POPP

MIDWEST OPERATIONS MANAGER

JOSH CARUANA

VICE PRESIDENT

REGIONAL MANAGER

INDIANAPOLIS | CINCINNATI | LOUISVILLE | ST LOUIS | KANSAS CITY

AUSTIN SUM

SENIOR INVESTMENT ASSOCIATE

BRIAN JOHNSTON

INVESTMENT ASSOCIATE

AUSTIN Hall

INVESTMENT ASSOCIATE

ALDEN SIMMS

INVESTMENT ASSOCIATE

BROKER SUPPORT

SAM PETROSNIO

VALUATION & RESEARCH

SKYER WILSON

CLIENT RELATIONS MANAGER

JOHN SEBREE

SENIOR VICE PRESIDENT

NATIONAL DIRECTOR

NATIONAL MULTI HOUSING GROUP

MICHAEL GLASS

SENIOR VICE PRESIDENT

MIDWEST DIVISION MANAGER

NATIONAL DIRECTOR, MANUFACTURED HOME COMMUNITIES GROUP

BRITTANY CAMPBELL-KOCH

DIRECTOR OF OPERATIONS

ALEX PAPA

MARKETING COORDINATOR

THE INVESTMENT

01

ASTER COURT APARTMENTS

PROPERTY DETAILS

Property Name: ASTER COURT APARTMENTS

Property Address: 100 ASTER COURT

City, State, Zip: Germantown, OH 45327

Submarket: Outer Montgomery County County: Montgomery

Year Built/Renovated: 1967/2022 Number Of Units: 36

617

22200

4.608

of Stories: 1 Current Occupancy: 92%

UTILITIES:

Electric: Tenant

Gas: None Water Owner Sewer Owner Trash: Owner

Avg
Rentable
Number of
Lot Size (Acres):
#
#
Unit Size:
Sqft:
Parcels: 1
of Buildings: 4

PHOTOS

INVESTMENT HIGHLIGHTS ASTER COURT APARTMENTS

WELL-MAINTAINED ASSET:

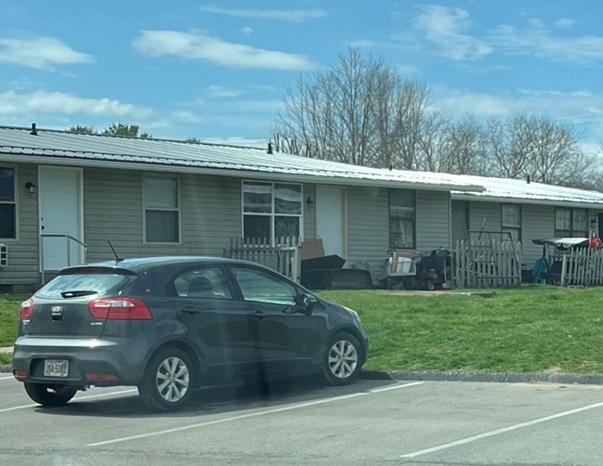
Current ownership has invested around $250,000 into the property since 2021. The improvements include:

• New metal roofs, gutters, and soffits

• Resurfaced parking lot

• New mailboxes

• New Heating/Air units in 15 units

• New hot water heaters in 14 units

• 36 new outdoor lights

• New dumpster concrete pad and dumpster

• 24 new front doors

• New windows in 14 units

• New waterproof vinyl flooring throughout 14 units

• New stoves and refrigerators in 13 units

• 100 privacy trees planted

PROVEN RENOVATION PLAN:

Aster Court has had two studios and twelve one-bedrooms renovated to push rents. The average effective rent for the unrenovated studios is $505 compared to $600 for the renovated studios. The average effective rent for unrenovated one-bedrooms is $505 compared to $690 for the renovated units. New renovated one-bedroom leases have been at or above $725. The current owners have spent around $8,000 per unit on the renovations. The twenty-two remaining unrenovated units provide an exciting value-add opportunity for an incoming investor.

STRONG SUBMARKET FUNDAMENTALS:

Germantown is a fundamentally strong Dayton submarket for investors. The average household income in the two-mile radius around Aster Court is $84,167 and the median household income is $71,832. The population within a 10-mile radius of Aster Court is 202,434. The median home value within a two-mile radius is $163,689. The median household income and median home value are very similar to Kettering - one of the top submarkets in Dayton ($71,232 and $167,713, respectively).

DEAL SUMMARY

22,200 36 617

PROPERTY SUMMARY

ASTER COURT APARTMENTS

# Studios 8 #1 Bedrooms 28 Occupancy 92%
RENTABLE SQUARE FEET TOTAL UNITS AVG SF
*

GERMANTOWN,OH

$84,167 Average HH Income

$71,832 Median HH Income

202,434 Population within 10 miles

$163,689 Median Home Value

FRANKLIN
ASTER COURT MIAMISBURG
MIAMISBURG 5.3 MILES 10 MINS DAYTON 15 MILES 23 MINS KETTERING 12 MILES 23 MINS FRANKLIN 7.2 MILES 14 MINS

RENT COMPETITORS

02

LIBERTY S TATIONAPTS

ASTER C O URTAPA R T -
location competitors
SLATE RU N
1 BED - $775
APTS
1 BED - $815 1 BED - $754
ASHGRO V E APTs
CROWN RI D GE APTS
1 BED - $910 1 BED - $725
STARCITY A PTS
N O RMAN
SE
Studio - $700
HO U
MIAMISB
RG ESTATE S
1 BED - $800
U
1 BED -$750

rent sort Studio

Studio Property Year Built # Units Avg SF Avg Rent Avg Rent/SF Slate Run Apartments (Miamisburg) 1985 48 500 $760 $1.52 Ashgrove Apartments (Franklin) 1982 64 288 $740 $2.57 Star City Apartments (Miamisburg) 1982 24 500 $700 $1.40 Subject Pro Forma 1976 36 500 $635 $1.27 Subject Average Effective 1976 36 500 $541 $1.10

rent sort ONE bedroom

One Bedroom Property Year Built # Units Avg SF Avg Rent Avg Rent/SF Ashgrove Apartments (Franklin) 1982 64 576 $910 $1.58 Slate Run Apartments (Miamisburg) 1985 48 579 $815 $1.41 Norman House (Miamisburg) 1969 66 608 $800 $1.32 Subject Pro Forma 1976 36 650 $775 $1.19 Liberty Station (Carlisle) 1971 188 550 $754 $1.37 Miamisburg Estates II (Miamisburg) 1974 18 659 $750 $1.14 Crown Ridge (Franklin) 1972 144 750 $725 $0.97 Subject Average Effective 1976 36 650 $597 $0.88

RENT

COMPETITORS

liberty station

UNITS 188 YEAR BUILT 1971 OCCUPANCY 100.0% UNIT MIX UNITS SQFT RENT RENT/SF One Bedroom 24 550 $754 $1.37 Two Bedroom 164 852 $900 $1.06 Apartment Interior Amenities Dishwasher Microwave Washer/dryer hookup Walk-in closet Common Area Amenities Pool Fitness Center Laundry Playground 950 Dubois Road, Carlisle, OH 45005

RENT COMPETITORS slate run apts

Units 48 Year Built 1985 Occupancy 95.8% UNIT MIX UNITS SQFT RENT RENT/SF Studio 5 500 $760 $1.52 One Bedroom 34 579 $815 $1.41 Apartment Interior Amenities Dishwasher Washer/dryer hookup Balcony Common Area Amenities Laundry 248 S Heincke Rd, Miamisburg, OH 45342
UNITS 64 YEAR BUILT 1982 OCCUPANCY 95.3% UNIT MIX UNITS SQFT RENT RENT/SF Studio 7 288 $740 $2.57 One Bedroom 44 576 $910 $1.58 Apartment Interior Amenities Patios Common Area Amenities Laundry 1 Ashgrove Ct, Franklin, OH 45005
RENT COMPETITORS ashgrove apartments

RENT COMPETITORS star city apartments

Units 24 Year Built 1982 Occupancy 70.8% UNIT MIX UNITS SQFT RENT RENT/SF Studio 24 500 $700 $1.40 7123 Springboro
OH 45449
Interior Amenities Dishwasher Microwave Common Area Amenities Laundry
Pike, Dayton,
Apartment

FINANCIALS

03

ASTER COURT APARTMENTS - FINANCIALS

UNIT MIX SUMMARY

AVERAGE EFFECTIVE MARKET PROJECTED UNIT TYPE NO. OF UNITS RENTABLE SF TOTAL SF RENT/UNIT RENT/SF TOTAL RENT POTENTIAL RENT/UNIT RENT/SF TOTAL RENT POTENTIAL RENT/UNIT RENT/SF TOTAL RENT POTENTIAL SUMMARY Studio 8 Units 500 SF 4,000 SF $540.63 $1.08 $4,325 $568.75 $1.14 SF $4,550 $635.00 $1.27 SF $5,080 One Bedroom 28 Units 650 SF 18,200 SF $597.50 $0.92 $16,730 $672.50 $1.03 SF $18,830 $775.00 $1.19 SF $21,700 Totals / Wtd. Averages 36 Units 617 SF 22,200 SF $584.86 $0.95 SF $21,055 $649.44 $1.05 SF $23,380 $743.89 $1.21 SF $26,780
UNIT DISTRIBUTION UNIT RENTS

ASTER COURT APARTMENTS - FINANCIALS

UNIT MIX BREAKDOWN

AVERAGE EFFECTIVE MARKET PROJECTED UNIT TYPE NO. OF UNITS RENTABLE SF TOTAL SF RENT/UNIT RENT/SF TOTAL RENT POTENTIAL RENT/UNIT RENT/SF TOTAL RENT POTENTIAL RENT/UNIT RENT/SF TOTAL RENT POTENTIAL Studio 0BR/1BA - Unrenovated 5 Units 500 SF 2,500 SF $505.00 $1.01 SF $2,525 $550.00 $1.10 SF $2,750 $635.00 $1.27 SF $3,175 0BR/1BA - Renovated 3 Units 500 SF 1,500 SF $600.00 $1.20 SF $1,800 $600.00 $1.20 SF $1,800 $635.00 $1.27 SF $1,905 Totals / Wtd. Averages 8 Units 500 SF 4,000 SF $540.63 $1.08 SF $4,325 $568.75 $1.14 SF $4,550 $635.00 $1.27 SF $5,080 One Bedroom 1BR/1BA - Unrenovated 14 Units 650 SF 9,100 SF $505.00 $0.78 SF $7,070 $570.00 $0.88 SF $7,980 $775.00 $1.19 SF $10,850 1BR/1BA - Renovated 14 Units 650 SF 9,100 SF $690.00 $1.06 SF $9,660 $775.00 $1.19 SF $10,850 $775.00 $1.19 SF $10,850 Totals / Wtd. Averages 28 Units 650 SF 18,200 SF $597.50 $0.92 SF $16,730 $672.50 $1.03 SF $18,830 $775.00 $1.19 SF $21,700

CURRENT RENT ROLL: AS OF APRIL 13, 2023 INCOME AND EXPENSES: FY 2022

ASTER COURT APARTMENTSFINANCIALS
YEAR 1 GROSS POTENTIAL RENT % of GPR Per Unit % of GPR Per Unit All Units at Market Rent $281,400 RR 7,817 $321,360 8,927 Gain (Loss) to Lease ($26,760) 9.51% (743) ($25,709) 8.00% (714) GROSS SCHEDULED RENT $254,640 RR 7,073 $295,651 8,213 GROSS POTENTIAL INCOME $254,640 7,073 $295,651 8,213 Physical Vacancy ($25,800) 10.13% (717) ($14,783) 5.00% (411) Bad Debt $0 0.00% 0 ($2,957) 1.00% (82) EFFECTIVE GROSS INCOME $228,840 80.36% 6,357 $277,912 86.00% 7,720 NON-CONTROLLABLE Real Estate Taxes % of EGI Per Unit % of EGI 2022 Taxes Paid $37,143 Auditor 16.23% 1,032 $37,143 13.36% 1,032 Total Real Estate Taxes $37,143 16.23% 1,032 $37,143 13.36% 1,032 Insurance $11,216 T12 4.90% 312 $14,400 5.18% 400 Utilities Utilities $13,904 T12 6.08% 386 $14,182 5.10% 394 Total Utilities $13,904 6.08% 386 $14,182 5.10% 394 Total Non-Controllable $62,263 27.21% 1,730 $65,725 23.65% 1,826 CONTROLLABLE Contract Services Snow Removal $1,260 Note 2 0.55% 35 $1,260 0.45% 35 Landscaping/Grounds $3,600 Note 2 1.57% 100 $3,600 1.30% 100 Pest Control $1,260 Note 2 0.55% 35 $1,260 0.45% 35 Total Contract Services $6,120 2.67% 170 $6,120 2.20% 170 Repairs & Maintenance $18,000 Note 2 7.87% 500 $18,000 6.48% 500 On-Site Payroll $28,800 Note 2 12.59% 800 $28,800 10.36% 800 Payroll Taxes & Benefits $3,600 Note 2 1.57% 100 $3,600 1.30% 100 General & Administrative $1,800 Note 2 0.79% 50 $1,800 0.65% 50 Management Fee $13,730 Note 2 6.00% 381 $16,675 6.00% 463 Replacement & Reserves $9,180 Note 1 4.01% 255 $9,455 3.40% 263 Total Controllable $81,230 35.50% 2,256 $84,450 30.39% 2,346 TOTAL EXPENSES $143,493 62.70% 3,986 $150,175 54.04% 4,172 NET OPERATING INCOME $85,347 37.30% 2,371 $127,737 45.96% 3,548 EXPENSE INCOME
INCOME & EXPENSES

UNDERWRITING NOTES

# NOTE

1 Replacement & Reserves: added based on market norm of $255 per unit per year

2 Added based on market norms

YEAR 2 YEAR 3 % of GPR Per Unit % of GPR Per Unit $331,001 9,194 $340,931 9,470 ($6,620) 2.00% (184) ($6,819) 2.00% (189) $324,381 9,011 $334,112 9,281 $324,381 9,011 $334,112 9,281 ($16,219) 5.00% (451) ($16,706) 5.00% (464) ($3,244) 1.00% (90) ($3,341) 1.00% (93) $304,918 92.00% 8,470 $314,065 92.00% 8,724 % of EGI Per Unit % of EGI Per Unit $37,143 12.18% 1,032 $37,143 12.18% 1,032 $37,143 12.18% 1,032 $37,143 12.18% 1,032 $14,832 4.86% 412 $15,277 5.01% 424 $14,466 4.74% 402 $14,755 4.84% 410 $14,466 4.74% 402 $14,755 4.84% 410 $66,440 21.79% 1,846 $67,175 22.03% 1,866 $1,298 0.43% 36 $1,337 0.44% 37 $3,708 1.22% 103 $3,819 1.25% 106 $1,298 0.43% 36 $1,337 0.44% 37 $6,304 2.07% 175 $6,493 2.13% 180 $18,540 6.08% 515 $19,096 6.26% 530 $29,664 9.73% 824 $30,554 10.02% 849 $3,708 1.22% 103 $3,819 1.25% 106 $1,854 0.61% 52 $1,910 0.63% 53 $18,295 6.00% 508 $18,844 6.00% 508 $9,739 3.19% 271 $10,031 3.29% 279 $88,104 28.89% 2,447 $90,747 29.58% 2,505 $154,544 50.68% 4,293 $157,921 51.79% 4,387 $150,374 49.32% 4,177 $156,144 51.21% 4,337
CURRENT YR 1 YR 2 YR 3 YR 4 YR 5 YR 6 YR 7 YR 8 YR 9 YR 10 YE MAR-2024 YE MAR-2025 YE MAR-2026 YE MAR-2027 YE MAR-2028 YE MAR-2029 YE MAR-2030 YE MAR-2031 YE MAR-2032 YE MAR-2033 GROSS POTENTIAL RENT All Units at Market Rent $281,400 $321,360 $331,001 $340,931 $351,159 $361,694 $372,544 $383,721 $395,232 $407,089 $419,302 Gain (Loss) to Lease ($26,760) ($25,709) ($6,620) ($6,819) ($7,023) ($7,234) ($7,451) ($7,674) ($7,905) ($8,142) ($8,386) GROSS SCHEDULED RENT $254,640 $295,651 $324,381 $334,112 $344,136 $354,460 $365,093 $376,046 $387,328 $398,947 $410,916 GROSS POTENTIAL INCOME $254,640 $295,651 $324,381 $334,112 $344,136 $354,460 $365,093 $376,046 $387,328 $398,947 $410,916 Physical Vacancy ($25,800) ($14,783) ($16,219) ($16,706) ($17,207) ($17,723) ($18,255) ($18,802) ($19,366) ($19,947) ($20,546) Bad Debt $0 ($2,957) ($3,244) ($3,341) ($3,441) ($3,545) ($3,651) ($3,760) ($3,873) ($3,989) ($4,109) EFFECTIVE GROSS INCOME $228,840 $277,912 $304,918 $314,065 $323,487 $333,192 $343,188 $353,483 $364,088 $375,011 $386,261 Real Estate Taxes $37,143 $37,143 $37,143 $37,143 $38,257 $39,405 $40,587 $41,804 $43,058 $44,350 $45,681 Insurance $11,216 $14,400 $14,832 $15,277 $15,735 $16,207 $16,694 $17,194 $17,710 $18,241 $18,789 Utilities $13,904 $14,182 $14,466 $14,755 $15,198 $15,654 $16,123 $16,607 $17,105 $17,618 $18,147 Contract Services $6,120 $6,120 $6,304 $6,493 $6,687 $6,888 $7,095 $7,308 $7,527 $7,753 $7,985 Repairs & Maintenance $18,000 $18,000 $18,540 $19,096 $19,669 $20,259 $20,867 $21,493 $22,138 $22,802 $23,486 On-Site Payroll $28,800 $28,800 $29,664 $30,554 $31,471 $32,415 $33,387 $34,389 $35,420 $36,483 $37,577 Payroll Taxes & Benefits $3,600 $3,600 $3,708 $3,819 $3,934 $4,052 $4,173 $4,299 $4,428 $4,560 $4,697 General & Administrative $1,800 $1,800 $1,854 $1,910 $1,967 $2,026 $2,087 $2,149 $2,214 $2,280 $2,349 Management Fee $13,730 $16,675 $18,295 $18,844 $19,409 $19,992 $20,591 $21,209 $21,845 $22,501 $23,176 Replacement & Reserves $9,180 $9,455 $9,739 $10,031 $10,332 $10,642 $10,961 $11,290 $11,629 $11,978 $12,337 TOTAL EXPENSES $143,493 $150,175 $154,544 $157,921 $162,659 $167,539 $172,565 $177,742 $183,074 $188,566 $194,223 NET OPERATING INCOME $85,347 $127,737 $150,374 $156,144 $160,828 $165,653 $170,623 $175,742 $181,014 $186,444 $192,038 INCOME EXPENSE ASTER COURT APARTMENTSFINANCIALS
CASH FLOW
CASH FLOW PROJECTION GROWTH RATE ASSUMPTIONS YR 1 YR 2 YR 3 YR 4 YR 5 YR 6 YR 7 YR 8 YR 9 Income Gross Potential Rent 14.20% 3.00% 3.00% 3.00% 3.00% 3.00% 3.00% 3.00% 3.00% (Loss) / Gain to Lease* 8.00% 2.00% 2.00% 2.00% 2.00% 2.00% 2.00% 2.00% 2.00% Other Income 3.00% 3.00% 3.00% 3.00% 3.00% 3.00% 3.00% 3.00% 3.00% Expenses Expenses 3.00% 3.00% 3.00% 3.00% 3.00% 3.00% 3.00% 3.00% Management Fee** 6.00% 6.00% 6.00% 6.00% 6.00% 6.00% 6.00% 6.00% 6.00% CASH FLOW PROJECTION GROWTH RATE ASSUMPTIONS YR 1 YR 2 YR 3 YR 4 YR 5 YR 6 YR 7 YR 8 YR 9 Physical Vacancy 5.00% 5.00% 5.00% 5.00% 5.00% 5.00% 5.00% 5.00% 5.00% Non-Revenue Units 0.00% 0.00% 0.00% 0.00% 0.00% 0.00% 0.00% 0.00% 0.00% Bad Debt 1.00% 1.00% 1.00% 1.00% 1.00% 1.00% 1.00% 1.00% 1.00% Concessions Allowance 0.00% 0.00% 0.00% 0.00% 0.00% 0.00% 0.00% 0.00% 0.00% Total Economic Loss 6.00% 6.00% 6.00% 6.00% 6.00% 6.00% 6.00% 6.00% 6.00% Tax Breakdown Property Address Parcel ID Year Built Acres Market Value Assessed Value Tax Rate Taxes Payable 100 ASTER COURT APARTMENTS D13-00108-0101 1976 4.61 $1,400,000 $490,000 0.075801 $37,142.56 Total 4.6.1 $1,400,000 $490,000 $37,142.56

LOCAL MARKET

04

DAYTON, oHIO

Since the arrival of the first settlers on April 1, 1796, Dayton has always been a place for pioneering vision and change. They have hosted many firsts as the patent capital of the U.S. and provided the world with a staggering number of life-changing innovations and technological advancements. Today they’re still setting trends and promoting growth. In the research labs of Wright-Patterson Air Force Base, the University of Dayton, Wright State University, and many of the top businesses, the innovative spirit of Dayton continues to produce cutting-edge technology and dynamic solutions

to today’s biggest issues.

With the crossroads of Interstate 70 and 75, the railroad capacity, and the international airport, Dayton provides one of the most accessible cities in the nation. In fact, Dayton’s location puts it within one day’s drive of 60% of the U.S. population. The superior transportation makes us among the most competitive mid-sized cities for logistics.

ECONOMIC OVERVIEW

Prior to the pandemic, Dayton’s real gross metropolitan product grew at an average annual rate of 1.6% from 2015 to 2019. During that same five-year period, job growth av eraged 1.0% annually, with roughly 3,900 jobs added on av erage each year. In 2020, COVID-19 mitigation measures and limited business activity caused the local economy to contract as much as 9.6% year-over-year in 2nd quarter. In 2022, the metros inflation-adjusted economic output con tracted 0.8%. At the same time, the metro recorded a net gain of 2,900 jobs, expanding the employment base 0.8%.

As such, Dayton’s unemployment rate in November 2022 declined 0.4 points year-over-year to 3.2%, below the na tional average of 3.4%. During the past year, job gains in Dayton were most pronounced in the Leisure/Hospitality Services sector followed by Government and Profession al/Business Services. Due to job losses stemming from the pandemic, Dayton’s current employment base now sits roughly 5,100 jobs or about 1% below the pre-pandemic level in February 2020.

Population: 743,000

Median age: 33.5

the rent

In 4th quarter 2022, same-store effective asking rents for new leases were up 8.4% year-over-year. That annual rent performance was well above the market’s five-year average of 4.8% and a new high for the market. s. In 4th quarter 2022, annual effective rent change was fairly even across the board, registering at 8.3% in Class A units, 8.2% in Class B units and 8.7% in Class C units. Among submarkets, the strongest annual rent change performances over the past year were in Northwest Dayton, North Dayton/Miami County and Greene County. The weakest performance was in South Montgomery County. In the coming year, same-store effective asking rent change in Dayton is expected to slow from the current level. As of 4th quarter 2022, effective asking rental rates in Dayton averaged $1,077 per month, or $1.182 per square foot.

DEMOGRAPHICS: STATISTICS

Msa median hhi: $54,457

1 - Year growth: 5.89%

Msa median home value: $69,400

1 - Year growth: 3.89%

Average occupancy: 96.2%

Rent growth: 8.4%

New apartment completions in Dayton were modest recently, as 412 units delivered in 2022. Completions over the past year expanded the local inventory base 0.7%. In the past year, supply was greatest in Central Dayton/Kettering and Greene County.

At the end of 2022, there were 886 units under construction with 661 of those units scheduled to complete in the next four quarters. Scheduled deliveries in the coming year are expected to be limited to Central Dayton/Kettering and North Dayton/Miami County.

SUPPLY OCCUPANCY

- Over the past year, occupancy lost 1.8 points, with the 4th quarter 2022 rate landing at 96.2%.

- Looking at product classes in Dayton, 4th quarter 2022 occupancy registered at 95.3%. In Class A units, 96.5% in Class B units and 96.7% in Class C units.

- Among submarkets, 4th quarter 2022 occupancy was strongest in Greene County and Central Dayton/Kettering.

- The weakest reading was in Northwest Dayton.

WRIGHT PATTERSON

Located in Dayton, Wright-Patterson Air Force Base (WPAFB) is one of the most diverse, largest, and organizationally complex bases in the Air Force. Not only is WPAFB the largest single-site employer in the entire state of Ohio, but it is also a center of innovation for the Air Force. It was selected as the “preferred location” for the F-35 Lightning II Hybrid Product Support Intergrator organization, which supports the entire F-35 enterprise. This would bring a minimum of 400 new jobs to the base. The potential impact to the region cannot only be measured in jobs alone, neighboring communities would benefit through the result of more growth for contractors and businesses. Wright-Patterson Air Force Base employs 27,500 military, civilian, and contract employees and has an annual economic impact of $4.3 billion.

“Wright Patterson AFB is the crown jewel of the state of Ohio, and our department will continue to do everything we can to accelerate the growth of the WPAFB and attract more jobs to the region.”

carillon historical park

Carillon Historical Park showcases Dayton’s rich heritage of creativity, invention, and milestones in innovation that changed the nation and the world!

The park houses the John W. Berry, Sr. Wright Brothers National Museum featuring the original 1905 Wright Flyer III, an impressive collection of NCR cash registers, the Carousel of Dayton Innovation, Gem City Letterpress and so much more.

america’s packard museum

The museum is housed in the original Packard dealership building built for Dayton in 1917. Approximately 50 Packard automobiles dating 1903-58 are displayed. Other exhibits include Packard marine and aircraft engines, items from the Detroit Packard factory.

higher education university of dayton

Founded in 1850, the University of dayton (UD) spans a massive 373-acres with state-of-the-art facilities in the downtown area. It boasts 38 academic, athletic, administrative, and research buildings, five resident halls, 18 student apartment complexes, and 473 houses (347 being owned by UD). In 2019, there were a total of 8,483 undergrad students enrolled. 85% of students live on-campus or in student neighborhoods. UD offers more than 80 undergraduate programs and 50 graduate and doctoral programs. UD has 17 Division I sports temas, 37 club sports, and 12 intramural sports. Since 2001, the NCAA tournament has had an impact of more than $70 million on dayton’s economy and UD Arena has hosted more Division I Basketball Championship gams than any other venue in the US.

wright state university

Located in the Dayton area, Wright State University is a national public research university. WSU offers 140 undergraduate programs and 136 graduate programs. Wright State has 20 percent more affordable in-state tuition than the national average. WSU adds $1.5 billion into the region’s economy annually and supports more than 20,000 jobs through its spending on operations and research and throuigh spending of students, alumni, and visitors. With a student body population of more than 13,000, there is only a 3,000 on-campus student housing capacity. WSU’s Nutter Center is southwest Ohio’s premier sports and entertainment facility. With a capacity of 11,200, it has also been recognized nationally as a top venue of its size.

Turn static files into dynamic content formats.

Create a flipbook
Issuu converts static files into: digital portfolios, online yearbooks, online catalogs, digital photo albums and more. Sign up and create your flipbook.