Journal of Dentistry and Oral Epidemiology
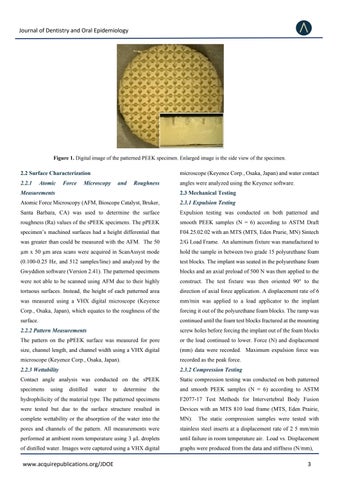
Figure 1. Digital image of the patterned PEEK specimen. Enlarged image is the side view of the specimen.
2.2 Surface Characterization 2.2.1
Atomic
Force
microscope (Keyence Corp., Osaka, Japan) and water contact
Microscopy
and
Roughness
angles were analyzed using the Keyence software.
Measurements
2.3 Mechanical Testing
Atomic Force Microscopy (AFM, Bioscope Catalyst, Bruker,
2.3.1 Expulsion Testing
Santa Barbara, CA) was used to determine the surface
Expulsion testing was conducted on both patterned and
roughness (Ra) values of the sPEEK specimens. The pPEEK
smooth PEEK samples (N = 6) according to ASTM Draft
specimen’s machined surfaces had a height differential that
F04.25.02.02 with an MTS (MTS, Eden Prarie, MN) Sintech
was greater than could be measured with the AFM. The 50
2/G Load Frame. An aluminum fixture was manufactured to
µm x 50 µm area scans were acquired in ScanAssyst mode
hold the sample in between two grade 15 polyurethane foam
(0.100-0.25 Hz, and 512 samples/line) and analyzed by the
test blocks. The implant was seated in the polyurethane foam
Gwyddion software (Version 2.41). The patterned specimens
blocks and an axial preload of 500 N was then applied to the
were not able to be scanned using AFM due to their highly
construct. The test fixture was then oriented 90° to the
tortuous surfaces. Instead, the height of each patterned area
direction of axial force application. A displacement rate of 6
was measured using a VHX digital microscope (Keyence
mm/min was applied to a load applicator to the implant
Corp., Osaka, Japan), which equates to the roughness of the
forcing it out of the polyurethane foam blocks. The ramp was
surface.
continued until the foam test blocks fractured at the mounting
2.2.2 Pattern Measurements
screw holes before forcing the implant out of the foam blocks
The pattern on the pPEEK surface was measured for pore
or the load continued to lower. Force (N) and displacement
size, channel length, and channel width using a VHX digital
(mm) data were recorded. Maximum expulsion force was
microscope (Keyence Corp., Osaka, Japan).
recorded as the peak force.
2.2.3 Wettability
2.3.2 Compression Testing
Contact angle analysis was conducted on the sPEEK
Static compression testing was conducted on both patterned
specimens
the
and smooth PEEK samples (N = 6) according to ASTM
hydrophilicity of the material type. The patterned specimens
F2077-17 Test Methods for Intervertebral Body Fusion
were tested but due to the surface structure resulted in
Devices with an MTS 810 load frame (MTS, Eden Prairie,
complete wettability or the absorption of the water into the
MN).
pores and channels of the pattern. All measurements were
stainless steel inserts at a displacement rate of 2 5 mm/min
performed at ambient room temperature using 3 µL droplets
until failure in room temperature air. Load vs. Displacement
of distilled water. Images were captured using a VHX digital
graphs were produced from the data and stiffness (N/mm),
using
distilled
water
to
determine
The static compression samples were tested with
www.acquirepublications.org/JDOE
3 3


