GIS for Crime Analysis - Geography for Predictive Models Jorge Ferreira1, Paulo João2 and José Martins1 1 e-GEO, FCSH – UNL, Lisbon, Portugal 2 DEIO –FCUL, University of Lisbon jr.ferreira@fcsh.unl.pt jolriao@gmail.com josemartins.geo@gmail.com Abstract: The term crime analysis refers to a concept and to a discipline practiced in the policing community. It includes analysis of more than just a crime, which is why some authors refer to it as public safety analysis. However, over the last few years crime analysis has become a general term that includes a lot of research subcategories: intelligence analysis, criminal investigative analysis, tactical crime analysis, strategic crime analysis, operation analysis and administrative crime analysis. Crime mapping and spatial analysis complements all of them and plays a crucial role in defining new forms of representation and visualization to better understand crime and to respond adequately to the problem of criminality. A new worldwide socio-economical order lead to an increasing number on crime rates and raised the need to find new ways to handle information about criminality. To better understand its causes, local, regional and national security authorities turned to new decision support tools such as Geographic Information Systems (GIS) and other information technologies to find better solutions. To understand the magnitude of all the variables involved it is necessary to spatially capture and correlate them. Only by doing that it´s possible to quantify and qualify some hidden aspects of the phenomena. The city of Lisbon with is new proposed administrative division, reducing from 53 to 24 “freguesias” (minimum administrative division and similar to parish’s) implies an enormous degree of uncertainty in the observation and location of criminal data. As the crime is not treated with an exact point, but at the level of parish, it implies that larger parishes are treated by the average crime regardless of place of occurrence. This research combines statistical methods (cluster analysis) and spatial models created with GIS, based on police crime reports. It also details a framework for short-term tactical deployment of police resources in which the objective is the identification of areas where the crime levels are high (enough) to enable accurate predictive models as well as to produce rigorous thematic maps. In recent years police services have engaged on proactive and IntelligenceLed Policing (ILP) methods. This advance was coincident with the recognition of law-enforcement solutions at local level. This paper also engages an approach to ILP as a methodology to provide the necessary tools for Decision Support System (DSS) of police departments. Keywords: crime analysis, GIS, geostatistics, intelligence-led policing, predictive dissemination, data mining
1. Introduction Over the last few years a new worldwide socio-economical order lead to an increasing number on crime rates and raised the need to find new ways to handle information about criminality. To better understand its causes, local, regional and national security authorities turned to new decision support tools such as Geographic Information Systems (GIS) and other information technologies to help them in finding better solutions. The spatial attributes of this phenomena implies quantitative and qualitative variables and to understand its magnitude, it is necessary to capture, analyze and correlate them. Statistics are an important tool in crime analysis and police forces are using it in a more effective way to discover useful information, reduce crime and maximize the use of resources. Statistics help strategic decisions and turn vast amounts of meaningless numbers into a general picture (geographically and temporally identified) of crime events. Geostatistics are also crucial when working with spatial data. That is, only through the use of geostatistics, the true value of information can be extract. By assuming that every crime point has a geographical location (in space) and that every point has a considerable amount of information added to it, we can relate all the individual information (point) with all the others to construct a complete analysis scenario. The city of Lisbon with is new proposed administrative division; reducing from 53 to 24 parishs (minimum administrative division) implies an enormous degree of uncertainty in the observation and location of criminal data. As the crime is not treated with an exact point, but at the level of parish, it implies that larger parishes are treated by the average crime regardless of place of occurrence. In recent years police services have engaged on proactive and Intelligence-Led Policing (ILP) methods. This advance was coincident with the recognition of law-enforcement solutions at local level. ISSN 1566-6379 36 ©Academic Publishing International Ltd Reference this paper as: Ferreira, J, João, P and Martins, J. “GIS for Crime Analysis - Geography for Predictive Models” The Electronic Journal Information Systems Evaluation Volume 15 Issue 1 2012, (pp36 -49), available online at www.ejise.com
Electronic Journal Information Systems Evaluation Volume 15 Issue 1 2012
This research combines statistical methods (cluster analysis) and spatial models with GIS based on police crime reports. It also details a framework for short-term tactical deployment of police resources in which the objective is the identification of areas where the crime levels are high (enough) to enable accurate predictive models as well as to produce rigorous thematic maps. It is also an approach to “Intelligence-led policing” as a strategic methodology to provide tools for decision support by police departments. Recent advances on GIS, geostatistics, information dissemination, data mining and predictive models, the study and modeling of crime data to identify patterns has emerged as a new research field. Within the scope of this chapter, some key questions will be addressed:
Can crime patterns be extrapolated in small areas such as precincts accurately enough for use in deployment, scheduling and evaluation of police effectiveness?
Can multivariate forecast models predict turning points and other new patterns?
Is it possible, by using geostatistics tools such as kriging methods, to foresee and predict the occurrence of incidents, beyond the mere descriptive models?
2. Community policing, problem-oriented policing and intelligence-led policing (ILP) Choosing between different policing approaches is probably far and beyond the control of most policemen as well as crime analysts. But however it is crucial to perceive that all the three have different aims and objectives. Community policing (CP) is more about integration of police and community. Problem-oriented policing (POP) is interested in patterns of events and intelligence-led policing (ILP) is more focused on individuals. In a real scenario it is probable that all of them could be used to obtain the best results when fighting the crime. Community policing has its origins in the lack of interaction between the police and the community. Definitions of CP appeared in several tactical police documents but according to the United States Community Policing Consortium, a group with links to the International Association of Chiefs of Police (IACP), the Police Executive Research Forum (PERF) and the National Organization of Black Law Enforcement Executives (NOBLE), community policing is a joint collaboration between the police and the community that identifies and solves community problems. Within the concept, all the members of the community become active allies in the effort for the safety and quality of neighborhood living. Mapping crime has been one of the most important trends and has grown considerably over the last few years. Crime data and modeling through Internet is a good example and although there’s few public (accessible) examples, they are beginning to appear. Problem-oriented policing could be described as an approach or process within a police department or agency “…in which formal criminal justice theory, research methods, and comprehensive data collection and analysis procedures are used in systematic way to conduct in-depth examination of, developed, informed responses to, and evaluate crime and disorder problems” (Boba, 2003:2). So, this method is not only about creating maps, not only statistical analysis, not only identify patterns with models, it is “…examining the underlying conditions of both the simple and complex problems…” that modern police has to deal and respond adequately. Because of that, mapping has to overcome the simple process of draw a pin or flag map and evolve to an understanding of structural causes that lead to crime. Intelligence-led policing originated from the idea that during the late 1980’s and early 1990’s traditional policing was not winning against the growing crime rates. The first stage in the development of ILP was in 1993 with an UK Audit Commission report titled “Helping With Enquires – Tackling Crime Effectively” (Audit Commission, 1993). Intelligence-Led Policing has as a specific “strategic, future-oriented and targeted approach to crime control (Maguire, 2000:316). The main focus is given to a prior analysis supporting decision-making processes. ILP is also more focused on individuals and groups of offenders and law enforcement solutions. Police forces are always struggling with lack of human resources to reduce crime on their jurisdiction. By analyzing and correlate information from primary sources on criminal environment, it’s possible to achieve higher efficiency levels.
www.ejise.com
37
©Academic Publishing International Ltd
Jorge Ferreira et al.
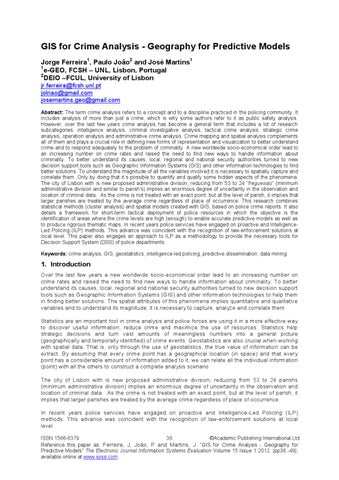
Criminal historical data are analyzed to develop new strategies and actions to reduce crime. It is a very demanding task in terms of technological means and human resources but it is the best strategy to reduce crime because it has an approach, both preventive and repressive.
Criminal environment
Intelligence
Decision-maker
Figure 1: ILP and crime reduction process (Ratcliffe, 2005) An ILP model (at its first stage) enables the interpretation of the criminal environment. This is usually performed by an intelligence department and relies on information’s sources both internal and external to the police service. The obtained information should, in an intelligence-led environment, be passed to people who can actually impact in a positive manner on the criminal environment (decision maker). This requires an intelligence structure to identify and influence the decision-makers. It should be noted that this requires both an ability to identify the decision-makers, as well as to influence their thinking, regarding the types of strategies to achieve better criminal numbers. ILP strives for greater efficiency in policing, but it has also been accompanied by other efficiency methods, some of which conflict with ILP. There is a performance culture in many police services which strives to measure every bit of data and it is a concern that the benefits of ILP will be lost in a flood of statistical operations. One of the major issues is response time. Many police services have now records of the response time to routine calls, and they build response improvement’ protocols that maximize performance. Unfortunately the research evidence is fairly conclusive: improving response times to calls does not reduce the number of crimes. The intelligence led policing model, is more difficult to implement but is also the most versatile in performance and results. The following table compares the various models of policing in terms of implementation, resources and results: Human resources
Technology resources
Costs estimate
Geography application
Expected results
Type of Information
Neiborhoud and community policing
low
high
low
high
Low
low
retrospective
preventive
Problem oriented policing
medium
high
medium
high
medium
medium
retrospective
repressive
www.ejise.com
38
Type of actuation
Implementation dificulty
Table 1: Strategic aspects of police activity
ISSN 1566-6379
Electronic Journal Information Systems Evaluation Volume 15 Issue 1 2012
Intelligenceled policing
high
low
high
medium
High
high
prospective
preventive and repressive
In recent years there has been a move within police services towards a proactive and ILP. That was coincident with the recognition of local policing solutions and the importance of intelligence function at local areas. This paper is also an approach to ILP as a strategic methodology to provide a tool for decisions makers in police departments. Knowing where the policeman becomes a crucial intervenient provides a better understanding of the intervention protocols anticipating the outcome and effect. Without such a baseline, evaluations are limited as to the purposes and sometimes anticipate consequences to police efforts. Intelligence-led policing is also about being a smart police. That means increasing the effectiveness and efficiency of police interventions through the use of the right information. Such efforts are data driven (quantitative and qualitative) and analytically rigorous, assuring than appropriate care has been taken to collect, organize and analyze information, prior to action. This ameliorates the deficiencies of rigid boundaries and moves towards a more dynamic methodology. With this new Lisbon “scenario”, from 53 to 24 parishes and assuming these administrative limits, crime analysis will become more difficult (to evaluate) due to spatial aggregation.
3. Crime mapping today From a crime mapping analysis perspective, both intelligence-led policing and problem-oriented policing place a central role. Proactive targeting of police resources based on quality analysis for the case of ILP and crime prevention resources for POP. Crime mapping will draw, measure, analyze and interpret what to do, where it should be done, what are the priorities and how to improve results. Mapping will also demonstrate future trends and patterns by modeling space and time. With the emergence of geographic information technology and its successful use as a tool for crime analysis and forecasting, the study and modeling of historical or current crime data to identify spatial crime patterns has emerged as a new research area. However in Europe, this reality is still recent (Chainey, S. et. al. 2008 & Wilson, R. et. al. 2008). Three key questions can be pointed out:
Can univariate methods be used as a mean to extrapolate accurate crime patterns in the shortrun small areas such as precincts?
Are they robust enough for use in deployment, scheduling and as counterfactuals for evaluating police effectiveness?;
Can standard crime indicators (used in multivariate forecast models) predict turning points and other new patterns like, for example, a new crime?
For some crime types, aggregation may mask important seasonal variations in smaller areas. For example, university areas may have seasonal patterns in property crimes influenced by the comings and goings of the students and teachers. Also, shopping areas may have peaks on holiday times. Law enforcement officers have been mapping crime virtually since the time that police agencies were established through the use of push pins and a paper map at the beginning of the 20 Century (Harries, 1999). By the late 70’s and early 80’s, there was a resurgence of interest in understanding and analyzing the spatial dimension of crime through the characteristics of incident, its location and geographical analysis on incident (Boba, 2009). With the development of GIS in the 90’s, law enforcement officers begun to consider the principles of geography and spatial information using new technologies in order to realize and develop mechanisms to crime prevention and the public safety. The cartographic representation has some advantages such as: help visual analysis and statistics of crime, aggregate information in spatial matrix, produce thematic maps that help to communicate the results of the analysis (Eck, J. et al. 2005 & Boba, 2009). www.ejise.com
39
©Academic Publishing International Ltd
Jorge Ferreira et al.
Harris (1990:3), states that “the purpose of maps is to communicate information”. The cartographic representation is a tool to communicate information across time and space. The diffusion of GIS into crime analysis has been a slow process, first due to costs, both hardware and software and then because of its complexity. When discussing the current use of GIS for crime analysis, activities can be divided into current and cutting edge applications (currently used in law enforcement agencies to support crime analysis activities). The use of GIS to support crime analysis activities in police day-to-day operations is a powerful tool for strategic planning (Johnson, 2000).
4. Geographical information systems and crime analysis With the ever-growing information society the amount of relations established between phenomena has grown exponentially. Technology has provided Humankind with tools to analyze and interpret such relations trough software and hardware platforms, namely geographical information systems (GIS). A geographical information system translates physical elements in the real world (roads, rivers, mountains, buildings) into forms that can be displayed, manipulated and analyzed with, for example, traffic, road accidents, demography, climate changes or for example police information about crimes, arrests or other related information. GIS uses two kinds of data models: vector and raster data. Vector data represent the basic units of spatial information: points, lines and polygons. A point feature is a discrete location, similar to a pin or flag placed on a paper map. A line feature is represented on a map by a line or a set of lines like roads, rivers or power lines. A polygon feature is a geographic area represented on a map by a multisided figure with a closed set of line segments. Buildings, parks or lakes are just a few examples. Within a GIS environment every element on the map corresponds to a record in an attribute table (row). In addition to vector data, the other is the raster data model. Raster data is an image. It could be an aerial/satellite photo or a remote sensing picture. The raster image is a grid formed by pixels and depending on its resolution they could be bigger (less resolution) or smaller (higher resolution). Each pixel has an attribute value. The use of these two data models enriches the GIS analysis. After collecting, editing and validating data, spatial analysis allows the assessment of relations, and patterns between them, and of those with the surrounding space, giving the information an operational value in geographic modelling support decision making. Since the 1960’s Geographical Information Systems (GIS) have been applied to a vast number of studies and criminality is not an exception. From its first applications in Canada, GIS has become a major instrument for an effective territorial planning. From in-car navigation, retail and commerce location, costumer geo-marketing studies to risk management, construction, weather forecasting, military planning and other application fields, GIS has consistently emerged as a killer application. However, it was only in the beginning of the 1980’s with the reducing prices of technologies (operating systems, processors, storage capacity, memory and hardware), that GIS saw a significant development on new research fields, such as crime analysis, relocation of police precincts and crime reduction strategies. From the first stage of data collection to monitoring and modeling future scenarios to evaluate how, where and when to react, GIS include a vast number of applications:
Monitoring citizen’ alerts;
Identifying areas of criminal activity – crime hotspots and other terminologies;
Allocation of police infrastructures and policeman;
Understanding in a more effective way crime distribution over space and time;
Modeling and prediction of “critical areas” through pattern analysis;
Monitoring results, resources and infrastructures;
Application of Internet as a form of communication to better disseminate information about crime statistics, police initiatives and public safety programs, etc.
www.ejise.com
40
ISSN 1566-6379
Electronic Journal Information Systems Evaluation Volume 15 Issue 1 2012
Much of the work in crime mapping and analysis was carried out in the United States by the Mapping and Analysis for Public Safety (MAPS), formerly known as the National Institute of Justice’s Crime Mapping Research Center (CMRC). This work served as a launching platform to the development of crime mapping in other countries like South Africa, Australia and United Kingdom The computerization of police records has come with a realization that this material can be used for crime and intelligence analyses (Ratcliffe, 2004). This work permits the recognition of patterns sometimes hidden and often not perceived by the police and authorities. Researchers have used crime mapping technologies to go beyond exploratory draws of crime and have been engaged in trying to discover the roots and structural causes of crimes. Those drivers are often used to observe long-term strains related to social behaviors. Geography is also necessary for advances on spatial understanding and consequently “…has contributed to many disciplines where understanding space and place is important, such as with crime” (Ratcliffe, 2004). With the new administrative divisions of Lisbon, crime analyses will be more difficult due to area aggregation. For example, on certain types of crime, aggregation will probably mask important pattern details. The comparison between the new and the old administrative divisions in Lisbon is important and the use of predictive models can help authorities and provide the necessary results to an effective decision. To proceed or not with these new administrative divisions is the major question that has to be answered shortly. And the most correct answer will depend upon a rigorous and pertinent research based on data, information, but also knowledge. The comparison between new and old administrative limits is an important exercise to perceive pattern differentiation and has obvious implications on territorial planning and public domain. The use of geostatistics tools such as predictive models and kriging methods allows, beyond the mere description of phenomena, to foresee and predict the occurrence of incidents.
5. Crime hot-spots – definitions, issues and controversies The key issue behind the hot-spots policing is the occurrence of a disproportionate number of crimes happens in particular areas in a city. For example, Sherman et al (1989) showed that 3% of addresses accounted for 50% of total crime calls to the police. Police strategies consist in finding and identify areas within the city with unusual amounts of crime to better respond to those specific areas. Traditional responses in hot spots are normally an increased police presence which leads to more arrests (Weisburd and Braga, 2006) Hot spots are the most common method used in criminal representation. It assumes that past crime locations will persist into the future, however the actual results of this method depends on the time period under review, usually this robust method only produces good results when applied to short time series. An interesting feature in the detection of hot-spots is its persistence and coincidence over time as shown by Anselin (2000), the hot-spots reflect high levels of crime initially moderate, but over time, usually, this crime will change to more violent types of crimes (e.g. acts of vandalism to crimes of theft). Therefore, should be contained and controlled in time to prevent more serious incidents to people and property in the geographic area covered by the hot-spot. According to Eck, J. et al. (2005), this method assumes that they must map the locations and not criminal occurrences thus understand why certain settings are more easily criminal occurrences while others appear to inhibit these same events. Ainsworth (2001:88) refers that "A crime hot-spot is usually understood as a location or small area with boundaries clearly identified where there is a concentration of criminal incidents, which exceed the normal for this area, the term can also be used to describe locations that showed an increase in crime a given period of time". But Ratcliffe and Chainey (2005), state that it doesn´t matter how you determine a crime hotspot, the important feature is the distribution of points within the crime hotspot area. So, the concept of hotspot www.ejise.com
41
©Academic Publishing International Ltd
Jorge Ferreira et al.
doesn’t always refer to a single point feature, but sometimes it also refers to a polygon feature. And that is crucial to GIS analysis tools. According to the same authors, the distribution can be addressed by three different spatial approaches: dispersed, clustered and hotpoint. Dispersed relates to a type of crime hotspot where crimes are distributed around the whole hotspot area. An example is the location of stolen vehicles inside a shopping area cark park. This type can be characterized by an absence of clustering in a significant location. According to the clustered definition, the hotspot is referred to as a clustered hotspot, although it does not put aside the possibility of crime events at other surrounding locations within the hotspot. The example might be a particular bar or disco that works like a crime catalyzer. The majority of times the crime will not occur there but in the proximity. The hotpoint is quite different because it’s a crime hotspot caused by the repeat victimization of a single location. The most common example is a repeated episode of burglaries at a school. Besides the spatial approach there is also a temporal approach and together they form the hotspot matrix. But due to the lack of historical statistical data, this temporal approach is often dismissed. Not because it’s less important but because from a GIS analysis perspective, time analysis comes after.
6. Descriptive statistics for crime analysis One of the most important tasks associated with crime analysis is to know data and its particularities. This data is the baseline for an intelligent analysis, however, very little of this data are accurately collected or has the necessary detail. Understanding the different types of data and their definitions is important because some types of analysis have been designed for particular types of data and may be inappropriate. Before using a GIS to analyze data, all the information must be geocoded. Geocoding is the process of linking an address with the map coordinates so that the address can be displayed on the map. Normally in crime mapping, the address of a record is geocoded to a line street segment. But it also can be geocoded by different levels of spatial scale or “resolution”, such as to the centroid of a zip code (in vector or raster data models). To obtain the most accurate and complete results, the analysis should rely on the most up to date geographical data. This is sometimes difficult to the rapid growth of urban areas and on less developed countries, illegal constructed areas. After preprocessing and geocoding all the information, data was analyzed and the dataset consisted in 35549 police records, distributed by 8 variables, according with the fallowing coding: Table 2: Data coding process Variable Day
Min 1
Max 31
Month
1
12
Hour
0
23
Minute
0
59
Type of crime
1
6
Subtype of crime
1
34
Classification
1
112
Parish
1
53
According to the Pearson’s’ coefficient correlation matrix, there was no significant correlation between the variables which let us to identify the variables as independent observations. In terms of overall information, this data represent a small part of the criminal phenomena, since there were only considered crimes reported and recorded by the Public Safety Police (Polícia de Segurança Pública – PSP).
www.ejise.com
42
ISSN 1566-6379
Electronic Journal Information Systems Evaluation Volume 15 Issue 1 2012
Table 3: Person correlation matrix Day
Month
Hour
Minute
Type
Subtype
Classification
Day
1
Month
-0,011
1
Hour
0,008
0,003
1
Minute
0,007
0,000
-0,019
1
Type
0,050
0,016
0,013
-0,020
1
Subtype
0,004
0,002
0,003
-0,004
0,020
1
Classification
-0,014
0,009
0,010
-0,009
-0,008
0,000
1
Parish
-0,002
0,005
0,007
-0,013
0,012
0,020
0,032
Parish
1
The primary dataset consist of one year of criminal offences for all individual events for 2009 in Lisbon County obtained with authorization from the PSP. The dataset include all personal and patrimonial offences. The most often studied crime is robbery occurred in public transportation. All the records have a geographic reference to a parish, which permits the classification of the offences and their mapping in a GIS. Unfortunately the accuracy is not the ideal because we don´t have the points of the occurrences which prevents us from using the georeference point but only the “parish area”. The histograms below show that the majority of crimes are robbery mainly during the evening.
Figure 2: Data histograms
6.1 Methodology Regarding the GIS methodology adopted, it was necessary to prepare the work with a set of layers and create a theme to match the expected distribution of parishes. Thematic maps showing the number of crimes or other metrics were aggregated using color palettes (darker for more crimes and brighter for less). This method is widely used because it permits the analysis by county, to observe where the crime has been committed. However, although this is also a popular method, it is unlikely that crime is fair by Municipality (e.g. Lisbon) and it can lead to interpretations that do not correspond to reality. The main reason is because the population density is different in each place. In this case, the use of ratios in the representation of colors would be the wisest choice. This type of maps creates a jurisdictional conflict between the geographical areas and administrative delimitations (or jurisdictions), when they are different (as is the case of Lisbon).
www.ejise.com
43
©Academic Publishing International Ltd
Jorge Ferreira et al.
On crime analysis, maps were initially created to show absolute values (recorded in 2009) by the Public Security Police (PSP) in Lisbon, according to the current structure of 53 parishes and the new structure of 24 parishes. This representation was the result of the geo-referenced crimes recorded in 2009 by 53 existing parishes. To represent the crimes according the new administrative structure it was necessary to aggregate data. The parish of Santa Maria dos Olivais, under the new structure will be divided into two parishes, giving rise to a new one, the Oriente. In order to estimate crime values in these two parishes, it was necessary to divide the total between the old and the new area, multiplying the current area. The result was then subtracted from the old parish with a view to obtaining an estimated average value for this new delimitation. It should be noted that these data could not be exact because a smaller area may have more or less recorded crimes. However, for research purposes, the method can be used, as long as properly referred.
Figure 3: Parish’s administrative division (actual and planning) Analyzing crime data by the actual divisions and by the new ones, it seems obvious an increase in numbers (in part due to the aggregation of values recorded in several parishes that lead to new administrative area). Significantly, the low number of crimes in the small villages of the current division changed from the first to the last value class (when aggregated the new administrative division). The data shows a very large criminal density on Oriente, but the empirical knowledge of this area can tell us that most criminal incidents occur in its (old) aggregated neighborhood. Next, the calculation of criminal density for the parish was made, dividing the total crimes per square Km in area. Regarding criminal density, the new administrative division gives the perception of a decrease in crime numbers. However, this fact is in part related to the significant increase in the area of some parishes, thus reducing the density of crimes. In order to understand how it would be the spatial representation of crime according to the city's population, it was created a criminal incidence rate, dividing the number of crimes by the population; the results were expressed in ‰.
www.ejise.com
44
ISSN 1566-6379
Electronic Journal Information Systems Evaluation Volume 15 Issue 1 2012
Figure 4: Total crimes in Lisbon
Figure 5: Ratio of total crimes per square Km in Lisbon The data used for the calculation was from 2001, the Population Census conducted by the National Statistics Institute (INE). It would be appropriate to use more recent values (for example the population in 2009) but it was not possible due to the fact that the census is made every 10 years. www.ejise.com
45
ŠAcademic Publishing International Ltd
Jorge Ferreira et al.
When it comes to an evaluation of numbers, for example criminal incidence rates, the new administrative division gives the perception of a decline. The reduction is in part due to the significant increase in the area of some parishes and their residents, thus reducing the incidence rate of crime in certain districts of the new administrative division. It is a well know fact that the southern part of the city, corresponding to the downtown district, correspond to an area that has the highest number of crimes, mainly because it is the center of major economic, financial and commercial activities. But also because it’s the main tourism “spot� in the city, which triggers criminal activity. In order to achieve different perspectives when analyzing the crime results across the city, it was decided to make the sum of the resident population with the mobility of population (population that enter and circulate in the city like daily workers and tourists), in the sense that only by analyzing the criminal statistics according to the resident population of Lisbon, may be to overemphasize the intensity of occurrence. Assuming of course that a large number of resident population plus the other group may lead to higher crime rates. (Machado, et. al. 2007:138).
Figure 6: Ratio of criminal incidence per 1000 inhabitants in Lisbon Looking at the crime rate with the local population, it is possible to observe the emergence of new parishes with a higher crime rates however, the maximum crime rate is much lower when compared to the representation only by the resident population. Finally, it was created a spatial index based on crime incidence using spatial statistical tools. This type of operation should be performed at a micro scale of analysis, statistically equal to subsection (Martins, 2010), constituting the highest level of disaggregation corresponding to the block in urban terms (Geirinhas, 2001). This index was calculated using a Geographic Weighted Regression (GWR) using spatial context of dynamic Gaussian Kernel. This operation uses the square root or log of the variables that are selected for analysis by smoothing the absolute values and approximating the curve of normal distribution in parabolic form, reducing disparities in the distribution (Longley et. al., 2005).
www.ejise.com
46
ISSN 1566-6379
Electronic Journal Information Systems Evaluation Volume 15 Issue 1 2012
Figure 7: Ratio of criminal incidence per 1000 inhabitants and presents in Lisbon
Figure 8: Spatial index of criminal incidence per 1000 inhabitants (actual and planning) The result is expressed in standard deviation units, which is repeatedly used as an index of risk (Harries, 1999). GWR provides a local model of the variable or process you are trying to understand www.ejise.com
47
ŠAcademic Publishing International Ltd
Jorge Ferreira et al.
by fitting a regression equation to every feature in the dataset. GWR constructs a separate equation for every feature in the dataset incorporating the dependent and explanatory variables of features falling within the bandwidth of each target feature. The shape and extent of the bandwidth is dependent on user input for the Kernel type, Bandwidth method, Distance and Number of neighbors parameters The dependent variable for the GWR index consisted on the criminal occurrences and as an independent variable it was used as the sum of the resident population with the mobility of population. It should be noted that this type of analysis can be a part of numerous independent variables of socio-economic development in order to identify a more realistic index. For studies with similar scales to parishes it would be appropriate but for larger areas it would be a difficult task for socio-economic values. It is also important to mention that this type of procedure (if used alone without performing a normalization of the variables) may generate incorrect analysis results (Harries, 1999) due to the fact that there are high levels of occurrence in areas with low population and this happens also with a cartographic representation of crime rates. Looking at the previous representation and using the GWR operation, it seems obvious a reduction of higher values of distribution according to population, mainly in certain areas of the new administrative division.
7. Conclusions Putting crime data into a GIS and create a map with a clear visualization and purpose is the starting point of many crime analysis. To extract information from data and to transform that information into knowledge is the primary objective of a decision-making process. But to draw a good map is always a challenging task. The importance of data quality is essential to obtain effective results but the precision of spatially referenced data is also crucial. When faced with new administrative boundaries, a territory is confronted with a new spatial adjustment. And the social and economical dynamics are very fast and unexpected. When it comes to rearrange a mix of variables like policemen on the street, relocation of precincts and a lot of other variables, decisions are difficult. The final results of this research can be vital to decide an effective police strategy. The decision to proceed with this new administrative scenario is so difficult as to decide about new ways to deal with this new territorial sketch. To decide what bases to consider and what technologies to adopt are also difficult choices. In recent years, researchers and technicians have made huge progresses in harnessing the analytic capabilities of GIS to track crime patterns over time and then use this information to create predictive models. These advances turned GIS in a valuable tool to assist and support decision-making strategies for the police forces and security services. Now that many law enforcement agencies have adopted crime mapping and have begun to produce the types of tools mentioned, they want more. The demands for more sophisticated spatial analytic techniques lead to the research on predictive models to help the prevention of the “next crime�. The crime must be examined in the context of threats and taking into account assessment of the demographic, economic, social and environmental variables that could affect the criminal act. Just seeing the real threats and developing solutions using Geography, GIS and multivariate statistics analysis, we can analyze the current map of criminality. The advanced spatial analysis came to identify crime patterns and vulnerable areas (in terms of insecurity). This type of research facilitates knowledge in order to take strategic decisions to combat the criminal phenomena. However, only at micro scale, the criminal data can be considered as useful to a strategic planning against crime. Complementing spatial analysis of crime with the empirical knowledge of the historical and cultural components of a given territory, one may identify the reason for the occurrence of a particular type of crime in a given geographical area and therefore planning and resources in order to prevent and reducing it. www.ejise.com
48
ISSN 1566-6379
Electronic Journal Information Systems Evaluation Volume 15 Issue 1 2012
Nowadays, the level of spatial analysis and modeling techniques already permit the development of tactical planning strategies to fight crime. Data gathered in a form of information and properly worked can end up in an effective decision-support tool. And that can only be achieved by a combination of technology and human knowledge. Univariate methods are limited when we try to understand the criminal occurrences; multivariate options are more reliable, with the inclusion of other variables. For police daily work this kind of study is necessary to prepare and organize all the resources as well as to implement decisions. Criminality is very complex and its remarkable dynamic nature is not easy to model with a simple multivariate statistic method. The help of sociologists and other specialized workgroups is also essential to choose the most correct and rigorous statistical models but also crucial to obtain reliable results. Geography gives the spatial coherence and GIS advances explore the true possibilities of spatial analyses.
References Ainsworth, P. (2001), Offender Profiling and Crime Analysis, UK, Devon, William Publishing. Anselin, L. et al. (2000), Spatial Analyses of Crime, Criminal Justice: Vol. 4, Washington. Audit Commission (1993), Helping With Enquiries: Tackling Crime Effectively, London, HMSO. Boba, R. (2003), Problem analysis in policing. Washington, DC: Police Foundation. nd Boba, R. (2009), Crime Analysis with Crime Mapping, SAGE Publications, Inc, California, 2 Ed. Chainey, S. & Tompson, L. (editors) (2008), Crime Mapping Case Studies: Practice and Research, John Wiley e Sons, England. Chainey, S., & Ratcliffe, J. (2005). GIS and Crime Mapping. London: Wiley. Eck, J.; Chainey, S.; Cameron, J.; Leitner, M. & Wilson, R. (2005), Mapping Crime: Understanding Hot Spots, USA, National Institute of Justice. Ferreira, J. (2008), Geography of Information Society. In The Encyclopedia of Networked and Virtual Organizations, Putnik, Goran and Cunha, Maria Manuela editors, IGI Global Publishers, Information Science Reference, London and New York, Volume II, pp. 635-642. th Ferreira, J. & Ferreira, J. (2010), Georeferencing Road Accidents with GoogleEarth. In Proceedings of the 4 European Conference on Information Technology Management and Evaluation (ECIME), ISBN: 978-1906638-72-6, ISEGI, Nova University of Lisbon, Lisboa, Academic Publishing Limited, Reading, pp. 68-76. Geirinhas, J. (2001) Conceitos e Metodologias - BGRI - Base Geográfica de Referenciação de Informação, Direcção Regional de Lisboa e Vale do Tejo/INE - 2º Semestre de 2001. Harries, K. (1999), Mapping Crime: Principle and Practice, Washington, DC, NIJ. Johnson, C. (2000), Crime Mapping and Analysis Using GIS. Geomatics 2000: Conference on Longley, P.; Goodchild, M.; Maguire, D. & Hind, D. (2005), Geographic Information Systems and Science, John nd Wiley e Sons, England, 2 Ed. Machado, P.; Pereira, A.; Rebelo, M.; Menezes, M.; Craveiro, J. & Santos, A. (2007), Metrópoles Seguras: Bases para uma Intervenção Multisectorial nas Áreas Metropolitanas de Lisboa e Porto, 2 Volume, Lisboa, LNEC – MAI. Maguire, M. (2000), Policing by risks and targets: Some dimensions and implications of intelligence-led crime control", Policing and Society, pp.3. Martins, J. (2010), Os Sistemas de Informação Geográfica na Gestão da Criminalidade em Portugal, Msc. dissertation FCSH-UNL, Lisboa. Ratcliffe, J.H. (2004),Strategic Thinking in Criminal Intelligence. Sydney: Federation Press. Ratcliffe, J.H. (2005), The effectiveness of police intelligence management: A New Zeland case study. Sherman, L.W., Gottfredson, D., MacKenzie, D., Eck, J., Reuter, P. & Bushway, S. (1998), Preventing Crime: What Works, What Doesn't, What's Promising, National Institute of Justice, Washington DC. D. Weisburd, A. Braga. (2006). Police innovation: contrasting perspectives. Cambridge Studies in Criminology; Cambridge University Press. Wilson, R. & Smith, K. (2008), What is Applied Geography for the Study of Crime and Public Safety?, in Geography & Public Safety, Vol. 1, Issue 1, February 2008, Washington, DC, COPS, NIJ, U.S. Department of Justice, pp.1–3.
www.ejise.com
49
©Academic Publishing International Ltd