33 minute read
The Effect of Water Ingress on the Thickener Structure in Bio-based Greases


By: Johanna Larsson and Roland Ardai Axel Christiernsson International AB
ABSTRACT
Environmentally adapted greases are coming into contact with water in most applications where they are used. Even when they are contaminated with water these greases are expected to provide lubrication, protect component surfaces and keep contaminants out of bearings while maintaining their rheological properties. Additionally, in the event of release into the environment, these greases need to decompose without any, or at least minimal, impact.
Previous studies performed by the authors evaluating different types of bio-greases contaminated with water have shown superior performance of anhydrous calcium greases. The ability of a grease to keep its technical performance after water ingress is related to how water interacts with and affects the thickener structure. This paper presents how different oil and thickener combinations respond to water and how this affects grease performance as lubricants at both normal operating conditions and at low temperatures.
INTRODUCTION
The more stringent government regulations worldwide have led to an increased number of enquiries and requests for bio-greases. For a grease producer, this leads to the need for continuous product development of high performing bio-greases, designed to be suitable for specific applications. Even in regions without regulations, the availability of a wide range of bio-greases makes it possible for the end-users to have the choice of using a grease with less environmental impact. But how can an end-user be sure that a good choice is made? To combine the demand for environmental behaviour and technical properties of lubricants, many countries have introduced local and general labelling programs based on voluntary schemes called ecolabels.
Ecolabels identify the environmentally preferable products within a product category, and the authorization to use an ecolabel is granted by an independent body. The purpose of the labels is primarily to provide a guide for consumers searching for “greener” products for their applications. The first ecolabelling program was set up in Germany 1977 and called the Blue Angel (Der Blaue Engel). The Nordic Swan was started in 1989, and the European ecolabel, called EU Flower, in 1992. In North America, the Environmental Choice program was started in 1998 in Canada and the US Green Seal in 1989. Also Japan set up its eco-labelling programme, EcoMark, in 1989 [1].
The world´s first government regulation requiring environmentally acceptable lubricants (EALs) for marine use is the Vessel General Permit or VGP 2013. This regulation is strongly impacting the marine industry, saving our waters and growing the EAL market. According to VGP 2013, all lubricants used in an oil-sea interface must either be EALs or compliant with an approved international eco-labelling scheme. This means that even though criteria may be different, all international eco-labelling schemes are valid for products to be considered as EALs by VGP 2013. Therefore, not only products for the marine industry are covered within VGP, but those suitable for land-based applications too. Even though the market share of bio-based greases is low overall, the need for development work is high as new regulations force a greater volume of EALs to be used [2]. And who knows what is to come? For example, VGP will be revised during 2018, and EU ecolabel is under revision already.
According to the 2015 NLGI Lubricating Grease Production Survey Report, 0.68% of the total reported global grease production used bio-based fluids. The survey shows that the demand for bio-based greases is on the rise, from a share of 0.54% in 2012, which represents a worldwide increase of 26% over a period of 4 years. Europe has the largest share of 2.44%, which reflects an increase of 39% when compared with the reported volumes from 2012 [3].
Due to the stringent government regulations and environmental concerns, research on bio-based lubricants is increasing. In addition, depleting petroleum reserves are leading to greater interest in research and development of
bio-products. Vegetable oil-based lubricants are finding applications in many environmentally sensitive and total loss applications. They possess excellent biodegradability, lower eco-toxicity, higher viscosity index, good boundary tribological properties, lower volatility and higher flash points compared to petroleum-based products [4]. Literature based on research and development of bio-based lubricants and greases helps to highlight the potential in bio-based lubricants [5]. With deeper knowledge on how to develop bio-greases, [6] [7] product performance continuously improves and the availability of suitable raw materials is high and increasing. The Lubricant Substances Classification list (LuSC-list) provides a wide selection of raw materials to use during the formulation of products suitable for the European Ecolabel [8]. To qualify for the European Ecolabel, a product should comply with requirements limiting aquatic toxicity, biodegradability, bioaccumulative potential, exclude specific hazardous substances and meet criteria for renewable raw material content.
Applications where the grease cannot be easily prevented from leaking into the surrounding environment are often referred to as loss lubrication systems, and they represent an increasingly important target market for bio-greases. If nothing stops the grease from leaking out of devices into the environment, it is also difficult to avoid the ingress of water. Even when they are contaminated with water, these greases are expected to provide lubrication, protect the lubricated surfaces and keep contaminants out of devices while maintaining rheological properties. The ability of a lubricating grease to withstand, reject or absorb water can, therefore, be of critical importance in many areas.
Historically different types of greases have been developed to combat the threats associated with water [9]. The increased concern for the environment highlights the importance of development of greases suitable for wet and cold conditions and loss lubrication systems. The ability of a grease to keep its technical performance after water ingress is related to how water interacts with and affects the thickener structure. Previous studies performed by the authors evaluating different types of bio-greases contaminated by water were made on fully formulated greases.
In this study, the authors actually took one step back at the formulation level and produced greases without the use of any polymers or additives. Their purpose was to increase the knowledge of the fundamental properties of bio-greases by performing experiments on base greases without the influence of other components. This paper presents how different oil and thickener combinations respond to water ingress and how water affects their performance as lubricants across a range of operating conditions. Two types of thickeners suitable for biogreases were selected, lithium and anhydrous-calcium soaps based on 12-hydroxystearic acid, in combination with two different base oils, rapeseed oil and biodegradable TMP ester. In real applications, water comes in many types and forms including fresh water, dirty industrial water, salt sea water, metal working emulsions, high pressure steam, and ice and snow. Experiments within this study are limited to looking at the performance of greases contaminated with deionized water.
The reason for this study was not only to learn more about the formulated base greases and how they performed when contaminated with water, but also to take the knowledge obtained from the study and apply it in the next step, developing fully formulated high performance bio-greases. Many regulations are under revision, and it is necessary to act quickly in order to meet the growing demands for high performance bio-greases!
MATERIALS and METHODS
Grease composition
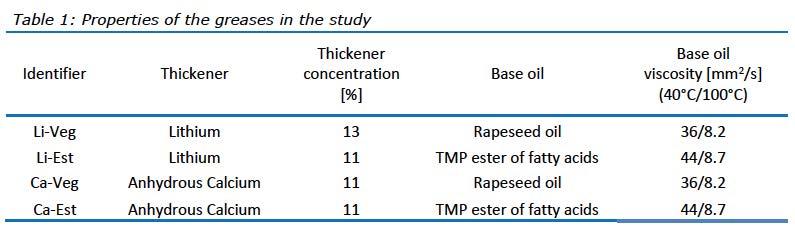
Four greases were manufactured for this study, and their important characteristics are summarized in Table 1. Each grease consists of two components; soap and base oil, which was used in both cooking and cooling procedures. The soaps were made using a metal hydroxide, either lithium or calcium, and 12-hydroxystearic acid. Components were selected based on their suitability to produce bio-greases compliant with EU Ecolabel and were formulated to NLGI 2 consistency grade.
Grease manufacturing
Manufacturing lithium grease: The lithium greases were made in a pilot reactor with a batch size of 5 kg according to standard manufacturing procedures. The soap was synthesized at around 35% of the total oil volume. The saponification step using 12-hydroxystearic acid was performed at 90°C with a hold time of 30 minutes. The temperature was then increased to the top temperature of 198°C. The cooling step was performed using 5% portions of oil with a hold time of 5 minutes. The grease was finally milled and deaerated for 1 hour.
Manufacturing calcium grease: The calcium greases were made in a pilot reactor with a batch size of 5 kg according to standard manufacturing procedures. The soap was synthesized at around 35% of the total oil volume. The saponification step using 12-hydroxystearic acid was performed with a temperature ramp starting at around 80°C up to around 110°C over approximately 4 hours. The temperature was then increased to the top temperature of 130°C. The cooling step was performed using 5% portions of oil with a hold time of 5 minutes. The grease was finally milled and deaerated for 1 hour.
Mixing water in grease
Deionized water (DW, referred to as water) was mixed homogenously into the greases using a DAC600 SpeedMixer. The amount of water in grease was defined in terms of weight
fraction. The number of mixing cycles to properly mix a specified volume of water into grease was observed, where one cycle was performed at 1800 rpm for 5 minutes. Proper mixing was obtained by observing with the naked eye if any visible droplets were formed, indicating the presence of free water. Before testing, each sample was deaerated with a final mixing cycle of 800 rpm for 2 minutes. All greases were prepared with 5, 7.5 and 10% water. After repeated attempts of 15 cycles (75 minutes total) the mixing procedure was stopped, and excess water (not incorporated into the structure of the grease) was decanted, and the actual amount of absorbed water was calculated.
Mixing water in oil
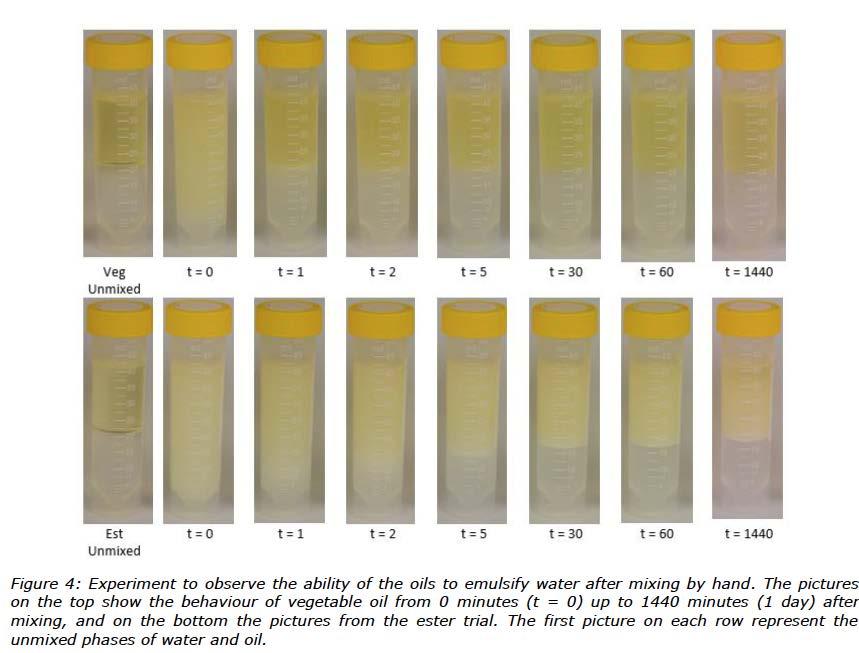
In this study, DW was added to each oil (50/50 ratio) in a sealed tube. They were mixed manually by turning the tubes upside down and back 100 times. The purpose of preparing the water-in-oil mixtures was to visually observe how the two different types of oils mix with water. Pictures were taken immediately after preparation and after storage to see how the solubility changed over time. The low temperature behaviour of the water-oil mixtures was investigated using rheological measurements (described below) immediately after samples were mixed.
Standard grease tests
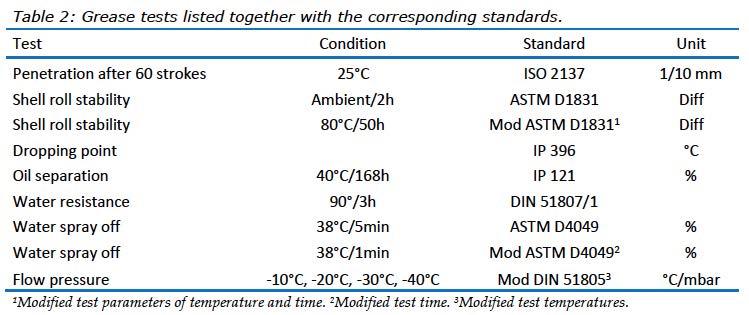
In this study, greases were evaluated using a number of tests that are common to the grease industry. These tests are suitable for base greases without additives, see Table 2.
Rheological measurements
The experiments to investigate low temperature flow behaviour were performed on an Anton Paar rheometer MCR 301 using a parallel plate setup. The stainless steel plates had a radius of 25 mm (PP50/S) and a sandblasted surface finish. A small quantity of grease was loaded onto the lower plate,
after which the gap was set at 0.8 mm. To investigate the flow behaviour at low temperatures, oscillatory measurements with a speed of 0.1% strain at constant 10 rad/s angular frequency were performed using a temperature ramp from 25°C down to -35°C with a cooling rate of 3°C/min. This gave a total of 480 data points per experiment. Temperature control was achieved to a precision of ±0,1°C. During the measurements, a Peltier hood was lowered over the plates in order to guarantee
a controlled temperature throughout the whole sample. The experiments were replicated two times using fresh specimens to check the reproducibility. The same temperature ramp test was run on the pure oils as well as water contaminated oils. All the setup parameters were the same as those used for the grease tests, but the gap was 0.2 mm. Apparent viscosity at 25°C was measured for the greases using a plate with a radius of 12.5 mm (PP25) and gap setting of 1 mm. Rotating measurements were performed with over a shear rate range of 0.1-100 s-1 giving a total of 50 data points.
Diffusion NMR
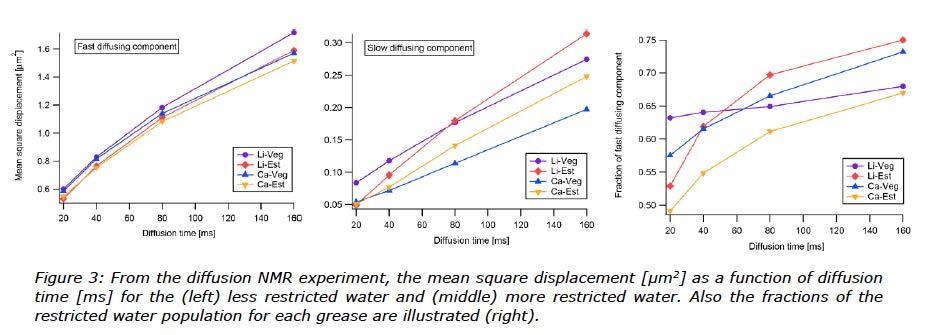
To look at how water was contained inside the greases, diffusion nuclear magnetic resonance (diffusion NMR) experiments were run on a 14.1 T (600 MHz) Bruker spectrometer equipped with a Diff30 probe at 25°C. 1H diffusion measurements were carried out in the z-direction by using a standard stimulated echo sequence. D1 was set to avoid T1 weighting. The gradient duration δ was set to 4 ms, and the time between the leading edges of the two gradient pulses Δ was increased from 20 ms to 160 s in 4 steps. The gradient strength g was varied in 16 steps depending on the choice of ∆ to get the same diffusion weighting. For each sample, 4 transients were collected. The processing (phasing and baseline correction) and integration of the water peak was done with Matlab (MathWorks Inc., USA). The normalized peak integral I versus the diffusion-weighting factor b = (γgδ)2(∆−δ/3) (γ is the magnetogyric ratio of 1H) was used to estimate the fast and slow diffusion components, Df and Ds by fitting the first 4 and the last 4 points to I = I0 exp(−Db). For the slow diffusion component, I0 reflects the fraction of slow diffusing water.
Magnetic resonance imaging – MRI
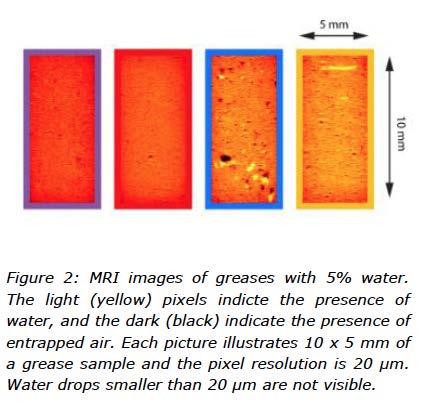
To investigate the way water was organized inside grease, magnetic resonance imaging (MRI) experiments were performed on the water contaminated greases (5% DW). A spin-echo imaging sequence was used to acquire an image of 200 µm thick grease slice with a resolution of 20 x 20 µm and a field-of-view of 10 x 5 mm. The repetition time was 1s.
RESULTS
Incorporation of water
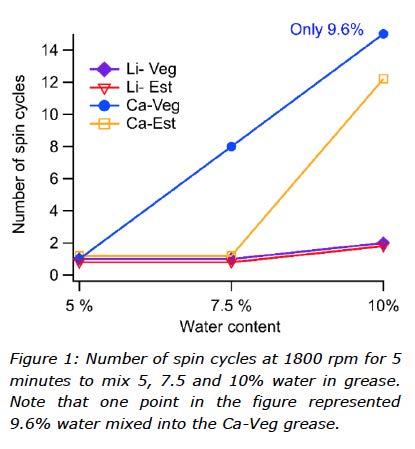
The ability of the greases to be mixed with 5, 7.5 and 10% water was determined by observing the number of required spin cycles to properly mix the total amount of water into grease. As visualized in Figure 1, 5% water required the same force (one spin cycle) to be properly mixed into all the greases, and, therefore, the majority of tests in this study were performed on the greases mixed with 5% water. This means that both the amount of water and the mixing procedure were fixed, which is beneficial for the comparison of test results, while the greases were treated in the same way.
Selected tests (rheological measurements) were also run on samples with the fixed amount of 10% water prepared using various procedures (from 10 up to 75 minutes in the SpeedMixer). In the case of Ca-Veg, despite repeated attempts of 15 spin cycles, only 9.6% water was mixed into this particular sample.
The results from the MRI experiments are images showing 5% water trapped in the greases, visualized in Figure 2. It needs to be pointed out here that the resolution of the MRI imaging is 20µm, and so very large water inclusions are visible. Compared to the MRI the diffusion NMR gave information about how water was organised in the greases on a much smaller scale.
Diffusion NMR experiments revealed two water populations in all samples: one fast diffusing and one slow diffusing. This is presented in Figure 3. The fast diffusing water population is interpreted as water structures in the grease where water molecules are less restricted in their movement, i.e. more similar to free water than the slow diffusing population. Still, the fast diffusing water population had a diffusion constant which is two orders of magnitude slower than free bulk water [10]. The slow diffusing water population can either be inside much smaller structures or dissolved in the grease. From here on, the two populations will be referred to as more restricted and less restricted water.
To learn more about the behaviour of the oils in this study when exposed to water, an experiment was performed observing the ability of oils to emulsify water. Pictures taken of unmixed oil and water were followed by pictures taken at specific time intervals after mixing. The amount of emulsified water and the colour of the mixed phase for each tube were observed. The pictures of the water-in-oil mixtures are shown in Figure 4.
Structural and thermal grease properties
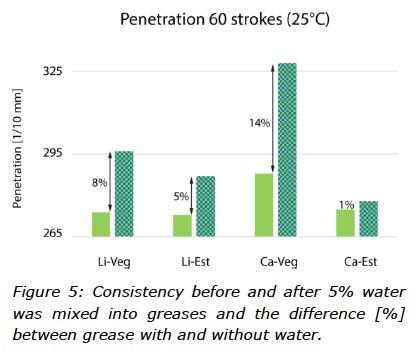
The consistency of a grease is given by the type and concentration of a thickener and the quality and distribution of the soap structure. Figure 5 shows that the greases in this study had cone penetration values in the range of 265-295 (1/10 mm), which represents NLGI grade 2 consistency. Figure 5 also shows the impact of mixing 5% water into the grease on consistency.
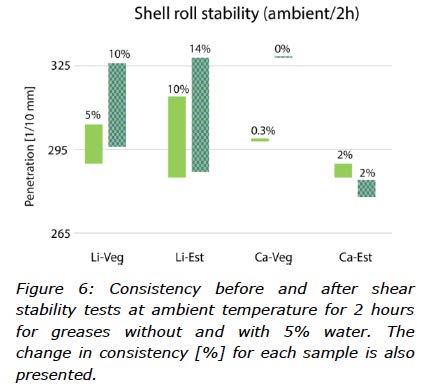
The mechanical stability is the ability of the thickener to withstand shear degradation. In this study, the Shell Roll Stability (SRS) test was used, which simulates the rolling action inside a roller bearing. The penetration values before and after the testing cycle at ambient temperature (2 hours) were measured with a ½-scale cone, and the differences were reported, see Figure 6.
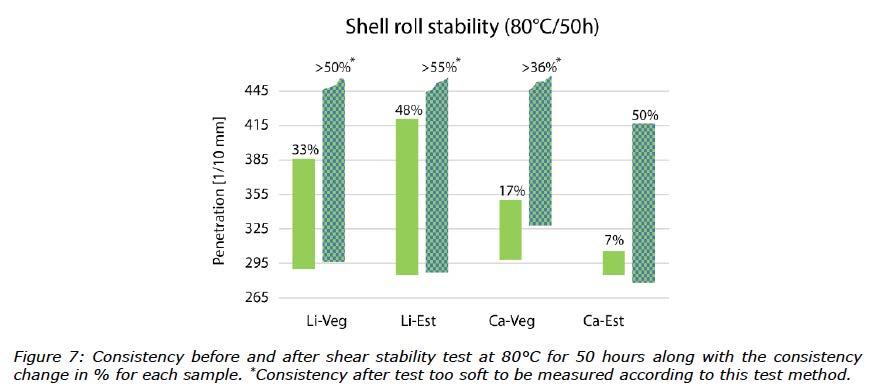
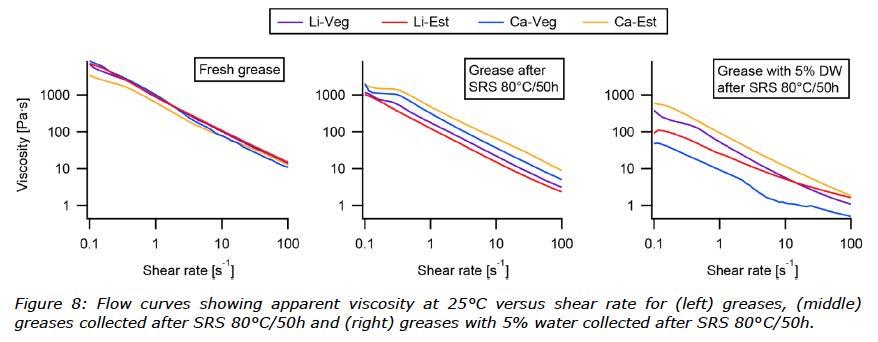
When the tests were modified using more severe conditions (80°C for 50 hours), which is used commonly to verify thermal shear stability, not all samples could be measured. Three of the samples mixed with water were too soft to be analysed in the cone penetration test; only the Ca-Est grease was measured, see Figure 7. Therefore, rheological methods for measuring apparent viscosity were also run on the greases after the SRS test (80°C for 50 hours) without and with water, and fresh greases as references. The flow curves can be seen in Figure 8.

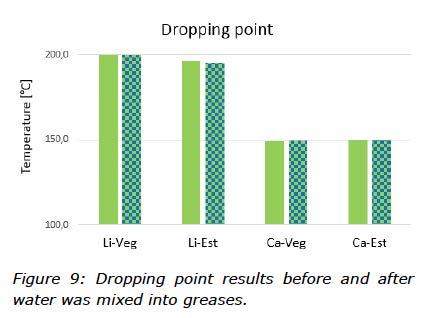
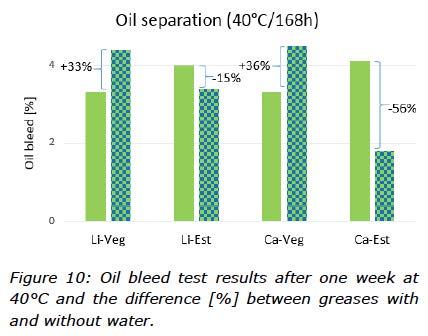
The thermal stability of the greases mixed with water was studied and the results from the dropping point test can be seen in Figure 9. Oil separation tests gave more information about the thermal behaviour of the greases and how they behaved when contaminated with water (Figure 10).
The effect of water on oil separation tests depended on the base oil. For greases formulated with vegetable oil, bleed was 33-36% greater with water than without water. The opposite was true for greases formulated with TMP ester. These results are consistent with observations that DW formed a more stable mixture with TMP ester than rapeseed oil (Figure 4). Vegetable oil based greases released more of their fluid phase than ester based greases because water separated much faster from vegetable oil than TMP ester. In addition, cone penetration tests (Figure 5) showed that water had a much greater effect on consistency of vegetable oil based greases than ester based greases. Obviously, effects of DW on grease consistency depended on both thickener type and base oil.
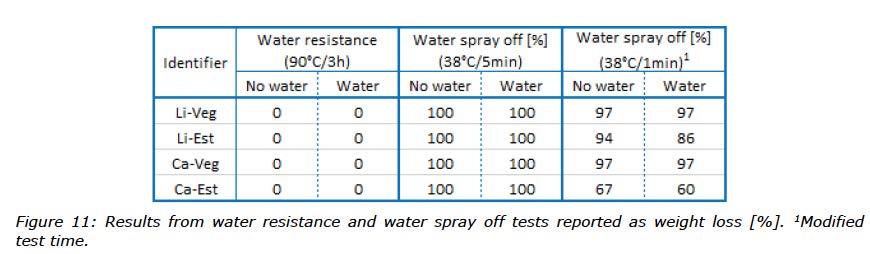
Water resistance
Two different static tests were run to evaluate the direct response of greases to water. The water resistance test evaluates the ability of a grease to resist degradation by the action of water at 90°C. The water spray off test evaluates the ability of a grease to remain on a metal surface when subjected to water spray. All greases performed very well in the water resistance test regardless of whether the samples were fresh or had been mixed with water (Figure 11).
In contrast, the more severe water spray off test resulted in 100% of the grease being sprayed off the plate for every sample. Therefore, the water spray off test was also performed with a reduced runtime of 1 minute instead of 5 minutes in an attempt to differentiate these greases. Under these modified conditions, the Ca-Est grease (67%) did outperform the others (94-97%) and, furthermore, when contaminated with water gave an even better result (60%). All results from these water tests can be seen in Figure 11.
Low temperature performance
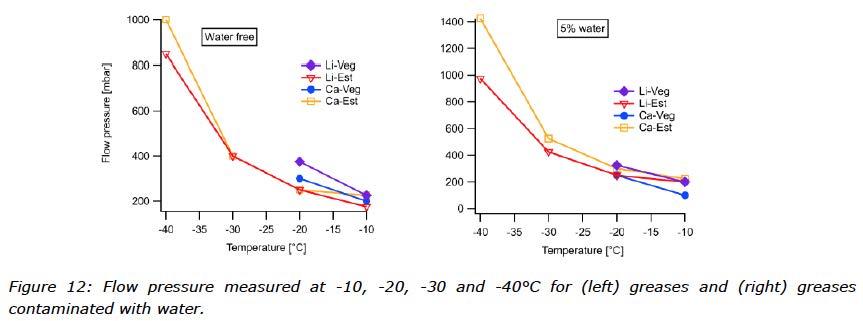
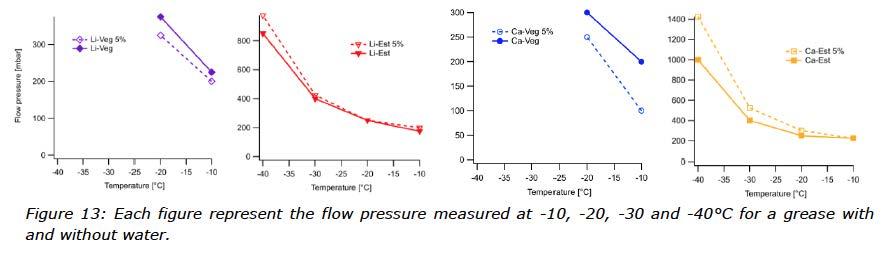
To learn about the low temperature flow properties, several tests were performed. Flow pressure is the pressure required to push an amount of grease through a specific test nozzle, at a specific temperature. The nozzle is filled with grease and connected to an air pump and a barometer. An equilibrium time of 2 hours is applied before the measurement starts. Flow pressure is a method often used to determine the low temperature performance of a grease, and the reported temperature will then be the lowest at which the applied pressure remains below 1400 mbar. For the purpose of this study, the low temperature behaviours were observed at -10, -20, -30 and -40°C with results visualized in Figure 12. How the performance of each grease changed after the water was mixed in can be seen in Figure 13. In those cases where the flow pressure exceeded 1400 mbar, pressure was not reported and considered a failed result.
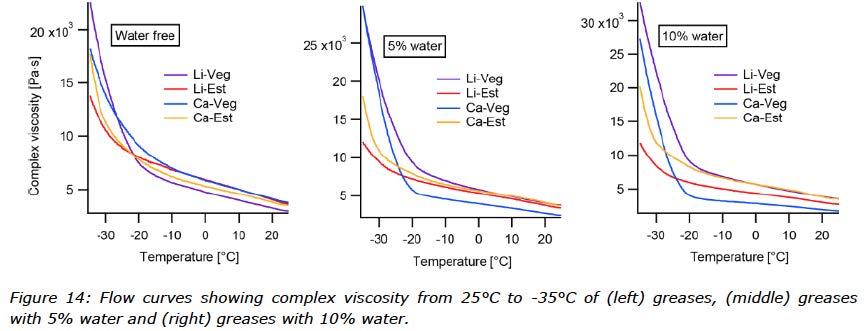
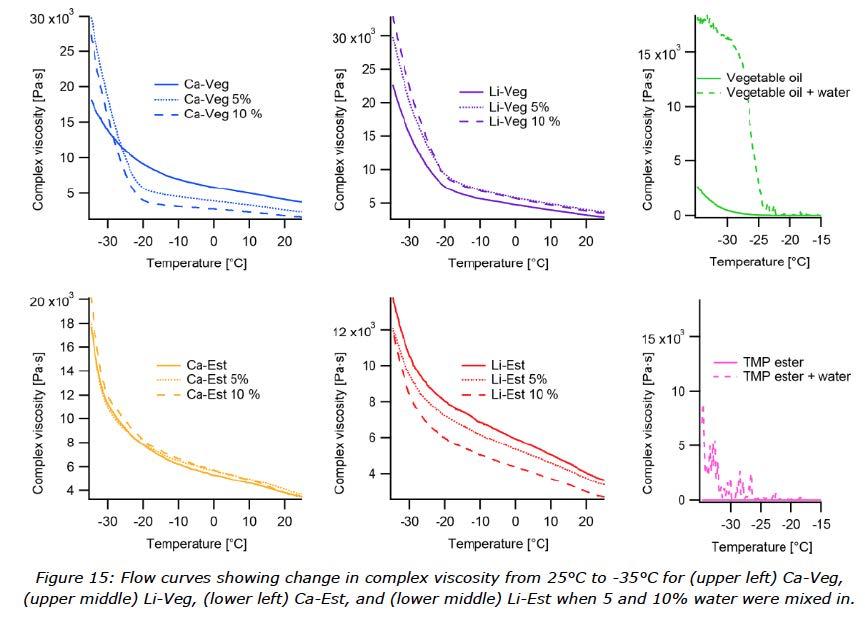
The rheological measurement performed with a temperature ramp showed the change in complex viscosity of the greases with and without water from 25°C down to -35°C (Figure 14). For this test greases contaminated with 5 and 10% water were evaluated. Figure 15 visualizes the behaviour of each grease mixed with water. To better understand the low temperature rheological behaviour of the different greases, the two oils used in the grease formulation were also measured both with and without water (Figure 15).
Incorporation of water
The first observation from the sample preparation when water was added to the greases was that calcium thickened grease showed greater resistance to water than the lithium thickened greases, which easily absorbed 10% DW. The second finding was that these two base oils affected the mixing of water into these greases, with the rapeseed oil based calcium grease showing a greater resistance to incorporation of water. Despite repeated attempts to mix in water, only 9.6% water was incorporated into the Ca-Veg grease.
The images from the MRI experiments showed that the water seemed to be organized differently depending on the type of thickener, which supports the observation from the water-ingrease mixing where the ability to incorporate water was also seen to be different for the type of thickeners in this study. Figure 2 shows that both calcium greases contained many relatively large water inclusions (larger than 20 µm), whilst there were no similar water inclusions in the lithium greases. As mentioned before, only large water inclusions could be observed using this particular MRI.
On a much smaller scale, the results from the diffusion NMR experiment helped to understand how water was taken up, or actually how the water molecules moved inside these greases. Two distinct populations of water were seen in the experiment, one less restricted and one more restricted. The experiment also gave the proportion of the two populations.
What can be seen from the diffusion NMR experiment is that there was no significant difference in less restricted water content for these greases, Figure 3. For the more restricted water, the difference is small but there is a different behaviour when it comes to the shape of the curves versus time. These graphs were more linear for rapeseed oil based greases and more bent or nonlinear for ester based greases. The explanation for a curve to appear bent is most probably caused by a difference in the shapes of the water inclusions. This would result in a changing diffusion rate over time. The same behaviour was observed when looking at the fraction of larger water inclusions, where ester based greases which increased over time (non-linear curve), and the vegetable oil based greases which appeared to be linear.
The results from the diffusion NMR experiments were not that easy to interpret. However, it seems like water was taken up differently in the greases in this study, and this appears to be linked to a combination of both the thickener and oil. From the water-in-oil experiments shown in Figure 4, differences were expected for technical behaviour of these greases contaminated with water because the TMP ester emulsified water to a much greater degree than the rapeseed oil, which separated from DW almost immediately.
Structural and thermal properties
When water was mixed into the greases, they all became softer with one (Ca-Veg) not even staying in NLGI grade 2. The opposite behaviour was observed for Ca-Est, which was almost unaffected by water (Figure 5).
In the first SRS test (ambient temperature, 2 hours) results were very good for both anhydrous calcium greases (Figure 6). With water added, both thickeners behaved differently. For lithium greases, the change in consistency doubled, whilst calcium greases remained unchanged. With the large drop in consistency when water was added to Ca-Veg, the overall performance for this sample was not very good.
In the modified, more severe SRS tests (80°C for 50 hours), calcium greases showed the best performance (Figure 7). Three greases could be considered as fluids (penetration values > 445 1/10 mm) and therefore could not be tested with the ½-scale cone. Ca-Est with water showed the best performance, even though the shear stability was poor compared to the reference grease without water. The flow curves from the apparent viscosity measurements supported the consistency measurements.
With the aim to investigate the shear stability of the water contaminated greases after the modified SRS test, the flow curves showed best performance for Ca-Est whilst Ca-Veg lost the most structure (Figure 8).
The thermal stability of the water contaminated greases were shown to be in line with the performance of the greases without water, with dropping points of 150°C for the calcium greases and around 200°C for the lithium greases (Figure 9). The oil separation test, however, showed different behaviour of the water contaminated greases compared to the greases without water. For both ester based greases, an observation was made of less oil bleed whilst the rapeseed oil based greases bled more oil (Figure 10). These results are consistent with observations that DW formed more stable mixtures with ester than rapeseed oil (Figure 4).
Water resistance
The combination of good water repellent properties and low temperature behaviour is often challenging to achieve in a single grease. For example, improved water resistance can be reached using appropriate polymers, however, this in turn can have an adverse impact on the low temperature performance of grease. Even though the greases in this study did not contain any polymers, they showed good resistance to water.
However, the much more severe water spray test showed the impact on performance of not using polymers to improve the adherence to the metal surface, resulting in 100% of all greases being sprayed off the test plate. In the modified water spray off test (test duration reduced from 5 to 1 minute), the Ca-Est grease performed better than the others and better
surface adhesion. It was observed that adhesion of both ester based greases improved when water was mixed in, whilst the rapeseed oil based greases were unchanged with near complete spray off (Figure 11).
Low temperature performance
The results from the flow pressure test of the greases without water were not difficult to predict while the type of base oil determined the low temperature behaviour of a grease, even though the soap content also contributed to the performance. The rapeseed oil based greases showed the poorest results with a low temperature performance level at -20°C. Improved low temperature flow behaviour was observed for the ester based greases at -40°C. (See Figure 12 and Figure 13).
What can be observed for the water contaminated greases was, however, more of a surprise. Instinctively, one might think that performance of grease contaminated with water should suffer in the flow test at sub-zero temperatures, but this was obviously not the case for all of these greases. Improved performance was observed for both vegetable oil based greases, meaning they showed lower resistance to flow when water was present. The opposite behaviour was shown by the ester based greases, which needed higher forces in order to flow at certain temperatures. The observations from the flow pressure test indicate that water had been incorporated differently into these greases depending on the type of oil.
How the water emulsifies in each combination of thickener and oil can affect grease response in flow pressure tests. Relatively large water crystals might adhere to the walls of the nozzle and introduce uncertainty to this test. On the other hand, water molecules might disturb the crystallization of the oil, working similar to a PPD (pour point depressant). Data from this study were not strong enough to identify or differentiate between mechanisms.
In the low temperature rheometer test, greases were investigated with contamination of 5 and 10% water. The flow curves in Figure 14 show the complex viscosity during cooling, which can be interpreted as structural changes increasing the resistance to oscillating movement. It is clear that crystallization built up during dynamic cooling. Above -20°C, the temperature ramp curves are similar and linear for greases with and without water contamination, and Li-Veg has the lowest viscosity. Below -20°C, all the curves change quickly, especially the Li-Veg which shows the highest increase in viscosity. The calcium soap in vegetable oil slows the structural change, possibly by interfering with the crystallization of the vegetable oil. Ester based greases outperformed the vegetable oil based greases, which correlated with the lower pour point of the oil, but the two soaps had different effects. The Ca-Est quickly built up structure below -30°C. As seen in Figure 15, the performance of water contaminated greases changed dramatically for Ca-Veg, whereas Ca-Est did not change at all.
Starting with Li-Veg, there was an increased viscosity in the case of water contamination. It seems like the water increased the flow resistance in general but did not change the shape of the curves, so the interaction between the soap and the vegetable oil did not change, but was reinforced by water. The Li-Est decreased in viscosity when contaminated with water. This trend was the opposite of Li-Veg, but the same behaviour when it comes to unchanged shape of the curves. This could mean that the water incorporated properly (as seen in the MRI experiment), softened the soap structure (the TMP ester allows more water to emulsify than for the vegetable oil) but had no chance to crystalize separately.
For Ca-Veg, it looked like water ingress affects the structure, but below -20°C the water started to freeze and sharply increased the flow resistance. This was a consequence of the big size of water droplets in the grease structure (Figure 2) combined with the resistance of water to emulsification in rapeseed oil. The soap probably separated and was not able to perform in the same way as in the more homogenous grease without water. The change of the curve shape also supported the possibility of two partly separated phases, and the inflection point was the temperature at which the water phase started to change and boosted the resistance of the crystalizing vegetable oil.
The effect of water contamination is negligible in the case of the Ca-Est grease. This behaviour was predictable by seeing water resistance of this kind of product in the past, but the image from the MRI experiment showed big water droplets which may lead one to expect a similarity in effect shown by the Ca-Veg sample. At least a change in the shape of the curves was expected, but nothing remarkable happened. The explanation of this can most probably be found in the behaviour of the TMP ester when mixed with water, as seen in Figure 4. Big water drops in the calcium grease have less resistance to be mixed with the TMP ester compared to the case with rapeseed oil with a much larger resistance to mix and a higher chance to crystalize.
Overall, the low temperature rheometer tests showed that the viscosity of one grease did not change when water was incorporated (Ca-Est), one increased (Li-Veg), one decreased (Le-Est) and one behaved differently (Ca-Veg) from the others. To understand the correlation between the impact of the base oil and the water contamination, the same test was run with pure base oils and water contaminated base oils. The results in Figure 15 showed that the viscosity did not change noticeably across the temperature range for the ester, but viscosity did start to increase around -25°C for the vegetable oil.
With water contamination, both base oils started to show irregularities in the viscosity at -20°C. Below -25°C for the water contaminated vegetable oil, viscosity sharply increased as a crystalized structure built up. Below -30°C the water contaminated ester showed increasing irregularities but it did not build up a solid system until -35°C. Unfortunately, -35°C is the lowest temperature that can be achieved with
the rheometer used in this study. Below -35°C the water contaminated ester probably increased viscosity, but the momentum of the increase is a very interesting question and future studies will include tests performed with prolonged cooling rates to further investigate these phenomena.
CONCLUSIONS
In this study, calcium and TMP ester were shown to be the best combination of thickener and oil to keep the soap structure unchanged when 5% water was added. The rapeseed oil based greases showed the highest drop in consistency, but only one of them, the combination with calcium (Ca-Veg), changed to the extent that it was no longer NLGI grade 2 after water was mixed in.
The combination of calcium and TMP ester also showed the best ability to withstand shear degradation after water ingress even when the temperature was elevated to 80°C. This means that even if the thermal stability of the lithium greases was higher than the calcium greases, as measured by the dropping point, the calcium greases showed better combination of shear and thermal stability.
The oil separation test gave an indication as to the different behaviour of the greases mixed with water depending on the base oil, with TMP ester based greases showing less oil bleed than the equivalent rapeseed oil based samples. In tests performed on the water contaminated greases, the modified water spray off test showed benefits for the ester-based greases and, in particular, for the calcium thickened grease (Ca-Est). The low temperature tests, in cases of water contamination, showed in general a better performance by the ester-based greases, which is expected from the technical properties of the oils. In the rheometer test, there was superior low temperature performance in the case of water contamination of grease formulated with calcium soap and TMP ester (Ca-Est). It was obvious that these greases behaved differently, which was most probably due to how water was taken up and organized within these grease structures.
The conclusion from previous studies was that the type of thickener rather than the type of oil seemed to determine how water was taken up by grease [11]. This paper gave the opportunity to perform a deeper investigation, and the findings indicated that a combination of both oil and thickener contributed to the performance of grease contaminated with water. Calcium greases showed a greater resistance to allowing water into the thickener structure, and the big droplets formed were in turn affected by the properties of the oil, with the TMP ester that emulsified water to a much higher degree than rapeseed oil showing a much better resistance to the mix in of water.
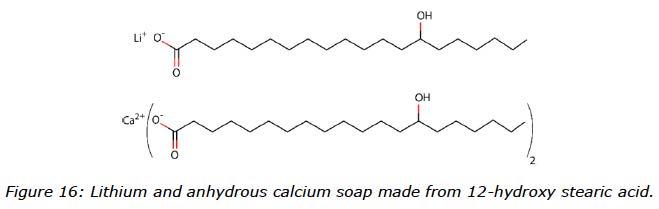
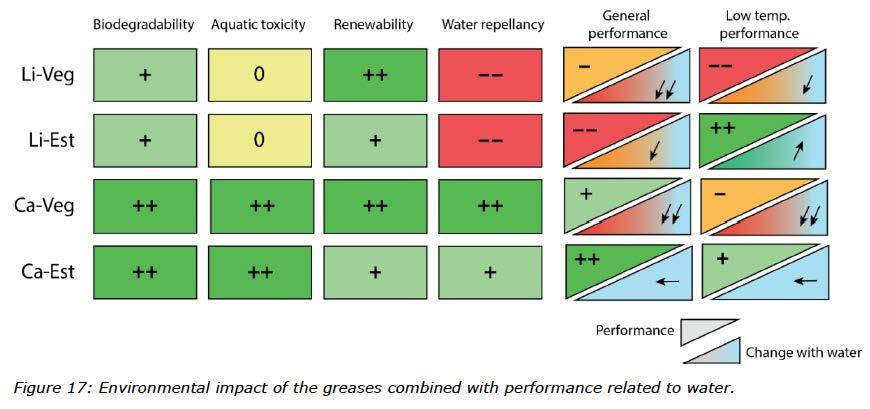
The lithium greases incorporated water easily, and for this type of thickener, the choice of oil seemed to be less important. To get a better understanding of the different grease structures, Figure 16 visualizes schematically lithium and anhydrous calcium 12-hydroxy stearate soaps. With the visual soap structures and the ability of the oils to incorporate water, it is obvious that greases made with different thickener types and base oils with different characteristics play a significant role when it comes to the capacity to incorporate water. Of the oils used in this study, the TMP ester showed less resistance to emulsify water whilst the rapeseed oil almost immediately separated from the water. The summary in Figure 17 shows environmental impacts of these greases combined with performance related to water.
As seen in this study, the soap and base oil combination is essential to handle highly water contaminated lubricating points where EAL greases are used. The performance is not connected exclusively to the soap or to the oil; it is a combination of the two that is important. The knowledge gained during these experiments will help in formulating improved products for specific applications. But if previous studies on fully formulated greases are taken into consideration, it cannot stop here. The additives, and especially the tackifiers, will significantly influence grease performance in the presence of water.
The investigation of bio-greases is planned to continue one step further in order to more deeply examine EAL compliant oils and additives, and to add new building blocks to the knowledge of environmentally adapted greases.
ACKNOWLEDGEMENTS
The authors would like to acknowledge Diana Bernin at the Swedish NMR Centre at the University of Gothenburg for assistance in running and interpret the NMR and MRI experiments. The authors would also like to acknowledge the support from their colleagues in the R&D laboratory at Axel Christiernsson International AB. In particular the authors would like to acknowledge Johan Leckner for general support. Furthermore, the authors would like to thank test engineers, Camilla Sköld, Thord Vångerstrand and Katja Eriksson for their efficient testing of the greases.
REFERENCES
[1] H. Baumann and A. Tillman, The Hitch Hiker´s Guide to
LCA, Lund: Studentlitteratur, 2004, pp. 255-276. [2] D. Sniderman, “VGP 2013: Propelling marine lubricants,”
Tribology & Lubrication Technology, pp. 32-40, 2017. [3] “NLGI Grease Production Survey Report 2015,” NLGI,
Missouri, 2016. [4] B. Sharma and G. Biresaw, Environmentally friendly and biobased lubricants, Boca Raton: CRC Press, 2017. [5] L. Honary and E. Richter, Biobased Lubricants and
Greases: Technology and Products, Chichester: John
Wiley & Sons, 2011. [6] G. Fish, “Technology for Sustainable Grease
Development,” in ELGI 28th Annual General Meeting,
Venice, 2016. [7] R. Ardai and J. Persson, “How to grow a flower on a grease can,” in Lubmat, Bilbao, 2016. [8] [Online]. Available: http://ec.europa.eu/environment/ ecolabel/documents/lusclist.pdf. [9] “H2O, Friend or Foe? Lubricating greases for wet conditions,” Axel Christiernsson, 2008. [10] K. Tanaka, “Self-diffusion coefficients of water in pure water and in aqueous solutions of several electrolytes with O and H as tracers,” J. Chem. Soc., Faraday Trans, vol. 1, no. 74, pp. 1879-1881, 1978. [11] J. Persson and R. Ardai, “Anhydrous Calcium grease - a high performance Eco labelled grease,” in Nordtrib 2016,
Hämeenlinna, 2016.
Be featured in NLGI Member Spotlight!
All NLGI members may take advantage of this opportunity to highlight your company’s history, global reach, vision, employees or whatever you’d like our readership to know about your company. You may talk about products & services, however, no competitor trade names may be used, nor mention of product pricing.
There is no limit on words and we welcome many photos of your headquarters, offices, plant & employee photos. We will accept articles for publication on a first received, first published basis. Contact Denise Roberts denise@nlgi.org at NLGI if you would like to submit an article for possible publication in an upcoming issue.
There is absolutely no charge to have your article appear in the NLGI Member Spotlight.