ECONOMY
GLOBAL ECONOMY
NATIONAL ECONOMY
Global growth in 2017 was more robust than expected, reaching 3.7% on the back of strengthening economic performances in Europe and Asia in particular. This momentum is forecasted to be maintained into 2018 with growth projected to rise to 3.9%. In recent months the US economy has posted strong economic results and activity is expected to be further stimulated by a new package of tax measures. Temporary tax allowances for investment and corporate income tax reductions were approved in December 2017, and are likely to encourage investment in the economy over the short- to medium-terms. Projected growth rates for 2018 and 2019 have thus been revised upwards to 2.7% and 2.5% respectively. The Eurozone’s economy performed better than expected in 2017, recording growth of 2.4%. Both domestic and external demand increased for many States in the monetary union and drove robust economic expansions, notably in Germany, Italy and The Netherlands.
The Quarterly National Accounts for Q3 2017 showed exceptionally strong levels of growth in the Irish economy with GDP expanding by 10.4% YoY. This stronger than expected growth was affected by the presence of large multinationals in Ireland, but was also driven by a number of domestic factors. Personal consumption is an important barometer of the health of the domestic economy and showed a robust rate of growth of 2.8% YoY in Q3 2017. Goods purchases expanded at the sharpest rate with the CSO reporting that medical goods and appliances performed particularly strongly, and the latter is considered a significant development given that it underlines the willingness of consumers to undertake big ticket purchases. On a sectoral basis, the information & communication sector was the strongest performer YoY with growth of over 12% in Q3. The Manufacturing sector, which is by some distance the largest sector in the State, also recorded robust growth with a YoY expansion of close to 9%.
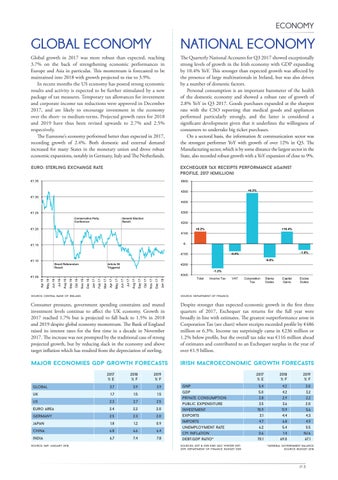
euro: sterling exchange rate
exchequer tax receipts performance against profile, 2017 (€million)
€1.35
€600 +6.3%
€500
€1.30 €400 €300
€1.25 Conservative Party Conference
General Election Result
€200
€1.20 €100
+0.2%
+16.4%
€-
€1.15
-9.8%
€1.10
Brexit Referendum Result
-€200
Article 50 Triggered
Jan 18
Dec 17
Oct 17
Nov 17
Sep 17
Jul 17
Aug 17
Jun 17
Apr 17
May 17
Mar 17
Jan 17
Feb 17
Dec 16
Oct 16
Nov 16
Sep 16
Jul 16
Aug 16
Jun 16
Apr 16
-€300
May 16
€1.05
-1.0%
-0.5%
-€100
-1.2% Total
Income Tax
VAT
Corporation Tax
Stamp Duties
Capital Gains
Excise Duties
source: central bank of ireland.
source: department of finance.
Consumer pressures, government spending constraints and muted investment levels continue to affect the UK economy. Growth in 2017 reached 1.7% but is projected to fall back to 1.5% in 2018 and 2019 despite global economy momentum. The Bank of England raised its interest rates for the first time in a decade in November 2017. The increase was not prompted by the traditional case of strong projected growth, but by reducing slack in the economy and above target inflation which has resulted from the depreciation of sterling.
Despite stronger than expected economic growth in the first three quarters of 2017, Exchequer tax returns for the full year were broadly in line with estimates. The greatest outperformance arose in Corporation Tax (see chart) where receipts exceeded profile by €486 million or 6.3%. Income tax surprisingly came in €236 million or 1.2% below profile, but the overall tax take was €116 million ahead of estimates and contributed to an Exchequer surplus in the year of over €1.9 billion.
major economies gdp growth forecasts
irish macroeconomic growth forecasts
global
2017 %E
2018 %f
2019 %f
3.7
3.9
3.9
uk
1.7
1.5
1.5
us
2.3
2.7
2.5
euro area
2.4
2.2
2.0
germany
2.5
2.3
2.0
japan
1.8
1.2
0.9
china
6.8
6.6
6.4
india
6.7
7.4
7.8
source: imf, january 2018.
gnp gdp private consumption public expenditure investment exports imports unemployment rate cpi inflation debt:gdp ratio* sourceS: 2017 & 2018 esri qec winter 2017. 2019: department of finance, budget 2018
2017 %E
2018 %f
2019 %f
5.4 5.0 2.8 3.5 15.9 3.1 4.7 6.2 0.6 70.1
4.2 4.2 2.9 3.6 11.9 4.4 6.8 5.4 1.4 69.0
3.0 3.2 2.2 2.0 5.6 4.3 4.9 5.5 N/A 67.1
*general government balance. source: budget 2018.
// 3
Dublin Economic Monitor - JAN 2018.indd 3
31/01/2018 11:54