DUBLIN ECONOMIC MONITOR
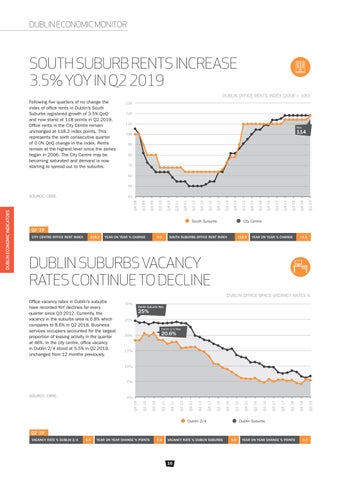
SOUTH SUBURB RENTS INCREASE 3.5% YOY IN Q2 2019 DUBLIN OFFICE RENTS INDEX (2006 = 100) Following five quarters of no change the index of office rents in Dublin’s South Suburbs registered growth of 3.5% QoQ and now stand at 118 points in Q2 2019. Office rents in the City Centre remain unchanged at 118.2 index points. This represents the sixth consecutive quarter of 0.0% QoQ change in the index. Rents remain at the highest level since the series began in 2006. The City Centre may be becoming saturated and demand is now starting to spread out to the suburbs.
130 120 110
Max
114
100 90 80 70 60 50
South Suburbs
Q2 19
Q4 18
Q2 18
Q4 17
Q2 17
Q4 16
Q2 16
Q4 15
Q2 15
Q4 14
Q2 14
Q4 13
Q2 13
Q4 12
Q2 12
Q4 11
Q2 11
Q4 10
Q2 10
Q4 09
Q2 09
Q4 08
40
City Centre
Q2 ‘19 CITY CENTRE OFFICE RENT INDEX
118.2
YEAR ON YEAR % CHANGE
0.0
SOUTH SUBURBS OFFICE RENT INDEX
118.0
YEAR ON YEAR % CHANGE
+3.5
DUBLIN SUBURBS VACANCY RATES CONTINUE TO DECLINE DUBLIN OFFICE SPACE VACANCY RATES % Office vacancy rates in Dublin’s suburbs have recorded YoY declines for every quarter since Q3 2012. Currently, the vacancy in the suburbs area is 6.8% which compares to 8.6% in Q2 2018. Business services occupiers accounted for the largest proportion of leasing activity in the quarter at 46%. In the city centre, office vacancy in Dublin 2/4 stood at 5.5% in Q2 2019, unchanged from 12 months previously.
30%
Dublin Suburbs Max
25% 25%
Dublin 2/4 Max
20.6%
20%
15%
10%
5%
SOURCE: CBRE.
Dublin 2/4
Dublin Suburbs
Q2 ‘19 VACANCY RATE % DUBLIN 2/4
5.5
YEAR ON YEAR CHANGE % POINTS
0.0
VACANCY RATE % DUBLIN SUBURBS
16
6.8
YEAR ON YEAR CHANGE % POINTS
-1.7
Q2 19
Q4 18
Q2 18
Q4 17
Q2 17
Q4 16
Q2 16
Q4 15
Q2 15
Q4 14
Q2 14
Q4 13
Q2 13
Q4 12
Q2 12
Q4 11
Q2 11
Q4 10
Q2 10
0% Q4 09
DUBLIN ECONOMIC INDICATORS
SOURCE: CBRE.