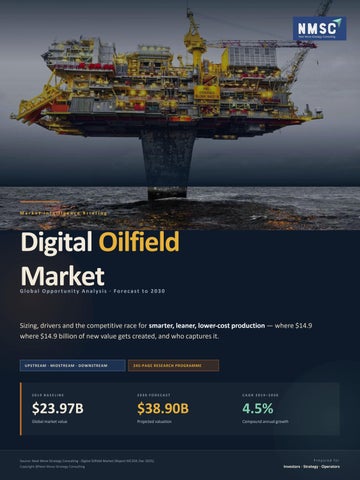
Market Intelligence Briefing
Digital Oilfield Market Global Opportunity Analysis · Forecast to 2030
Sizing, drivers and the competitive race for smarter, leaner, lower-cost production — where $14.9 where $14.9 billion of new value gets created, and who captures it.
UPSTREAM · MIDSTREAM · DOWNSTREAM
245-PAGE RESEARCH PROGRAMME
2019 BASELINE
2030 FORECAST
CAGR 2019–2030
$23.97B
$38.90B
4.5%
Global market value
Projected valuation
Compound annual growth
Source: Next Move Strategy Consulting · Digital Oilfield Market (Report MC359, Dec 2025). Copyright @Next Move Strategy Consulting
Prepared for
Investors · Strategy · Operators
Digital Oilfield Market
Market Landscape A $38.90 billion market by 2030, compounding at 4.5% — driven by cost-per-barrel discipline, not hype cycles.
Global market value trajectory
USD billion · 2019 vs 2030
$38.90B $23.97B CAGR
4.5% +$14.93B absolute value added over the forecast window
2019
2030F
Segmentation by process
Segmentation by component
Four reporting segments
Where the value accrues
Production Optimization Real-time output & flow assurance
Drilling Optimization Rig downtime & well-path efficiency
Reservoir Optimization
Software
Highest margin pool
Services
Recurring revenue engine
Hardware
Modelling & improved recovery rates
Other Processes
Install-base gateway
Bars show relative strategic attractiveness, not revenue share. Segment revenue splits are detailed in the full report.
Safety, HSE & asset integrity
Executive summary 1
Digitalization is an efficiency play, not a volume play. Automation across upstream, midstream and downstream lifts recovery and cuts rig downtime — margin expansion is the investable thesis.
2
A 4.5% CAGR signals a maturing, defensible market. Growth is steady rather than explosive — favouring incumbents with installed base and multi-year service contracts over speculative entrants.
3
North America holds the lion's share, on re-engineered oilfield solutions and new reserve discoveries; Europe follows on mature North Sea assets and developed infrastructure.
4
Cybersecurity is the binding constraint. Rising attack volume and data-security concerns are the report's named restraint — and simultaneously the fastest-opening adjacent services opportunity. Industry ecosystem · value chain
Sensors & SCADA
Connectivity
Analytics & AI
Decision support
Field execution
Edge data capture
Remote telemetry
Modelling layer
Integrated ops centre
Output & safety gain
Source: Next Move Strategy Consulting, Digital Oilfield Market (Report MC359, Dec 2025). Copyright @Next Move Strategy Consulting
SLIDE 02 / 06
Digital Oilfield Market
Growth Drivers & Opportunities Demand is anchored in production-cost compression; the upside sits in Asia-Pacific volume and software-led service contracts.
Demand drivers
Crude demand from developing economies
Mandate to cut production cost
Automation & remote decision making
Operator capital into legacy fields
Rising industrial and population-led consumption keeps barrels in demand while operators are forced to defend unit economics.
Digital tooling is the primary lever for lowering lifting cost per barrel — the single most cited adoption trigger in the report.
Effective measurement, analysis and modelling enable remote management and intelligent, faster intervention.
Surging investment by major players to re-engineer existing oilfield processes expands the addressable retrofit base.
Regional opportunity map
High-growth segments
Share position vs growth velocity
Where to lean in
North America
Production Optimization
~33–34%
Closest to cash flow — output uplift shows on the next production report.
Leading share · re-engineered solutions, new reserve discoveries
Europe
Drilling Optimization
Significant
Reduced rig downtime converts directly into day-rate savings.
Mature North Sea assets · developed infrastructure base
Asia-Pacific
Software & analytics
Fastest growth
Upgrade cycles and new launches create repeatable, highermargin revenue.
Low-cost production · rapid, consistent solution uptake
Middle East
OT cybersecurity
Scale assets
The report's named restraint — and therefore an attached services opportunity.
Saudi Arabia, UAE, Iraq, Kuwait, Qatar national-oil programmes
Onshore skew
Latin America
Emerging
Brazil pre-salt & Venezuela reserves · earlier adoption stage
Onshore assets account for the dominant application share (~76%), keeping retrofit volume — not frontier offshore — the core demand pool.
Bar lengths indicate relative positioning. North America share band triangulated from Grand View Research (34.0%, 2025) and Fortune Business Insights (33.2%, 2025); regional ranking per Next MSC.
What this means 1
Underwrite cost savings, not oil price. The adoption case is lifting-cost reduction and improved recovery — it holds through commodity cycles, which de-risks the revenue forecast.
2
Asia-Pacific is the share-shift story. Low-cost production plus accelerating solution acceptance make it the region where incremental share is genuinely contestable.
3
Software upgrades and launches are the opportunity the report flags. Strategic collaborations paired with product refresh cycles convert one-off hardware sales into annuity revenue.
4
Price the cyber risk explicitly. Increasing attacks and data-security concerns are expected to inhibit growth; vendors that bundle OT security remove the top procurement objection.
Opportunity headline
$14.93B of incremental value is created between 2019 and 2030 — capture depends on region and component mix, not on drilling more wells.
Primary source: Next Move Strategy Consulting, Digital Oilfield Market (MC359, Dec 2025). Secondary: Grand View Research; Fortune Business Insights (regional share, application skew). Copyright @Next Move Strategy Consulting
SLIDE 03 / 06
Digital Oilfield Market
Competitive Scenario An extremely competitive field of 12 profiled players, where alliances and acquisitions — not price — defend dominance.
Competitive positioning matrix
Integration breadth × digital depth
Digital specialists
Integrated leaders
Schlumberger
Emerson Electric
Digital / software depth →
Honeywell Halliburton
Baker Hughes
IBM
GE
NOV
Siemens Pason
Sinopec OFS
Weatherford
Niche / regional
Equipment-led scale
Integration breadth & field -service footprint → Bubble size reflects relative scale of digital-oilfield presence. Player roster per Next MSC report MC359; quadrant placement is NMSC analytical interpretation of disclosed portfolio breadth, not a revenue-share ranking.
Key strategies in play
Structural read-through
Named moves from the report
Concentration & consolidation
Strategic alliances — the primary lever cited for maintaining dominance. Acquisitions — buying capability rather than building it, to close portfolio gaps fast. New product launches & software upgrades — the report's stated opportunity channel. Process re-engineering investment — majors funding upgrades to their own installed oilfield base.
12
Major players profiled — a concentrated field with high technical barriers to entry.
~52%
Share of the publicly listed oilfield-services market held by SLB, Baker Hughes and Halliburton combined (FY2025).
$1B+
SLB digital annual recurring revenue crossed $1bn (Q4 2025) — proof the software model monetises at scale.
Investor read 1
The top quadrant is occupied, not contested. Schlumberger, Halliburton and Baker Hughes pair global service footprints with proprietary digital stacks — displacing them head-on is capital-inefficient.
2
Industrial-automation entrants attack from the software side. Emerson, Honeywell, Siemens and IBM bring control-systems and analytics depth without oilfield-services legacy cost.
3
Specialists are acquisition targets, not standalone compounders. Pason, NOV and Sinopec OFS hold defensible niches — the likely value event is being bought into an integrated stack.
4
Partnership access beats build-from-zero. With alliances the dominant named strategy, the fastest route into this market is co-selling with an incumbent's installed base.
Primary source: Next Move Strategy Consulting, Digital Oilfield Market (MC359, Dec 2025). Secondary: public FY2025 OFS revenue-share analysis; SLB Q4 2025 digital ARR disclosure. Copyright @Next Move Strategy Consulting
SLIDE 04 / 06
Digital Oilfield Market
Strategic Outlook Three tailored plays — and the risk register each audience should price before committing capital.
Tailored implications by audience
For investors
For internal strategy
For B2B buyers
Buy the annuity, not the rig cycle
Sequence APAC before frontier offshore
Contract for outcomes, not licences
A 4.5% CAGR on a $24bn base is a quality-of-
With onshore assets at roughly 76% of application
Tie vendor payment to rig-downtime reduction
earnings story — recurring software and service
share, retrofit volume beats greenfield
and recovery uplift — the two benefits the report
contracts, not commodity beta.
complexity.
names explicitly.
Screen for disclosed digital ARR and attach rate,
Asia-Pacific shows the fastest, most consistent
Demand interoperability guarantees; the
uptake — prioritise channel build there over share
hardware install base is the lock-in mechanism.
not headline oilfield revenue.
defence in saturated North America.
Specialist niche players are the realistic M&A entry point into a concentrated field.
Use the alliance-heavy landscape as negotiating Bundle OT cybersecurity into the core offer to
leverage — multiple integrated stacks can serve
neutralise the market's named restraint.
the same asset.
Risk register Risk factor
Restraints & mitigations Severity
Mitigation lever
Cyber-attacks & data security
HIGH
Embed OT-grade security and audited data governance in every deployment scope.
Commodity-price volatility
MEDIUM
Anchor the business case on cost-per-barrel savings, which persist through price troughs.
Legacy-asset integration debt
MEDIUM
Phase retrofits process-by-process; prove value on production optimization first.
Energy-transition capital shift
WATCH
Position digital spend as the emissions-and-efficiency lever, not incremental extraction capex.
Action roadmap to 2030 H O R IZ O N 1 · 0 –1 2 MO NTH S
H O R IZ O N 2 · 1 –3 Y E A R S
H O R IZ O N 3 · 3 –7 Y E A R S
Prove production-optimization ROI on a single
Scale across the onshore portfolio; enter Asia-
Own the integrated operations layer across the
asset
Pacific via partners
value chain
Establish a measured downtime and recovery baseline to underwrite scale-up.
Convert pilots into multi-year service agreements with security bundled in.
Shift revenue mix toward software and analytics as the market approaches $38.9bn.
The bottom line
This is a margin-expansion market with a concentrated incumbent core. Returns accrue to whoever converts the installed hardware base into secured, software-led recurring revenue.
Primary source: Next Move Strategy Consulting, Digital Oilfield Market (MC359, Dec 2025). Audience implications and horizon roadmap are NMSC analysis built on report findings. Copyright @Next Move Strategy Consulting
SLIDE 05 / 06
Next Move Strategy Consulting
Thank you Let's turn this market view into your next move. Connect with our analysts for indepth insights, custom segmentation, and strategic guidance tailored to your portfolio or growth plan. Get in touch
Official website
Contact number
nextmsc.com
+1 857 758 5017
info@nextmsc.com
https://www.nextmsc.com/
Analyst desk · global enquiries
Report & custom-research requests
Call to action
Access the complete report
nextmsc.com/report/
245 pages · 135 tables · 105 figures · Report code MC359 digital-oilfield-market
Follow us gen-dedup-9cb8d97fbad94c450f3e644ccd69f008.png
in LinkedIn
f Facebook
𝕏
◎
YouTube
Twitter / X
linkedin.com/company/
facebook.com/
youtube.com/channel/
twitter.com/
instagram.com/
next-move-strategy-consulting
Next-Move-Strategy-Consulting
UCJuVRxfBo-Dsog7BgDE4uPQ
nextmsc
nextmsc
This deck summarises a 245-page research programme. Custom cuts by process, component, country and company are available on request — reach out to scope a briefing with the analyst team.
Source: Next Move Strategy Consulting, Digital Oilfield Market (Report MC359, Dec 2025). Copyright @Next Move Strategy Consulting
SLIDE 06 / 06