

PROJECT NO. 70100310
DATE: FEBRUARY 2026
8 First Street Manchester M15 4RP
Phone: +44 161 200 5000
WSP.com
PROJECT NO. 70100310
DATE: FEBRUARY 2026
8 First Street Manchester M15 4RP
Phone: +44 161 200 5000
WSP.com
Prepared by Signature
Checked by
Signature
Authorised by
Signature

Table 5-4 – Comparison of default soil-to-plant concentration factors for PFOA by produce group, with representative data from samples taken from the Occupation Road allotments.
34
Table 5-5 – Comparison of default homegrown fraction by produce group with representative data collected from responses to an allotment questionnaire. 34
Table 5-6 – Key assumptions for the non-soil (background) ADE for PFOA in mg/kg body weight/day for an adult and a young child.
36
Table 5-7 – Comparison of the original estimate of total ADE for PFOA in for an adult and a young child with an adjusted total taking into account potential double counting for non-soil ADE, systematic bias in chemical analysis, and potential contributions to soil exposure from other sites.
38
Table 5-8 – Summary table of POD-HED identified by authoritative organisations with details provided on overall effect classification, the specific endpoint of concern from the study, the model (animal or human), and the type of POD reported.
40
Table 5-9 – Overview of the categorisation and terminology used for the margin of exposure assessment in this risk evaluation.
46
Table 5-10 – Comparison of the PFOA concentrations in vegetables from the Occupation Road allotment with the lower and upper bound mean of PFOA concentrations from national surveys for the vegetable and vegetable products category.
56
Table 5-11 – Comparison of the estimated intakes for PFOA from dietary sources against estimates of exposure from the site only* 57
Figure 4-1 - PFOA Surface Soil Dataset (GL – 0.1 m bgl). Occupation Road Allotments 22
Figure 4-2 - PFOA Sub-surface Soil Dataset (0.1 – 0.6 m bgl). Occupation Road Allotments 23
Figure 5-1 - Child (AC 1-6) and Adult (AC 17) ADE (Sub-surface Soils) Plotted Against POD-HED Data. 45
FIGURES


RISK ASSESSMENT - SUPPORTING INFORMATION
PRELIMINARY FSA COMMENTARY

NQMS Declaration Reference: 1225-K1507
NQMS SQP Declaration of Document Adequacy
Project
Project Name
Project Address
Thornton-Cleveleys
Thornton-Cleveleys
NQMS Declaration Reference 1225-K1507
Summary Description of Project / Proposed development
WSP UK Ltd (WSP) has been instructed by the Environment Agency (the ‘client’) to provide expert opinion in respect to the status of the allotments located at Occupation Road, ThorntonCleveleys under Part 2A of the Environmental Protection Act (1990).
As part of the instruction from the Client, WSP was tasked with discussing the findings of the preliminary site investigation works, completed by WSP in September 2024, and the recent site investigation works, completed by WSP between December 2024 and January 2025, as reported in April 2025. The purpose of this project is to undertake both generic and detailed quantitative risk assessment and risk evaluation works, to deliver suitably robust conclusions consistent with the decision-making required by the Statutory Guidance and all relevant up-todate good practice for contaminated land investigation and risk assessment. The purpose of this interpretative report is to provide regulators with the necessary information to support a decision as to whether the site meets the statutory definition of contaminated land under Part 2A.
Document
Document Title Occupation Road Allotments, Interpretative Site Investigation Report
Document Type

Interpretative Report
Document Reference uk-70100310
Document Date February 2026
Document Author / Publishing Organisation WSP UK Ltd
Named Client Environment Agency
Local Authority Details
Local Authority Name
Contact Name
Contact Telephone
Contact Email
Contact Role
Regulator Details
Regulator
Contact Name Contact
Contact
Contact
SQP Details
SQP Name
SQP

Chartered or Professional Institution
Chartered or Professional Institution
Membership Reference
NQMS Declaration Reference: 1225-K1507
NQMS SQP Declaration of Document Adequacy
I, , confirm that I am the person described in the SQP Details section and hold current valid registration as a Suitably Qualified and Experienced Person Registration No. SQP0077 with the NQMS.
I have reviewed the document described in the Document Details section, in relation to the project and site described in the Site Details section, and I am satisfied that:

1. The assessment has been carried out by appropriately capable people with reference to the Brownfield Skills Framework.
2. That the assessment carried out is, to the best of my knowledge, undertaken with reasonable skill and care, and the information and data reported: i. describe an appropriate scope and objectives and ii. accord with relevant good practice guidance and standards and iii. are based upon appropriately robust science and iv. are factually correct and v. have been appropriately reviewed.
3. That all specialist aspects have been reviewed by an appropriately qualified/competent person with relevant skills and experience in that specialist area.
4. That the interpretation and conclusions are reasonable.
5. That proposals to mitigate actual, potential, or residual risks are appropriate (where relevant to the report type).
6. I am competent to sign this Declaration and that
a. I am fully aware of and comply with the SiLC Code of Practice and the Code of Conduct of Institution of Environmental Sciences through which I hold Chartership .
b. The work of this review and Declaration are within the limits of my knowledge, competence and professional capacity.
Note:The document that has been reviewed was prepared by the organisation named for the benefit of the named Client who has reliance upon it. Any professional liability arising from any proven negligent act or omission by the Company carrying out the work and publishing the document rests with that Company and not with the SQP or the NQMS. 1225-K1507



WSP UK Ltd (WSP) has been instructed by the Environment Agency (the ‘client’) to provide expert opinion in respect to the status of the allotments located at Occupation Road, Thornton-Cleveleys (hereafter the ‘site’) under Part 2A of the Environmental Protection Act (1990) [8]. For the location of the site see Figure 1, Appendix A.
As part of the instruction from the Client, WSP was tasked with discussing the findings of the preliminary site investigation works, completed by WSP in September 2024 [12], and the recent site investigation works, completed by WSP between December 2024 and January 2025, as reported in April 2025 [14] The purpose of this project is to undertake both generic and detailed quantitative risk assessment and risk evaluation works, to deliver suitably robust conclusions consistent with the decision-making required by the Statutory Guidance [3] and all relevant up-to-date good practice for contaminated land investigation and risk assessment.
The purpose of this interpretative report is to provide regulators with the necessary information to support a decision as to whether the site meets the statutory definition of contaminated land under Part 2A
The investigation findings and risk assessment presented herein form part of a Part 2A inspection focused on legacy emissions from the AGC Chemicals Europe Ltd (formerly Asahi Glass Co. Ltd) manufacturing facility (referred to as the ‘AGCCE Ltd facility’), which historically formed part of the wider ICI chemical works (referred to as ‘ICI Ltd’) The investigation of land in Thornton-Cleveleys is being undertaken through a two tracked, phased and iterative approach, defined as follows:
• Track 1 refers to the wider assessment of contaminant dispersion across the surrounding area.
• Track 2 is the more targeted assessment of specific parcels of land where evidence indicates a potentially unacceptable risk under the Part 2A legislation
Aerial deposition of perfluorooctanoic acid (PFOA) in soils across the Occupation Road site is likely attributed to legacy aerial emissions from the AGCCE Ltd facility from the 1950s. To date, two phases of shallow soils investigation have been undertaken at the Occupation Road allotments:
• Phase 1 undertaken by WSP in September 2024, comprising part of the Track 1 preliminary investigation. Data obtained is discussed herein and presented within the factual report from the preliminary phase of offsite soils investigation [12]. This suggested a potential contaminant linkage between legacy aerial deposition of PFOA in soils and users of the Occupation Road site, including those that may consume produce grown at the site, despite not regularly visiting the allotments
• Phase 2 undertaken by WSP between December 2024 and January 2025, comprising a Track 2 detailed investigation of the allotments including analysis of shallow soils and allotment produce. Data obtained is discussed herein and presented within the factual report [14].
The scope of works for this interpretative report comprises the following:
• Conceptual Site Model for the Occupation Road site, including site description and consideration of potentially significant contaminant linkages;
• Summary of site investigation works to date including the levels of PFOA, perfluorononanoic acid (PFNA), perfluorohexane sulfonic acid (PFHxS) and perfluorooctane sulfonic acid (PFOS) found in collected soil and produce samples;
• Completion of a risk assessment for PFOA, but also considers PFNA, PFHxS, and PFOS, undertaken in general accordance with EPA 1990 [8], the Statutory Guidance [3], and relevant up-to-date good practice guidance; and,
• Provision of written advice to the regulators (Environment Agency), based on the outcome of the risk assessment and consideration of the uncertainty, as to whether the Occupation Road site meets the Statutory definition of Contaminated Land under Part 2A of the EPA 1990 [8].
This assessment was undertaken in general accordance with the following standards and guidance documents:
• EA, 2025. Land Contamination Risk Management [6];
• Part 2A of the Environmental Protection Act, 1990 [8]; and,
• Defra, 2012. Contaminated Land Statutory Guidance [3]
Opinion has been limited to the consideration of Contaminated Land and specifically to the assessment of potentially significant risks to human health. Focus has been upon PFOA, PFNA, PFHxS, and PFOS
The report is addressed to and may be relied upon by the Environment Agency, as “the client” within the meaning given to that phrase within the agreement and subject to the terms and conditions contained therein.
This report has been completed with regard to generally accepted consulting practices and may not be relied upon by any other party without the explicit written agreement of WSP. No other third-party warranty, expressed or implied, is made as to the professional advice included in this report. This report must be used in its entirety.
Unless WSP has actual knowledge to the contrary, WSP has assumed the correctness and completeness of third-party information supplied and shall have no liability in respect of any inaccuracy, defect or omission in any information or materials provided, anecdotally or otherwise, by the Client or any other third party to WSP. WSP does not assume any liability for misrepresentation of information or for items not visible, accessible, present or supplied at the time of the study.
Furthermore, we can accept no liability for misrepresentation of information or for items not visible, accessible, present or supplied at the time of this study. Should further information arise then we reserve the right to update and/or change our opinion. Any comments made of a legal nature must also be considered no more than provisional. Presenting opinion and debating any consideration of responsibility have been excluded.
It should be noted that even a comprehensive sampling and testing programme implemented in accordance with a professional Standard of Care may fail to detect certain conditions. The environmental, geological, geotechnical and hydrogeological conditions that WSP has identified to exist between sampling points may differ from those that actually exist. Passage of time, natural occurrence, and activities near the Site may substantially alter discovered conditions.
In any Conclusions and/or Recommendations section of this report, WSP has set out its key findings and provided a summary and overview of its advice, opinions and recommendations. However, other parts of this report will often indicate the limitations of the information and therefore any advice, opinions or recommendations set out in any Conclusions and Recommendations sections ought not to be relied upon until considered in the context of the whole report. WSP does not provide legal advice, and the advice of lawyers may be required. Furthermore, any Conclusions and Recommendations are only technical advice and may differ from that of the Regulator or other interested parties when wider context is considered.
WSP’s General Limitations are included in Appendix B
No : 70100310
The Conceptual Site Model (CSM) is developed at the Preliminary Risk Assessment tier and reviewed and refined during subsequent risk assessment tiers (as defined under the Land Contamination Risk Management, EA [6]). The CSM represents the characteristics of the site and indicates the possible relationships between contaminants, pathways and receptors, where:
• A contaminant is a substance which is present in, on, or under the land and has the potential to cause harm;
• A receptor is something which could be adversely affected by the contaminant, including the site users, and the allotment-grown produce (representing ‘property’ in the context of Part 2A1); and,
• A pathway is a route or means by which a receptor could be exposed to, or affected by, a contaminant
For a potential risk to exist from a site, all three of the above elements must be present and linked together. In other words, a contaminant has been identified; a receptor is present; and there is an exposure pathway that links the contaminant to the receptor. The term contaminant linkage is introduced in the Statutory Guidance [3] to describe a particular contaminant-pathway-receptor relationship.
Exposure assessments for human health risk assessment are based upon defined exposure scenarios, and the Occupation Road site is currently utilised as an allotment garden. An allotment garden, as described in EA, 2009: SR3 (‘Updated technical background to the CLEA model’) [5] comprises a number of plots of open space of approximately 250 m2, made available by the local authority for the growing and consumption of fruit and vegetables by tenants. There are usually several plots to a site, and the overall site area may cover more than a hectare.
The key generic assumptions underpinning this scenario are defined as:
• A critical receptor comprising a young, female child (0-6 years);
• An exposure duration of 6 years;
• Exposure pathways comprising of direct soil and dust ingestion, the consumption of allotment produce, the consumption of soil adhering to allotment produce, skin contact with soils and the outdoor inhalation of dusts and vapours; and,
• The lack of any permanent or substantial buildings.
Potential risks have been considered in relation to the current use of the land, as per the Statutory Guidance [3]. Whilst tenants may choose to keep animals, the potential exposure to contaminated meat and eggs is not considered within the generic exposure scenario developed for the initial assessment of land contamination However, such additional pathways can and should be considered on a site-specific basis
1 As per Table 4.2, Section 3 of Statutory Guidance [3]
The Occupation Road site comprises an area of approximately 2,100 m2 (64 m x 33 m), containing 22 No. allotment plots ranging in size from 55 m2 to 200 m2 Plot sizes at the site are smaller than the generic plot size quoted in SR3, which could potentially result in a lower risk to site users However, the level of risk is also influenced by the types of produce grown and contaminant concentrations in both the soils and plants consumed, so any potential reduction in risk to site users is very difficult to quantify. The locations of the plots are indicated on Figure 2 in Appendix A, and a selection of photographs taken at various points during the Phase 2 works are included within Appendix D of the factual report [14].
At the time of the initial site walkover (undertaken on 13 January 2025), approximately 14 No. plots appeared to be well tended / in recent use for active growing. A number of unused plots appeared to be present within the centre south, which did not seem to have been worked on for some time given the observed presence of established scrub type vegetation over plastic tarpaulin and due to the presence of poor-quality planters or a lack of beds.
A number of sheds and fixed infrastructure, including greenhouses and paving slabs, were sporadically positioned across the site with water butts / small plastic receptacles frequently observed, being used for rainwater harvesting. A shared mains water supply was provided to the allotment via three standpipes located along a central footway which bisects the site.
Based on received questionnaire responses and communications from allotment holders to the Council (included within the factual report [14]), in addition to anecdotal information received onsite, a wide variety of produce was typically grown in active plots including tubers, green vegetables, root vegetables and herbaceous fruits. A wide variety of activities were undertaken over the course of each year including planting, watering, harvesting and weeding. A number of soil preparation and improvement methods were observed during the walkover, including the presence of bagged compost, manure and imported mulch where vegetables were being grown, in addition to a variety of weed suppressant methods including ground covering with geotextile sheeting, plastic, polyethylene, cardboard and carpets.
The majority of produce was being grown in small, raised beds, but larger in-ground beds were also observed, albeit less frequently. In some locations, the soil within the in-ground beds was anecdotally reported by an allotment holder to have not been changed for many years.
No poultry or other animals were observed to be present onsite, which is consistent with the standard allotment scenario described in SR3 [5].
Deposition from legacy aerial emissions, associated with historical activities undertaken at the adjacent (off-site) AGCCE Ltd facility (formerly operated by ICI Ltd), have likely resulted in PFOA concentrations present in shallow soils and locally grown produce at the Occupation Road site, as discussed in Section 4
As part of historic operations undertaken by ICI Ltd, and subsequently AGCCE Ltd, the company has estimated that approximately 49 tonnes of PFOA were released to air between the 1950s and 2012. Further details are provided within the desk study [12].
Project No : 70100310
A modelling and dispersion assessment undertaken by the Environment Agency [15] indicated that the historical deposition of PFOA via aerial emissions from a stack located within the curtilage of the current AGCCE Ltd facility had potentially occurred. However, the rate of, and amount of, deposition was not quantified.
A desk study [12] did not identify any other historical sources of PFOA within the Thornton-Cleveleys area that could be used to explain the extent of soil contamination observed in the Track 1 land investigations
The potential for localised contamination from other sources of PFAS on the allotment site is acknowledged because of their wide-spread use in materials such as polyethylene sheeting and various textiles that may have been used by plot holders to cover the ground as part of typical gardening practices. There is also the potential for possible dilution of contamination, with the addition of other materials to active allotment beds, such as composts and manures, which are generally dug in and consolidated into the soil. However, the findings of the widespread presence of PFOA across the Track 1 area [13], including the allotments, and the general absence of other PFAS compounds at similar concentrations, both support the hypothesis that historical emissions of PFOA to air from the AGCCE Ltd facility - including former site activities - is the most probable primary source of the elevated concentrations detected in offsite shallow soils, and subsequently in allotment produce.
Based on the usage of the allotments (as described in Section 2.2) and nature of the contaminants under consideration, the relevant human health exposure pathways for the Occupation Road site include direct exposure pathways (soil and dust ingestion, and dermal contact with soil), the inhalation of dust, and the consumption of allotment produce and attached soil. All pathways are relevant to onsite users, but the consumption of allotment produce and attached soil is largely an off-site activity, as produce will primarily be consumed off-site, and in some cases by individuals who will not have physically visited the allotment gardens
Plant uptake of soil contamination is typically a passive process through the root zone, and the highest density of roots occurs in the top 0.8 m of the soil profile (EA, 2009: SR3 (‘Updated technical background to the CLEA model’) [5]). The uptake of contamination from soil represents a relevant exposure pathway for the ‘property’ receptor (allotment-grown produce).
As discussed within the Interim C4SL report for PFAS [2], the volatilisation of PFOA at pH levels above 2.5 is considered negligible2. Consequently, exposure to PFOA via vapour migration and inhalation at the allotment is also considered negligible and it has not been modelled. Whilst a number of structures are present at the site including sheds, significant indoor exposure is considered to be unlikely as the buildings are small, well-ventilated and primarily used for storage (EA, 2009: SR3 (‘Updated technical background to the CLEA model’) [5]).
2 The majority of PFAS are present in the environment in their involatile dissociated anionic forms. The volatilisation of any structural isomer of PFOA from water will be negligible at environmentally relevant conditions (pH > 2.5) [2].
Project No : 70100310
The tracking back of contamination from the allotment gardens to the home has not been included as a relevant pathway in the CSM for the site and is not considered relevant for an allotment exposure scenario (as per SR3 [5]). Whilst it is accepted that some plot holders may live in close proximity to the Occupation Road site, and / or may have a shed on their plot, this pathway is unlikely to be significant, due to the expected use of reasonable standards of hygiene.
An important consideration in this exposure scenario is the presence, or absence, of children at the allotment gardens on a regular basis. The standard allotments exposure scenario assumes that children are likely to visit the site infrequently, and in the absence of evidence to the contrary, this is a reasonable assumption for this site For PFOA, the consumption of homegrown produce, and soil attached to produce, accounts for 98.7% of all soil related exposure for an allotment exposure scenario [2]. Exposure via this pathway does not require attendance at the site, and all consumers of produce grown at the site are considered to be receptors in the context of the CSM.
The critical human health receptors for the Occupation Road site are therefore:
• A 0-6 year old female child (CLEA age classes AC1-6), in accordance with EA, 2009: SR3 (‘Updated technical background to the CLEA model’) [5]; and,
• An adult female (CLEA age class 17), see Section 5 for further discussion
Part 2A also introduces categories of ‘non-human’ receptors, which include ‘property’ - specifically ‘produce grown domestically or on allotments for consumption’ - as outlined in Section 4.3, Table 2 of the Statutory Guidance [3]
Under Part 2A and in the context of risks to human health, the aim is to consider whether the site is contaminated or not on the grounds of Significant Harm or the Significant Possibility of Significant Harm (SPOSH). As per the Statutory Guidance [3], “contaminated land” is any land which appears to the local authority in whose area it is situated to be in such a condition, by reason of substances in, on or under the land that significant harm is being caused or there is a significant possibility of such harm being caused. The following health effects should always be considered to constitute significant harm to human health: death, life threatening diseases, other diseases likely to have serious impacts on health, serious injury, birth defects and impairment of reproductive functions. Historically, ammonium perfluorooctanoate (AFPO) was used at the adjoining AGCCE Ltd facility (historically operated by ICI Ltd) as a surfactant in the production of fluorotelomer polymers, before it was phased out in 2012. APFO is the ammonium salt of PFOA and readily dissociates in water to give the ammonium and perfluorooctanoate ions, and whilst APFO and PFOA have different properties under certain conditions, it is still considered appropriate to assume that APFO behaves like PFOA in both its toxicity to health and its behaviour on reaching the environment [12] PFOA is a PFCA (perfluoroalkyl carboxylic acid) with the chemical formula of C8HF15O2. The health effects identified in humans following exposure to PFOA by authoritative bodies such as the European Food Safety Authority (EFSA), the Agency for Toxic Substances and Disease Registry (ATSDR), Food Standards Australia New Zealand (FSANZ) and the United States Environmental Protection Agency (USEPA) include those in the liver, cardiovascular system, immune system and / or within the developing fetus [24,22,27,30] It has also been classified as a Group 1 carcinogen
Project No : 70100310
(carcinogenic to humans) by the International Agency for Research on Cancer (IARC) [32]. It can therefore reasonably be concluded that several authoritative organisations have associated human exposure to PFOA with a range of potential adverse effects that meet the definition of a significant health effect as identified in the Statutory Guidance [3]
In the context of risks to property (allotment-grown produce), Part 2A requires the regulator to decide whether or not significant harm is being caused, or if there is considered to be the significant possibility of such harm to the specified property receptor [3]. Produce is considered to be ‘significantly harmed’ when it is deemed no longer fit for purpose (i.e. consumption), as defined by the Section 8(2) of the Food Safety Act 1990 [50], which states that food fails to comply with food safety requirements if it is unsafe within the meaning of Article 14 of Regulation (EC) No. 178/2002 and references to food safety requirements or to food complying with such requirements shall be construed accordingly. Article 14 ‘Food safety Requirements’ Paragraph 5 States: In determining whether any food is unfit for human consumption, regard shall be had to whether the food is unacceptable for human consumption according to its intended use, for reasons of contamination, whether by extraneous matter or otherwise, or through putrefaction, deterioration or decay.
The CSM table below (Table 2-1) identifies the contaminant linkages considered relevant in relation to this specific parcel of land (the Occupation Road allotments). The qualitative risk assessment contained within Table 2-1 is based upon the methodology as established within CIRIA C552 [48].
No : 70100310
Table 2-1 - Preliminary Conceptual Site Model
Source Pathway Receptor Linkage
Potential Source Pathway Receptors
SCL 1 PFOA within shallow soil.
(legacy aerial emissions of PFOA associated with historical activities undertaken by the adjacent AGCCE Ltd facility – and former site operators (ICI Ltd)
Soil and dust ingestion, dermal contact with soils. Inhalation of dust, consumption of homegrown produce, and soil attached to homegrown produce.
Human Health –Allotment users, consumers of produce grown at the allotments.
Female child, age 0-6 years.
Female adult, age 16-65 years.
SCL2 Plant uptake of contamination from soil. Property –Produce grown on allotments.
Project No : 70100310
As part of a wider (Track 1) site investigation undertaken by WSP in September 2024, the Occupation Road site was subject to limited shallow soil sampling. Nine soil samples were obtained between ground level and 0.6 m bgl (below ground level), from three sample points (referenced LP01-SP01 to LP01-SP03). A maximum sample recovery depth of 0.6 m bgl was selected to account for plausible exposure pathways as identified within the preliminary conceptual site model for the site presented within the desk study [12]. PFOA was recorded above the limit of detection in each sample collected at the Occupation Road site, at concentrations ranging from 1.1 µg/kg dry weight (DW) to 18.9 µg/kg DW (mean 9.2 µg/kg DW). Produce sampling was not undertaken as part of the preliminary investigation.
Soil results are presented and discussed in Section 4, and further details are provided within the factual report for the works [12]
The Track 1 site investigation found PFOA present in soils at the Occupation Road site that potentially indicated the presence of a contaminant linkage under the Part 2A legislation, necessitating the completion of a detailed investigation and assessment of the Occupation Road site The detailed (Track 2) site investigation was undertaken by WSP between December 2024 and January 2025. An account of the works is provided within the factual report [14], with key information summarised in the following section.
An unbiased sampling strategy was adopted at the Occupation Road site, in accordance with Environment Agency, 2000, R&D Technical Report P5-066/TR [4]. A total of 33 No. sample points were chosen, on a random grid spacing of 8 metres. The sample points were randomly positioned using mapping software (ArcGIS) with a minimal allowance set to 3.5 m, which ensured that the locations were positioned within plots. Details are provided within the factual report [14].
For the assessment and control of sampling uncertainty, duplicate sample collection in general accordance with BS:10175 [49] was undertaken at 10 No. randomly selected locations, equivalent to 10% of the proposed sample targets.
To account for the relevant exposure assumptions for allotment users as described in the standard land use scenario [5], three soil samples were collected at each location, at depths ranging from ground level to 0.6 m bgl. Samples were collected across this depth range to allow separate characterisation of contaminant concentrations at depths representative of direct soil exposure pathways and the root zone of fruit and vegetables grown on the plots, and to further consider differences in the levels of PFOA with increasing depth
In total, 129 soil samples were collected (representing 89 No. soil samples and 40 No. sample duplicates), which were all scheduled for analysis. For each of the 10 No. duplicate sampling target locations, a separate hand pit was progressed alongside the target. To account for both sampling and analytical precision, the duplicate sampling resulted in four separate samples being collected in the field for each sample target. Details are provided within the factual report [14].
The soil samples were collected in fully labelled laboratory-supplied containers, relevant to the required suite of analysis, and transported in cooled containers under full chain of custody to a UKAS accredited laboratory (ALS Life Sciences Ltd). Whilst, for the purpose of this investigation, PFOA was identified as the principal contaminant of concern, a wider suite of PFAS analysis was implemented, which offered the lowest method detection limit (MDL) available for PFOA of 0.5 µg/kg DW
The samples were analysed by liquid chromatography coupled with a triple quadrupole mass spectrometer (LC-MS/MS) (ALS test method TM-4403). The standards used for calibration of PFOS and PFHxS contained both linear and branched components, so all were integrated when quantitating these compounds. All other compounds including PFOA were quantified for the linear component only.
The analytical testing methodology utilised by ALS Life Sciences Ltd does not include all forms of PFOA as it is centred on linear PFOA, and the laboratory does not have a branched PFOA standard for confirmation. This may result in an under-reporting of total PFOA concentrations within the soils data.
Soil results are presented and discussed in Section 4 Full laboratory results are included within the factual report [14].
The consumption of homegrown produce and soil attached to produce is the dominant exposure pathway as modelled within CLEA for the ‘allotments’ exposure scenario [2] These two pathways account for 98.7% of all soil related (i.e. non-background) exposure for the standard allotment scenario used to derive the interim Category 4 Screening Levels.
As part of the Track 2 investigation, a total of 25 No. produce and soil root zone samples were collected on 16 December 2024. These samples were collected to better understand the relationship between soil and produce concentrations, and to inform further evaluation of the likelihood of human exposure from the consumption of fruit and vegetables grown onsite. Prior to conducting the produce sampling, agreement from allotment tenants was obtained by Wyre Council, and out of the 22 No. plots potentially available, only six plots were confirmed to be accessible for sampling. Despite the produce sampling constraints, the site data collected is considered to be broadly representative of activities and produce grown at the Occupation Road site, with the exception of tree and shrub fruit (as allotment plot holders actively growing tree and shrub fruit did not make their produce available for sampling). The produce sampled was limited to the types available in the winter months, at the time of sampling, and those found to be growing on the six plots when access was made available.
In total, 14 No. samples of green vegetables were collected, 8 No. samples of root vegetables and three samples of tuber vegetables. The locations of the sampled produce (and corresponding root zone soils) are indicated in Figure 2 in Appendix A.
3 https://www.alsenvironmental.co.uk/media-uk/method_statements/hawarden/contaminated-landorganics/tm440 pfas-in-soils.pdf
Project No : 70100310
A minimum of 100 grams of produce was obtained for each sample, and the type of produce, sample condition and location were recorded along with the time of collection. Attempts were made to remove any loose adhered soil during sample collection and subsequently by the performing laboratory during sample preparation; however, the complete absence of adhered soil to root vegetables cannot be guaranteed. No additional preparation of the samples was undertaken (e.g. peeling) Produce samples were frozen prior to shipment to Eurofins Food Testing UK, who subcontracted the analysis to their partner accredited laboratory in Germany.
Produce results are presented and discussed in Section 4. Analytical results, expressed on a sample as received basis (fresh weight), are included within the factual report [14]
Project No : 70100310
As discussed within Section 3, as part of the Track 1 site investigation works undertaken by WSP in 2024, nine soil samples were collected at the Occupation Road site, and submitted for a suite of PFAS analysis (‘PFAS Broad Suite’) at ALS Life Sciences Ltd. Following the subsequent completion of detailed (Track 2) investigation works at the site, a further 129 No. soil samples were collected, and submitted to the same laboratory for the same analytical suite The resultant soil dataset comprises a total of 138 No. soils samples, collected using an unbiased (non-targeted) sampling strategy.
As noted in Section 3.2.2, a further 25 No. root zone samples were collected as part of a targeted sampling exercise completed during the Track 2 fieldworks. This additional soil data was not considered suitable for statistical assessment because the sampling was targeted and not unbiased. The results of the root zone soil sampling are discussed within Section 5.
Although the principal contaminant of concern for this assessment is PFOA, each of the soil samples scheduled for testing was analysed for a total of 52 No. separate PFAS compounds. Current good practice for the assessment of risks to health from exposure to PFAS compounds in contaminated soils (as discussed in Section 5) is based upon combined exposure to the sum of PFOA, PFOS, PFHxS and PFNA. As a result, soil results for these four PFAS are discussed in more detail below.
4.1.1 PFOA
4.1.1.1 PFOA Depth Profile
Soil PFOA concentrations at the site were reported in excess of the MDL of 0.5 µg/kg DW in all 138 No. samples (a frequency of detection of 100%), at concentrations ranging from 1.1 to 20.2 µg/kg DW Table 4-1 below summarises the depth profile for reported PFOA concentrations within the dataset.
4.1.1.2
In order to consider whether the representative concentration of PFOA in the soils collected at the Occupation Road site changed with depth, further statistical analysis was carried out. The sample populations presented in Table 4-1 have been assessed using the Mann-Whitney U Test, in order to establish if they are statistically different. This is a nonparametric statistical test used to compare differences between two independent populations. It is particularly useful when the data is not normally distributed or when sample sizes are small (n < 30), such as for the dataset above separated by depth The 0.0 – 0.1 m bgl dataset has been assessed against the 0.1 – 0.6 m bgl datasets to provide an indication of whether the PFOA results for surface soils are statistically comparable to those recorded in sub-surface soils (soils collected below a depth of 0.1 m bgl)
The Mann-Whitney U test has been performed as a two-sided test. The null and alternative hypotheses (H) are:
H0: The two populations are equal i.e. they have the same mean PFOA concentration
Ha: The two populations are not equal and are therefore independent of one another
The output of the test is a p-value which is compared against a pre-defined significance level (in this instance 0.05). For the comparison of the surface soils to sub-surface materials, the p-value of the test is smaller than our significance level of 0.05, and therefore we can reject the null hypothesis, indicating that the surface soil results are statistically different to the sub-surface material.
To provide a further level of confidence, the 0.1 – 0.2 m dataset has been assessed against the 0.2 – 0.3 m dataset. The p-value of the test is larger than our significance level of 0.05, and therefore we cannot reject the null hypothesis, confirming that the sub-surface soil results are statistically comparable. Consequently, based upon the above statistical analysis there is justification in splitting the full PFOA soil dataset of 138 No. samples into two subsets, namely surface soils (0.0 – 0.1 m bgl) and sub-surface soils (0.1 – 0.6 m bgl). Mann-Whitney U Test results are provided within Table C.1 (Appendix C)
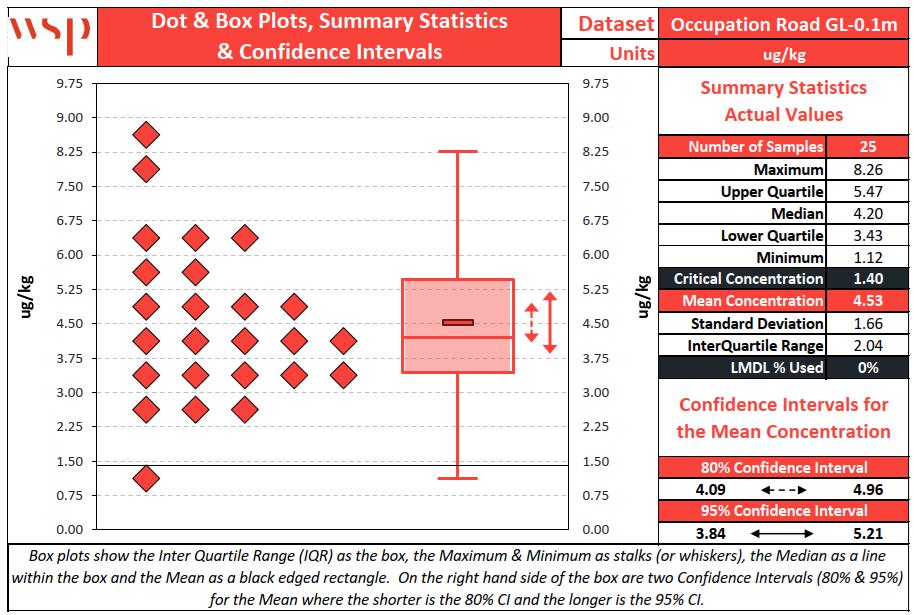
The PFOA results for the surface soil dataset of 25 No. soils, collected between ground level (GL) and 0.1 m bgl, are presented below in Figure 4-1. The soil dataset was observed to be logsymmetric, with a mean concentration of 4.5 µg/kg DW and a median concentration of 4.2 µg/kg DW
Confidence intervals for the mean concentration were:
• 4.1 – 5.0 µg/kg DW (80% confidence interval around the mean value); and
• 3.8 – 5.2 µg/kg DW (95% confidence interval around the mean value).
Project No : 70100310
Figure 4-1 - PFOA Surface Soil Dataset (GL – 0.1 m bgl). Occupation Road Allotments
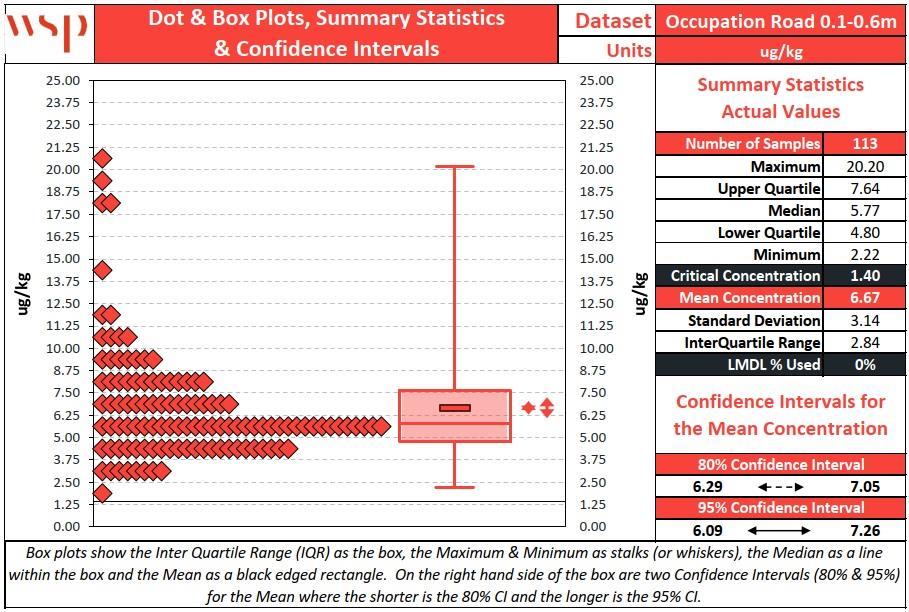
The PFOA results for the sub-surface soil dataset of 113 No. soils, collected between 0.1 m and 0.6 m bgl, are presented below in Figure 4-2. The soil dataset was observed to be log-symmetric, with a mean concentration of 6.7 µg/kg DW and a median concentration of 5.8 µg/kg DW
Confidence intervals for the mean concentration were:
• 6.3 – 7.1 µg/kg DW (80% confidence interval around the mean value); and
• 6.1 – 7.3 µg/kg DW (95% confidence interval around the mean value).
Project No : 70100310
Figure 4-2 - PFOA Sub-surface Soil Dataset (0.1 – 0.6 m bgl). Occupation Road Allotments
The sampling strategy was not intended to facilitate a detailed assessment of the site on a plot-byplot basis. Nevertheless, a minimum of 3 No. and a maximum of 18 No. samples were collected from 18 of the 22 No. allotment plots.
The soil dataset for each plot is summarised below in Table 4-2.
Project No : 70100310
Upper 95th percentile confidence intervals of the arithmetic mean PFOA concentration for individual plots range from 4.4 µg/kg DW (plot 02A) to 13.7 µg/kg DW (plot 04B) Where six or more soil samples have been collected from an individual plot, the reported 95th percentile confidence intervals in Table 4-2 are broadly comparable. However, due to the small sample population sizes for each plot, and the confirmation of a PFOA depth profile between surface and sub-surface soils, the soil dataset is considered to be insufficient to identify any notable differences in PFOA concentrations between the 18 No. plots sampled at the site
4.1.2 PFOS
A total of 24 of the 138 No. samples contained PFOS above the MDL of 0.6 µg/kg DW (a frequency of detection of 17%). The maximum reported total PFOS concentration (branched and linear) was 2.4 µg/kg DW
4.1.3 PFHXS
Concentrations within all 138 No. samples were reported below the MDL of 0.5 µg/kg DW
4.1.4 PFNA
A single reportable concentration of PFNA (0.63 µg/kg DW) was identified, in sample LP01-SP212. Concentrations within the remaining 137 No. samples were reported below the MDL of 0.5 µg/kg DW
4.2 PRODUCE
A total of 25 No. produce samples were collected as part of the investigation works [14].
Full analytical results are included within the factual report [14], and a summary is provided below in Table 4-3.
Project No : 70100310
Table 4-3 – Produce Dataset (all results µg/kg FW)
PFOA was detected above the MDL of 0.001 µg/kg FW (fresh weight) in 24 of the 25 No. produce samples submitted for analysis. Reportable concentrations ranged from 0.0135 to 2.11 µg/kg FW, with the highest PFOA concentrations being found in samples of beetroot, chard, cavolo nero and green cabbage leaves.
Concentrations of PFOS were reported above the MDL of 0.002 µg/kg FW in 21 of the 25 No. samples, to a maximum of 0.0438 µg/kg FW (leek).
Reportable concentrations of PFNA were identified in 20 of the 25 No. produce samples submitted for analysis, despite 137 of the 138 No. soil samples containing PFNA below the MDL of 0.5 µg/kg. This disparity is likely due to the MDL for the produce analysis having a far greater sensitivity than the corresponding soil testing. The maximum reported PFNA concentration is 0.0225 µg/kg FW.
A single reportable concentration of PFHxS was identified (0.00547 µg/kg FW), within a sample of beetroot.
This section outlines the purpose of risk assessment in the context of Part 2A and details the methodology applied to the risk evaluation process. This has been used to inform the potential determination of whether Significant Contaminant Linkages (SCLs) to human health exist at the site, as defined under Part 2A of the Environmental Protection Act 1990 [8,3] It is important to note that the soil at a site can be contaminated by polluting substances, but the level of contamination may not meet the legal definition of contaminated land based on the level of risk it poses to site users and the wider environment.
In April 2012, the Department of Environment, Food and Rural Affairs (Defra) published updated Statutory Guidance, which introduced a four-category approach to determining whether land in England and Wales is contaminated or not on the grounds of significant possibility of significant harm in respect of human health [3]. The categories are as follows:
• Category 1: Human Health cases result when the local authority considers there to be an unacceptably high probability, supported by robust, science-based evidence, that significant harm would occur if no action is taken to stop it.
• Category 2: Human Health cases result where the local authority concludes that the land poses a ‘significant possibility of significant harm’ , on the basis that there is a strong case for considering that the risks from the land are of sufficient concern.
• Category 3: Human Health cases result if the authority concludes that the strong case described above does not exist, and therefore the legal test for ‘significant possibility of significant harm’ is not met
• Category 4: Human Health cases result when the local authority considers there to be no risk, or that the risk is low.
Part 2A takes a risk-based approach to identifying contaminated land as outlined in the Statutory Guidance [3]. This often starts with a preliminary risk assessment based on a desk study and site walkover, moving onto a generic quantitative risk assessment and various stages of more detailed quantitative risk assessment [3,6] At each stage, more site-specific information is used to reduce uncertainties and conservatism incorporated into the risk assessment. For land to proceed to the next stage of risk assessment, there should be evidence that an unacceptable risk could reasonably exist, with the assessment process continuing until sufficient information is available for the local authority to make an informed decision on:
a) Whether there is insufficient evidence that the land might be contaminated land to justify further inspection and assessment; and / or
b) whether or not the land is contaminated land.
In accordance with the Statutory Guidance [3], the decision-making process for this assessment follows the following steps:
1. Initial qualitative decision on Category 1 in case of an obvious or urgent significant risk to health or the environment,
2. Decision on Category 4 using primarily Tier 2 generic quantitative risk assessment (GQRA) and consideration of what constitutes normal background concentrations [6]. If the site cannot be allocated to Category 4: Human Health, then,
3. Refine decision between Categories 1, 2 and 3 using GQRA, Tier 3 detailed quantitative risk assessment (DQRA) and other evidence [6]
In all steps of the investigation and assessment, whether the evidence points to the need for urgent action should be kept under review.
This report presents the evidence collected at each stage, utilising the results of the GQRA, DQRA and/or other evidence (as applicable) to support the decision-making process. The preliminary risk assessment for the Occupation Road site concluded that there was no obvious or urgent risk to human health, and this report continues the risk evaluation process at step 2.
A Tier 2 GQRA forms step 2 in the risk assessment process and is a systematic approach used to evaluate risks through the screening of site concentrations against appropriate criteria [6]. This method allows for a more quantitative understanding of risks compared to qualitative assessments alone. For this assessment, the GQRA has been undertaken using published, generic soil assessment criteria, supported by qualitative considerations around normal levels of PFOA to assess whether the Occupation Road site represents Category 4: Human Health. When undertaking the GQRA, the technical approach outlined in good practice guidance has been followed [6].
Category 4 Screening Levels (C4SL) are screening criteria derived to help local authorities (and others) to decide when a site falls within Category 4 (Human Health) in the context of Part 2A of the Environmental Protection Act (1990) [8]. C4SLs are intended to be more pragmatic than other generic assessment criteria, such as the older soil guideline values, whilst remaining strongly precautionary.
C4SL values are contaminant concentrations in soil below which the risk to public health from exposure for a standard land-use scenario is considered low [2]. They do not mark the boundary between land contamination and contaminated land and exceeding them is not necessarily an indicator of unacceptable risk However, if a C4SL is not exceeded by a representative soil concentration, the land should normally be placed in Category 4: Human Health, and no further inspection and assessment is required. A site placed in Category 4 does not meet the legal definition of contaminated land. Where a C4SL is exceeded by a representative soil concentration, other factors should be considered such as normal levels of contamination (see Section 5.2.3), and the appropriate categorisation of the site (in either Category 1, 2, 3, or 4) further evaluated
The Interim C4SL Report for PFAS [2] presents individual assessment criteria for four individual PFAS compounds including PFOA, PFOS, PFNA and PFHxS, as shown in Table 5-1 However, the interim C4SL for PFOA [2] has been used alone to assess whether the Occupation Road site should be placed in Category 4 under the Part 2A regime. The reasoning for this is that PFOA is present more consistently and at higher levels than any of the other three PFAS. Notably, PFNA and PFHxS were almost always below the analytical MDL in soil samples collected from the Occupation Road site. The C4SL value for PFOA has been compared with a representative soil concentration of PFOA calculated from the site investigation data described in Section 4.1.1.
Project No : 70100310
5.2.2
Table 5-1 – Interim C4SL for PFAS [2] – Allotments (µg/kg DW)
According to the C4SL report [2] itself, “The label "interim" has been used throughout this report to reflect the fact that further work by COT [Committee on the Toxicity of Chemicals in Food, Consumer Products, and the Environment] and others may result in the need for the LLTC and the resulting C4SL values to be updated”
As discussed in Section 4.1.1, there is statistical justification in splitting the full PFOA soil dataset of 138 No. samples into two subsets, namely surface soils (0.0 – 0.1 m bgl) and sub-surface soils (0.1 – 0.6 m bgl). Soil results for each dataset are considered representative of the levels of contamination at the Occupation Road site at specific depths
5.2.2.1 Surface Soils
The surface soils dataset comprised a total of 25 No. samples, collected between ground level and 0.1 m bgl. Reported PFOA concentrations ranged from 1.1 to 8.3 µg/kg DW, with a 95th percentile lower confidence limit (LCL) of the mean of 3.8 µg/kg DW. The LCL of 3.8 µg/kg DW exceeds the interim C4SL for PFOA of 1.4 µg/kg DW
The results of the assessment for the surface soils dataset are included in Table C2 (Appendix C).
5.2.2.2
The sub-surface soils dataset comprised a total of 113 No. samples, collected between 0.1 and 0.6 m bgl. Reported PFOA concentrations ranged from 2.2 to 20.2 µg/kg DW, with a 95th percentile LCL of 6.1 µg/kg DW. The LCL of 6.1 µg/kg DW exceeds the interim C4SL for PFOA of 1 4 µg/kg DW
The results of the assessment for the sub-surface soils dataset are included in Table C3 (Appendix C)
5.2.3
As per the Statutory Guidance [3], ‘normal’ levels of contaminants in soil should not be considered to cause land to meet the definition of contaminated land, unless there is a particular reason to consider otherwise. Normal levels of contaminants in soil can arise from natural presence (i.e. underlying geology) or low-level diffuse pollution from residential and municipal activities (such as transport emissions or domestic heating using coal or wood).
Limited soil data is available for levels of PFOA in English soils. An EA initiated pilot study to assess PFAS background in soils (Beriro et al. 2025 [47]) analysed a range of archived and contemporary soil samples from across England. They reported the mean level of PFOA as 0.27 and 0.60 µg/kg DW for archived and contemporary samples, respectively. PFOA was detected in 24 of 25 No. archived soils and all nine contemporary soils. Beriro et al. noted that the PFAS levels found in their study were similar to other surveys conducted at regional, national, and international scales. The mean levels found in surface and sub-surface soils at the Occupation Road site, 4.5 and 6.7 µg/kg DW, respectively, are an order of magnitude higher.
Project No : 70100310
The Track 1 evidence [13] indicated widespread local PFOA contamination in soil with levels ranging from 0.7 to 144 µg/kg DW and a mean of 4.2 µg/kg DW, from a dataset of 291 No. samples. The soil contamination found at the Occupation Road site is broadly consistent with these earlier findings While these might be considered normal levels of contamination caused by low level diffuse pollution from a regional perspective, it is important to note that the Statutory Guidance (para. 3.23) [3] excludes contamination arising from specific industrial processes. As noted in Section 1.2, the source of PFOA contamination in this area is considered to be the AGCCE Ltd facility, which historically formed part of the wider ICI Ltd chemical works. It is therefore concluded that elevated local soil levels are not a relevant comparator for normal levels of contamination.
Two criteria were used to evaluate whether the Occupation Road site should be placed in Category 4 of the Statutory Guidance for Part 2A on the basis of PFOA contamination [3]:
• Whether representative levels of PFOA in surface and sub-surface soils were less than the C4SL for PFOA for an appropriate land-use scenario [2]; and
• Whether the levels of PFOA found were consistent with local or national widespread levels as a result of low-level diffuse pollution.
Representative soil concentrations at the Occupation Road site exceeded the C4SL by up to a factor of 4. While data on ambient levels of PFOA in English soils is limited, indicative evidence suggests that local levels in the Thornton-Cleveleys area are much higher. As a result, it is concluded that the Occupation Road site cannot be placed in Category 4 based on the outcome of the GQRA, and further assessment in accordance with the LCRM guidance [6] and Statutory Guidance [3] is required.
5.3.1
In Section 5.2, an assessment concluded that there was insufficient evidence to place the Occupation Road site in Category 4 for risks to Human Health under the Part 2A regime [3]. The interim C4SL for PFOA [2] was key evidence used in that assessment. However, as noted in the Statutory Guidance [3], generic assessment criteria such as C4SL represent cautious estimates of levels in soil that suggest a potential risk to health, and they should not be used as direct indicators of whether a significant possibility of significant harm (SPOSH) exists. They also do not describe the boundary between Categories 2 and 3 for risks to Human Health under the Part 2A regime. In the context of Part 2A, land only meets the definition of Contaminated Land if the authority considers it falls within Categories 1 or 2.
In this section, evidence is presented to assist the authority in deciding whether the Occupation Road site potentially falls within Categories 1, 2, or 3 with respect to risks to Human Health under the Part 2A regime.
No : 70100310
5.3.2
The evaluation is split into three sections:
• Estimates of human exposure to PFOA based on modelling and supported by site information;
• Comparison of estimated exposures with available evidence from epidemiological and animal studies of PFOA to consider the likelihood and significance of risk to human health; and,
• Other considerations to contextualise the evidence presented for site exposures to PFOA, including comparison with other examples of environmental contamination found internationally, such as via food and drinking water, and decisions taken by other authorities at similar sites, albeit under different jurisdictions.
These are considered the multiple lines of evidence needed to support any regulatory decision.
This sub-section provides estimates of human exposure to PFOA for the two critical human health receptors (female adult, female child), as defined in Table 2-1, which can be used to further evaluate the potential risks to human health. It incorporates information and tasks available during a Tier 3 DQRA, which is the step beyond a Tier 2 GQRA. A Tier 2 assessment relies primarily on generic assessment criteria [6] and is considered insufficient to further determine the significance of any risk to human health under the Statutory Guidance [3].
These exposure estimates for children and adults are based on forward modelling using the CLEA model [45] The parameterisation of the model is supported by lines of evidence including the paired produce / soil root zone samples (see Table C.4 in Appendix C), and a questionnaire circulated to the allotment users to gather further information on how they use their individual plots (included within the factual report [14]). This is followed by a further discussion of the uncertainties in the exposure estimates, and whether these likely lead to an under- or over-estimation of exposure by using the conceptual model for an allotment scenario in the model.
5.3.2.1
Estimates of human exposure for a generic adult and child were made using the CLEA model [45] operating in forward (ratio) mode using the default C4SL allotment scenario (Environment Agency [5], CL:AIRE [18]) and chemical parameters from the derivation of the interim C4SL for PFOA (CL:AIRE [2]). In forward mode, the CLEA model estimates the average daily exposure (ADE) to a soil-borne chemical in mg chemical/kg body weight/day for a defined receptor and land-use scenario, for a specified soil concentration. The exposure pathways assumed by the allotment scenario have been previously described in Section 2.2 While the interim C4SL for PFOA assumes the most sensitive receptor is a young child (age from birth to six years), which is consistent with the likelihood of increased soil exposure relative to body weight, some potential adverse effects from exposure to PFOA are relevant to adult women of child-bearing age (see Section 5.3.3). Table 5-2 presents estimated exposure using the CLEA model for the Occupation Road site for both a young female child (age classes 1 to 6 in the CLEA model, total exposure duration of six years) and a female adult (age class 17, total exposure duration of 49 years).
One of the key parameters for forward modelling using the CLEA model is the choice of a representative soil concentration. As noted in Section 4.1.1.1, the statistical analysis of soil samples taken at the Occupation Road site indicated that PFOA concentrations in surface soils (0 – 0.1 m bgl) are statistically different from those taken at depth (0.1 – 0.6 m bgl). Therefore, what is the preferred representative soil concentration for initial modelling?
In the technical background to the CLEA model (Environment Agency [5]), the contamination depth assumed by the default conceptual model is 0 – 0.6 m. The importance of the concentration of contamination with depth depends on the exposure pathway In the case of direct soil ingestion, skin contact with soil, and wind-blown dust, the soil nearer the surface (0 – 0.1 m) is likely to have the greater influence on exposure, compared to soil at greater depths. However, for the consumption of allotment produce, plant uptake is often a passive process throughout the soil rootzone. The updated technical background to the CLEA model (Environment Agency [5]) noted that for many crop plants, root depths were as deep as 1 – 2 m bgl; although, the highest density occurred in the top 0.8 m. Many root vegetables need around 0.4 – 0.6 m of soil to establish their roots [46]
As noted in Section 2.5, the CL:AIRE interim C4SL report for PFAS [2] noted that consumption of allotment produce contributed around 98.7% of the total predicted human exposure to PFOA at a soil concentration equal to the interim C4SL. On this basis, the sub-surface (0.1 – 0.6 m) soil concentration across the Occupation Road site is considered the most representative for estimating site user exposures.
Table 5-2 presents estimated exposure to PFOA using the CLEA model for the Occupation Road site for both a young child (age classes 1 to 6 in the CLEA model) and an adult (age class 17). The initial soil concentration of PFOA used for this estimate is 7.3 µg/kg DW, which is the 95th percentile upper confidence limit of the mean for the sub-surface dataset (0.1 – 0.6 m bgl), as calculated from the site investigation data in Section 4.1.1.3
Table 5-2 – Estimated ADE of PFOA in mg/kg bw/d for an adult and a child *
ADE (contribution to total ADE)
(non-soil) ADE (oral and inhalation)
* using forward modelling in the CLEA model [45] and the standard C4SL allotment scenario, chemical parameters for PFOA from the interim C4SL for PFAS report, and a representative site soil concentration of 7.3 µg/kg DW PFOA
It can be noted from Table 5-2 that the ADE for a child is higher than the ADE for an adult. In both cases, the major contributor to the total ADE is the site itself (comprising 68% of exposure for a child and 79% for an adult, respectively).
5.3.2.2 Site-specific
It has been previously noted that the consumption of allotment grown produce is the most important exposure pathway for PFOA using the standard C4SL allotment scenario in the CLEA model. The basis for estimating the soil-derived ADE via this pathway is set out in Chapter 7 of SR3 (Environment Agency [5]) and depends on the following parameters, as described in Equation 7-16 in SR3:
• The soil concentration;
• The soil-to-plant concentration factor for each produce group;
• The average amount of each produce group consumed daily; and,
• The fraction of each produce group considered to come from the allotment.
Project No : 70100310
Tables 5-3, 5-4, and 5-5 summarise the key parameters used by the CLEA model for this scenario (Environment Agency [5], CL:AIRE [2,18]).
Further work has been undertaken to evaluate two of the key parameters used by the CLEA model to estimate exposure via this pathway. This work included the collection of paired samples of produce and root zone soils and the subsequent calculation of site-specific soil-to-plant concentration factors for the vegetables made available for sampling (see Table C.4 in Appendix C). Tenants were also asked to complete a questionnaire to better understand how they used their plots, the types of fruit and vegetables they grew and to capture evidence relevant to the fraction of each produce group they consumed that came from the allotment.
Due to the constricted nature of the produce sampling, and the limited questionnaire responses received from plot holders, neither activity provided a robust and complete dataset that could be used to replace the quantitative assumptions in the CLEA model. However, they did provide useful evidence to sense-check the use of the default data within the CLEA model
Table 5-3 – Default consumption rates used by the CLEA model for the allotment C4SL for PFOA by receptor age and produce group.
The soil to plant concentration factor (CF) is the ratio of the concentration of PFOA in soil to the corresponding level in the edible fraction of fruit or vegetable and represents the plant uptake of PFOA and the potential level to which a consumer of the produce might be exposed. The default values used in the CL:AIRE interim C4SL report for PFAS [2] were the geometric mean of concentration data collected from a wide range of literature studies. The authors of the C4SL report noted that limited data (one data point) was available for tree fruit, and no data was reported for shrub fruit.
Empirical data, as collected during the December 2025 site investigation works, was used to calculate CF values for green vegetables, root vegetables and tuber vegetables in mg/g FW plant to mg/g DW soil. The produce was not washed in the field during the sampling works, but excess soil was removed by the WSP engineers, and limited cleaning was then undertaken by the laboratory prior to produce analysis Details are provided within Table C.4 in Appendix C and a comparison with the default data used by the CLEA model is shown in Table 5-4.
Project No : 70100310
Table 5-4 – Comparison of default soil-to-plant concentration factors for PFOA by produce group, with representative data from samples taken from the Occupation Road allotments.
Produce Group
Green vegetables
Root vegetables
Tuber vegetables
Herbaceous fruit
Shrub fruit
Tree fruit
Soil-to-plant concentration factors (mg/g FW plant over mg/g DW soil)
Default Site Observed Values geometric mean (minimum and maximum values)
0.0871 0.0506 (0.0008 – 0.3993)
0.0532 0.0554 (0.0135 – 0.5452)
0.00223
0.0176 (0.0166 – 0.0184)
0.0214 No data
Not modelled No data
Not modelled No data
PFOA was reported in plant samples at concentrations above the method detection limit (MDL) of 0.001 µg/kg FW in 24 of the 25 No. produce samples submitted for testing (as presented in Table 4-3). This provides clear evidence for an exposure pathway from soil to site users.
While the data within different produce groups varied by up to three orders of magnitude (a finding commonly observed in such datasets), the geometric mean values of CF values measured at the Occupation Road site are within an order of magnitude of the default values used for the derivation of the interim C4SL for PFOA [2]. Although there is insufficient site data for a broader range of crops to be considered (due to the timing of sampling), this provides a line of evidence that qualitatively suggests that the default CF parameters are not unreasonable.
As part of the detailed site investigation works, WSP produced a questionnaire to be distributed to all allotment plot holders (see further details in factual report [14]). The aim was to collect a wide range of information on the activities undertaken by plot holders including the types of produce grown and any soil conditioning undertaken, to provide site-specific background and context. Responses were only received from eight of the 22 No. plot holders, and consequently the results of this survey may not be representative of the behaviours of all allotment users.
Table 5-5 compares a summary of the responses with the CLEA model defaults.
Table 5-5 – Comparison of default homegrown fraction by produce group with representative data collected from responses to an allotment questionnaire.
Produce Group Homegrown Fraction (dimensionless) [5]
Green vegetables
Default Questionnaire Responses
0.33
Root vegetables
Project No : 70100310
0.40
All respondents (8 of 8) reported consuming green vegetables grown at the site with estimates of the proportion of the diet for this produce group ranging from 5 – 95% (mean 52% or a fraction of 0.52).
Most respondents (6 of 8) reported consuming root vegetables grown at the site with estimates of the proportion of the diet for this produce group ranging from 5 – 95% (mean 23% or a fraction of 0.23).
Produce Group
Tuber vegetables
Homegrown Fraction (dimensionless) [5]
Default Questionnaire Responses
0.13
Herbaceous fruit
0.40
Shrub fruit
0.60
Tree fruit
0.27
Half of respondents (4 of 8) reported consuming tuber vegetables grown at the site with estimates of the proportion of the diet for this produce group ranging from 0 – 95% (mean 35% or a fraction of 0.35).
Most respondents (6 of 8) reported consuming herbaceous fruit grown at the site with estimates of the proportion of the diet for this produce group ranging from 5 – 75% (mean 37% or a fraction of 0.37).
A minority of respondents (3 of 8) reported consuming shrub fruit grown at the site with estimates of the proportion of the diet for this produce group ranging from 5 – 40% (mean 11% or a fraction of 0.11).
Half of respondents (4 of 8) reported consuming tree fruit grown at the site at the site with estimates of the proportion of the diet for this produce group ranging from 0 – 40% (mean 11% or a fraction of 0.11).
Although only a minority of plot holders (around one third) responded to the questionnaire, their evidence suggests that some site users consumed a greater proportion of allotment grown produce for some produce groups (green and tuber vegetables) and less for others (shrub and tree fruit) than that assumed by the CLEA model. However, interpretation of the results is difficult with some respondents answering “fruit” and not specifying the individual categories, such as herbaceous, shrub, and tree.
It is a challenge to quantitatively interpret the questionnaire data in the context of the overall estimate of exposure using the CLEA model. In some cases, it qualitatively suggests that the default parameters used for the CLEA model may be conservative – that is, over predicting intake, notably through the consumption of root vegetables. However, it also suggests that intakes may be underestimated – most notably in the consumption of potatoes (a tuber vegetable), where the default values for both CF and the proportion of home grown produce in the diet appear to have been underestimated from the site data. The consumption of shrub and tree fruits is also a potential area where the predicted intakes have been underestimated. These two produce categories are not considered at all within the standard C4SL allotment land-use scenario for PFOA because of a lack of available chemical data on plant uptake (CL:AIRE [2]); although, they were reported to be grown for consumption by some plot holders on the Occupation Road site
In conclusion, the limited evidence collected to support the risk evaluation suggests that the use of the default approach in the CLEA model to estimate human exposure due to the consumption of allotment grown produce is not unreasonable and unlikely to be overly precautionary. Unfortunately, no data was available to update the consumption rates for the produce groups, which would require plot holders to keep some form of food diary for most of the year to reflect the availability of seasonal produce. This remains an important and significant uncertainty.
Project No : 70100310
The estimated total ADE reported in Table 5-2 is the sum of soil-derived ADE and ADE from other sources, including the general diet, drinking water and ambient air (‘background exposure’). This section considers several other challenges to the estimated exposures from the Occupation Road site.
The first possible issue to consider is whether PFOA exposure is overestimated due to double counting from the consumption of allotment produce and from the dietary contribution from root and leafy vegetables and tubers to the non-soil background intake. As noted in Section 5.3.2.2, a minority of plot holders grow a significant proportion of their consumed produce at the allotment and therefore dietary contributions from non-site sources would be expected to be reduced. However, for most plot holders and most produce categories, the majority of consumed fruit and vegetables is not expected from the site.
The assumptions for non-soil (background) ADE are taken from the interim C4SL PFAS report [2], where the estimated oral and inhalation adult mean daily intakes (MDI) for PFOA were reported as 0.0128 µg/day and 0.00104 µg/day, respectively. The non-soil ADE estimated from these values is shown in Table 5-6
Table 5-6 – Key assumptions for the non-soil (background) ADE for PFOA in mg/kg body weight/day for an adult and a young child.
Non-soil
The inhalation MDI was based on measured concentrations of PFOA within indoor and outdoor air, taken from four studies (CL:AIRE [2]). There is considered to be a very low risk of double counting with site exposures, as ambient air levels were measured from a wide variety of sources and are likely a baseline for site levels.
The oral MDI is based on the sum of adult mean dietary and drinking water intakes (CL:AIRE [2]) No double counting is expected from the component from drinking water, as this is not considered by the allotment scenario in the CLEA model. Mean dietary intakes were estimated from the lower bound estimates of intake from the UK National Diet and Nutrition Survey for the period 2008 to 2011 (Table A5 of Annex A, EFSA [7]). By examining the supplementary data in Table A6 of Annex A (EFSA [7]), which identified the main contributing food categories from a number of dietary surveys across different age categories, double counting of up to of 10 - 15% of the oral MDI is possible within the non-soil (background) ADE.
Consequently, reducing the oral non-soil ADE by 15% would result in a revised total non-soil ADE of 6.75E-07 and 1.70E-07 mg/kg body weight/day for a child and an adult, respectively.
No : 70100310
The representative PFOA soil concentration used to predict the ADE reported in Table 5-2 is 7.3 µg/kg DW, which was based on chemical analysis of sub-surface soil samples collected from the Occupation Road site (see also Section 4.1.1). However, the testing method used by the analytical laboratory was based on a linear PFOA reference sample (that is, a PFOA molecule without significant branched alkyl groups) and that branched PFOA present in the sample may have been under reported. Other studies (Schulz et al [19]) have suggested that this under reporting could be as much as 20% of the total PFOA concentration in the sample. Since there is a linear relationship between the representative soil concentration and predicted soil ADE by the CLEA model, this suggests that increasing the representative soil concentration by 20% to 8.8 µg/kg DW would result in an increased soil ADE of 1.97E-06 and 8.68E-07 mg/kg body weight/day for a child and adult, respectively.
The outcome of the Track 1 investigation of the area surrounding the AGCCE Ltd facility reported the ubiquitous presence of PFOA in surface soils [13]. In terms of human exposure, this indicates that users of the Occupation Road site and family members that consume produce from the allotment (who may not otherwise visit the site) may also be exposed to soil contamination from other sites, such as residential gardens and recreational public open space. While it is challenging to estimate this additional off-site soil exposure, it can be illustrated through forward modelling using the CLEA model. For example, if we assume that the allotment plot holder and their family live within the surrounding area then additional PFOA exposure can be estimated by using the CLEA model with the C4SL land use scenario for a residential property (without homegrown consumption) and a representative soil concentration estimated from the Track 1 study.
Table 6-1 in the factual report for the Track 1 works [13] reported that the mean PFOA soil level found at seven individual locations within 500 m of the AGCCE Ltd facility ranged from 4.1 to 11.6 µg/kg DW, with a mean value of 8.9 µg/kg DW. Assuming a representative PFOA soil concentration of 8.9 µg/kg DW, the soil ADE for a C4SL residential scenario using the CLEA tool (Environment Agency [5], CL:AIRE [2,18]) would be 6.91E-08 and 9.99E-09 mg/kg body weight/day for a child and adult, respectively (CLEA model output reports are included within Appendix C). This represents an additional soil ADE of only 3.5% for a child and 1.2% for an adult, suggesting that the majority of soil exposure would come from the Occupation Road site. In conclusion, the most significant effect of the above considerations is the underestimation of the soil concentration due to a systematic limitation in the analysis. However, as shown in Table 5-7, this is offset in part by potential double counting in the non-soil (background) ADE. Exposures from other sites are likely to make a small additional contribution to total PFOA ADE.
Project No : 70100310
Table 5-7 – Comparison of the original estimate of total ADE for PFOA in for an adult and a young child with an adjusted total taking into account potential double counting for non-soil ADE, systematic bias in chemical analysis, and potential contributions to soil exposure from other sites.
As introduced in Section 5.2.1, the use of generic assessment criteria including the C4SLs are useful to indicate when land presents a low risk, meaning it is highly unlikely to pose a significant possibility of significant harm to human health (SPOSH). As the Statutory Guidance [3] makes clear, such assessment criteria should not be used as direct indicators of whether a significant possibility of significant harm exists, or to mark the boundary between Category 2 and Category 3
In Section 2.6, the term ‘significant harm’ was introduced, along with an overview of the potential adverse health effects that have been attributed to exposure to PFOA by numerous authoritative bodies. The toxicological effects of PFOA and its potential impacts on public health have been widely reviewed in recent years, although many uncertainties in the interpretation of epidemiological and animal studies remain.
To evaluate the significance of estimated exposures to PFOA for users of the Occupation Road site (and consumers of its allotment-grown produce), data has been collated from a number of authoritative reviews on the toxicology of PFOA. The purpose of this review is to ensure that a broad range of evidence, and not just the health-based guidance value that underpins the C4SL, is used to inform any decision on whether the land meets the definition of Contaminated Land (that is, it should be placed in Category 1 or 2, and not Category 3 in accordance with the Statutory Guidance [3]).
Collating and presenting a broad evidence base provides a clearer understanding of the underlying toxicological uncertainty and ensures that this is considered as part of any robust decision-making process. The review is not a detailed evaluation or systematic review of the available data, which is the subject of on-going work by the Expert Committee on the Toxicity of Chemicals in Food, Consumer Products, and the Environment (COT)
The approach taken here is consistent with a margin of exposure approach (EFSA [20]), which is a tool used by risk assessors to assess safety concerns in a range of different scenarios, including food safety. Firstly, the assessor identifies one or more points of departure (POD) from relevant epidemiological and toxicological studies. PODs include no observed adverse effect levels (NOAELs), low observed adverse effect levels (LOAELs), and lower confidence limits of the benchmark dose (BMDLs) for specific endpoints from a relevant study. Secondly, the assessor estimates an exposure for a specific population – in this case, the estimated exposures for allotment plot holders at the Occupation Road site, as presented in Table 5-2. The ratio of the POD to the
Project No : 70100310
estimated exposure level is calculated, with a lower ratio indicating a greater concern for public health. EFSA [20] noted that for a thresholded adverse effect, a margin equal to or greater than 100 for a POD derived from an animal study would not be considered a concern to public health. Margins much lower than 100 may still not represent a concern, if the POD is derived from an epidemiological study or the POD from an animal study is adjusted to take into account some of the interspecies differences For example, a POD adjusted to a human equivalent dose (HED) from an animal study (a POD-HED), already accounts for some of the toxicokinetic differences between the animal species and humans and therefore margins of exposure equal to or greater than 25 would not be considered a concern to public health. Further information on the basic principles of chemical risk assessment can be found in the Environment Agency report SR2 ‘Human health toxicological assessment of contaminants in soil’ [17]
While there is very little toxicological data on many PFAS, PFOA is one of the most studied. Authoritative reviews have been published in recent years by:
• Agence nationale de sécurité sanitaire de l’alimentation, de l’environnement et du travail (ANSES) [21];
• Agency for Toxic Substances and Disease Registry [22];
• European Food Safety Authority [23,24];
• Food Safety Commission of Japan [25];
• Health Canada [26];
• Food Standards Australia New Zealand [27];
• National Health and Medical Research Council / Australian Drinking Water Guidelines [28];
• Office of Environmental Health Hazard Assessment for State of California [29]; and,
• United States Environmental Protection Agency [30]
POD-HEDs shortlisted as candidates for health-based guidance values by these authoritative organisations were collated from their review documents and are shown in Table 5-8. These were primarily derived using physiologically based pharmacokinetic (PBPK) modelling from a blood concentration of PFOA in animals or humans to an equivalent dietary human intake.
No : 70100310
Table 5-8 – Summary table of POD-HED identified by authoritative organisations with details provided on overall effect classification, the specific endpoint of concern from the study, the model (animal or human), and the type of POD reported.
4 Health Canada 2018 concluded that tumours were not likely to have been caused by a non-thresholded mechanism. The weight of evidence suggests that PFOA is not genotoxic
5 SLR/NHMRC 2024 concluded that tumours were not likely to have been caused by a non-thresholded mechanism. The weight of evidence suggests that PFOA is not genotoxic
ATSDR 2021 [22] Developmental Effects Neurodevelopmental effects (decreased number of inactive periods, altered novelty induced activity)
[22]
2021 [22] Developmental Effects Reduced ossification of proximal phalanges and advanced preputial separation
ATSDR 2021 [22] Developmental Effects Increased ambulatory activity
(2011)
Food Safety Commission of Japan 2025 [25] Developmental Effects Reduced number of ossification sites in proximal phalanges of forelimbs and hindlimbs of foetuses, acceleration of sexual maturation in male offspring
FSANZ 2017 [27] Developmental Effects Decreased pup body weight gain
SLR / NHMRC 2024 [28] Developmental Effects Decreased pre-weaning growth rate in pups
DMOE 2015 [31] Hepatic Effects Increased hepatic palmitoyl CoA oxidase activity, increased relative liver weights, and hepatocellular hypertrophy and necrosis of liver cells
DMOE 2015 [31] Hepatic Effects Increased hepatic palmitoyl CoA oxidase activity, increased relative liver weights, and hepatocellular hypertrophy and necrosis of liver cells
[26]
[28]
ATSDR 2021 [22] Immune Effects Reduced response to dinitrophenyl-ficoll (DNP) antigen
In total, 50 No. POD-HED were identified from authoritative reviews, although a small number of these values were duplicates for the same endpoint from the same study. The values were grouped into six different effect categories (see the following subsections for a description and discussion of each category)
Figure 5-1 below presents the POD-HED graphically, alongside the estimated soil ADE (no background) and total ADE (from Table 5-2) for both the child (AC 1-6) and adult (AC 17) receptors It can be seen that these estimates of exposure generally are much lower than the POD-HED derived from animal studies but are within the range of values observed in epidemiological studies. This is the focus of further discussion within this section
Figure 5-1 - Child (AC 1-6) and Adult (AC 17) ADE (Sub-surface Soils) Plotted Against PODHED Data.
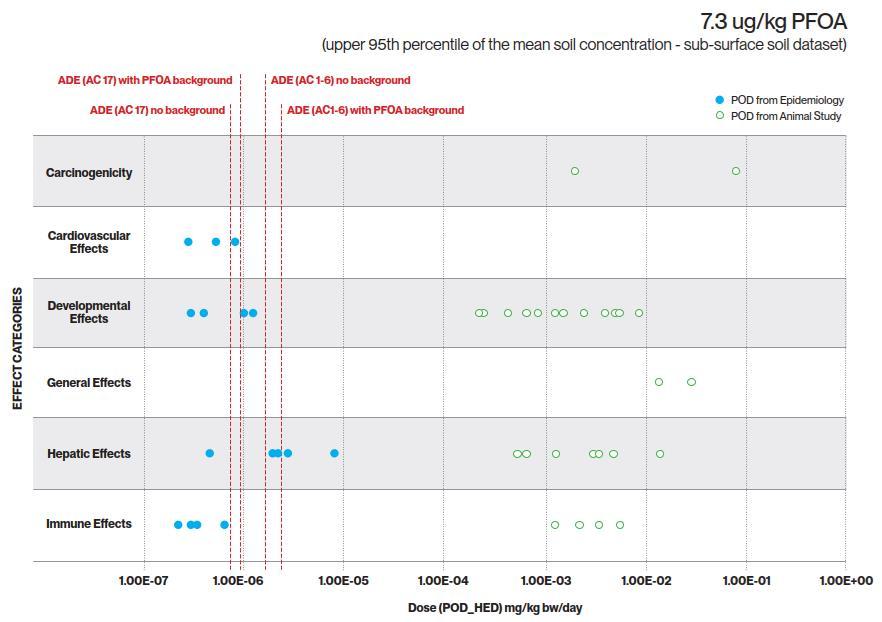
In the interpretation of the margins of exposure used in this report, the authors have used the approach described in Table 5-9. As noted in sections 5.3.3.1 to 5.3.3.6, the biological and clinical relevance, and adverse health impacts of biomarkers and other endpoints observed in epidemiological studies is not clearly understood and there remains critical differences of opinion and interpretation between authoritative bodies. Therefore, the statement of a possibility of a potential effect adopted in this report applies to a specific study endpoint (such as changes in cholesterol levels) and not necessarily to the occurrence of clinical symptoms of disease.
Project No : 70100310
5.3.3.1
Table 5-9 – Overview of the categorisation and terminology used for the margin of exposure assessment in this risk evaluation.
Margin of Exposure Category
Animal studies Human studies
≥ 25 ≥ 10
1 – 25 1 – 10
≤ 1 ≤ 1
A very low possibility of a potential effect on the endpoint(s) in question
A low to moderate possibility of a potential effect on the endpoint(s) in question
A moderate to high possibility of a potential effect on the endpoint(s) in question
PFOA is classified as carcinogenic to humans (Group 1) by the International Agency for Research on Cancer (IARC Monographs Volume 135 [32]). They noted in the Group 1 evaluation that “…based on the combination of sufficient evidence for cancer in experimental animals and strong mechanistic evidence of key characteristics of carcinogens in exposed humans.”
Several authoritative organisations do not consider PFOA to be a genotoxic carcinogen, and that carcinogenicity has a threshold (EFSA [23,24], NHMRC [28]). The NHMRC reported in 2025 [33] that no evidence for genotoxicity had been identified by the IARC [32] and that evidence from animal studies had not reported genotoxicity at non-cytotoxic concentrations (ATSDR [22]). Although the USEPA [30] have derived cancer slope factors from epidemiological studies that assumed a non-threshold behaviour, the NHMRC [33] noted that the USEPA had acknowledged a lack of information to support a mutagenic mode of action.
Two POD-HED for carcinogenic effects were identified from authoritative reviews. Health Canada [26] reported a NOAEL for the incidence of Leydig tumours and NHRMC [28] reported a BMDL10 for the incidence of pancreatic tumours, both in rat studies. The margin of exposure from the lowest of these two POD-HED is 2,063 and 782, for adult and child exposures, respectively, indicating a very low possibility of a potential effect on the incidence of tumours
5.3.3.2
All of the POD-HED chosen by authoritative bodies for cardiovascular effects were derived from epidemiological studies in the adult human population (EFSA [23], USEPA [30]).
The European Food Safety Authority concluded in 2018 [23] that a likely association between blood serum PFOA levels and blood serum cholesterol levels, observed in epidemiological studies, was causal, and that an increase in cholesterol levels was considered adverse. They derived two POD-HED as BMDL5 values, based upon epidemiological studies (Steenland et al. 2009, Eriksen et al. 2013). In their updated Opinion on PFAS in 2020 [24], EFSA revised their view on this endpoint. In the executive summary, they stated that although “… the association with increased cholesterol was observed in a large number of studies, the CONTAM panel now considers the uncertainty regarding causality to be larger This is primarily due to a postulated biological process around the
Project No : 70100310
5.3.3.3
enterohepatic cycling of both PFASs and bile acids, the latter affecting serum cholesterol levels. This should be further investigated.”
The USEPA concluded in 2024 [30] that the available evidence indicated that PFOA exposure is likely to cause cardiovascular effects in humans, given sufficient exposure conditions (e.g., at measured levels in humans as low as 1.1 to 5.2 ng/mL, and at administered doses in animals as low as 0.3 to 1.0 mg/kg/day). They proposed that the primary evidence supporting cardiovascular effects was increased blood serum lipid levels in humans and alterations to lipid homeostasis in animals.
POD-HED as BMDL5 values were proposed as candidates for the derivation of a health-based guidance value from two medium confidence epidemiological studies (Steenland et al. 2009, Dong et al. 2019). The USEPA [30] commented that even a small increase in serum cholesterol was clinically relevant when extrapolated to the overall population, because this could “… shift the distribution of serum cholesterol in the overall population relative to the clinical cut-off, leading to an increased number of individuals at risk for cardiovascular disease.”
The SLR addendum to the NHMRC review [28] identified significant limitations in the epidemiological study by Dong et al. 2019 (as cited by the USEPA [30]) and did not recommend using the POD-HED determined by the USEPA [30] as a basis for the Australian drinking water guideline. The SLR addendum to the NHMRC review [28] noted that the clinical significance of the findings by Dong et al. 2019 were unclear.
The margin of exposure from these four POD-HED (BMDL5 values) range from 0.3 to 0.9 for adult exposure, and from 0.1 to 0.3 for child exposure. This suggests a moderate to high possibility of a potential effect on cholesterol levels, although there is considerable uncertainty amongst authoritative bodies on the clinical relevance and significance of this endpoint. The four POD-HED were derived from studies of the general adult population and therefore may not have accounted for susceptibility in children.
A total of 14 No. POD-HED based on developmental effect endpoints in mice studies were identified by authoritative bodies with seven proposed by ATSDR [22]. A range of specific endpoints were identified including skeletal alterations, reduced ossification of proximal phalanges and advanced preputial separation, neurodevelopmental effects, decreased pup growth rates, and decreased pup survival rates. Four POD-HED were also proposed by authoritative bodies for developmental effects derived from epidemiological studies (EFSA [23], USEPA [30]). The critical effect was considered to be low birth weight.
In all cases, the margin of exposure from POD-HED derived from animal studies were much greater than 25. This indicates a very low possibility of a potential effect for the different endpoints, and no detailed discussion of the animal studies is required.
In 2018, EFSA [23] reviewed 13 No. prospective and four cross-sectional epidemiological studies that examined associations between PFOA and/or PFOS and birth weight. Relatively modest but consistent inverse associations with birth weight were observed for both compounds, although this may have been partly confounded by physiological changes in pregnancy (Committee on Toxicity Statement, 2022 [34]). In 2020, EFSA [24], after review of eight additional studies, concluded that “there may well be a causal association between PFOS and PFOA [exposure] and birth weight.” EFSA [23] proposed two POD-HED based on the BMDL5 values from two studies (Fei et al. 2007, Whitworth et al. 2012). Fei et al. (2007) reported a significant inverse association between maternal
Project No : 70100310
5.3.3.4
blood serum concentrations (n = 1,400) of PFOA (mean 5.6 ng/mL) and birth weight with a modest reduction of 5 g in birth weight per 1 ng/mL increase in maternal concentrations (corresponding to around 50–60 g reduction in birth weight over the effective exposure range). Whitworth et al. (2012) reported a borderline significant inverse association between maternal concentrations of PFOA (median 2.2 ng/mL, n = 901) of 106 g comparing the highest to lowest quartile of exposure. EFSA [23] concluded that the “… biological relevance of an inverse association with birth weight on its own was unclear. Whether a modest reduction in birth weight was an indication of some adverse events that will become apparent later cannot, however, be excluded. Overall, despite relatively consistent inverse associations being observed, some uncertainty about the causality of these findings remains.” EFSA [24] reinforced this view by observing that “… the decrease in birth weight after adjusting for confounders is not large and the potential longer-term consequences of this decrease are unclear.”
The USEPA [30] concluded that for developmental effects, the primary evidence was decreased birth weight in human infants and decreased offspring survival, decreased fetal and pup weight, delayed time to eye opening, and related pre- and postnatal effects in animal studies. The USEPA [30] noted that decreases in birth weight “… even at smaller magnitudes at the individual level, are clinically relevant when extrapolated to the overall population. This is because, at the population level, even small magnitude decreases in birthweight could shift the distribution of birthweight in the overall population relative to the clinical cut-off, leading to an increased number of individuals at risk for decreased birthweight and subsequent effects related to decreased birthweight.” They derived BMDL5 values for decreases in body weight observed in two epidemiological studies with cohorts of mothers and infants (Sagiv et al. 2018, Wikstrom et al. 2020). A BMR of 5% was selected because decreased birth weight was considered a sensitive developmental effect. The SLR addendum to the NHMRC review [28] commented that there was no statistically significant difference between birth weight and PFOA in the Sagiv et al. 2018 study, after correction for confounders. In the case of Wikstrom et al. 2020, the SLR addendum to the NHMRC review [28] acknowledged that low PFOA doses appeared to be associated with decreased birth weight, but they concluded that the data on dose response was not considered sufficiently reliable for use as a key study for derivation of the Australian drinking water guideline.
Given this endpoint is based on maternal blood serum concentrations, the exposure estimates for adults (females of childbearing age) are considered more relevant for any margin of exposure assessment. The margins of exposure calculated from these four POD-HED (BMDL5 values) range from 0.3 to 1.3. This suggests, for two of these four POD-HEDs, there is a moderate to high possibility of a potential effect on birth weight, although there is considerable uncertainty amongst authoritative bodies on the clinical relevance and significance of this endpoint. For the remaining two POD-HEDs, there is a low to moderate possibility of a potential effect on birth weight.
Two POD-HED were derived from animal studies for decreases in mean body weight (Lau et al. 2006, Perkins et al. 2004). The margin of exposure from the lowest of these two POD-HED is 14,115 for an adult and 5,350 for a child, indicating a very low possibility of a potential effect on body weight. There are no further considerations.
Project No : 70100310
5.3.3.5
In experimental studies, the liver was the target organ in rodents (EFSA [23]). Ten POD-HED based on hepatic effect endpoints in rodent studies were identified by authoritative bodies with specific endpoints including hepatocellular hypertrophy and necrosis, liver inflammation, and increases in liver weight. The lowest POD-HED values were from a study by Perkins et al. 2004, which were used by Health Canada [26] and ANSES [21] in the derivation of health-based guidance values. The margin of exposure from the lowest of these two POD-HED is 566 and 214, for adult and child exposures, respectively. This indicates a very low possibility of a potential effect for the different endpoints
Five POD-HED were derived from epidemiological studies by three different authoritative organisations (EFSA [23], OEHAA [29] and USEPA [30]). The specific endpoint identified in all derivations was increased blood serum levels of alanine transferase (ALT).
EFSA [23] noted that epidemiological studies provided support for a causal association between exposure to PFOA and increased serum levels of the liver enzyme ALT. However, on further review, EFSA [24] commented that the “… magnitude of the associations was small (~ 3%), however, and few studies found associations with ALT outside the reference range, and there were no associations with liver disease.” EFSA [23] proposed a POD-HED based on a BMDL5 value from the study by Gallo et al. 2012, who investigated associations between PFOA and biomarkers of liver function in a cross-sectional study of 47,000 adults. The study adjusted for common causes of elevated liver enzymes such as ALT including obesity (BMI) and high alcohol consumption.
OEHHA [29] commented that the current epidemiological literature provided consistent evidence that PFOA can cause hepatotoxicity in humans, and in particular, increases in liver enzyme levels. However, they also noted that consistent evidence for overt liver diseases had not been seen. OEHHA [29] proposed a POD-HED derived from a NOAEL value from the study by Gallo et al. 2012. They described this endpoint as representative of an increased risk of liver toxicity, as indicated by elevated ALT levels that exceeded clinically based reference levels used by the International Federation of Clinical Chemistry and Laboratory Medicine. OEHHA [29] also noted that “… These fairly small effect sizes raise concerns that they may be due to relatively small amounts of residual confounding or bias. Importantly though, the fact that associations were seen across a number of different study populations and the fact that results changed only slightly after adjustments for potential confounders in several studies are evidence that this is not the case.” In terms of the significance of the effect, OEHHA [29] concluded that the “… relatively small effect sizes reported in most of the studies of PFOA and liver enzymes might also raise concerns about their clinical relevance These effect sizes are generally lower than what might be seen with overt hepatitis or other severe liver disease. Regardless, as shown for lead and other prevalent exposures, small effect sizes like this, which might have only minor or unnoticeable effects in an otherwise healthy individual, can have very important impacts on a population basis or in particularly susceptible people especially for very common exposures like PFOA. A good example of this has been shown for thyroid hormones, and the same principles apply to hepatotoxicity.”
The USEPA [30] concluded that there was “… moderate evidence for an association between PFOA exposure and hepatic effects in humans based on associations with liver biomarkers, especially ALT, in several medium confidence studies.” They proposed three POD-HED derived from BMDL5 values from three medium confidence epidemiological studies (Gallo et al. 2012, Darrow et al. 2016, Nian et al. 2019). The two largest studies of PFOA and ALT in adults (Gallo et al. 2012 and Darrow
Project No : 70100310
5.3.3.6
et al. 2016) were both conducted in over 30,000 adults. The third study by Nian et al. 2019 examined a large population of adults in Shenyang (one of the largest fluoropolymer manufacturing centres in China). The USEPA [30] concluded that the POD-HED based on Gallo et al. 2012 was the preferred candidate value for derivation of a health-based guidance value because (a) unlike Nian et al. 2019, the predominant exposure was from PFOA and not PFOS and (b) unlike Darrow et al. 2016, the serum ALT levels were measured and not modelled. The SLR addendum to the NHMRC review [28] reviewed the three studies selected by USEPA [30] and concluded that the dose response data from these studies were not considered sufficiently reliable for use as a key study for derivation of the Australian drinking water guideline.
The margin of exposure from these five POD-HED (four BMDL5 values and a NOAEL value) range from 0.5 to 8.6 and from 0.2 to 3.3 for adult and child exposures, respectively. In respect of the Gallo et al. 2012 study alone, the margins varied from 2.2 to 2.9 and 0.8 to 1.1 for adult and child exposures, respectively. This suggests, for three of the five of these POD-HEDs, a moderate to high possibility of a potential effect on serum ALT levels, although there is considerable uncertainty amongst authoritative bodies on the clinical relevance and significance of this endpoint. For the remaining two POD-HEDs, there is a low to moderate possibility of a potential effect on serum ALT levels.
In animal studies, PFOA has been shown to cause a reduced response to vaccination (T-celldependent antibody response) (EFSA [24]). Four POD-HED based on immune system effects in mice studies were identified by authoritative bodies with specific endpoints including reduced response to dinitrophenyl-ficoll (DNP) antigen and reduced response to sheep red blood cells (SRBC). The margin of exposure from the lowest of these POD-HED is 1,314 and 498, for adult and child exposures, respectively. This indicates a very low possibility of a potential effect for the different endpoints, and no detailed discussion of the animal studies is required.
EFSA [24] considered the findings of a decreased immune response to be robust, since they were consistently observed for PFOA in rodents and in humans. They derived a POD-HED for the combined effect of PFOS, PFOA, PFNA, and PFHxS from a derived BMDL10 for decreased serum anti-diphtheria antibody concentration in predominantly breastfed children (around one year old) from an epidemiological study by Abrahams et al. 2021. Using a PBPK model, and assuming 12 months of breastfeeding, EFSA [24] estimated that the BMDL10 in infants corresponded to a dietary intake by the mother of 0.63 ng/kg bw per day for the sum of four PFAS. Although they noted that a decreased vaccination response was considered a risk factor for disease rather than a disease, EFSA [24] concluded that when antibody titres were diminished, the level of protection from vaccines might be compromised. In their 2022 statement [34], COT commented that it was not clear what decrease in antibody levels might cause such an effect, and that there were natural fluctuations in vaccine titres over time.
The COT [34] agreed that on the basis of the information reviewed by EFSA [24], qualitatively the appropriate endpoint had been identified, but quantitatively, they questioned the calculations. COT noted that overall “there were some reservations about the choice of the critical study (Abraham et al. 2020) and the specific effect selected. However, the COT agreed that the critical study was the best available. It was not unreasonable that this study was selected, and in the absence of more appropriate studies, its use was understandable.” They had “… significant reservations about the
Project No : 70100310
model used, including the BMD [benchmark dose] approach, and the TWI [tolerable weekly intake] which had been established, due to the uncertainties and the caveats involved.”
The USEPA [30] observed that the primary evidence for immunotoxicity was developmental immunosuppression in humans, specifically decreased antibody response to vaccination against tetanus and diphtheria in children, and evidence of immunosuppression and other types of immunotoxicity in studies of adult animals, including decreased IgM response to sheep red blood cells (SBRC), reduced spleen and thymus weights, changes in immune cell populations, and decreased splenic and thymic cellularity. They derived four POD-HED from BMDL 0.5 SD values for decreased serum anti-diphtheria and anti-tetanus antibody concentrations from two medium confidence epidemiological studies (Budtz-Jørgensen and Grandjean 2018, Timmermann et al. 2021). However, ultimately the USEPA [30] concluded that the response observed in 7-year-old Faroese children in a cohort study (Budtz-Jørgensen and Grandjean 2018) was more robust than that reported by the cross-sectional study by Timmermann et al. 2021. They also noted that “no biological rationale has been identified as to whether one particular time period or duration of exposure or outcome measurement is more sensitive to an overall immune response to PFOA exposure.”
The USEPA [30] used a novel PBPK model to convert an internal dose metric (serum concentration) to an external exposure. They concluded that this approach “… explicitly models PFOA exposure to infants during nursing who are undergoing rapid development, including growth, through childhood and who do not reach steady state until near adulthood. This allows for a more accurate estimation of exposures associated with either serum levels in children or dose metric from developmental animal toxicological studies.”
The SLR addendum to the NHMRC review [28] reviewed the Timmermann et al. 2021 study selected by the USEPA [30] and reported a number of potential confounders not accounted for in the epidemiological study, including the presence of other chemicals and the time to last vaccination. They also found it difficult to reconcile the large difference between markers of immunosuppression in mice studies (for example, mean PFOA levels of ~73,100 ng/mL, with no effects at 45,300 ng/mL) with the human serum PFOA concentrations in Timmermann et al. 2021 for which statistical associations were found with antibody concentrations (that is, a median of 2.28 ng/mL for PFOA). The SLR addendum to the NHMRC review [28] concluded that this “… indicates there is still marked uncertainty in terms of the appropriateness of using epidemiological data to define the threshold and dose response of effects potentially caused by PFOS and PFOA exposure.” The SLR addendum to the NHMRC review [28] concluded that the dose response data from these studies were not considered sufficiently reliable for use as a key study for derivation of the Australian drinking water guideline.
A margin of exposure was not determined for the EFSA [24] POD-HED because of the complexity in interpreting the results for PFOA alone. The margin of exposure for the four POD-HED for PFOA (BMDL 0.5 SD) derived by the USEPA [30] ranged from 0.2 to 0.4 and from 0.09 to 0.14 for adult and child exposures, respectively. In respect of the Budtz-Jørgensen and Grandjean 2018 study, the margins were 0.3 for adult exposures and from 0.12 to 0.13 for child exposures. This suggests a moderate to high possibility of a potential effect on antibody titres in response to vaccination, although there is considerable uncertainty amongst authoritative bodies on the clinical relevance and significance of this endpoint. It is unclear to what extent the concerns raised by the COT [34] about the derivation of the POD-HED by EFSA [24] are also applicable to the derivations by the
Project No : 70100310
5.3.3.7
USEPA [30]. However, the COT statement [34] suggests that their reservations concerning this endpoint are applicable here.
A wide range of potential hazards to human health from long-term exposure to PFOA have been identified by authoritative bodies. A margin of exposure approach, comparing estimated soil exposures for adults and children from the Occupation Road site with POD-HED values for a range of different effects reported in animal and epidemiological studies, has been undertaken.
In order to conclude that land is Contaminated Land for the purpose of the Part 2A regime, the regulator must consider whether there is a significant possibility of significant harm to human health (SPOSH), based on the available evidence and taking into account the uncertainty. Within the review above, the likelihood of exposure and the significance of the potential effects identified have been considered separately, and the results are summarised below.
In total, 50 POD-HED were identified from authoritative organisations, although a small number of values were duplicates for the same endpoint from the same study. These values were grouped into six different effects categories (see Figure 5-1).
Across all six effect categories, the margin of exposure for POD-HED from animal studies were considered to present a very low possibility of a potential effect for a wide range of study endpoints. Categories that included only POD-HED values from animal studies (that is, carcinogenicity and general toxicity effects) are not considered to meet SPOSH on the basis of the evidence presented. Margins of exposure for POD-HED values from epidemiological studies were much lower, sometimes less than one. On this basis alone, it is considered that for most study endpoints, there is a moderate to high possibility of potential effects across the four categories (cardiovascular effects, developmental effects, hepatic effects, and immune effects). However, while this addresses the question of a significant possibility of an effect, a further question needs to be asked about whether the markers and endpoints seen in the epidemiology studies constitute significant harm. In all cases, there are differences of opinion between authoritative organisations as to the significance of the endpoints reported in epidemiological studies in terms of biological and clinical relevance and adverse effect on health
The lowest POD-HED values have been derived from vaccine response data. Whilst the USEPA [30] and EFSA [24] consider these endpoints to be relevant to public health, other authorities such as the NHMRC [28] and the Food Safety Commission of Japan [25] have considered the uncertainties to be too large, and they have subsequently recommended guidelines based upon animal data. In their 2022 statement, the COT [34] did not object to the choice of endpoint but expressed concerns about how the POD-HED used by EFSA [24] had been derived. Although the COT has not yet reviewed the approach taken by the USEPA (2024, [30]), their statement [34] suggests that there would still be reservations regarding the biological significance of this endpoint. There is therefore considerable uncertainty as to whether the endpoints selected from epidemiological studies constitute appropriate markers for significant harm.
The outcome of this assessment is that for four categories (cardiovascular effects, developmental effects, hepatic effects, and immune effects), there is considered to be a significant possibility of potential effects on various epidemiological markers including cholesterol levels, birth weight, serum ALT levels, and antibody titres in response to vaccination The question of SPOSH requires the
Project No : 70100310
regulator to take either a precautionary view of the evidence or to seek additional technical advice on interpretation of the evidence from a relevant authoritative body.
The purpose of this section of the report is to summarise evidence from other locations where land has been contaminated with PFOA internationally, the soil and produce levels observed, and the views / actions taken subsequently by regulators. In addition, it considers situations where environmental contamination with PFOA (not necessarily of soil) has resulted in measured or estimated exposures to the general public, and the view taken by regulatory authorities in a broader context.
This information helps to contextualise the findings reported here for the Occupation Road site and can be used as supporting information in decision-making. This is consistent with advice in paragraphs 4.19 (a) and (b), and 4.21 (d) of the Statutory Guidance [3].
5.3.4.1
Two relevant examples were identified in the published literature: the DuPont / Chemours site in Dordrecht, the Netherlands and the DuPont Washington Works, Parkersburg, West Virginia, the USA. These are discussed below.
DuPont / Chemours fluoropolymers factory in Dordrecht, The Netherlands
At the DuPont / Chemours fluoropolymers factory in Dordrecht, The Netherlands, PFOA was used as a dispersant in the polymer preparation of Teflon and other fluoropolymer products [37]. Atmospheric emissions of PFOA occurred from 1970 to 2012, and land investigations confirmed in 2000 that PFOA had been deposited over a 50 km radius from the factory [37]. Residential properties were located in close proximity to the factory, within both the Dordrecht and Sliedrecht areas.
The National Institute for Public Health and the Environment (RIVM) has conducted research into possible health risks for the local residents as a result of this long-term exposure. An assessment reported in 2016 [9] comprised the estimation of exposure from air, drinking water and food around the factory, on the basis of emission data only. This assessment did not account for the consumption of homegrown fruit and vegetables. Nevertheless, RIVM concluded that in the past, long-term exceedances of the health-based limit value for PFOA in blood serum of 89 ng/mL7 probably occurred, leading to possible adverse effects on the liver.
In 2018, RIVM undertook an assessment to characterise PFOA (and GenX) concentrations in vegetable crops grown in the area surrounding the Dordrecht factory (reported in 2021) [10]. RIVM reported sum concentrations of GenX and PFOA in a range of produce types, expressed as PFOA equivalent concentrations8 . Concentrations ranged from 0.07 to 2.65 µg/kg FW. This is very similar to the reported PFOA concentrations at the Occupation Road site, where PFOA was detected in
7 The blood serum concentration of 89 ng/mL was selected by RIVM in 2016 as a health-based limit value for long term exposure to PFOA. As a comparison, albeit for a different endpoint (immunotoxicity and not hepatic) the EFSA TWI is based upon a blood serum concentration of 17.5 ng/mL, based upon the sum of PFOS, PFOA, PFNA and PFHxS.
8 The relative potency factors used by RIVM [10] are 0.06 for GenX and 1 for PFOA.
Project No : 70100310
24 of the 25 No. produce samples, with reportable concentrations ranging from 0.0135 to 2.11 µg/kg FW
Their initial conclusions were that vegetable garden crops grown within 1 km of the factory could be consumed, though not too often, and not in large quantities. Following the publication of the revised (stricter) tolerable weekly intake by EFSA in 2020 [7], RIVM updated their assessment, using the original produce data collected in 2017; and as a result, advised local residents not to eat homegrown produce grown within 1 km of the Dordrecht factory.
DuPont Washington Works, Parkersburg, WV. USA
The DuPont Washington Works, located approximately 10 miles south-west of Parkersburg, WV, is a well-known case study, following its depiction in the 2019 motion picture ‘Dark Waters’. Established in the 1940s, the site used APFO as a surfactant in some of its fluoropolymer production processes between 1951 and 2003.
Releases of APFO to the atmosphere and the subsequent deposition to soil, in addition to releases to surface water, were the principal sources of the detected PFOA within local drinking water supplies (Paustenbach et al., 2007 [16]). The highest off-site PFOA impacts were predicted around 1 mile from the facility, where representative surface soil concentrations of PFOA were estimated to be 11 µg/kg (moderately elevated compared to mean surface soil PFOA concentrations at the Occupation Road site of 4.5 µg/kg DW)
In August 2001, a class action lawsuit was filed against DuPont on behalf of approximately 70,000 people in West Virginia and Ohio, due to PFOA-contaminated drinking water supplies linked to the Washington Works.
Between 2005 and 2013, an independent scientific panel (the C8 Science Panel) carried out exposure and health studies on the residents of the Mid-Ohio Valley communities potentially affected by the PFOA emissions from the Washington Works plant [38]. The panel then assessed the links between PFOA exposure and a number of diseases, and concluded that there was a probable link between PFOA exposure and the following health effects:
• Diagnosed high cholesterol;
• Ulcerative colitis;
• Thyroid disease;
• Testicular cancer;
• Kidney cancer; and,
• Pregnancy-induced hypertension.
With regards to the DuPont Washington Works, modelled PFOA concentrations within off-site drinking water (1951 to 2003) are 4 µg/l [16]. Assuming a 70 kg adult drinks 2 litres of water per day, this results in a daily exposure of 1.1E-04 mg/kg body weight/day PFOA. Calculated soil exposures for an adult receptor at the Occupation Road allotments, as discussed in Section 5.3.2, range from 7.2E-07 to 8 7E-07 mg/kg bw/d PFOA. Estimated exposures from this case study are therefore considered to be orders of magnitude higher than those predicted from the Occupation Road site.
Project No : 70100310
Three potentially relevant examples were identified in the literature. Studies of water pollution in Jersey [35] and the Veneto region in Italy [42,43,44], and a study of contaminated composts and sludges applied to agricultural fields in Germany [39,40,41]. However, sufficient data for a comparison with the Occupation Road site was available for only the Jersey study
Historically, PFAS have been released into the environment through the use of firefighting foams at Jersey Airport [35]. This has led to elevated PFAS concentrations in both groundwater and surface water, affecting private water supplies (including boreholes and wells) and contributing to contamination plumes extending to St Ouen’s Bay and Pont Marquet areas of Jersey.
Investigations into PFAS levels in private water supplies in Jersey and source characterisation have been ongoing since 2018 [35] An Independent Scientific Advisory Panel, commissioned by the Government of Jersey, has prepared three reports to date to support the Government of Jersey and its residents in assessing the risks and addressing health concerns raised. Report 4 on PFAS in the Environment in 2025, is currently in preparation which will include testing of various media for PFAS to understand the concentrations of PFAS in food, water, the marine environment and waste, to gain a better understanding of PFAS levels in Jersey and their impacts on public health and the environment [36]
In 2023, the Government of Jersey [35] reported safety concerns regarding the consumption of new potatoes grown by farmers leasing land in St Ouen’s Bay. These crops were irrigated using water drawn from a PFAS-contaminated surface water body. A targeted investigation was subsequently conducted to characterise PFAS levels (specifically PFOS, PFHxS, PFOA, and PFNA) in irrigation water, soil, and potato samples.
The Government of Jersey [35] reported concentrations of PFOA in potato samples ranging from 0.0035 to 0.0177 µg/kg FW, which were notably lower than those tested from the Occupation Road site (0.0494 to 0.053 µg/kg FW). However, total PFAS (sum of PFOA, PFOS, PFNA and PFHxS) concentrations were higher in the Jersey potato samples (0.1629 to 0.1754 µg/kg FW) compared to samples from the Occupation Road site (0.0711 to 0.0887 µg/kg FW). PFOS emerged as the dominant compound in the Jersey samples, which is indicative of the different source profile compared to the Occupation Road site.
The study found that total PFAS concentrations in potatoes decreased by an average of 30% following boiling, with the report suggesting that cooked concentrations are more representative of actual human exposure. Based on these findings, the estimated mean weekly intake of the four PFAS compounds through potato consumption was 0.29 ng/kg/week (range: 0.11 to 0.47 ng/kg/week), based on a female weighing 71.8 kg and a weekly consumption of fresh potatoes of 0.317 kg and absorption factor of 1 Using the same parameters and concentrations from uncooked potatoes at the Occupation Road site this would equate to a range of estimated weekly intake of the four PFAS through potato consumption alone of 0.31 to 0.39 ng/kg/week The estimated intake for both the Jersey case study and Occupation Road site is significantly below the EFSA tolerable weekly intake of 4.4 ng/kg/week. This comparison led the Government of Jersey to conclude that the potatoes were not considered unsafe for human consumption. However, it was noted that those who consume Jersey potatoes may also be exposed to these four PFAS from other exposure sources, such as drinking water
The major source of exposure to PFOA in the general UK population is through the diet including foodstuffs (79.7%) and drinking water (20.3%) (CL:AIRE [2]). In their 2020 report, EFSA [24] collated data on the concentrations of PFAS including PFOA in a wide range of foodstuffs, although most of the data was provided by Norway, France, and Germany. In their 2022 statement, the COT [34] commented that UK specific data for the sum of the four PFAS included in the tolerable weekly intake (that is, PFOA, PFOS, PFNA, and PFHxS) were within and towards the lower end of the range of data reported by EFSA.
Analytical results from testing of produce sampled at the Occupation Road site are summarised in Table 4-3 and Section 3.2.2, and further details on this site produce data is found in the factual report [14]. Results are expressed by the laboratory on a sample as received basis (i.e. fresh weight).
The site produce data has been compared against produce data collated by EFSA [24] for the vegetables and vegetable products category. This data was supplied by member states up to a cut-off date of 2018. The individual datasets, which included survey data provided by the UK, were not reported separately. EFSA [24] reported censored data based on a limit of quantification (LOQ) of 1 µg/kg FW (that is, data with an LOQ greater than this were excluded). However, a number of LOQs were reportedly less than this for individual national survey results (see Figure 2 in EFSA [24]).
Table 5-10 presents a summary of the PFOA concentrations reported in produce collected from the Occupation Road site with representative data from Table 4 of EFSA [24]. For the vegetable and vegetable products category, the EFSA report [24] had a sample size (after censoring for high LOQ) of 489 No. samples. Most of the PFOA concentrations (86%) were left censored, that is, they were less than the LOQ implemented by the individual surveys. Table 5-10 presents the estimate made by EFSA [24] of the lower and upper bound mean PFOA concentrations in µg/kg FW, determined in all foodstuffs in the vegetables category. The lower bound estimate assumes that all PFOA concentrations reported as less than the LOQ are treated as zero for the purpose of determining the mean concentration. The upper bound estimate assumes that all PFOA concentrations reported as less than the LOQ are assumed to be equal to the LOQ for the purpose of determining the mean concentration. Therefore, the choice of the LOQ is critical to determining the upper bound estimate, and the true mean from the sampled foodstuffs will always be lower than this upper bound estimate.
Table 5-10 – Comparison of the PFOA concentrations in vegetables from the Occupation Road allotment with the lower and upper bound mean of PFOA concentrations from national surveys for the vegetable and vegetable products category.
Site Produce Dataset µg/kg FW
EFSA Produce Dataset [24] µg/kg FW
*Only a single sample had a PFOA concentration less than the LOQ, so the reported lower and upper bound mean produce concentrations are the same to three significant figures
Project No : 70100310
Only a single produce sample from the Occupation Road site (see Section 4.2 and the factual report [14]) had a reported PFOA concentration less than the LOQ. Therefore, the lower and upper bound mean concentrations reported by this dataset are the same, to three significant figures (0.431 µg/kg FW). The mean concentration for the sampled allotment produce is more than two and a half times higher than the upper bound produce mean reported by EFSA [24] of 0.160 µg/kg FW The median concentration of the site produce dataset of 0.166 µg/kg FW is also slightly higher than the upper bound mean of the EFSA data, which indicates that the comparison is not skewed by only one or two samples. The site produce dataset is considered to be elevated when compared to the produce surveyed by member states.
Reported produce concentrations of PFHxS, PFNA and PFOS from the Occupation Road site (see Section 4.2 and the factual report [14]) fall within the EFSA LB and UB ranges and are therefore not considered to be elevated.
EFSA [24] undertook an exposure assessment for PFAS in the diet using produce data collected by 19 No. European countries including the UK. For PFOA, the survey highlighted that fish, egg and egg products, livestock meat, drinking water, fruit and fruit products, vegetables and vegetable products contained relatively high levels, considering their significant contribution to the diet. Overall, EFSA [24] noted that left-censored data (that is, levels below the LOQ for the test method) was above 90% for all PFAS with the exception of PFOS, and that as a result, the “… chronic dietary survey cannot be performed accurately.”
As noted in sub-section 5.3.4.3, EFSA [24] calculated a lower and an upper bound mean for dietary exposure across various age categories. Exposure is likely to be underestimated with the lower bound approach and overestimated with the upper bound approach. EFSA [24] concluded that these values prove only a “rough indication” and that interpretation of these exposures should be approached with caution. CL:AIRE [2] commented that EFSA considered the lower bound estimates to be more realistic.
Table 5-11 summarises the lower bound mean dietary intakes of PFOA according to different age groups as presented by EFSA [24] in Tables 6, 7, 8, and 10 of the main report. Estimated site only exposures for an adult and a child (see Table 5-2) from the Occupation Road site are four times higher than the median lower bound mean dietary intakes estimated by EFSA for a toddler and an adult, respectively. Although part of the difference may be explained by differences in the assumed consumption patterns between an allotment holder (modelled at a higher rate) and the general population, exposure from the site is still considered to be moderately elevated compared to dietary data.
Table 5-11 – Comparison of the estimated intakes for PFOA from dietary sources against estimates of exposure from the site only*
Receptor Group
Project No : 70100310
Receptor Group
*Comparison of the estimated lower bound mean dietary intakes for PFOA from dietary sources as presented in Tables 6, 7, 8, and 10 of EFSA (2020 [24]) for infants (<1 year), toddlers (1-3 years), other children (3-10 years), and adults (18-65 years). They are compared with the estimates of exposure from the site only for a child and adult from the Occupation Road allotments as presented in Table 5-2. All exposure data is presented in mg/kg body weight/day.
The COT [34] reviewed other sources of exposure including drinking water, dust and soil, and indoor air, but some of the data was presented for total PFAS only (the sum of PFOS, PFOA, PFNA, and PFHxS). Nonetheless, the Occupation Road site exposures to PFOA only, as presented in Table 5-2, were higher when compared with these intakes. For example, chronic mean exposures from drinking water, assuming a reasonably conservative PFAS concentration of 0.01 µg/l, were estimated to be 2.5E-07 and 8.1E-08 mg/kg body weight/day for toddlers and older adults (aged >65), respectively. Estimated Occupation Road site exposures are between a factor of 6 and 9 higher than these estimates for PFOA alone. Exposures to PFOA in indoor dust were estimated by the COT [34] to be 3.7E-07 and 2.1E-09 mg/kg body weight/day for infants and adults (aged up to 65), respectively. Estimated Occupation Road site exposures were higher for infants (by a factor of 4) and for adults (by a factor of more than 100), compared to exposures from indoor dust.
5.4 SUMMARY AND INITIAL RECOMMENDATIONS
5.4.1 SUMMARY
A risk evaluation for the Occupation Road site has been completed in accordance with LCRM [6] and the Statutory Guidance [3] The risk evaluation serves to inform the potential determination of whether SCLs to human health exist at the site, as defined under Part 2A of the Environmental Protection Act 1990 [8].
Estimates of human exposure to PFOA were calculated for the two critical human health receptors using a representative soil concentration of 7.3 µg/kg DW, the 95th percentile UCL of the mean for the sub-surface dataset (0.1 – 0.6 m bgl). Although an underestimation of this soil concentration is possible due to a systematic limitation in the analysis, this is largely offset by potential double counting in the non-soil ADE calculations.
Further work was undertaken to evaluate two of the key parameters used by the CLEA model to estimate exposure via the consumption of allotment grown produce pathway, with the evidence suggesting that the use of the default approach in the CLEA model to estimate human exposure via the consumption of allotment grown produce is not unreasonable, and unlikely to be overly precautionary. However, the lack of site-specific consumption rates remains an important and significant uncertainty.
Total ADE values for PFOA of 2.43E-06 and 9.21E-07 mg/kg bodyweight/day were calculated for a female 0-6 year old child and a 16-65 year old adult, respectively. To help evaluate the significance of these estimated exposures, data was collated from a number of authoritative reviews on the toxicology of PFOA. Whilst a detailed evaluation of the available data was not undertaken, this
Project No : 70100310
exercise has provided a clearer understanding of the underlying toxicological uncertainty. Nevertheless, the lack of a systematic review (the subject of on-going work by the COT) represents an uncertainty in the assessment
In total, 50 No. POD-HED were identified, grouped into six different effect categories. The estimated PFOA exposure for both receptors were much lower than the POD-HED derived from animal studies, which were therefore considered to represent a very low possibility of a potential effect on a wide range of study endpoints, but within the range of values observed in epidemiological studies. Margins of exposure for POD-HED values from epidemiological studies were sometimes less than one, and for most study endpoints, there is considered to be a moderate to high possibility of potential effects on various epidemiological markers including cholesterol level, birth weight, serum ALT level, and antibody titres in response to vaccination. However, there remain important differences of opinion between authoritative organisations as to the significance of the endpoints reported in epidemiological studies, in terms of both biological and clinical relevance, and the potential for an adverse effect on health. This represents a key uncertainty in the assessment.
The published literature was reviewed for similar experiences of land contamination and environmental pollution with PFOA outside of the UK. Whilst study sites from the Netherlands, USA, Germany, Italy and Jersey have been identified where the land has been contaminated with PFOA, the DuPont / Chemours fluoropolymers factory in Dordrecht, the Netherlands, is the only identified site to share a comparable conceptual model to the Occupation Road site. Furthermore, RIVM [10] reported sum concentrations of GenX and PFOA in a range of produce types at this site, expressed as PFOA equivalent concentrations, ranging from 0.07 to 2.65 µg/kg. Despite the inclusion of GenX, the concentrations are very similar to the reported PFOA concentrations at the Occupation Road site. Following the assessment of this data against the EFSA TWI in 2021, the RIVM advised local residents not to eat homegrown produce grown within 1 km of the Dordrecht factory [10]
Produce data collected at the Occupation Road site has been compared against data collated by EFSA [24] for the vegetables and vegetable products category. The mean PFOA concentration for the sampled allotment produce is more than two and a half times higher than the upper bound produce mean as reported by EFSA. PFOA concentrations within the produce grown on the Occupation Road site are therefore considered elevated when compared to the produce surveyed by EU member states. The FSA reviewed the produce data obtained from the Occupation Road site, and their preliminary commentary is included as Appendix D. They confirmed that whilst the produce sampling was limited, and some of the samples may have contained soil adhered to roots, reported PFOA concentrations in green and root vegetables were elevated compared to expected background levels.
Site only PFOA exposures for an adult and a child were compared against PFAS dietary intakes across 19 No. European countries (including the UK), as collected by EFSA [24]. Site exposures were four times higher than the median lower bound mean dietary intakes estimated by EFSA for a toddler and an adult, respectively [24]. Exposure from the site is therefore considered to be moderately elevated, compared to EU dietary data. In their preliminary commentary, the FSA stated that there was the potential, on an indicative basis, for some regular consumers of large proportions of green and root vegetables from the site to exceed the EFSA TWI by in the region of up to 3-4 times, increasing to 7-8 times when taking into account mean background dietary levels.
Project No : 70100310
The question is, based upon the above lines of evidence, does the Occupation Road site meet the requirements for Category 1, 2, or 3 with respect to Human Health, as defined within the Statutory Guidance [3] and summarised above in Section 5.1
Following a detailed literature review, the DuPont / Chemours site in Dordrecht, the Netherlands, was the only identified site to share a comparable conceptual model to the Occupation Road site. RIVM reported comparable PFOA equivalent concentrations in produce to that reported for the Occupation Road site. However, despite the RIVM advising local residents not to eat homegrown produce grown within 1 km of the Dordrecht factory, there is no known evidence of significant harm to the health of residents living in close proximity to the factory. Therefore, as per section 4.19 of the Statutory Guidance [3], no similar land or situations have been identified where significant harm has been caused, and there is no evidence that similar degrees of PFOA exposure have led to significant harm. Consequently, there is insufficient evidence to classify the site as Category 1: Human Health.
The key remaining question is whether the site should be categorised as Category 2: Human Health or Category 3: Human Health, in accordance with the Statutory Guidance [3]? Due to the stated uncertainties in the risk assessment, the regulator may wish to seek additional technical advice from a relevant authoritative body, such as the COT, to clarify the biological and clinical relevance of the endpoints seen in epidemiology studies, which could help to support a decision on whether the effects constitute significant harm under Part 2A. However, the timeframes for the completion of such a systematic review by the COT are unknown9
There is clear evidence of a contaminant linkage at the Occupation Road site with PFOA found in soils and crops grown by plot holders. The estimated PFOA exposures for adult and child receptors at the Occupation Road site are considered reasonable based on the evidence available and to represent a moderate to high possibility of potential effects on various epidemiological markers including cholesterol levels, birth weight, serum ALT levels, and antibody titres in response to vaccination There are differences of opinion between authoritative organisations as to the significance of the endpoints reported in epidemiological studies in terms of biological and clinical relevance and adverse effect on health. Therefore, there remains uncertainty as to whether the biomarker effects of PFOA observed at comparable exposures in epidemiological studies are consistent with significant harm. PFOA concentrations within the produce grown on the allotments site are considered elevated when compared to background produce levels within the EU, and estimated site-only PFOA exposures are considered to be moderately elevated, compared to background dietary data.
The soil at the Occupation Road site is contaminated with PFOA. However, is the level of contamination sufficient to place the site in Category 2 (that is, does it meet the definition of Contaminated Land)?
9 FSA evidence provided to the Environmental Audit Committee (EAC) earlier in 2025 indicated that further COT evaluation and outputs on this topic were not expected for at least 2 years.
If the regulator wishes to conclude the categorisation without delay, for example, to avoid further public uncertainty and concern, there is considered to be sufficient evidence for it to take action on a precautionary basis and place the Occupation Road site into Category 2: Human Health.
(Category 2: Human Health as defined in Section 4.25 of the Statutory Guidance: There is a strong case for considering that the risks from the land are of sufficient concern, that the land poses a significant possibility of significant harm, with all that this might involve and having regard to Section 1. Category 2 may include land where there is little or no direct evidence that similar land, situations or levels of exposure have caused harm before, but nonetheless the authority considers on the basis of the available evidence, including expert opinion, that there is a strong case for taking action under Part 2A on a precautionary basis.)
Project No : 70100310
6.1
6.1.1 PURPOSE
This section presents the evidence and rationale used to determine whether an SCL exists for a ‘property’ receptor at the Occupation Road allotments in accordance with Part 2A of the Environmental Protection Act 1990. In this context, ‘property’ refers specifically to “produce grown domestically, or on allotments, for consumption.” The assessment examines whether chemical contamination, principally PFOA, has resulted in, or creates the conditions for, produce to be considered “no longer fit for purpose” (human consumption).
6.1.2 SCOPE AND LINKAGE UNDER CONSIDERATION
The contaminant linkage assessed is detailed within the Conceptual Site Model (Table 2.1)
6.2.1
Section 4.3 of the Statutory Guidance [3] identifies non-human receptors, including ‘property’. For produce, ‘significant harm’ is framed as domestically grown produce (vegetables grown as food) being no longer fit for purpose. Section 4.3, Table 2 of the Statutory Guidance [3] states ‘Food should be regarded as being no longer fit for purpose when it fails to comply with the provisions of the Food Safety Act 1990’. The Part 2A test for produce is therefore property-based (fitness for purpose), rather than a direct demonstration of adverse health outcomes in consumers.
For the purposes of Part 2A, the Statutory Guidance directs decision-makers to the Food Safety Act 1990 (FSA90) [50]. Under FSA90, food fails to comply with food safety requirements if it is “unsafe” within the meaning of Article 14 of Regulation (EC) No 178/2002. Article 14 requires regard to be had to whether food is unacceptable for human consumption according to its intended use, including for reasons of contamination. This provides the benchmark used here for determining whether allotment produce may be considered ’no longer fit for purpose’ within a Part 2A context.
In relation to food safety, Section 4, Article 14 of this regulation states:
In determining whether any food is injurious to health, regard shall be had:
a) not only to the probable immediate and/or short-term and/or long-term effects of that food on the health of a person consuming it, but also on subsequent generations;
b) to the probable cumulative toxic effects;
c) to the particular health sensitivities of a specific category of consumers where the food is intended for that category of consumers.
In determining whether any food is unfit for human consumption, regard shall be had to whether the food is unacceptable for human consumption according to its intended use, for reasons of contamination, whether by extraneous matter or otherwise, or through putrefaction, deterioration or decay.
6.3.1
In assessing a site such as the Occupation Road allotments, where harm to property is a relevant consideration, two key questions must be addressed in accordance with Section 5.6 of the Statutory Guidance [3]:
(i) whether significant harm is occurring; or
(ii) whether there is a significant possibility of significant harm.
Section 4.3 and Table 2 of the Part 2A Statutory Guidance [3] considers allotment produce as ‘property’ and distinguishes between significant harm (evidence that produce is currently considered ‘no longer fit for purpose’) and SPOSH, which is a forward looking test assessing whether there is a real, evidence based possibility that produce will become, or may reasonably be deemed ‘no longer fit for purpose’
The Statutory Guidance [3] defines SPOSH in this scenario as: “ … Conditions would exist for considering that a significant possibility of significant harm exists to the relevant types of receptor where the local authority considers that significant harm is more likely than not to result from the contaminant linkage in question, taking into account relevant information for that type of contaminant linkage, particularly in relation to the ecotoxicological effects of the contaminant”
The risk evaluation draws on:
• Soil and root-zone contamination data;
• Produce analytical results;
• Evidence of soil-to-plant transfer (paired sampling);
• Comparative context from EFSA produce datasets and TWI benchmarks; and
• Regulator (FSA) commentary and risk-management advice.
6.4.1 ALLOTMENT USE AND EXPECTATION OF CONSUMPTION
The Occupation Road allotment site comprises 22 No. active growing plots where a range of vegetables are grown. Questionnaire responses and site observations indicate that produce is grown for consumption and that allotment produce may be consumed by household members who do not routinely attend the allotments.
6.4.2
Evidence relating to the contamination of site produce is provided in previous chapters and underpins the conclusions behind the Category 2: Human Health linkage presented in Chapter 5, noting that for PFOA, the consumption of homegrown produce, and soil attached to produce, accounts for 98.7% of all total predicted human exposure to PFOA in an allotment scenario.
6.5.1
Across the unbiased soil dataset, PFOA was detected in 100% of samples at a concentration range of 1.1 - 20.2 µg/kg dry weight (DW) - noting the C4SL for allotments is 1.4 ug/kg. A statistically supported depth profile was identified, with surface soils (0 - 0.1 m bgl) having a mean PFOA concentration of 4.5 µg/kg DW and sub-surface soils (0.1 - 0.6 m bgl) having a mean of 6.7 µg/kg DW. The sub-surface interval overlaps the principal root zone for many crops and is therefore particularly relevant for plant uptake.
6.5.2
Twenty-five produce samples were collected (winter availability) from six accessible plots and analysed on a fresh weight (FW) basis. PFOA was detected above the method detection limit in 24 of 25 No. samples, with concentrations ranging from 0.0135 to 2.11 µg/kg FW. The highest concentrations were observed in beetroot (up to 2.11 µg/kg FW), chard (1.5 µg/kg FW), cavolo nero (1.07 µg/kg FW) and green cabbage leaves (1.04 µg/kg FW).
Paired sampling of produce and corresponding root-zone soils enabled calculation of soil-to-plant concentration factors (CFs) for key produce groups. The geometric mean CFs derived from site data were within an order of magnitude of the default values used in the CLEA-based interim C4SL derivation, supporting an active and plausible plant uptake pathway and indicating that generic uptake assumptions are not obviously inconsistent with the observed scenario at the Occupation Road allotments.
6.5.4
In the absence of UK health screening values for produce, reliance has been placed on EU thresholds – specifically the EFSA TWI values. The TWI is the maximum intake of substances in food that can be consumed weekly over a lifetime without risking adverse health effects (noting the uncertainty with regard the derivation of the TWI and ongoing research).
The site produce dataset was compared with EFSA’s collated data for the ‘vegetables and vegetable products’ category. The mean PFOA concentration across the Occupation Road samples (0.431 µg/kg FW) exceeds EFSA’s reported upper-bound mean (0.160 µg/kg FW) by more than a factor of two (2.7x), and the site median (0.166 µg/kg FW) is also slightly higher than EFSA’s upper-bound mean. This indicates the site produce concentrations are elevated relative to typical EU survey data.
6.5.5
The FSA reviewed the produce dataset and, while noting the limited number of samples and the likelihood that some root vegetables retained residual soil, concluded that PFOA concentrations in both green and root vegetables were elevated relative to expected background levels. On an indicative basis, the FSA advised that regular consumers who eat substantial quantities of these vegetables could exceed the EFSA TWI by approximately 3–4 times, increasing to 7–8 times when typical background dietary exposure is included. The FSA further noted that adverse effects from the estimated exposures are possible; however, they emphasised that more definitive conclusions cannot be reached until the COT completes its ongoing evaluation of PFAS.
6.6.1
The key consideration under Part 2A is (i) whether significant harm is occurring, or (ii) whether there exists a significant possibility of significant harm . In making this determination, it must be assessed whether allotment produce is, or may reasonably be considered to be, ‘no longer fit for purpose’that is, unfit for human consumption - as a result of the identified contamination.
As indicated above, the Statutory Guidance states that Significant Harm to property (produce) occurs where food is “no longer fit for purpose,” which is defined by reference to the Food Safety Act 1990 (50). That Act, in turn, relies on Article 14 of Regulation (EC) No 178/2002, which states that:
“ In determining whether any food is unfit for human consumption, regard shall be had to whether the food is unacceptable for human consumption according to its intended use, for reasons of contamination”
To meet the Part 2A test for Significant Harm to property, it must therefore be clearly demonstrated that produce is currently and demonstrably unfit for consumption under food safety criteria. For this test, Part 2A requires proof of actual occurring harm of a serious nature for all allotment produce, not a risk of future harm. Based on the information collected to date, this evidential threshold has not been met.
The threshold for demonstrating Significant Harm to produce is not fulfilled because:
• Sampling was limited in scope. Only a narrow range of vegetables were collected, and samples were not taken from all active allotment plots. No fruit was available for testing. Although a substantial proportion of sampled produce showed elevated PFAS levels, concentrations varied between vegetable types, meaning it is not possible to robustly conclude that all produce from the Occupation Road allotments is unfit for purpose.
• Soil contamination does not equate to universal produce contamination. While PFAS detected within the rooting zone suggests a source for plant uptake, this does not automatically translate into contamination of the edible fraction across all plant varieties.
• Potential surface adherence complicates interpretation. PFAS contaminated soil is likely to have adhered to the outer surfaces of some produce items, potentially inflating measured concentrations and complicating the assessment of impact to produce and suitability for consumption.
• Scientific uncertainty remains. Research into PFAS toxicology, plant uptake mechanisms, and implications for domestic produce is ongoing. Although the assessment has drawn on the best available science, uncertainties remain regarding what PFAS levels should be considered unacceptable for consumption.
While the dataset and available evidence do not, on their own, demonstrate that the produce is definitively ‘no longer fit for purpose’ - and therefore do not meet the threshold for significant harmthey do indicate a reasonable and scientifically credible possibility that such harm could occur if the current situation continues. The SPOSH test does not require the produce to already be unfit for
consumption; rather, it is a forward looking, probabilistic test that evaluates the likelihood of such harm arising based on plausible exposure routes and established risk assessment principles. In practical terms, SPOSH for produce may be supported where measured contaminant concentrations - combined with realistic exposure scenarios - show that an authoritative tolerable intake or comparable health based benchmark would likely be exceeded by regular consumers. SPOSH may also be supported where regulatory bodies recommend consumption limits or behavioural restrictions due to chemical contamination, as such recommendations signal that there is the strong possibility that the produce may no longer be fit for purpose. Evidence obtained supports the significant possibility of such harm because:
• PFOA is present in nearly all sampled produce;
• Concentrations are elevated against EU survey data and associated typical dietary intakes;
• Authoritative tolerable intake exceedances are plausible for realistic high-consumption behaviours; and
• Precautionary behavioural advice has been issued by Wyre Council10 - such as washing and peeling produce, removing excess soil, and considering the use of raised beds with clean soilindicating that growers and consumers may need to modify their usual practices, and that unrestricted growing and consumption of produce under normal allotment conditions may no longer be appropriate.
Based on the information presented above, the following contaminant linkage is considered valid and satisfies the relevant criteria set out in Section 5.6 of the Statutory Guidance, which provides the grounds for determination:
5.6 (b) There is a significant possibility of significant harm being caused to a human or relevant non human receptor.
This conclusion is supported by site specific produce data, soil concentrations, soil to plant transfer evidence, comparative datasets, and the preliminary commentary provided by the FSA (as contained in Appendix D). Although the available evidence is insufficient to demonstrate that significant harm to produce is already occurring, it clearly indicates a Significant Possibility of Significant Harm to domestically grown produce
This conclusion follows from the established contaminant linkage, as defined in Table 2.1, which demonstrates a reasonable basis for determining that produce grown at the Occupation Road allotments may be considered unfit for human consumption due to chemical contamination.
10 https://www.wyre.gov.uk/news/article/478/advice-shared-with-allotment-holders-in-ongoing-historiccontamination-investigation, accessed on 24 February 2026
7.1.1
WSP UK Ltd was instructed by the Environment Agency to provide expert opinion in respect to the status of the allotments located at Occupation Road, Thornton-Cleveleys under Part 2A of the Environmental Protection Act (1990) [8]. As part of the instruction from the Client, WSP was tasked with discussing the findings of the preliminary site investigation works, completed by WSP in September 2024 [13], and recent site investigation works, completed by WSP between December 2024 and January 2025 [14]
The purpose of this project is to undertake both Tier 2 generic and Tier 3 detailed quantitative risk assessment and risk evaluation works, to deliver suitably robust conclusions consistent with the decision-making required by the Statutory Guidance [3] and all relevant up-to-date good practice for contaminated land investigation and risk assessment.
The Occupation Road site is currently utilised as an allotment garden, and deposition from legacy aerial emissions, associated with historical activities undertaken at the adjacent (off-site) AGCCE Ltd facility (formerly operated by ICI Ltd), have likely resulted in PFOA concentrations present in shallow soils and locally grown produce at the allotments site.
For PFOA, the consumption of homegrown produce, and soil attached to produce, accounts for 98.7% of all soil related exposure for an allotment exposure scenario. Exposure via this pathway does not require attendance at the site, and all consumers of produce grown at the site are considered to be receptors in the context of the CSM. The critical human health receptors for the Occupation Road site are therefore a 0-6 year old female child and an adult female.
Furthermore, produce grown on the Occupation Road site is a relevant receptor under Part 2A (‘property’). The uptake of PFOA contamination from shallow soils into this produce creates a significant possibility that it is not fit for its intended purpose - consumption - thereby establishing a potentially significant contaminant linkage.
7.1.3
Following the completion of preliminary and detailed investigation works at the site [13,14], a total of 138 No. soil samples were collected, using an unbiased (non-targeted) sampling strategy. Soil PFOA concentrations at the site were reported in excess of the MDL of 0.5 µg/kg DW in all 138 No. samples, at concentrations ranging from 1.1 to 20.2 µg/kg DW. A statistical assessment confirmed the presence of a depth profile to the PFOA concentrations, providing justification in splitting the full PFOA soil dataset of 138 No. samples into two subsets, namely surface soils (0.0 – 0.1 m bgl) and sub-surface soils (0.1 – 0.6 m bgl). The 95th percentile LCL and UCL of the mean PFOA concentrations were 3.8 and 5.2 µg/kg DW for the surface soil dataset, and 6.1 and 7.3 µg/kg DW for the sub-surface soil dataset, respectively.
A total of 25 No. produce samples were collected as part of the investigation works [14]. PFOA was detected above the MDL of 0.001 µg/kg FW in 24 of the 25 No. produce samples, with reportable concentrations ranging from 0.0135 to 2.11 µg/kg FW.
A risk evaluation for the Occupation Road site was completed in accordance with LCRM [6] and the Statutory Guidance [3], to inform the potential determination of whether SCLs to human health exist at the site, as defined under Part 2A of the Environmental Protection Act 1990 [8]. Estimates of human exposure to PFOA were calculated for the two critical human health receptors (a female adult and a female child, aged 0-6 years) using a representative soil concentration of 7.3 µg/kg DW, the 95th percentile UCL of the mean for the sub-surface dataset (0.1 – 0.6 m bgl). Although an underestimation of this soil concentration was possible due to a systematic limitation in the analysis, this was largely offset by potential double counting in the non-soil average daily exposure calculations.
Further work indicated that the key parameters used by the CLEA model to estimate exposure via the consumption of allotment grown produce pathway were not unreasonable, and unlikely to be overly precautionary. However, the lack of site-specific consumption rates remained an important and significant uncertainty.
Total ADE values for PFOA of 2.43E-06 and 9.21E-07 mg/kg bodyweight/day were calculated for a female 0-6 year old child and a 16-65 year old adult, respectively. To help evaluate the significance of these estimated exposures, data was collated from a number of authoritative reviews on the toxicology of PFOA. The lack of a UK authoritative review (the subject of on-going work by the COT) represented an uncertainty in the assessment. Nevertheless, in total, 50 No. POD-HED were identified and grouped into six different effect categories. The estimated PFOA exposure for both receptors were much lower than the POD-HED derived from animal studies, which were therefore considered to represent a very low possibility of a potential effect on a wide range of study endpoints, but within the range of values observed in epidemiological studies. Margins of exposure for POD-HED values from epidemiological studies were sometimes less than one, and for most study endpoints, there was considered to be a moderate to high possibility of potential effects on various epidemiological markers including cholesterol level, birth weight, serum ALT level, and antibody titres in response to vaccination. However, there remained important differences of opinion between authoritative organisations as to the significance of the endpoints reported in epidemiological studies, in terms of both biological and clinical relevance, and the potential for an adverse effect on health. This represented a key uncertainty in the assessment.
The published literature was reviewed for similar experiences of land contamination and environmental pollution with PFOA outside of the UK, and study sites from the Netherlands, USA, Germany, Italy and Jersey were identified where the land has been contaminated with PFOA. The DuPont / Chemours fluoropolymers factory in Dordrecht, the Netherlands, is the only identified site to share a comparable conceptual model to the Occupation Road site. Furthermore, RIVM [10] reported sum concentrations of GenX and PFOA in a range of produce types at this site, expressed as PFOA equivalent concentrations, ranging from 0.07 to 2.65 µg/kg. Despite the inclusion of GenX, the concentrations are very similar to the reported PFOA concentrations at the Occupation Road site. Following the assessment of this data against the EFSA TWI in 2021, the RIVM [10] advised local residents not to eat homegrown produce grown within 1 km of the Dordrecht factory.
Project No : 70100310
Produce data collected at the Occupation Road site was compared against data collated by EFSA [24] for the vegetables and vegetable products category. The mean PFOA concentration for the sampled allotment produce was more than two and a half times higher than the upper bound produce mean as reported by EFSA. PFOA concentrations within the produce grown on the Occupation Road site were therefore considered elevated when compared to the produce surveyed by EU member states. The FSA reviewed the produce data obtained from the Occupation Road site, and confirmed that whilst the produce sampling was limited, and some of the samples may have contained soil adhered to roots, reported PFOA concentrations in green and root vegetables were elevated compared to expected background levels.
Site only PFOA exposures for an adult and a child were compared against PFAS dietary intakes across 19 No. European countries (including the UK), as collected by EFSA [24]. Site exposures were four times higher than the median lower bound mean dietary intakes estimated by EFSA for a toddler) and an adult, respectively [24]. Exposure from the site was therefore considered to be moderately elevated, compared to EU dietary data.
7.2.1
In the context of Part 2A and potential human health risk, land only meets the definition of Contaminated Land if the authority considers it falls within Categories 1 or 2 as defined in the Statutory Guidance [3]. The following lines of evidence are presented in order to assist the authority in deciding whether the Occupation Road site potentially falls within Categories 1, 2, or 3 with respect to risks to Human Health under the Part 2A regime.
Following a detailed literature review, as discussed within Section 5.3.4, the DuPont / Chemours site in the Netherlands is the only identified site to share a comparable conceptual model to the Occupation Road site. However, there is no known evidence of significant harm to the health of residents living in close proximity to the factory, and as per section 4.19 of the Statutory Guidance [3], there is insufficient evidence to classify the site as Category 1: Human Health.
Category 2 / 3
Uncertainties have been identified within the Tier 2 and 3 quantitative risk assessments, and the authority may choose to seek additional advice from a relevant authoritative body to clarify the biological and clinical relevance of the endpoints seen in the epidemiology studies, which could help to support a decision on whether the effects constitute significant harm. However, as stated within the 2012 Statutory Guidance [3], Category 2 may include land where there is little or no direct evidence that similar land, situations or levels of exposure have caused harm before, but nonetheless the authority considers on the basis of the available evidence, including expert opinion, that there is a strong case for taking action under Part 2A on a precautionary basis.
The soil at the Occupation Road site is contaminated with PFOA. As discussed within Section 5.3.3, estimated PFOA exposures for adult and child receptors at the site are considered to represent a moderate to high possibility of potential effects on various epidemiological markers including cholesterol levels, birth weight, serum ALT levels, and antibody titres in response to vaccination However, the biological relevance and potential health impacts of these effects are currently not clearly understood.
Project No : 70100310
7.2.2
Furthermore, PFOA concentrations within the produce grown on the Occupation Road site are considered elevated when compared to background EU produce levels, and estimated site-only PFOA exposures are considered to be moderately elevated when compared to background dietary data.
On this basis, there is considered to be sufficient evidence to justify taking regulatory action on a precautionary basis and placing the Occupation Road site into Category 2: Human Health
(Category 2: Human Health as defined in Section 4.25 of the Statutory Guidance: There is a strong case for considering that the risks from the land are of sufficient concern, that the land poses a significant possibility of significant harm, with all that this might involve and having regard to Section 1. Category 2 may include land where there is little or no direct evidence that similar land, situations or levels of exposure have caused harm before, but nonetheless the authority considers on the basis of the available evidence, including expert opinion, that there is a strong case for taking action under Part 2A on a precautionary basis.)
The Part 2A Statutory Guidance identifies a category of receptors described as ‘property’, which explicitly includes produce grown on allotments. In this context, the relevant exposure pathway is the uptake of PFOA contamination from shallow soils into edible produce - noting that for PFOA, the consumption of homegrown produce, and soil attached to produce, accounts for 98.7% of all total predicted human soil exposure to PFOA in an allotment scenario. This pathway underpins the potential health effects discussed in Chapter 5. Consequently, contamination may render the produce no longer fit for purpose - being unsuitable for consumption - or create conditions in which there is a significant possibility of such harm occurring.
The FSA have indicated that, on an indicative basis, some regular consumers of large quantities of green and root vegetables from the site could exceed the EFSA TWI by approximately 3–4 times, rising to 7–8 times when background dietary levels are considered. As a result of confirmed contamination in soil and produce, it has been suggested by the FSA that growers and consumers of vegetables may wish to adapt their behaviour.
While this - and the other evidence presented in the sections above - does not demonstrate actual significant harm to produce, under Part 2A the information is considered sufficient to conclude that there is a significant possibility that produce grown at the Occupation Road allotments (‘property’) is no longer fit for purpose (consumption). This aligns with the definition in the Food Safety Act [50] and meets the conditions for a significant contaminant linkage - a significant possibility of significant harm to produce grown domestically
(As defined in Section 4.3, Table 2 of the Statutory Guidance: Conditions would exist for considering that a significant possibility of significant harm exists to the relevant types of receptor where the local authority considers that significant harm is more likely than not to result from the contaminant linkage in question, taking into account relevant information for that type of contaminant linkage, particularly in relation to the ecotoxicological effects of the contaminant.)
No : 70100310
1. CL:AIRE, 2020. Professional Guidance: Comparing Soil Contamination Data with a Critical Concentration.
2. CL:AIRE, 2024. Interim Category 4 Screening Levels for per- and polyfluoroalkyl substances (PFAS): perfluorooctanoic acid (PFOA), perfluorononanoic acid (PFNA), perfluorohexane sulfonic acid (PFHxS) and perfluorooctane sulfonic acid (PFOS).
3. Defra, 2012. Contaminated Land Statutory Guidance.
4. Environment Agency, 2000. Secondary Model Procedure for the Development of Appropriate Soil Sampling Strategies for Land Contamination Development. R&D Technical Report P5-066/TR.
5. Environment Agency, January 2009. Science Report – Updated Technical Background to the CLEA Model. SC050021/SR3
6. Environment Agency, 2025. Land Contamination Risk Management (LCRM).
7. European Food Safety Authority (EFSA), 2020. Risk to human health related to the presence of perfluoroalkyl substances in food.
8. Part 2A of the Environmental Protection Act, 1990.
9. RIVM, 2016. Risk assessment of PFOA emissions for local residents. Location: DuPont/Chemours, Dordrecht, The Netherlands. RIVM Letter Report 2016-0049.
10. RIVM, 2021. Revision of the risk assessment of GenX and PFOA in vegetable crops in Dordrecht, Papendrecht and Sliedrecht. RIVM Letter Report 2021-0064.
11. USEPA, 2024. Human Health Toxicity Assessment for Perfluorooctanoic Acid (PFOA) and Related Salts. Final.
12. WSP UK Ltd, 2025. Desk Study: AGC Chemicals Europe Ltd Facility, ThorntonCleveleys. Specification for PFAS Risk Screening - Phase 4 (Ref 70100310-12157(5))
13. WSP UK Ltd, 2024 Land at Thornton-Cleveleys, Factual Report from Preliminary Phase of Offsite Soils Investigation.
14. WSP UK Ltd, 2025. Occupation Road Allotments, Thornton-Cleveleys. Factual Report from Detailed Investigation.
15. Environment Agency, 2023. PFOA Dispersion - Air dispersion and deposition modelling study (ref: AQMAU-C2478-RP02)
16. Paustenbach et al., A Methodology for Estimating Human Exposure to Perfluorooctanoic Acid (PFOA): A Retrospective Exposure Assessment of a Community (1951-2003). Journal of Toxicology and Environmental Health, Part A, 70: 28-57 (2007).
17. Environment Agency, January 2009. Science Report – Human Health Toxicological Assessment of Contaminants in Soil. SC050021/SR2.
18. CL:AIRE, 2013. Development of Category 4 Screening Levels for Assessment of Land Affected by Contamination (SP1010).
19. Schulz et al., Distribution and effects of branched versus linear isomers of PFOA, PFOS, and PFHxS: A review of recent literature. Science of the Total Environment Volume 733, 1 September 2020, 139186.
20. https://www.efsa.europa.eu/en/topics/topic/margin-exposure (accessed on 16.10.25).
21. ANSES, 2017. Tableau XVIII. Avis de l'Anses relatif à l’évaluation des risques sanitaires d’alkyls per- et polyfluorés dans les eaux destinées à la consommation humaine (Saisine no. 2015-SA-0105). Agence nationale de sécurité sanitaire de l’alimentation, de l’environnement et du travail (Maisons-Alfort).
22. ATSDR, 2021. Table A8. Toxicological Profile for Perfluoroalkyls.
23. EFSA, 2018. Table 28. Risk to human health related to the presence of perfluorooctane sulfonic acid and perfluorooctanoic acid in food. EFSA Journal 2018, 16(12), 5194
24. EFSA, 2020. Risk to human health related to the presence of perfluoroalkyl substances in food. EFSA Journal 2020, 18(9), 6223
25. Food Safety Commission of Japan, 2025. Per- and Poly-fluoroalkyl Substances (PFAS) (Chemicals and Contaminants). Food Safety 2025; Vol. 13, No. 1, 19–21.
26. Health Canada, 2018. Guidelines for Canadian Drinking Water Quality Guideline Technical Document Perfluorooctanoic Acid (PFOA). Ottawa: Health Canada.
27. FSANZ, 2017. Table 31. Hazard assessment report – Perfluorooctane Sulfonate (PFOS), Perfluorooctanoic Acid (PFOA), Perfluorohexane Sulfonate (PFHxS). Food Standards Australia New Zealand.
28. SLR Consulting Australia, 2024. Table 6-4. Addendum to PFAS Evidence Evaluation for Australian Drinking Water Guidelines Chemical Fact Sheets. Work undertaken for and published by the National Health and Medical Research Council.
29. OEHHA, 2024. Public Health Goals. Perfluorooctanoic Acid and Perfluorooctane Sulfonic Acid in Drinking Water. Office of Environmental Health Hazard Assessment at California Environmental Protection Agency.
30. US EPA, 2024. Table 4-11. Human Health Toxicity Assessment for Perfluorooctanoic Acid (PFOA) and Related Salts. EPA Document No. 815R24006.
31. DMOE, 2015. Table 5-3. Perfluoroalkylated substances: PFOA, PFOS and PFOSA Evaluation of health hazards and proposal of a health based quality criterion for drinking water, soil and ground water. Environmental project No. 1665, 2015. Danish Ministry of the Environment.
32. International Agency for Research on Cancer Monographs Volume 135: Perfluorooctanoic acid (PFOA) and perfluorooctanesulfonic acid (PFOS).
33. National Health and Medical Research Council. Australian Drinking Water Guidelines 6 2011 Version 4.0 Updated June 2025.
34. Committee on Toxicity. Statement on the EFSA Opinion on the risks to human health related to the presence of perfluoroalkyl substances (PFASs) in food (2022)
35. Government of Jersey, 2024, A rapid assessment of potatoes grown within St Ouen’s Bay, Jersey to explore the presence of per- and polyfluoroalkyl substances (PFAS), 15 March 2024.
36. PFAS Testing Protocol – Informing Report Four by the Independent PFAS Scientific Panel. https://www.gov.je/SiteCollectionDocuments/Planning%20and%20building/PFAS%20Tes ting%20Protocol.pdf (accessed on 20.10.25)
37. Gerardu et al., Accumulation and transport of atmospherically deposited PFOA and PFOS in undisturbed soils downwind from a fluoropolymers factory Environmental Advances 11 (2023) 100332.
38. C8 Science panel website. http://www.c8sciencepanel.org/ (accessed on 30.09.25).
Project No : 70100310
39. Rohler et al., Long-term behaviour of PFAS in contaminated agricultural soils in Germany Journal of Contaminant Hydrology 241 (2021) 103812.
40. https://www.umweltbundesamt.de/sites/default/files/medien/2875/dokumente/pfas_kraka u_final.pdf (accessed on 20.10.25).
41. https://rpk.baden-wuerttemberg.de/abt5/referat-52-gewaesser-und-boden/stabsstellepfas/pfc-problematik-mittelbaden-mannheim/ (accessed on 20.10.25).
42. Giglioli, S. Colombu, L. Azzellino, A. 2023, Cluster and multivariate analysis to study the diffuse contamination of emerging per- and polyfluroalkyl substances (PFAS) in the Veneto Region plant (North-eastern Italy), Chemosphere, 319.
43. Ingeliod, A, M. Abballe, A. Gemma, S. Dellatte, E. Lacovella, N. De Angelis, G. Zampaglioni, F. Marra, V. Miniero, R. Valentini, S. Russo, F. Vazzoler, M. Testai, E and De Felip, E. 2018, Biomonitoring of perfluorinated compounds in adults exposed to contaminated drinking water in the Veneto Region, Italy, Environment International, 110, 149-159.
44. Ingeliod, A, M. Abballe, A. Gemma, S. Dellatte, E. Lacovella, N. De Angelis, G. Marra, V. Russo, F. Vazzoler, M. Testai, E and De Felip, E. 2020, Serum concentrations of perfluorinated alkyl substance in farmers living in areas affected by water contamination in the Veneto Region (Northern Italy), Environment International, 136, 105435.
45. Contaminated land exposure assessment (CLEA) tool - GOV.UK [Last updated 7 September 2015]
46. https://www.growveg.co.uk/guides/vegetable-root-depths-revealed-use-this-guide-tomake-smarter-planting-decisions (accessed 15.10.25).
47. Beriro D.J., Bearcock J.M., Vane C.H., Marchant B., Martin I., Haslam A., Pickering H., Hughes M., James A., 2025. A comparative analysis of PFAS in archive and fresh soil samples in England and implications for large-scale surveys. Environmental Pollution, 379, art no. 126401.
48. CIRIA C552 Contaminated land risk assessment. A guide to good practice. 2001
49. BS 10175:2011+A2:2017 Investigation of potentially contaminated sites. Code of practice.
50. Food Safety Act, 1990.
No : 70100310
The following terms and abbreviations have been used throughout the enclosed statement. All may be considered as common terms used on an everyday basis by Contaminated Land professionals, their definitions are presented to assist the reader and avoid ambiguity.
Ammonium Perfluorooctanate (APFO) is the ammonium salt of perfluorooctanoic acid (PFOA) and readily dissociates in water to give the ammonium and perfluorooctanoate ions. Whilst APFO and PFOA have subtly different properties it considered appropriate to assume APFO = 100% PFOA once it reaches the environment.
Average Daily Exposure (ADE) The average daily amount of a contaminant per kg bodyweight, which a critical human receptor might take in over the duration of exposure.
Committee on Toxicity (COT). The Committee on Toxicity of Chemicals in Food, Consumer Products and the Environment (COT) is an independent scientific committee that provides advice to the Food Standards Agency, the Department of Health and Social Care, and other Government Departments and Agencies on matters concerning the toxicity of chemicals.
Concentration Factor (CF).
Contaminated Land: Applications In Real Environments (CL:AIRE).
Conceptual Site Model (CSM). A representation of the characteristics of the site in diagrammatic or written form that shows the possible Pollutant linkages between Contaminants, Pathways and Receptors.
Contaminant. A substance that is in, on or under the land and that has the potential to cause harm or to cause pollution to the water environment.
Contaminant Linkage. The relationship between a contaminant, pathway and receptor, which is identified by developing the conceptual site model (‘CSM’). See also source-pathway-receptor linkage.
Contaminant of Concern (CoC). Contaminants that pose an unacceptable risk to human health and the environment, as identified in the risk assessments.
Contaminated Land. Contaminated Land: defined in section 78A(2) of the Environmental Protection Act [8] as: ‘any land which appears to the local authority in whose area it is situated to be in such a condition, by reason of substances in, on or under the land, that - ‘(a) significant harm is being caused or there is a significant possibility of such harm being caused, or; ‘(b) pollution of controlled waters is being, or is likely to be, caused.’ OR with respect to radioactive contamination defined in section 78A(2)(as modified) as ‘any land which appears to the local authority in whose area it is situated to be in such a condition, by reasons of substances in, on or under the ground, that: (a) harm is being caused, or (b) there is a significant possibility of such harm being caused.’
Critical Receptor The individuals or subgroup of the population most likely to be exposed and/or susceptible to the presence of soil contamination.
Cytotoxic. Toxic to cells.
Detailed Quantitative Risk Assessment (DQRA).
European Food Safety Authority (EFSA)
Excess Lifetime Cancer Risk (ELCR)
Food Standards Agency (FSA)
Generic Quantitative Risk Assessment (GQRA)
Genotoxic. A chemical capable of causing damage to genetic material.
Harm. This means adverse impacts on the health of living organisms or other interference with the ecological systems of which they form a part and, in the case of man, includes harm to property.
(Defined in section 78A(4) of the Environmental Protection Act 1990)
Hazard. A property or situation that in particular circumstances could lead to harm or pollution.
Hazard Index (HI).
Hazard Index Approach for PFAS: The hazard index approach requires that a hazard quotient (HQ) is first calculated for each of the four PFAS for each soil sample. The hazard quotient is the ratio of the measured soil concentration to the relevant C4SL. The hazard index (HI) for the soil sample is then the sum of the hazard quotients for the four PFAS: HI = HQPFOA + HQPFOS + HQPFHxS + HQPFNA A hazard quotient or index of greater than 1 (again, subject to consideration of uncertainties) signifies that further assessment or consideration of the risk is required
Hazard Quotient (HQ): See Hazard Index approach for PFAS.
Human Equivalent Dose (HED)
IARC. The International Agency for Research on Cancer is the specialized cancer agency of the World Health Organisation (WHO).
LLTC (Low Level of Toxicological Concern). An LLTC should represent an intake of low concern that remains suitably protective of health, and definitely does not approach an intake level that could be defined as SPOSH.
LOD or Limit of Detection. The lower limit achievable detection as reported by the smallest amount (concentration) that can be detected with reasonable certainty using a specific analytical procedure. Margin of Exposure (MoE).
Method Detection Limit (MDL). The minimum concentration of a substance that can be measured and reported with 99% confidence that the analyte concentration is greater than zero.
Part 2A: Part 2A of the Environmental Protection Act 1990
Pathway. A route or means by which a receptor could be, or is exposed to, or affected by a Contaminant.
Per- and polyfluoroalkyl substances (PFAS). A group of synthetic organofluorine chemical compounds that have multiple fluorine atoms attached to an alkyl chain.
• Perfluorooctanesulfonic acid (PFOS)
• Perfluorooctanoic acid (PFOA)
• Perfluorononanoic acid (PFNA)
• Perfluorohexane sulfonate (PFHxS)
Project No : 70100310
Plausible Contaminant Linkage. A contaminant linkage that may plausibly be significant but requires further quantification or investigation to confirm or refute in the context of Part 2A.
Point of Departure The dose or concentration selected from a toxicity or epidemiology study as the basis for the derivation of a health criteria value or a margin of exposure.
Receptor. In general terms, something that could be adversely affected by contamination (e.g., people, an ecological system, property or a water body).
Risk. A combination of the probability, or frequency of occurrence of a defined hazard and the magnitude of the consequences of the occurrence.
Risk Assessment. The formal process of identifying, assessing and evaluating the health and environmental risks that may be associated with a hazard.
Site Investigation (SI). The collection and analysis of soil, surface water, groundwater, soil gas and other media as a means of further understanding the condition of the site and to inform the risk assessment. This investigation may be undertaken in a single stage, or a number of successive stages.
Significant Contaminant Linkage (SCL) A contaminant linkage that gives rise to a level of risk sufficient to justify a piece of land being determined as Contaminated Land.
Significant Possibility of Significant Harm (SPOSH) (a formal term within Part 2A Legislation). The following health effects should always be considered to constitute significant harm to human health: death; life threatening diseases (e.g., cancers); other diseases likely to have serious impacts on health; serious injury; birth defects; and impairment of reproductive functions. Other health effects may be considered by the local authority to constitute significant harm. For example, a wide range of conditions may or may not constitute significant harm (alone or in combination) including physical injury; gastrointestinal disturbances; respiratory tract effects; cardio-vascular effects; central nervous system effects; skin ailments; effects on organs such as the liver or kidneys; or a wide range of other health impacts. In deciding whether or not a particular form of harm is significant harm, the local authority should consider the seriousness of the harm in question: including the impact on the health, and quality of life, of any person suffering the harm; and the scale of the harm.
Tolerable Weekly Intake (TWI)
United Kingdom Health Security Agency (UKHSA).
Unacceptable Risk A risk of such a nature that it would give grounds for land to be considered Contaminated Land under Part 2A.
Uncertainty. A lack of knowledge about specific factors in a risk or exposure assessment, including parameter uncertainty, model uncertainty and scenario uncertainty. Parameter uncertainty refers to the uncertainty in the model parameter values, which can be due to uncertainties in the data available. Model uncertainty is uncertainty due to imperfections and idealizations made in the physical model formulation. Scenario uncertainty is uncertainty in the actual conceptual model being assumed for example in the actual exposure duration and frequency of a receptor on a site.
United States Environmental Protection Agency (USEPA).
Upper Confidence Limit (UCL)




1. WSP UK Limited has prepared this report solely for the use of the Client and those parties with whom a warranty agreement has been executed, or with whom an assignment has been agreed and outlined in the body of the report.
2. Unless explicitly agreed otherwise, in writing, this report has been prepared under WSP UK Limited standard Terms and Conditions as included within our proposal to the Client.
3. Project specific appointment documents may be agreed at our discretion and a charge may be levied for both the time to review and finalise appointments documents and also for associated changes to the appointment terms. WSP UK Limited reserves the right to amend the fee should any changes to the appointment terms create an increase risk to WSP UK Limited.
4. The report needs to be considered in the light of the WSP UK Limited proposal and associated limitations of scope. The report needs to be read in full and isolated sections cannot be used without full reference to other elements of the report and any previous works referenced within the report.
Coverage: This section covers reports with the following titles or combination of titles: phase 1; desk top study; geo environmental assessment; development appraisal; preliminary environmental risk assessment; constraints report; due diligence report; geotechnical development review; environmental statement; environmental chapter; project scope summary report (PSSR), program environmental impact report (PEIR), geotechnical development risk register; and, baseline environmental assessment.
5. The works undertaken to prepare this report comprised a study of available and easily documented information from a variety of sources (including the Client), together with (where appropriate) a brief walk over inspection of the Site and correspondence with relevant authorities and other interested parties. Due to the short timescales associated with these projects responses may not have been received from all parties. WSP UK Limited cannot be held responsible for any disclosures that are provided post production of our report and will not automatically update our report.
6. The opinions given in this report have been dictated by the finite data on which they are based and are relevant only for the purpose for which the report was commissioned. The information reviewed should not be considered exhaustive and has been accepted in good faith as providing true and representative data pertaining to site conditions. Should additional information become available which may affect the opinions expressed in this report, WSP UK Limited reserves the right to review such information and, if warranted, to modify the opinions accordingly.
7. It should be noted that any risks identified in this report are perceived risks based on the information reviewed. Actual risks can only be assessed following intrusive investigations of the site.
8. WSP UK Limited does not warrant work / data undertaken / provided by others.

Coverage: The following report titles (or combination) may cover this category of work: geo environmental site investigation; geotechnical assessment; GIR (Ground Investigation reports); preliminary environmental and geotechnical risk assessment; and, geotechnical risk register.
9. The investigation has been undertaken to provide information concerning either:
i. The type and degree of contamination present at the site in order to allow a generic quantitative risk assessment to be undertaken; or
ii. Information on the soil properties present at the site to allow for geotechnical development constraints to be considered.
10. The scope of the investigation was selected on the basis of the specific development and land use scenario proposed by the Client and may be inappropriate to another form of development or scheme. If the development layout was not known at the time of the investigation the report findings may need revisiting once the development layout is confirmed.
11. For contamination purposes, the objectives of the investigation are limited to establishing the risks associated with potential contamination sources with the potential to cause harm to human health, building materials, the environment (including adjacent land), or controlled waters.
12. For geotechnical investigations the purpose is to broadly consider potential development constraints associated with the physical property of the soils underlying the site within the context of the proposed future or continued use of the site, as stated within the report.
13. The amount of exploratory work, soil property testing and chemical testing undertaken has necessarily been restricted by various factors which may include accessibility, the presence of services; existing buildings; current site usage or short timescales. The exploratory holes completed assess only a small percentage of the area in relation to the overall size of the Site, and as such can only provide a general indication of conditions.
14. The number of sampling points and the methods of sampling and testing do not preclude the possible existence of contamination where concentrations may be significantly higher than those actually encountered or ground conditions that vary from those identified. In addition, there may be exceptional ground conditions elsewhere on the site which have not been disclosed by this investigation and which have therefore not been taken into account in this report.
15. The inspection, testing and monitoring records relate specifically to the investigation points and the timeframe that the works were undertaken. They will also be limited by the techniques employed. As part of this assessment, WSP UK Limited has used reasonable skill and care to extrapolate conditions between these points based upon assumptions to develop our interpretation and conclusions. The assumption made in forming our conclusions is that the ground and groundwater conditions (both chemically and physically) are the same as have been encountered during the works undertaken at the specific points of investigation. Conditions can change between investigation points and these interpretations should be considered indicative.
16. The risk assessment and opinions provided are based on currently available guidance relating to acceptable contamination concentrations; no liability can be accepted for the retrospective effects of any future changes or amendments to these values. Specific assumptions associated
with the WSP UK Limited risk assessment process have been outlined within the body or associated appendix of the report.
17. Additional investigations may be required in order to satisfy relevant planning conditions or to resolve any engineering and environmental issues.
18. Where soil contamination concentrations recorded as part of this investigation are used for commentary on potential waste classification of soils for disposal purposes, these should be classed as indicative only. Due consideration should be given to the variability of contaminant concentrations taken from targeted samples versus bulk excavated soils and the potential variability of contaminant concentrations between sampling locations. Where major waste disposal operations are considered, targeted waste classification investigations should be designed.
19. The results of the asbestos testing are factually reported and interpretation given as to how this relates to the previous use of the site, the types of ground encountered and site conceptualisation. This does not however constitute a formal asbestos assessment. These results should be treated cautiously and should not be relied upon to provide detailed and representative information on the delineation, type and extent of bulk ACMs and / or trace loose asbestos fibres within the soil matrix at the site.
20. If costs have been included in relation to additional site works, and / or site remediation works these must be considered as indicative only and must be confirmed by a qualified quantity surveyor.
21. On 1st April 2010, BS EN 1997-1:2004 (Eurocode 7: Geotechnical Design – Part 1) became the mandatory baseline standard for geotechnical ground investigations.
22. In terms of geotechnical design for foundations, slopes, retaining walls and earthworks, EC7 sets guidance on design procedures including specific guidance on the numbers and spacings of boreholes for geotechnical design, there are limits to methods of ground investigation and the quality of data obtained and there are also prescriptive methods of assessing soil strengths and methods of design. Unless otherwise explicitly stated, the work has not been undertaken in accordance with EC7. A standard geotechnical interpretative report will not meet the requirements of the Geotechnical Design Report (GDR) under Eurocode 7. The GDR can only be prepared following confirmation of all structural loads and serviceability requirements. The report is likely to represent a Ground Investigation Report (GIR) under the Eurocode 7 guidance.
23. These reports build upon previous report versions and associated notes. The scope of the investigation, further testing and monitoring and associated risk assessments were selected on the basis of the specific development and land use scenario proposed by the Client and may not be appropriate to another form of development or scheme layout. The risk assessment and opinions provided are based on currently available approaches in the generation of Site Specific Assessment Criteria relating to contamination concentrations and are not considered to represent a risk in a specific land use scenario to a specific receptor. No liability can be accepted for the retrospective effects of any future changes or amendments to these values, associated models or associated guidance.
24. The outputs of the Detailed Quantitative Risk Assessments are based upon WSP UK Limited manipulation of standard risk assessment models. These are our interpretation of the risk assessment criteria.
25. Prior to adoption on site they will need discussing and agreeing with the Regulatory Authorities prior to adoption on site. The regulatory discussion and engagement process may result in an alternative interpretation being determined and agreed. The process and timescales associated with the Regulatory Authority engagement are not within the control of WSP UK Limited. All costs and programmes presented as a result of this process should be validated by a quantity surveyor and should be presumed to be indicative.
26. The GDR can only be prepared following confirmation of all structural loads and serviceability requirements. All the relevant information needs to be provided to allow for a GDR to be produced.
27. These reports are factual in nature and comprise monitoring, normally groundwater and ground gas and data provided by contractors as part of an earthworks or remedial works.
28. The data is presented and will be compared with assessment criteria.


Report generated
Report title
Created by RESULTS
WSP UK Ltd 16-May-25
OccupationRoad Allotments. PFOA 7.3 ug/kg. Adult

1
Soil-to-plant concentration factor for green vegetables (mg g -1 plant DW or FW basis over mg g -1 DW soil)
Soil-to-plant concentration factor for root vegetables (mg g -1 plant DW or FW basis over mg g -1 DW soil)
Soil-to-plant concentration factor for tuber vegetables (mg g -1 plant DW or FW basis over mg g -1 DW soil)
Soil-to-plant concentration factor for herbaceous fruit (mg g -1 plant DW or FW basis over mg g -1 DW soil)
Soil-to-plant concentration factor for shrub fruit (mg g -1 plant DW or FW basis over mg g -1 DW soil)
Soil-to-plant concentration factor for tree fruit (mg g -1 plant DW or FW basis over
Soil-to-water partition coefficient (cm 3 g -1 )
Vapour pressure (Pa) Water solubility (mg L -1 )
Soil-to-plant concentration factor for green vegetables (mg g -1 plant DW or FW basis over mg g -1 DW soil)
Soil-to-plant concentration factor for tree fruit (mg g -1 plant DW or FW basis over mg g -1 DW soil) 16-May-25
Soil-to-plant concentration factor for root vegetables (mg g -1 plant DW or FW basis over mg g -1 DW soil)
Soil-to-plant concentration factor for tuber vegetables (mg g -1 plant DW or FW basis over mg g -1 DW soil)
Soil-to-plant concentration factor for herbaceous fruit (mg g -1 plant DW or FW basis over mg g -1 DW soil)
Soil-to-plant concentration factor for shrub fruit (mg g -1 plant DW or FW basis over mg g -1 DW soil)
Software Version 1.071 Page 1 of 5
Report generated
Report title
Created by
16/05/2025
Occupation Road Allotments. PFOA 7.3 ug/kg. Adult
WSP UK Ltd
Land UseAllotments (lifetime exposure C4SL)
BuildingNo building
ReceptorFemale (allot)Start age class17End age class17Exposure Duration49years
SoilSandy loam
Exposure Pathways Direct soiland dust ingestion
Consumption of homegrown produce
Soilattached to homegrown produce
Dermal contact with indoor dust
Dermal contact with soil
Inhalation of indoor dust
Inhalation of soil dust
Inhalation of indoor vapour Inhalation of outdoor vapour
Report16-May-25 generated

Frequencies (days yr-1)Occupation Periods (hr day-1)
1 251800250250.03.00.001.000.105.600.710.30.320.263.43E-01
2 130365013001300.03.00.001.000.109.800.818.80.330.264.84E-01
3 130365013001300.03.00.001.000.1012.700.920.70.320.255.82E-01
4 130365013001300.03.00.001.000.1015.100.919.10.350.286.36E-01
5 653650650650.03.00.001.000.1016.901.021.30.350.287.04E-01
6 653650650650.03.00.001.000.1019.701.124.90.330.267.94E-01
7 653650650650.03.00.001.000.1022.101.217.60.220.158.73E-01
8 653650650650.03.00.001.000.1025.301.220.20.220.159.36E-01
9 653650650650.03.00.001.000.1027.501.321.80.220.151.01E+00
10 653650650650.03.00.001.000.1031.401.325.00.220.151.08E+00
11 653650650650.03.00.001.000.1035.701.428.40.220.141.19E+00
12 653650650650.03.00.001.000.1041.301.419.80.220.141.29E+00
13 253650250250.03.00.000.300.0547.201.522.70.220.141.42E+00
14 253650250250.03.00.000.300.0551.201.624.50.220.141.52E+00
15 253650250250.03.00.000.300.0556.701.627.20.210.141.60E+00
16 253650250250.03.00.000.300.0559.001.628.30.210.141.63E+00
17 258365025802580.03.00.000.300.0570.001.627.40.330.271.78E+00
18 258365025802580.03.00.000.300.0570.901.625.40.330.271.80E+00
Rates

Age Class
1 3.47E+005.22E+009.22E+008.90E-011.07E+001.87E+007.12E+001.07E+011.60E+011.83E+002.23E+003.82E+00
2 3.34E+001.61E+003.14E+001.93E+002.60E-015.84E+005.87E+002.83E+006.60E+003.39E+004.60E-011.03E+01
3 3.34E+001.61E+003.14E+001.93E+002.60E-015.84E+005.87E+002.83E+006.60E+003.39E+004.60E-011.03E+01
4 3.34E+001.61E+003.14E+001.93E+002.60E-015.84E+005.87E+002.83E+006.60E+003.39E+004.60E-011.03E+01
5 2.54E+001.20E+002.65E+001.25E+001.10E-012.89E+004.53E+002.14E+004.95E+002.24E+001.90E-015.16E+00
6 2.54E+001.20E+002.65E+001.25E+001.10E-012.89E+004.53E+002.14E+004.95E+002.24E+001.90E-015.16E+00
7 2.54E+001.20E+002.65E+001.25E+001.10E-012.89E+004.53E+002.14E+004.95E+002.24E+001.90E-015.16E+00
8 2.54E+001.20E+002.65E+001.25E+001.10E-012.89E+004.53E+002.14E+004.95E+002.24E+001.90E-015.16E+00
9 2.54E+001.20E+002.65E+001.25E+001.10E-012.89E+004.53E+002.14E+004.95E+002.24E+001.90E-015.16E+00
10 2.54E+001.20E+002.65E+001.25E+001.10E-012.89E+004.53E+002.14E+004.95E+002.24E+001.90E-015.16E+00
11 2.54E+001.20E+002.65E+001.25E+001.10E-012.89E+004.53E+002.14E+004.95E+002.24E+001.90E-015.16E+00
12 1.03E+004.90E-011.60E+005.10E-014.00E-021.18E+001.87E+008.90E-013.05E+009.30E-018.00E-022.13E+00
13 1.03E+004.90E-011.60E+005.10E-014.00E-021.18E+001.87E+008.90E-013.05E+009.30E-018.00E-022.13E+00
14 1.03E+004.90E-011.60E+005.10E-014.00E-021.18E+001.87E+008.90E-013.05E+009.30E-018.00E-022.13E+00
15 1.03E+004.90E-011.60E+005.10E-014.00E-021.18E+001.87E+008.90E-013.05E+009.30E-018.00E-022.13E+00
16 1.03E+004.90E-011.60E+005.10E-014.00E-021.18E+001.87E+008.90E-013.05E+009.30E-018.00E-022.13E+00
17 1.26E+006.00E-011.18E+006.90E-019.00E-021.27E+002.36E+001.12E+002.35E+001.29E+001.80E-012.38E+00
18 1.35E+006.40E-011.25E+007.40E-011.00E-011.36E+002.34E+001.12E+002.36E+001.28E+001.80E-012.37E+00
Top 2 applied?Yes Where top 2 method is applied, two produce categories use 90th percentile rates, while the remainder use the mean.Produce categories varyon a chemical-by-chemical basis.Where top 2 method is not used, allproduce categories for all chemicals assume 90th percentile rates.
Building No building
Building footprint (m2)
Living space air exchange rate (hr-1)
Living space height (above ground, m)
Living space height (belowground, m)
Pressure difference (soil to enclosed space, Pa)
Foundationthickness (m)
Floor crack area (cm2)
Dust loading factor (μg m-3)
16-May-25
Soil Sandy loam
0.00E+005.30E-01
Porosity, Total(cm3 cm-3)
0.00E+002.00E-01
Porosity, Air-Filled (cm3 cm-3)
0.00E+003.30E-01
Porosity, Water-Filled (cm3 cm-3)
Residualsoilwater content (cm3 cm-3)
0.00E+001.20E-01
0.00E+003.56E-03
Saturated hydraulic conductivity(cm s-1)
vanGenuchtenshape parameter m (dimensionless)
0.00E+003.20E-01 1.21E+00
0.00E+00
0.00E+00
Bulk density(g cm-3)
Threshold value of wind speed at 10m (m s-1) 7.20E+00
Ambient soiltemperature (K)
Soil pH
Soil Organic Matter content (%)
Fractionof organic carbon(g g-1)
Effective totalfluid saturation(unitless)
Intrinsic soilpermeability(cm2)
Relative soil air permeability(unitless)
Effective air permeability(cm2)
Empiricalfunction(Fx) for dust model(dimensionless) 1.22E+00 2.83E+02 7.00E+00 6.00E+00 3.48E-02 5.12E-01 4.75E-08 6.42E-01 3.05E-08
Soil - Vapour ModelAir Dispersion Model
Depthto top of source (no building) (cm)
Soil gas ingress rate (cm3 s -1)
Averaging time surface emissions (yr) 49
Finite vapour source model? No Thickness of contaminated layer (cm) 200
Tuber vegetables 16-May-25 Building ventilationrate (cm3 s -1)
Soil - Plant Model
Dryweight conversion factor
Homegrown fraction
Herbaceous fruit
Shrub fruit Green vegetables Root vegetables
Tree fruit
Soilloading factor
Preparation correction factor
0.0960.050.331.00E-032.00E-01
0.1030.060.401.00E-031.00E+00
0.2100.020.131.00E-031.00E+00
0.0580.060.401.00E-036.00E-01
0.1660.090.601.00E-036.00E-01
0.1570.040.271.00E-036.00E-01
Gardener type High Air dispersionfactor at height of 0.8m *
CLEA Software Version 1.071 Page 1 of 11
Report generated
Report title
Created by
RESULTS
WSP UK Ltd 16-May-25
OccupationRoad Allotments. PFOA 7.3 ug/kg. Child
1
Soil-to-plant concentration factor for green vegetables (mg g -1 plant DW or FW basis over mg g -1 DW soil)
Soil-to-plant concentration factor for root vegetables (mg g -1 plant DW or FW basis over mg g -1 DW soil)
Soil-to-plant concentration factor for tuber vegetables (mg g -1 plant DW or FW basis over mg g -1 DW soil)
Soil-to-plant concentration factor for herbaceous fruit (mg g -1 plant DW or FW basis over mg g -1 DW soil)
Soil-to-plant concentration factor for shrub fruit (mg g -1 plant DW or FW basis over mg g -1 DW soil)
Soil-to-plant concentration factor for tree fruit (mg g -1 plant DW or FW basis over
Soil-to-water partition coefficient (cm 3 g -1 )
Vapour pressure (Pa) Water solubility (mg L -1 )
Soil-to-plant concentration factor for green vegetables (mg g -1 plant DW or FW basis over mg g -1 DW soil)
Soil-to-plant concentration factor for tree fruit (mg g -1 plant DW or FW basis over mg g -1 DW soil) 16-May-25
Soil-to-plant concentration factor for root vegetables (mg g -1 plant DW or FW basis over mg g -1 DW soil)
Soil-to-plant concentration factor for tuber vegetables (mg g -1 plant DW or FW basis over mg g -1 DW soil)
Soil-to-plant concentration factor for herbaceous fruit (mg g -1 plant DW or FW basis over mg g -1 DW soil)
Soil-to-plant concentration factor for shrub fruit (mg g -1 plant DW or FW basis over mg g -1 DW soil)
Software Version 1.071 Page 1 of 5
Report generated
Report title
Created by
16/05/2025
Occupation Road Allotments. PFOA 7.3 ug/kg. Child
WSP UK Ltd
Land UseAllotments (C4SL)
BuildingNo building
ReceptorFemale (allot)Start age class1End age class6Exposure Duration6years
SoilSandy loam
Exposure Pathways Direct soiland dust ingestion
Consumption of homegrown produce
Soilattached to homegrown produce
Dermal contact with indoor dust
Dermal contact with soil
Inhalation of indoor dust
Inhalation of soil dust
Inhalation of indoor vapour Inhalation of outdoor vapour
Report16-May-25 generated
Exposure Frequencies (days yr-1)Occupation Periods (hr day-1)
1 251800250250.03.00.001.000.105.600.710.30.320.263.43E-01
2 130365013001300.03.00.001.000.109.800.818.80.330.264.84E-01
3 130365013001300.03.00.001.000.1012.700.920.70.320.255.82E-01
4 130365013001300.03.00.001.000.1015.100.919.10.350.286.36E-01
5 653650650650.03.00.001.000.1016.901.021.30.350.287.04E-01
6 653650650650.03.00.001.000.1019.701.124.90.330.267.94E-01
7 0000000.00.00.000.000.0022.101.217.60.220.158.73E-01
8 0000000.00.00.000.000.0025.301.220.20.220.159.36E-01
9 0000000.00.00.000.000.0027.501.321.80.220.151.01E+00
10 0000000.00.00.000.000.0031.401.325.00.220.151.08E+00
11 0000000.00.00.000.000.0035.701.428.40.220.141.19E+00
12 0000000.00.00.000.000.0041.301.419.80.220.141.29E+00
13 0000000.00.00.000.000.0047.201.522.70.220.141.42E+00
14 0000000.00.00.000.000.0051.201.624.50.220.141.52E+00
15 0000000.00.00.000.000.0056.701.627.20.210.141.60E+00
16 0000000.00.00.000.000.0059.001.628.30.210.141.63E+00
17 0000000.00.00.000.000.0070.001.627.40.330.271.78E+00
18 0000000.00.00.000.000.0070.901.625.40.330.271.80E+00
Rates
Age Class
1 3.47E+005.22E+009.22E+008.90E-011.07E+001.87E+007.12E+001.07E+011.60E+011.83E+002.23E+003.82E+00
2 3.34E+001.61E+003.14E+001.93E+002.60E-015.84E+005.87E+002.83E+006.60E+003.39E+004.60E-011.03E+01
3 3.34E+001.61E+003.14E+001.93E+002.60E-015.84E+005.87E+002.83E+006.60E+003.39E+004.60E-011.03E+01
4 3.34E+001.61E+003.14E+001.93E+002.60E-015.84E+005.87E+002.83E+006.60E+003.39E+004.60E-011.03E+01
5 2.54E+001.20E+002.65E+001.25E+001.10E-012.89E+004.53E+002.14E+004.95E+002.24E+001.90E-015.16E+00
6 2.54E+001.20E+002.65E+001.25E+001.10E-012.89E+004.53E+002.14E+004.95E+002.24E+001.90E-015.16E+00
7 2.54E+001.20E+002.65E+001.25E+001.10E-012.89E+004.53E+002.14E+004.95E+002.24E+001.90E-015.16E+00
8 2.54E+001.20E+002.65E+001.25E+001.10E-012.89E+004.53E+002.14E+004.95E+002.24E+001.90E-015.16E+00
9 2.54E+001.20E+002.65E+001.25E+001.10E-012.89E+004.53E+002.14E+004.95E+002.24E+001.90E-015.16E+00
10 2.54E+001.20E+002.65E+001.25E+001.10E-012.89E+004.53E+002.14E+004.95E+002.24E+001.90E-015.16E+00
11 2.54E+001.20E+002.65E+001.25E+001.10E-012.89E+004.53E+002.14E+004.95E+002.24E+001.90E-015.16E+00
12 1.03E+004.90E-011.60E+005.10E-014.00E-021.18E+001.87E+008.90E-013.05E+009.30E-018.00E-022.13E+00
13 1.03E+004.90E-011.60E+005.10E-014.00E-021.18E+001.87E+008.90E-013.05E+009.30E-018.00E-022.13E+00
14 1.03E+004.90E-011.60E+005.10E-014.00E-021.18E+001.87E+008.90E-013.05E+009.30E-018.00E-022.13E+00
15 1.03E+004.90E-011.60E+005.10E-014.00E-021.18E+001.87E+008.90E-013.05E+009.30E-018.00E-022.13E+00
16 1.03E+004.90E-011.60E+005.10E-014.00E-021.18E+001.87E+008.90E-013.05E+009.30E-018.00E-022.13E+00
17 1.26E+006.00E-011.18E+006.90E-019.00E-021.27E+002.36E+001.12E+002.35E+001.29E+001.80E-012.38E+00
18 1.35E+006.40E-011.25E+007.40E-011.00E-011.36E+002.34E+001.12E+002.36E+001.28E+001.80E-012.37E+00
Top 2 applied?Yes Where top 2 method is applied, two produce categories use 90th percentile rates, while the remainder use the mean.Produce categories varyon a chemical-by-chemical basis.Where top 2 method is not used, allproduce categories for all chemicals assume 90th percentile rates.
Building No building
Building footprint (m2)
Living space air exchange rate (hr-1)
Living space height (above ground, m)
Living space height (belowground, m)
Pressure difference (soil to enclosed space, Pa)
Foundationthickness (m)
Floor crack area (cm2)
Dust loading factor (μg m-3)
16-May-25
Soil Sandy loam
0.00E+005.30E-01
Porosity, Total(cm3 cm-3)
0.00E+002.00E-01
Porosity, Air-Filled (cm3 cm-3)
0.00E+003.30E-01
Porosity, Water-Filled (cm3 cm-3)
Residualsoilwater content (cm3 cm-3)
0.00E+001.20E-01
0.00E+003.56E-03
Saturated hydraulic conductivity(cm s-1)
vanGenuchtenshape parameter m (dimensionless)
0.00E+003.20E-01 1.21E+00
0.00E+00
0.00E+00
Bulk density(g cm-3)
Threshold value of wind speed at 10m (m s-1) 7.20E+00
Ambient soiltemperature (K)
Soil pH
Soil Organic Matter content (%)
Fractionof organic carbon(g g-1)
Effective totalfluid saturation(unitless)
Intrinsic soilpermeability(cm2)
Relative soil air permeability(unitless)
Effective air permeability(cm2)
Empiricalfunction(Fx) for dust model(dimensionless) 1.22E+00 2.83E+02 7.00E+00 6.00E+00 3.48E-02 5.12E-01 4.75E-08 6.42E-01 3.05E-08
Soil - Vapour ModelAir Dispersion Model
Depthto top of source (no building) (cm)
Soil gas ingress rate (cm3 s -1)
Averaging time surface emissions (yr) 6
Finite vapour source model? No Thickness of contaminated layer (cm)
Tuber vegetables 16-May-25 Building ventilationrate (cm3 s -1)
Soil - Plant Model
Dryweight conversion factor
dispersionfactor at height of 1.6m *
Homegrown fraction
Herbaceous fruit
Shrub fruit Green vegetables Root vegetables
Tree fruit
Soilloading factor
Preparation correction factor
0.0960.050.331.00E-032.00E-01
0.1030.060.401.00E-031.00E+00
0.2100.020.131.00E-031.00E+00
0.0580.060.401.00E-036.00E-01
0.1660.090.601.00E-036.00E-01
0.1570.040.271.00E-036.00E-01
Gardener type High Air dispersionfactor at height of 0.8m *
CLEA Software Version 1.071 Page 1 of 11
Report generated
Report title
Created by
RESULTS
WSP UK Ltd 16-May-25
OccupationRoad Off-site Resi Exposure. PFOA 8.9 ug/kg. Adult
1
1
Inhalation of vapour (indoor)Background (oral)
Background(inhalation)Inhalation of vapour (outdoor)
16-May-25
Soil-to-water partition coefficient (cm 3 g -1 ) Vapour pressure (Pa)
Soil-to-plant concentration factor for green vegetables (mg g -1 plant DW or FW basis over mg g -1 DW soil)
Soil-to-plant concentration factor for root vegetables (mg g -1 plant DW or FW basis over mg g -1 DW soil)
Soil-to-plant concentration factor for tuber vegetables (mg g -1 plant DW or FW basis over mg g -1 DW soil)
Soil-to-plant concentration factor for herbaceous fruit (mg g -1 plant DW or FW basis over mg g -1 DW soil)
Soil-to-plant concentration factor for shrub fruit (mg g -1 plant DW or FW basis over mg g -1 DW soil)
Soil-to-plant concentration factor for tree fruit (mg g -1 plant DW or FW basis over mg g
Soil-to-water partition coefficient (cm 3 g -1 )
Vapour pressure (Pa) Water solubility (mg L -1 )
Soil-to-plant concentration factor for green vegetables (mg g -1 plant DW or FW basis over mg g -1 DW soil)
Soil-to-plant concentration factor for root vegetables (mg g -1 plant DW or FW basis over mg g -1 DW soil)
Soil-to-plant concentration factor for tuber vegetables (mg g -1 plant DW or FW basis over mg g -1 DW soil)
Soil-to-plant concentration factor for herbaceous fruit (mg g -1 plant DW or FW basis over mg g -1 DW soil)
Soil-to-plant concentration factor for shrub fruit (mg g -1 plant DW or FW basis over mg g -1 DW soil)
Soil-to-plant concentration factor for tree fruit (mg g -1 plant DW or FW basis over mg g -1 DW soil)
CLEA Software Version 1.071
Report generated
Report title
Created by
Page 1 of 5
WSP UK Ltd 16/05/2025
Occupation Road Off-site Resi Exposure. PFOA 8.9 ug/kg. Adult
Land UseResidential (lifetime exposure C4SL)
BuildingSmall terraced house
ReceptorFemale (res C4SL)Start age class17End age class17Exposure Duration49years
SoilSandy loam
Exposure Pathways Direct soiland dust ingestion Dermal contact with indoor dust Inhalation of indoor dust
Consumption of homegrown produce Dermal contact with soil Inhalation of soil dust
Soilattached to homegrown produce
Inhalation of indoor vapour Inhalation of outdoor vapour
Report16-May-25 generated
Exposure Frequencies (days yr-1)Occupation Periods (hr day-1)
Age Class
1 18018018017036536523.01.00.060.100.105.600.75.40.320.263.43E-01
2 36536536517036536523.01.00.060.100.109.800.88.00.330.264.84E-01
3 36536536517036536523.01.00.060.100.1012.700.98.90.320.255.82E-01
4 36536536517036536523.01.00.060.100.1015.100.910.10.350.286.36E-01
5 36536536517036536519.01.00.060.100.1016.901.010.10.350.287.04E-01
6 36536536517036536519.01.00.060.100.1019.701.110.10.330.267.94E-01
7 36536536517036536519.01.00.060.100.1022.101.212.00.220.158.73E-01
8 36536536517036536519.01.00.060.100.1025.301.212.00.220.159.36E-01
9 36536536517036536519.01.00.060.100.1027.501.312.00.220.151.01E+00
10 36536536517036536519.01.00.060.100.1031.401.312.00.220.151.08E+00
11 36536536517036536519.01.00.060.100.1035.701.412.00.220.141.19E+00
12 36536536517036536519.01.00.060.100.1041.301.415.20.220.141.29E+00
13 36536536517036536515.01.00.060.300.0547.201.515.20.220.141.42E+00
14 36536536517036536515.01.00.060.300.0551.201.615.20.220.141.52E+00
15 36536536517036536515.01.00.060.300.0556.701.615.20.210.141.60E+00
16 36536536517036536515.01.00.060.300.0559.001.615.20.210.141.63E+00
17 36536536517036536516.01.00.060.300.0570.001.615.70.330.271.78E+00
18 36536536517036536516.01.00.060.300.0570.901.613.60.330.271.80E+00
Rates
Age Class
1 3.47E+005.22E+009.22E+008.90E-011.07E+001.87E+007.12E+001.07E+011.60E+011.83E+002.23E+003.82E+00
2 3.34E+001.61E+003.14E+001.93E+002.60E-015.84E+005.87E+002.83E+006.60E+003.39E+004.60E-011.03E+01
3 3.34E+001.61E+003.14E+001.93E+002.60E-015.84E+005.87E+002.83E+006.60E+003.39E+004.60E-011.03E+01
4 3.34E+001.61E+003.14E+001.93E+002.60E-015.84E+005.87E+002.83E+006.60E+003.39E+004.60E-011.03E+01
5 2.54E+001.20E+002.65E+001.25E+001.10E-012.89E+004.53E+002.14E+004.95E+002.24E+001.90E-015.16E+00
6 2.54E+001.20E+002.65E+001.25E+001.10E-012.89E+004.53E+002.14E+004.95E+002.24E+001.90E-015.16E+00
7 2.54E+001.20E+002.65E+001.25E+001.10E-012.89E+004.53E+002.14E+004.95E+002.24E+001.90E-015.16E+00
8 2.54E+001.20E+002.65E+001.25E+001.10E-012.89E+004.53E+002.14E+004.95E+002.24E+001.90E-015.16E+00
9 2.54E+001.20E+002.65E+001.25E+001.10E-012.89E+004.53E+002.14E+004.95E+002.24E+001.90E-015.16E+00
10 2.54E+001.20E+002.65E+001.25E+001.10E-012.89E+004.53E+002.14E+004.95E+002.24E+001.90E-015.16E+00
11 2.54E+001.20E+002.65E+001.25E+001.10E-012.89E+004.53E+002.14E+004.95E+002.24E+001.90E-015.16E+00
12 1.03E+004.90E-011.60E+005.10E-014.00E-021.18E+001.87E+008.90E-013.05E+009.30E-018.00E-022.13E+00
13 1.03E+004.90E-011.60E+005.10E-014.00E-021.18E+001.87E+008.90E-013.05E+009.30E-018.00E-022.13E+00
14 1.03E+004.90E-011.60E+005.10E-014.00E-021.18E+001.87E+008.90E-013.05E+009.30E-018.00E-022.13E+00
15 1.03E+004.90E-011.60E+005.10E-014.00E-021.18E+001.87E+008.90E-013.05E+009.30E-018.00E-022.13E+00
16 1.03E+004.90E-011.60E+005.10E-014.00E-021.18E+001.87E+008.90E-013.05E+009.30E-018.00E-022.13E+00
17 1.26E+006.00E-011.18E+006.90E-019.00E-021.27E+002.36E+001.12E+002.35E+001.29E+001.80E-012.38E+00
18 1.35E+006.40E-011.25E+007.40E-011.00E-011.36E+002.34E+001.12E+002.36E+001.28E+001.80E-012.37E+00
Top 2 applied?Yes Where top 2 method is applied, two produce categories use 90th percentile rates, while the remainder use the mean.Produce categories varyon a chemical-by-chemical basis.Where top 2 method is not used, allproduce categories for all chemicals assume 90th percentile rates.
Building Small terraced house
Building footprint (m2)
Living space air exchange rate (hr-1)
Living space height (above ground, m)
Living space height (belowground, m)
Pressure difference (soil to enclosed space, Pa)
Foundationthickness (m)
Floor crack area (cm2)
Dust loading factor (μg m-3)
Soil Sandy loam
Porosity, Total(cm3 cm-3)
Porosity, Air-Filled (cm3 cm-3)
2.80E+015.30E-01 5.00E-012.00E-01
4.80E+003.30E-01
Porosity, Water-Filled (cm3 cm-3)
0.00E+001.20E-01
4.23E+02
Residualsoilwater content (cm3 cm-3)
Saturated hydraulic conductivity(cm s-1)
3.10E+003.56E-03 1.50E-013.20E-01 1.21E+00
vanGenuchtenshape parameter m (dimensionless) Bulk density(g cm-3)
5.00E+01 Threshold value of wind speed at 10m (m s-1) 7.20E+00
Ambient soiltemperature (K)
Soil pH
Soil Organic Matter content (%) Fractionof organic carbon(g g-1) 16-May-25
Effective totalfluid saturation(unitless)
Intrinsic soilpermeability(cm2)
Relative soil air permeability(unitless)
Effective air permeability(cm2)
Empiricalfunction(Fx) for dust model(dimensionless) 1.22E+00 2.83E+02 7.00E+00 6.00E+00 3.48E-02 5.12E-01 4.75E-08 6.42E-01 3.05E-08
Soil - Vapour ModelAir Dispersion Model
Soil gas ingress rate (cm3 s -1) Depthto top of source (no building) (cm)
Building ventilationrate (cm3 s -1)
Averaging time surface emissions (yr) 49
Finite vapour source model? No Thickness of contaminated layer (cm) 200
Soil - Plant Model
Dryweight conversion factor
Air dispersionfactor at height of 0.8m *
Air dispersionfactor at height of 1.6m * 16-May-25
Homegrown fraction
AverageHigh
Soilloading factor
Preparation correction factor
0.0960.050.331.00E-032.00E-01
0.1030.060.401.00E-031.00E+00
Tuber vegetables
Herbaceous fruit
Shrub fruit Green vegetables Root vegetables
Tree fruit
0.2100.020.131.00E-031.00E+00
0.0580.060.401.00E-036.00E-01
0.1660.090.601.00E-036.00E-01
0.1570.040.271.00E-036.00E-01
Gardener type Average
CLEA Software Version 1.071 Page 1 of 11
Report generated
Report title
Created by
RESULTS
WSP UK Ltd 16-May-25
OccupationRoad Off-site Resi Exposure. PFOA 8.9 ug/kg. Child
1
Inhalation of vapour (indoor)Background (oral)
Background(inhalation)Inhalation of vapour (outdoor)
16-May-25
Soil-to-water partition coefficient (cm 3 g -1 ) Vapour pressure (Pa)
Soil-to-plant concentration factor for green vegetables (mg g -1 plant DW or FW basis over mg g -1 DW soil)
Soil-to-plant concentration factor for root vegetables (mg g -1 plant DW or FW basis over mg g -1 DW soil)
Soil-to-plant concentration factor for tuber vegetables (mg g -1 plant DW or FW basis over mg g -1 DW soil)
Soil-to-plant concentration factor for herbaceous fruit (mg g -1 plant DW or FW basis over mg g -1 DW soil)
Soil-to-plant concentration factor for shrub fruit (mg g -1 plant DW or FW basis over mg g -1 DW soil)
Soil-to-plant concentration factor for tree fruit (mg g -1 plant DW or FW basis over mg g
Soil-to-water partition coefficient (cm 3 g -1 )
Vapour pressure (Pa) Water solubility (mg L -1 )
Soil-to-plant concentration factor for green vegetables (mg g -1 plant DW or FW basis over mg g -1 DW soil)
Soil-to-plant concentration factor for root vegetables (mg g -1 plant DW or FW basis over mg g -1 DW soil)
Soil-to-plant concentration factor for tuber vegetables (mg g -1 plant DW or FW basis over mg g -1 DW soil)
Soil-to-plant concentration factor for herbaceous fruit (mg g -1 plant DW or FW basis over mg g -1 DW soil)
Soil-to-plant concentration factor for shrub fruit (mg g -1 plant DW or FW basis over mg g -1 DW soil)
Soil-to-plant concentration factor for tree fruit (mg g -1 plant DW or FW basis over mg g -1 DW soil)
CLEA Software Version 1.071 Page 1 of 5
Report generated
Report title
Created by
WSP UK Ltd 16/05/2025
Occupation Road Off-site Resi Exposure. PFOA 8.9 ug/kg. Child
Land UseResidential without produce (C4SL)
BuildingSmall terraced house
ReceptorFemale (res C4SL)Start age class1End age class6Exposure Duration6years
SoilSandy loam
Exposure Pathways Direct soiland dust ingestion
Dermal contact with indoor dust
Consumption of homegrown produce Dermal contact with soil
Inhalation of indoor dust
Inhalation of soil dust
Soilattached to homegrown produce Inhalation of indoor vapour Inhalation of outdoor vapour
Report16-May-25 generated
Exposure Frequencies (days yr-1)Occupation Periods (hr day-1)
1 180018017036536523.01.00.060.100.105.600.75.40.320.263.43E-01
2 365036517036536523.01.00.060.100.109.800.88.00.330.264.84E-01
3 365036517036536523.01.00.060.100.1012.700.98.90.320.255.82E-01
4 365036517036536523.01.00.060.100.1015.100.910.10.350.286.36E-01
5 365036517036536519.01.00.060.100.1016.901.010.10.350.287.04E-01
6 365036517036536519.01.00.060.100.1019.701.110.10.330.267.94E-01
7 0000000.00.00.000.000.0022.101.212.00.220.158.73E-01
8 0000000.00.00.000.000.0025.301.212.00.220.159.36E-01
9 0000000.00.00.000.000.0027.501.312.00.220.151.01E+00
10 0000000.00.00.000.000.0031.401.312.00.220.151.08E+00
11 0000000.00.00.000.000.0035.701.412.00.220.141.19E+00
12 0000000.00.00.000.000.0041.301.415.20.220.141.29E+00
13 0000000.00.00.000.000.0047.201.515.20.220.141.42E+00
14 0000000.00.00.000.000.0051.201.615.20.220.141.52E+00 15 0000000.00.00.000.000.0056.701.615.20.210.141.60E+00
16 0000000.00.00.000.000.0059.001.615.20.210.141.63E+00
17 0000000.00.00.000.000.0070.001.615.70.330.271.78E+00 18 0000000.00.00.000.000.0070.901.613.60.330.271.80E+00
Rates
Age Class
1 3.47E+005.22E+009.22E+008.90E-011.07E+001.87E+007.12E+001.07E+011.60E+011.83E+002.23E+003.82E+00
2 3.34E+001.61E+003.14E+001.93E+002.60E-015.84E+005.87E+002.83E+006.60E+003.39E+004.60E-011.03E+01
3 3.34E+001.61E+003.14E+001.93E+002.60E-015.84E+005.87E+002.83E+006.60E+003.39E+004.60E-011.03E+01
4 3.34E+001.61E+003.14E+001.93E+002.60E-015.84E+005.87E+002.83E+006.60E+003.39E+004.60E-011.03E+01
5 2.54E+001.20E+002.65E+001.25E+001.10E-012.89E+004.53E+002.14E+004.95E+002.24E+001.90E-015.16E+00
6 2.54E+001.20E+002.65E+001.25E+001.10E-012.89E+004.53E+002.14E+004.95E+002.24E+001.90E-015.16E+00
7 2.54E+001.20E+002.65E+001.25E+001.10E-012.89E+004.53E+002.14E+004.95E+002.24E+001.90E-015.16E+00
8 2.54E+001.20E+002.65E+001.25E+001.10E-012.89E+004.53E+002.14E+004.95E+002.24E+001.90E-015.16E+00
9 2.54E+001.20E+002.65E+001.25E+001.10E-012.89E+004.53E+002.14E+004.95E+002.24E+001.90E-015.16E+00
10 2.54E+001.20E+002.65E+001.25E+001.10E-012.89E+004.53E+002.14E+004.95E+002.24E+001.90E-015.16E+00
11 2.54E+001.20E+002.65E+001.25E+001.10E-012.89E+004.53E+002.14E+004.95E+002.24E+001.90E-015.16E+00
12 1.03E+004.90E-011.60E+005.10E-014.00E-021.18E+001.87E+008.90E-013.05E+009.30E-018.00E-022.13E+00
13 1.03E+004.90E-011.60E+005.10E-014.00E-021.18E+001.87E+008.90E-013.05E+009.30E-018.00E-022.13E+00
14 1.03E+004.90E-011.60E+005.10E-014.00E-021.18E+001.87E+008.90E-013.05E+009.30E-018.00E-022.13E+00
15 1.03E+004.90E-011.60E+005.10E-014.00E-021.18E+001.87E+008.90E-013.05E+009.30E-018.00E-022.13E+00
16 1.03E+004.90E-011.60E+005.10E-014.00E-021.18E+001.87E+008.90E-013.05E+009.30E-018.00E-022.13E+00
17 1.26E+006.00E-011.18E+006.90E-019.00E-021.27E+002.36E+001.12E+002.35E+001.29E+001.80E-012.38E+00
18 1.35E+006.40E-011.25E+007.40E-011.00E-011.36E+002.34E+001.12E+002.36E+001.28E+001.80E-012.37E+00
Top 2 applied?Yes Where top 2 method is applied, two produce categories use 90th percentile rates, while the remainder use the mean.Produce categories varyon a chemical-by-chemical basis.Where top 2 method is not used, allproduce categories for all chemicals assume 90th percentile rates.
Building Small terraced house
Building footprint (m2)
Living space air exchange rate (hr-1)
Living space height (above ground, m)
Living space height (belowground, m)
Pressure difference (soil to enclosed space, Pa)
Foundationthickness (m)
Floor crack area (cm2)
Dust loading factor (μg m-3)
Soil Sandy loam
Porosity, Total(cm3 cm-3)
Porosity, Air-Filled (cm3 cm-3)
2.80E+015.30E-01 5.00E-012.00E-01
4.80E+003.30E-01
Porosity, Water-Filled (cm3 cm-3)
0.00E+001.20E-01
4.23E+02
Residualsoilwater content (cm3 cm-3)
Saturated hydraulic conductivity(cm s-1)
3.10E+003.56E-03 1.50E-013.20E-01 1.21E+00
vanGenuchtenshape parameter m (dimensionless) Bulk density(g cm-3)
5.00E+01 Threshold value of wind speed at 10m (m s-1) 7.20E+00
Ambient soiltemperature (K)
Soil pH
Soil Organic Matter content (%) Fractionof organic carbon(g g-1) 16-May-25
Effective totalfluid saturation(unitless)
Intrinsic soilpermeability(cm2)
Relative soil air permeability(unitless)
Effective air permeability(cm2)
Empiricalfunction(Fx) for dust model(dimensionless) 1.22E+00 2.83E+02 7.00E+00 6.00E+00 3.48E-02 5.12E-01 4.75E-08 6.42E-01 3.05E-08
Soil - Vapour ModelAir Dispersion Model
Soil gas ingress rate (cm3 s -1) Depthto top of source (no building) (cm)
Building ventilationrate (cm3 s -1)
Averaging time surface emissions (yr) 6
Finite vapour source model? No Thickness of contaminated layer (cm)
Soil - Plant Model
Dryweight conversion factor
Air dispersionfactor at height of 0.8m *
Air dispersionfactor at height of 1.6m * 16-May-25
Homegrown fraction
Soilloading factor
Preparation correction factor
0.0960.050.331.00E-032.00E-01
0.1030.060.401.00E-031.00E+00
Tuber vegetables
Herbaceous fruit
Shrub fruit Green vegetables Root vegetables
Tree fruit
0.2100.020.131.00E-031.00E+00
0.0580.060.401.00E-036.00E-01
0.1660.090.601.00E-036.00E-01
0.1570.040.271.00E-036.00E-01
Gardener type None


FSA commentary on Occupation Road allotment produce PFAS results – PRELIMINARY as of 11/02/2025
Introduction
The FSA has considered the results of the testing of produce samples collected from the allotments. We have considered whether concentrations of PFOA and other PFAS are elevated by comparing to these to the 95th percentile concentrations reported in the relevant food grouping by EFSA (2020).
We have considered in general the implications of the results for increasing dietary exposure to the sum of PFOA, PFOS, PFNA and PFHxS by regularly eating produce grown on the allotments. In addition, for the relatively high results we have assessed dietary intakes by using chronic consumption data for the commodity in question for high level consumers (97.5th percentile). In doing so we have taken into account background intakes of PFAS by summing with mean total dietary intakes assessed by EFSA (2020). We have assessed intakes both for adults and toddlers, as small children consume greater amounts of food in general than adults in relation to their body weight so may have higher estimated intakes per kg bodyweight. Dietary intakes have been primarily compared with the tolerable weekly intake (TWI) established by EFSA (2020).
Results
Results in µg/kg, as summarised:
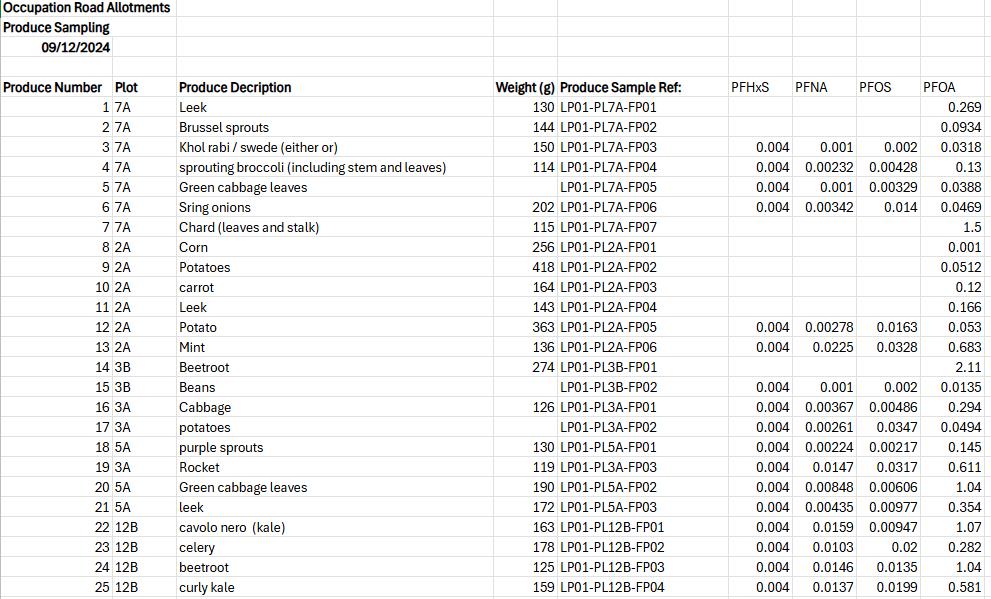
In considering the results it should be noted that due to the nature of the sampling, only small numbers of samples of produce have been analysed, and these were limited to the types of vegetables available at the time of sampling. In addition, while loose soil was brushed off when collecting samples, and adhering soil was removed by wiping at the laboratory, no further preparation of the samples was undertaken at the laboratory due to the condition of the samples, and it is possible that samples which included some roots (e.g. beetroot) may have included some soil, which may have significantly contributed to the measured concentrations Samples which were of purely leafy parts (e.g. cabbage) should not have been contaminated with soil.
Results are highest for PFOA of the 4 PFAS tested, as expected from the initial soil testing results, in which only PFOA was present at elevated levels.
EFSA (2020) reported mean concentrations of PFOA in vegetables and vegetable products as 0.006-0.16 µg/kg (LB-UB1). The occurrence data were limited by high LOQs for the analyses, and 86% of the results were left censored. For exposures to PFAS in general, EFSA considered that they were likely to be closer to LB estimates than UB estimates. The 95th percentile concentration of PFOA in vegetables and vegetable products reported by EFSA was 0.0124 – 1 µg/kg All but one of the PFOA results from the allotment produce sampled are greater than the LB 95th percentile concentration reported in vegetables and vegetable products and a number are higher than the UB 95th percentile concentration. In conclusion, the results show elevated concentrations of PFOA in vegetables.
EFSA considered starchy roots and tubers separately. The mean concentration of PFOA in starch roots and tubers was 0.004-0.613 µg/kg. The 95th percentile concentration was listed as 0-1 µg/kg. Considering the results for the allotment produce for potatoes and beetroot, it is less clear how the results for potatoes compare to background levels. However, the results for beetroot both exceed the UB 95th percentile level. While the results for beetroot could potentially have been affected to some extent by the presence of soil on roots, this indicates elevated concentrations of PFOA in starchy roots.
The allotment produce tested do not include any fruit so it is unclear whether levels of PFOA are elevated in fruit, though this may be expected given the results for vegetables.
The results for PFHxS, PFNA and PFOS are all within both the LB-UB ranges for the mean and 95th percentile concentrations reported by EFSA, and it is not clear whether there are any elevations in the concentrations of these. However, based on the previous preliminary soil testing, no increased concentrations are expected of these other PFAS
EFSA (2020) indicated that, in adults, PFOA contributed about 21% of total dietary intakes of the sum of PFOA, PFOS, PFNA and PFHxS (based on mean LB intakes across different dietary surveys). Using data for UK adults, PFOA from fruit and fruit products, starchy roots and tubers
1 LB = lower bound (assumes concentrations below the limit of detection or limit of quantification are zero). UB = upper bound (assumes concentrations below the limit of detection or limit of quantification are at the limit of detection or limit of quantification)
and vegetables and vegetable products contributed about 18% of total PFOA intake (based on mean LB intakes).
The FSA previously noted that this implies that if the intakes of PFOA from fruits and vegetables (including starch roots and tubers) are increased 10-fold as a result of the soil contamination, the total dietary intake of the sum of PFOA, PFOS, PFNA and PFHxS (the 4 PFAS for which EFSA’s tolerable weekly intake (TWI) applies) may be increased by about 34%. If the intakes from fruits and vegetables are increased by 27 times (highest soil concentration of 18.9 µg/kg divided by mean soil concentration reported in the Netherlands of 0.7 µg/kg (Wintersen et al., 2020), the total dietary intake of the sum of the 4 PFAS may be increased by about 98%. Therefore, approximately, it could be estimated that intakes of PFAS will be increased by a proportion, up to a maximum of 2-fold in the average diet. It is likely to be less than this in reality as it is unlikely that all vegetables and fruit consumed, on a long term basis, will be grown on the allotments, and the average soil concentration of PFOA was around half the maximum concentration
The results of the allotment produce testing appear to be broadly in line with anticipated increases in PFOA concentrations in the region of 1 order of magnitude, indicating that regular consumption of significant amounts of produce grown on the allotments in likely to increase the total dietary intake of PFAS (sum of PFOA, PFOS, PFNA and PFHxS) by a proportion.
Exposure assessment for individual commodities and plots
The vegetables with the highest measured concentrations of PFOA are chard, beetroot, cabbage and cavolo nero. Consumption data for these commodities have been extracted from years 1-11 of the rolling National Diet and Nutrition Survey (NDNS) in order to assess intakes of PFAS in high level consumers of these commodities. Chronic consumption data for adults and toddlers at the 97.5th percentile have been used.
For plot 7a, the highest concentration of PFOA was in chard at 1.5 µg/kg. From the certificate of analysis, this sample also contained quantifiable levels of PFNA and PFOS, and the sum of 4 PFAS (PFOA, PFOS, PFNA + PFHxS) was 1.51 µg/kg (lower bound approach taken for PFHxS).
Estimated intakes of PFAS 4 at a concentration of 1.51 µg/kg in chard
Age group
97.5th percentile consumption (g/kg bw/day)
97.5th %ile intake of PFAS 4 (ng/kg bw/day) % of daily equivalent of
Intakes from high consumption of kale would be within EFSA’s TWI. However, EFSA (2020) estimated mean background intakes to be 2.44-63.86 (LB-UB) ng/kg bw/day in UK toddlers, which is 387-10,140% of the daily equivalent of the TWI, and 0.62-13.77 (LB-UB) ng/kg bw/day in UK adults, which is 98-2190% of the daily equivalent of the TWI. EFSA considered that true exposure levels would be closer to LB estimated than UB estimates as their LB exposure estimates were more consistent with reported blood serum levels in European populations. Summing the 97.5th percentile intakes from consumption of this chard with the mean LB total dietary exposure estimates by EFSA (to reflect the background diet), total intakes would be about 450% of the TWI in toddlers and about 190% of the TWI in adults, and thus exceed the TWI by several fold, but with most of this intake being from the background diet
For plot 2a, measured concentrations of PFOA are lower and these results have not been considered further at this stage.
For plot 3b, the highest concentration of PFOA was in beetroot at 2.11 µg/kg. This sample also contained quantifiable levels of PFHxS, PFNA and PFOS and the sum of 4 PFAS was 2.14 µg/kg
Estimated intakes of PFAS 4 at a concentration of 2.14 µg/kg in beetroot
Age group 97.5th percentile consumption (g/kg bw/day) 97.5th %ile intake of PFAS 4 (ng/kg bw/day)
(1.5-3 yrs)
TWI
Summing the 97.5th percentile intakes from consumption of this beetroot with the mean LB exposure estimates by EFSA for the background diet, total intakes would be about 800% of the TWI in toddlers and about 350% of the TWI in adults, and thus exceed the TWI by multiple fold, though up to half of the intake would be from the background diet.
For plot 3a, measured concentrations of PFOA are lower and these results have not been considered further at this stage.
For plot 5a, the highest concentration of PFOA was in green cabbage leaves at 1.04 µg/kg. This sample also contained quantifiable levels of PFNA and PFOS and the sum of 4 PFAS was 1.05 µg/kg.
Estimated intakes of PFAS 4 at a concentration of 1.05 µg/kg in cabbage
Age group
97.5th percentile consumption (g/kg bw/day)
97.5th %ile intake of PFAS 4 (ng/kg bw/day)
Summing the 97.5th percentile intakes from consumption of this cabbage with the mean LB exposure estimates by EFSA for the background diet, total intakes would be about 670% of the TWI in toddlers and about 240% of the TWI in adults, and thus exceed the TWI multiple-fold in young children and more modestly in adults
For plot 12b, relatively high concentrations of PFOA were found in two commodities, cavolo nero and beetroot.
The cavolo nero contained 1.07 µg/kg PFOA. It also contained measurable concentrations of PFNA and PFOS and the sum of 4 PFAS was 1.10 µg/kg.
Estimated intakes of PFAS 4 at a concentration of 1.10 µg/kg in kale
Age group
97.5th percentile consumption (g/kg bw/day)
97.5th %ile intake of PFAS 4 (ng/kg bw/day)
*There were only 6 consumers in the survey so this consumption figure should be treated with caution
Summing the 97.5th percentile intakes from consumption of this kale with the mean LB exposure estimates by EFSA for the background diet, total intakes would be about 450% of the TWI in toddlers and about 250% of the TWI in adults, and thus the TWI would be exceeded several-fold.
The beetroot contained 1.04 µg/kg PFOA. It also contained measurable concentrations of PFNA and PFOS and the sum of 4 PFAS was 1.07 µg/kg.
Estimated intakes of PFAS 4 at a concentration of 1.07 µg/kg in beetroot
Age group
97.5th percentile consumption (g/kg bw/day)
97.5th %ile intake of PFAS 4 (ng/kg bw/day) % of daily equivalent of EFSA TWI
Summing the 97.5th percentile intakes from consumption of this kale with the mean LB exposure estimates by EFSA for the background diet, total intakes would be about 590% of the TWI in toddlers and about 230% of the TWI in adults, and thus the TWI would be exceeded by severalfold.
As a potential, indicative worst-case scenario, it could be assumed that consumers would be 97.5th percentile consumers of both the kale and beetroot from this plot. In this case, intakes in toddlers and adults would be around 280% of the TWI, not taking into account dietary intakes from other sources. For an adult, the consumption data are equivalent to consuming around 50 g of beetroot + 74 g of kale each day, or 124 g/day total produce from the allotment, and thus, including the fact that this is based on two relatively high analytical results, this might be indicative of a reasonable worst case long term intake from regularly eating green and root vegetables from the allotments. If mean LB exposure estimates by EFSA for the background diet were added to this exposure assessment, the total exposure would be about 660% of the TWI in toddlers and about 380% of the TWI in adults
While potential dietary intakes up to 8 times the EFSA TWI in toddlers and 3.5 times the EFSA TWI in adults have been estimated above, EFSA estimated total dietary intakes at the 95th percentile in UK toddlers and UK adults based on LB data to be approximately 17 times the TWI and 3 times the TWI, respectively. Therefore, the estimated intakes above are within estimated ranges of total dietary intake for UK consumers, at least for toddlers. The estimated intakes may also be conservative since it is possible that the beetroot samples were contaminated by some soil adhering to roots. This indicates that total dietary intakes, and risks, of consumers of allotment produce will depend significantly on their intakes of PFAS from other dietary sources, which is a significant area of uncertainty.
In conclusion:
- While the sampling was limited, and some of the samples may have contained some soil, adhered to roots, the results of the allotment produce testing show elevated concentrations of PFOA in green and root vegetables compared to expected background levels, while the situation is less clear for tubers and no data are available for fruit.
- The FSA’s current view remains that people who regularly eat large amounts of vegetables and fruits grown in the allotments or in gardens are likely to be increasing their exposure to PFAS, whereas occasional or modest consumption are unlikely to greatly affect long-term background intakes.
- Considering the results individually, most would not be of concern in themselves, even in high level consumers of those commodities, though they would contribute to the increasing total dietary exposure to PFAS, which already exceeds the EFSA TWI.
- For four of the results (both samples of beetroot, one of cabbage and the single sample of kale), intakes would exceed the EFSA TWI in high (97.5th percentile) consumers of these commodities alone
- On an indicative basis, there is the potential for some regular consumers of large proportions of green and root vegetables from the allotments to exceed the EFSA TWI by in the region of up to 3-4 times, increasing to 7-8 times when taking into account mean background dietary levels. Intakes in this region were estimated for high consumption of beetroot from one plot, high consumption of cabbage from another plot, and high consumption of both beetroot and kale from another plot.
While the EFSA TWI is likely to be exceeded, the potential health risks depend on which healthbased guidance value (HBGV) is applied to risk assessments The Committee on Toxicity (COT) had some reservations regarding the EFSA TWI, particularly whether changes seen in epidemiological studies were clinically relevant, and it has established a working group to evaluate PFAS and consider whether it can establish one or more HBGVs for PFAS. In the meantime, the COT advises that where risk assessments are undertaken for the potential risks associated with exposure to PFAS, consideration should be made of the various available HBGVs, recognising the uncertainties with respect to the critical effects and modelling approaches adopted (COT, 2023). Dietary intakes of PFOA do not exceed most HBGVs which have been established previously for PFOA based on toxicology data in laboratory animals, whereas exceedances are seen of HBGVs established by EFSA and the US Environmental Protection Agency (EPA) based on epidemiological data.
Based on EFSA’s evaluations of PFOA and PFAS, potential health effects include a reduction in the immune response to vaccinations, increased serum cholesterol, increased serum ALT (which is a sensitive marker of liver damage) and small decreases in birthweight.
Key uncertainties
- Any other contaminated dietary sources which could contribute, e.g. eggs from backyard layers
- Background dietary intakes from other sources
- The appropriateness of EFSA’s TWI and other established HBGVs for PFOA and PFAS
Barry Maycock
Chemical Risk Assessment
Food Standards Agency 11/2/2025
References
COT (2023). Interim position paper on per- and polyfluoroalkyl substances. COT position paper June 2023. Committee on Toxicity of Chemicals in Food, Consumer Products and the Environment. Available at https://cot.food.gov.uk/Interim%20Position%20Paper%20on%20Per%20and%20Polyfluoroalkyl%20Substances
EFSA (2020). Scientific Opinion on the risk to human health related to the presence of perfluoroalkyl substances in food. EFSA Journal 2020;18(9):6223, 391 pp. https://doi.org/10.2903/j.efsa.2020.6223
Wintersen A, Spijker J, van Breemen P, van Wijnen (2020). Achtergrondwaarden perfluoralkylstoffen (PFAS) in de Nederlandse landbodem Rijksinstituut voor Volksgezondheid en Milieu. RIVM-briefrapport 2020-0100. Downloaded from https://www.rivm.nl/publicaties/achtergrondwaarden-perfluoralkylstoffen-pfas-innederlandse-landbodem