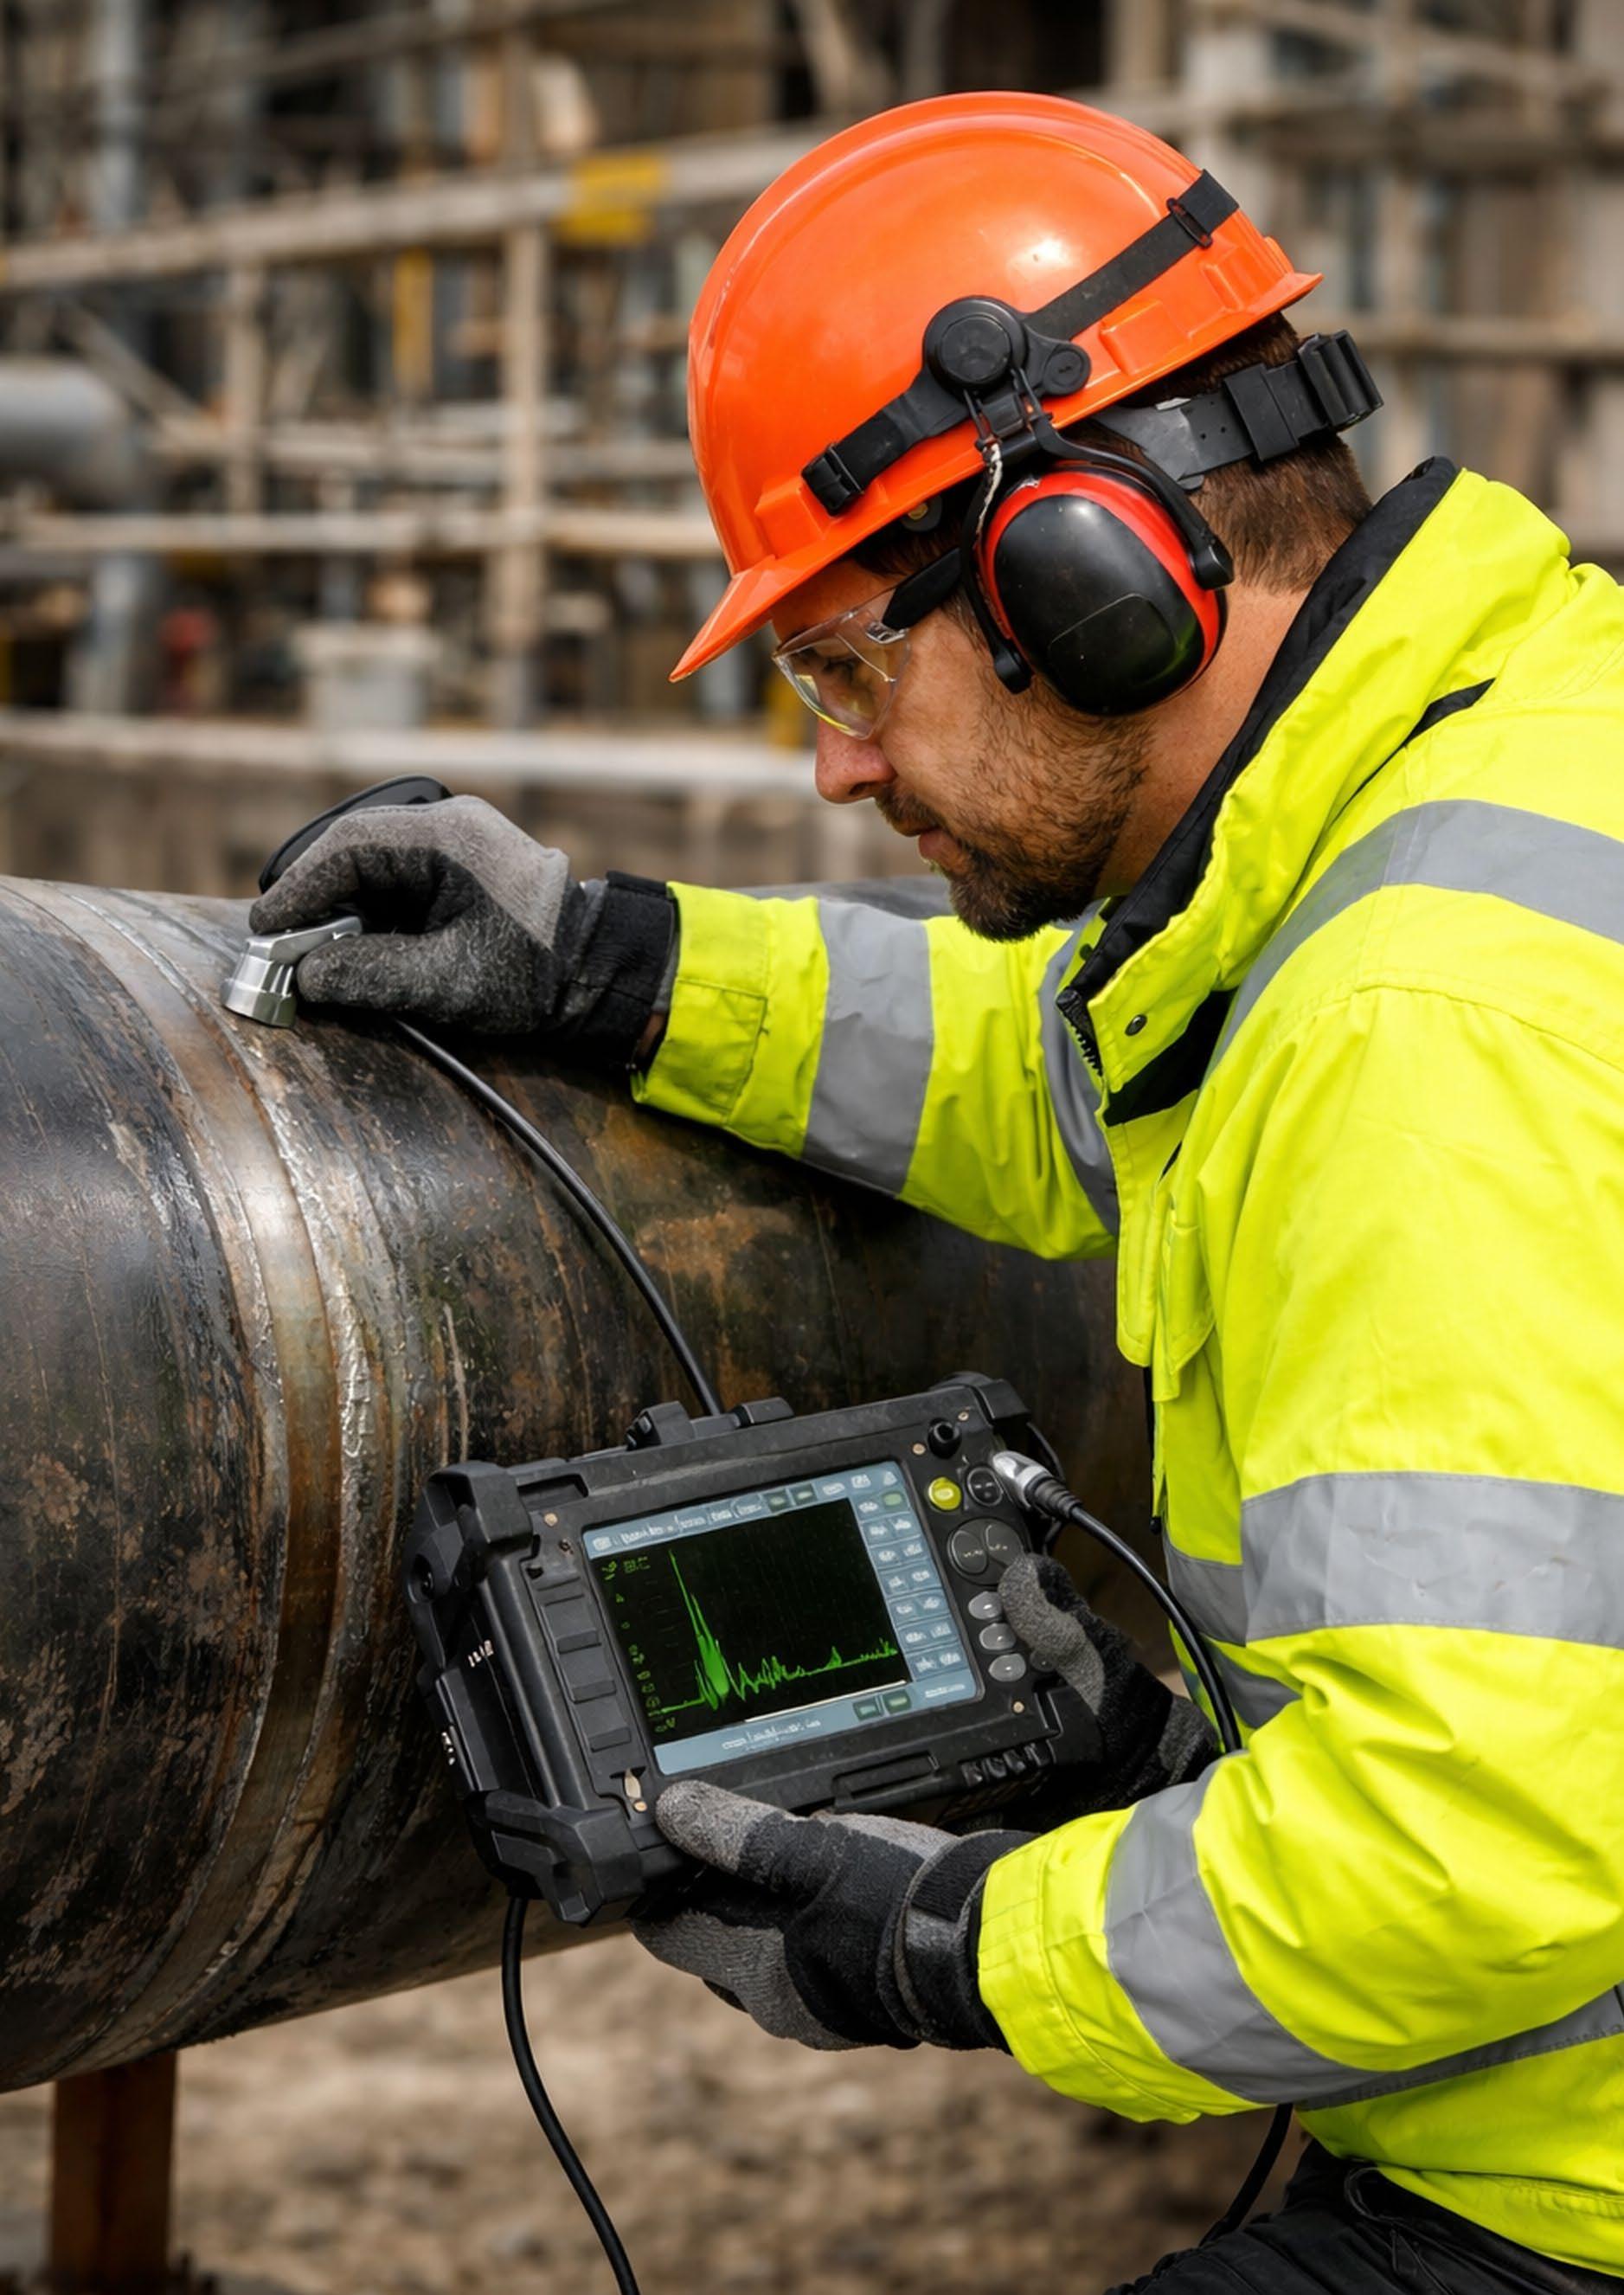
INDUSTRIAL
THE OFFICIAL JOURNAL OF THE AUSTRALIAN INSTITUTE FOR NON-DESTRUCTIVE TESTING
RADIOGRAPHY ULTRASONICS EDDY CURRENT PENETRANT MAGNETIC PARTICLE VIBRATION ANALYSIS LUBRICATION ANALYSIS THERMOGRAPHY ACOUSTIC EMISSION
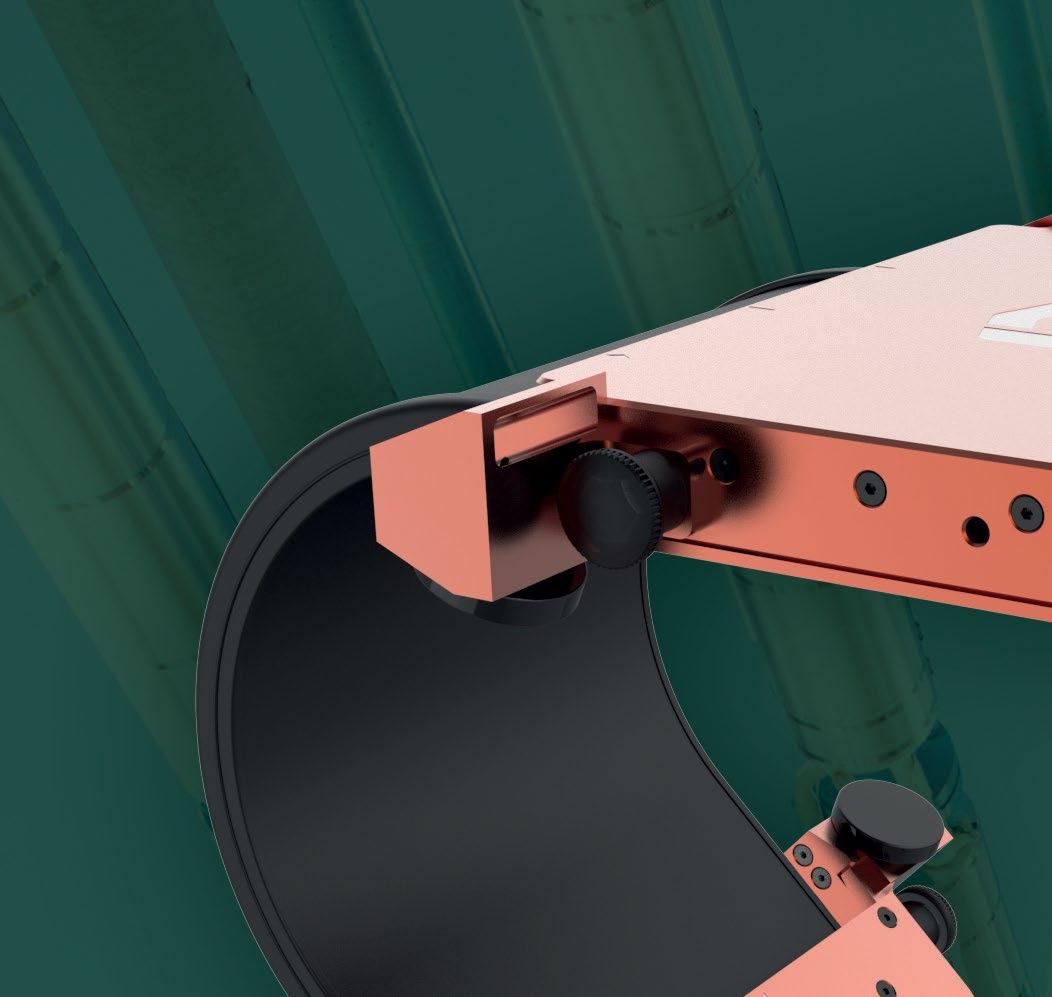
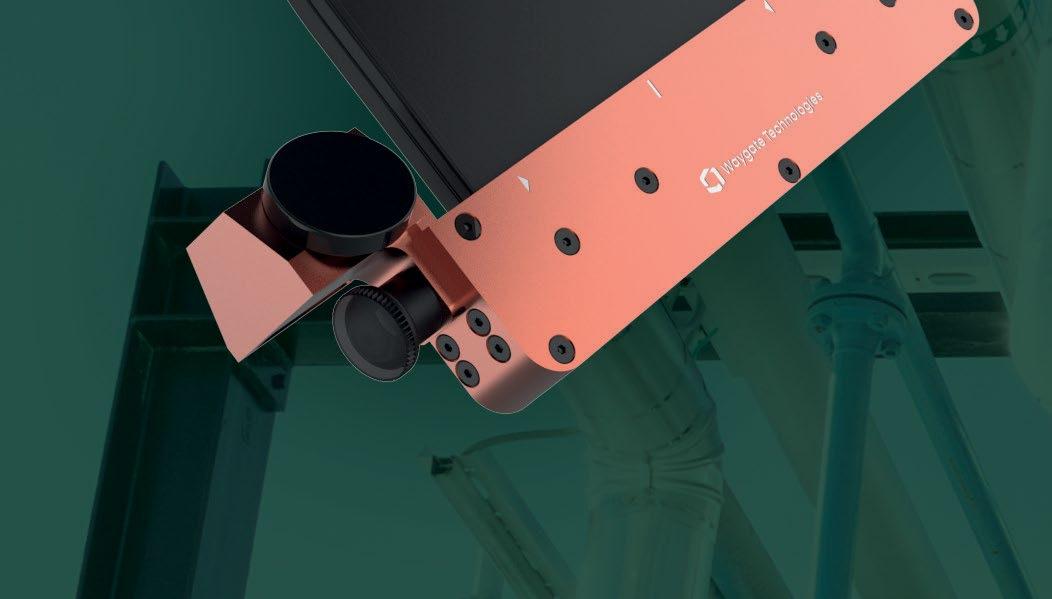



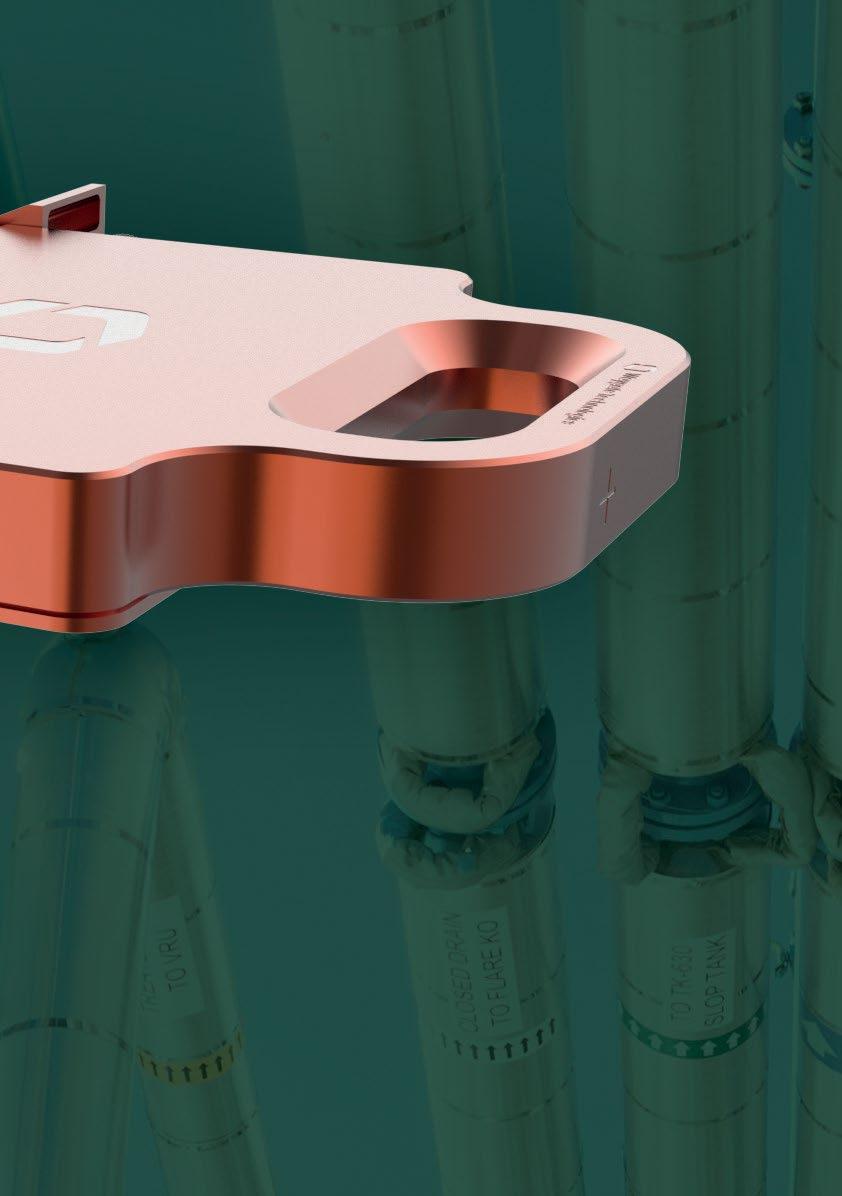
DXR Flex 1025/1043 bendable
detectors
Dedicated to industrial use, this customer driven design of the next generation of DXR detectors combines image quality with rugged reliability, perfectly matching the criteria for the inspection of a wide range of weldments.
The new DXR Flex is a perfect fit for a wide range of weld related applications:
• pipeline weld inspection
• fabrication shop inspections (pipe spool, vessels, tanks, etc.)
• weld inspection (piping)
• crack detection
to know more? Scan this code or go to waygate-tech.com
President's Message
I’ve spent a fair bit of time lately away from the laptop. Out on site at refineries, offices, and catching up with teams across the country. I also got down to Melbourne in mid-March for the NATA AAC meeting.

Getting out of the office is always a good reset. You hear a very different version of what’s happening when you’re standing on site having a coffee versus reading reports or sitting in meetings. The reality on the ground is usually clearer, and a bit less polished.
There is some uncertainty out there, around technology, workforce, and where the investment is actually going. You can feel it talking to crews in Western Australia, Queensland, and right across the country. Everyone is trying to work out what that means for their roles and the future of the industry.
But I don’t see this as the industry going backwards. If anything, it feels like we’re being pushed to step up. For a long time, a lot of what we’ve done has been tied to hours, turning up, doing the work, moving on. That model is starting to shift.
More and more, I'm seeing asset owners look for something different. Not just extra hands, but partners they trust to contribute to how their assets are managed over the long term, with earlier involvement, input into planning, and accountability for outcomes rather than just activity.
We’re starting to see that play out in longer-term agreements and closer working relationships. It’s a better position for the industry, but it also raises the bar. It’s no longer enough to just be good at the task in front of you. There’s an expectation that you understand the bigger picture and can add value beyond the immediate job.
That comes down to people, and frankly, to leadership. The ones who will do well in this shift are those who can operate comfortably on site but also think a level higher.
A good example came out of a recent client workshop. We talked about moving away from just ticking a box because that's how we've always done it. The real value came when the team started questioning the why, connecting their hands-on work to the actual risk the asset owner is trying to manage. It’s that ability to see the bigger picture while you’ve still got your boots in the dirt.
All of these conversations are leading into the National Summit in Newcastle in a couple of weeks. There's more value in getting the right people in a room and having a straight conversation about where things are heading than trying to piece it together from the outside.
If you’re in the industry, whether you’re early in your career or have been around a while, it’s worth being in the room.
Sam Hallifax President, AINDT Global SME & Business Improvement Manager, EnerMech
Sam Hallifax
President: Mr Sam Hallifax
Immediate Past President: Mr Joshua Morris
Vice President: Mr Ian Hogarth
Treasurer: Mr Damien Clarke
Secretariat Liaison: Mr Peter Milligan
CEO: Mr Stuart Norman
President Mr Frank Galea
Vice President Mr Sam Hallifax
Treasurer Mr Paul Ashby
Secretary
President
Production Sally Wood Design Alarna O’Connell
AINDT
PO Box 52, Parkville Vic 3052
P: (03) 9486 9267
www.aindt.com.au
E: federaloffice@aindt.com.au
ADVERTISING
AINDT Federal Office
P: (03) 9486 9267
E: sally@wordly.com.au
INSTRUCTIONS TO AUTHORS OF TECHNICAL ARTICLES
Manuscripts should be submitted in electronic form:
1. in word
2. typed with single spacing
3. with figures as tif or jpeg files at better than 300dpi
Manuscripts should include:
1. symbols and abbreviations conforming to recognised standards; metric units (SI)
2. references listed, after the text, in the order in which they occur in the paper
3. references indicated in the text by arabic numerals in square brackets
4. tables and figures numbered separately but consecutively with Arabic numerals and brief, descriptive titles
5. a reference in the text to all tables and figures
6. graphs and diagrams made with lines of sufficient thickness to reproduce well
7. titles and address of authors
Procedure for submission of manuscripts:
1. articles should be sent to: journal@aindt.com.au
2. manuscripts will be submitted to referees who will remain anonymous
3. reprints of each paper will be supplied free to the author
Published by:
The Australian Institute for Non-Destructive Testing, PO Box 52, Parkville, Vic 3052 Australia
ISSN: 2203-2940
A Message from the CEO

Stuart Norman
The recent closure of a major NDT training provider in Western Australia has caused real concern for technicians and employers across the country. While this wasn’t an AINDT body, we know that losing access to training puts livelihoods and project schedules at risk.
To help settle that uncertainty, the AINDT is offering free certification transfers for those affected, with a commitment to process complete applications within 10 working days. Our priority is making sure no one is left stranded and that the WA workforce keeps moving. We’ve been on the ground in Perth meeting with major employers and our own training bodies to ensure that training and certification remain seamless during this transition.
The Australian Institute for Non-Destructive Testing (AINDT) has also taken proactive steps to address these challenges and has engaged with key stakeholders, including NATA, to confirm that all necessary measures are being implemented to support the sector.
The AINDT has met with several major NDT employers in Perth, alongside AINDT AQBs, to ensure continuity of training and certification services. AQBs have confirmed their capacity and willingness to respond to immediate training requirements and work collaboratively with industry to address short-term needs.
NDT Service Providers
While not all service providers currently utilise AINDT certification for their workforce, AINDT, as the peak body for non-destructive testing in Australia, remains committed to representing and supporting the entire industry.
AINDT will continue to take all necessary actions to ensure Australia maintains a pipeline of well-trained, competent, and appropriately certified NDT personnel. This commitment is fundamental to maintaining confidence in inspection practices and supporting the integrity of critical infrastructure across the country.
Certified Technicians
The Australian Institute for Non-Destructive Testing (AINDT) is actively supporting the local NDT industry during the current period of transition and uncertainty by providing a clear and accessible pathway for certification continuity.
To ensure technicians are not disadvantaged, AINDT is offering free certification transfers from other recognised ISO 9712:2021 certification schemes for individuals who are due to renew or recertify before 30 June 2027.
This initiative is designed to maintain workforce capability, minimise disruption to employers, and uphold confidence in the competence and certification of NDT personnel across Australia and the broader region.
AINDT’s certification scheme ensures that all transferred certifications maintain full international recognition and technical integrity. To further support industry needs, AINDT is currently processing complete applications within 10 working days, enabling a rapid and efficient transition for affected technicians. This streamlined approach reflects AINDT’s commitment to service delivery, certification integrity, and the ongoing support of industry during this period.
AINDT Assisting Industry
The AINDT is more than a certification body; we are the peak body for the NDT and Condition Monitoring industries in Australia. In this role, we are committed to both upholding the integrity of its certification schemes and actively representing the broader interests of industry in Australia. While maintaining a robust, internationally aligned certification framework remains a core priority, AINDT is equally focused on ensuring the nations sector is effectively supported, promoted, and positioned for future growth.
This commitment is reflected in the inclusion of Advocacy as a formal pillar within the AINDT 2026–2029 Strategic Plan. Through this, AINDT will continue to engage with industry, government, and key stakeholders to strengthen recognition of NDT and Condition Monitoring as critical to asset integrity, public safety, and national capability.
AINDT Summit 2026
The AINDT Summit 2026, held 20–22 April in Newcastle, is Australia’s leading event for non-destructive testing (NDT) and condition monitoring (CM) professionals. Bringing together industry leaders, technicians, and engineers, the Summit offers a focused platform to explore the latest developments in inspection, asset integrity, and emerging technologies.
The technical program spans NDT, inspection, and CM, featuring high-quality presentations, panel discussions, and practical insights aligned to real-world industry challenges. Delegates will gain exposure to advancements in digital inspection, data-driven decision making, and applications across defence, energy, infrastructure, and manufacturing.
In addition to the technical content, the Summit provides strong networking opportunities with peers, certification experts, and suppliers. The exhibition and social functions, including the Welcome Reception and Gala Dinner, support meaningful industry engagement.
AINDT Summit 2026 is an essential opportunity to strengthen capability, build connections, and stay at the forefront of the NDT and CM industries.
Fraunhofer – Edith Cowan University Lab Launch
I had the pleasure of attending the launch of the Fraunhofer–Edith Cowan University joint laboratory, which represents a meaningful step forward for non-destructive
testing (NDT) capability in Australia. The partnership with Fraunhofer IKTS brings a proven, industry-focused research model into the local context—one that is directly aligned to developing and deploying practical inspection solutions.
For the NDT sector, this is a significant shift, creating a pathway to develop, validate, and implement advanced inspection technologies domestically rather than relying on international capability. Positioned within Edith Cowan University, the lab provides a structured environment where industry and researchers can collaborate on realworld inspection challenges.
From an NDT perspective, the lab’s focus on advanced materials, hydrogen systems, and high-performance infrastructure is particularly relevant as inspection demands become more complex. The ability to test and refine NDT methods alongside material and asset development ensures inspection capability keeps pace with industry evolution
Stuart Norman Chief Executive Officer, AINDT
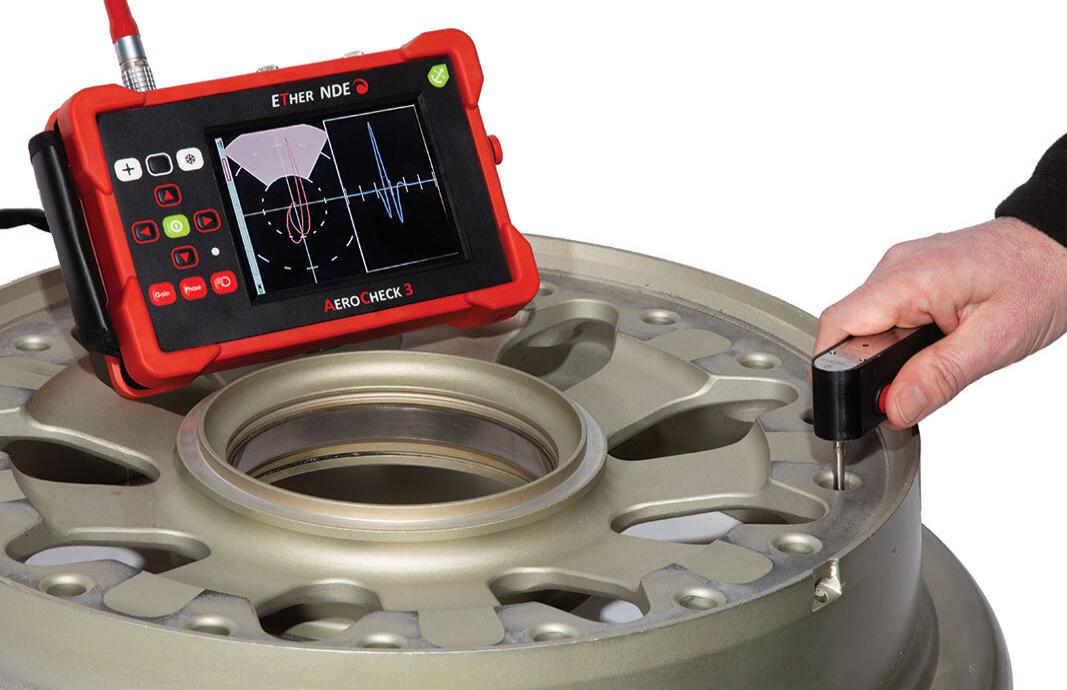

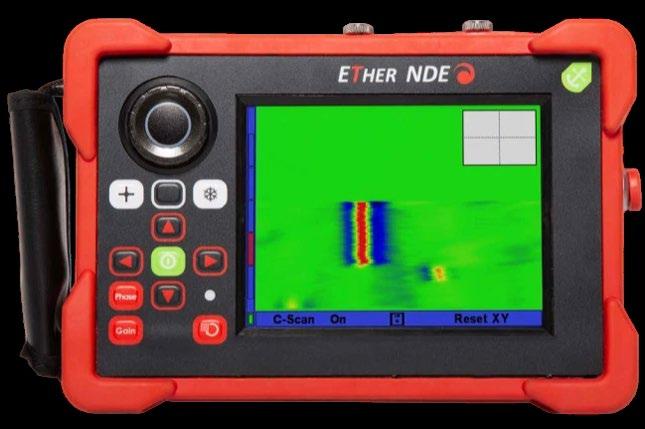


•Advanced features: Conductivity, Auto Mix, C-Scan, Loop, Guides & Trace.
•3 Year Warranty
•Lightweight, Ergonomic, Rugged design
•Thumbwheel option
•7 Hour battery life, fast 2 5 hour charging time
Designed to meet IP64, IP68 rated connectors






Last Chance to Register: AINDT Summit 2026
If you’ve been waiting for the right time to commit, this is it. The 2026 Summit is shaping up to be our biggest yet, with game-changing speakers, future-focused discussions, and the kind of networking that fuels real opportunity.
The AINDT Summit 2026 will be held in Newcastle, New South Wales, from 20 to 22 April 2026. With the majority of exhibition booths already sold and a strong lineup of sponsors confirmed, momentum is building for what promises to be a standout event for the non-destructive testing (NDT) and condition monitoring (CM) community.
The Summit is designed to bring together key decisionmakers, senior professionals, and technicians from across the NDT and CM fields. Whether you’re a seasoned practitioner or looking to expand your technical knowledge, the program will deliver diverse opportunities for learning, collaboration, and professional growth.
Networking Opportunities
While the educational component is central to the Summit, there will also be plenty of time to network and reconnect with peers. Between sessions, delegates can mingle at Newcastle Town Hall, explore the bustling exhibition space, or join one of several social events planned throughout the three days.
The event will officially commence with a Welcome Reception in the exhibition hall on the Sunday night. On Tuesday night, the Gala Dinner will celebrate excellence in our profession. For those eager to keep the celebrations going, a Gala Dinner After Party will follow at a nearby venue. Expect plenty of networking, music, and sponsor giveaways to carry the camaraderie well into the evening.
Education that Counts
Importantly, attendance supports your professional development and certification pathway. Delegates will receive a Certificate of Attendance confirming professional development hours, which can assist with certification renewals and recertification requirements, including earning points through the Structured Credit System.
The Power of Inspection
This year’s theme, The Power of Inspection, explores the concept of power both as a generative force—driving progress, energy and innovation—and as the detailed insight that inspection provides into the integrity and performance of critical assets.
As part of the program, AINDT invites researchers, practitioners, and innovators to submit original papers showcasing new developments, technologies, or case

Gala Dinner Host: Dave O’Neill
AINDT is pleased to announce that the host for the AINDT Summit 2026 Gala Dinner is Dave’ O’Neill.
Dave O’Neil has been in comedy for over 30 years and is one of Australia’s most recognisable stand-up comics, having performed at over 20 Melbourne International Comedy Festivals. Dave has appeared on numerous Australian television shows including Have You Been Paying Attention?, The Project, Utopia, Talkin’ ‘Bout Your Generation, Spicks & Specks. Dave also stars in Kitty Flanagan’s ABC sitcom Fisk playing Bob Stanley, the inept lawyer. As well as his stand up and television career, Dave is a skilled radio broadcaster.
In 2017 Dave launched his podcast The Debrief with Dave O’Neil – each episode, Dave drives a comedian home from a gig and discusses comedy and their career. Dave is also the co-host of podcasts Somehow Related with Glenn Robbins, and The Junkees with Kitty Flanagan.
studies that advance our industry’s understanding. Delegates will receive a certificate of attendance reflecting professional development hours, which can assist with certification renewals or recertification requirements.
Expert Speakers
The AINDT Summit will once again bring together some of the most respected specialists in the field. This year’s expert presenters represent a diverse cross-section of industry, research and technology, offering valuable insights into the latest advancements shaping the future of NDT.
Just some of our speakers include: Salah Attia (MCS), Nick Elefethroiu (Evident Australia), Frank Galea, Jake
Graham (Iris NDT), Paul Grosser (Level 3 NDT), Chris Howson (QINDT), Brett Hyland (NATA), Simon Krismer (WQMS), Jim Molinaro (FujiFilm), Fahad Mudayeq (SABIC), Nestor Sequera (SN Integrity), Khalid Sheltami (SABIC), Pranay Wadyalkar (OMS Software) and Simon Welding (Red Earth NDT).

Keynote Speaker: Shane Walton, General Manager, University of Ultrasonics
Internationally recognised ultrasonics expert Shane Walton will headline the 2026 Summit with a keynote on the global NDT industry, sharing bold insights into what will make the profession stronger, smarter and more future-ready. He’ll also be delivering a workshop on ‘Total Focusing Method – Phased Array’.
Based in Texas, Shane is General Manager at the University of Ultrasonics, where he trains inspectors and engineers in cutting-edge techniques including Phased Array and Total Focusing Method, and consults across oil and gas, aerospace and power generation, making him the perfect speaker for anyone wanting to stay ahead of what’s next in NDT.

Salah Attia
Technical Director, Machinery Consultation and Services (MCS)
Remote condition monitoring and diagnostics are no longer theoretical. They’re happening now, at scale. At the Summit, Salah Attia will present:
‘Remote Balancing of a 155MW Steam Turbine in Turkey from Australia – Challenges, Diagnostics, and Lessons Learned’.
In this session, Salah will share a real-world case study of remotely balancing a large 155MW steam turbine located in Turkey while working from Australia. The presentation walks through the technical, diagnostic and logistical challenges involved, and how they were successfully overcome.
This presentation will be particularly valuable for vibration analysts, rotating equipment specialists, and those looking to deepen their understanding of realworld balancing applications.

Pranay Wadyalkar Managing Director, OMS Software
Pressure equipment inspection has been part of industry practice for decades, but the way inspection data is captured, transferred and reused often falls short.
At the Summit, Pranay Wadyalkar will present: ‘Power of Pressure Equipment Details for Integrity Monitoring’.
This session examines a common industry challenge: pressure equipment inspections conducted by different inspectors, at different times, often relying on limited historical information.
Pranay will explore how the lack of detailed, structured inspection data impacts long-term integrity monitoring, risk assessment and decision-making. The presentation will highlight why capturing meaningful integrity parameters (not just producing a generic report) is critical to effective pressure equipment management over its lifecycle.
This session will be particularly relevant for inspectors, engineers, asset owners and anyone involved in pressure equipment governance who wants to improve continuity, traceability and inspection outcomes.
Chris Howson Director, Quantum Integrity Non-Destructive Testing (QINDT)
Chris Howson will present ‘What Lies Beneath?’
In high temperature and high-pressure steam raising equipment such as power station boilers, oxide scale formation on the internal surfaces of tubing is an unavoidable byproduct of continuous operation, particularly in elevated temperature zones.
Chris will cover how, while this internal oxidation can sometimes offer protective benefits, over time it contributes to thermal resistance and increasing inefficiencies. As oxide thickness builds, it can obscure the true rate of wall loss, posing significant challenges for accurate ultrasonic thickness measurement

Brett Hyland
Stakeholder Engagement Manager, NATA
Personnel certification has fundamentally reshaped how NDT is practiced, governed and assured in Australia, but that didn’t happen overnight.
Brett Hyland will present: ‘Reflections on Personnel
Certification in Australian NDT Facilities’.
Drawing on first-hand experience as NATA’s NDT Field Manager (2000–2011) and a long-serving member of AINDT’s NDT Certification Board, Brett will reflect on the evolution of personnel certification in Australian laboratories from the early 2000s onward.
This presentation offers valuable historical context and practical insight for laboratory managers, quality professionals, technical authorities and anyone involved in certification, accreditation or compliance.

Nick Eleftheriou Product Manager and Applications Specialist NDT, Evident Industrial
Advanced ultrasonic imaging techniques continue to push the limits of defect detection in challenging materials.
At the AINDT Summit 2026, Nick Eleftheriou will present: ‘Evaluations of Phase Coherence Imaging (PCI) Techniques for CRA’.
This presentation examines how Phase Coherence Imaging (PCI) is extending the capabilities of Full Matrix Capture (FMC) and Total Focusing Method (TFM), particularly in difficult inspection scenarios.
Corporate Registrations
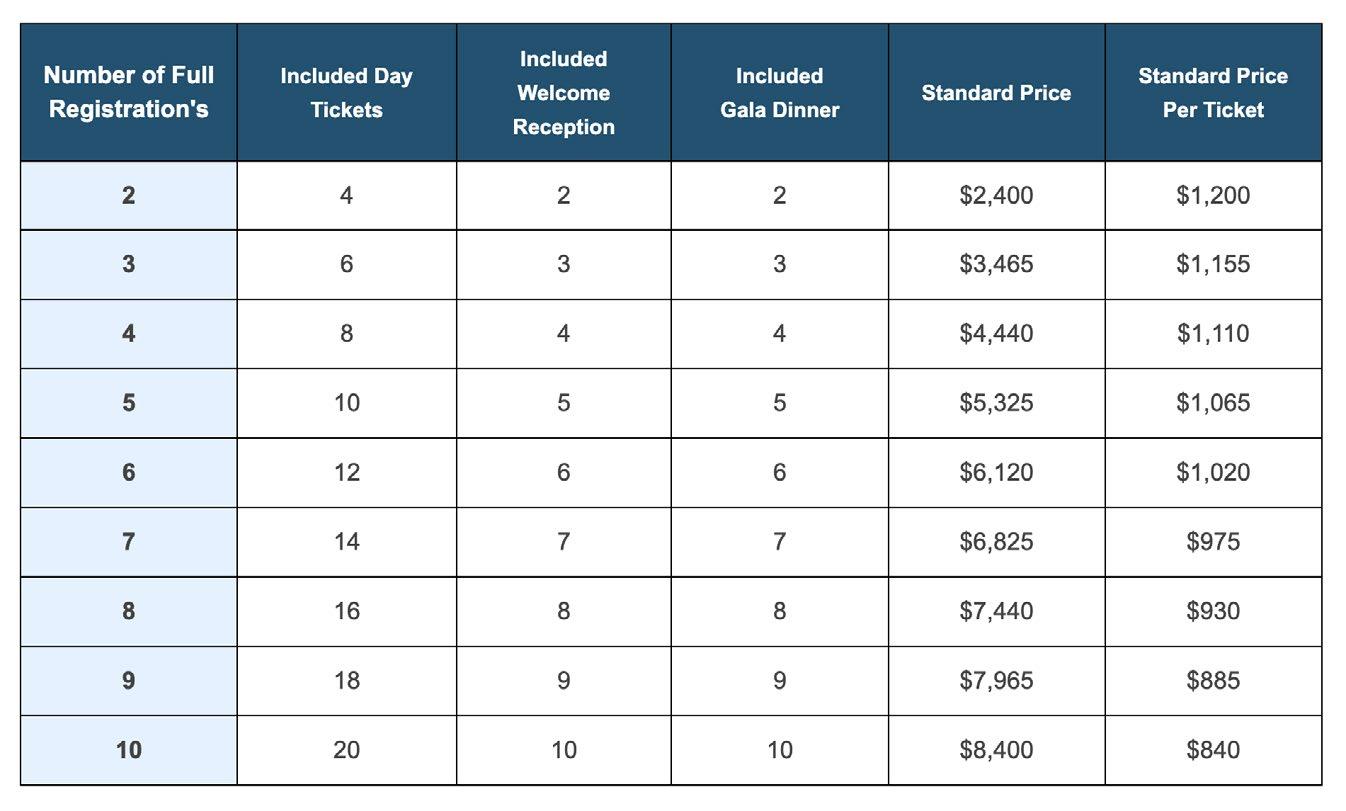
Planning to bring your team? Our Corporate Registration packages offer exceptional value, with significant savings increasing as your group size grows. Each package includes full Summit access, Day Tickets, Welcome Reception passes and Gala Dinner tickets. Unlock big value for your organisation. Pay $7,400 now for 10 people compared to $12,000 for 10 individual early bird registrations. To book corporate registrations, please email federaloffice@aindt.com.au
Register for the Summit now
Join us in Newcastle this April to celebrate The Power of Inspection — three days of innovation, insight, and industry connection that you won’t want to miss To secure your place, visit the Summit website: aindtevents.eventsair.com/ aindt-summit-2025/register
The session will also explain how statistically defined noise coherence thresholds can help separate meaningful indications from background noise, improving confidence in interpretation.
This presentation will be particularly valuable for practitioners working with difficult materials where conventional techniques reach their limits.

Jake Graham
Advanced NDT Technician, Iris NDT
Jake will speak on the topic: ‘Rope Access PAUT of Wind Turbine Blades for the inspection of discontinuities.’
The structural integrity of wind turbine blades is critical to the performance and safety of wind energy systems. The application of Phased Array Ultrasonic Testing (PAUT) using Rope access techniques as a high-resolution, adaptable technique for the inspection of discontinuities such as delamination's, Inclusions, wrinkles and adhesive issues within wind turbine blades.
PAUT enables dynamic beam steering and focusing, allowing for comprehensive coverage of curved and layered composite surfaces. The results highlight PAUT’s advantages in terms of sensitivity, imaging clarity, and inspection speed compared to conventional ultrasonic methods.

AINDT Membership Registrar Update
Membership Value and Benefits: An Ongoing Focus
AINDT membership continues to provide strong professional, technical, and commercial value across individual, company, corporate, supporting and sustaining member categories. Core member benefits include regular access to the AINDT Journal (Industrial Eye), significant discounts on certification, renewal and recertification fees, and access to technical advice and professional development opportunities.
Members also benefit from discounted registration for AINDT conferences, seminars, and workshops, networking opportunities through state branches, and access to the AINDT online membership and certification portal.
Company, corporate, supporting and sustaining members receive additional benefits including advertising opportunities, staff certification support, technical consultation, and direct engagement with AINDT leadership and certification management.
Particularly professional development activities and upcoming major events in 2026.
AINDT Summit 2026 – Newcastle, NSW (April 2026)
Members are reminded of the upcoming AINDT Summit 2026, to be held in Newcastle from 20–22 April 2026. The Summit will bring together NDT, CM, and Inspection professionals from across Australia and internationally for three days of technical presentations, keynote
sessions, panel discussions, exhibitions, and networking opportunities.
AINDT members are eligible for discounted registration and are encouraged to attend, present technical papers, and participate in professional networking throughout the event.
APCNDT 2026 – Honolulu, Hawaii (May 2026) Looking internationally, the 17th Asia-Pacific Conference on Non-Destructive Testing (APCNDT 2026) will be held in Honolulu, Hawaii from 11–15 May 2026. APCNDT is a major biennial international event for the global NDT community and is organised in 2026 by the American Society for Non-destructive Testing (ASNT).
APCNDT 2026 provides a valuable opportunity for AINDT members to engage with international peers, share knowledge, and stay informed on global developments in non-destructive testing and inspection.
I encourage all members to take full advantage of AINDT membership benefits by participating in upcoming national and international events, maintaining certification currency, and engaging with branch and Institute activities. These opportunities continue to strengthen professional capability, industry visibility, and the collective standing of the NDT and CM profession.
Craig Taylor Membership Registrar, AINDT
Member List
April 2026
The AINDT is a national peak body that promotes the professional practices of non-destructive testing and condition monitoring personnel. Our mission is to provide members, industry and the community with independent and professional service in relation to the science and practice of non-destructive testing.
Through the work of our state branches and federal office, AINDT is committed to fostering a community of professionals and organisations dedicated to the fields of non-destructive testing, engineering, and materials and quality testing.
We offer a tiered membership structure, inviting businesses to enhance their professional standing and industry influence by becoming a Company, Corporate, or Sustaining member. Our memberships unlock a suite of benefits, including marketing opportunities, heightened support, streamlined staff certification management, and much more.
AINDT would like to thank the companies below for their valued support.
SUSTAINING MEMBERS
ATTAR
D R May Inspections
EnerMech
SRG Industrial Pty Ltd
Intertek
SUPPORTING MEMBERS
Chevron
COMPANY MEMBERS
NSW
AXT Pty Ltd
Barry Evans Lifting World
Bluescope Steel (Port Kembla)
ENDETEK
HVT Inspection Services
Monnoo Engineering Services Pty
Ltd
NBQC and Inspection Services
NDT Equipment Sales Pty Ltd
Noble Engineering Services
Reliance Hexham
Russell Fraser Sales
Simplifi Nii P/L
SmartChem Industries Pty Ltd
Sonix NDT Pty Ltd
Thermal Imaging Services (AUS)
QLD
Australian Biosecurity Services Pty Ltd
AXS Pty Ltd (Mackay)
CORPORATE MEMBERS
Azure NDT Quality Services Pty Ltd
Bureau Veritas Australia
Chemetall (Australasia) Pty Ltd
Evident Australia Pty Ltd
GFS NDT
Hofco Oilfield Services
IRISNDT
OMS Engineering Pty Ltd
SafeRad SE Asia Pty Ltd
Edith Cowan University – School of Engineering
TR Pty Ltd
Industrial Mining Inpsection Solutions
International Tube Testing Pty Ltd
M-Test Mackay Pty Ltd
Queensland Alumina Limited
Testing Inspection and Calibration Services
VIC / TAS
ATCL
Defence Science and Techology
Organisation (DSTO – Fishermans Bend)
Gippsland NDT Services Pty Ltd
Global Inspections & Engineering Services Pty Ltd
Iron Training and Consulting
iTest NDT
LMATS Pty Ltd (Williamstown)
NATA
OMS Software Pty Ltd
SA / NT
ASC Pty Ltd
Kuzer Technical
SN Integrity
WA
Alliance Solutions Group
Applecross Electrical and Testing Services
Asset Reliability Inspections Pty Ltd
Assurity NDT & Consulting
GoldFields NDT
ICM Training Solutions
MJ Engineering Inspection Services (Welshpool)
J & S Castlehow Electricial Services
Vertech
Weld Integrity
Wood – Asset Performance
Optimisation
NDT Certification Board Update
Firstly, I would like to thank the efforts of the Federal Office staff and all the teams behind the scenes for the work they have been doing with the processing of applications for certifications since September 2025 when the AINDT adopted ISO 9712: 2021.
The effort to learn and apply the updated processes and procedures, forms and templates has been well worth it and now we can proudly say that complete applications are now being turned around in an average of 7 days. This is something the whole industry should be whole heartedly satisfied with. A personal thank you to Paul Grosser who has volunteered weeks and weeks of his time to support this success for the AINDT as the temporary Certification Services Manager.
Logbooks remain the Technicians best friend. As with a pet, taking care of them will lead to a happy and stressfree life in the long run. As pesky as you may feel they are at times, filling in details regularly and obtaining sign offs as you go is key. They will come in great service in times of need, such as during renewal and recertification. If you take care of your logbook, it will take care of you.
Significant Interruptions to Work: What This Means for Certified Technicians
The Guide and Standard say: “Absence or change of activity which prevents the certified individual from practising the duties corresponding to the level in the method and the sector(s) within the certified scope, for either a continuous period in excess of one year or two or more periods for a total time exceeding two years.”
Noting: “Legal holidays or periods of sickness or courses of fewer than 30 days are not considered when calculating the interruption.”
This is more than the obvious: “I left the NDT industry completely for a year or two and now I’m back”.

It applies to the activities you are doing in your role. You may be employed as an NDT technician full time. However, if you have not conducted a test with a method in which you are certified for longer than a year, then you are in a period of significant interruption for that certification.
It is a personal responsibility to maintain certification. The certificate holder is expected to meet the requirements for maintaining certifications. They must abide by the code of ethics, maintain records of visual acuity and notify the employer and the certification body if the conditions of certification are not maintained.
Employers have responsibilities as well under ISO 9712 and one of them is verifying continuity in the application of the NDT method without significant interruption. Employees and Employers should be discussing this regularly at logbook signing times.
Finally, I would like to thank all the members of the AINDT NDT Certification Board that are making themselves available to attend the AINDT Summit 2026 in Newcastle and being available to answer your certification questions face to face. I’m looking forward to this being a great event.
We welcome all communications, should you wish to contact the AINDT NDT Certification Board, please make your enquiries in writing to the Secretary of the AINDT NDT Certification Board, PO Box 52 Parkville VIC 3052 Australia, or via email to ndtcertification@aindt.com.au. Email is preferred.

CONNECT, LEARN & LEAD
B E C O M E A N A I N D T M E M B E R T O D A Y
Whether you're looking to enhance your knowledge, expand your network, or influence industry standards, AINDT is your gateway to success. Connect with top professionals and thought leaders in an environment that celebrates innovation and progress. Just some of the member benefits are outlined below.
Regular editions of the AINDT Journal (6 per year)
Discounted certification and renewal fees
Free and discounted advertising on the AINDT website
On and off-site technical advice
Exclusive Corporate Member benefits
J O I N N O W > > >
Condition Monitoring Training Centres
Unlock the future of your career with top-tier condition monitoring training from trusted providers.
These training centres have earned the endorsement of AINDT, aligning perfectly with the national syllabi approved by the AINDT Certification Board. This ensures that you receive the highest standard of education and training.
To maximise your learning experience, AINDT recommends obtaining a copy of the training module—either directly from the training provider or by downloading it from the AINDT website. This will ensure you are well-prepared for your course.
For those seeking certification, it's crucial to successfully complete the specified training program and required training hours outlined in ISO18436. This is essential for achieving certification in your desired conditioning monitoring method, category, and industry sector. All examinations are conducted by the AINDT. For exam dates and further details, please contact AINDT via: federaloffice@aindt.com.au.
Elevate your skills and advance your career with the industry's best training and certification programs.
Victoria
Industrial Precision Instruments
A: Unit 12, 634-644 Mitcham Road, Vermont 3133
T: 1300 781 701
E: training@ipi-inst.com.au
W: ipi-inst.com.au
IR Technology Australia
A: 39-45 James Street, Lara 3212
T: 0418 569 698
E: erik.t@bigpond.com
W: irta.com.au
University of Melbourne
A: Parkville 3010
T: 03 9810 3348
E: claudine.evans@unimelb.edu.au
W: unimelb.edu.au
Wood – Asset Performance Optimisation
A: Level 3, 171 Collins Street, Melbourne 3000
T: 08 6314 2000 or (08) 6314 2280
E: svt.bu.training@woodplc.com
W: woodplc.com
Western Australia
ICM Training Solutions
A: 45 Delawney Street, Balcatta 6021
T: 0419 993 233
E: rainingacademy@icmt.com.au
W: icmt.com.au
SRG Training Academy
A: 109 Bannister Road, Canning Vale 6155
T: 08 9232 0300
E: trainingacademy@srgglobal.com
W: srgglobal.com
Wood – Asset Performance Optimisation
A: Level 1, 240 St Georges Terrace, Perth 6000
T: (08) 6314 2000 or (08) 6314 2280
E: svt.bu.training@woodplc.com
W: woodplc.com
Queensland
Advanced Infrared Resources Australia AIRA
A: PO Box 372, Hervey Bay 4655
T: 0467 565 836
E: jeff@irtau.com.au
W: irtau.com.au
Machinery Diagnostics Institute
A: 16 Wheeler Avenue, Gracemere 4702
T: 0499881 294
E: training@mcsturbo.com
W: mdiaustralia.com
SRG Training Academy
A: 7 Brisbane Road, Riverview 4303
T: 07 3816 5500
E: training@mcsturbo.com
W: mcsturbo.com
Wood – Asset Performance Optimisation
A: Level 20, 127 Creek Street, Brisbane 4000
T: (08) 6314 2000 or (08) 6314 2280
E: svt.bu.training@woodplc.com
W: woodplc.com
Authorised Qualifying Bodies
AQBs are authorised to offer AINDT-approved training and initial and recertification examinations in any Australian state, at any time throughout the year.
The AINDT also conducts scheduled examination rounds twice yearly, with dates advertised in The Industrial Eye and the AINDT e-newsletter.
While the AINDT strives to notify certificate holders of impending certification expirations, it remains the responsibility of the certificate holder to initiate the renewal and recertification process before their certification expires. Please note that late fees apply to overdue certification applications.
South Australia
Kuzer Technical
T: 1300 199 086
E: info@kuzer.com
W: kuzer.com
NDT methods, levels, and industry sectors offered:
• Magnetic Particle Level 1, 2 and 3 Multisector (ISO 9712)
• Dye Penetrant Level 1, 2 and 3 Multisector (ISO 9712)
• Ultrasonics Level 1, General Engineering (ISO 9712)
• Ultrasonics 2 and 3 Welds (ISO 9712)
• Phased Array Level 2 and 3 Multisector (ISO 9712)
• Time Of Flight Diffraction Level 2 and 3 Multisector (ISO 9712)
• Radiographic Testing Level 1, Level 2 and 3 Welds (ISO 9712)
Full Matrix Capture Level 2 Welds (ISO 9712)
• Visual Testing Level 1 and 2 Multisector (ISO 9712)
• Eddy Current Level 1, 2 and 3 Multisector (ISO 9712)
• Level 3 Basic Exam Prep (ISO 9712)
• OCTG drill pipe inspection
• Material Science in NDT – Multisector
• NDT for Managers & Engineers
• Radiation Safety (exceeding the syllabus of national module EA612)
Victoria
ATTAR
T: 03 9574 6144
E: training@attar.com.au
W: attar.com.au
NDT methods, levels, and industry sectors offered:
• Computed and Digital Radiography 2, 3
• Ultrasonic Testing 1,2,3 Welds, Casting, Wrought,
• Aerospace, Thickness
• Radiographic Testing Level 1, Level 2 and 3 Welds (ISO 9712)
Full Matrix Capture Level 2 Welds (ISO 9712)
• Magnetic Particle Testing 1,2,3 Multisector, Aerospace
• Penetrant Testing 1,2,3 Multisector, Aerospace
• Eddy Current Testing 2,3 Multisector, Aerospace
• Magnetic Flux Leakage 2
• Tank Bottom Testing
• Phased Array levels 2 and 3 Ultrasonics 2 Multisector
• Visual/Optical Testing 2 Multisector
• Time of Flight Diffraction (TOFD) levels 2 and 3 Welds
• Heat Treatment
• ISO 9712 UT Level 2 Corrosion/Erosion Detection and Mapping (CDM)
Western Australia
ATTAR
T: 03 9574 6144
E: training@attar.com.au
W: attar.com.au
NDT methods, levels, and industry sectors offered:
• Computed and Digital Radiography 2, 3
• Ultrasonic Testing 1, 2,3 Welds, Casting, Wrought,
• Aerospace, Thickness
• Radiographic Testing Level 1, Level 2 and 3 Welds (ISO 9712) Full Matrix Capture Level 2 Welds (ISO 9712)
• Magnetic Particle Testing 1,2,3 Multisector, Aerospace
• Penetrant Testing 1,2,3 Multisector, Aerospace
• Eddy Current Testing 2,3 Multisector, Aerospace
• Magnetic Flux Leakage 2
• Tank Bottom Testing
• Phased Array 2, 3 Ultrasonics 2 Multisector
• Visual/Optical Testing 2 Multisector
• Time of Flight Diffraction (TOFD) 2, 3 Welds
• Heat Treatment
• ISO 9712 UT Level 2 Corrosion/Erosion Detection and Mapping (CDM)
SRG Training Academy
T: 08 9232 0300
E: trainingacademy@srgglobal.com
W: srgglobal.com
NDT methods, levels, and industry sectors offered:
• Ultrasonic Testing 1,2 Welds
• Magnetic Particle Testing 1,2 Multisector
• Penetrant Testing 1,2 Multisector
• Phased Array Ultrasonic Testing 2 Multisector
Queensland
Protecs Global
T: 07 3492 9213
E: hamed.madani@protecsglobal.com.au
W: protecsglobal.com.au
NDT methods, levels, and industry sectors offered:
• Ultrasonic Testing 1 ( General Engineering) 2 Welds
• Magnetic Particle Testing, 2 Multisector
• Penetrant Testing, 2 Multisector
Western Australia Branch Update
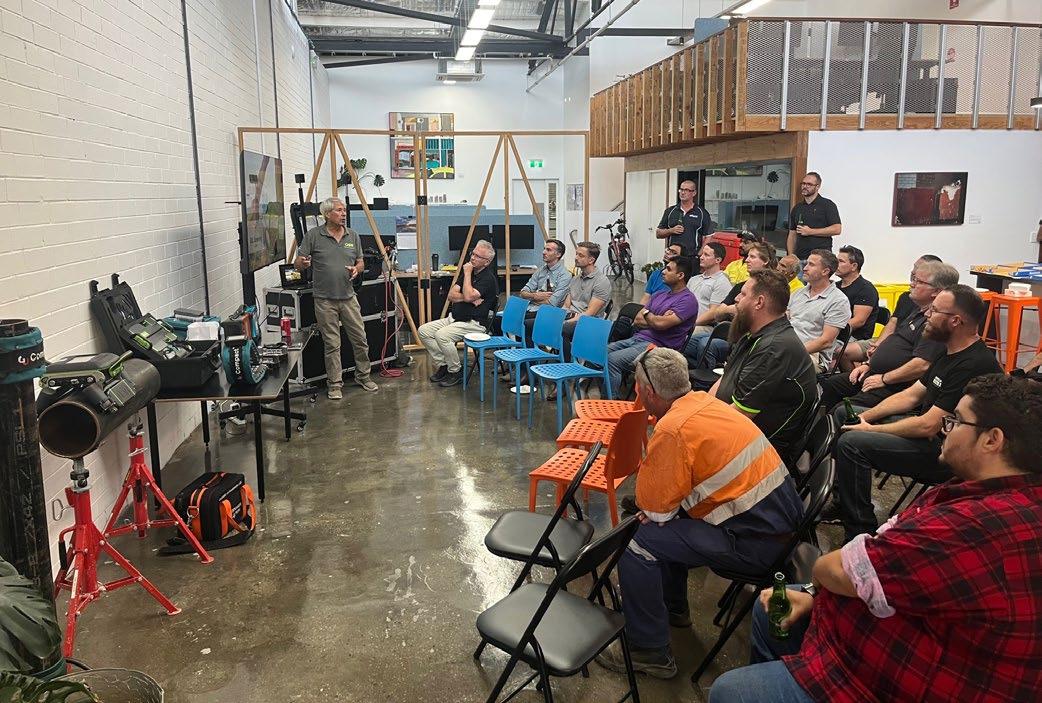
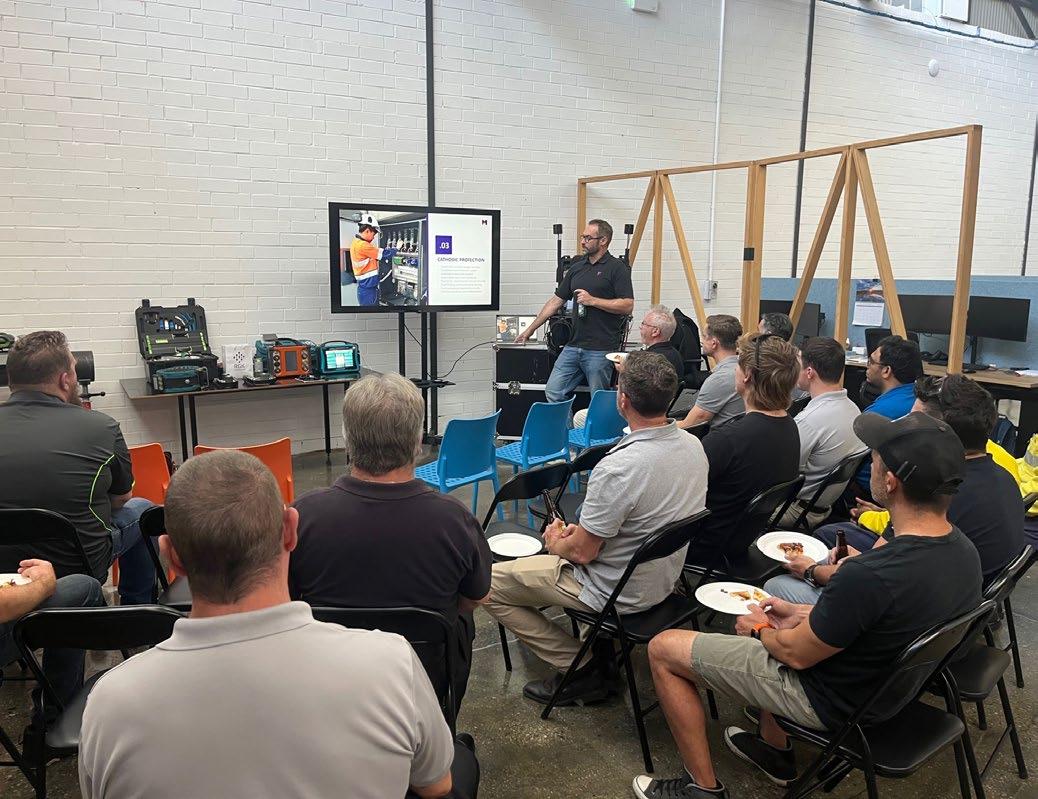
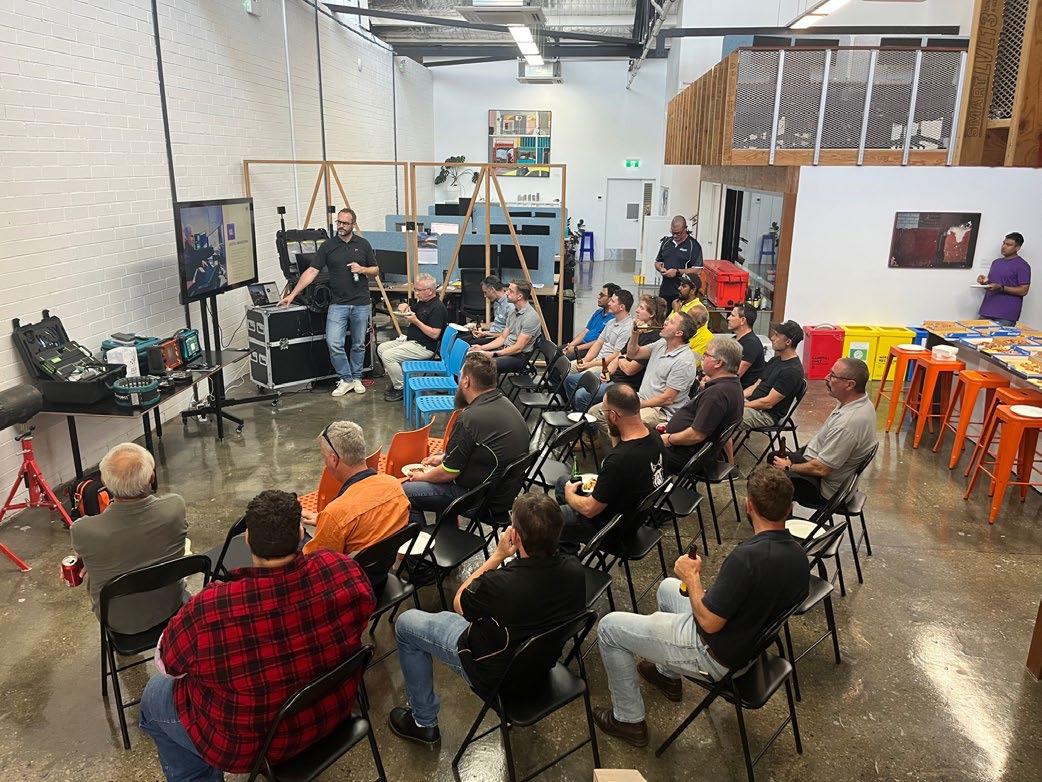
The Australian Institute for Non-Destructive Testing (AINDT) Western Australia Branch hosted a successful Technical Night on Wednesday 11 March 2026 at the MEnD Consulting Office in East Perth.
The event brought together industry professionals for an engaging evening focused on the latest advancements in Guided Ultrasonic Pipe Scanning technology. Attendees were given an overview of cutting edge solutions, including the Wavemaker G5, QSR, and Axial systems, highlighting their application in modern inspection programs and asset integrity management.
The technical session provided an excellent platform for knowledge sharing, discussion, and peer networking within the NDT community. With amazingly over-catered food and refreshments , participants had ample opportunity to connect with fellow practitioners and exchange insights on emerging technologies and industry challenges.
Many thanks to Ben Nooteboom from Guided Ultrasonics Limited (GUL) for taking his time to present and share many of his guided wave use cases from around the world. Thanks to RGK Resources Limited and MEnD Consulting for hosting the evening. MEnD have recently acquired RGK Resources in a bid to diversify their suite of services. To provide a little more context, MEnD was acquired by Duratec in 2017 and all three companies now form part of the broader Duratec group.
Thanks to AINDT CEO Stuart Norman, for finding the time in his busy schedule to represent the AINDT federal office at this event, fitting it in amongst three full days at the EXA Conference in Perth.
All attendees received a Certificate of Attendance, eligible for one Structured Credit Point under the AINDT Structured Credit System, contributing toward certification renewal and Level 3 recertification.
The evening reinforced AINDT’s commitment to supporting professional development and keeping members informed of the latest inspection technologies shaping the future of non-destructive testing.
Standards Update
This year has started slowly with some changes within Standards Australia and MT007 not being able to have proposed meetings. However the meeting is proposed to occur within April and further meetings before the Rome ISO Standards Meetings.
As detailed previously, the main items on the MT007 Agenda are the potential adoptions of ISO Standards relating to Acoustic Emission, Thermography and advanced NDT methods during the first meeting to be held this year.
Current ISO Designation Title
ISO 4386-1:2019 Plain bearings — Metallic multilayer plain bearings
ISO 16809:2025 Non-destructive testing — Ultrasonic thickness determination
ISO 4993:2024 Steel and iron castings — Radiographic testing
Voting has closed for direct adoptions of Standards listed below with results available shortly.
AS / NZS Designation To Be Superseded
AS/NZS 2824.1:202X Supersede AS 2824-2003
AS/NZS ISO 16809:202X
Supersede AS ISO 16809:2020
AS/NZS ISO 4993:202X Supersede AS ISO 4993:2020
Other projects currently being worked on by ISO Committees are as follows with internal ballots undertaken as drafts are completed.
ISO/FDIS 12716 (Ed 2) Non-destructive testing — Acoustic emission testing — Vocabulary
ISO/CD 10878 Non-destructive testing — Infrared thermography — Vocabulary
ISO 22290: Non-destructive testing — Infrared thermographic testing — General principles for thermoelastic stress measuring method
ISO/DIS 25335 : Non-destructive testing — Thermographic testing — Mechanical and electrical equipment testing
ISO/FDIS 18490 (Ed2) Non-destructive testing — Evaluation of vision acuity of NDT personnel
ISO/DIS 25222-2 Non-destructive testing — Characterization and verification of ultrasonic air-coupled equipment — Part 2: Probes
ISO/CD 11666 Non-destructive testing of welds — Ultrasonic testing — Acceptance levels
ISO/CD 15626 : Non-destructive testing of welds — Time-of-flight diffraction technique (TOFD) — Acceptance levels
ISO/CD 19285 : Non-destructive testing of welds — Phased array ultrasonic testing (PAUT) — Acceptance levels
ISO 22232-3: Non-destructive testing — Characterization and verification of ultrasonic test equipment — Part 3: Combined equipment
ISO/CD 17640 Non-destructive testing of welds — Ultrasonic testing — Techniques, testing levels, and assessment
ISO/CD 13588 : Non-destructive testing of welds — Ultrasonic testing — Phased array technique
ISO/CD 20601 Non-destructive testing of welds — Ultrasonic testing — Phased array technique for thin-walled steel components
ISO/CD 23279 Non-destructive testing of welds — Ultrasonic testing — Characterization of discontinuities in welds
Please contact me using the details below if you have any questions or require further information and I will reply at the first opportunity.
Angelo Zaccari
MT007 Standards Chairperson angelo.zaccari@outlook.com
Thermography In Action
When “Green” Runs Hot: Thermography, Harmonics and Hidden Risks in Large
Solar Installations
BY LIAM MITCHELL, SECRETARY, AUSPTA
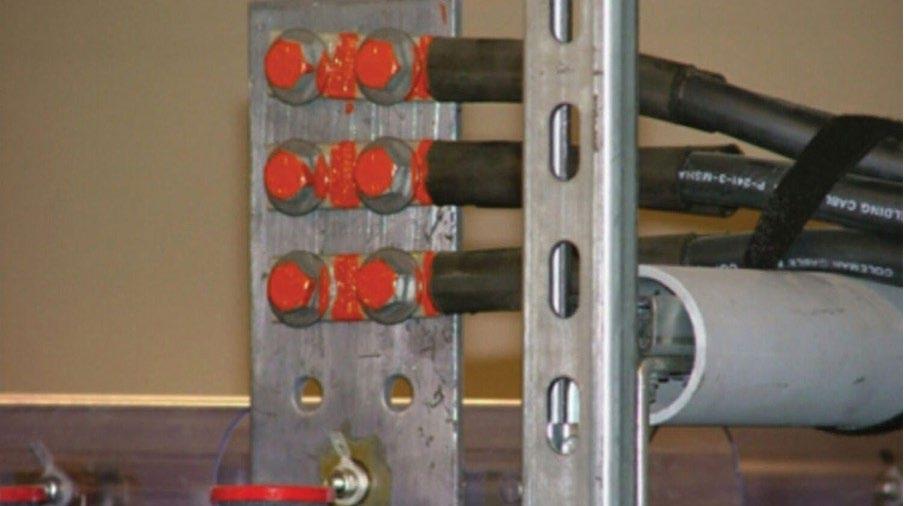
Walk into any modern industrial site and you are likely to find a roof covered in photovoltaic panels and a substation full of inverters humming away. On a recent thermographic inspection of a new commercial solar installation at a large mixed-use facility, that hum translated into something more worrying: cables and switchgear running so hot that you could quite literally have boiled a kettle on them.
While completing unrelated works on site, our installation and commissioning technicians happened to lean against a recently installed AC input cubicle and, if not for a layer of protective clothing, would have immediately burned their skin on the surface of the escutcheon panels.
Naturally we immediately offered to dispatch a condition monitoring team to site, an offer which the client gladly accepted, and unsurprisingly the team immediately identified components operating with temperatures well outside their design parameters. What was interesting however, is that these components were operating with load conditions well inside their design parameters.
This case illustrates a broader issue that is only going to become more common as high penetration rooftop solar and other non-linear electrical loads continue to proliferate: conventional design assumptions and inspection practices do not always cope well with non linear loads that run near full power for extended periods. The result can be excessive heating, premature ageing of equipment, and in the worst case, the ingredients for a fire.
Why Harmonics Make Conductors Run Hotter
Under traditional, largely linear loading (like motors, resistive heating, incandescent lighting), current waveforms are close to sinusoidal at the fundamental supply frequency, and conductor sizing is mostly a question of handling the expected RMS current and ambient temperature. Harmonic currents change that picture.
Non linear loads such as solar inverters, variable speed drives and switch mode power supplies draw current in pulses rather than as a smooth sine wave, creating harmonic components at multiples of the fundamental frequency. These harmonic currents increase Joule losses because heating scales with I^2 R, and the RMS current including harmonics can be significantly higher than the fundamental alone.
At higher harmonic orders, skin effect and proximity effect become more pronounced, pushing current towards the surface of conductors and unevenly distributing it between parallel paths or adjacent phases. That increases the effective AC resistance of busbars and cables compared with their 50/60 Hz values, further raising losses and conductor temperature for the same nameplate current.
In three phase four wire systems (like those used in every low voltage power system in Australia), triplen harmonics (3rd, 9th, 15th…) are in phase on each phase conductor and add in the neutral instead of cancelling, which can make the neutral the hottest conductor in the group.
The net effect is simple but easily underestimated: where significant harmonic distortion is present, conductors and terminations can run much hotter than they would under a clean sinusoidal load of the same apparent power.
Solar Inverters As Long Duration Non Linear Loads
Large solar arrays have two characteristics that are particularly challenging from a thermal point of view. First, grid connected inverters are strongly non linear, producing harmonic currents on the AC side as a by product of chopping and reconstructing the waveform. Modern designs with good filtering meet harmonic limits, but they do not eliminate distortion altogether.
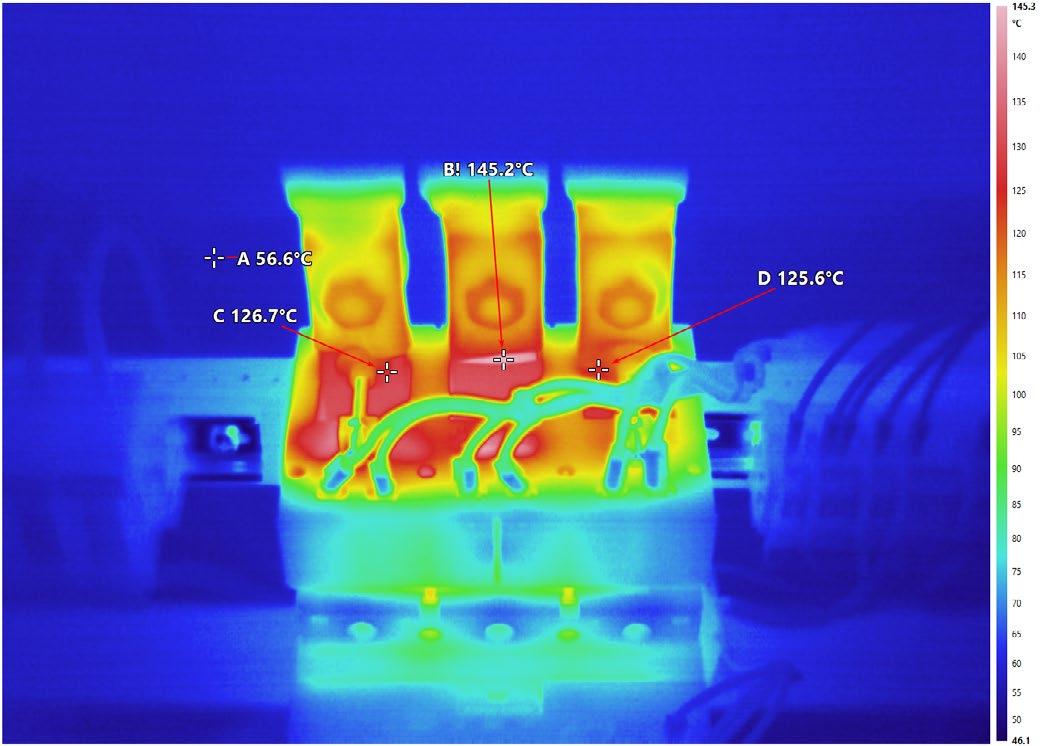
Figure 1. 630amp MCCB with approx. 500amps/phase symmetrical load
Second, a well designed array can (and is generally intended to) sit close to its continuous rating for several hours around solar noon on a clear day, especially in hot climates.
This combination – non linear current plus long, hot duty cycles – means that any weaknesses in thermal design tend to be exposed significantly. Switchrooms crowded with inverters and switchgear behave almost like low grade ovens, and installations that just about work on a mild commissioning day can tip over into sustained overheating during peak summer conditions.
In the inspected site, the substations housing the inverters and main switchgear were operating at high ambient temperatures with limited ventilation, compounding the heating from I²R and harmonic losses in busbars, breakers and cables. Even modern inverters operating at 98-99% efficiency still throw off some waste heat; a 500kW inverter array at 98% is producing 10kW worth of pure waste heat. In an unventilated (and often uninsulated) substation, with no active cooling, that heat has nowhere to go and increases the ambient temperature well beyond the original design limits of the substations, switchboards and other enclosures.
Once components are pushed beyond their intended temperature range, their electrical properties change. The resistivity or impedance of copper, for example, increases with temperature, so a hot conductor generates more heat at the same current than a cool one. If that heat cannot be removed efficiently, the system can approach a regime where rising temperature drives rising resistance and still more heat – a positive feedback mechanism that, if unchecked, is often described as thermal runaway.
What the Standards Say About Temperature Limits
Historically, low voltage switchboards in Australia and New Zealand were assessed to AS/NZS 3439, which effectively limited copper busbars and connections to a maximum absolute temperature of 105°C. AS/ NZS 61439, which has now superseded that standard, changed the framework by defining temperature rise limits above a reference ambient instead of a single absolute value.
Under AS/NZS 61439.1, the default reference ambient is 35°C. The standard is based on ISO61439.1, and section 9.2 table 6 of both standards sets out maximum permissible temperature rises. In this particular case we are most interested in the temperature rise permitted on “built-in components” (ie. circuit breakers and switchgear).
The manufacturers of the switchgear available and used in Australia typically reference IEC60947-1 table 2 for the maximum temperature rise above ambient at the terminals of the switchgear of 65°C.
Crucially, the standard assumes a particular ambient profile: a maximum ambient of 40°C at any time, with an average of 35°C over 24 hours, and it expects that higher ambient temperatures will be offset by derating the equipment. In a solar inverter room or substation
in a hot climate, the actual ambient can run well above these values unless adequate ventilation or active cooling is provided. That reduces the permissible temperature rise available to conductors and terminals before they exceed material limits, effectively eating into the thermal margin that was assumed at design time. For all intents and purposes this all combines to impose a hard temperature limit of 105°C at the terminals of any “standard” switchgear with nickel plated terminals (that number increases to 110°C for silver plated, or decreases to 100°C for bare copper terminals).
When “Too Hot” is Simply Too Hot
Unfortunately, conditions in excess of the above limitations were present on dozens of components across this site. And at the time of inspection, they were not yet operating under full load conditions. And to make matters worse, when initially presented with these findings, the solar installers were largely dismissive: “We have access to our own infrared camera, and our inspection said they’re fine”.
When pressed further, it turned out that their inspection was done at 09:00 in the morning, by an uncertified operator, with no regard to load conditions (nor was any report produced – just a collection of radiometric JPEG files).
Interpreting thermographic results in this context requires training, experience, and certification. And, even for an experienced electrical thermographer, sometimes a shift in mindsight.
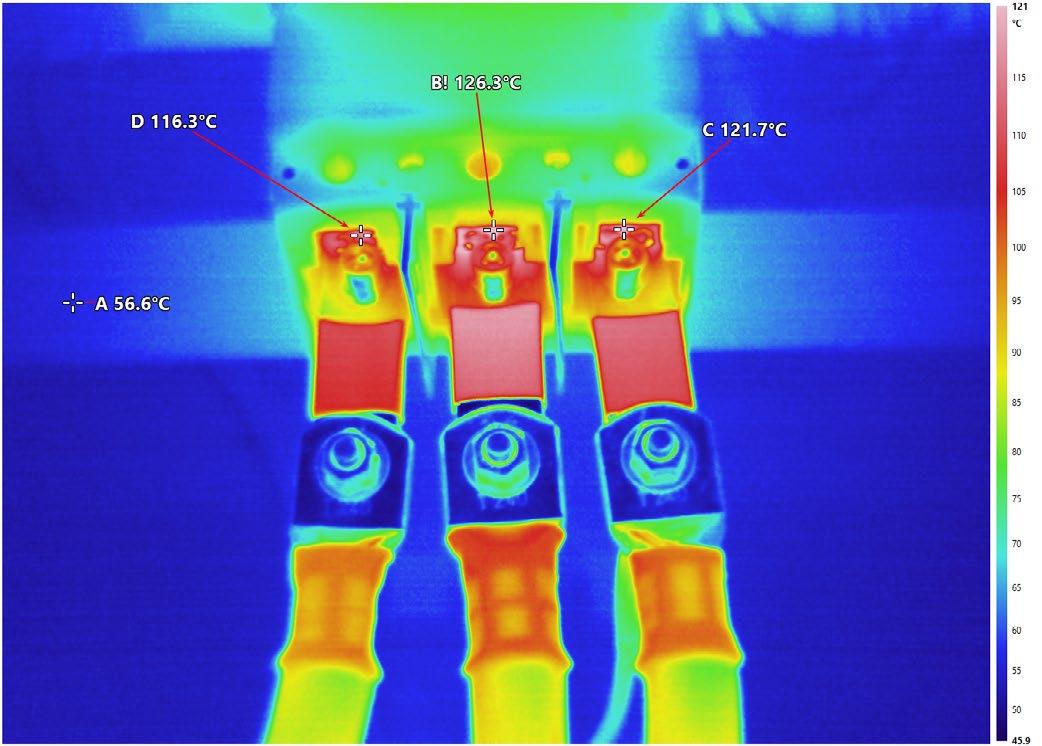
In many conventional inspections, absolute temperatures are treated cautiously because emissivity, loading and ambient conditions can all influence readings. Instead, inspectors rely heavily on deltas between phases or between similar components. Traditionally qualitative inspections are favoured over quantitative inspections for electrical thermography, with arbitrary
Figure 2. Another 630amp MCCB with approx. 450amps/phase symmetrical load
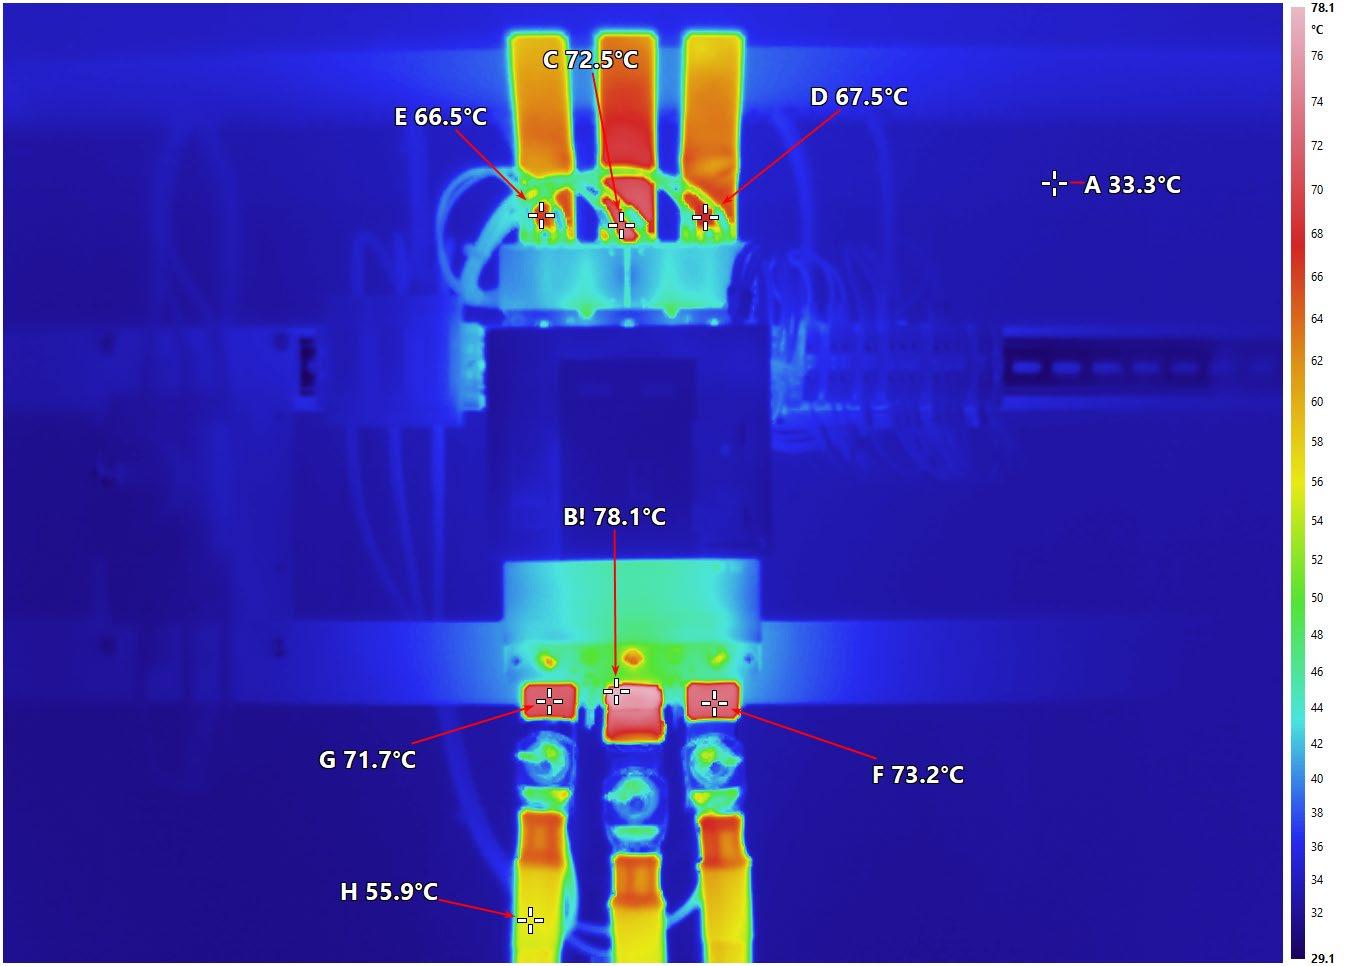
baselines being far less useful than comparison between like components under similar load and ambient temperature.
In a heavily loaded solar plant room with poor cooling, that qualitative method can become less useful, or almost completely useless. When all three phases of a breaker feeding an inverter are running at elevated temperature, and cable lugs or bus connections are measurably above the published rating of the insulation or the maximum temperature implied by AS/NZS 61439 test conditions, it is reasonable to conclude that the equipment is not being operated within its intended thermal parameters, regardless of whether one phase is a few degrees hotter than the others. Moreover, a slightly uneven thermal profile under symmetrical load conditions can be typical of even a healthy solar installation.
There is also a practical safety dimension. Even if a particular configuration can be argued to squeak inside the letter of the standard, accessible cables and copperwork hot enough to cause burns on contact, or
to significantly accelerate insulation ageing, represent a clear reliability and safety risk. From an operator’s point of view, arguing about the fine print is far less attractive than designing in sufficient headroom that such conditions simply do not arise.
Strategies For Mitigating Harmonic Heating
Once a site is already built, options are more constrained, but there are still several effective levers for reducing the impact of harmonic rich, high duty loads on conductors and switchgear.
• Improve room cooling and airflow. Lowering the ambient temperature in inverter and switchboard rooms increases the allowable temperature rise before material limits are reached and helps break the feedback loop between rising conductor temperature and rising resistance. This can include adding or upsizing split system air conditioning, providing mechanical ventilation to remove hot air, and ensuring that air paths are not blocked by continuous perimeter vents that short circuit airflow patterns.
Figure 3. Classic thermal profile heavily influenced by harmonics. Despite symmetrical load conditions well below the rating of the switchgear, and correct terminations, L2 is considerably hotter than the other phases.
• Reduce solar gains into plant rooms. Insulating metal roofs, shading external walls and eliminating direct sun through translucent roof sheets can materially reduce internal ambient on hot days, which again restores some of the temperature rise margin assumed by AS/ NZS 61439.
• Upsize conductors and switchgear. For future projects or major retrofits, specifying larger than minimum cross section conductors, bigger busbars and higher frame switchgear reduces current density, lowers I²R losses and spreads heat over a larger surface area. Many guidance documents and cable rating methodologies now include harmonic rating factors explicitly to account for the extra heating effect of distorted currents.
• Allow for cable grouping and bundling. Cables run in tight bundles or enclosed trays have limited ability to shed heat, so most standards require derating in such configurations. In harmonic rich installations, those derating factors become even more critical; failing to apply them can result in jacket and conductor temperatures well above 90–100°C under peak conditions, even if nameplate current appears compliant.
• Use equipment designed for harmonic loads. K-factor rated transformers, harmonic rated busway, and devices with reinforced neutrals are examples of products engineered specifically to withstand higher levels of harmonic heating without excessive temperature rise.
• Consider harmonic mitigation. Where distortion levels threaten other equipment or cause unacceptable heating, passive harmonic filters, active filter systems, or phase shifting transformer arrangements can reduce problematic harmonic currents and therefore the associated thermal stress.
Why Solar Thermography Must Be Done At Full Operating Load
Perhaps the most important lesson from the inspection described at the outset is not about harmonics per se but about timing. The original installer carried out a thermographic inspection in the morning, when irradiance – and therefore inverter loading – was still relatively low. Under those conditions, connection points and cables may have appeared perfectly acceptable, with modest temperature rises and minimal thermal gradients.
By the time the later inspection was carried out, in the mid afternoon on a warm day, the plant was operating near its maximum export capacity and the rooms had reached their worst case ambient. That combination revealed surface temperatures that would never have appeared in the earlier survey, even though the underlying installation was unchanged. And the results were deeply concerning.
For large solar installations, it is therefore essential that commissioning and periodic thermographic inspections be scheduled to coincide with realistic worst case conditions:
• Clear, high irradiance days when the array is likely to run close to its nameplate for at least an hour, and preferably longer.
• Times of day when ambient temperatures in inverter and switchboard rooms are at or near their peak.
• Operating scenarios representative of normal export or self consumption, rather than artificially reduced load states.
Only under those conditions will issues such as undersized conductors, inadequate busbar cross section, poor room cooling or missing cable derating reveal themselves clearly.
Treating thermography as a box ticking exercise at any convenient time of day risks a false sense of security.
Lessons For Designers, Installers and Owners
High penetration solar is an excellent tool for reducing operating costs and emissions, but it changes the thermal and power quality profile of industrial electrical installations in ways that traditional design assumptions do not always capture. Harmonic rich, high duty loads place extra demands on conductors and switchgear, especially in hot climates and confined plant rooms.
Standards such as AS/NZS 61439 provide a framework for temperature rise limits, but they rely on realistic assumptions about ambient conditions and appropriate derating where those assumptions are exceeded.
For designers and installers, that means treating large inverter rooms as thermally aggressive environments from the outset: allowing for harmonics in cable and busbar sizing, applying grouping and ambient derating rigorously, and providing ventilation or active cooling commensurate with the heat that the equipment will dump into the space.
For owners and operators, it means insisting that thermographic inspections are carried out under real operating load and being prepared to invest in remedial works – from improving cooling to upsizing critical conductors – when inspections reveal that the installation is running hotter than it should.
In the long run, the cost of thicker copper, highercurrent switchgear, and a split system unit or two is trivial compared with the financial and safety consequences of premature failures or a serious electrical fire. In a world where “green” infrastructure is becoming part of the backbone of industrial power systems, making sure that it runs cool is not a luxury. It is a necessity.
Calibration Isn’t a Certificate: Understanding Traceability in Practice
Calibration sits at the centre of most NDT quality systems.
BY JOHN DUENZL FOUNDER, SIMPLIFI NII
Instruments are periodically assessed against known references, and certificates are issued to confirm their performance under defined conditions. In many organisations, that certificate is used as part of the evidence to support confidence in measurement results. Calibration is essential. However, in practice, it is only one part of a broader measurement framework.
This article does not question the role of calibration or the requirements of existing standards. Instead, it focuses on how calibration is commonly interpreted in day-to-day operations, where misunderstandings can arise, and how traceability can become difficult to demonstrate when calibration is treated as a standalone confirmation rather than part of a connected process.
Calibration Confirms Performance — Not Application
A calibration certificate confirms how an instrument performed under specific conditions at a particular point in time. It does not, on its own, confirm how that instrument will perform across all inspection scenarios.
In practical NDT environments, conditions vary. Probes are changed. Settings are adjusted. Surfaces and materials differ. Environmental factors can influence performance.
As a result, an instrument may be:
• Within calibration
• Operating as expected
• Not ideally suited to a specific inspection task
This distinction is well understood in the field, but it is not always clearly reflected in records — particularly when those records are reviewed later by someone who was not involved in the inspection.
Traceability Is a Chain — Not a Checkbox
Traceability is often simplified to a yes-or-no question: Is the instrument traceable?
In practice, traceability is a chain that links:
• The instrument
• The calibration reference
• The conditions under which calibration was performed
• The way the instrument was configured and used
If any part of that chain is not clearly documented or understood, it can become more difficult to demonstrate traceability in practice even when each individual element appears valid on its own.
This can become evident during audits or reviews. The calibration certificate is present, and the instrument was within its calibration period, but the relationship between calibration and actual use is not always straightforward to demonstrate retrospectively.
Where Misunderstandings Can Arise
Most issues related to calibration are not caused by a lack of knowledge. They tend to arise from how information is simplified in practice.
Some assumptions that can arise include:
• A valid calibration certificate confirms suitability for all applications
• Calibration responsibility is assumed to sit entirely with the laboratory
• Calibration intervals alone are sufficient to manage measurement risk
• Instrument configuration does not need to be considered once calibration is complete
These assumptions are not defined in standards, but they can develop over time through routine workflows and administrative convenience.
When everything is operating normally, they may not create visible issues. Under scrutiny, they can make it more difficult to demonstrate how measurement decisions were supported at the time.
Clear Roles: Laboratory and User
Calibration laboratories have a defined role: to assess and report instrument performance under controlled conditions, with traceability to recognised standards. They do not determine how an instrument is used in the field.
Responsibility for application sits with the organisation performing the inspection.
This distinction is consistent with established standards, where laboratories report performance under defined conditions, and users determine suitability for application. Maintaining this separation helps ensure that calibration results are not overstated and that inspection decisions remain transparent and defensible.
Time, Use and Changing Conditions
Calibration occurs at defined intervals, while instruments are used continuously between those points.
During that time, instruments may:
• Be used across different projects
• Be configured differently depending on the task
• Be operated by multiple technicians
• Be exposed to varying environmental conditions This reflects normal NDT practice.
However, when reviewing work after the fact, particularly during audits or investigations. It can become difficult to clearly demonstrate, through records alone:
• The calibration state of the instrument at the time of use
• The configuration applied for a specific inspection
• The relationship between calibration conditions and field conditions
This does not indicate that the work was incorrect. It reflects the challenge of connecting information across time and context.
Calibration as Part of a Measurement System
Calibration is most effective when considered as part of a broader measurement system that includes:
• Defined procedures and method requirements
• Instrument configuration and setup
• Technician competence and judgement
• Environmental awareness
• Clear, connected records
When these elements are aligned, calibration certificates retain their intended value as part of a coherent evidence base.
When they are treated in isolation, their role can be misunderstood, either over-relied upon or insufficiently explained.
Improving this alignment does not necessarily require additional documentation. In many cases, it involves making clearer connections between information that already exists.
What This Article Does — and Does Not — Claim
To avoid misinterpretation:
• This article does not redefine calibration or traceability
• It does not assign additional responsibilities to calibration laboratories
• It does not suggest that calibration certificates are insufficient
• It does not propose changes to existing standards
• No interpretation in this article should be read as extending or redefining any standard requirement
Instead, it reflects a practical observation: calibration is often well executed, but may not always be clearly connected to how instruments are used in the field.
Where readers interpret this differently, that difference itself highlights how easily interpretation can vary across organisations.
Conclusion
Calibration remains a critical component of NDT quality systems. Its value is strongest when it is understood in context — not as a standalone confirmation, but as part of a connected measurement process.
By maintaining clear links between calibration, configuration, and application, organisations can strengthen traceability without increasing complexity.
In doing so, calibration continues to support what it is intended to provide: confidence in measurement, supported by clarity in evidence.

About the Author: John Duenzl
John Duenzl is the founder of Simplifi NII, where he works at the intersection of non-destructive testing, compliance, and practical systems design. With more than two decades in the NDT industry, John has learned that most technical failures don’t come from bad inspections, they come from good people working with disconnected systems under pressure.
He spends his time helping inspection teams make compliance boring, evidence easy to find, and audits far less dramatic than they need to be.
John believes that if a system only works when the “right person” is around, it isn’t finished yet.
When he’s not working with ultrasonic, EMAT, or inspection data systems, John enjoys translating complex standards into plain English, usually with a whiteboard, a question, and the occasional uncomfortable silence that leads to better thinking.
Comparing PAUT, PWI, PCI, and TFM Technologies
BY STEPHAN COUTURE, GLOBAL ADVANCED PRODUCT SUPPORT SPECIALIST, EVIDENT SCIENTIFIC
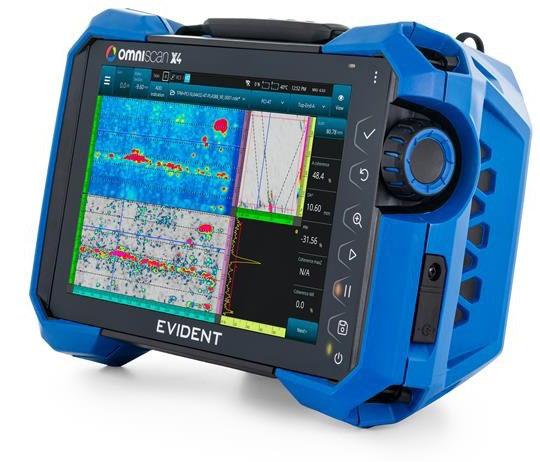
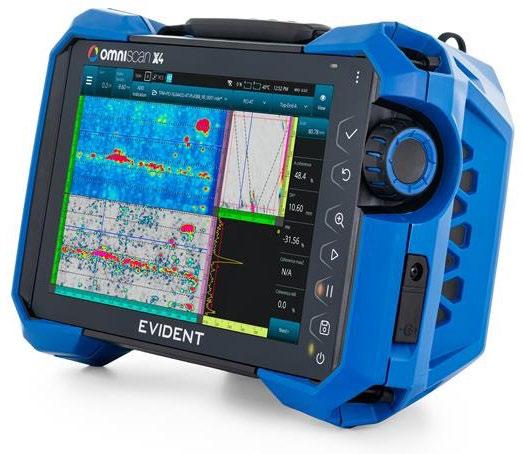
A versatile, multitechnolgy solution, every model of the OmniScan X4™ flaw detector is fully equipped with every ultrasonic testing (UT) techniques we have to offer:
• Conventional UT
• Phased array ultrasonic testing (PAUT)
• Time-of-flight diffraction (TOFD)
• Total focusing method (TFM)
• Phase coherence imaging (PCI)
• Plane wave imaging (PWI)
• Twin TFM/PCI
The combination of these advanced imaging capabilities and an easy-to-use interface enables OmniScan X4 users of all skill levels to perform rapid, reliable inspections of welds and components.
Our aging infrastructure can be affected by complex damage mechanisms such as high-temperature hydrogen attack (HTHA), hydrogen sulfide (H2S), and creep damage. These flaws are particularly challenging to detect with only conventional UT or PA because of inherent limitations to do with the sound beam and the shape, size, and angle of the damage. It’s an advantage to be able to exploit different techniques and tools to properly discern them.
But which technique is best for which type of flaw? FMC, TFM, PCI, and PWI are relatively new on the NDT scene—even experienced phased array practitioners may be unfamiliar with some of these new ultrasonic technologies. Rather than tell you about them, I decided to show you. To try and help demystify TFM, PCI, and PWI, I performed a few imaging experiments on standards containing a typical weld flaw, i.e. lack of root penetration (LORP), and HTHA damage.
What Is the Difference between TFM, PCI, and PWI?
Before we take a look at imaging comparisons, I’ll recap how each imaging technique works in general terms:
• FMC: A pulse-receive sequence designed to acquire a comprehensive set of waveform data from a single phased array (PA) probe. The sequence involves pulsing one element at a time while receiving on all elements. This process is repeated until each element in the array has been individually pulsed.
• PWI: A pulse-receive sequence that captures a reduced volume of waveform data compared to FMC. In this method, multiple-element apertures are pulsed simultaneously, and signals are received on
all elements. The process is repeated until all userdefined beams have been collected.
• TFM: The data collected from each transmitter-receiver combination, whether using FMC or PWI, is processed using delay-and-sum algorithms to generate a "focused everywhere" image. Synthetic beamforming is applied in both transmission and reception by synthesizing all combinations of elementary transmission and reception data (A-scans) acquired.
Watch our video on the basic principles of TFM on the Inspectioneering website.
• PCI: An amplitude-free variation of TFM, phase coherence imaging uses FMC data but only the phase information is conserved, and the amplitude is discarded. An image is then generated based on the level of phase coherence between A-scans, rather than the summed signal amplitudes. Phase coherence is assessed by analyzing the frequency distribution of the A-scans.
Weld Inspection Comparison: PAUT vs. FMC vs. PWI
In the first comparison, I generated images using three different technique combinations. Here are the parameters I used:
• PAUT: Compound scan 40° to 70° with a 0.5° step
• FMC using TFM and PCI: T-T mode with double thickness zone (full matrix and sparse configuration)
All OmniScan X4 models (including the 16:64PR) offer TFM, PCI, PWI, and twin TFM/PCI capabilities in addition to UT, PAUT, and TOFD.
• PWI using TFM and PCI: T-T mode with double thickness zone (angles 40° to 70° with varying angle steps)
Amplitude Data
To compare the PAUT, FMC, and PWI amplitude data, optimal scan parameters were used: “full sparse” FMC and an angle step of 1° for PWI. For this comparison, the lack of root penetration (LORP) tip signal was normalized to 80%.
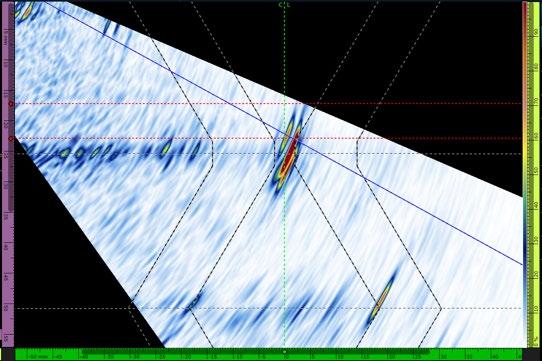
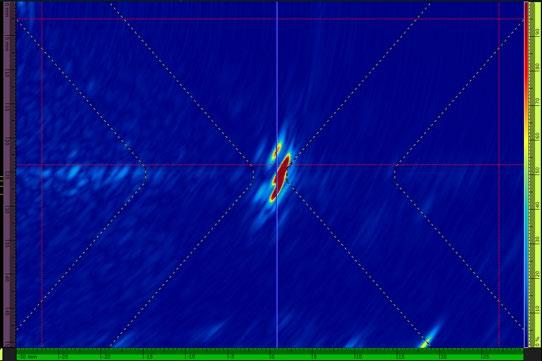
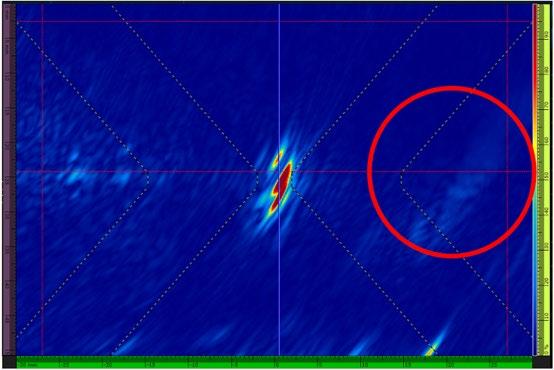
beyond the inspection area (circled in red). PWI enables a scanning speed of roughly two times that of FMC. However, the PAUT results are just as good, and its inspection speed is significantly better.
Phase Data
Using the default PCI color palette, PWI/PCI returns a noticeably weaker signal than FMC/PCI. When the color palette is adjusted (zoomed), however, PWI/PCI shows a noisier signal and also shows that all of the aspects of the indication are still detected.
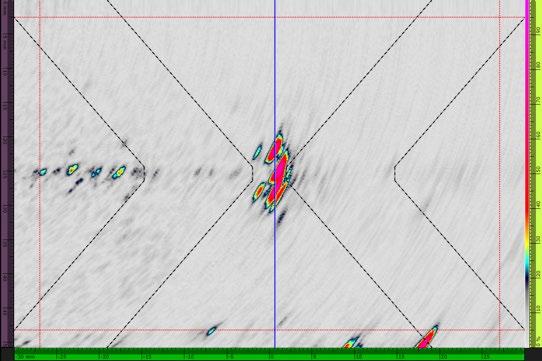
We see here that signals are comparable between the different technologies. PWI shows an unwanted echo
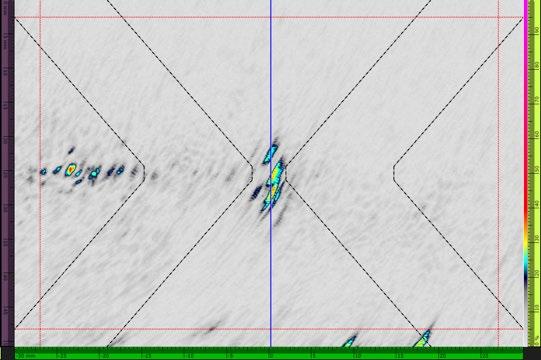
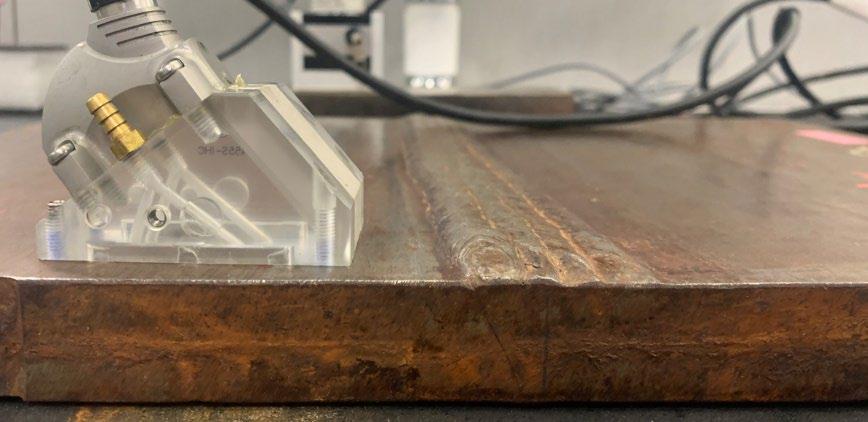
Our first test configuration is a single V weld with a 25.4 mm thickness. Tests were conducted using a 5L64 A32 probe with N55S wedge.
PAUT scan speed: 132 mm/s
FMC/TFM max scan speed: 18 mm/s
PWI/TFM max scan speed: 38 mm/s
FMC/PCI max scan speed: 17 mm/s
PWI/PCI max scan speed: 35 mm/s
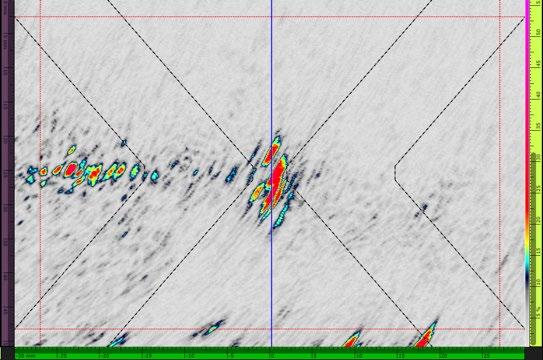
We see here that while PWI enables a faster scanning speed, there is a significant trade-off in signal quality, with the quality worsening as the speed increases.
Amplitude: Sparse
For the next set of images, I used the “Sparse 1/2” firing setting. This impacted the noise level for the flaws: for the LORP, the signal-to-noise ratio (SNR) went from 30.8 dB to 29.4 dB; and for the toe crack, the SNR went from 25.6 dB to 23.1 dB.
We see here that scanning speed with Sparse 1/2 is equivalent to PWI with a 1° angle step and without the unwanted signal drawback.
Amplitude: Limited PWI Angles
In comparison, we see a rapid decrease in signal quality as the PWI angle step is increased.
HTHA Inspection Comparison: PAUT vs. FMC vs. PWI
In our second technique comparison, we’ll take a look at inspection images created using three different technique combinations and parameters:
• PAUT: 0° linear scan using a 40-element aperture
• TFM and PCI using FMC: L-L mode (full matrix and sparse configuration)
• TFM and PCI using PWI: L-L mode (angles −20° to +20° with varying angle steps)
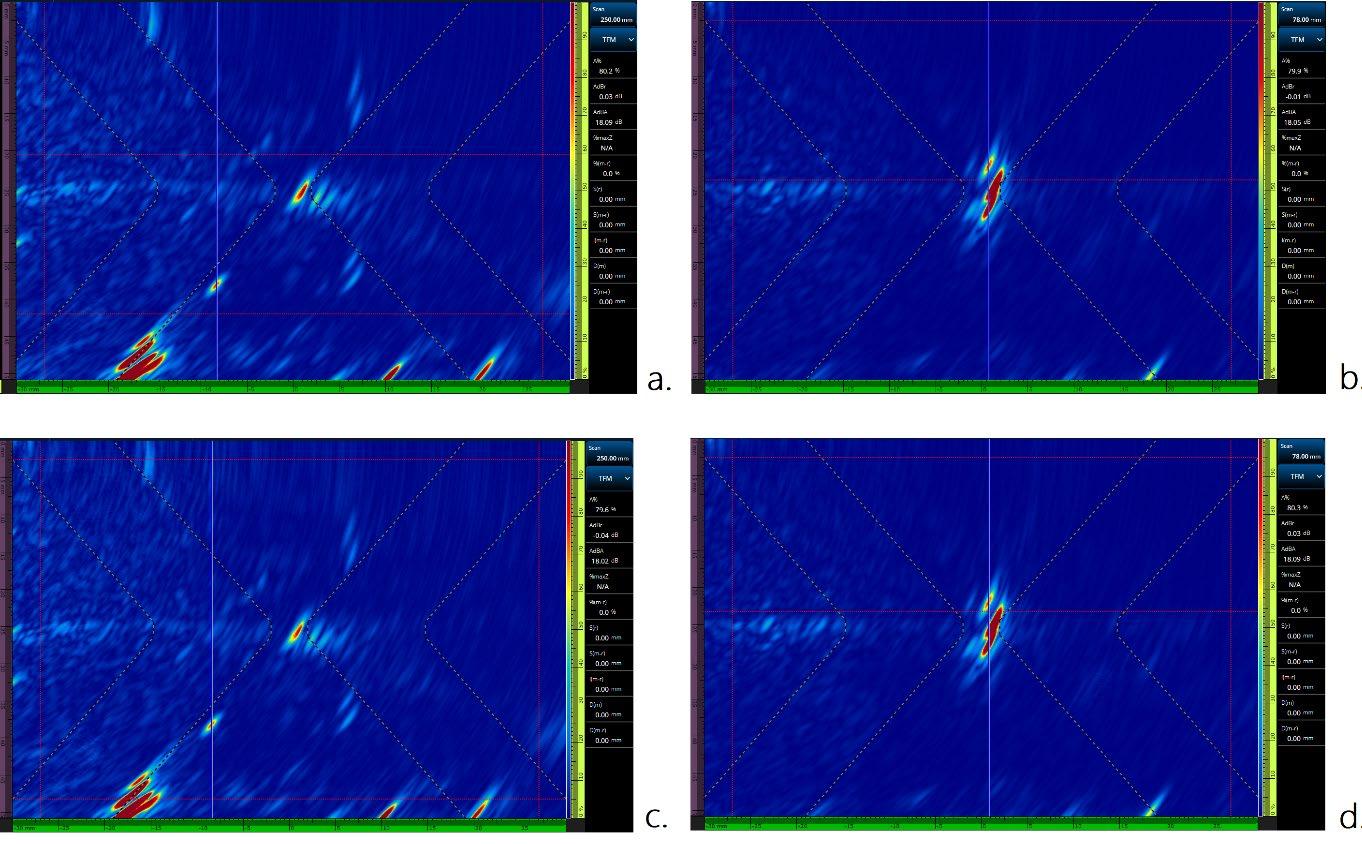
PWI/PCI max scan speed: 35 mm/s (with color palette adjusted)
FMC/TFM Full Matrix max scan speed: 18 mm/s (a and b), FMC/TFM Sparse 1/2 max scan speed: 36mm/s (c and d)
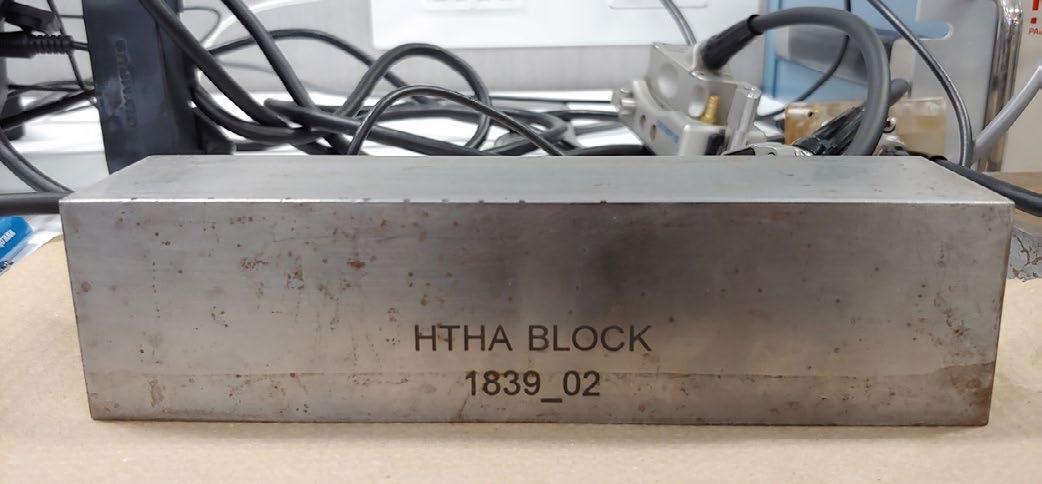
The second test configuration is a block with artificial HTHA with a 47mm thickness. Tests were conducted using a 10L64 A32 probe in contact mode.
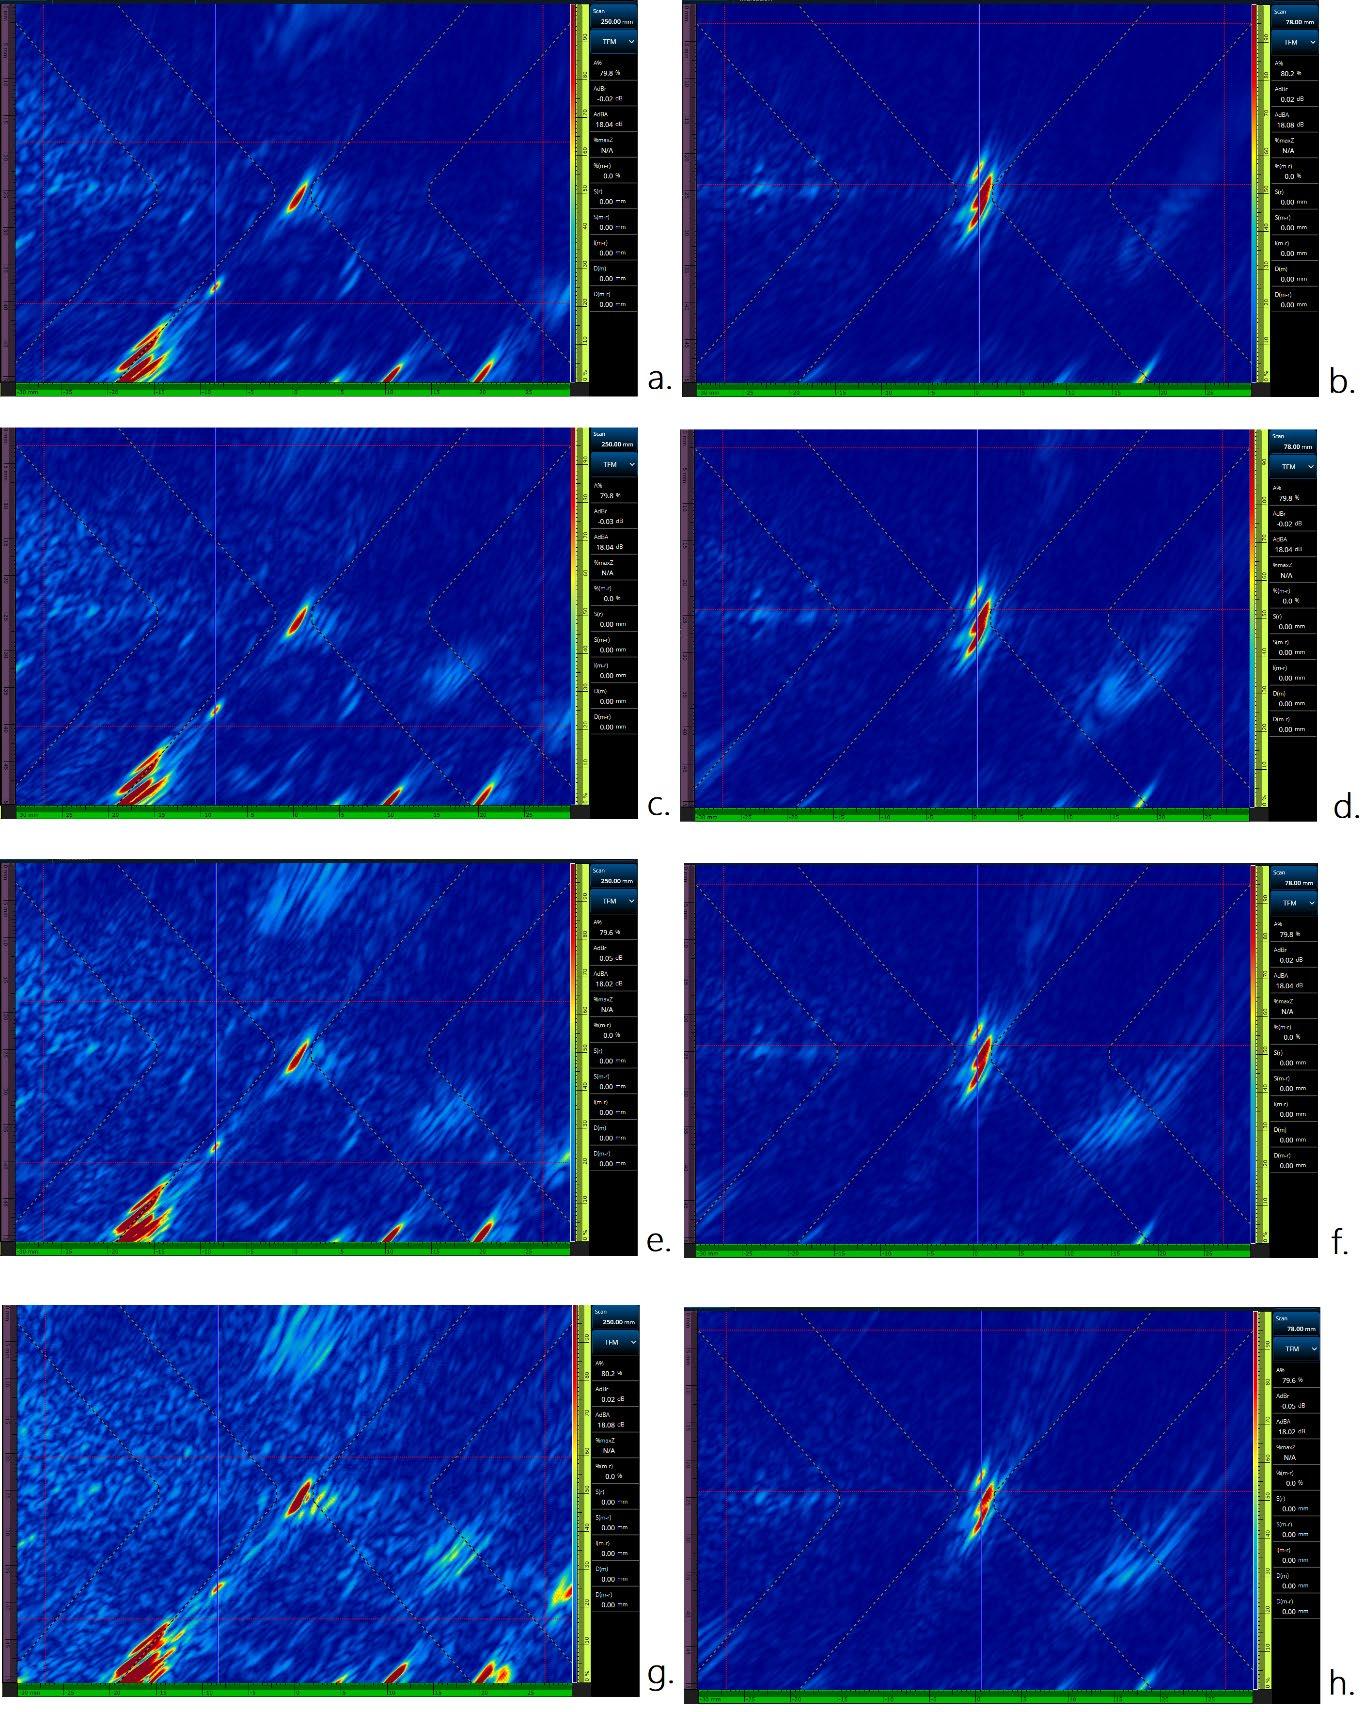
PWI/TFM 1° angle step
speed: 38mm/s (a and b), PWI/TFM 2° angle
scan speed: 73mm/s (c and d), PWI/TFM 3° angle step scan speed: 106mm/s (e and f), PWI/TFM 5° angle step scan speed: 167mm/s (g and h)
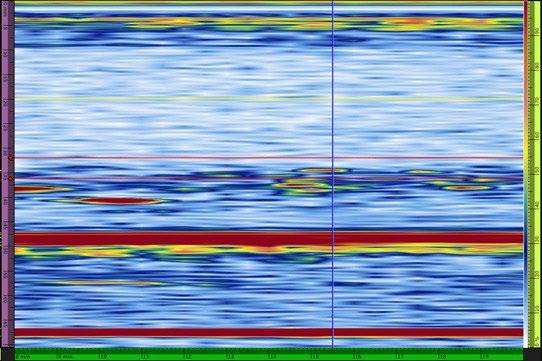
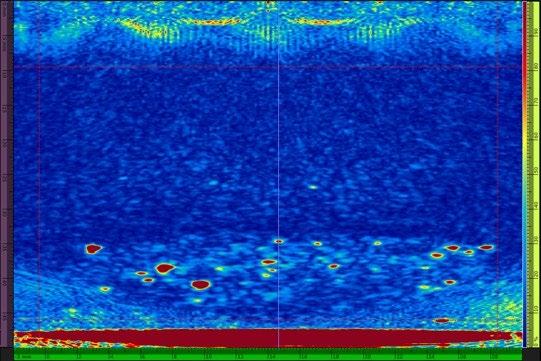
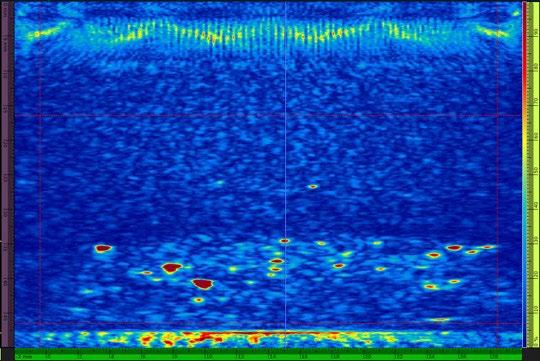
Amplitude Data
To compare PAUT, FMC, and PWI amplitude data, these scan parameters were used: “full sparse” FMC and an angle step of 1° for PWI.
For this comparison, an isolated signal at 127 mm scanning distance was normalized to 100%.
We see here that PAUT enables a much faster scan speed, but the signal is not even close to the information we can get with FMC and PWI. HTHA is an application where these technologies shine. PWI returns
more information than FMC without generating the signals in the bottom corner and having a weaker back wall signal.
Phase Data
Using the default PCI color palette, PWI/PCI returns a weaker signal than FMC/PCI. When the color palette is adjusted (zoomed), however, PWI/PCI starts to show more details of the HTHA damage.We see here that PWI also enables a better scanning speed.
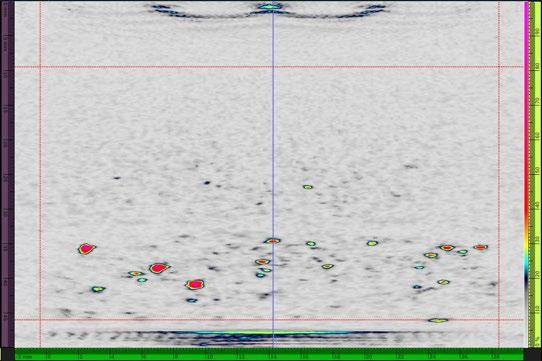
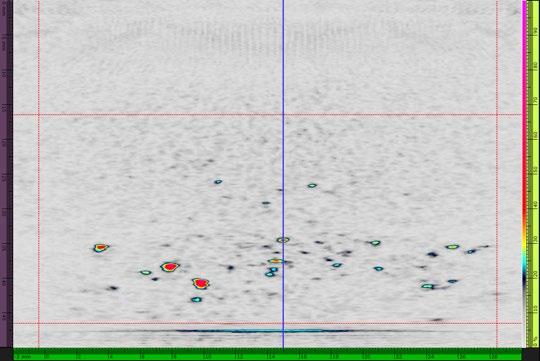
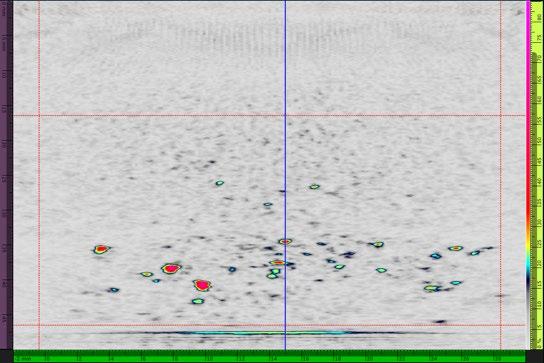
PAUT scan speed: 661mm/s
FMC/TFM max scan speed: 31mm/s
PWI/TFM max scan speed: 49mm/s
FMC/PCI max scan speed: 29mm/s
PWI/PCI max scan speed: 45mm/s
PWI/PCI max scan speed: 45mm/s (with color palette adjusted)
Phase: Sparse
Because of the statistical nature of PCI, sparse firing is usually not recommended. However, it does not affect the signal for this configuration. The scanning speed using Sparse 1/2 firing is better than PWI with a 1° angle step.
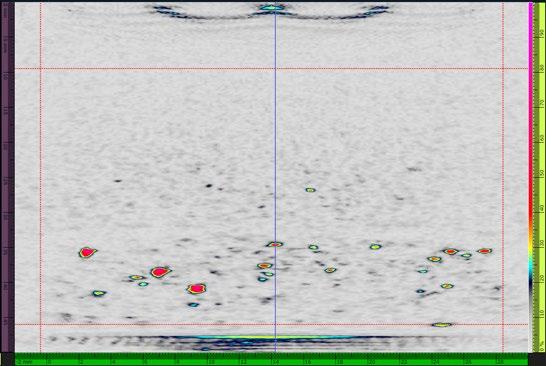
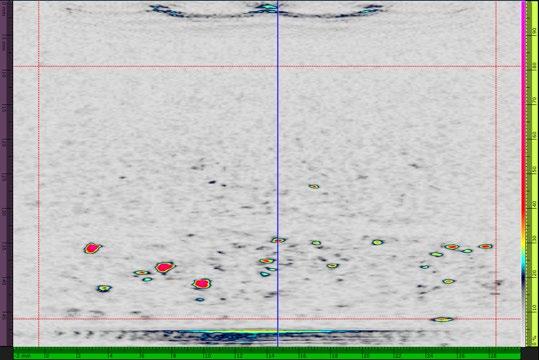
Phase: Limited PWI Angles
The same signal degradation seen with TFM occurs with PCI.
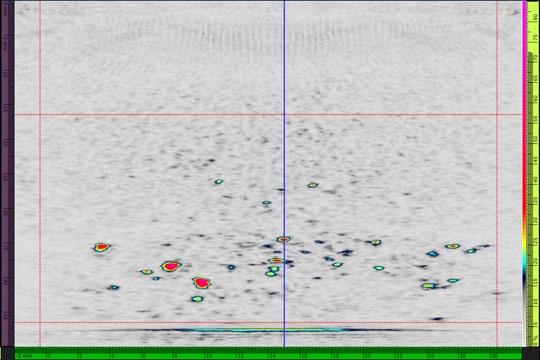
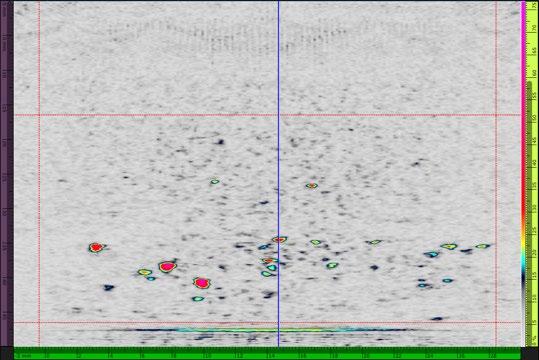
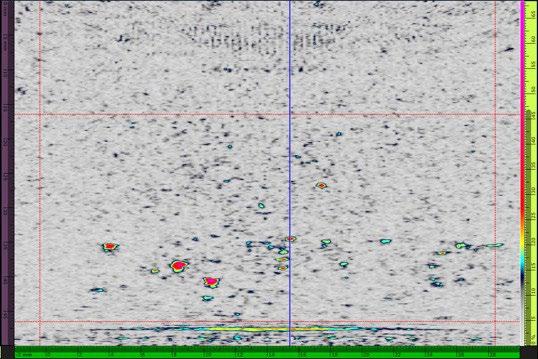
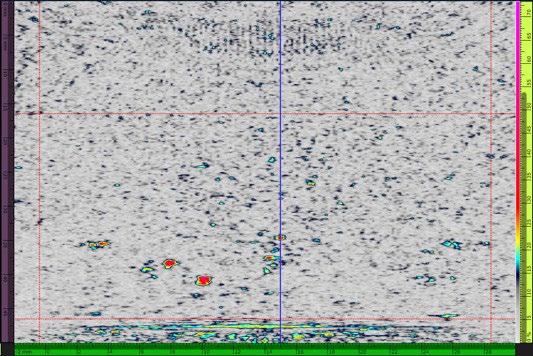
FMC/TFM Full Matrix max scan speed: 29mm/s
FMC/TFM Sparse 1/2 max scan speed: 57mm/s
PWI/PCI 1° angle step max scan speed: 45mm/s
PWI/PCI 2° angle step max scan speed: 87mm/s
PWI/PCI 5° angle step max scan speed: 204 mm/s
PWI/PCI 10° angle step max scan speed: 367mm/s
Conclusions
These imaging technique comparisons—weld inspection: PAUT vs. FMC vs. PWI and HTHA inspection PAUT vs. FMC vs. PWI—yielded the following conclusions: 25.4 mm V Weld Inspection
PAUT excelled—it provided results comparable to FMC-TFM and PWI-TFM but with a significantly higher inspection speed.
HTHA Inspection with a 10L64-A32 Probe in Contact
PWI outperforms PAUT and FMC, whether using TFM or PCI technology. Despite its slower scanning speed compared to PAUT, PWI increases the probability of detection.
Note: Maintaining a good signal-to-noise ratio (SNR) requires a small angle step or a high number of PWI beams.
Whether you’re using automated, semiautomated, or manual scanning methods, the OmniScan X4 flaw detector supports all of the aforementioned UT techniques. In some cases, you can combine multiple techniques in the same inspection to improve your detection probability and make it easier to identify and size your indications.
If you are interested in more details, reach out to your local Evident representative or contact us

Stephan Couture
Global Advanced Product Support Specialist, Evident Scientific
Stephan worked with Evident at product development and as a Product Specialist for 9 years.
In 2017, he transitioned to work in the inspection world to gather more applicative knowledge with the boots on the ground.
In 2019, Stephan rejoined Evident as a leader for Global Advanced Product Application.
Stephan is now supporting worldwide on applications, trainings, and industry projects as an Ultrasonic advanced products specialist.
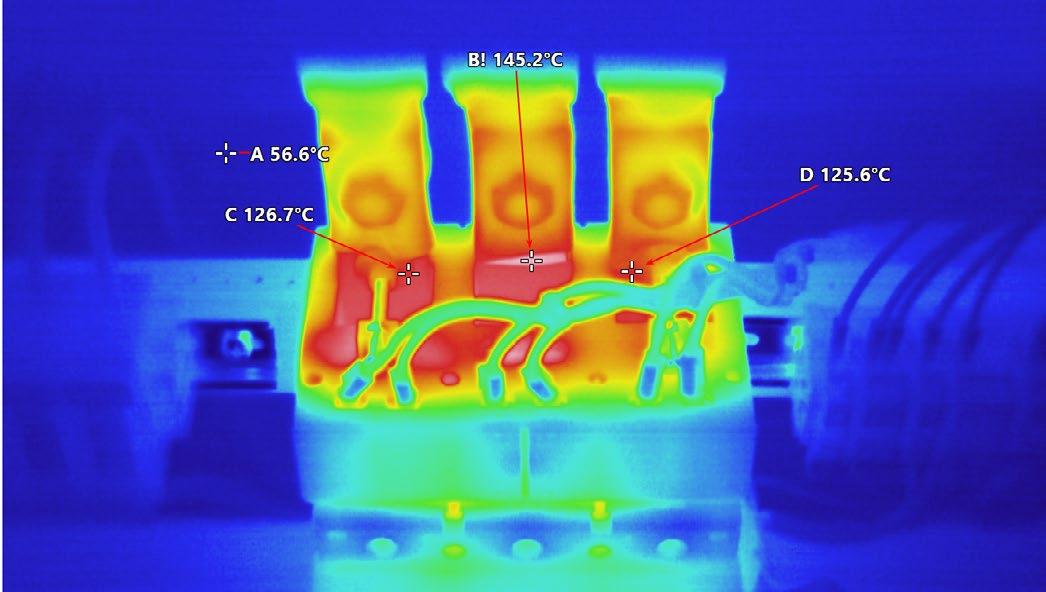
Using Infrared Cameras for Preventive Maintenance
Thermal imaging, maintenance and monitoring, motors, drives, pumps, compressors
Heat is often an early symptom of equipment damage or malfunction, making it important to monitor in preventive maintenance (PM) programs. Using infrared preventive maintenance regularly to check the temperature of critical equipment allows you to track operating conditions over time and quickly identify unusual readings for further inspection.
By monitoring equipment performance and scheduling maintenance when needed, these facilities reduce the likelihood of unplanned downtime due to equipment failure, spend less on “reactive” maintenance fees and equipment repair costs, and extend the lifespan of machine assets.
Here’s the trick: to actually save money, preventive maintenance should not create excessive additional maintenance efforts. The goal is to transition maintenance resources away from emergency repairs and into scheduled inspections of key equipment. Inspections take less time than repairs, especially if done with a thermal imager.
This article discusses the cost savings of thermal imaging and PM, provides guidelines for successfully capturing and analysing thermographic data and describes how to integrate thermography into a preventive maintenance program.
Return on Investment and cost savings
Studies by the Federal Energy Management Program (FEMP), estimate that a properly working preventive maintenance program can lead to savings, to the tune of 30 % to 40 %. Other independent surveys show that, on average, sustaining an industrial preventive maintenance program results in savings:
• Return on investment: 10 times
• Reduction in maintenance costs: 25 % to 30 %
• Elimination of breakdowns: 70 % to 75 %
• Reduction in downtime: 35 % to 45 %
• Increase in production: 20 % to 25 %
You can share this information with your supervisor or clients. To calculate the savings at a facility, estimate the costs of unplanned equipment failures. Then factor in human resources, costs for parts, and lost revenue from specific production lines.
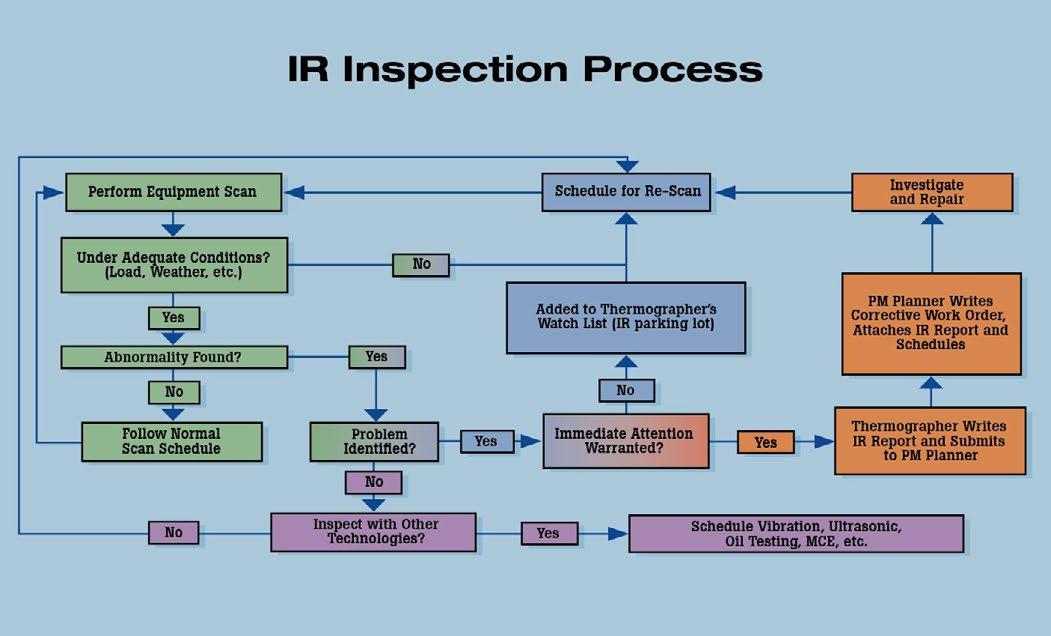
It would be wise for the maintenance manager to keep a record of machine asset availability, production output, and the distribution of maintenance dollars and total maintenance costs over time. Those numbers will help you calculate the return on your thermal imaging and maintenance investment.
Integrating Thermography Into PM Infrared cameras are often the first inspection tool a technician thinks to use as part of their preventive maintenance program. They can swiftly measure and compare heat signatures for all equipment on the inspection route, all without interrupting operations.
If the temperature is noticeably different from previous readings, facilities can then use other maintenance technologies—vibration, motor circuit analysis, airborne ultrasound, and lube analysis—to investigate the source of the problem and determine the next course of action.
For best results, integrate all of your maintenance technologies into the same computer system, so that they share the same equipment lists, histories, reports and work orders. Once the infrared data is correlated with data from other technologies, the actual operating condition of all assets can be reported in an integrated format.
Applications
• Monitor and measure bearing temperatures in large motors or other rotating equipment.
• Identify “hot spots” in electronic equipment.
• Identify leaks in sealed vessels.
• Find faulty insulation in process pipes or other insulated processes.
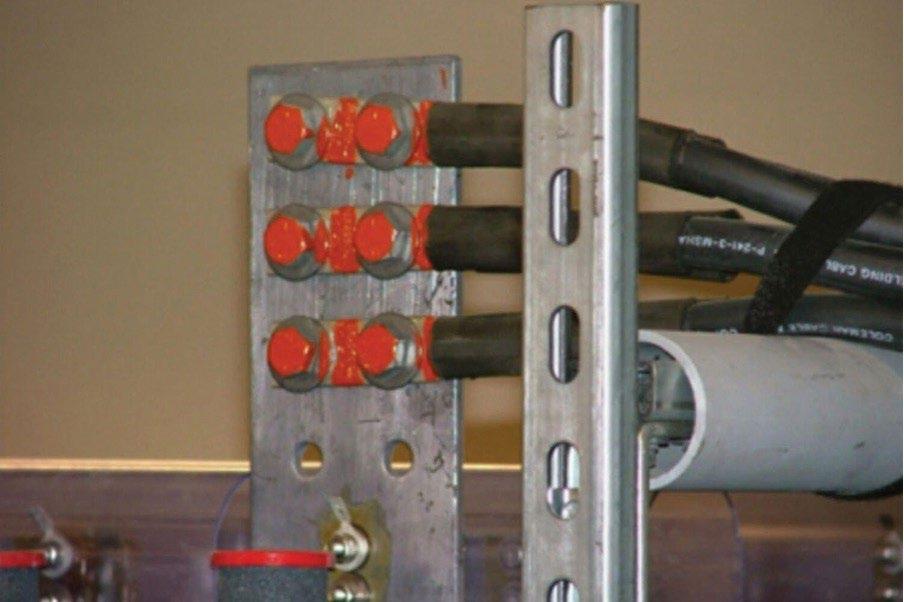
• Find faulty terminations in high power electrical circuits.
• Locate overloaded circuit breakers in a power panel.
• Identify fuses at or near their current rated capacity.
• Identify problems in electrical switch gear.
• Capture process temperature readings.
Inspection Process
1. Use existing lists of equipment from a computerised maintenance management system (CMMS) or another inventory tool.
2. Eliminate items that aren’t well suited for infrared measurement.
3. Review maintenance and production records. Prioritise key equipment that is prone to failure or often causes production bottlenecks.
4. Use a database or spreadsheet to group the critical equipment together, either by area or function, into roughly 2-3-hour inspection blocks.
5. Use your infrared camera to capture baseline images of each piece of critical equipment. Note: on some pieces of equipment, you may want to regularly capture multiple thermal images of key components or subsystems.
6. Download the baseline images into software and document your route with location descriptions, inspection notes, emissivity and RTC levels and alarm levels if appropriate.
7. When the next inspection is due, if your imager supports uploading, simply load the previous inspection images onto the camera and follow the onscreen prompts.
Measurement Guidelines
To capture the best thermal images, follow these best practices:
• Verify that the target system is operating at a minimum 40% of load (lighter loads don’t produce much heat, making it hard to detect problems).
• Get close to your target and don’t “shoot” through doors, especially not through glass. When safety procedures allow, electrical enclosures must be opened or infrared windows or viewports utilised.
• Account for wind and air currents. These powerful convective forces cool the abnormal hot spots, often below the threshold of detection.
• Account for ambient air temperatures, especially outdoors. In hot weather, the sun can heat up equipment while cold weather can mask the effects of overheating components.
With proper conditions, including direct access and normal loads, problems like this high resistance connector are often easy to locate.
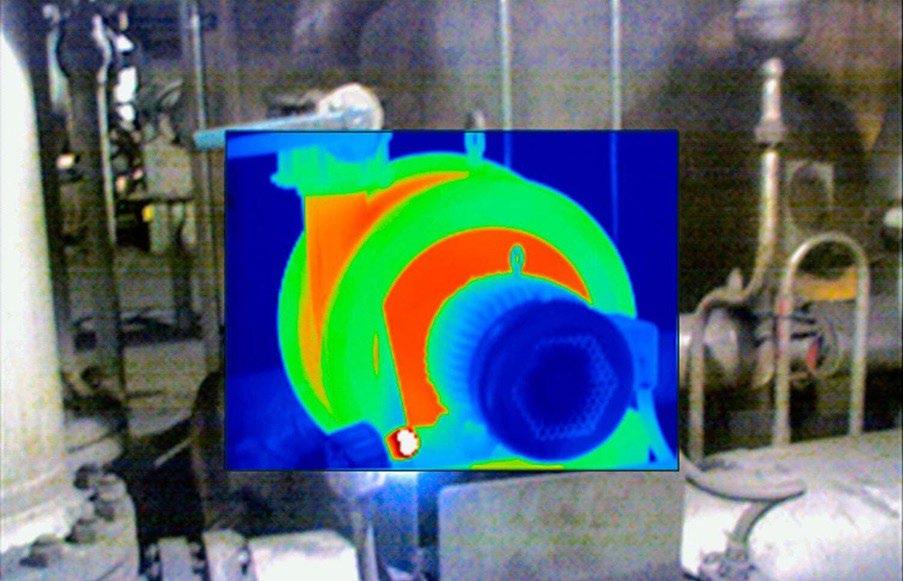
• Not all problems are hot! Blown fuses and restricted flow in cooling systems are just two examples of situations where a problem is indicated by a cooler than normal signature. In other cases, a cold component is abnormal due to the current being shunted away from the high-resistance connection. Thermographers must understand how a machine works and what its heat-related failure signatures are.
• Consider sources for reflective infrared radiation. Items that have shiny reflective surfaces and are emissive will reflect infrared energy from other nearby objects, including the sun. This can interfere with target temperature measurement and image capture.
• Unpainted metals are difficult to measure. To improve measurement accuracy and repeatability, consider affixing “targets”, typically paper stickers, electrical tape or painted spots, to such components.
• Accumulate both numeric temperatures and thermal images, to facilitate long-term data analysis. Temperature trends will show you where to investigate more and where inspections can be less frequent.
• Once you have a database of baseline images, associate an alarm temperature with each one. Upload the most recent version onto your camera before each inspection. If the alarm goes off when you take the new measurement, that indicates a significant change in temperature that needs to be investigated.
Inspecting Motor Bearings
Checking motor bearings is a relatable example. Start with a newly commissioned and freshly lubricated motor and take a “snap shot” of the motor bearing housing while the motor is running. Use this image as a baseline.
As the motor and its lubrication ages, the bearings become worn and heat-producing friction develops in the motor bearing, causing the outside of the bearing housing to heat up. Take additional thermal images at regular intervals, comparing them to the baseline to analyse the motor’s condition.
When the thermal images indicate an overheating bearing, generate a maintenance order to replace or lubricate the bearing housing and reduce or eliminate the possibility of costly engine failure.
Spotting Leaky Seals and Gaskets
Finding leaks in sealed vessels is a “snap” when using thermal imagers. Most leaks develop in or around a gasket or seal. Less often, corrosion will cause a weakness to develop and rupture the vessel.
Either way, an infrared imager can diagnose the problem. To find a leaky gasket or seal, scan the imager along the seal looking for thermal eccentricities. A large change in temperature along the seal or gasket indicates a loss of either heat or cold—the “signature” of a failure.
Learn More www.fluke.com.au
The upper bearing on the far motor is failing, causing the entire motor to overheat. (Photo courtesy Greg McIntosh, Snell Infrared Canada)
X-ray monitoring of the melt pool during additive manufacturing of stainless steel 316L: a comprehensive study of feasibility
Laser Metal Deposition with powder is an additive manufacturing technique used for repairing metal components or producing parts with complex geometries.
LOÏC JEGOU1 (, THOMAS ELGUEDJ2, VALÉRIE KAFTANDJIAN3, MOHAMED TAHRAOUI3), PHILIPPE DUVAUCHELLE3)
1 EUROPEAN SYNCHROTRON RADIATION FACILITY (ESRF), ID11, GRENOBLE, FRANCE. EMAIL: LOIC.JEGOU@ESRF.FR
2 UNIV. LYON, INSA LYON, CNRS, LAMCOS, UMR5259, VILLEURBANNE, FRANCE
3 INSA LYON, LVA, UR677, 69621, VILLEURBANNE, FRANCE
These techniques are more and more present in the industry, and the need for live monitoring using nondestructive testing is rising. X-ray imaging offers the ability to penetrate metallic parts and detect defects such as porosity. In the context of additive manufacturing, they can also be employed to visualize the shape of the melt pool during the fabrication process, using the contrast between the liquid and solid phases, due to their density differences.
This study first describes how to experimentally implement such a control in an industrial-type additive manufacturing cabin, with an X-ray lab source and a recycled X-ray detector. The source parameters (voltage, intensity) are optimized according to the detector, using image quality indicators, and an extensive safety study ensures that the setup is safe, according to the French law.
The low quality of the detectors, and the high absorption of stainless steel 316L does not allow for a direct segmentation of the melt pool, and a cheap encoderdecoder network is effectively developed and trained on simulated data. The model shows promising results when transferred onto experimental data, and highlights the need for high frame rate imaging detectors for live monitoring of additive manufacturing process.
Keywords: X-ray; melt pool; additive manufacturing; nondestructive testing; simulations
Introduction
Additive manufacturing (AM) is defined by the American society for testing and materials as: "the process of joining materials to make objects from 3D model data, usually layer upon layer, as opposed to subtractive manufacturing methodologies, such as traditional machining". While this definition applies to all types
of materials, this work specifically focuses on metallic parts. Regarded as the new industrial revolution [1], AM has continuously evolved to address current industrial demands, such as rapid production, material efficiency, and the ability to create complex, custom-designed components. Today, a lot of different technologies exist [2], and this article focuses on Laser Metal Deposition with Powder (LMDp, [3]).
LMDp involves using a highly focused laser to melt a localized region of a substrate, while continuously delivering powdered feedstock material into the melt pool [4]. During this process, there is a complex interaction between the powder, laser, and melt pool which is strongly influenced by the operating parameters (such as powder flowrate, laser power and scanning speed). These parameters significantly affect the quality of the final part in terms of geometry, residual stress [5], and metallurgical properties [6].
The melt pool serves as a reliable indicator of defect formation [7] and overall quality. Monitoring it in real-time during the manufacturing process is highly valuable, both for predicting defect locations (such as porosity, as demonstrated by [8] using infrared images) and for adjusting operating parameters during the fabrication, as seen in studies using infrared sensors [9] or CMOS cameras [10].
Numerous imaging techniques have been developed to monitor the melt pool's morphology [11-13], its temperature [14,15], or both simultaneously [16]. While these methods provide critical insights into the melt pool's behavior, they are limited to surface observations, leaving the subsurface dynamics unobserved. This is where X-rays step in, offering the ability to peer through the material and capture details beneath the surface. In the industry, X-rays are extensively used to perform Nondestructive Testing (NDT) to inspect manufactured parts for defects, such as porosity [17]. Radioscopy is an imaging technique relying on two-dimensional grayscale images that reflect the degree to which X-rays interact with an object [18]. This method examines contrasts resulting from variations in thickness, chemical composition, or density. In metal AM, the idea is to analyze the melt pool by leveraging the contrast created by the density differences between the liquid and solid phases. Prior to its application in AM, X-rays
were used to study melt pools in welding and laser cutting processes with similar objectives [19,20]. While porosities were easily visible in these studies, the melt pool contours were often indistinct due to low contrast between the two phases.
Yamada et al. [21] addressed this issue using synchrotron radiation, where X-ray beams are far brighter (at least a million times more photons) than those produced by X-ray laboratory sources. This led to numerous studies of LMDp conducted at synchrotron facilities, such as the Advanced Photon Source in the USA [22-25] and Diamond Light Source in England [26-28]. These studies provided valuable insights into porosity formation mechanisms, powder particle interactions above the melt pool, particle trajectories influenced by laser-induced pressure gradients, and melt pool dynamics. However, synchrotrons are huge installations that generate intense X-ray beams with the capability to filter them into monochromatic rays. The downside is that AM setups must be miniaturized to fit within these facilities [29], which results in systems with characteristics that differ from those used in industrial environments. The primary goal of this study is to make X-ray NDT feasible on an industrial additive manufacturing setup, using a laboratory X-ray source. These kinds of X-ray sources, unlike synchrotrons, produce polychromatic beams that are significantly less bright, resulting in radioscopic images with lower contrast. The next challenge is to develop a method for identifying the melt pool in these low contrasted grayscale images. This issue closely parallels challenges in the medical field, where tumors or pathological features must be detected in X-ray scans with similarly low contrast.
Several image segmentation techniques exist, including thresholding [30], region-based methods [31], boundary-based approaches [32], and hybrid techniques [33]. Currently, automatic segmentation methods are favored due to their lack of reliance on manual adjustments. Otsu's thresholding, known for its efficiency, has inspired many researchers [34,35]. However, the effectiveness of these methods can be compromised by the poor quality of the radioscopy, the size of the tumor or the level of contrast [36]. Artificial intelligence provides new approaches to deal with these segmentation challenges, achieving higher success rates [37,38]. Typically, computer vision problems are solved with convolutional neural networks. A comprehensive review of these architectures is provided by [39]. Among these, auto-encoders have gained popularity in recent years for image processing tasks [40]. All these techniques inspired the Encoder-Decoder (ED) approach described in this paper for identifying the melt pool in low-contrast radioscopies.
Training such models requires a substantial amount of data, currently lacking in LMDp. To address this limitation, an analytical thermal simulation of the process has been used to generate the temperature distribution in a typical melt pool, followed by a simulation of an X-ray shot onto the melt pool.
Finally, different architectures of E-D have been trained on simulations of in-situ radioscopies of the LMDp process, and subsequently applied to experimental radioscopy to identify the melt pool during the deposition of ten successive layers of Stainless Steel 316L (SS316L) parts.
The paper begins with a brief overview of X-ray theory, followed by a detailed description of the complete experimental setup, including the specific safety measures related to X-ray use. After calibrating the system, the first image acquisition of in-situ radioscopies of the melt pool in LMDp is conducted. Various image analysis techniques are employed to identify the melt pool but prove to be ineffective. In the next phase, a full dataset of simulated radioscopies of the melt pool is generated to train three E-D inspired by the architectures of LeNET5, AlexNET, and VGG16. Upon completion of the training, VGG16-based E-D successfully identifies the melt pool in simulated radioscopies, regardless of its size or position within the image. Finally, the same E-D is directly applied to the experimental images without additional training, yielding promising results.
Methodology 2.1 Theory
X-rays are high-energy photons characterized by wavelengths shorter than 10−8 m. In both medical and industrial applications, the most prevalent method for generating X-rays is through the use of laboratory X-ray generators (Figure 1).
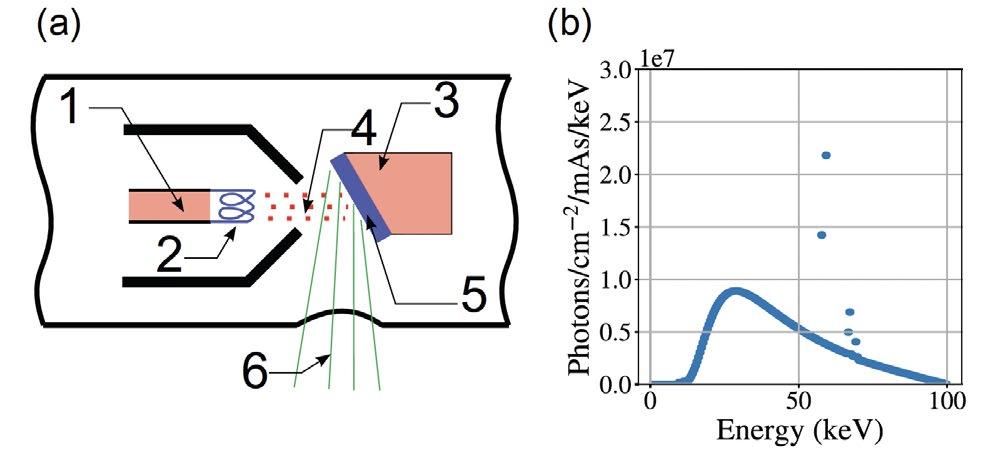
Electrons move freely in a closed circuit looping through the anode and the tungsten filament (indicated as (1) and (2) on Figure 1 (a)). When a voltage difference is applied between the cathode and the anode (3), electrons are emitted (4) and collide with the tungsten target (5). This interaction generates the primary X-ray beam (6), which can subsequently be filtered and collimated according to specific requirements.
The photons in the primary beam exhibit a broad range of energy levels, with the maximum energy determined by the applied voltage difference (Figure 1 (b)).
The variation in photon energy implies that they will interact differently with objects.
Figure 1: (a) schematic of an X-ray source. (b) The energy spectrum of an incident X-ray beam with a high voltage of 100 kV.
2.2X-ray interactions and attenuation
At industrial voltage levels (approximately 100 kV), the predominant interaction between photons and matter is attributed to the photoelectric effect.
On a broader scale, X-ray interactions with matter can be viewed as a statistical problem: what is the probability that an X-ray will interact with electrons over a specified length of a material? Beer-Lambert's law provides a simplified answer to this question. For a homogeneous material with density �� (g. cm−3), an attenuation coefficient �� (cm−1), and a given thickness �� (cm), the intensity of the transmitted X-ray beam ��1 (for a given energy E) is determined as follows (equation 1.).

1.
��0 is the intensity of the direct beam and �� is the mass attenuation coefficient (in cm2. g−1), �� known for every element of the periodic table for a given energy [41].
This equation is valid for monochromatic X-ray beams (where all photons have the same energy E). In this study, the X-ray beam is polychromatic, meaning that the photons from the incident beam will not undergo uniform attenuation, resulting in noisier and less contrasted images.
However, despite the noise, for a given material placed in an X-ray beam, the measured signal on the detector will solely depend on the thickness and density of that material. For a fixed thickness, even a slight variation in density will lead to a small change in the signal detected in the radioscopy. This low contrast becomes more challenging to detect with polychromatic beams, as the transmitted signal ��1 is noisier. Nonetheless, the objective of this paper is to leverage this characteristic to identify the melt pool during the additive manufacturing process.
Experimental setup
3.1 X-ray source and detector
The X-ray source used in this study is a portable generator (LLX200-DA-1) from Balteau NDT (Figure 2 (a)). This source is commonly employed in open environments, such as construction sites, for the examination of industrial components. It can produce X-rays with a voltage ranging from 5 to 200 kV and a current intensity of 0.5 to 12 mA, with a maximum power output of 900 W (additional specifications are available via the manufacturer’s website). X-ray emission is initiated using a wireless remote control.
The detector employed in this experiment is a flat panel (flashscan 23 from Thales) featuring a wide active area that enables a broad field of view (Figure 2 (b)). Its specifications are detailed in the subsequent table (Table 1).
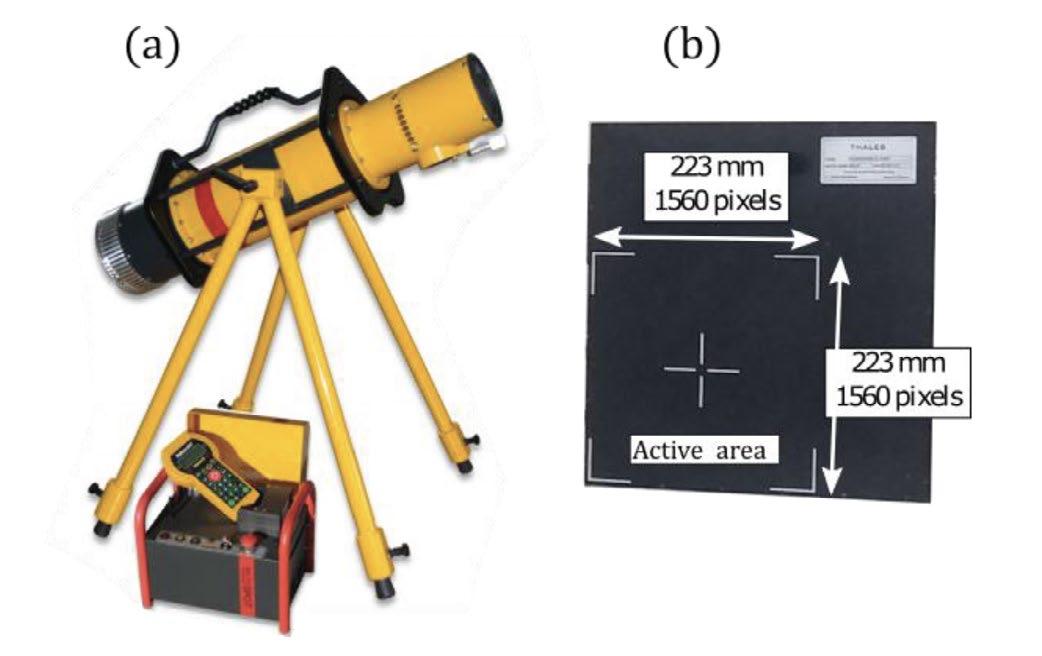
Table 1: characteristics of the detector.
Characteristics Value
Dimensions of the active area (pixels) 1560 × 1560
Size of a pixel (μm) 143 × 143
Scintillator Gadox
Voltage (kV) 40 to 150
Acquisition rate (Hz) 0.1
Year of manufacture 2006
3.2 Additive manufacturing setup
The additive manufacturing setup is located in an open area of 3 square meters. It features a 6-axis robot arm (Staubli RX160) equipped with a set of outer and inner nozzles (Precitec - ZM YC50 DAS 0.5 II and ZM YC50 DIS II).
The laser and the powder are routed to the nozzles via a diode laser (Laserline LMD2000) with a wavelength ranging from 900 to 1200 nm and a beam diameter of 1.4 mm, as well as a powder feeder (Oerlikon Twin 150) that contains two distinct tanks for different materials. The powder used in this study is SS316L, with particles of size 106×45 μm. The evolution of the density of SS316L as a function of temperature is discussed in detail in the appendix (Appendix A: Stainless steel density as a function of temperature). There is one single feeding nozzle, which is coaxial to the laser. The X-ray source and detector are positioned on either side of the robotic arm (Figure 3). In this configuration, the laser remains stationary while a mechanical stage beneath the substrate moves horizontally (along ��⃗) and vertically (along ��⃗) to deposit each layer onto the previous one. The laser being fixed also ensures that the melt pool remains stationary, allowing for extended X-ray exposure times.
3.3 Safety measures
Prolonged exposure to X-rays can result in significant adverse effects. In France, the annual permissible dose for a citizen is set at 1 mSv over a 12-month period.
Figure 2: (a) X-ray source. (b) X-ray flat panel detector (the pictures are not scaled).
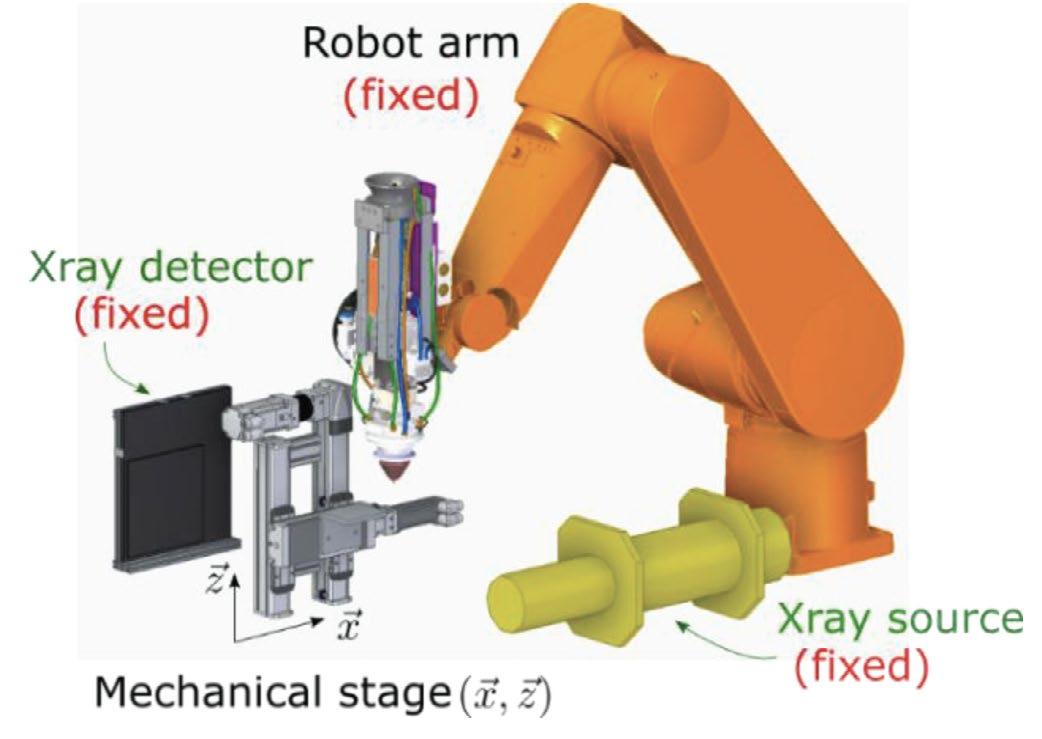
To comply with French regulations, the X-ray dose rate in public areas must be maintained below 80 μSv. month−1 or
0.5 μSv. h−1. In the absence of safety measures, the dose rate around the source measures 2.0 mSv. h−1 per hour at a distance of 1 meter. In the beam axis, this rate increases to 10.2 Sv. h−1 at the same distance, indicating that the lethal dose is reached within 36 minutes.
Lead is an effective material for attenuating X-rays due to its high atomic number, which results in a significant absorption rate of X-rays, as demonstrated by its mass attenuation coefficient shown in Figure 4).
The K absorption edge of lead occurs at 88 keV, where its mass attenuation coefficient experiences a significant increase from 1.9 cm2. g−1 to 7.7 cm2. g−1. This sharp rise in the coefficient explains why lead is such an effective material for attenuating high-energy X-rays.
Figure 4: attenuation coefficient of lead and iron. By covering the X-ray source with lead sheets of 4 mm thickness, the leakage dose rate is significantly reduced. Additionally, a thick wall made of 50 mm lead bricks is constructed along the beam axis to attenuate most of the primary beam (Figure 5).
With this shielding, the dose rate outside the additive manufacturing cabin remains below the permissible level for public areas.
3.4
Choice of X-ray parameters
This section explores the optimal parameters for the voltage (�� in kV) and intensity (�� in mA) of the X-ray source. To evaluate and rank different parameter sets, two indicators of image quality are employed: the signal-to-noise ratio (SNR; equation 2.) and the contrast-to-noise ratio (CNR, equation 3.). The SNR is defined as follows:
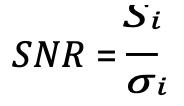
2.
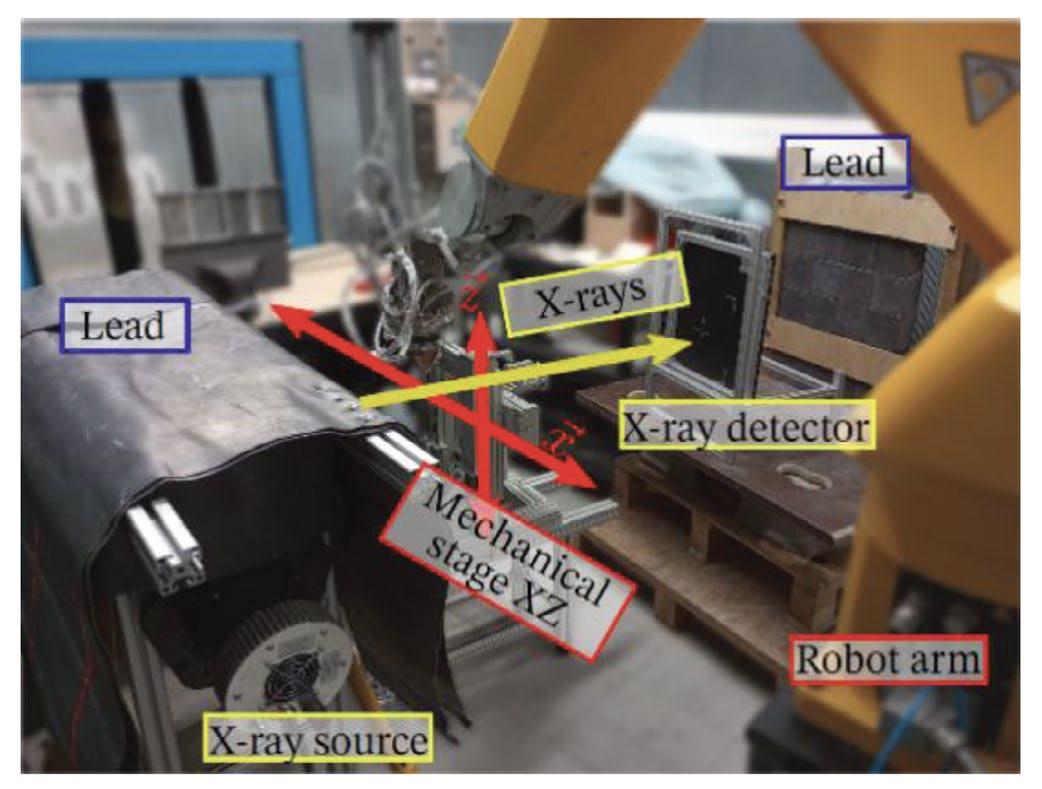
where ���� is the mean signal in a homogeneous area �� of the image (typically measured in gray level), and ���� denotes the standard deviation of the signal within the same area (with the same units as ����). A higher SNR indicates that the noise is less significant. Measuring the SNR is straightforward and can be accomplished prior to the experiment by positioning a 2 mm thick steel plate (which is made from the same material and is approximately the same thickness as the samples under study) in front of the X-ray source. The CNR is defined as follows:
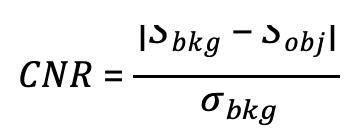
3.
where �������� and �������� are respectively the mean signal in the background and the studied object, while �������� indicates the associated standard deviation. In this case, the area of the object is too small to obtain a reliable standard deviation; thus, the CNR is only normalized by ��������. A higher CNR value indicates that the object is more easily distinguishable from the background. To facilitate the measurement of CNR, images quality indicators were employed, with the wire type being used for this experiment (Figure 6 (a)).
Seven low-alloy steel wires are aligned in decreasing diameters (from left to right: ∅�������� = [0.400, 0.320, 0.250, 0.200, 0.160, 0.125, 0.100] mm). In industrial radioscopy, these wires are positioned above the surface being studied, closest to the X-ray source and furthest from the detector. Here, the wires are used prior to the experiment on a 2 mm stainless steel plate. Both the CNR and SNR were evaluated as functions of the X-ray source's voltage and intensity (Figure 6).
The five points circled in red in Figure 6 (a) represent the highest SNR values. At 80 kV and 4 mA (the highest set of parameters), the signal the maximum value for 14-bit encoded images (approximately 15000 out of a maximum of 214 − 1 = 16383), risking overexposure
Figure 3: 3D visualization of the robot arm and the X-ray equipment.
Figure 5: experimental setup within the additive manufacturing cabin.
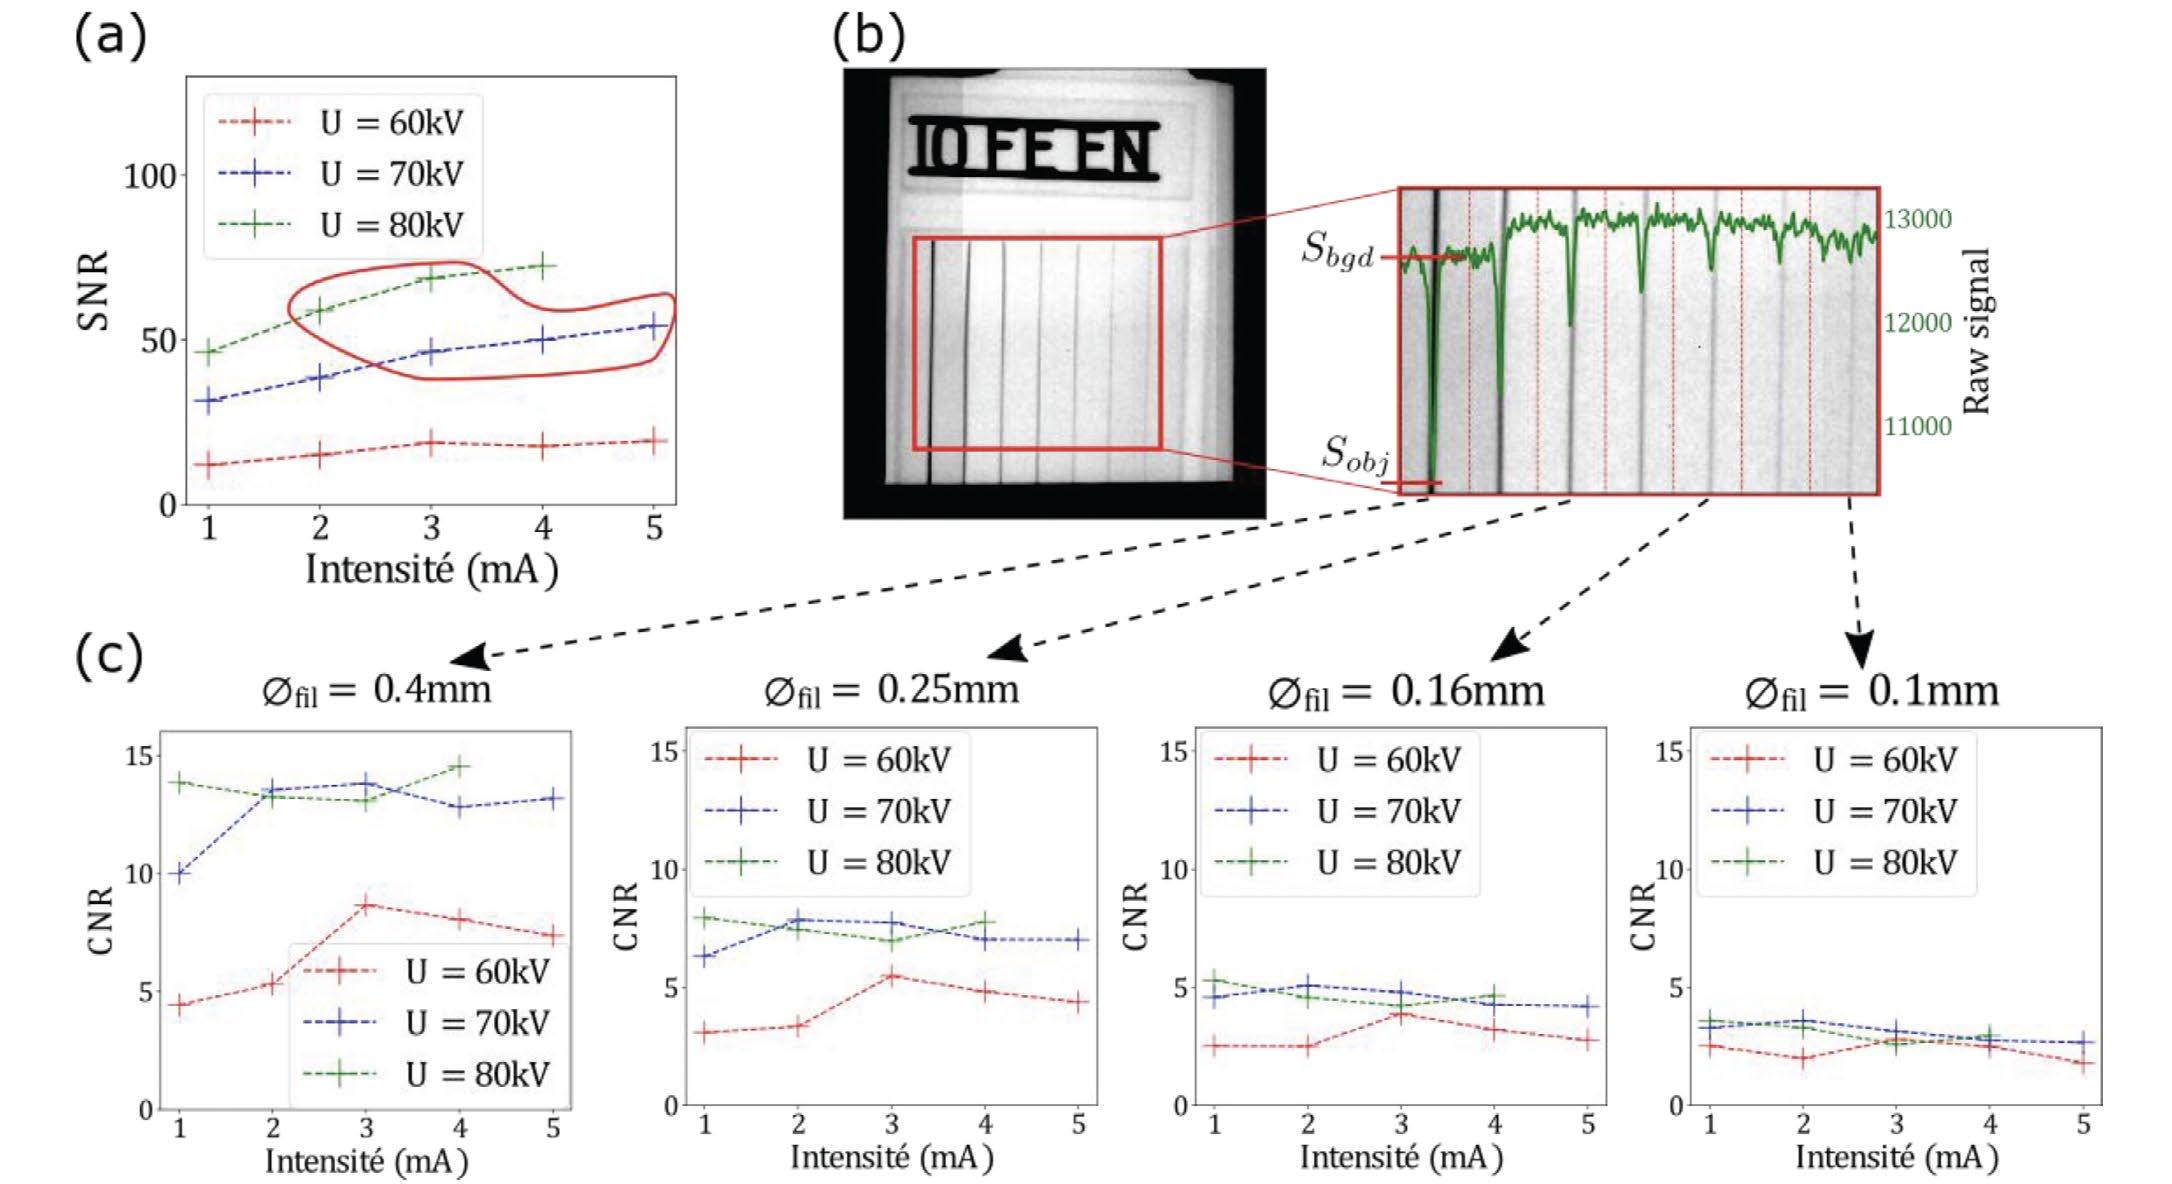
in certain areas. On the contrary, at 60 kV across all intensities and at 1 mA for all voltages, the signal is too low (below 2500), leading to potential underexposed areas.
For each wire diameter, the CNR peaks at voltages of 70 and 80 kV and remains consistent for intensities above 2 mA (Figure 6 (c)). For safety considerations, the lowest set of parameters is selected: 70 kV and 3 mA.
The expected CNR due to the density variation of SS316L is relatively low. According to Beer-Lambert's law, a 12% variation in density has the same impact on the signal intensity as a 12% variation in the thickness of the material being studied. In that case, 0.12 × 2 = 0.24, suggesting a CNR equivalent to that of the wire with a diameter of 0.25 mm, which is quite good, CNR = 7. However, because density variation diminishes gradually around the melt pool (from 12% at its center to 0% at its edges), the actual CNR will be significantly lower, making density variations difficult to identify using conventional image processing techniques.
One potential solution to address this problem is to analyze the contrast in terms of thickness of material penetrated by the X-rays. According to Beer-Lambert's law, the signal on the detector depends on
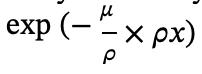
The mass attenuation coefficient remains constant for a specific material. Thus, the effects of density and thickness on signal intensity are equivalent. By assuming a constant thickness, it becomes possible to compute the density variations of the studied object. The
opposite is also true, by assuming a constant density, thickness variations can be computed. For calibration purposes, since studying thickness variations in SS316L is more straightforward, the latter approach will be prioritized, and the experimental setup is calibrated to estimate the thickness of a SS316L object based on the signal measured in the radioscopy (Appendix B: Calibration for SS316L thickness estimation).
Acquisition
and analysis of in-situ radioscopy
All the experimental devices have been described in the previous section. X-ray experiments are conducted with the appropriate safety measures, at 70 kV and 3 mA.
4.1 Image acquisition
For this experiment, ten layers of SS316L (the choice of this material is discussed at the end of this paper in section 5.3 Generalization to experimental data and discussion), are successively deposited onto a substrate. The fabrication parameters are:
• laser power, 300 W.
• Horizontal velocity of the mechanical stage, 3 mm. s−1.
• Length of a layer, 50 mm.
• Break duration between the deposition of two successive layers, 30 s.
• Vertical displacement of the mechanical stage between two successive layers, 0.2 mm.
• Carrier gas flow rate (argon), 6 L. min−1.
• Powder flow rate, 3.4 g. min−1.
Compared to classical fabrication processes, the primary difference in this experiment is the break duration
Figure 6: (a) evolution of the SNR. (b) Radioscopy of the wire type images quality indicators and (c) the evolution of the CNR
between the deposition of two successive layers (the idle time), which typically lasts a few seconds. In this case, a pause of 30 seconds is necessary to ensure two things: allow sufficient time for transferring the image from the detector to the computer and avoid any afterglow effects on the detector.
Indeed, the scintillator in the detector requires time to reset after an exposure to X-rays. This extended idle time alters the thermal cycle of the part being built, with heat accumulation in the substrate being less impactful on the initial layers.
With these parameters, it is possible to make one radioscopy acquisition per layer (Figure 7). Zooming in under the laser reveals a slight bump, indicating the newly deposited layer and the presence of the melt pool. Two experiments were conducted under identical
conditions to compare the results (Figure 8 (a) and (b)). In the second experiment, the acquisition started after the first layer, which is therefore absent from the data.
In both sets of images, the height of the deposited layer decreases as the number of layers increases. Notably, the height of the bump is nearly three times higher in the first two layers compared to layers 9 and 10. This behavior can be attributed to a well-known self-regulation phenomenon in additive manufacturing processes [42].
The objective of analyzing these images is to identify the contours of the melt pool, which should appear lighter due to the variation in density. However, no apparent gray level variations are discernible to the naked eye, prompting the use of image analysis algorithms to process these images.
4.2 Image analysis
A wide variety of image analysis techniques can be employed depending on the specific case of study. In this context, the radioscopies are presented in gray scale, and the objective is to highlight low-contrast areas. Four methods have been studied:
• the entropy (Figure 9 (a)). This method provides information about the amount of information contained in an image. A blank image would have an entropy close to 0, while a well-defined outline will exhibit a higher entropy. It is computed via the skimage library [43].
• The moment of order ���� (��11, Figure 9 (b)) that on an image �� of dimensions �� × ��
Figure 7: (a) whole radioscopy of the laser and the layer being deposited on the first and tenth layers. (b) Zoom in under the laser.
Figure 8: all 10 radioscopies of (a) the first experiment and (b) the second experiment.
pixels with �� and �� the pixel coordinates (�� ≤ ��, �� ≤ ��) is computed as a function of the �� nearest neighbors:
• The morphological gradient (Figure 9 (c)), that is the difference between the dilation and erosion of a given image, corresponding to the dilate and erode functions in the OpenCV library [44].
• Otsu's thresholding (Figure 9 (d)), that is an iterative algorithm that automatically determines optimal thresholds within a given image [45].
Finally, a fifth method consists in trying to estimate the thickness of the wall based on a calibration done prior to the experiment (Appendix B: Calibration for SS316L thickness estimation, Figure 9 (e)). In this particular image, the computed thickness of the manufactured layers appears less than 2 mm. This discrepancy arises because the last layer takes on a semi-cylindrical shape, resulting in a consistently reduced thickness at the top of the layer.
This calibration method assumes that the material being analyzed is homogeneous and possesses a constant density.
However, this is not true for the melt pool, which is liquid and therefore less dense. Consequently, the variation in density should translate as a thickness variation in the computed results.
This method is particularly valuable as it is physicsbased, modifying pixel values in accordance with BeerLambert's law.
However, none of these five methods are sufficient to clearly highlight the contours of the melt pool and facilitates its identification. The entropy and the moment of order 11 both emphasize the bump, but this is primarily due to the 45-degree contour between the air and the solid part. Similarly, the morphological gradient and Otsu's thresholding detect the separation between the air and the solid material, but the contrast of the melt pool remains too low to be discernible. While computing the thickness of the part provides valuable insights, any potential variations in thickness within the melt pool area are obscured by the natural geometric variations of the layer, which can span several hundred micrometers. Besides, it is exacerbated by the surface tension of the deposited layers, which tend to form a spherical shape, resulting in increased thickness at their base.
Finally, the contrast between the melt pool and the surrounding material is too subtle to be identified using conventional image analysis techniques. More advanced processing techniques have been suggested, such as a template-Bayesian based approach by Lindenmeyer et al. [24] to segment the melt pool on synchrotron absorption images. Despite showing promising results, this method also relies on an edged segmentation that is inefficient on the current data.
The first experimental solution to this problem would be to invest in a more suitable detector, with for instance, a higher frame rate in order to study 2 successive pictures and evaluate relevant gray level variations. A faster detector would also allow to take flats and darks during the experiment and get a better correction of the acquired pictures. A more compact detector, with eventually a smaller active area, would also be valuable as it could be place further away from the melt pool and allow its magnification due to the divergence of the beam. Future studies will highlight the impact of these solutions. For now, a numerical solution is preferred, the development of a cheap and fast encoder-decoder (E-D) network to identify areas that are indistinguishable to the naked eye. Due to the restricted number of experimental images, it is necessary to generate simulated data in order to train the E-D and then generalize it to real experimental images.
Dataset creation
The goal of this section is to generate a dataset that contains radioscopies of the melt pool, associated with labels that represent the shape of the melt pool. This dataset will be used to train multiple E-D networks aimed at identifying the melt pool in low-contrast X-ray images.
The melt pools are generated with a three steps simulation:
• the thermal simulation of a laser moving onto a nonplanar surface (tuned according to experimental results from a previous study [16]),
• the discretization of these thermal results in terms of density (reflecting the changes in material properties due to phase transitions),
Figure 9: (a) entropy. (b) Moment of order 11. (c) Morphological gradient. (d) Otsu's method with 5 thresholds. (e) Thickness.
• the simulation of an X-ray shot directed at the densitydiscretized results.
The first and last steps of this process are the most expansive in terms of time and computational resources. To streamline the simulations and optimize computational efficiency, several simplifying assumptions are made about the laser source, the X-ray source and the material properties. All these aspects are discussed in details in the appendix (Appendix C: Dataset creation).
5.1 Visualisation of the dataset
The dataset consists of two main components:
• an input, a simulation of a radioscopy of the melt pool (via the 3 steps simulation),
• an output, a binary image of the melt pool (derived from the thermal simulation by assuming that every voxel with a temperature exceeding 1673 K corresponds to the melt pool).
A total of 162 thermal and X-ray simulations are performed, with laser power varying between 100 and 950 W and velocities ranging from 1 to 9mm. s−1, in order to get various sizes and shapes of melt pool. At the lowest powers and highest velocities, the heat input is insufficient to create a melt pool (Figure 10 (b)). However, these data are valuable for training the model to recognize scenarios where no melt pool is present in the X-ray image (due to insufficient heating for instance). The proportion of images without melt pool accounts for 15% of the dataset.
To enhance the dataset further and avoid the melt pool always being centered in each image, a random offset is added to the melt pool position (Figure 10 (a) and (c)). At this point, the dataset is completely created, made of 4050 images, and ready to be used to train and test the E-D.
5.2 Encoder-Decoder architecture
An E-D is a type of neural network that consists of two back-to-back convolutional networks: an encoder and a decoder (Figure 11).
The input is an image �� with dimensions (h × �� × ��), where h represents the height, �� the width, and �� the number of color channels (for a standard RGB image, �� = 3). The image is processed by the encoder ��, which converts the input into a new representation �� (typically a compressed version capturing the main features of the input based on the training).
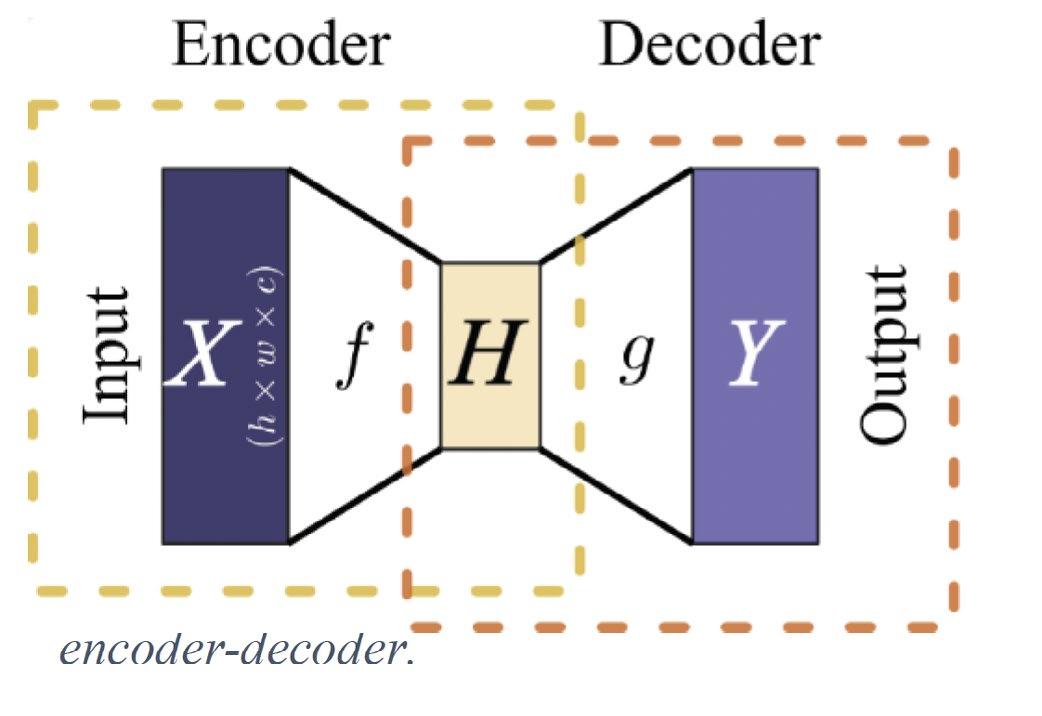
This representation is then passed through the decoder ��, resulting in a new output image �� with the desired dimensions [46] provides a more detailed review about convolutional neural networks).
5.2.1
Layout
In this study, three architectures of E-D have been studied, inspired by LeNET5, AlexNET, and VGG16 (Figure 12).
The convolution layers, indicated by the red arrows, all have a stride and padding of 1 with a kernel size of (3,3) (see Dumoulin et al. [47] for a more detailed discussion on the impact of these parameters). After each of these layers, the rectified linear unit activation function is applied [48]. The max-pooling layers [49], represented by the pink arrows, reduce the size of the data.
Figure 10: simulation of the radioscopy, the thermal simulation and the associated binary label: (a) with a small melt pool,
(b) without melt pool (������������=100 W and ������������=9 ���� ��−1) and (c) with a big melt pool and an offset.
In contrast, the decoders mirror the architecture of the encoders but in reverse: transposed convolutions replace the standard convolutions, and up-sampling layers replace the max-pooling ones.
5.2.2
Training process
The training process involves adjusting the parameters of the layers to produce an output that aligns with the labels corresponding to given inputs. First, the dataset
Figure 10: simulation of the radioscopy, the thermal simulation and the associated binary label: (a) with a small melt pool, (b) without melt pool (������������=100 W and ������������=9 ���� ��−1) and (c) with a big melt pool and an offset.
Figure 11: simplified representation of an encoder-decoder.
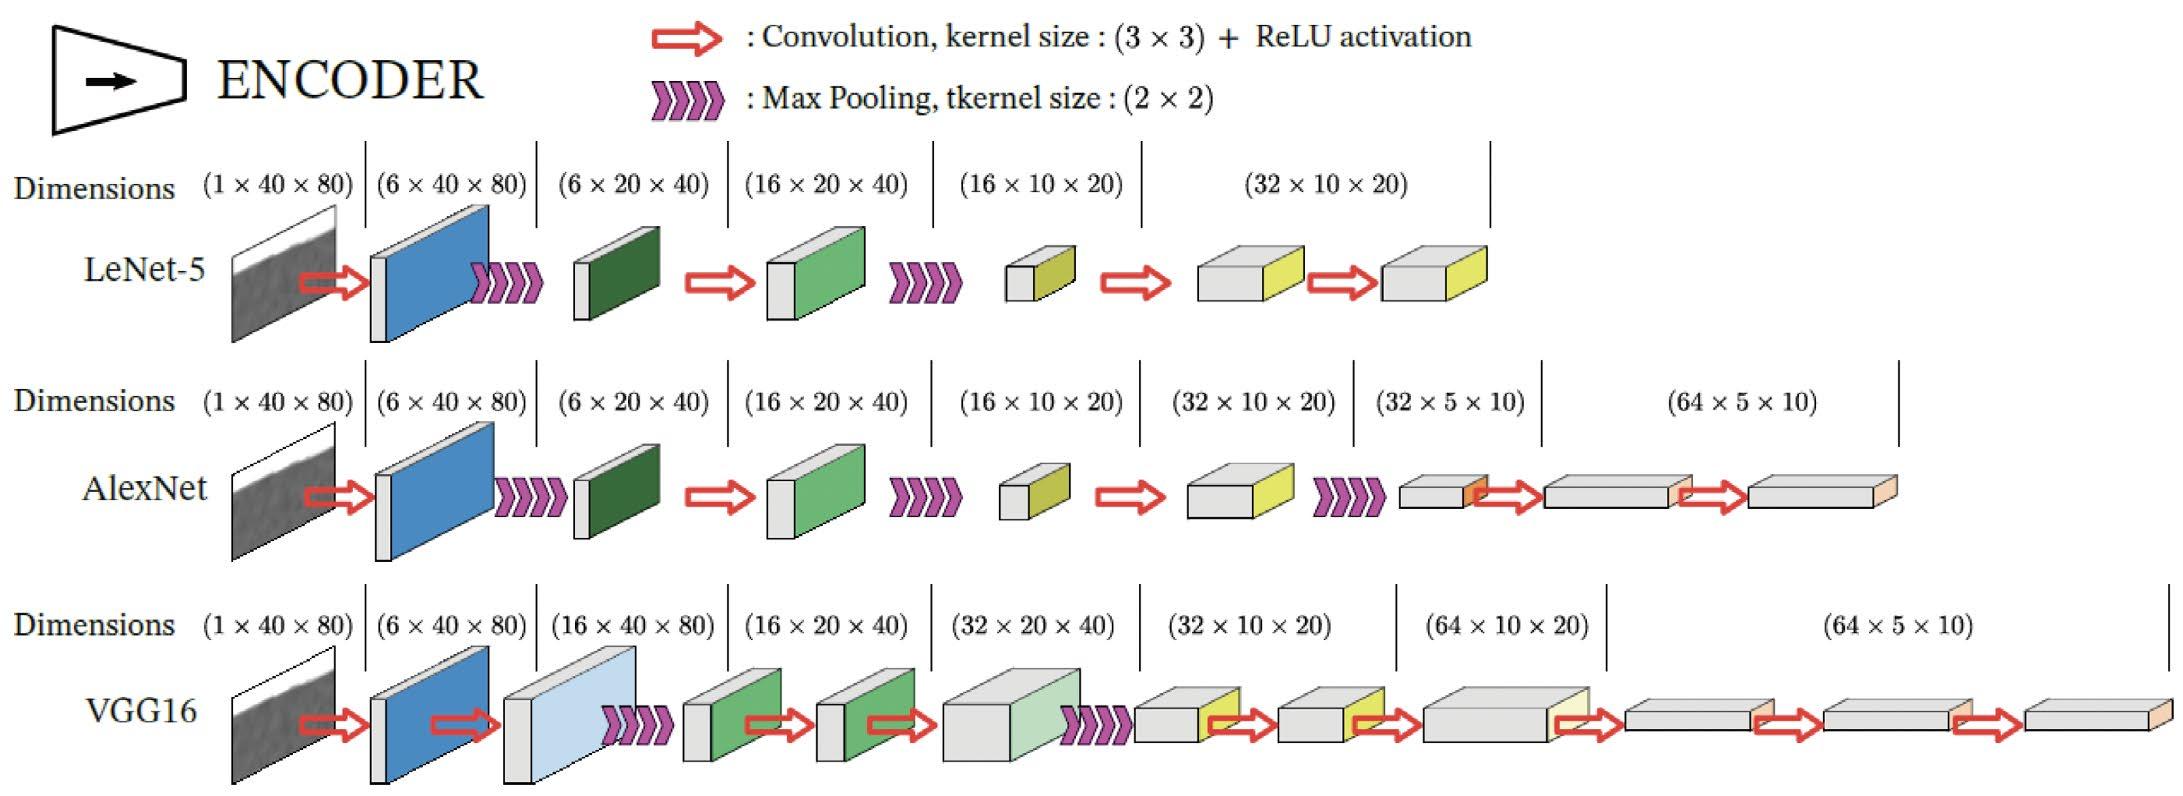
is divided into a training set (70% =2835 inputs) and a test set (30% = 1215 inputs), with the test set being completely excluded from the training process.
The training data is further divided into batches of 50 and 200 images in order to reduce the risk of overfitting and speed up the optimization of the E-D. It is important to make the difference between an epoch and an iteration; for example, with 1000 images in the training set and a batch size of 200, completing one epoch requires 5 iterations.
To quantify the E-D’s error, the output (����) is compared with the associated label (����) using the Mean Squared Error (MSE, equation 4.):

with:
• ���� the label of the input,
• ���� the prediction of the input by the autoencoder,
• �� the number of data in the batch.
After processing each batch, the E-D coefficients are updated, and the results are recorded over the course of 600 epochs.
5.2.3 Results and loss
At the end of each epoch, the mean loss on the training set (referred to as the training loss, Figure 13 (a)) and the mean loss on the test set (referred to as the generalization loss, Figure 13 (b)) are recorded. An effective neural network strikes a balance between these two-error metrics.
For all architectures, the training loss consistently decreases as the number of epochs increases. On the opposite, the generalization loss also rapidly decreases during the first hundred epochs, after which it reaches a minimum and begins to increase gradually. This increase indicates signs of overfitting. Additionally, the batch size influences both the training and generalization loss; larger batch sizes tend to raise the training error but result in a slightly lower generalization error, which is more desirable to reduce risks of overfitting.
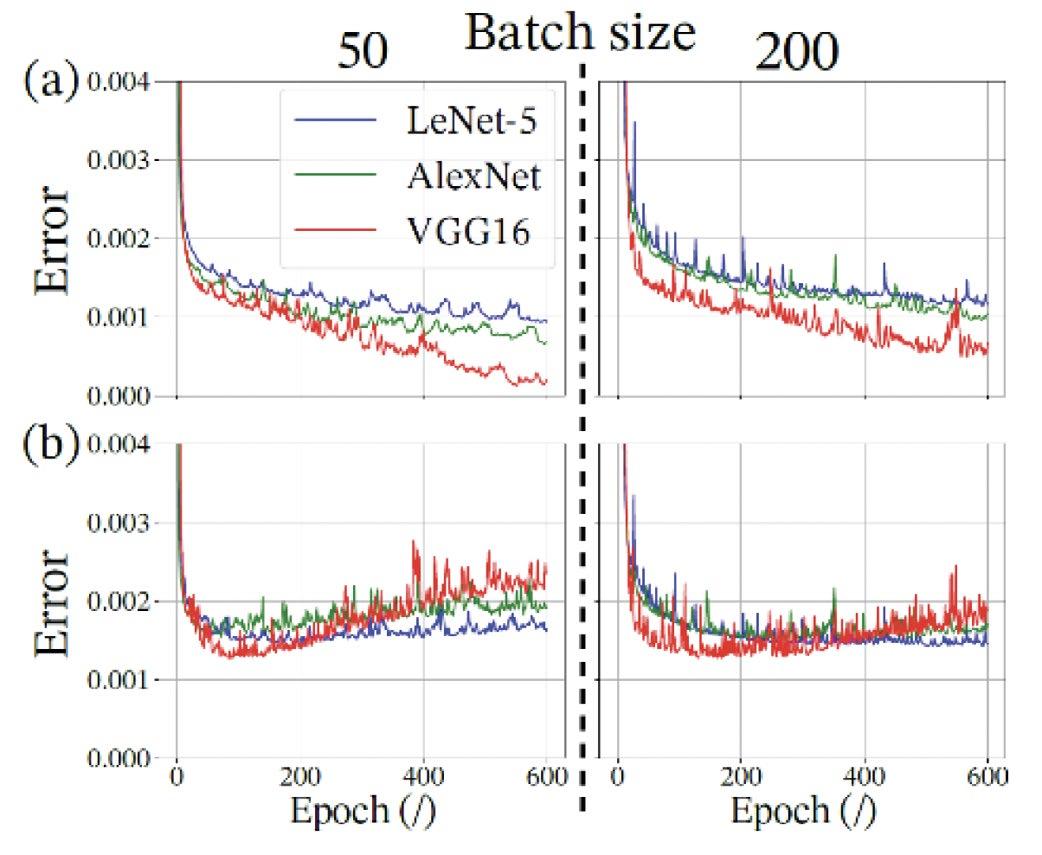
VGG16 is the most complex architecture among the three, and exhibits slightly better performances than the others. The results on simulated data are shown in Figure 14.
The color legend on the output can be interpreted as the probability that a particular pixel belongs to the melt
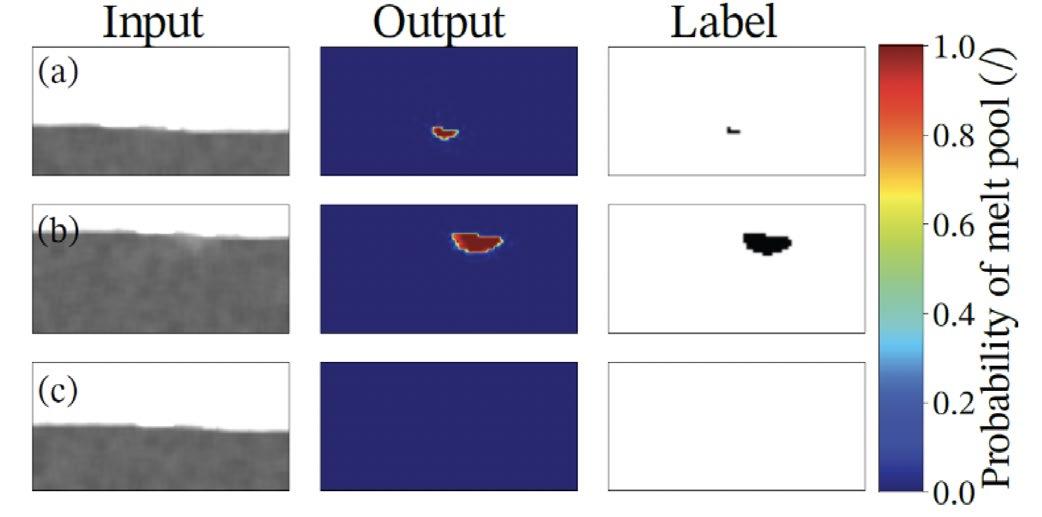
Figure 12: architecture of the 3 E-D inspired from LeNET5, AlexNET and VGG16.
Figure 13: (a) training loss. (b) Generalization loss
Figure 14: identification of the melt pool onto the simulation of the test set with the VGG16 inspired ED, with batches of 200 and trained during 400 epochs: (a) little melt pool, (b) big melt pool with an offset and (c) no melt pool.
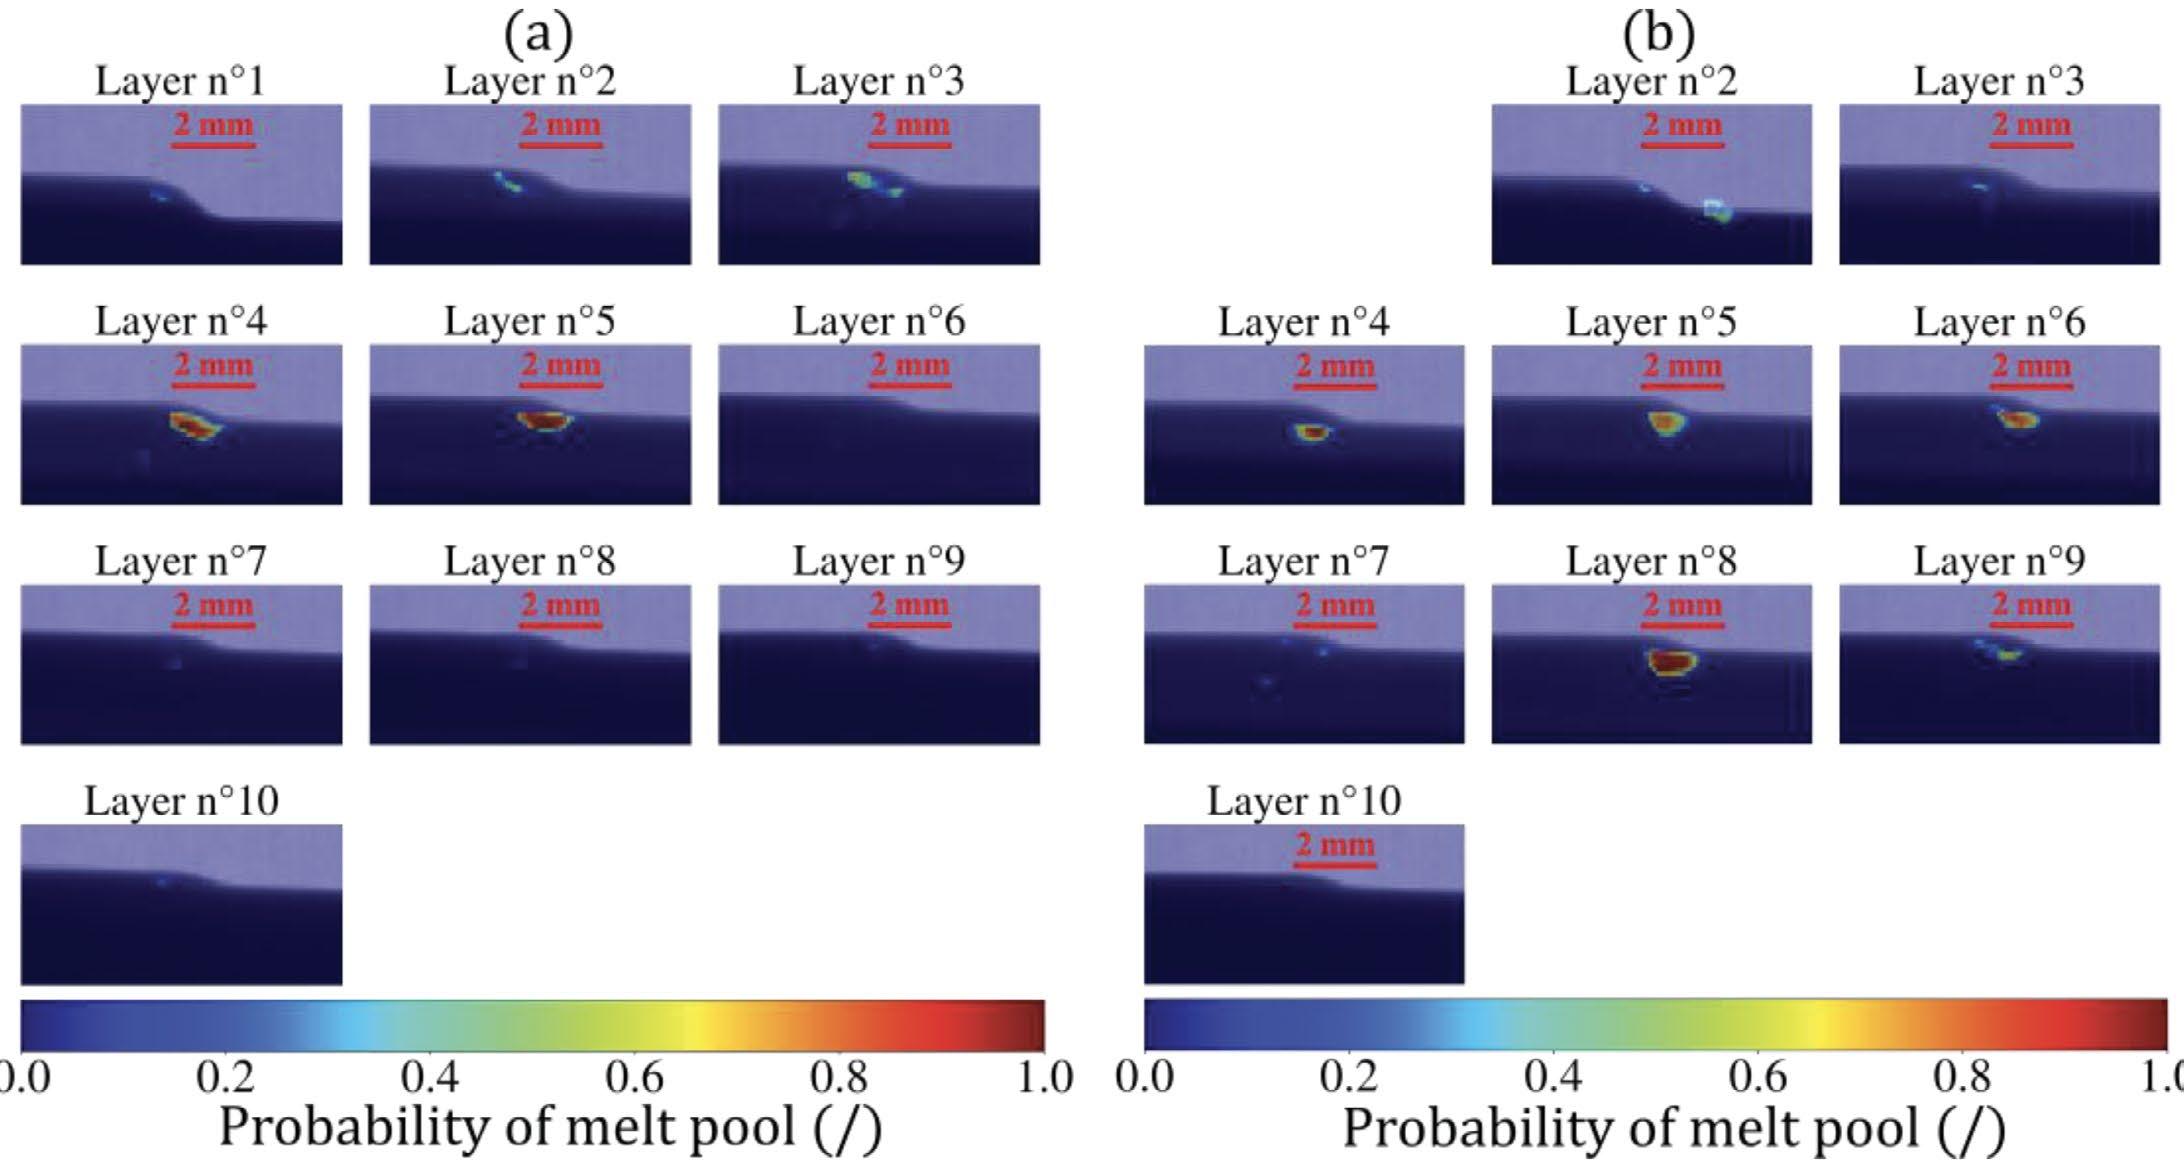
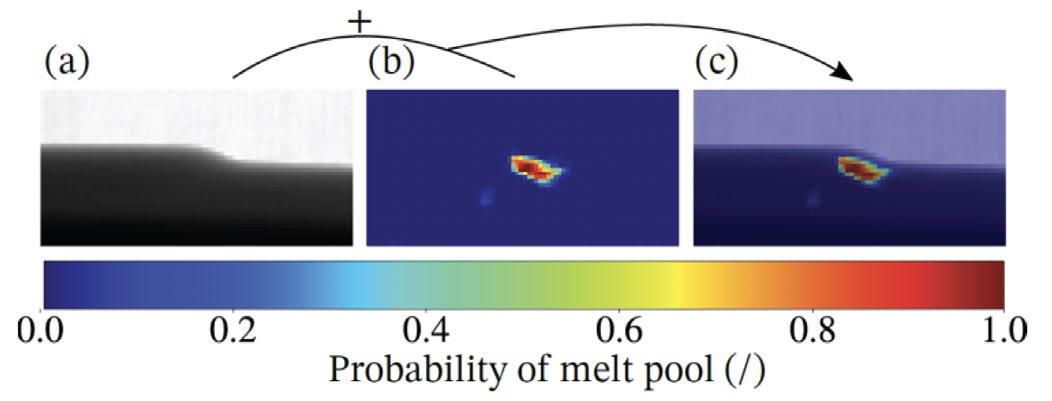
pool. In cases where there is no melt pool (Figure 14 (a)), a bigger one (Figure 14 (b)) or a medium-sized one (Figure 14 (c)), the E-D accurately draws its shape.
The next step is to evaluate how effectively this model, trained on simulated data, performs on experimental radioscopies.
5.3 Generalization to experimental data and discussion
The primary objective of this study is to identify the melt pool in very low-contrast in-situ radioscopies. The previous results demonstrate that VGG16 E-D can effectively detect the melt pool on simulated data, regardless of its size and position. This section aims to assess how well this model generalize to experimental images. Currently, transfer learning is a prominent area of research that involves training large neural networks on supercomputers to perform source tasks. These same networks are then partially retrained on more accessible hardware for target task.
In this study, the source task involves identifying
the melt pool in simulated radioscopies, while the target task focuses on identifying the melt pool in experimental images. However, here the number of experimental data is both insufficient and unlabeled to be able to retrain the E-D. Thus, all flattened radioscopies obtained during the experimental tests (Figure 8) are directly used as inputs, and the VGG16 E-D is not trained further than on simulated data, with batches of 200 images over the course of 400 epochs (Figure 16).
To visualize the results, the outputs of the E-D are overlaid on the original radioscopies (Figure 15).
VGG16-inspired E-D shows promising results. In the first experiment (Figure 16 (a)), it successfully identifies the melt pool and locates it correctly within layers 3, 4, and 5. In the second experiment (Figure 16 (b)), similar results are observed, with the melt pool detected directly beneath the bump in layers 4, 5, 6, and 8.
On the pictures, the average size of the melt pool is 1.5 mm, which is in accordance with results from a previous work on the same additive manufacturing setup, using a bichromatic thermal camera [16]. Both devices could not be mounted at the same time due to the risk of X-rays damaging the electronics of the camera. These melt pool dimensions are also in accordance with more complex simulations results of this process [50]. These results are very encouraging to pursue further studies to monitor additive manufacturing process with X-rays. The experimental dataset size is insufficient to get good statistics out of these measurements, which also suggest the necessity to invest in a detector with a much higher frame rate. Alternatively, the tremendous progress in artificial intelligence could allow to find a
Figure 16: results of the VGG16 architecture on the experimental radioscopies (batch size 200, 400 epochs). (a) First experiment. (b) Second experiment
Figure 15: (a) flattened radioscopy (input of the ED). (b) Output of the ED. (c) Superimposition of (b) onto (a) for a better visualization.
model capable of identifying low-contrast differences in random images. It would then require substantial resources for training, including a large dataset where once again a high frame rate detector would be much appreciated.
At this point, the readers might also wonder what is the advantage of this method since melt pools have been observed with a very high resolution in synchrotron, for instance on ID19 at the European Synchrotron Radiation Facility [51], and why studying SS316L rather than aluminum that has a much lower density and should exhibit a better contrast on X-ray radioscopies.
Synchrotrons experience target a different scientific problematic. Their aim is more targeted at material science, to discover how the melt pool shapes evolve, and how is it influenced by processing parameters. From a technical perspective, it is impossible to monitor an industrial process using a synchrotron source. Thus, the aim of this study is to demonstrate and overcome the challenges that industry will face when trying to implement online monitoring on their manufacturing process.
Regarding the choice of SS316L, once again it is relevant from an industrial perspective as it is a widely used material for medical applications, energy and aerospace. Besides, aluminum powder is explosive and requires a highly controlled atmosphere to be used in LMDp, which is not the case in this particular open AM cabin. Usually, additive manufacturing processes using aluminum are wire based (wire arc additive manufacturing for instance). Such process could indeed be studied with the exact same experimental device, but it is outside of the scope of this article.
Conclusions
This work has demonstrated the feasibility of in-situ X-ray NDT on industrial additive manufacturing setups. The system consists of a detector, a movable X-ray source, and lead sheets to ensure safety concerning X-ray exposure. The source's operational parameters were optimized to maximize the SNR and the CNR. However, the radioscopies obtained with this setup exhibit low contrast, making it difficult to distinguish the density differences between the melt pool and the solid areas using conventional image analysis techniques.
To further investigate the image processing analysis, three encoder-decoders architecture have been designed to try to enhance the contrast. Due to the restricted number of experimental data, a three-step simulation (thermal simulation, temperature to density transposition and deterministic X-ray simulation) has been developed to simulate 2D radioscopies and create a full dataset of various melt pool sizes to train the different models. By analyzing the training and generalization losses, the VGG16-inspired architecture is the one that showed better performances on simulated data. This model has then been directly transposed onto experimental data, without further training, and yielded encouraging results, successfully identifying the melt pool in experimental images.
The main limitation during this study appeared to be the acquisition rate of the 20 years old detector which significantly limited the number of experimental images collected. Upgrading to a higher acquisition rate would facilitate the collection of multiple images during the deposition of one single layer, thereby generating more experimental data and providing much more statistics to compare images over shorter time frames. It would also allow for a better normalization of the images by taking more dark and flat pictures. Finally, the thermal and X-ray simulations greatly help to pre-train the fast E-D network and will be beneficial to consider transfer learning and enhance their generalization for future studies.
Acknowledgements
This work was supported by the institute Carnot Ingénierie@Lyon through the TORTELLINI project, this support is gratefully acknowledged.
Data accessibility statement
The data that support the findings of this study are available from the corresponding author, Loïc Jegou, upon reasonable request.
Appendix A: Stainless steel density as a function of temperature
The evolution of the density as a function of temperature has been extensively investigated, first in a solid state [52] and then in a liquid state [53]. Thanks to these studies, the density of SS316L can be expressed as a function of temperature (equation 5., Figure 17).
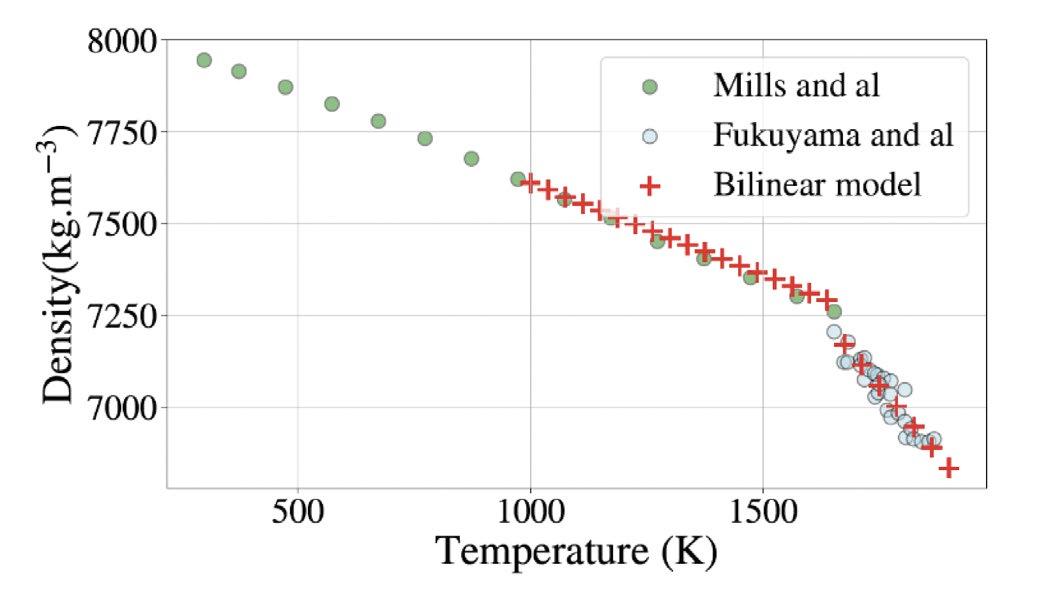
17: evolution of the density as a function of the temperature for solid and liquid SS316L.
Research on this specific additive manufacturing process has indicated that the maximum temperature can approach 2000 K [16], resulting in a density variation of approximately 12% between the solid and liquid regions.
Appendix B: Calibration for SS316L thickness estimation
Beer Lambert's attenuation law, as stated in equation
Figure
1., is applicable only to monochromatic energies. As a matter of fact, the mass attenuation coefficient varies with the energy of the photons; lower-energy photons are more easily attenuated by a given thickness of material. This phenomenon is referred to as beam hardening.
To calibrate the polychromatic beam for a specific material, a series of plates with known thicknesses are placed in front of the X-ray source, and the resulting signal is measured on the detector (Figure 18 (a)).
This calibration is specific to a given detector in a particular configuration:
• distance between the X-ray source and the object, and the object and the detector (respectively 680 mm and 520 mm in this experiment),
• voltage and intensity of the X-ray source (respectively 70 and 3 mA in this experiment). For each plate, the signal received on the detector (��) is measured and normalized by the signal
��0 when a 2 mm plate is placed between the source and the detector. Although this measurement is typically performed without any plates between the source and the detector, doing so often leads to detector saturation. The 2 mm thickness corresponds to the expected thickness of the manufactured parts. This normalized signal is referred to as the flattened signal (����), which is then directly fitted using an equation inspired by Baur et al. [54] (equation 6.).
���� = exp(���� − ����1−��) 6. with ��, �� and �� the three parameters to optimize.
Table 2: Calibration of the setup for SS316L.
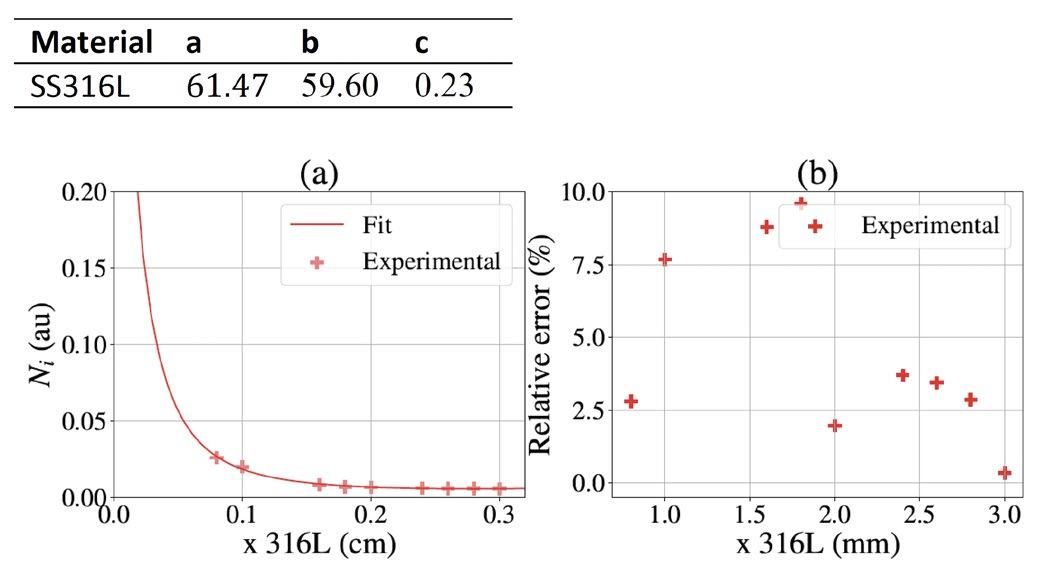
316L object based on its signal on the detector. This is accomplished by solving equation 7. using a numerical method, such as the Newton-Raphson algorithm.
���� − ����1−�� − ln(����) = 0 7.
This calibration is particularly valuable in the context of additive manufacturing, as it offers an alternative method for analyzing the acquired images. Moreover, the thickness calibration of the source can also be used to compute the density for a specified thickness, enhancing the ability to characterize the material properties of the produced parts.
Appendix C: Dataset creation C.1 Assumptions
The overall time of simulation (thermal and X-ray) is reduced with the following assumptions:
• thermal properties are constant and independent from the temperature,
• the thermal convection loss is neglected,
• the laser source is Gaussian,
• the geometry of the melt pool is approximated by polynomial functions,
• the X-ray scattering is neglected,
• the X-ray source is isotropic.
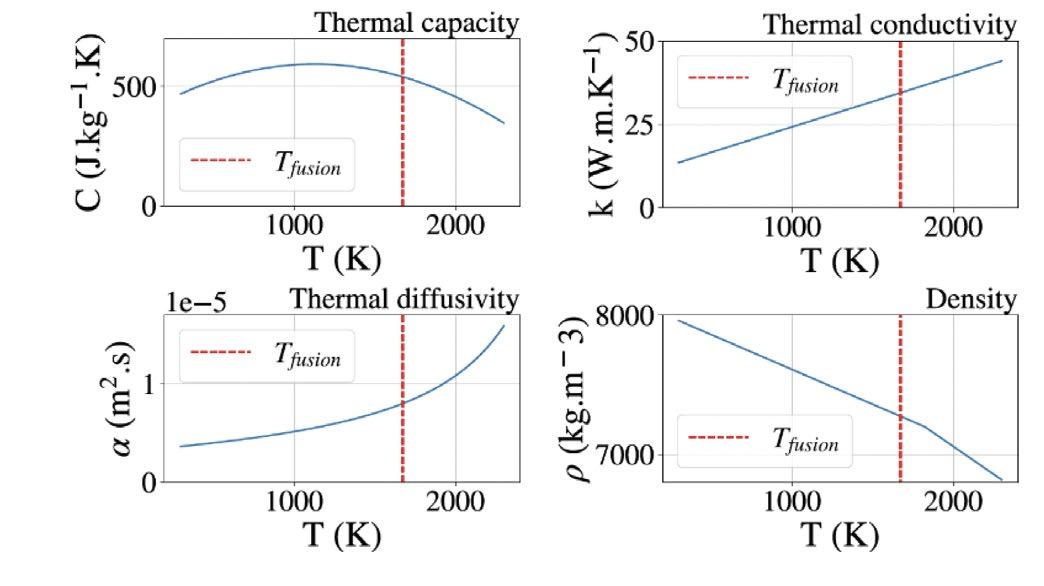
The relative error between the measured thickness and the computed one using the calibration results (Table 2) is less than 10% (Figure 18 (b)). For thickness exceeding 3 mm, the measured signal is too low, as nearly all X-rays are absorbed by the material. Given that the studied objects have an approximate thickness of 2 mm, the calibration is highly effective and provides a reliable method for calculating the thickness of a homogeneous
The first assumption is the most constraining since the temperature equation is highly nonlinear, and every property of the material is temperature-dependent (Figure 19). However, to obtain an analytic solution to the thermal problem (significantly faster than using finite element methods) it is essential to impose constant values for the thermal properties, specifically: the thermal capacity (�� = 500 J. kg−1. K), the thermal conductivity (�� = 20 W. m. K−1), the density (�� = 7800 kg. m−3) and the thermal diffusivity (�� = ��/ ���� in m2. s).
Assumptions (2) and (3) are common in thermal simulation of additive manufacturing processes (although nowadays Goldak laser sources are also common in this domain), and the fourth simplifies the resolution of the analytic problem.
Figure 18: evolution of (a) the signal and (b) the relative error on the computed thickness, as a function of the thickness of SS316L.
Figure 19: evolution of material parameters as a function of the temperature.
The last two assumptions concerning the X-ray simulation are both aimed at reducing computational time and are supported by experimental evidence. When the distance between the object and the detector is large enough, the scattering of X-rays is negligible (air gap technique), and when observing a small area of the detector, the isotropic assumption holds.
C.2 Analytical simulation of the melt pool
The thermal simulation consists in applying a moving Gaussian heat source onto the non-planar surface of the melt pool (Figure 20 (a)). This simulation is inspired by the work of Fathi et al. [55].
The geometry of the melt pool is simplified and governed by two equations, one for its height (h(��, ��), equation 9.) and another for its width (��(��), equation 8.).
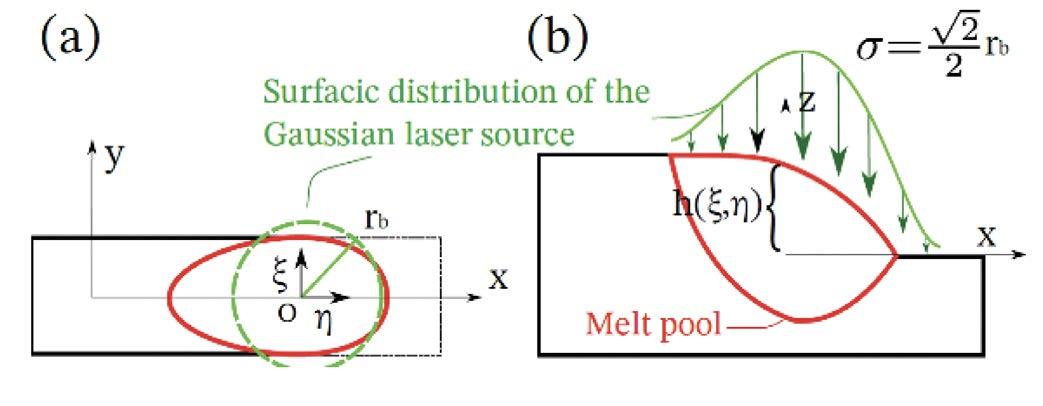
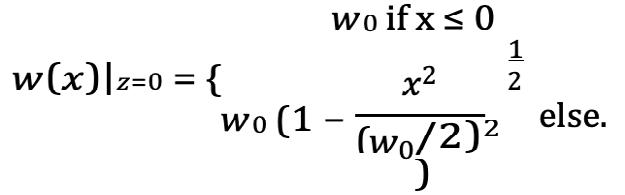
with:
• �� ∈ [−L2, L1]
• ��0 the maximum width of the melt pool along the �� axis (i.e at its center, x=y=0),
• L1 + L2 the total length of the melt pool along the �� axis. And 9.
The Gaussian heat source is applied onto this nonplanar surface (Figure 20 (b)) such as:
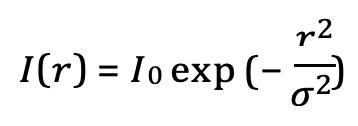
with:
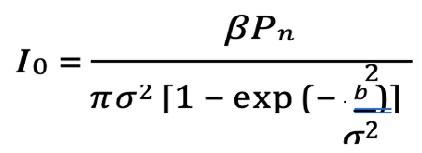
with:
• ��0 the nominal intensity of the laser (W. m−2),
• �� the radial distance regarding the center of the laser (m),
• �� the effective radius of the laser �� = ����√2 (m),
• ���� the radius of the laser (m),
• �� the laser's absorptivity,
• ���� the power of the laser (W).
And the integrated laser power ��0 (in W) onto the surface can be written in the mobile set of coordinates ( ��⃗, ��⃗) (equation 10.). 10.

Finally, the analytical expression of the temperature then writes:
With:
• ������������ the laser velocity (in mm. s−1).
C.3 From temperature to density
In order to simulate an X-ray shot of an object, three properties of the given object are required: geometry, chemical composition, density. For this study, the material, SS316L, is homogeneous, which means that its chemical composition is the same (Table 3).
Table 3: composition of SS316L for this simulation. W is the weight percentage of the given element.
However, the temperature (i.e. the density) of the melt pool varies a lot. In order to simulate an X-ray shot onto it, it has to be discretized into multiple voxels (here, the chosen dimensions were 25 × 20 × 10 voxels of size 0.1 × 0.1 × 0.1 mm) with each the same chemical composition but a different density. Thanks to the results of the analytical simulation (Appendix C.2 Analytical simulation of the melt pool), it is possible to compute the density of each single voxel depending on its temperature (Figure 21 (a) towards (b)).
The rest of the substrate, which is solid, has a constant density (�� = 8000 kg. m−3).
All these elements altogether make the object studied in the X-ray simulation (Figure 21 (c)). The minimum size of voxels is limited by two factors:
• the computational time. The more single objects, the more computational resources are needed.
Figure 20: (a) upside and (b) side views of the simplified geometry of the melt pool and the Gaussian laser source applied onto it.
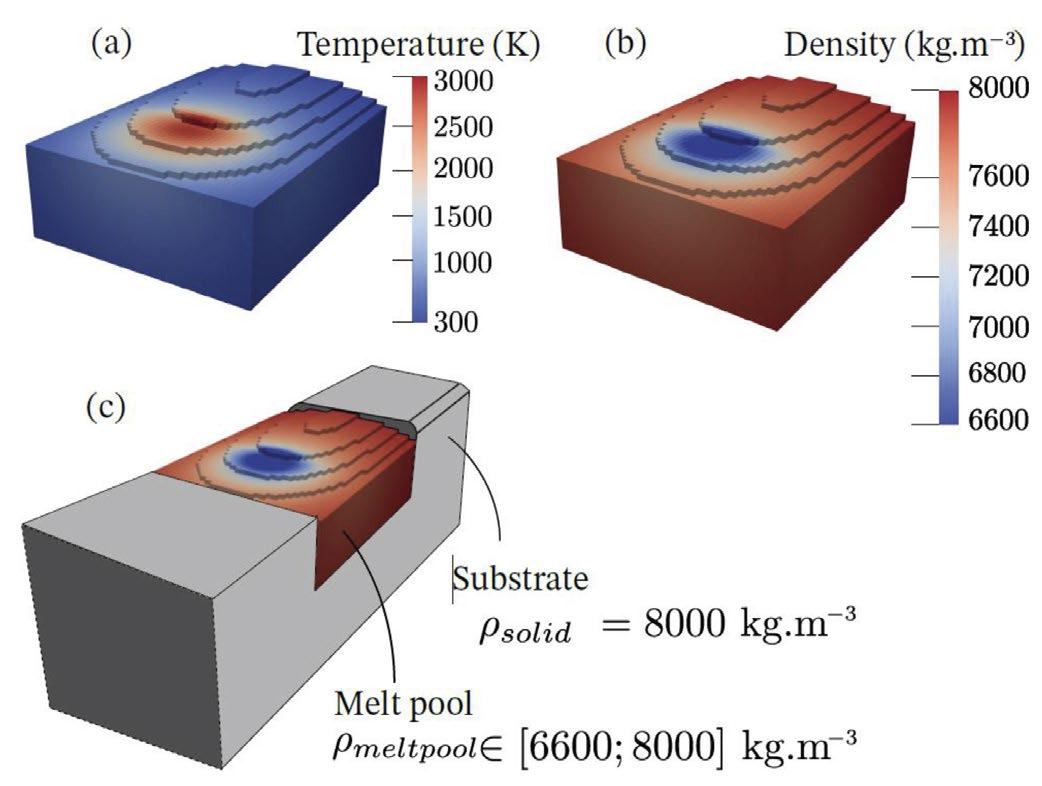
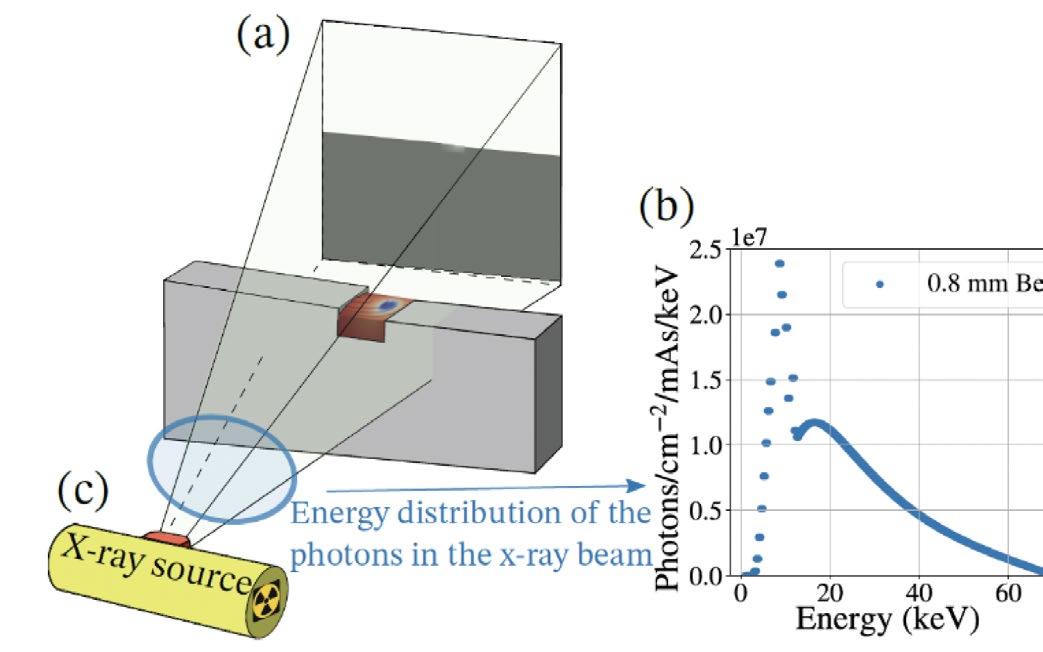
C.5 Results and image processing
• The photons-voxels interactions. The software uses a non-random process to simulate the X-ray beam, and the interaction between photons and voxel edges creates computational difficulties.
These objects are then used in the X-ray software introduced thereafter.
C.4 Simulation of radioscopy
The radioscopy simulation is structured around three principal components: the X-ray source, the detector, and the studied object.
All simulations are conducted using the software Virtual X-ray Imaging (VXI) [56]. The specifications for the X-ray source and detector are derived directly from the experimental setup (section 3.1 X-ray source and detector). The X-ray spectrum (Figure 22 (b)) is generated with the Python library Spekpy [57] with a 0.8 mm Beryllium filtration, a voltage of 70 kV, and the target material in tungsten.
The detector (Figure 22 (a)) is in Gadolinium oxysulfide (Gadox), with 260 × 260 pixels of size 143 × 143 μm. The X-ray beam is isotropic so that it illuminates the entire detector area.
The spatial arrangement mirrors the experimental conditions with the following distances:
• source to object: 680 mm,
• object to detector: 520 mm.
Since these X-ray simulations are deterministic (meaning that two independent simulations with identical parameters will provide the same results), noise and blur (resulting from the focal spot size) are added during a post-processing step.
The results of these simulations yield 2D images with gray level values representing the energy deposited in the detector due to the quantity of X-rays that pass through the object.
To facilitate a meaningful comparison between these simulations and actual radioscopies, three image processing operations are applied successively:
• the first step involves flattening the image, which consists in dividing the original image by a radioscopy taken without an object (Figure 23 (a) to (b)). This operation normalizes the picture by ensuring that the signal in the air regions is set to 1. Since experimentally the detector saturates at 70 kV and 3 mA, the flattening is accomplished by dividing the original picture by a radioscopy obtained with a 2 mm thick plate of SS316L. As a result, the flattened signal in solid areas equals 1.
• The second step involves introducing noise into the radioscopy (Figure 23 (c)). The noise follows a Poisson distribution denoted as ��(�� = 6). The choice of the �� parameter is critical and has been established based on the specific characteristics of the experimental setup, particularly for the source and detector used.
• The final processing step involves blurring the radioscopy (Figure 23 (d)). Given that X-ray sources are not point-like, a natural blur occurs in radioscopies based on the relative positions of the object, source, and detector. The blur is achieved by convolving the image with a matrix of size ���������� × ���������� where all entries equal 1. A larger ���������� results in a blurrier image. In this setup, ���������� = 5, ensuring that both the simulation and the experimental blurs correspond to approximately 6 pixels.
At this stage, the simulation of a radioscopy of the melt pool is complete. By varying the power and the velocity of the laser during the thermal simulation, it becomes possible to change the size of the melt pool and the contrast variation in the final image.
Figure 21: discretization of the melt pool in terms of temperature (a), and density (b). (c) Melt pool within the substrate with a constant density.
Figure 22: scheme of a scene on VXI: (a) X-ray detector, (b) X-ray spectrum, (c) X-ray source.
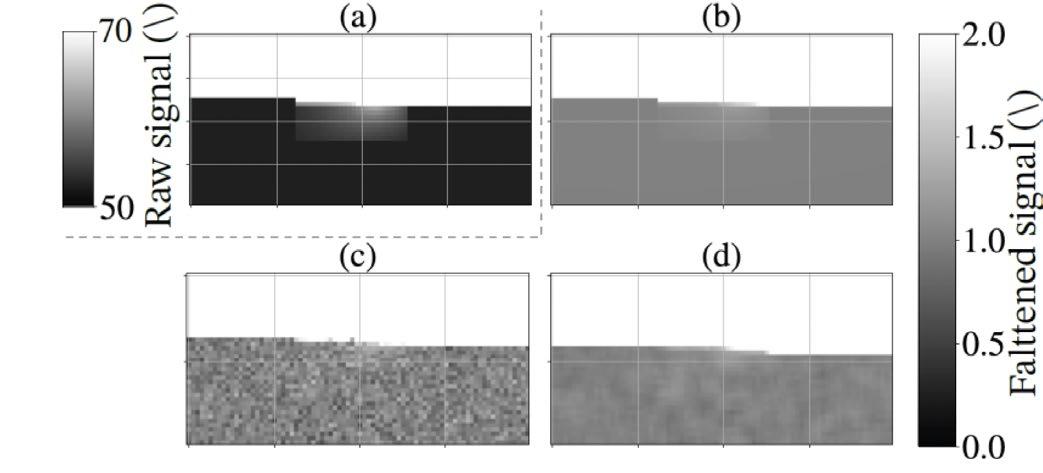
References
[1] Berman, Barry. "3-D printing: The new industrial revolution". Business Horizons 55. 2(2012): 155–162.
[2] Frazier, William E. "Metal additive manufacturing: A review". Journal of Materials Engineering and Performance 23. 6(2014): 1917–1928.
[3] Ahn, Dong Gyu. "Directed Energy Deposition (DED) Process: State of the Art". International Journal of Precision Engineering and Manufacturing - Green Technology 8. 2(2021): 703–742.
[4] Svetlizky, David, Mitun, Das, Baolong, Zheng, Alexandra L., Vyatskikh, Susmita, Bose, Amit, Bandyopadhyay, Julie M., Schoenung, Enrique J., Lavernia, Noam, Eliaz. "Directed energy deposition (DED) additive manufacturing: Physical characteristics, defects, challenges and applications". Materials Today 49. (2021): 271–295.
[5] Lu, Xufei, Xin, Lin, Michele, Chiumenti, Miguel, Cervera, Yunlong, Hu, Xianglin, Ji, Liang, Ma, Haiou, Yang, Weidong, Huang. "Residual stress and distortion of rectangular and S-shaped Ti-6Al-4V parts by Directed Energy Deposition: Modelling and experimental calibration". Additive Manufacturing 26. (2019): 166–179.
[6] Marya, Manuel, Virendra, Singh, Jean Yves, Hascoet,Surendar, Marya. "A Metallurgical Investigation of the Direct Energy Deposition Surface Repair of Ferrous Alloys". Journal of Materials Engineering and Performance 27. 2(2018): 813–824.
[7] Scime, Luke, Jack, Beuth. "Using machine learning to identify in-situ melt pool signatures indicative of flaw formation in a laser powder bed fusion additive manufacturing process". Additive Manufacturing 25. November 2018(2019): 151–165.
[8] Khanzadeh, Mojtaba, Sudipta, Chowdhury, Mark A., Tschopp, Haley R., Doude, Mohammad, Marufuzzaman, Linkan, Bian. "In-situ monitoring of melt pool images for porosity prediction in directed energy deposition processes". IISE Transactions 51. 5(2019): 437–455.
[9] Gibson, B. T., Y. K., Bandari, B. S., Richardson, W. C., Henry, E. J., Vetland, T. W., Sundermann, L. J., Love. "Melt pool size control through multiple closed-loop modalities in laser-wire directed energy deposition of Ti-6Al-4V". Additive Manufacturing 32. November 2019(2020): 100993.
[10] Akbari, Meysam, Radovan, Kovacevic. "Closed Loop Control of Melt Pool Width in robotized laser poder directed energy deposition process". International Journal of Advanced Manufacturing Technology 104. 5(2019): 78170–78181.
[11] Sun, Zhe, Wei, Guo, Lin, Li. "In-process measurement of melt pool cross-sectional geometry and grain orientation in a laser directed energy deposition additive manufacturing process". Optics and Laser Technology 129. March (2020): 106280.
[12] Ding, Yaoyu, James, Warton, Radovan, Kovacevic. "Development of sensing and control system for robotized laser-based direct metal addition system". Additive Manufacturing 10. (2016): 24–35.
[13] Smurov, I., M., Doubenskaia, A., Zaitsev. "Comprehensive analysis of laser cladding by means of optical diagnostics and numerical simulation". Surface and Coatings Technology 220. (2013): 112–121.
[14] Liu, Shuang, Parisa, Farahmand, Radovan, Kovacevic. "Optical monitoring of high power direct diode laser cladding". Optics and Laser Technology 64. (2014): 363–376.
[15] Everton, Sarah K., Matthias, Hirsch, Petros I., Stavroulakis, Richard K., Leach, Adam T., Clare. "Review of in-situ process monitoring and insitu metrology for metal additive manufacturing". Materials and Design 95. (2016): 431–445.
[16] Jegou, Loic, Joel, Lachambre, Nicolas, Tardif, Mady, Guillemot, Anthony, Dellarre, Abderrahime, Zaoui, Thomas, Elguedj, Valerie, Kaftandjian, Nicolas, Beraud. "Bichromatic melt pool thermal measurement based on a Red, Green, and Blue camera: Application to additive manufacturing processes". Optics and Laser Technology 167. (2023): 109799.
[17] Hanke, Randolf, Theobald, Fuchs, Norman, Uhlmann. "X-ray based methods for nondestructive testing and material characterization". Nuclear Instruments and Methods in Physics Research, Section A: Accelerators, Spectrometers, Detectors and Associated Equipment 591. 1(2008): 14–18.
[18] Letang, Jean Michel (Creatis). "X-ray imaging: Physics, Instrumentation & Applications". https://www.creatis.insa-lyon.fr/$∼$letang/X-raybook/introduction.html. (2023).
[19] Abt, Felix, Meiko, Boley, Rudolf, Weber, Thomas, Graf, Gregor, Popko, Siegfried, Nau. "Novel X-ray system for in-situ diagnostics of laser-based processes - First experimental results". Physics
Figure 23: (a) original picture. (b) Flattening of the image. (c) Adding noise to the image. (d) Blurred image.
Procedia 12. PART 1(2011): 761–770.
[20] Boley, M., F., Abt, R., Weber, T., Graf. "X-ray and optical videography for 3D measurement of capillary and melt pool geometry in laser welding". Physics Procedia 41. (2013): 488–495.
[21] Yamada, Tomonori, Takahisa, Shobu, Akihiko, Nishimura, Yukihiro, Yonemoto, Susumu, Yamashita, Toshiharu, Muramatsu. "In-situ X-ray observation of molten pool depth during laser micro welding". Journal of Laser Micro Nanoengineering 7. 3(2012): 244–248.
[22] Wolff, Sarah J., Hao, Wu, Niranjan, Parab, Cang, Zhao, Kornel F., Ehmann, Tao, Sun, Jian, Cao. "Insitu high-speed X-ray imaging of piezo-driven directed energy deposition additive manufacturing". Scientific Reports 9. 1(2019): 1–14.
[23] Wolff, Sarah J., Benjamin, Gould. "Synchronized in situ X-ray and infrared imaging of laser deposition". Manufacturing Letters 31. (2022): 87–90.
[24] Lindenmeyer, Adrian, et al. "Template-bayesian approach for the evaluation of melt pool shape and dimension of a DED-process from in-situ X-ray images." CIRP Annals 70.1 (2021): 183-186.
[25] Webster, Samantha, et al. "Pore formation driven by particle impact in laser powder-blown directed energy deposition." PNAS nexus 2.6 (2023): pgad178.
[26] Chen, Yunhui, Samuel J., Clark, Lorna, Sinclair, Chu Lun Alex, Leung, Sebastian, Marussi, Thomas, Connolley, Robert C., Atwood, Gavin J., Baxter, Martyn A., Jones, Iain, Todd, Peter D., Lee. "Synchrotron X-ray imaging of directed energy deposition additive manufacturing of titanium alloy Ti-6242". Additive Manufacturing 41. October 2020(2021): 101969.
[27] Chen, Yunhui, Samuel J., Clark, David M., Collins, Sebastian, Marussi, Simon A., Hunt, Danielle M., Fenech, Thomas, Connolley, Robert C., Atwood, Oxana V., Magdysyuk, Gavin J., Baxter, Martyn A., Jones, Chu Lun Alex, Leung, Peter D., Lee. "Correlative Synchrotron X-ray Imaging and Diffraction of Directed Energy Deposition Additive Manufacturing". Acta Materialia 209. (2021): 116777.
[28] Chen, Yunhui, Samuel J., Clark, Yuze, Huang, Lorna, Sinclair, Chu, Lun Alex Leung, Sebastian, Marussi, Thomas, Connolley, Oxana V., Magdysyuk, Robert C., Atwood, Gavin J., Baxter, Martyn A., Jones, Iain, Todd, Peter D., Lee. "In situ X-ray quantification of melt pool behaviour during directed energy deposition additive manufacturing of stainless steel". Materials Letters 286. (2021): 129205.
[29] Dass, Adrita, et al. "Laser based directed energy deposition system for operando synchrotron X-ray experiments." Review of Scientific Instruments 93.7 (2022).
[30] Sahoo, P. K., S., Soltani, A. K.C., Wong. "A survey of thresholding techniques". Computer Vision, Graphics and Image Processing 41. 2(1988): 233–260.
[31] Karthick, S., Dr.K., Sathiyasekar, A., Puraneeswari. "A Survey Based on Region Based Segmentation". International Journal of Engineering Trends and Technology 7. 3(2014): 143–147.
[32] Zhu, Guopu, Shuqun, Zhang, Zeng, Qingshuang, Changhong, Wang. "Boundary-based image segmentation using binary level set method". Optical Engineering 46. 5(2007): 050501.
[33] Nyma, Alamgir, Myeongsu, Kang, Yung Keun, Kwon, Cheol Hong, Kim, Jong Myon, Kim. "A hybrid technique for medical image segmentation". Journal of Biomedicine and Biotechnology 2012. (2012).
[34] Ng, Hui-Fuang. "Automatic thresholding for defect detection." Pattern recognition letters 27.14 (2006): 1644-1649.
[35] Fan, Jiu Lun, Bo, Lei. "A modified valley-emphasis method for automatic thresholding". Pattern Recognition Letters 33. 6(2012): 703–708.
[36] Swetha, T. L.V.N., C. H.Hima, Bindu. "Detection of Breast cancer with Hybrid image segmentation and Otsu's thresholding". 2015 International Conference on Computing and Network Communications, CoCoNet 2015. 2008(2016): 565–570.
[37] Chowdhary, Chiranji Lal, Mohit, Mittal, P., Kumaresan, P. A., Pattanaik, Zbigniew, Marszalek. "An efficient segmentation and classification system in medical images using intuitionist possibilistic fuzzy C-mean clustering and fuzzy SVM algorithm". Sensors (Switzerland) 20. 14(2020): 1–20.
[38] Liu, Jingyu, Gangming, Zhao, Yu, Fei, Ming, Zhang, Yizhou, Wang, Yizhou, Yu. "Align, attend and locate: Chest X-ray diagnosis via contrast induced attention network with limited supervision". Proceedings of the IEEE International Conference on Computer Vision 2019-Octob. (2019): 10631–10640.
[39] Zhang, Kai, Wangmeng, Zuo, Yunjin, Chen, Deyu, Meng, Lei, Zhang. "Beyond a Gaussian denoiser: Residual learning of deep CNN for image denoising". IEEE Transactions on Image Processing 26. 7(2017): 3142–3155.
[40] Tschannen, Michael, Olivier, Bachem, Mario, Lucic. "Recent advances in autoencoderbased representation learning". arXiv preprint arXiv:1812.05069. (2018).
[41] Hubbell, John H., and Stephen M. Seltzer. Tables of X-ray mass attenuation coefficients and mass energy-absorption coefficients 1 keV to 20 MeV for elements Z= 1 to 92 and 48 additional substances of dosimetric interest. No. PB-95-220539/XAB; NISTIR-5632. National Inst. of Standards and Technology-PL, Gaithersburg, MD (United States). Ionizing Radiation Div., 1995.
[42] Haley, James C., Baolong, Zheng, Umberto Scipioni, Bertoli, Alexander D., Dupuy, Julie M., Schoenung, Enrique J., Lavernia. "Working distance passive stability in laser directed energy deposition additive manufacturing". Materials and Design 161. (2019): 86–94.
[43] Van Der Walt, Stéfan, Johannes L., Schönberger, Juan, Nunez-Iglesias, François, Boulogne, Joshua D., Warner, Neil, Yager, Emmanuelle, Gouillart, Tony, Yu. "Scikit-image: Image processing in python". PeerJ 2014. 1(2014): 1–18.
[44] Itseez. "Open Source Computer Vision Library." (2015).
[45] Xu, Xiangyang, Shengzhou, Xu, Lianghai, Jin, Enmin, Song. "Characteristic analysis of Otsu threshold and its applications". Pattern Recognition Letters 32. 7(2011): 956–961.
[46] Zhang, Qianru, Meng, Zhang, Tinghuan, Chen, Zhifei, Sun, Yuzhe, Ma, Bei, Yu. "Recent advances in convolutional neural network acceleration". Neurocomputing 323. (2019): 37–51.
[47] Dumoulin, Vincent, Francesco, Visin. "A guide to convolution arithmetic for deep learning". arXiv. (2016): 1–31.
[48] Sharma, Siddharth, Simone, Sharma, Athaiya, Anidhya. "Understanding activation functions in neural networks". International Journal of Engineering Applied Sciences and Technology 4. 12(2020): 310–316.
[49] Scherer, Dominik, Andreas, Müller, Sven, Behnke. "Evaluation of pooling operations in convolutional architectures for object recognition". Lecture Notes in Computer Science (including subseries Lecture Notes in Artificial Intelligence and Lecture Notes in Bioinformatics) 6354 LNCS. PART 3(2010): 92–101.
[50] Jia, Yabo, Yassine, Saadlaoui, Eric, Feulvarch, Jean Michel, Bergheau. "An efficient local moving thermal-fluid framework for accelerating heat and mass transfer simulation during welding and additive manufacturing processes". Computer Methods in Applied Mechanics and Engineering 419. September 2023(2024).
[51] Bugelnig, Katrin, et al. "In-situ & in-operando additive manufacturing of engineering alloys." (2024).
[52] Mills, Kenneth C., S. U., Yuchu, L. I., Zushu, Robert F., Brooks. "Equations for the calculation of the thermo-physical properties of stainless steel". ISIJ International 44. 10(2004): 1661–1668.
[53] Fukuyama, Hiroyuki, Hideo, Higashi, Hidemasa, Yamano "Thermophysical Properties of Molten Stainless Steel Containing 5 mass % B4C". Nuclear Technology 205. 9(2019): 1154–1163.
[54] Baur, Manuel, Norman, Uhlmann, Thorsten, Pöschel, Matthias, Schroter. "Correction of beam hardening in X-ray radiograms". Review of Scientific Instruments 90. 2(2023): 1–11.
[55] Fathi, Alireza, Ehsan, Toyserkani, Amir, Khajepour, Mohammad, Durali. "Prediction of melt pool depth and dilution in laser powder deposition". Journal of Physics D: Applied Physics 39. 12(2006): 2613–2623.
[56] Duvauchelle, Philippe, Nicolas, Freud, Valérie, Kaftandjian, Daniel, Babot. "Computer code to simulate X-ray imaging techniques". Nuclear Instruments and Methods in Physics Research, Section B: Beam Interactions with Materials and Atoms 170. 1(2000): 245–258.
[57] Poludniowski, Gavin, Artur, Omar, Robert, Bujila, Pedro, Andreo. "Technical Note: SpekPy v2.0—a software toolkit for modeling X-ray tube spectra". Medical Physics 48. 7(2021): 3630–3637.
NDT World Event Calendar
2026 AINDT Summit
20 to 22 April 2026 | Newcastle, Australia
The 2025 AINDT Summit will bring together industry leaders, innovators, and NDT professionals for three days of knowledge sharing, networking, and professional development in Newcastle from 18 to 20 November 2025. With the theme The Power of Inspection, the Summit will explore how inspection services deliver crucial insights about critical assets across industries. This timely theme also addresses Australia's evolving energy landscape and the expanding role of inspection services in supporting our future energy infrastructure.
For further information, visit: aindt.com.au
The 17th Asia Pacific Conference for Non-Destructive Testing (APCNDT)
11 to 14 May 2026 | Hawaii, USA
APCNDT is set to be an unmissable event for NDT professionals across the globe. Held under the theme Breaking Barriers: NDT Solutions for a Changing World – Innovate, Adapt, Transform, this premier conference will showcase the latest innovations and emerging technologies that are redefining non-destructive testing. Attendees will have the opportunity to connect with global experts, share knowledge, and explore new solutions to address the evolving challenges faced by industries worldwide. Join us to discover how NDT is driving transformation, and paving the way for a dynamic future.
For further information, visit: apcndt2026.com
COFREND Days 2026
19 to 21 May 2026 | Lyon, France
COFREND Days 2026 is one of Europe’s premier international events dedicated to Non-Destructive Testing (NDT). The three-day program combines technical conferences, plenary sessions, workshops and an extensive exhibition, featuring over 160 scientific presentations and more than 80 exhibitors. It brings together industry professionals, researchers, equipment providers and educators to showcase innovation, exchange knowledge and explore NDT applications across sectors like aerospace, energy, civil engineering and petrochemicals.
For further information, visit: cofrend2026.com
The 14th European Conference on NonDestructive Testing (ECNDT 2026)
15 to 19 June 2026 | Verona, Italy
ECNDT 2026 is a leading international event hosted by the European Federation for Non-Destructive Testing. Bringing together experts, researchers, and professionals, the conference is a hub for sharing innovation, research, and emerging technologies shaping the future of inspection and quality assurance. The program features technical presentations and case studies across a range of sectors, complemented by a dynamic exhibition. This connection between research and practical application encourages collaboration, networking, and advancement of NDT worldwide.
For further information, visit: ecndt2026.org
12th
European Workshop on Structural
Health Monitoring
7 to 10 July 2026 | Toulouse, France
Organised every two years, EWSHM is the main European event dedicated to structural health monitoring, a key technology for infrastructure maintenance and integrity monitoring. This unmissable event attracts worldrenowned experts from the academic and industrial sectors, as well as from research laboratories around the world, to discuss innovations and applications in this constantly evolving field. This year, the always-popular event will be held in, Toulouse (France), a city known for its aeronautics and space industry.
For further information, visit: ewshm2026.com
ASNT 2026
12 to 15 October 2026 | Ohio, USA
ASNT 2026 is your opportunity to experience the very best of non-destructive testing—innovations, insights, and the people shaping what comes next. Over four days, thousands of professionals come together to learn, connect, and explore the technologies and approaches advancing the field. With over 100 technical sessions, 200 exhibitors, technical talks will cover all the major methods and industries, the latest on codes and standards, and new innovations. The theme, Together We Lead, reflects a shared commitment to progress.
For further information, visit: asnt.org/events/asnt-2026

ASG NDT Supplies is a trusted provider of advanced nondestructive testing (NDT) equipment and solutions, serving industries across Australia and New Zealand. The company supplies a comprehensive range of high-quality inspection technologies designed to improve safety, reliability, and asset integrity across sectors such as oil and gas, manufacturing, power generation, aerospace, and infrastructure.
ASG partners with some of the world’s most respected NDT manufacturers, enabling customers to access cutting-edge inspection technologies and reliable instrumentation. These suppliers include Teledyne ICM, Gammatec NDT Supplies, Novotest, TPAC, IONIX, IRIS Inspection Services, OKO NDT, Eclipse Scientific, and Jireh Industries. Through these partnerships, ASG ensures customers receive industry-leading equipment

HOT Engineering Magnetic Particle Testing Specialists
HOT Engineering is a Mudgee, NSW-based precision engineering company with an accredited Non-Destructive Testing division specialising in magnetic particle testing (MT). Since establishing in 2017, we have built a reputation for delivering reliable, high-quality NDT services to some of Australia's leading mining, construction and civil infrastructure operators.
Our magnetic particle testing capability is carried out by skilled, accredited technicians trained to detect surface and near-surface discontinuities in ferromagnetic materials — assessing the integrity, quality and reliability of components and structures without causing damage. From weld inspections to structural assessments, our MT services are integral to ensuring
Russell Fraser Sales
Russell Fraser Sales has been a key player in Australia’s non-destructive testing (NDT) industry since 1993, supplying advanced inspection equipment and supporting customers with demonstrations, training, and technical expertise. The company offers a broad portfolio of NDT solutions, including ultrasonic flaw detectors, thickness gauges, UV inspection systems, and hardness testers, serving industries such as mining, oil and gas, manufacturing, and infrastructure.
A standout product within its ultrasonic range is the Sonatest Veo3, a high-performance phased array flaw detector designed for advanced inspection applications. The Veo3 combines multiple ultrasonic techniques— including phased array (PA), time of flight diffraction (TOFD), and Full Matrix Capture/Total Focusing Method
backed by global expertise and innovation. The ASG product portfolio includes ultrasonic testing (UT) systems, phased array equipment, industrial radiography systems, eddy current testing instruments, magnetic particle inspection tools, hardness testing devices, IRIS tube inspection systems, and digital radiography solutions. These technologies help inspectors detect flaws, corrosion, cracks, and other defects without damaging the tested material. With strong industry knowledge and hands-on experience in asset integrity and inspection, ASG focuses on providing tailored solutions that meet specific operational requirements. By combining highquality equipment with technical support and industry expertise, ASG NDT Supplies continues to support inspection professionals in achieving accurate results, improved operational efficiency, and enhanced safety standards across a wide range of industrial applications.
For more information, visit: asgndtsupplies.com
safety and compliance across demanding industrial environments.
Magnetic particle testing sits at the heart of our QDS Attachment compliance program, where we manage the full maintenance and inspection lifecycle of mining and earthmoving attachments. Every attachment that passes through our facility is subject to rigorous NDT inspection before returning to service — giving our clients confidence that their equipment is safe, compliant and built to last.
HOT Engineering holds ISO 9001:2015 certification and operates in full compliance with Australian building and engineering standards. We service clients including Glencore, Peabody, Yancoal and Webuild across NSW and the Eastern Seaboard.
For NDT inspections, QDS compliance or general enquiries, contact us today. For further information, visit: hotengineering.com.au
(FMC/TFM)—within a single platform. This allows inspectors to perform multi-scan, multi-technique inspections simultaneously, significantly improving probability of detection and inspection efficiency.
The Veo3 features a powerful 32:128PR phased array architecture, high-speed data processing, and the ability to generate up to six live TFM scans with exceptional image resolution. It supports up to 1024 focal laws and offers advanced imaging capabilities that enable precise flaw characterisation and sizing. The system also includes intuitive workflow-driven software, onboard reporting tools, and high-capacity data storage, making it suitable for both field and laboratory environments. Together, Russell Fraser Sales and the Sonatest Veo3 represent a strong combination of local expertise and cutting-edge ultrasonic technology, helping NDT professionals achieve accurate, reliable inspection results across a wide range of applications.
For further information, visit: rfsales.com.au

Simplifi NII Delivers Seamless SIUI PAUT Solutions for OmniScan Users
In the world of advanced NDT, compatibility is king—and Simplifi NII is proud to supply SIUI's powerful range of Phased Array Ultrasonic Testing (PAUT) probes, wedges, and crawlers that integrate beautifully with Olympus/ OmniScan platforms.
Whether you're running automated weld inspections, corrosion mapping, or composite inspections, the right hardware makes all the difference. SIUI’s PAUT gear, distributed by Simplifi NII, is engineered to match the performance and signal fidelity demanded by OmniScan users—without the need for complicated adapters or workaround setups.

Smartchem Industries
Smartchem Industries
is your trusted partner for magnetic particle and dye penetrant requirements, with over 100 year’s combined experience in the Manufacture and Distribution of Magnetic Particle and Dye Penetrant consumables. Smartchem is 100% Australian owned and proudly manufactures in Australia with Australian resources where possible. Smartchem prides itself on service, both technical and in the delivery of our products.
The Smartcheck MPI range comply to the requirements ISO-9934.2 and other relevant standards.
The Smartcheck Dye Penetrant range has been 3rd party type tested to ISO 3452.2 by MPA Hanover in Germany, this now includes a level 3 water washable/solvent removable fluorescent dye penetrant, Smartcheck Dye Pen Fluoro.
Wood
With 35,000 professionals across 60 countries, Wood PLC is one of the world's leading consulting and engineering companies operating across Energy and Resources markets.
Here in Australia, the broad range of services they offer their clients includes machinery vibration and lubrication analysis for all types of equipment, across all industries. Their certified personnel can provide end-to-end routine measurement, analysis, and reporting; alternatively, they will supplement your people to match your needs. They are vendor-agnostic and work with a wide range of wireless, wired, and portable hardware and software platforms to provide routine and troubleshooting services to the very highest level.
But Wood does not stop at finding and diagnosing problems – from skid to piping to vessel, they have
Simplifi NII’s standard connectors and wedge profiles ensure plug-and-play compatibility, while their range of dual-axis crawlers and encoded scanners offer the flexibility and precision needed for high-spec projects. With durability for harsh site conditions and precision you can count on, SIUI is a serious alternative for teams looking to enhance performance without breaking the budget.
Simplifi NII doesn’t just supply the gear—they also offer fast delivery, calibration services, and technical support across Australia. So whether you're scaling up your inspection fleet or need a reliable replacement probe in a pinch, Simplifi NII has you covered.
Looking for equipment that plays nice with your OmniScan, but without the brand tax? Talk to us about SIUI.
For further information, visit: simplifi-nii.com.au
All CoC and SDS are available on the website which is a useful reference tool for an audit or where a copy is required in the field.
SmartChem is the exclusive distributor for the Matcon range of Magnets and equipment. We are also exclusive distributors for Promag UV lights and equipment.
SmartChem supplies direct and has a network of resellers throughout Australia, please contact us for your nearest reseller on the East Coast. Heatleys Safety and Industrial www.heatleys.com.au are our distributor in WA, ensuring our products available via a wellestablished distribution network .
Our products are now available in New Zealand, stocked in both the North and South Island through our new distributor Accurate Instruments www.accurate.kiwi.
Come and say hello at the AINDT Summit, Booth 19 and enjoy a hot coffee courtesy of the Smartchem Coffee Cart.
For further information, visit: smartchem.com.au
an unrivalled track record of engineering actionable solutions. They also offer machinery alignment and balancing, optical motion amplification, thermography, bearing failure analysis, root cause analysis facilitation, FEAs, flow analysis, noise studies and much more.
And, they practice what they teach. Wood offer vibration and lubrication analysis training per ISO 18436 Parts 1 to 4, with optional AINDT certification. Their public courses are delivered in Perth and Brisbane by active principal practitioners with decades of experience. Alternatively, they can provide bespoke courses at your site or venue.
Wood currently offers LCAT1, VCAT1 and VCAT2 training, and will be expanding our catalogue soon. The LCAT I and VCAT I courses each provide three days of training, plus a two-hour certification examination. The VCAT2 duration is four days of training, plus a three-hour certification examination.
For further information, visit: https://vdn.woodplc.com
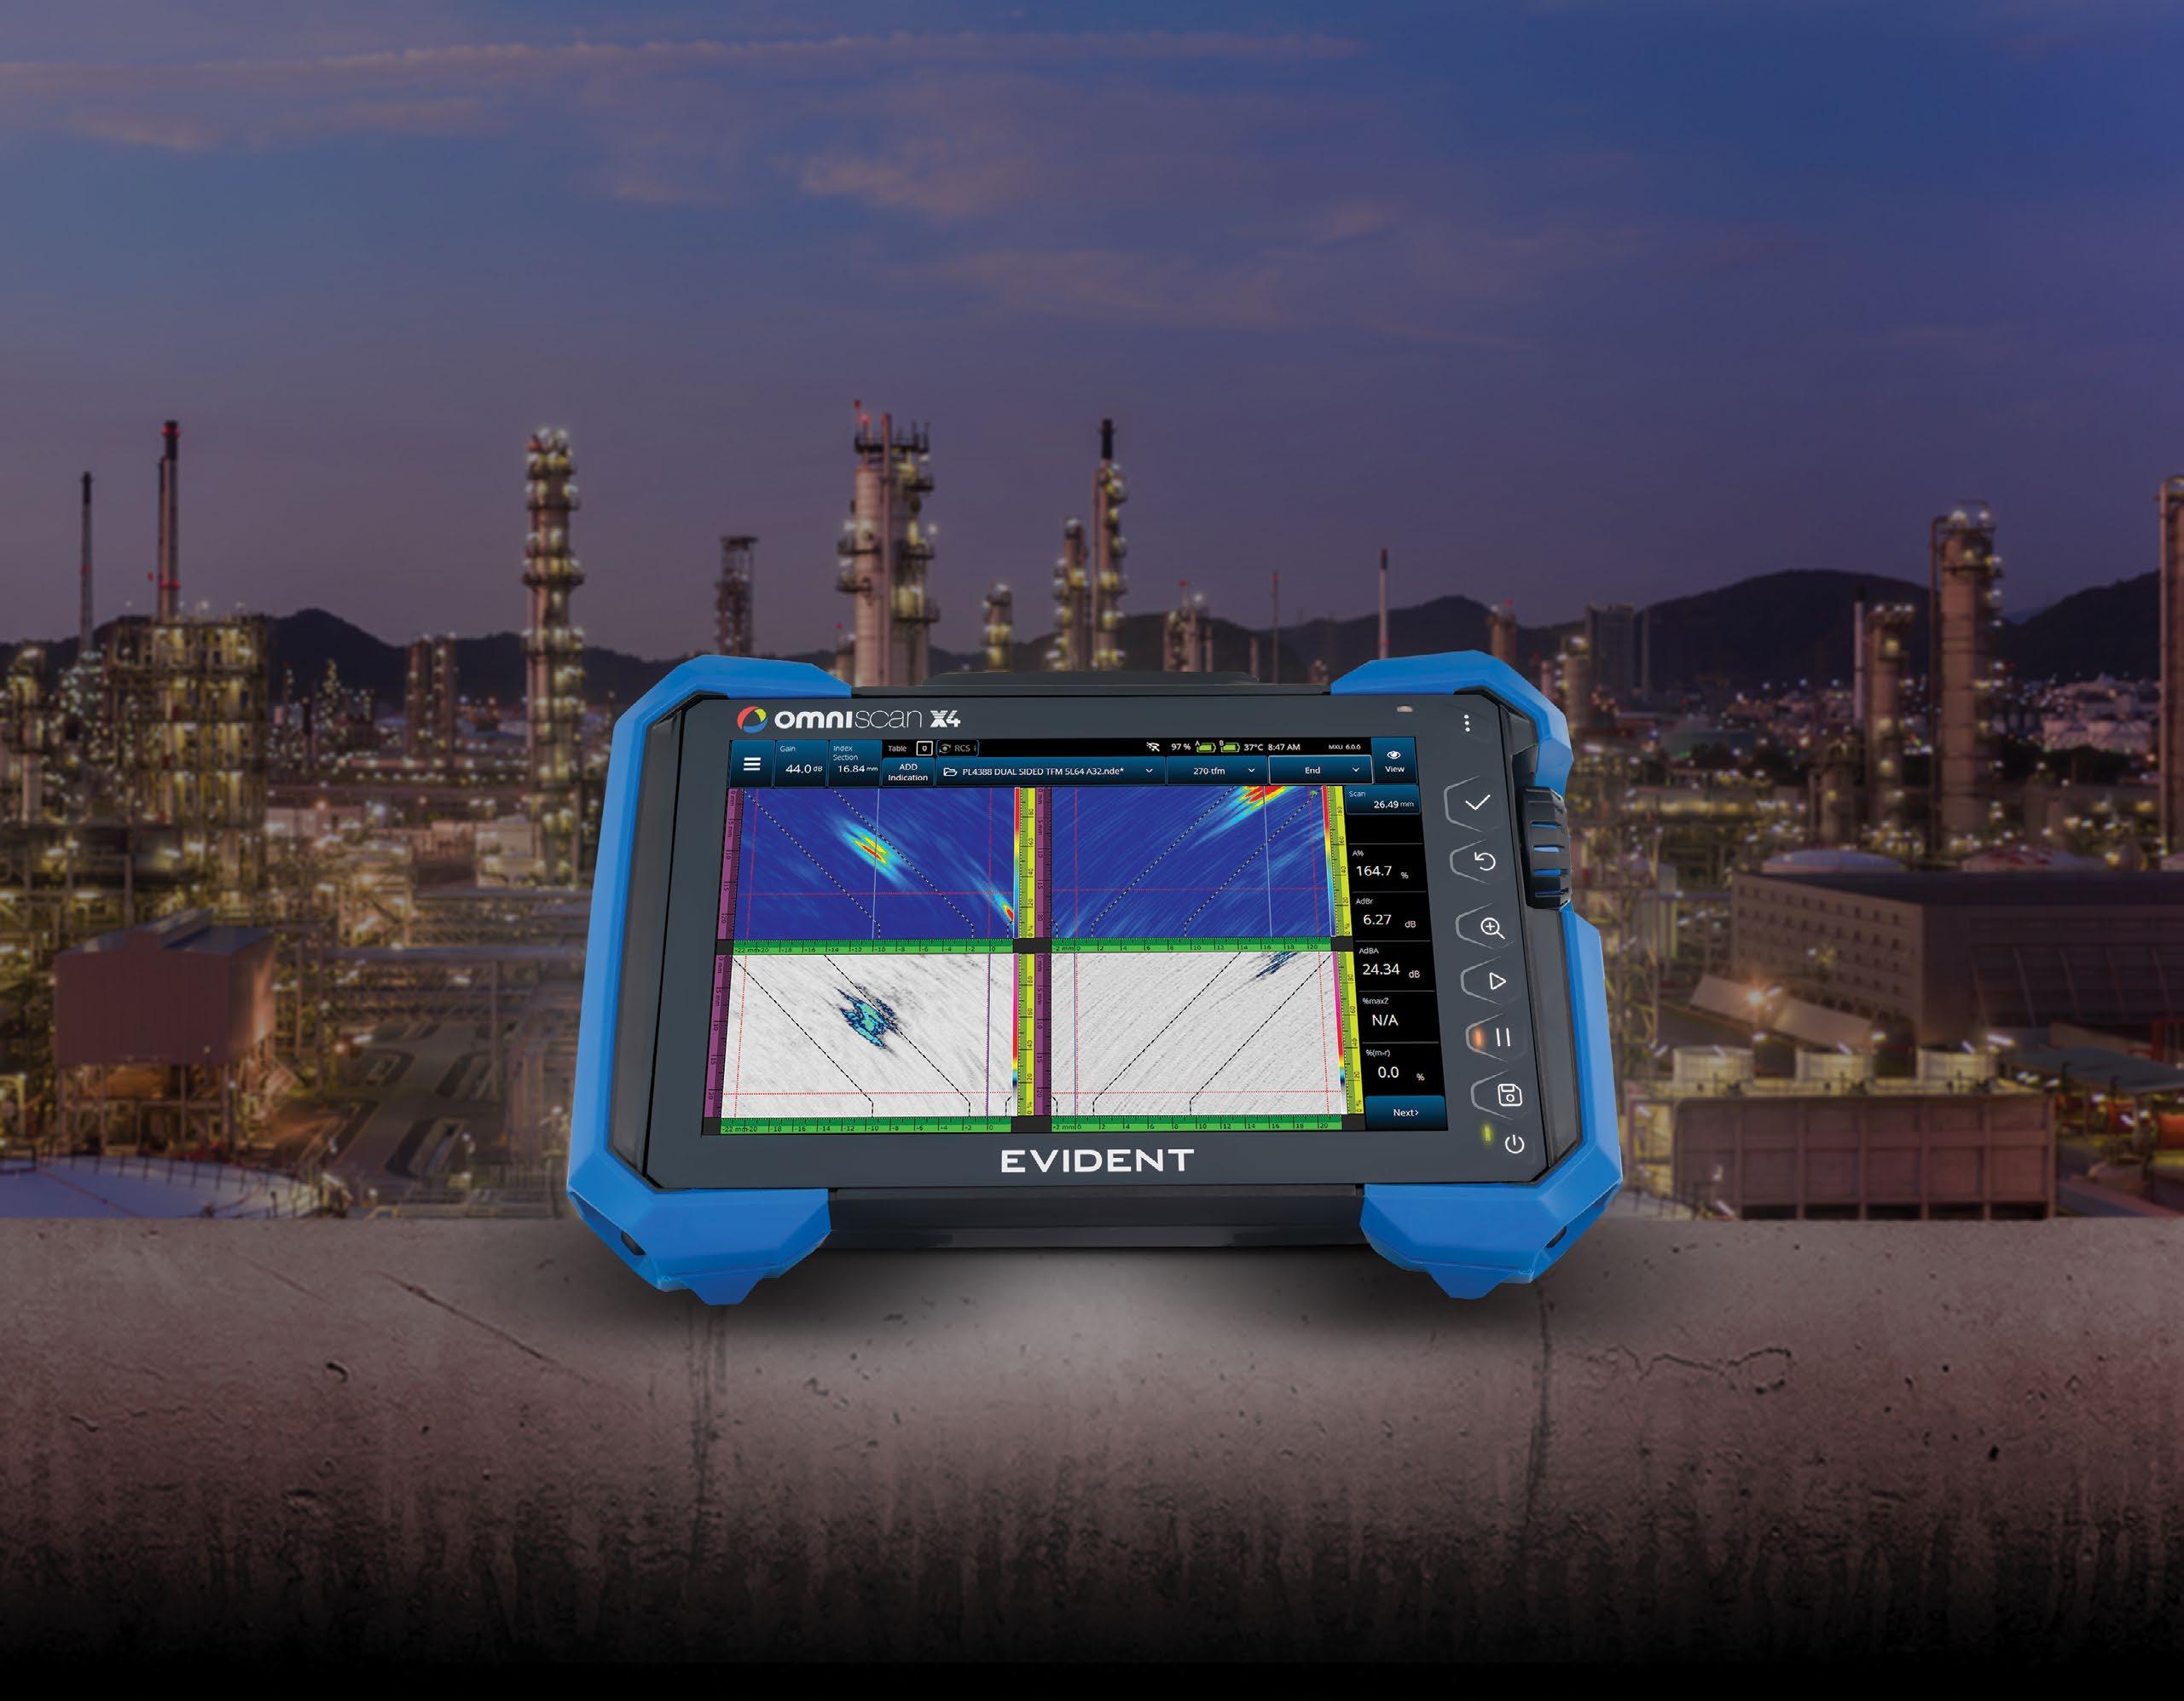
Be Ready for What’s Next
The New OmniScan™ X4 Flaw Detector
Engineered for Speed & Simplicity
Advanced imaging technology and an easy-to-use interface allow users of all skill levels to perform fast, accurate inspections—boosting performance and streamlining workflows.
Proven to Perform, Trusted to Deliver
An all-in-one imaging platform, coupled with unmatched portability and versatility, delivers exceptional results in even the most challenging inspection environments.
Designed to Evolve with Your Needs
With free quarterly software updates, the OmniScan X4 empowers you to continuously adapt to future inspection needs—ensuring that you’re always ready for what’s next.