VOLUME 13 | NO 4 JULY/AUGUST 2026
INDUSTRIAL THE OFFICIAL JOURNAL OF THE AUSTRALIAN INSTITUTE FOR NON-DESTRUCTIVE TESTING
RADIOGRAPHY
ULTRASONICS
VIBRATION ANALYSIS
EDDY CURRENT
LUBRICATION ANALYSIS
PENETRANT
THERMOGRAPHY
EYE
MAGNETIC PARTICLE ACOUSTIC EMISSION
CORROSION INSPECTION STARTS WITH US.
Krautkrämer PAXYS: Less Than 1 kg. Full Phased Array Performance. Built on 75+ years of ultrasonic innovation, our new Krautkrämer PAXYS brings fast and reliable corrosion mapping to challenging oil & gas environments. It produces encoded C-scan thickness data without proprietary hardware or compromising on data quality – all at the hands of a single inspector. Powering it all is comPAct, our patented, thumbsized chip with full phased array capability inside. Scan the QR Code to learn more! Or visit our website at waygate-tech/paxys
AINDT NEWS
AINDT NEWS
President's Message Since my last report, I sat three Level 3 recertification practical examinations. Magnetic particle and penetrant back-to-back, foll owed by radiographic testing two weeks later. On the international front, we are working through updates to our Memoranda of Understanding with partner societies, including the British Institute of Non-Destructive Testing (BINDT) and the New Zealand Non-Destructive Testing Association (NZNDTA).
I want to say something about how we are approaching these. An MoU is easy to sign and easy to frame on a wall. The ones we are negotiating now are different. We are working through the substance, mutual recognition, what happens with lapsed certificate holders, where each body's scheme applies and where it does not. Slower to agree, harder to draft, and worth far more to our members when done. If your certification is going to travel with you internationally, the agreements behind it need to hold weight.
Sam Hallifax
I will be honest, there is something clarifying about being on the candidate's side of the exam table when you chair the board of the body running the scheme. No shortcuts, no special treatment, and nor should there be.
I prepared the same way every technician does. Work instructions written and checked, standards reread, practical skills sharpened. And I walked out with a renewed respect for what we ask of every person who holds AINDT certification.
Our CEO, Stuart Norman, has covered the successful transition of our scheme to ISO 9712:2021 and the maintained JAS-ANZ accreditation in his message, so I will not repeat the detail. What I can offer is a firsthand view. The rigour is real. Sitting those practicals, it was clear the scheme tests what actually matters on the job, not what is easy to examine. That is the difference between certification that means something and certification that is just paper. When industry puts confidence in an AINDT ticket, that confidence is earned at the exam table, and I have the fresh memories to prove it.
Industrial Eye July/August 2026
One more observation, and at this stage it is just that. Some of our committees have shown what is possible when a group of members gets deliberate about the future of their sector. The rail committee is a good example, engaging on technology, capability, and how to bring new people into the industry rather than only maintaining what exists. I would like to see more of our committees thinking this way, with a view on where their sector is heading and what the pipeline of people and technology needs to look like to get there. It is a conversation I am keen to have with the Federal Council and the branches over the coming months, and I would welcome hearing from any member with ideas on it. The Institute has had a strong period, and the milestones Stuart describes were hard won. My thanks to the certification boards, the examiners, and everyone who kept the scheme running at full standard through a demanding transition. I saw your work up close this time and it holds up. Sam Hallifax President, AINDT Global SME & Business Improvement Manager, EnerMech
3
CONTENTS
17
20
AINDT News
Technical Articles
CEO Message Member List An Update from the Membership Registrar Enter the AINDT Photo Competition NDT Certification Board Update Condition Monitoring Training Centres Authorised Qualifying Bodies Queensland Branch Update Victoria Branch Update
6 9 11 12 13 14 15 19 20
Industry News Standards Update Thermography in Action AINDT Member Profile: Steve Kennedy NDT World Event Calendar
30
A Simple Reference-Based Method for Measuring Acoustic Nonlinearity Parameter of Solids Using Immersion Ultrasonics
37
Artificial Intelligence in Safety-Critical NDT: 34 Why Skepticism is an Engineering Responsibility
Clarifying Critical Parameters in Total Focusing 43 Method Implementation for Advanced Ultrasonic Testing Performance in Industrial Application: Case study in Centreline Crack
VICTORIAN BRANCH
SOUTH AUSTRALIAN BRANCH
President: Mr Sam Hallifax Immediate Past President: Mr Joshua Morris Vice President: Mr Ian Hogarth Treasurer: Mr Damien Clarke Secretariat Liaison: Mr Peter Milligan CEO: Mr Stuart Norman
President Mr Miro Katouzi Past President Mr Paul Trigg Vice President Mr Peter Milligan Treasurer Mr Samad Asghary Secretary Mr Peter Milligan Official Address PO Box 52 Parkville VIC 3052
President Mr Tyson Jenke Vice President Mr Luke Jones Treasurer Mr Hans Zuidland Secretary Mr Nick Hart Official Address PO Box 538 Kent Town DC SA 5071
QUEENSLAND BRANCH
President Mr Joshua Wilkinson Vice President Mr Nathan Lenane Treasurer Mr Michael Needham Secretary Mr Joshua Wilkinson Official Address Level 7, 256 Adelaide Terrace Perth WA 6000
President Mr Frank Galea Vice President Mr Sam Hallifax Treasurer Mr Paul Ashby Secretary Mr Matthew Thompson Official Address 45 Jenkins Street Douglas Park NSW 2569
26
The Power Of Pressure Equipment Inspection Details For Integrity Monitoring
FEDERAL EXECUTIVE OFFICERS
NEW SOUTH WALES BRANCH
4
16 22 24 49
What Lies Beneath: Ultrasonic Thickness Measurement of Internal Oxide Layers
President Mr Steven Kennedy Vice President Mr Pawel Banda Treasurer Shaina Johnson Honorary Secretary Mr Roger Hardy Immediate Past President Mr Jim Tibani Official Address PO Box 301 Cleveland QLD 4163
WEST AUSTRALIAN BRANCH
Industrial Eye July/August 2026
CONTENTS
26 Products & Services AXT
50
QuadSonics
50
Total Asset Solutions
51
OMS
SmartChem Industries Wood Group
Production Sally Wood Design Alarna O’Connell AINDT PO Box 52, Parkville Vic 3052 P: (03) 9486 9267 www.aindt.com.au E: federaloffice@aindt.com.au ADVERTISING AINDT Federal Office P: (03) 9486 9267 E: sally@wordly.com.au
Industrial Eye July/August 2026
50 51 51
INSTRUCTIONS TO AUTHORS OF TECHNICAL ARTICLES Manuscripts should be submitted in electronic form: 1. in word 2. typed with single spacing 3. with figures as tif or jpeg files at better than 300dpi
Manuscripts should include: 1. symbols and abbreviations conforming to recognised standards; metric units (SI) 2. references listed, after the text, in the order in which they occur in the paper 3. references indicated in the text by arabic numerals in square brackets 4. tables and figures numbered separately but consecutively with Arabic numerals and brief, descriptive titles
5. a reference in the text to all tables and figures 6. graphs and diagrams made with lines of sufficient thickness to reproduce well 7. titles and address of authors Procedure for submission of manuscripts: 1. articles should be sent to: journal@aindt.com.au 2. manuscripts will be submitted to referees who will remain anonymous 3. reprints of each paper will be supplied free to the author Published by: The Australian Institute for Non-Destructive Testing, PO Box 52, Parkville, Vic 3052 Australia ISSN: 2203-2940
5
AINDT NEWS
A Message from the CEO Since my last report, I sat three Level 3 recertification practical examinations. Magnetic particle and penetrant back-to-back, followed by radiographic testing two weeks later. CEO's Report – Industrial Eye (July/ August 2026)
Over the past two years, the AINDT has been focused on strengthening the foundations of the Institute. From transitioning our certification scheme to ISO 9712:2021 and improving governance, Stuart Norman to modernising our systems and reinforcing relationships with industry and our international partners, we have undertaken significant work to position the Institute for the future.
I am pleased to say that we have now reached an important milestone in that journey. Following our recent JAS-ANZ assessment, we have been advised that the AINDT's accreditation has been maintained following the successful transition of our certification scheme to ISO 9712:2021. This represents the culmination of many months of work by our staff, volunteers, Certification Boards and Approved Qualifying Bodies. It demonstrates the strength of our certification scheme and provides confidence to industry that AINDT certification continues to meet internationally recognised standards of competence, impartiality and governance. At the same time, we have commenced recruitment for a permanent Certification Services Manager. I would like to sincerely thank everyone who expressed interest in or applied for the position. The quality of applicants has been extremely encouraging and reflects the reputation the AINDT has built within the profession. This appointment will provide the Institute with dedicated capability to continue strengthening our certification services while supporting our long-term strategic objectives.
None of these achievements would have been possible without the dedication of many people. In particular, I would like to acknowledge Paul Grosser, who has served as Acting Certification Services Manager during this important period. 6
Paul has volunteered an extraordinary amount of time and expertise to support the Institute through the ISO 9712:2021 transition. His professionalism, technical knowledge and unwavering commitment have played a critical role in ensuring the transition was delivered successfully. On behalf of the Board of Directors, the Certification Boards, staff and members, thank you, Paul, for your outstanding contribution to the AINDT.
Following the recent Branch Council elections, I congratulate all newly elected Branch Councillors and thank those continuing to serve. Branch Councils are the backbone of member engagement across Australia and provide an invaluable opportunity for members to contribute to the profession. Many of today's leaders within the AINDT first became involved through their local branch, and I encourage members to consider putting their hand up in the future. It is an excellent stepping stone to leadership roles within the Institute while developing professional networks and contributing to the future of our profession.
With these important milestones now behind us, our focus turns to the next phase of the Institute's development. One of our key priorities will be progressing a new Constitution for the AINDT to ensure our governance framework remains contemporary and supports the Institute well into the future. Another significant objective is re-establishing the AINDT as an ICNDT Schedule 2 Recognised Certification Body. This will involve an independent audit by the ICNDT and will further reinforce the international standing of the AINDT Certification Scheme.
Successfully transitioning to ISO 9712:2021 is not the end of the journey. It provides a strong foundation from which the Institute can continue to evolve and prepare for the next generation of international requirements. Over the next 12 months, we will begin implementing the requirements of the recently published ISO/IEC 17024. While there will be a transition period before the revised standard becomes mandatory, the AINDT is committed to taking a proactive approach. The updated standard places greater emphasis on digital systems,
Industrial Eye July/August 2026
AINDT NEWS
Looking ahead, planning will soon commence for the AINDT's next national conference, with initial discussions to take place at the upcoming Federal Council meeting. Our conferences remain one of the most valuable opportunities for members, researchers, students and industry partners to share knowledge, showcase innovation and strengthen professional relationships.
cybersecurity, governance of artificial intelligence (AI) and other emerging technologies.
By commencing this work early, we will ensure the AINDT continues to meet international best practice while maintaining the integrity, impartiality and confidence that industry expects from our certification scheme. These priorities closely align with discussions held during the ICNDT Executive Committee and Working Group meetings that I attended in Verona during June. Global harmonisation of personnel certification continues to be a major focus internationally, and Australia is well placed to contribute to these discussions while ensuring our certification scheme remains aligned with international developments.
Strengthening our relationships with like-minded organisations will also continue to be a priority. Over the coming months we will work towards updating Memoranda of Understanding with organisations including the British Institute of Non-Destructive Testing (BINDT) and the New Zealand Non-Destructive Testing Association (NZNDTA), supporting greater collaboration and information sharing.
While there is still much to do, it is worth taking a moment to recognise how far the Institute has come. We have completed several significant milestones and are now well positioned to focus on the next chapter. Thank you to every member, volunteer, examiner, Approved Qualifying Body, committee member and industry partner who continues to contribute to the success of the AINDT. Together, we are building an Institute that is stronger, more resilient and better prepared for the future.
Stuart Norman Chief Executive Officer, AINDT
Krautkrämer PAXYS
Miniaturized technology, Maximum performance
Rethink your corrosion mapping workflow Krautkrämer PAXYS transforms corrosion mapping with fast, reliable phased array inspection in a compact, ultra-portable scanner. It delivers repeatable thickness data, clear C-scan imaging, and efficient single-person operation, helping reduce inspection time and asset downtime. • Ultra-lightweight design, weighing less than 1 kg • X/Y dual-axis encoded scanning for precise, repeatable results • Clear C-scan visualisations for confident corrosion assessment • Ideal for rope access, confined spaces, and challenging field inspections
Official Distributor
Scan for Specs!
Industrial Eye July/August 2026
Proudly supporting Waygate Product users across Australia For more information please email us at
Sales@endetek.com.au
7
AINDT NEWS
Member List July 2026
The AINDT is a national peak body that promotes the professional practices of non-destructive testing and condition monitoring personnel. Our mission is to provide members, industry and the community with independent and professional service in relation to the science and practice of non-destructive testing. Through the work of our state branches and federal office, AINDT is committed to fostering a community of professionals and organisations dedicated to the fields of non-destructive testing, engineering, and materials and quality testing.
We offer a tiered membership structure, inviting businesses to enhance their professional standing and industry influence by becoming a Company, Corporate, or Sustaining member. Our memberships unlock a suite of benefits, including marketing opportunities, heightened support, streamlined staff certification management, and much more. AINDT would like to thank the companies below for their valued support.
SUSTAINING MEMBERS
CORPORATE MEMBERS
ATTAR D R May Inspections EnerMech SRG Industrial Pty Ltd Intertek
Azure NDT Quality Services Pty Ltd Bureau Veritas Australia Evident Australia Pty Ltd GFS NDT Hofco Oilfield Services IRISNDT OMS Engineering Pty Ltd SafeRad SE Asia Pty Ltd Edith Cowan University – School of Engineering TR Pty Ltd
SUPPORTING MEMBERS Chevron Cashcor Engineering
COMPANY MEMBERS NSW
AXT Pty Ltd Barry Evans Lifting World Bluescope Steel (Port Kembla) ENDETEK HVT Inspection Services Monnoo Engineering Services Pty Ltd NBQC and Inspection Services NDT Equipment Sales Pty Ltd Noble Engineering Services Reliance Hexham Russell Fraser Sales Simplifi Nii P/L SmartChem Industries Pty Ltd Sonix NDT Pty Ltd Thermal Imaging Services (AUS)
QLD
Australian Biosecurity Services Pty Ltd AXS Pty Ltd (Mackay)
Industrial Eye July/August 2026
Industrial Mining Inpsection Solutions International Tube Testing Pty Ltd M-Test Mackay Pty Ltd Queensland Alumina Limited Testing Inspection and Calibration Services
VIC / TAS
ATCL Defence Science and Techology Organisation (DSTO – Fishermans Bend) Gippsland NDT Services Pty Ltd Global Inspections & Engineering Services Pty Ltd Iron Training and Consulting iTest NDT LMATS Pty Ltd (Williamstown) NATA OMS Software Pty Ltd
SA / NT
ASC Pty Ltd Kuzer Technical SN Integrity
WA
Alliance Solutions Group Applecross Electrical and Testing Services Asset Reliability Inspections Pty Ltd Assurity NDT & Consulting GoldFields NDT ICM Training Solutions MJ Engineering Inspection Services (Welshpool) J & S Castlehow Electricial Services Vertech Weld Integrity Wood – Asset Performance Optimisation
9
Full-Coverage Corrosion Mapping System
AINDT NEWS
AINDT Membership Registrar Update
Membership Continues to Grow
As the 2026-2027 membership year begins, AINDT maintains a strong membership across the nondestructive testing, condition monitoring and inspection industries.
The current register contains 626 member and representative records across individual and organisational membership categories. Of these, 613 are based in Australia, with other members in New Zealand, the United States, the United Kingdom, Canada, Ireland and Malaysia.
Welcoming Our New Members
The register includes 102 members and representatives who have joined AINDT since the beginning of 2025, including 16 additions during 2026.
We are pleased to welcome Daniel Watson, Brendan Ding, Ronil Rey, Michael Ferron, Matt Welsby, Hassan Monnoo, Sean Mansfield, Hyojoon Kim, Nestor Sequera, Okechukwu Emeghara, Anil Kumar Reddy Nagella, William Rodighiero, Frank Burkardt, Nichola Kelly-Cook, Micheal Wilson and Brett Cahill. Our most recent addition is Cashcor Engineering as an AINDT Supporting Member, represented by Brett Cahill. We thank Cashcor Engineering for its support.
Membership Renewals
Thank you to the members and organisations who have renewed for 2026-2027. Those who have not yet renewed are encouraged to do so as soon as possible. Industrial Eye July/August 2026
Continuous financial membership provides uninterrupted access to benefits including:
• Discounted certification, renewal and re-certification
fees
• The AINDT Journal, Industrial Eye
• Member rates for conferences, seminars and
technical events
• Voting and participation rights at eligible Branch
and Institute meetings
• Technical information, networking and professional
development opportunities
Keeping Your Details Current
Members should also review their contact and employment details through the AINDT Member Portal. Please check that your email address, telephone number, employer, postal address, State Branch and preferred Journal delivery method remain correct. Accurate information helps AINDT provide certification updates, event notices, Branch communications, renewal information and each edition of Industrial Eye. On behalf of the Institute, thank you for your ongoing membership and support of AINDT and the broader NDT and Condition Monitoring professions. We look forward to your continued involvement throughout 2026-2027. Renew or update your details through the AINDT Member Portal: portal.cbdb.aindt.org/login.php
11
AINDT NEWS
Show Us NDT in Action and Win Lunch for Your Workplace AINDT is building a new library of authentic images that showcase non-destructive testing professionals, workplaces and technology across Australia—and we need your help. You’re invited to submit high-quality photos of NDT in action. This could include technicians carrying out inspections, equipment being used in the field, team members at work, training activities, facilities, interesting job sites or behind-the-scenes moments from across the industry.
Win a $150 Uber Eats Voucher
One winning photo will be selected from each Australian state and territory.
Each winner will receive a $150 Uber Eats voucher, so you can have lunch delivered to your workplace on us. What We’re Looking For
We’re particularly interested in genuine, engaging photos that help tell the story of Australia’s NDT industry, including: • NDT technicians at work
• Inspection and testing activities
• NDT equipment and technology in use • Teams, trainees and workplaces
How to Enter
Complete the online form: https://form.jotform.com/262237171179055 Entries close at 5pm on Wednesday 30 September 2026. You can submit as many photos as you like. Scan the QR code below to enter now.
Image Use and Permissions
By submitting a photograph, you confirm that you have the authority and permission to provide the image to AINDT, including permission from any identifiable people pictured and, where relevant, the site owner or organisation.
You also grant AINDT an ongoing, royalty-free right to reproduce, edit, publish and use the photograph for any AINDT marketing, promotional, educational and communications purposes. This may include use on AINDT’s website, social media channels, emails, publications, presentations, event materials and printed collateral. Help us showcase the people, expertise and technology behind Australia’s NDT industry—and you could win lunch for your workplace.
• Industrial facilities, infrastructure and job sites • Interesting or unusual NDT applications
Please ensure everyone clearly identifiable in the image has agreed to be photographed and that photography is permitted at the location.
Photo Requirements Photos must be:
• Supplied as a high-resolution JPEG or PNG
• At least 1MB in file size, although larger files are
strongly preferred
• Clear, well-lit and suitable for professional use
• Free from confidential, commercially sensitive or
restricted information
12
Industrial Eye July/August 2026
AINDT NEWS
Non-Destructive Testing Certification Board Update European Conference on Non-Destructive Testing (ECNDT)
AINDT CEO, Stuart Norman, and NDT Certification Board Chair, Mark Welland, attended the European Conference on Non-Destructive Testing (ECNDT) in Verona Italy from 15 to 19 June 2026 on behalf on the AINDT. Angelo Zacarri also attended on behalf of Standards Australia. As a result, AINDT had a presence at the following technical meetings: ISO TC135 meetings; ICNDT WG1 meeting; ICNDT General Assembly Meeting; NDT frontiers workshop; and the ICNDT certification workshop on Global Harmonisation of Certification Quality. The key themes repeated throughout the speaker presentations and at the workshops were AI adoption in NDT, and ethics and morals in NDT. The general consensus was that AI is not going to replace the NDT technician. However, the NDT technician will need to learn how to use AI correctly. Knowledge such as how use AI appropriately, when to trust that AI is correct and, perhaps more importantly, the skills and courage to disagree and override AI when it is incorrect are essential.
Training in these AI-related skills for the next generation of technicians and the upskilling of current technicians is required. Ethics and morals in NDT is at the core of our profession and industry. Sadly, there are numerous cases that demonstrate how people make poor choices that can (and have) result in catastrophic outcomes. Keeping ethics and morals in NDT front of mind and discussing it regularly is the perfect place to start improvements.
AINDT Certification Scheme Gap Analysis
A gap analysis for the AINDT Certification Scheme is underway in light of the release of ISO 17024: 2026, which supersedes ISO 17024: 2012. There have been considerable changes in the industry since 2012, and the major structural changes to the standard and new requirements reflecting this.
Industrial Eye July/August 2026
A key change in the standard is the use of AI in the certification of people. AINDT does not currently use AI in the certification process. However, the new version of ISO 17024 opens the door to this, outlining requirements on the responsible use of AI. A working group on the next revision of ISO 9712 has been formed by the ICNDT and, at this stage, may possibly be published in 2030. ISO TS 25107 and TS ISO 25108 are both in the process of revision, which will mean changes for the AINDT and our AQBs. It is going to be a busy few years behind the scenes to bring the AINDT swiftly in line with the new standards requirements.
JAS-ANZ Audit of the AINDT ISO 9712 Certification Scheme
Finally, the latest JAS-ANZ audit of the AINDT ISO 9712 Certification Scheme was carried out on the 25 and 26 June 2026 at the Federal Office. Minor findings reported are being addressed and closed out. By all accounts, it was very good result for all our certificate holders and members.
I’d like to congratulate and thank you everyone involved for continuing to run a tight ship, including AINDT CEO Stuart Norman, Certification Service Manager Paul Grosser, Certificate Administrator Payoja Jain, Uma Sudhakar Putan, Juandri Potgieter, AINDT Auditor Peter Dawson, the Chair of the Applications Committee Chris Howsen, the Applications Committee members, the Pannel of Examiners members, and the NDT Certification Board. Mark Welland Chair, AINDT NDT Certification Board
13
AINDT NEWS
Condition Monitoring Training Centres Unlock the future of your career with top-tier condition monitoring training from trusted providers. These training centres have earned the endorsement of AINDT, aligning perfectly with the national syllabi approved by the AINDT Certification Board. This ensures that you receive the highest standard of education and training.
Wood – Asset Performance Optimisation A: Level 3, 171 Collins Street, Melbourne 3000 T: 08 6314 2000 or (08) 6314 2280 E: svt.bu.training@woodplc.com W: woodplc.com
To maximise your learning experience, AINDT recommends obtaining a copy of the training module—either directly from the training provider or by downloading it from the AINDT website. This will ensure you are well-prepared for your course.
Western Australia
For those seeking certification, it's crucial to successfully complete the specified training program and required training hours outlined in ISO18436. This is essential for achieving certification in your desired conditioning monitoring method, category, and industry sector. All examinations are conducted by the AINDT. For exam dates and further details, please contact AINDT via: federaloffice@aindt.com.au.
Elevate your skills and advance your career with the industry's best training and certification programs.
Victoria
Industrial Precision Instruments A: Unit 12, 634-644 Mitcham Road, Vermont 3133 T: 1300 781 701 E: training@ipi-inst.com.au W: ipi-inst.com.au IR Technology Australia A: 39-45 James Street, Lara 3212 T: 0418 569 698 E: erik.t@bigpond.com W: irta.com.au
University of Melbourne A: Parkville 3010 T: 03 9810 3348 E: claudine.evans@unimelb.edu.au W: unimelb.edu.au
14
ICM Training Solutions A: 45 Delawney Street, Balcatta 6021 T: 0419 993 233 E: rainingacademy@icmt.com.au W: icmt.com.au
SRG Training Academy A: 109 Bannister Road, Canning Vale 6155 T: 08 9232 0300 E: trainingacademy@srgglobal.com W: srgglobal.com
Wood – Asset Performance Optimisation A: Level 1, 240 St Georges Terrace, Perth 6000 T: (08) 6314 2000 or (08) 6314 2280 E: svt.bu.training@woodplc.com W: woodplc.com
Queensland
Advanced Infrared Resources Australia AIRA A: PO Box 372, Hervey Bay 4655 T: 0467 565 836 E: jeff@irtau.com.au W: irtau.com.au Machinery Diagnostics Institute A: 16 Wheeler Avenue, Gracemere 4702 T: 0499881 294 E: training@mcsturbo.com W: mdiaustralia.com SRG Training Academy A: 7 Brisbane Road, Riverview 4303 T: 07 3816 5500 E: training@mcsturbo.com W: mcsturbo.com
Wood – Asset Performance Optimisation A: Level 20, 127 Creek Street, Brisbane 4000 T: (08) 6314 2000 or (08) 6314 2280 E: svt.bu.training@woodplc.com W: woodplc.com
Industrial Eye July/August 2026
AINDT NEWS
Authorised Qualifying Bodies AQBs are authorised to offer AINDT-approved training and initial and recertification examinations in any Australian state, at any time throughout the year. The AINDT also conducts scheduled examination rounds twice yearly, with dates advertised in The Industrial Eye and the AINDT e-newsletter. While the AINDT strives to notify certificate holders of impending certification expirations, it remains the responsibility of the certificate holder to initiate the renewal and recertification process before their certification expires. Please note that late fees apply to overdue certification applications.
South Australia
Kuzer Technical T: 1300 199 086 E: info@kuzer.com W: kuzer.com
NDT methods, levels, and industry sectors offered: • Magnetic Particle Level 1, 2 and 3 Multisector (ISO 9712) • Dye P enetrant Level 1, 2 and 3 Multisector (ISO 9712) • Ultrasonics Level 1, General Engineering (ISO 9712) • Ultrasonics 2 and 3 Welds (ISO 9712) • Phased Array Level 2 and 3 Multisector (ISO 9712) • Time Of Flight Diffraction Level 2 and 3 Multisector (ISO 9712) • Radiographic Testing Level 1, Level 2 and 3 Welds (ISO 9712) Full Matrix Capture Level 2 Welds (ISO 9712) • Visual Testing Level 1 and 2 Multisector (ISO 9712) • Eddy Current Level 1, 2 and 3 Multisector (ISO 9712) • Level 3 Basic Exam Prep (ISO 9712) • OCTG drill pipe inspection • Material Science in NDT – Multisector • NDT for Managers & Engineers • Radiation Safety (exceeding the syllabus of national module EA612)
Victoria
ATTAR T: 03 9574 6144 E: training@attar.com.au W: attar.com.au
NDT methods, levels, and industry sectors offered: • Computed and Digital Radiography 2, 3 • Ultrasonic Testing 1,2,3 Welds, Casting, Wrought, • Aerospace, Thickness • Radiographic Testing Level 1, Level 2 and 3 Welds (ISO 9712) Full Matrix Capture Level 2 Welds (ISO 9712) • Magnetic Particle Testing 1,2,3 Multisector, Aerospace • Penetrant Testing 1,2,3 Multisector, Aerospace • Eddy Current Testing 2,3 Multisector, Aerospace Industrial Eye July/August 2026
• Magnetic Flux Leakage 2 • Tank Bottom Testing
• Phased Array levels 2 and 3 Ultrasonics 2 Multisector • Visual/Optical Testing 2 Multisector
• Time of Flight Diffraction (TOFD) levels 2 and 3 Welds • Heat Treatment
• ISO 9712 UT Level 2 Corrosion/Erosion Detection
and Mapping (CDM)
Western Australia
ATTAR T: 03 9574 6144 E: training@attar.com.au W: attar.com.au
NDT methods, levels, and industry sectors offered: • Computed and Digital Radiography 2, 3 • Ultrasonic Testing 1, 2,3 Welds, Casting, Wrought, • Aerospace, Thickness • Radiographic Testing Level 1, Level 2 and 3 Welds (ISO 9712) Full Matrix Capture Level 2 Welds (ISO 9712) • Magnetic Particle Testing 1,2,3 Multisector, Aerospace • Penetrant Testing 1,2,3 Multisector, Aerospace • Eddy Current Testing 2,3 Multisector, Aerospace • Magnetic Flux Leakage 2 • Tank Bottom Testing • Phased Array 2, 3 Ultrasonics 2 Multisector • Visual/Optical Testing 2 Multisector • Time of Flight Diffraction (TOFD) 2, 3 Welds • Heat Treatment • ISO 9712 UT Level 2 Corrosion/Erosion Detection and Mapping (CDM)
SRG Training Academy T: 08 9232 0300 E: trainingacademy@srgglobal.com W: srgglobal.com
NDT methods, levels, and industry sectors offered: • Ultrasonic Testing 1,2 Welds • Magnetic Particle Testing 1,2 Multisector • Penetrant Testing 1,2 Multisector • Phased Array Ultrasonic Testing 2 Multisector
Queensland
Protecs Global T: 07 3492 9213 E: hamed.madani@protecsglobal.com.au W: protecsglobal.com.au
NDT methods, levels, and industry sectors offered: • Ultrasonic Testing 1 ( General Engineering) 2 Welds • Magnetic Particle Testing, 2 Multisector • Penetrant Testing, 2 Multisector 15
INDUSTRY NEWS
Standards Update Standards Australia was represented by MT007 Committee Members at the ISO Standards Meetings from 12 to 14 July in Verona, Italy. MT007 Committee Members attended the meetings both online and face-to-face due to the meetings coinciding with the European Conference on Non-Destructive Testing (ECNDT).
A large contingent of countries was present including representatives from Argentina, Australia, Austria, Belarus, Brazil, Bulgaria, Canada, Czech Republic, China, Finland, France, Germany, Hungary, India, Indonesia, Iran, Islamic, Italy, Japan, Kazakhstan, Kenya, South Korea, Malaysia, Netherlands, New Zealand, Norway, Poland, Portugal, Mongolia, Romania, Russian Federation, Serbia, Slovakia, South Africa, Spain, Sweden, Switzerland, Thailand, United Kingdom, United States, Uzbekistan, Ukraine, Zimbabwe. Key items discussed within each method committee and approved by the TC135 Main Committee are outlined below
TC135 / SC3 Ultrasonic Testing
• Revision of ISO 22232-1, Non-destructive testing -
Characterization and verification of ultrasonic test equipment Part 1: Instruments
• Revision of ISO 22232-2, Non-destructive testing -
Characterization and verification of ultrasonic test equipment Part 2: Probes
• Revision of ISO 22232-3, Non-destructive testing -
Characterization and verification of ultrasonic test equipment Part 3: Combined equipment
• Revision of ISO 23243, Non-destructive testing -
Ultrasonic testing with arrays - Vocabulary
• Potential new work item: General principles of
ultrasonic guided-wave Testing
• Potential new work item: Ultrasonic guided-wave
testing of pipes
• Potential new work item: Phased array ultrasonic
testing (PAUT) method on round-in-square austenitic stainless-steel pipes for magnetic confinement fusion reactors
TC135 / SC4 Eddy Current Testing
• ISO 15548-1:2026: Non-destructive testing -
Equipment for eddy current examination - Part 1: Instrument characteristics and verification
• ISO/PWI 15548-2: Non-destructive testing -
Equipment for eddy current examination - Part 2: Probe characteristics and verification
• ISO/PWI 20669: Non-destructive testing - Pulsed eddy
current testing of ferromagnetic metallic components
• ISO/PWI 12718: Non-destructive testing - Eddy current
testing - Vocabulary
16
TC135 / SC7 Certification
• ISO 9712:2021 non-destructive testing - Qualification
and certification of NDT personnel: Published in December 2021, next systematic review scheduled for October 2026
• ISO/TS 11774:2011 non-destructive testing -
Performance-based qualification: Confirmed in July 2023, next systematic review scheduled for July 2026
• ISO 18490:2015 non-destructive testing - Evaluation
of vision acuity of NDT personnel: New edition of ISO 18490:2026 published in March 2026
• ISO 20807:2004 non-destructive testing - Qualification
of personnel for limited application of non-destructive testing: ISO/AWI 20807 revision is commencing
• ISO/TS 25108:2018 non-destructive testing -
Guidelines for NDT personnel training organizations: ISO/WD 25108 study completed
• ISO/TS 25107:2019 non-destructive testing - NDT
training syllabuses: ISO/AWI 25107 revision registered under WG 11, revision is commencing
• Working Group 11 (WG 11): NDT personnel training
organizations and ISO 25108 and ISO 25107 updates coming
TC135 / SC8 Thermography
• ISO 10878 (non-destructive testing - Infrared
thermography - Vocabulary) scheduled for July 2026
• Extension of time granted to ISO/DIS 17501, Non-
destructive testing - Thermographic testing - Active thermography with laser excitation, from 18 months to 24 months
• ISO/TC 135/SC 8 agreed to change WG 5’s title to
Active thermography with laser or inductive excitation
• ISO/TC 135/SC 8 approved the strategy for
terminological harmonisation
TC135 / SC9 Acoustic Emission
• SO/TC 135/SC 9 approved to revise ISO 12713:1998
non-destructive testing - Acoustic emission inspection - Primary calibration of transducers
As you can see there is a lot of work proposed and being undertaken by ISO and Standards Australia MT007 Committee. Please contact me using the details below if you have any questions or require further information and I will reply at the first opportunity. Angelo Zaccari MT007 Standards Chairperson angelo.zaccari@outlook.com
Industrial Eye July/August 2026
AINDT NEWS
International Committee For NonDestructive Testing (ICNDT) Meetings Recently, AINDT's CEO, Stuart Norman, and Chair of the NDT Certification Board, Mark Welland, had the privilege of attending the International Committee for Non-Destructive Testing (ICNDT) meetings held alongside the European Conference on Non-Destructive Testing (ECNDT) in Verona, Italy.
Recently, AINDT's CEO, Stuart Norman, and Chair of the NDT Certification Board, Mark Welland, had the privilege of attending the International Committee for NonDestructive Testing (ICNDT) meetings held alongside the European Conference on Non-Destructive Testing (ECNDT) in Verona, Italy. One of the most significant topics discussed was global harmonisation of NDT personnel certification. As our industry becomes increasingly international, the need for greater consistency in certification, training and competence recognition across borders has never been more important. Employers, technicians and regulators all benefit from certification systems that are aligned, transparent and internationally recognised. Representatives from certification bodies and NDT societies around the world shared their experiences, challenges and perspectives on how we can continue to strengthen international cooperation while maintaining Industrial Eye July/August 2026
the integrity and confidence that industry expects.
For Australia, these discussions are particularly relevant. The Australian Institute for Non-Destructive Testing (AINDT) remains committed to delivering an internationally recognised certification scheme in accordance with ISO 9712, while actively contributing to the global conversation on improving consistency, mutual confidence and mobility of qualified NDT personnel.
The ICNDT continues to play a vital role in bringing together the international NDT community to address common challenges and identify opportunities that benefit our profession worldwide. It was a valuable opportunity to represent Australia, contribute to these important discussions and strengthen relationships with colleagues from around the globe.
17
SHAPE THE
FUTURE VOLUNTEER FOR YOUR LOCAL AINDT BRANCH COMMITTEE TODAY Join the vibrant team of volunteers at your local state branch and turn your passion for progress into action. Volunteer with us and connect with a community of professionals dedicated to making a difference in our industry.
WHY VOLUNTEER?
Network with industry leaders and peers Develop professional skills and gain unique experiences Influence the direction of our industry and contribute to meaningful change
aindt.com.au 03 9486 9267 federaloffice@aindt.com.au
AINDT NEWS
Queensland Branch Update Planning is underway for our End of Year Function, which will be held in Brisbane. Further details, including the venue and confirmed date, will be communicated to members once arrangements have been finalised. In addition, we are currently coordinating three technical industry events that will provide valuable professional development and networking opportunities for our members. These events will feature presentations and demonstrations from Waygate Technologies on CT Radiography, ENDeTek, and Villari with their innovative crack detection and structural monitoring systems. Dates and event details will be announced as they become available.
Industrial Eye July/August 2026
We encourage all members to stay engaged and look forward to seeing strong participation at these upcoming events throughout the remainder of the year.
19
AINDT NEWS
Victoria Branch Update Wabtec Technical Night
The Victoria Branch recently enjoyed an informative technical night hosted by Wabtec Inspection Technologies Australia at its Keysborough facility. The evening featured excellent hospitality, valuable industry networking and a practical presentation introducing the new NORTEC™ 700 Eddy Current Flaw Detector and developments in Eddy Current Array technology. The NORTEC 700 combines conventional Eddy Current Testing and advanced Eddy Current Array capabilities within a streamlined platform. Its userfriendly workflows, high-fidelity imaging and nextgeneration array probe technology are designed to improve inspection consistency, reduce setup time and make advanced ECA inspections more accessible across aerospace, manufacturing and other industrial applications.
The live demonstrations and technical discussions provided attendees with a valuable opportunity to explore the equipment’s capabilities and practical applications. The Victoria Branch sincerely thanks Wabtec and Paul Trigg for hosting and supporting this successful industry event.
Evident Technical Night
AINDT VIC held a successful technical night in late May, hosted by Asset Reliability Inspection (ARI) at their Keysborough office. The event was well attended by industry professionals and AINDT councillors, creating a valuable opportunity for technical discussion, networking, and knowledge sharing. The presentation was delivered by Nick Eleftheriou, Evident Scientific Product Manager and NDT Application Specialist, who introduced Evident’s latest X4 128 technology and provided live demonstrations. While the event included exposure to advanced Evident equipment, the focus was not limited to a commercial product presentation. It was also a valuable technical and educational session for PAUT, TFM, and TOFD practitioners and enthusiasts, covering practical topics such as customised overlay setups, inspection advancements using matrix probes, simplified wireless file management, and the use of open-source data. The event provided attendees with useful insights into recent developments in NDT technology and their practical application in the field.
20
Industrial Eye July/August 2026
RENEW YOUR MEMBERSHIP RENEW FOR REWARDS: STAY A STEP AHEAD WITH 2026-2027 AINDT MEMBERSHIP Whether you're looking to enhance your knowledge, expand your network, or influence industry standards, AINDT is your gateway to success. Connect with top professionals and thought leaders in an environment that celebrates innovation and progress. Just some of the member benefits are outlined below.
AINDT MEMBERSHIPS ARE DUE BY 30 JUNE
Regular editions of the AINDT Journal (6 per year) Substantial discounts on certification fees and expenses Access to our online portal and resources Eligibility for exam and industry service awards A host of networking opportunities, including branch events, workshops, seminars, and our conference Exclusive Corporate Member benefits like free and discounted advertising rates, and technical advice
RENEW NOW >>>
aindt.com.au
INDUSTRY NEWS
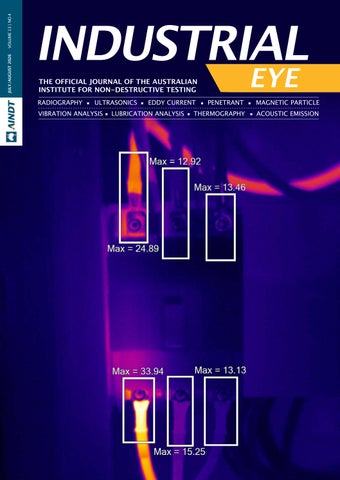
Thermography In Action Infrared Thermography Identifies Phase Load Imbalance in a Three-Phase Distribution System BY PETER MILLIGAN, DIRECTOR OF TOTAL ASSET SOLUTIONS AND SECRETARY OF AUSPTA CATEGORY 2 THERMOGRAPHER, ELECTRICAL/MECHANICAL (AINDT)
Infrared thermography has become one of the most effective predictive maintenance technologies available to electrical asset owners. By allowing equipment to be inspected under normal operating conditions, thermography provides a non-contact method of identifying developing faults before they result in failure, downtime, or safety incidents. This case study examines a commercial electrical installation where thermographic inspection identified significant phase load imbalance across a three-phase distribution system. The inspection revealed elevated temperatures on the red phase at both the main switch and metering fuse assembly, indicating a broader system-wide loading issue rather than an isolated defect.
Load imbalance is a common issue within commercial and industrial facilities. As equipment is added over time, electrical loads can gradually become concentrated on one phase. Although this may not immediately result in equipment failure, the resulting increase in conductor temperatures, energy losses, and stress on electrical infrastructure can significantly reduce equipment life expectancy.
Main Switch Assessment Connection
Temperature (°C)
Red Upper
24.89
Blue Upper
13.46
White Upper Red Lower
White Lower Blue Lower
12.92 33.94 15.25 13.13
Analysis of all six connection temperatures identified a clear thermal imbalance. The upper red phase connection recorded 24.89°C while the lower red phase connection recorded 33.94°C. By comparison, the remaining phase connections ranged between 12.92°C and 15.25°C. This represented a substantial temperature differential between the red phase and the remaining phases. 22
Figure 1. Main switch thermal profile showing elevated temperatures on the red phase.
Importantly, the elevated temperatures were present on both red phase connection points. If a high resistance or deteriorated connection had been responsible, a highly localised hotspot would typically be observed. Instead, heating was distributed throughout the conductor path, indicating that excessive current flow was the most likely cause. This thermal signature is characteristic of load imbalance. In balanced three-phase systems, current should be distributed as evenly as possible across all phases. When one phase carries a disproportionate share of the load, conductor temperatures increase and additional stress is placed on upstream and downstream electrical infrastructure. The thermal pattern observed strongly suggested that the red phase was carrying significantly greater load than the white and blue phases.
Industrial Eye July/August 2026
INDUSTRY NEWS
Metering Fuse Assessment
a common root cause: excessive loading of the red phase. This highlights the importance of evaluating the entire electrical system rather than focusing solely on individual components.
Potential Consequences
If left unresolved, phase load imbalance can contribute to elevated conductor temperatures, increased neutral currents, higher energy losses, and accelerated ageing of electrical equipment. Transformers, switchgear, protective devices, and cable insulation can all experience reduced service life when subjected to sustained thermal stress.
The financial consequences should also not be overlooked. Increased conductor temperatures result in higher resistive losses, reducing overall energy efficiency. Over time, these losses can become significant, particularly in larger facilities with continuous operating loads. From a reliability perspective, identifying load imbalance early allows corrective action to be planned and implemented before equipment degradation becomes severe enough to cause unplanned outages.
Conclusion Figure 2. Metering fuse assembly showing elevated temperature on the red phase fuse.
The second thermal anomaly was identified at the metering fuse assembly. The red phase fuse recorded a maximum temperature of 56.18°C compared with 31.50°C and 22.08°C on the remaining phases. This provided further evidence that the elevated loading condition extended beyond the main switch and was influencing the broader distribution system.
One of the most important principles of thermography is the use of comparative analysis. Temperature alone rarely determines severity. Instead, thermographers compare similar components operating under comparable conditions.
This case study demonstrates the value of infrared thermography as a predictive maintenance tool capable of identifying operational issues before equipment failure occurs. By analysing thermal patterns at both the main switch and metering fuse assembly, the inspection identified a significant phase load imbalance affecting the red phase of the installation.
The findings reinforce the importance of assessing complete thermal patterns rather than focusing solely on individual hotspot temperatures. Through routine thermographic inspections and timely corrective action, organisations can improve safety, increase reliability, reduce maintenance costs, and extend the service life of critical electrical assets.
In this case, the substantial temperature differential between the red phase fuse and the adjacent phases clearly indicated abnormal operating conditions.
The correlation between the metering fuse anomaly and the main switch anomaly significantly increased confidence in the diagnosis. Rather than being isolated hotspots, both thermal signatures pointed towards
Industrial Eye July/August 2026
23
AINDT NEWS
AINDT Member Profile Steve Kennedy, Senior NDT Technician at Queensland Alumina Limited (QAL) with diverse expertise across both Condition Monitoring (C/M) and Non-Destructive Testing (NDT). Our work primarily involves routine asset integrity monitoring and pre-commissioning inspections. In recent years, we have expanded our capabilities to include drone-based inspections, with drone ultrasonic thickness testing expected to be introduced in the near future.
Can you share your journey into the NDT industry? What motivated you to take on a career in NDT?
My introduction to NDT and Condition Monitoring came long before I was aware that formal qualifications even existed in these fields. I began as a specific-task employee at Gladstone Power Station, performing VA data capture and dye penetrant inspections on components and plant equipment within the fuel handling areas.
Steve Kennedy
From an unexpected introduction to NDT at Gladstone Power Station to a career spanning more than two decades, Steve Kennedy has built his expertise on curiosity, integrity and a willingness to keep learning.
Now Senior NDT Technician, Radiation Safety Officer and NATA Representative at Queensland Alumina Limited (QAL), Steve works alongside a highly skilled team helping safeguard the integrity of critical assets while embracing new inspection technologies. In this member profile, Steve reflects on the mentors and projects that have shaped his career, why attention to detail remains fundamental to NDT excellence, and the professional connections and friendships he has gained through AINDT membership.
Where do you work? Describe your job.
I am currently employed at Queensland Alumina Limited (QAL) as a Senior NDT Technician, Radiation Safety Officer (RSO), and NATA Representative.
According to our records, the facility has been a member of the AINDT for 55 years, and I have personally been involved for the past 20 of those years. I am fortunate to work as part of a team of 10 highly skilled technicians
24
When J.B. Engineering opened its Gladstone operation, I became its first workshop employee. As the company grew and eventually became Berg Engineering Gladstone, I was offered the opportunity to undertake formal NDT training. Having always enjoyed learning and developing new skills, I eagerly accepted. My first certification course, UT Level 1, was conducted by ATTAR in Adelaide. Coincidentally, the second day of the course was September 11, 2001. The events of that day, coupled with the collapse of Ansett Airlines shortly afterwards, made the journey home particularly challenging. I owe a great deal of thanks to my mentor, study partner, and friend, Thomas Higgs, for helping us navigate the situation and get home safely.
After five rewarding years with Berg Engineering, I accepted a position with QAL, where I worked for six and a half years. Following a brief return to Berg Engineering for a couple of years, I returned to QAL, where I currently remain.
Who or what has influenced you most professionally?
I have been fortunate to learn from many mentors throughout my career—arguably from almost everyone I have worked with, including trainees.
Industrial Eye July/August 2026
AINDT NEWS
A personal philosophy that has served me well is: "You can learn something from everyone, even if it's what not to do." I would like to acknowledge and thank several individuals who have had a significant influence on my professional development, including Graeme Timson, Thomas Higgs, Noel Jones, John Dare, and Malcolm Oakey.
What has been the most interesting project you've worked on and why?
Over the years, I have been involved in many challenging and rewarding projects, ranging from boiler upgrades and structural inspections to trial product assessments.
One particularly memorable project was the repair of a dragline bull gear. While initially appearing to be a straightforward task, it proved to be one of the most rewarding projects of my career. The challenges of handling and manoeuvring a 29-tonne component, mapping the crack propagation paths, and subsequently witnessing the excavation process confirm the predicted crack geometries provided a great sense of professional satisfaction. What advice would you give to someone just starting their career in the NDT industry?
Forgive the shameless plug, but I would strongly encourage anyone entering the industry to join the AINDT, participate in their local state council, and help contribute to the future of the profession.
How has being a member of AINDT benefited you professionally or personally?
Professionally, AINDT membership has provided access to reduced examination and certification renewal fees, test specimens, professional guidance, technical resources, the Industrial Eye magazine, and invitations to technical events. It has also helped me stay informed about emerging technologies and changes to industry standards.
Personally, it has enabled me to build connections with professionals from diverse backgrounds and industries, resulting in many lasting friendships as well as valuable professional relationships.
What are the top three things on your bucket list? 1. Travel throughout Japan.
2. Complete a lap around Australia.
3. Celebrate my grandson's 21st birthday.
Rapid fire What is your favourite? • Food: Sushi and sashimi
• Song: Hale to the king – Avenged seven-fold • Sport: Soccer
If you could be famous, what would it be for?
Making a positive difference and helping save lives.
If you could meet anyone—alive or dead— who would it be?
Listen to your mentors and colleagues, and never be afraid to ask questions. Integrity is at the heart of what we do, and a strong attention to detail will serve you well throughout your career.
Kat Dennings.
What has been your greatest professional achievement?
What is your top tip for NDT excellence?
There have been many milestones and achievements throughout my career, but I would like to think that my greatest professional accomplishment is still ahead of me.
Industrial Eye July/August 2026
What is your pet peeve? Hypocrisy.
Attention to detail and integrity. These are the foundations of quality inspection work and professional credibility.
25
TECHNICAL ARTICLE
What Lies Beneath: Ultrasonic Thickness Measurement of Internal Oxide Layers Some of the most damaging degradation in a steam boiler happens somewhere no visual inspection will ever reach: the inside surface of the tube wall. That was the starting point for What Lies Beneath? BY CHRIS HOWSON, DIRECTOR, QINDT
My presentation at this year’s AINDT Summit, which looked at how ultrasonic thickness gauging can be used to detect and measure internal oxide scale in steam boiler tubes, and why getting that measurement right is harder than it looks.
Steam boiler tubes sit in constant contact with hightemperature steam, and above 800°C that steam doesn’t just pass through the tube: it reacts with it, converting iron in the tube wall into magnetite: Iron + Steam → Magnetite + Hydrogen (3Fe + 4H2O → Fe3O4 + 4H2). That magnetite layer builds up unevenly, with the hot side of a tube typically developing thicker scale than the rest of the circumference, which is why trending the same physical location at every outage matters more than a single spot reading.
Image: Oxide formation.
Oxide scale is a poor conductor of heat compared with the parent steel, and that’s what turns it from a measurement curiosity into an asset integrity problem. As it thickens, it insulates the tube wall from the cooling effect of the steam or water flowing inside, pushing the metal temperature above its design value and accelerating creep damage, local overheating, and rupture risk, even in a tube whose external wallthickness reading still looks perfectly healthy.
It also cuts heat transfer efficiency and raises fuel consumption. And because a conventional thickness reading blends steel and oxide into one number, while only the remaining steel actually contributes to pressure containment, that blended figure can create false confidence in a tube’s true remaining life. That’s the real “what lies beneath” problem: the risk isn’t necessarily wall loss you can measure directly, it’s what’s hiding underneath a reading that looks normal.
26
Image: Oxide formation.
Getting an accurate split between steel and scale is genuinely difficult, for reasons rooted in the physics of the oxide layer itself. It isn’t a single, uniform acoustic layer: it’s porous, multi-phase, and mechanically stressed, with internal boundaries that create their own hidden interfaces. Worse, amplitude alone can’t be trusted to identify the right reflector. The steel-to-oxide interface produces a weak reflection because the two materials have similar acoustic impedance, while the oxide-to-steam interface reflects almost completely, meaning the largest echo on screen is very often not the boundary you actually need to measure.
Industrial Eye July/August 2026
TECHNICAL ARTICLE
Image: Large echoes can be misleading. Waveform shape, polarity, and cycle selection must be verified in RF mode.
Image: Wave mode selection: thick oxide.
There’s a hard resolution limit sitting underneath all of this too. At a typical inspection frequency of 20MHz, one wave cycle takes 50 nanoseconds, equivalent to roughly 0.15mm of steel. A 0.10mm oxide layer corresponds to about 0.03 microseconds of travel time, and a 0.20mm layer to about 0.07 microseconds, so two separate oxide interfaces can sit inside a single wave cycle and simply merge into one reading rather than two. The practical fix is in probe and wave-mode selection. Switching from a longitudinal to a shear wave effectively halves the sound velocity in the material, which doubles the available time resolution and allows thinner oxide layers to be resolved than a standard compression probe can manage, typically using 20 to 25MHz probes for this kind of inspection. Field data across three oxide thicknesses made the difference clear: at 0.762mm, both wave modes resolved the layer easily; at 0.381mm, separation between the two interfaces only just began to appear; and at 0.178mm, only the shear wave produced a resolvable echo at all.
Image: Wave mode selection: shear versus longitudinal. Industrial Eye July/August 2026
Image: Wave mode selection: average oxide.
Image: Wave mode selection: thin oxide. 27
TECHNICAL ARTICLE
None of this works if it’s left to automation. The instrument doesn’t know what a reflector actually is, only the operator does, and automated gating assumes a reflector identity that can silently jump to the wrong peak, producing a number that looks stable while being systematically wrong.
The rule I presented was simple: waveform first, number second. Verify in RF mode before trusting an automated thickness value, repeat every measurement point at least three times, adjust for oxide velocity, and treat two peaks collapsing into one as a possible sign of delamination rather than good news. Get this wrong in the field and the consequences aren’t abstract: incorrect remaining-life assessments, wrong tube replacement decisions, and missed overheating risk. Stable numbers are not the same as correct numbers. Where an inspector places a gate encodes an engineering hypothesis about what the wave is reflecting off, so that decision deserves the same scrutiny as any other engineering judgement call.
I presented this work at the AINDT Summit because it’s a problem NDT practitioners run into regularly but one that doesn’t always get airtime outside boiler and power specialists. At QINDT, we help operators build inspection procedures and interpretation techniques for exactly this kind of thickness monitoring, alongside our broader NDT consulting, technical review, and technician services. If you’re working through a similar problem, I’d be glad to talk it through.
About the Author: Chris Howson Director, QINDT
Chris Howson is the Director of Quantum Integrity NonDestructive Testing (QINDT), providing Level 3 services, training, and consultancy across multiple sectors within the NDT industry. He began his NDT career in the early 2000s with the UK’s National Power, before migrating to Australia in 2012. From 2012 to 2024, Chris served as the NSW and Victoria Regional Lead and later as Level 3 for one of Australia’s largest NDT providers, gaining extensive hands-on and leadership experience in field inspection, procedure development, and technician training. Chris is actively involved in advancing the NDT profession through his roles on the AINDT NSW Branch Committee, the AINDT Certification Board, and the NATA Accreditation Advisory Committee (AAC).
With a strong focus on practical integrity solutions and technician competency, he continues to drive high standards across the industry. For further information, visit: qindt.com.au Image: Engineering consequence (what happens in the real world if we get it wrong).
28
Industrial Eye July/August 2026
CONNECT, LEARN & LEAD GET AINDT CERTIFIED TODAY AINDT Certification demonstrates that you have the necessary knowledge and skills to carry out inspections, testing, and analysis to detect flaws or defects in materials and structures without causing damage. As the primary Certification Body in Australia for the NDT and CM industry, our certification is recognised, respected, and streamlined. Independent verification of your competence Widely recognised and respected across the Australian industry Boosts employability and career progression Demonstrates commitment to safety, quality and compliance Builds confidence with employers, clients and auditors Reduces risk, rework and downtime Portable credential across sectors
LEARN MORE >>>
aindt.com.au
TECHNICAL ARTICLE
The Power Of Pressure Equipment Inspection Details For Integrity Monitoring The asset integrity industry has conducted pressure equipment (PE) inspections for decades.
BY PRANAY WADYALKAR C.ENG CMATP MET DMTE AICIP ISI AINDT L3 - UT, ET, RT, PT, MT MANAGING DIRECTOR, OMS SOFTWARE
While some service providers issue generic, single or two-page report, others inspect for detailed integrity parameters. Frequently, when an asset is re-inspected after a typical two year interval by a different inspector from another company, only a basic report is available.
Because most standards and clients do not mandate the reporting of every detailed observation, these brief reports fail to preserve critical historical data. This lack of continuity prevents subsequent inspectors from accurately determining deterioration trends. To bridge this gap, a digitalised model is proposed to configure parameter focused management of PE inspections and standardise reporting using consistent terminologies. Standardising data acquisition and configuring digital inspection prompts for critical parameters has significantly benefited inspectors, inspection bodies, and asset owners. This approach 30
ensures detailed, repeatable observations are captured for long term integrity monitoring while driving gains in industry productivity.
The Problem Statement The Hidden High Cost of the Basic Report In modern asset management, the primary barrier to effective monitor integrity of a pressure equipment is the lack of detailed historical data. Some of the root causes and consequences of this issue are:
• Undocumented inspection parameters: Most inspection
standards and clients do not explicitly mandate that reports contain every detailed parameter and its corresponding observation.
• The two-page limit: Many providers issue brief, one or
two-page reports. While administratively convenient and cost saving for such providers, these documents omit critical engineering data essential for future reference.
Industrial Eye July/August 2026
TECHNICAL ARTICLE
• The disconnect between inspection cycles: Pressure
equipment is frequently inspected by different personnel or entirely different inspection bodies from one cycle to the next.
• Blind spots in deterioration trends: Without
comprehensive data from previous inspections, the incoming inspector cannot reliably determine the asset's deterioration trend. A single-page report offers no actionable intelligence to a subsequent inspector or the next inspection body.
The Solution
Comprehensive and Standardised Reporting To resolve these blind spots, the industry must transition to comprehensive reporting that systematically documents all inspected parameters, corresponding physical observations, non-conformities (or conditions for compliance), and subsequent engineering recommendations. Implementing the above requires standardising three core areas:
1. Inspection parameters: Defining exactly what must be looked at for every equipment type.
2. Probable observations and conditions: Providing predefined terminologies for what the inspector finds on-site and enters on the inspection record. 3. Recommendations: Standardising corrective actions to maintain consistency across different inspectors.
Industry Benefits
• For the asset owner: Owners gain access to granular,
parameter-specific observations that enable true predictive condition monitoring.
• For the future inspectors: Incoming inspectors are
equipped with precise baseline data, allowing them to compare findings and determine accurate deterioration trends.
• For industry compliance: Standardising data formats
ensures both the asset owner and the inspection body can track and monitor integrity concerns seamlessly over time.
Framework of a Modern Comprehensive Report A digitally driven, comprehensive inspection report is structurally superior to legacy paper documents. Key elements of a high-integrity report include: • Cryptographic authenticity (QR codes): Integrating
unique QR codes allows clients to instantaneously verify the authenticity of the report, mitigating the risk of fraudulent documentation.
• Granular conformity evaluations: Every single inspected
parameter is listed with its specific conformity status, detailed physical conditions, and corresponding recommendations.
• Integrated photographic evidence: Photographs are
mapped directly to the individual questionnaire items, providing visual context to the written findings.
Industrial Eye July/August 2026
• Strict document segregation (ISO/IEC 17020 or 17025
compliance): In alignment with international standards, reports must clearly segregate internal documentation (data generated directly by the inspection body) from externally provided documents (such as thirdparty non-destructive testing reports or material certificates).
Why Legacy Methods Fail
Transitioning to highly detailed reporting may initially sound time consuming and thus expensive. However, attempting to achieve this level of detail through legacy methods is virtually impossible with • Paper based or PDF inspection procedures: Standard
text based lengthy procedures are ineffective because field inspectors can become complacent over time, forget key parameters under time pressure, or they may simply overlook specific procedural requirements.
• Paper checklists: Traditional paper checklists do not
enforce completeness. Inspectors can easily bypass fields, leave handwritten entries prone to illegibility, or make critical spelling and entry errors.
• Basic form Apps: Simple Android input/output forms
lack the relational logic needed to enforce standardised data control or reference pre-configured compliance libraries in the field.
How to Increase Efficiency via Process Digitisation
The key to delivering highly detailed reports without increasing field hours lies in process control in the digital platform. By replacing paper checklists with an intelligent digital workflow, inspection bodies can dramatically increase efficiency and quality control through four core mechanisms:
[On-site prompting] ➔ [Connected reference libraries] ➔ [Data type validation] ➔ [Automated reporting]
The following guidelines could be useful for the entire industry. 1. Essential Safety and Job Safety Analysis (JSA)
Before any physical inspection begins, inspector safety must be addressed. Hence, your digital system must include the JSA as a precedent to the inspection process. A digitised JSA should feature interactive, conditional logic: • If an inspector answers a safety prompt with "Yes" or
"No," the system must validate the response.
• If a hazard is flagged, for example, if the inspector
indicates they do not know the site's emergency escape route then the system should halt the workflow and force the entry of corrective safety information before allowing the inspection to proceed.
2. Design, Registration and Content Integration
The digital model should house all engineering and design metadata directly within the inspection file. For example:
31
TECHNICAL ARTICLE
• Design approvals: Storing design approval certificates
directly in the digital asset file, eliminating the need to search through physical filing cabinets.
• Regulatory certificates: Provision for uploading
regulatory registration certificates, complete with application dates, registration dates, renewal deadlines, and manufacturer data.
• Design and operating limits: Capturing design
pressure, volume, temperature, and fluid contents.
• Automatic calculations: The system should
automatically calculate critical values (e.g. volume, expansive energy, etc) in real-time, supporting the inspector in manual calculations and thus eliminating mathematical errors.
• Historical baselines: Pulling previous inspection dates,
report numbers, and historical data directly into the active screen for immediate reference.
3. Smart Field Input and Standardised Prompting
While inspecting the physical equipment, the inspector should be guided by smart prompts tailored to the specific asset type. For example:
• Conditional field logic: If an inspector finds an
anomaly or critical observation then the system shall dynamically prompt them to input the specific
32
information or related data capture.
andatory fields: Unlike paper, the system blocks M report finalisation if mandatory fields are left blank, eliminating the common problem of discovering missing data only after returning to the office.
• Digital client sign-off: Upon completing the field
work, the inspector reviews the findings on-screen with the asset representative and captures their digital signature directly on a mobile device. This ensures mutual agreement on the scope completed and the conditions found before the inspector leaves the site.
4. Standardising the Input Structure
To generate polished, professional reports automatically, the system must separate the inspector's field interface from the final report output.
• Field question vs. statement on a report: In the field,
an inspector needs an active question. For example, "What is the condition of the protective coating?" On the final client facing report, this can be automatically rendered as a concise, objective statement: "Protective coating condition: {Inspectors selected observations}."
• Connected reference libraries: Instead of
typing extensively in hot, sweaty, dusty, or noisy environments, inspectors should be able select from Industrial Eye July/August 2026
TECHNICAL ARTICLE
drop-down menus populated by pre-configured reference libraries. These libraries should be built by the company's most experienced inspectors or engineers to capture institutional knowledge. For example -
o Contents: Integrating comprehensive, pre-loaded lists of vessel contents, complete with UN codes as specified in standards like AS 4343. o Conditions and non-conformities: Standardised phrases for defects and conditions, allowing field inspectors to import professional, compliant terminology rather than drafting generic text onsite.
• No post inspection editorial bottlenecks: Because
section headers, sub-sections, and data types are pre-configured, the report format is generated automatically based on site inputs. This eliminates the need for manual office formatting and drafting.
Reimagining the Client Portal and Data Security
True asset integrity monitoring requires that historical inspection data is readily accessible. Storing completed reports in a secure, centralised client portal allows asset owners to view equipment histories with ease.
As per international standards, inspection bodies must maintain confidentiality about client data. Traditional, permanent usernames and passwords pose a significant security risk. For example, if you provide a permanent login and password to your client contact, then there is a distinct possibility that if that contact leaves the client’s organisation, they could still access proprietary asset data while working for a competitor. To resolve this, modern portals use secure, dynamic access methods, such as One-Time Passwords (OTP) sent to verified corporate email addresses or phone numbers, ensuring only active, authorised personnel can access the organisation’s data.
What the Ideal Client Portal Can Deliver
A modern portal should categorise assets systematically (such as pressure equipment, tanks, lifting systems, heavy machinery, vehicles, non-classified assets) and provide instant access to key metrics like:
• Integrity dashboard: Instant visibility of the upcoming
external and internal inspection due dates.
• NCR register: Instant visibility of all pending NCRs and
input boxes for the client to action these NCRs.
• Historical archive: Single-click access to all historical
inspection reports and raw data.
• Ancillary records: Single-click access to historical
• Design records: Direct access to manufacturer data
reports and design registration records.
• Granular asset search: Quick access to generic asset
parameters (dimensions, operating pressures, design limits) without opening full PDF reports.
Conclusion and Industry Outcomes
By implementing digital process control, prompting, and standardisation, the asset integrity sector can move beyond the limitations of brief, uninformative reports. Transitioning to an intelligent digital model yields clear, measurable benefits: • Improved process visibility: Standardisation ensures
field inspections are conducted thoroughly and consistently.
• Enhanced integrity monitoring: Comprehensive
data and robust client portals empower asset owners to track long term deterioration trends and make informed maintenance decisions.
• Operational efficiency: Digitising the workflow
reduces non-conformities, eliminates office rework, lowers administrative costs, and boosts overall productivity.
The technology to achieve this level of precision has been active and continuously being enhanced by OMS Software since 2015. By embracing digital process control, inspection bodies can protect their field personnel, deliver unmatched value to asset owners, and raise the standard of engineering safety.
For a complimentary advice to improve your current system or for any other explanation or comments about this article, feel free to contact the author.
About the Author: Pranay Wadyalkar
Managing Director, OMS Software Pranay Wadyalkar is a Chartered Engineer, CMatP, Metallurgist, AICIP, AINDT L3 in ET, UT, RT, MT, PT, working in laboratories for 32years. Currently, as the MD at OMS Software, a digital automation company providing business management platform and LIMS. Prior to OMS, Pranay founded LMATS providing services in the field of NDT, inspection, metallurgy, mechanical and chemical testing. Pranay is on the NATA’s NDT Advisory Committee, Steel Association Board, Australian delegate on the ICNDT, APFNDT and NDE4.0SIG. Pranay was the AINDT President from 2014-2016, and a director (2009-2017).
calibration and test records for asset accessories.
Industrial Eye July/August 2026
33
TECHNICAL ARTICLE
Artificial Intelligence in Safety-Critical NDT: Why Skepticism is an Engineering Responsibility The asset integrity industry has conducted pressure equipment (PE) inspections for decades.
BY GLENN TUBRETT CHIEF EXECUTIVE OFFICER, CANADIAN INSTITUTE FOR NON-DESTRUCTIVE TESTING (CINDE)
Artificial intelligence has become almost impossible to avoid. Every conference includes AI sessions. Every software vendor has an AI roadmap. Every organisation is being asked what its AI strategy is. The excitement is understandable. AI has already demonstrated remarkable capabilities in many fields, and there is every reason to believe it will play an increasingly important role in non-destructive testing (NDT). What concerns me, however, is not the enthusiasm for AI. It is the assumption that innovation is, by its very nature, an improvement. Engineers have always approached such claims with healthy skepticism.
Throughout history, engineering has advanced because we embraced innovation while demanding evidence. New materials, new inspection techniques, new equipment 34
and new processes have all transformed our profession. Yet none were accepted simply because they were new. They were accepted because they were demonstrated to be at least as safe, reliable and effective as the methods they replaced. Artificial intelligence deserves exactly the same standard.
In safety-critical industries, skepticism is not resistance to progress. It is part of the engineering process. When an inspection influences the continued operation of an aircraft, a nuclear generating station, a pressure vessel, a bridge or a railway, our responsibility extends far beyond adopting the latest technology. Our responsibility is ensuring that every technological advance maintains—or improves—the level of safety that society expects from our profession.
Too often, discussions surrounding AI focus almost exclusively on what it can do. We hear about faster inspections, automated reporting, improved consistency Industrial Eye July/August 2026
TECHNICAL ARTICLE
and reduced costs. These are worthwhile objectives, but they answer only part of the question. The more important question is this:
How do we know when an AI system is ready to make safety-critical decisions?
Traditional engineering has always placed the burden of proof on those introducing change. If someone proposes a new welding process, a new alloy or a new inspection method, they must demonstrate that it performs as well as—or better than—the existing practice. Those asking for evidence are not expected to prove that the innovation is unsafe. The innovators must demonstrate that it is safe. Artificial intelligence should be no different.
Recent history provides a sobering reminder of why this principle exists. The Boeing 737 MAX tragedies were not caused simply by software. They resulted from a complex interaction of automation, human factors, assumptions about system behaviour and an overconfidence that technology would perform exactly as intended.
The Maneuvering Characteristics Augmentation System (MCAS), introduced to improve aircraft handling characteristics, relied on a single angle-of-attack sensor. When that sensor failed, the system repeatedly commanded nose-down trim, ultimately contributing to the loss of two aircraft and 346 lives.
The lesson for engineers was not that automation is inherently dangerous. Modern aviation depends upon automation, and commercial aviation remains one of the safest forms of transportation ever developed. The lesson was far more important. Sophisticated technology does not eliminate engineering responsibility. Every assumption must be challenged. Every credible failure mode must be explored. Every safeguard must be validated before lives depend upon it. Artificial intelligence presents a remarkably similar challenge.
AI introduces different challenges.
Instead of fatigue, we must consider biased or incomplete training data. Instead of inconsistent human judgement, we may encounter systematic errors repeated thousands of times before they are recognized. Instead of asking why an individual inspector made an incorrect decision, we may have to understand why an algorithm learned the wrong lesson. These are not software problems. They are engineering problems.
This distinction becomes especially important in non-destructive testing. Unlike many commercial AI applications that process millions of nearly identical examples every day, NDT often operates in environments characterized by variability. Components differ in geometry, manufacturing history, service conditions and degradation mechanisms. Inspection equipment evolves. Environmental conditions change. The defects we care most about are often rare, irregular and unlike anything contained within even carefully curated training datasets.
Ironically, the applications where AI could provide the greatest benefit are often the most difficult to validate. This is not an argument against AI. Quite the opposite.
There are already encouraging examples where artificial intelligence has demonstrated real value. Certain manufacturing environments produce highly repeatable inspection conditions and large quantities of consistent data, making them well suited for machine learning. In our own industry, promising work has also been undertaken in applications such as automated analysis of CANDU containment liner corrosion, where inspection conditions and objectives are sufficiently well defined to support meaningful algorithm development.
The question is not whether AI is impressive. It clearly is. The question is whether we can demonstrate, with evidence, that it consistently performs at least as well as the qualified professionals and established processes it is intended to support or replace.
These successes deserve recognition because they demonstrate what is possible when engineering discipline accompanies technological innovation.
That is a much higher standard—and it should be.
During a recent article I wrote on what I called the "AI Complexity Paradox," I argued that AI implementation becomes more difficult as inspection environments become more variable and less predictable. That observation remains relevant here, but perhaps an even more important question follows.
One of the interesting characteristics of artificial intelligence is that it changes the nature of risk rather than simply reducing it. Human inspectors become fatigued. They occasionally overlook indications. Experience differs from one individual to another. Our certification systems, procedures and independent verification processes have evolved over decades to recognize and minimize these human limitations. Industrial Eye July/August 2026
The danger lies in assuming that success in one application automatically transfers to another. It rarely does.
How much evidence should we require before AI becomes part of a safety-critical inspection process?
35
TECHNICAL ARTICLE
I would suggest the answer is "more than we currently discuss."
At a minimum, we should expect objective evidence that an AI system performs at least as well as qualified personnel under realistic operating conditions. Validation should extend beyond carefully selected development datasets and include different equipment, inspectors, environmental conditions and component types. False calls, missed indications, and confidence limits should be characterized rather than assumed. Limitations should be clearly understood and communicated. Performance should continue to be monitored after deployment, and significant algorithm updates should trigger appropriate revalidation.
Perhaps most importantly, we should think very carefully before removing meaningful human oversight. AI may become an exceptionally capable decision-support tool long before it is ready to become an autonomous decision-maker. History suggests this is exactly how engineering advances.
Digital radiography did not replace radiographers.
Engineers neither worship technology nor fear it. We verify it.
We validate it.
We measure it.
Only then do we trust it.
Artificial intelligence has extraordinary potential to improve safety, consistency and productivity throughout nondestructive testing. I hope it succeeds because our industry will undoubtedly benefit if it does. But hope has never been an engineering principle. Evidence is.
Innovation should never lower the standard of proof simply because it is exciting. If anything, transformative technologies deserve even greater scrutiny before they are entrusted with decisions affecting public safety. The future of AI in non-destructive testing will not be determined by how quickly we adopt it.
It will be determined by how rigorously we prove that it deserves our confidence.
Phased array ultrasonic testing did not eliminate ultrasonic testing expertise. Advanced robotics did not remove the need for engineers.
Each technology expanded our capabilities while simultaneously demanding new knowledge, new procedures and new competencies. Artificial intelligence is likely to follow the same path.
One of the more interesting ironies surrounding AI is that many organizations pursue it in search of efficiency, believing that fewer highly qualified people will be required. The opposite may prove true. Successfully implementing AI in safety-critical industries often requires additional expertise in materials engineering, statistics, software engineering, data science, validation, human factors and systems engineering. The technology may automate certain tasks, but it also introduces new responsibilities that demand highly qualified professionals. In other words, AI may not reduce complexity. It may simply relocate it.
As professionals, we should resist pressure from both extremes. One view claims that AI will soon replace inspectors. Another rejects AI as inherently unsafe. Neither position reflects how engineering has traditionally advanced.
36
About the Author: Glenn Tubrett
CEO, Canadian Institute for Non-Destructive Evaluation (CINDE) Glenn Tubrett is the CEO of the Canadian Institute for Non-Destructive Evaluation (CINDE). CINDE is Canada’s not-for-profit, member-based, technical society dedicated to the people and companies engaged in non-destructive evaluation, non-destructive testing, and inspection. Glenn graduated with a Bachelor of Engineering degree (Electrical) from Memorial University of Newfoundland. He has over 20 years of work experience in senior executive positions with the Canadian Standards Association Group.
His national and international assignments have included working with volunteer members in different forums to facilitate stakeholder engagement and develop government relations while improving conformity assessment standards.
Industrial Eye July/August 2026
TECHNICAL ARTICLE
A Simple Reference-Based Method for Measuring Acoustic Nonlinearity Parameter of Solids Using Immersion Ultrasonics A reference-based inversion framework is presented for measuring the absolute acoustic nonlinearity parameter, β, of solids using nonlinear immersion ultrasonics. BY YOGANANDH MADHURNATHAKAM, SUNIL KISHORE CHAKRAPANI DEPARTMENT OF ELECTRICAL AND COMPUTER ENGINEERING, MICHIGAN STATE UNIVERSITY
The proposed approach eliminates the need for direct transducer calibration by normalizing the measured second harmonic response of an unknown specimen with respect to a reference solid of known nonlinearity. A physics-based theoretical model describing finiteamplitude wave propagation in multilayer media is combined with through-transmission immersion measurements to isolate the contribution of the solid layer from surrounding fluid layers. The inversion is performed by matching the experimentally measured ratio of second harmonic amplitudes between the test and reference specimens with the corresponding ratio predicted by the model, which accounts for nonlinear accumulation, diffraction, and attenuation across all layers. The framework is validated experimentally using immersion measurements on cast aluminum, Ti-64, and SS 420. The inverted β values fall within the range typically reported for metallic materials, demonstrating the robustness of the pro-posed reference-based methodology and its suitability for repeatable, calibration-independent nonlinear material characterization.
Introduction
Nonlinear ultrasonic testing is widely used for detecting microstructural changes and early-stage damage in solids. The acoustic nonlinearity parameter (β) is particularly sensitive to dislocation density, precipitate evolution, and residual stress, and has been shown to be more responsive to subtle material degradation than conventional linear ultrasonic parameters such as velocity and attenuation [1, 2, 3].
The finite-amplitude method remains one of the most established approaches for determining the absolute acoustic nonlinearity parameter [4, 5]. In this framework, a monochromatic longitudinal wave propagating through a nonlinear medium undergoes quadratic distortion, generating a second harmonic component [1]. By relating the second harmonic amplitude to the square of the fundamental amplitude, β can be quantified. While Industrial Eye July/August 2026
well developed for fluids [6, 7, 8], accurate measurement of β in solids presents additional experimental challenges. Absolute β measurements in solids are commonly performed using contact-based piezo-electric detection [9, 10]. Although this technique provides high signalto-noise ratio, it requires controlled coupling conditions and careful transducer calibration. Variations in couplant thickness or contact force introduce uncertainty in displacement calibration and reduce repeatability. Other methods like laser interferometry and capacitive detection[11, 12, 13] eliminate coupling variability, but demand stringent surface preparation and controlled laboratory conditions. Immersion ultrasonics[14] offers consistent acoustic coupling while maintaining high signal fidelity. In a through-transmission configuration, the nonlinear wave propagates through a three-layer system (water/solid/ water), and the measured second harmonic contains cumulative nonlinear contributions from all layers. Accurate extraction of the solid’s β therefore requires a multilayer nonlinear propagation model and an appropriate inversion framework[15, 16]. In our previous work [15], a unified n-layer nonlinear acoustic model was developed in which nonlinear accumulation, equivalent attenuation, and diffraction were treated using a single Fresnel-zone formulation. An inversion strategy based on slope minimization of the p2 versus p2 relationship was validated experimentally and showed good agreement with contact-based measurements.
However, the framework required explicit calibration of the receiving transducer to convert measured voltage into absolute displacement or pressure. Although effective under laboratory conditions, this calibration step increases experimental complexity and limits repeatability across different systems. More importantly, it reduces the practicality of the method for industrial deployment, where robustness, minimal setup dependence, and reproducibility are essential. Therefore, there remains a need for an immersionbased inversion framework capable of determining the 37
TECHNICAL ARTICLE
absolute acoustic nonlinearity parameter without direct transducer calibration. The objective of the present work is to address this limitation and develop a calibrationindependent methodology suitable for repeatable and industry-oriented non-linear material characterization.
Three Layer Nonlinear Acoustic Wave Propagation Model
For immersion ultrasonic testing, the nonlinear acoustic wave propagates in three-layer configuration (water/ solid/water), as illustrated in Fig. 1. Using the previously developed n-layer nonlinear acoustic wave propagation model[15], the expressions for the fundamental and second harmonic pressures at the receiver location, i.e., at the end of the third layer, can be written as follows:
Figure 1: Nonlinear acoustic wave propagation in three-layer media
Sensitivity Study
Here, pi,n represents pressure in which i is 1 for fundamental and 2 for second harmonic, n denotes the layer number, T12 and T23 are transmission coefficients between 1 & 2 and 2 & 3. ρn, kn, zn, cn and βn are the density, wave number, layer thickness, speed of sound and acoustic nonlinearity parameter of the nth layer.
D and Γ are the diffraction and attenuation loss terms for fundamental (FH) and second (SH) harmonics, which are expressed as follows:
The objective of this article is to measure the acoustic nonlinearity parameter β. As is evident in Eqs. 1, 2 and 3, the experimentally measured harmonic amplitudes are dependent on several parameters. In the immersion setup, the nonlinear acoustic wave propagates through a three-layer medium, as illustrated in Fig. 1. The propagation distances in the first (z1) and third (z3) layers, i.e., the water path lengths, as well as the source frequency (f ) and transducer diameter (d), can be selected to enhance the influence of the solid’s nonlinearity parameter β2 on the received second harmonic signal. To optimize the measurement of β of the solid, a sensitivity study was conducted to identify the experimental parameters that yield maximum sensitivity to β2. To quantify this sensitivity, the slope of the relationship between the measured second harmonic pressure (p2,3) and the acoustic nonlinearity parameter of the solid (β2) was evaluated. A higher slope indicates that small changes in β2 produce a larger effect on p2,3 thereby improving the accuracy and robustness of the inversion.
Here, r and a represents radial distance from the source center and source radius. Where, α1,e and α2,e represents the equivalent attenuation coefficient of three layers for FH and SH pressure waves shown in Eq. 4. ze represents total propagation length and z¯e represents equivalent fresnel zone length of three layers derived similar to the existing work [17].
Figure 2: Sensitivity of second harmonic pressure (p2,3) to variations in β2 for a fixed set of propagation and transducer parameters.
The slope m shown in Fig. 2 was computed for a range of values of z1, z3, f , and d. Specifically, z1 and z3 were varied from 0.5 to 2.5 inches, and the corresponding
38
Industrial Eye July/August 2026
TECHNICAL ARTICLE
slope m was calculated using Eq. 1. The results are presented as a contour plot in Fig. 3(a). Similarly, frequency (f ) was varied from 1 MHz to 15 MHz, and transducer diameter (d) from 0.25 inch to 1 inch. The resulting slope values for these parameters are shown in Fig. 3(b).
Experiments
The experimental procedure closely follows the immersion-based nonlinear ultrasonic measurement method presented in our previous work [15], with a key distinction: the requirement for transducer calibration was eliminated by employing a reference-based technique. The schematic of the experimental setup is shown in Fig. 4. A custom-designed 3D-printed fixture was used to align the transmitting and receiving transducers with the solid sample, ensuring that both transducers were coaxial and that the faces of the solid were perpendicular to the direction of wave propagation.
Figure 4: Schematic of immersion ultrasonic testing setup that was used for experiments.
A 10 MHz immersion transducer was used as the source, and a 20 MHz transducer was used as the receiver. A 40-cycle tone burst was generated using a function generator and amplified with a RITEC GA2500 gated amplifier. The choice of a 40-cycle tone burst ensures sufficient steady-state harmonic generation and improved signal-to-noise ratio, while remaining short enough to avoid temporal overlap with reflections from specimen boundaries, enabling clean windowing of the received signals. A stepped attenuator was used to control and maintain consistent input power levels to the transmitter. The experimental procedure was carried out in three steps, as shown in Fig. 5: Step 1: Propagation in water without any solid layer. Figure 3: (a) Sensitivity of p2,3 to β2 as a function of water path lengths z1 and z3. (b) Sensitivity variation with source frequency (f ) and transducer diameter (d).
The results presented in Fig. 3 indicate that shorter water path lengths (z1 and z3) lead to increased sensitivity of the second harmonic pressure (p2,3) to the solid’s nonlinearity parameter β2. In addition, the sensitivity improves with higher transducer frequency (f ) and smaller transducer diameter (d). Based on these observations and considering practical experimental limitations, the propagation lengths in water (z1 and z3) were selected to be as short as feasible. A transducer with a center frequency of 10 MHz and an aperture diameter of 0.25 inch was chosen to ensure high sensitivity while maintaining reliable operation within the constraints of the setup.
Industrial Eye July/August 2026
Step 2: Propagation in a three-layer medium with a reference solid in the second layer.
Step 3: Propagation in a three-layer medium with the test solid in the second layer.
Figure 5: Schematic of the three experimental configurations: (a) Step 1 - Water only, (b) Step 2 – Reference solid, (c) Step 3 – Test solid
In each step, the transmitter was excited with both 10 MHz and 20 MHz tone bursts. The 10 MHz excitation was used to measure the fundamental harmonic (FH) attenuation coefficient (α1,2), longitudinal wave speed (c2), and the acoustic nonlinearity parameter (β2) of
39
TECHNICAL ARTICLE
the solid. The 20 MHz tone burst was used exclusively to determine the second harmonic (SH) attenuation coefficient (α2,2). The postprocessing and inversion for measuring attenuation coefficient and acoustic nonlinearity parameter are detailed in Sec. 5.
To ensure accurate measurements, the input power levels were carefully regulated using the stepped attenuator. For the determination of α1,2 and α2,2, the input power was maintained sufficiently low to avoid nonlinear distortion, ensuring that only the fundamental harmonic was present in the received signal. For the measurement of β, the input power was increased in a controlled manner to generate measurable second harmonic components while avoiding the generation of third and higher-order harmonics. This selective excitation ensured that the inversion procedure was based solely on the fundamental and second harmonic responses.
This formulation presents a key advantage: the ratio is independent of both the source amplitude p0 and the calibration factor H(f ), since the source, transducers, and electronics remain unchanged between the two measurements. The only unknown in the expression is ΓSol , which is a function of the attenuation coefficient α1,2 as described in Eq. 3. The attenuation coefficient α1,2 of the test solid can thus be obtained by minimizing the difference between the left-hand and right-hand sides of the above equation. This is achieved by iteratively updating α1,2 until convergence. The overall procedure is summarized in the flowchart shown in Fig. 6.
Reference Based Inversion Model
a. Measurement of Attenuation Coefficient
Attenuation loss plays a critical role in accurately measuring the acoustic nonlinearity parameter β. Therefore, the same experimental setup shown in Fig. 4 was utilized to measure the attenuation coefficients at the fundamental (FH) and second harmonic (SH) frequencies, i.e., 10 MHz and 20 MHz, respectively. A reference-based method was adopted to evaluate the attenuation, derived from the following expressions:
Here, pRef and pSol denote the fundamental harmonic pressures measured at the receiver (end of the third layer) from Step 2 and Step 3 of the experiment, respectively. In practice, the signals captured at the receiver are voltages, which require conversion to pressure using a calibration function H(f ). However, since the same receiver and electronic system are used in both steps, the calibration factor H(f ) remains constant and can be factored out as:
Substituting the above into the earlier expressions and taking the ratio yields:
40
b. Measurement of β
To determine the acoustic nonlinearity parameter β of the test solid, we adopt the reference-based inversion approach utilizing the analytical expression for second harmonic pressure in a 3-layer system (Eq. 1), which can be reformulated as:
Similar to the reference-based attenuation measurement method, the second harmonic pressures measured at the receiver in Step 2 (reference solid) and Step 3 (test solid) can be expressed as:
Substituting these into the expression for p2,3 and taking the ratio yields:
Industrial Eye July/August 2026
TECHNICAL ARTICLE
In this formulation, the only unknown is the acoustic nonlinearity parameter of the test solid, βSol 2. By iteratively varying βSol 2 and minimizing the difference between the left-hand and right-hand sides of Eq. 10, the value of βSol2 can be estimated. The overall inversion algorithm is outlined in Fig. 6.
Results
Borosilicate glass sample was used as the reference solid for the measurement process since it has very low attenuation and has been well characterized in the literature. The thickness of the borosilicate reference sample was 0.75′′. The attenuation coefficients of borosilicate were determined using water as the reference medium, following the procedure outlined in Sec. 5.1. The calculated values were shown in Table. 1.
The longitudinal wave speed in each solid was measured using the time-of-flight method based on the first signal onset. Subsequently, the attenuation coefficients of Cast Aluminum, Ti-64, and SS 420 were computed using the reference-based method described in Sec. 5.1. For each material, three independent experimental runs were performed, and the acoustic nonlinearity parameter β for each material was estimated using the inversion framework discussed in Sec. 5.2. The speed of sound in each solid was measured based on the time-of-flight of the received signal. These values, along with the corresponding sample thicknesses, attenuation coefficients, and acoustic nonlinearity parameters, are summarized in Table. 1 Table 1: Measured geometric, linear, and nonlinear acoustic properties of the different solids. Material
Thickness c2 α1,2 α2,2 β z2 (mm) (m/s) (Np/m) (Np/m)
Borosilicate (Ref)
19.05
5512
5.01
5.2
Cast Aluminum
25.40
6276
13.9
39.4
Ti-64
25.15
6121
6.9
17.8
SS 420
26.16
6029
3.7
11.4
Discussion and conclusion
6 (Ref)
7.5 ± 1.8
17 ± 2.6
13 ± 0.8
This study presented a novel immersion-based method for measuring the absolute acoustic nonlinearity parameter (β) of solids using a reference-based inversion framework. The proposed method eliminates the need for direct transducer calibration by leveraging relative measurements from a known reference material.
Industrial Eye July/August 2026
A validated three-layer nonlinear acoustic model was used to derive expressions for second harmonic pressure at the receiver, accounting for diffraction, attenuation, and multi-interface transmission effects.
A sensitivity study revealed that minimizing the water path length and selecting a higher frequency transducer with a smaller aperture significantly increases the sensitivity of p2,3 to the solid’s β2. Based on this insight, the experimental setup was optimized using a 10 MHz, 0.25-inch diameter transducer and short water paths. Borosilicate glass was used as the reference solid, and its known β, velocity, and attenuation properties enabled accurate inversion for the test materials. The inversion technique was applied to Cast Aluminum, Ti–64, and SS 420. The measured β values fall within the range reported in the literature for similar metallic alloys. It should be noted that directly comparable data for these specific alloys and processing conditions are limited. For stainless steels, prior studies [18, 19] provide reference values, while more broadly, intact metallic materials typically exhibit β values in the range of 5–20. All measurements obtained in this study fall within this expected range and validate the applicability of the proposed method to a variety of materials. Moreover, the attenuation coefficients obtained through the same reference-based approach offer additional insights into the energy dissipation mechanisms in these solids.
Overall, the method offers a repeatable, non-contact alternative to traditional contact-based techniques and is particularly useful for materials that are difficult to couple with piezoelectric sensors or require high spatial repeatability. Future work will extend this framework to anisotropic materials and more complex geometries, and investigate corrections for higher-order harmonic generation to further enhance inversion fidelity.
Acknowledgment
This article is based on research conducted as part of the doctoral dissertation entitled “Nonlinear Acoustic Wave Propagation in Layered Media and Its Application to Characterizing Material Nonlinearity[20],” completed by Yoganandh Madhuranthakam at Michigan State University, August 2025.
References
[1] K. H. Matlack, J. Y. Kim, L. J. Jacobs, and J. Qu. Review of Second Harmonic Generation Measurement Techniques for Material State Determination in Metals. Journal of Nondestructive Evaluation, 34, 3 2015. ISSN 15734862. [2] Mark F Hamilton and David T Blackstock. Nonlinear acoustics, chapter 2, page 33. Acoustic Society of America, 2008. [3] D. S. Hughes and J. L. Kelly. Second-order elastic deformation of solids. Phys. Rev., 92:1145–1149, Dec 1953. doi: 10.1103/PhysRev.92.1145.
41
TECHNICAL ARTICLE
[4] R. N. Thurston and M. J. Shapiro. Interpretation of Ultrasonic Experiments on Finite-Amplitude Waves. The Journal of the Acoustical Society of America, 41(4B): 1112–1125, 04 1967. ISSN 0001-4966. doi: 10.1121/1.1910443.
[14] Sunil Kishore Chakrapani and Daniel J. Barnard. A calibration technique for ul-trasonic immersion transducers and challenges in moving towards immersion based harmonic imaging. Journal of Nondestructive Evaluation, 2019.
[6] C Barriere and D Royer. Diffraction effects in the parametric interaction of acoustic waves: Application to measurements of the nonlinearity parameter B/A in liquids. IEEE Transactions on Ultrasonics, Ferroelectrics, and Frequency Control, 48(6):1706 – 1715, 2001.
[16] Yoganandh Madhuranthakam and Sunil Kishore Chakrapani. Diffraction and at-tenuation of nonlinear acoustic waves in layered media. Journal of Theoretical and Computational Acoustics, 0(0):2650001, 2025.
[5] M. A. Breazeale and D. O. Thompson. Finiteamplitude ultrasonic waves in alu-minum. Applied Physics Letters, 3(5):77–78, 09 1963. ISSN 00036951. doi: 10.1063/1.1753876.
[7] Cristian Pantea, Curtis F. Osterhoudt, and Dipen N. Sinha. Determination of acous-tical nonlinear parameter beta of water using the finite amplitude method. Ultrason-ics, 53(5):1012–1019, 2013. ISSN 0041-624X. [8] Daniel J. Barnard and Sunil Kishore Chakrapani. Measurement of nonlinearity pa-rameter (β) water using commercial immersion transducers. AIP Conference Pro-ceedings 1706, 060004, 2016.
[9] DJ Barnard, GE Dace, and O Buck. Acoustic harmonic generation due to thermal embrittlement of inconel 718. Journal of Nondestructive Evaluation, 16:67–75, 1997.
[10] Sunil Kishore Chakrapani, Alexander Howard, and Daniel Barnard. Influence of surface roughness on the measurement of acoustic nonlinearity parameter of solids using contact piezoelectric transducers. Ultrasonics, 84:112–118, 2018.
[11] D C Hurley and C M Fortunko. Determination of the nonlinear ultrasonic parameter using a michelson interferometer. Measurement Science and Technology, 8(6):634, jun 1997.
[15] Yoganandh Madhuranthakam, Daniel J. Barnard, and S. K. Chakrapani. Inversion of acoustic nonlinearity parameter of a solid using immersion method. Research in Nondestructive Evaluation, 0(0):1–19, 2025.
[17] Lester W. Schmerr. Fundamentals of Ultrasonic Nondestructive Evaluation, chap-ter 8, pages 272– 285. Springer International Publishing Switzerland, 2016.
[18] John H. Cantrell. Nondestructive Evaluation of Metal Fatigue Using Nonlinear Acoustics. In Donald O. Thompson and Dale E. Chimenti, editors, Review of Progress in Quantitative Nondestructive Evaluation, volume 1096 of American Institute of Physics Conference Series, pages 19–32, March 2009. doi: 10.1063/1.3114205.
[19] Sunil Kishore Chakrapani and Daniel J. Barnard. Determination of acoustic nonlin-earity parameter () using nonlinear resonance ultrasound spectroscopy: Theory and experiment. The Journal of the Acoustical Society of America, 141(2):919–928, 02 2017. ISSN 0001-4966. doi: 10.1121/1.4976057. [20] Yoganandh Madhuranthakam. Nonlinear acoustic wave propagation in layered media and its application to characterizing material nonlinearity. Order No. 32170070, Michigan State University, page 92, 2025.
[12] W. B. Gauster and M. A. Breazeale. Detector for measurement of ultrasonic strain amplitudes in solids. Review of Scientific Instruments, 37(11):1544–1548, 11 1966. ISSN 0034-6748.
[13] William T. Yost and John H. Cantrell. Absolute ultrasonic displacement amplitude measurements with a submersible electrostatic acoustic transducer. Review of Scien-tific Instruments, 63(9):4182–4188, 09 1992. ISSN 0034-6748. doi: 10.1063/1.1143231.
42
Industrial Eye July/August 2026
TECHNICAL ARTICLE
Clarifying Critical Parameters in Total Focusing Method Implementation for Advanced Ultrasonic Testing Performance in Industrial Application: Case study in Centreline Crack The Total Focusing Method (TFM) is widely recognized as an advanced imaging algorithm in ultrasonic non-destructive testing (NDT), providing high spatial resolution and detailed flaw visualization. BY MOHAMMADEBRAHIM BAJGHOLI, GILLES ROUSSEAU, EDWARD GINZEL, MARTIN VIENS AND THOMAS KRAUSE
However, inconsistencies in TFM implementation, calibration, and reporting practices continue to limit reproducibility and hinder meaningful comparisons across laboratories and industrial applications.
This study explores three key aspects of TFM implementation: (1) the practical differences observed when TFM is applied for flaw detection versus flaw sizing, (2) the influence of amplitude fidelity and grid resolution on quantitative image accuracy, and (3) the effect of wave-mode selection on flaw characterization. A combined simulation and experimental investigation was conducted. Semi-analytical simulations were performed using CIVA software to evaluate the influence of wave-mode selection, amplitude fidelity, and grid resolution on TFM imaging. The results highlight how variations in amplitude fidelity and wave-mode selection can affect detection sensitivity and flaw dimension estimation.
Introduction and Background
TFM represents a major advancement in ultrasonic nondestructive testing (NDT). Its quantitative capability for flaw detection, sizing, and characterization has made it a preferred inspection approach across numerous industrial sectors. Despite its growing adoption, inter-laboratory studies have revealed significant inconsistencies in TFM implementation, calibration, and interpretation. Variations in acquisition setup, grid definition, and post-processing algorithms can substantially influence amplitude accuracy, image fidelity, and flaw sizing precision, underscoring the need for improved procedural consistency and parameter standardization across both research and industry [1–10]. Over the past few years, several studies [1–10] have systematically addressed calibration methodologies and human factors to establish a more unified foundation for parameter selection and interpretation. Numerous investigations [1–10] have also shown that FMC/TFM can surpass other Phased Array Ultrasonic Testing Industrial Eye July/August 2026
(PAUT) in detection sensitivity, spatial resolution, and signal-to-noise ratio (SNR). Unlike PAUT, which relies on predefined focal laws, TFM performs post-acquisition focusing at every point within the region of interest (ROI), simplifying setup and improving interpretability. According to ISO 23864 and ISO 23865 [11, 12], FMC/ TFM offers significant post-processing flexibility, enabling velocity correction, adaptive focusing, and reanalysis without repeating inspections. Among the factors governing TFM performance, three aspects are the focus of this study: (1) the practical use of TFM for flaw detection versus quantitative flaw sizing, (2) amplitude fidelity and grid resolution, and (3) wave-mode selection. Although TFM is widely applied for both detection and flaw sizing, these objectives require different inspection strategies and imaging conditions. Amplitude fidelity, which is strongly influenced by reconstruction grid resolution, governs the quantitative accuracy of reconstructed amplitudes and flaw dimensions. Wave-mode selection determines the ultrasonic propagation paths used for image reconstruction and therefore influences flaw detectability, sizing accuracy, and characterization.
Wave-mode selection defines how ultrasonic wave propagation paths are used for image reconstruction. In this study, the wave-mode notation identifies the wave type during propagation and reflection, where L denotes a longitudinal wave, T denotes a transverse (shear) wave, and the separator (–) distinguishes the propagation path before and after reflection from the target. For example, L–L and T–T represent direct longitudinal and direct transverse wave imaging, respectively, in which the same wave mode is transmitted, reflected, and received. More complex notations describe indirect or mode-converted propagation paths. For example, LLL and TTT represent triple-leg propagation involving only longitudinal or only transverse waves, whereas TT–TT denotes a fourleg transverse-wave propagation path. Direct modes (L–L and T–T) are generally well suited for detecting volumetric reflectors, whereas indirect or converted modes (e.g., LL–L, TT–T, and LT–L) can enhance the detection of planar or vertically oriented flaws. 43
TECHNICAL ARTICLE
Multi-mode imaging combines these complementary propagation paths to improve overall flaw detection and characterization [6, 10–14]
In summary, while TFM provides exceptional imaging capability, its quantitative reliability strongly depends on appropriate parameter selection and verification. To investigate these factors, this study combines semi-analytical CIVA simulations with experimental investigations using a representative SMAW welded specimen. The simulation study is used to systematically evaluate the effects of wave-mode selection, amplitude fidelity, and grid resolution under controlled conditions. This study therefore addresses a critical gap in current practice by examining three key aspects of TFM implementation: (1) flaw detection versus flaw sizing, (2) amplitude fidelity and grid resolution, and (3) wavemode selection. Unlike prior studies that treat these parameters independently or qualitatively, this work establishes practical guidelines for optimizing TFM configuration in industrial inspections, demonstrated through a centerline crack case study.
TFM as a Sizing Tool
TFM provides significant advantages for quantitative flaw sizing and characterization compared with amplitudebased approaches [2, 4, 5, 10]. By reconstructing fully focused images from all transmit–receive element combinations, TFM enables precise localization of defect boundaries and enhanced depth resolution. The accuracy of flaw characterization depends on multiple factors, including acquisition parameters, probe frequency, aperture size, wedge geometry, and material properties, all of which collectively determine image resolution. The flaw analyzed in this study comes from a destructive round-robin reference specimen (SMAW #2, Flaw #3) containing a centerline crack with a vertical extent of 3.24 mm and a ligament distance of 3.9 mm from the outer pipe surface, as shown in Figure 1 [8].
to replicate the experimental inspection geometry used for the weld. A planar flaw was defined to approximate the centerline indication observed in the weld. Multiple TFM wave-mode combinations (L–L, T–T, and modeconverted paths) and grid resolutions were analyzed to evaluate the effects of pixel density on amplitude fidelity, image sharpness, and flaw-height estimation
Figure 2. CIVA simulation setup showing the 7.5L32 linear phased array probe mounted on a 55S wedge positioned over the modeled planar flaw.
accuracy. These results highlight the necessity of explicitly defining the intended role of TFM, whether as a detection or sizing tool prior to inspection design. For detection-oriented inspections, broader apertures and lower-frequency probes are typically favored to maximize coverage and signal-to-noise ratio, whereas accurate flaw sizing or characterization requires higherfrequency probes, smaller apertures, and precise wedge geometries to enhance lateral resolution and minimize beam divergence. In this study, the chosen setup and simulation parameters were optimized for centerline crack detection and quantitative sizing, aligning probe frequency, aperture, and wave mode selection with this objective. Figure 3 illustrates the metallographic crosssections of the center crack, providing the ground-truth
Figure 1. Pipe sample and flaw dimension.
Simulation Study: A representative semi-analytical model was developed in CIVA 2023 simulation software (EXTENDE, France) [15] to simulate the flaw geometry within a welded specimen. Since the curvature of the original pipe was minor, an equivalent planar configuration was used, which provided comparable results for flaw depth and ligament thickness. The CIVA simulation setup is illustrated in Figure 2, using a 7.5 MHz, 32-element linear phased-array probe with a 1.0 mm element pitch and 0.9 mm individual element width, a 10 mm passive aperture, and mounted on a 55° refracting wedge. This configuration was modeled
44
Figure 3. Metallographic cross-sections for center crack used for TFM sizing validation.
geometric measurements used to validate the accuracy of TFM-based flaw sizing. Experimental Reference. The flaw was reproduced in CIVA simulation software as a CAD-defined planar reflector using dimensions obtained from destructive testing, including a 3.9 mm ligament from the outer pipe surface. Figure 4 shows the flaw vertical extents derived from the macro-photograph identifying the measurements to the upper and lower limits of the
Industrial Eye July/August 2026
TECHNICAL ARTICLE
flaw. Red horizontal lines are drawn parallel to the upper surface through the points with minimum and maximum ligament. This is in accord with the BS 7910 sizing box [4, 7]. Thin orange and grey lines at the ends of the indication represent the length as estimated by extrapolating to a point that is half-way between the last cut where the flaw was seen and the next cut where it was not seen.
Figure 4. Flaw vertical extents based on macro-photo measurements, showing upper and lower crack tip positions.
Wave Mode Selection in TFM
Simulation Results: TFM reconstructs ultrasonic images employing multiple propagation paths (L–L, T–T, LLL, TTT, etc.). Each wave mode offers advantages in terms of penetration depth, lateral resolution, and sensitivity to flaw orientation [6, 10]. In the present study, six propagation modes (L–L, LLL, LLLL, T–T, TTT, and TT– TT) were evaluated on the centerline crack indicated in Figure 5. Mechanical T-scans were performed using CIVA simulation at 2 mm intervals along the crack, with right-side inspection data reported.
Longitudinal-wave modes produced broad flaw representations with diffuse reflections and limited tip resolution, whereas shear-wave modes yielded higher image contrast and more distinct tip diffractions. Among all configurations, the TT–TT mode demonstrated the highest accuracy in flaw-height estimation (≈3.2 mm), closely matching destructive metallographic measurements. Although higher-order multi-leg paths (e.g., TT–TT) improved side-lobe suppression, they introduced weaker back wall correlation and minor spatial inaccuracies due to increased propagation paths.
The “Mechanical T-scan” image (Figure 6) shows the amplitude distribution at the flaw location. When reconstructed using the TT–TT mode, the Mechanical T-scan provides a clear outline of the flaw geometry. However, the 6 dB drop method cannot be applied to estimate flaw length or height in this case, as the upper tip diffraction produces a sharp peak followed by a rapid amplitude decrease, preventing a meaningful −6 dB boundary definition.
Figure 6. Mechanical T-scan from CIVA simulation software (upper image indicated the flaw outline, lower image overlays the TFM reconstruction data).
Industrial Eye July/August 2026
45
TECHNICAL ARTICLE
Exporting the Mechanical T-scan into a 3D rendering using a −20 dB color palette produced an outline that closely matched the overall flaw dimensions, as shown in Figure 7.
Figure 7. Flaw height from CIVA simulation software.
Using the tip-diffraction profile obtained from the Mechanical T-scan under the TT–TT mode, the upper and lower tip responses provided a reliable indication of the flaw height, as illustrated in Figure 8.
Figure 8. Mechanical T-scan of the simulated flaw, confirming the flaw vertical extent and length.
Experimental Validation: Following the simulation, the TFM experimental result were validated using the TOPAZ 64 system with a 7.5 MHz probe under the TT–TT wave-mode selection. The reconstructed image using projection gates confirms clear flaw localization with high signal amplitude, consistent with the predicted simulation response as seen in Figure 9.
Amplitude Fidelity and Grid Resolution
Amplitude fidelity refers to the accurate preservation of the relative amplitudes of received ultrasonic signals during image reconstruction. It directly affects amplitude-based sizing methods such as tipdiffraction or corner-response sizing. According to ASME BPVC Section V, Article 4, MANDATORY APPENDIX F, F-461[13], amplitude fidelity must remain within ±2 dB between reference and reconstructed amplitudes to ensure quantitative reliability in TFM imaging. Deviation beyond this tolerance can distort the energy distribution of reflected signals, leading to under- or overestimation of flaw height and ligament measurements. In addition, the qualified procedure must outline the method used to assess amplitude fidelity. According to ASME PTB-15 [14], the accuracy of amplitude reconstruction in TFM imaging is influenced by the spatial resolution of the computational grid. To ensure reliable signal representation, the grid pitch should be sufficiently fine, typically about one-fifth of the wavelength (λ/5), to achieve at least five pixels per wavelength. When the ultrasonic beam propagates parallel to the grid axes, this resolution maintains amplitude variations within approximately −2 dB.
Simulation Assessment: To assess these effects, multiple grid resolutions were evaluated using the TT–TT mode, as illustrated in Figure 10. At identical scan positions, the depths corresponding to the maximum-amplitude upper and lower crack-tip echoes were measured and summarized in Table 1. The 0.1 × 0.1 mm grid provided the closest correspondence to the mechanical T-scan measurement, demonstrating accurate reporting of both tip diffractions and total flaw height (3.19 mm compared to the actual value of 3.24 mm). However, this apparent precision must be interpreted within the spatial uncertainty imposed by the grid resolution (±0.05 mm for a 0.1 mm grid). The coarser 0.5 × 0.5 mm grid exhibited amplitude under-representation at the upper tip, while the finer 0.075 × 0.075 mm grid showed slightly improved edge definition and reduced speckle noise compared to the 0.1 × 0.1 mm grid, albeit with longer processing time. These findings align with ASME guidelines [13-14], which recommend balancing amplitude fidelity and grid density for consistent imaging performance. Practitioners are therefore advised to:
1. Validate amplitude fidelity using reference reflectors at the same frequency and focal depth as the inspection region.
2. Report the grid dimensions, reconstruction algorithm, and amplitude-correction method used. 3. Demonstrate that amplitude deviation remains within ±2 dB across the imaging field. Such documentation ensures transparency, reproducibility, and traceable compliance with TFM performance standards. Figure 9. TFM experimental result obtained using the TOPAZ 64 by 7.5 MHz probe.
46
Industrial Eye July/August 2026
TECHNICAL ARTICLE
Table 1. Comparison of grid size versus measured flaw depth and height obtained from CIVA Simulation software (The modeled flaw at this axial position has a vertical extent of 3.24 mm). Grid (mm)
Upper Tip Depth (mm)
Lower Tip Depth (mm)
0.125x0.125
4.46
7.59
0.075x0.075
4.54
7.75
0.5x0.5 0.1x0.1
4.9
4.48
7.85
7.67
Flaw Height (mm) 3.0 ± 0.25
3.1 ± 0.06
3.2 ± 0.05 3.2 ± 0.04
Using the TT–TT mode and selecting suitable palette colours, the TFM tip-diffraction outline of the flaw is clearly seen to reliably maintain the flaw shape and size, as shown in Figure 11. The red contour in the simulation represents the flaw outline, while the colored regions indicate the locations of the tip-diffracted signals obtained from the simulation. The corresponding reconstruction using the 0.1 × 0.1 mm grid is also shown in this figure. Although CIVA displays tip coordinates with two decimal places, the effective vertical sizing resolution is limited by the reconstruction grid spacing. The tip location can only be resolved to within half of the grid increment (± grid/2). Therefore, reported flaw heights should be interpreted within the uncertainty band dictated by the grid resolution rather than the displayed numerical precision. When interpreted within their respective grid-dependent uncertainty bands (± grid/2), all measured flaw heights contain the true flaw height of 3.24 mm, indicating that differences at higher decimal precision reflect discretization effects rather than true physical deviation.
Figure 10. TFM reconstructions at different grid sizes showing amplitude contrast and flaw-tip clarity.
Industrial Eye July/August 2026
Figure 11. Mechanical T-scan showing flaw outline from a five-step scan with 0.1 × 0.1 mm grid resolution by CIVA Simulation Software.
47
TECHNICAL ARTICLE
Conclusion
This study highlights the critical influence of parameter standardization, particularly wave-mode selection, amplitude fidelity, and grid resolution, on the accuracy and reproducibility of TFM imaging. In the case study presented, which focused on a centerline crack within the weld joint, several wave-mode configurations were applied to evaluate their influence on flaw detection and sizing. Among these, the shear-wave mode (TT– TT) achieved the most accurate flaw-tip resolution and height estimation when validated against destructive testing results. A 0.1 × 0.1 mm reconstruction grid provided an optimal balance between spatial accuracy, signal clarity, and computational efficiency for this specific configuration. These results confirm that TFM should be regarded as a flaw measurement tool, requiring careful calibration, documentation, and verification. Standardized reporting of wave modes, reconstruction parameters, and fidelity validation enhances data traceability and inter-laboratory reproducibility.
Acknowledgment
This paper is dedicated to the memory of Gilles Rousseau, whose mentorship, generosity, and technical insight profoundly influenced this work. The authors gratefully acknowledge financial support from École de technologie supérieure (ÉTS) and Hydro-Québec as an industrial partner. The authors also thank the NDT and DT departments of the Centre de métallurgie du Québec (CMQ), as well as Mr. Guy Maes and Mr. Patrick Tremblay of Eddyfi Technologies, and Dr. Jon Lesage of Acuren, for their valuable collaboration and support throughout this research.
References
1. Bajgholi, M. E., Rousseau, G., Viens, M., & Thibault, D. (2021). Capability of advanced ultrasonic inspection technologies for hydraulic turbine runners. Applied Sciences, 11(10), 4681. https://doi.org/10.3390/app11104681 2. Bajgholi, M. E., Rousseau, G., Ginzel, E., Thibault, D., & Viens, M. (2023). Total focusing method applied to probability of detection. The International Journal of Advanced Manufacturing Technology, 126(7–8), 3637–3647. https://doi.org/10.1007/s00170-02311328-x 3. Bajgholi, M. E., Rousseau, G., Viens, M., Thibault, D., & Gagnon, M. (2023). Reliability assessment of non-destructive testing (NDT) for the inspection of weld joints in the hydroelectric turbine industry. The International Journal of Advanced Manufacturing Technology, 128(9–10), 4223–4233. https://doi. org/10.1007/s00170-023-12176-5
4. Ginzel, E., Bajgholi, M. E., Guimarães, M. B. M., Foucher, F., Rousseau, G., & Viens, M. (2022). Total focusing method used for flaw sizing in probability of detection determination. e-Journal of Non-Destructive Testing & Ultrasonics, 27(7). www.ndt.net/article/ ndtnet/papers/TFM_used_for_flaw_sizing_for_ probability_of_detection_deter mination.pdf
48
5. Bajgholi, M. E., Rousseau, G., Viens, M., & Thibault, D. (2023). Advanced ultrasonic inspection methodologies for fitness-for-service (FFS) assessment of hydraulic turbines. The International Journal of Advanced Manufacturing Technology, 129(5–6), 2621–2633. https://doi.org/10.1007/s00170-023-12498-4 6. Bajgholi, M. E., Rousseau, G., Ginzel, E., Viens, M., & Mélançon, V. (2024). Developing flaw sizing methodology in total focusing method (TFM) by EDM calibration blocks. E-Journal of Non-Destructive Testing & Ultrasonics, 29(10). www.ndt.net/ article/ndtnet/papers/Developing_flaw_sizing_ methodology_in_Total_Focusing_Meth od.pdf
7. Burrowes, M., Ginzel, E., Pereira, G. R., & Tavares, L. M. (2023). Stage 1 Round-Robin Report: On the Use of Total Focusing Method for Sizing Flaws in Assessing Probability of Detection. e-Journal of NondestructiveTesting (eJNDT Articles & News),28(8). www.ndt.net/article/ndtnet/papers/Stage_1_ Round-Robin_Report_On_the_Use_of_Total_ Focusing_Method_for_Sizing_Flaws_in_Assessing_ Probability_of_ Detection.pdf 8. M. Burrowes, E. Ginzel, G. R. Pereira, C. G. Camerini. Evaluating Human Factors in TFM Sizing Accuracy: Statistical Findings from a Round-Robin Programme (Part 2). December 2024. www.ndt.net/article/ ndtnet/papers/Evaluating_Human_Factors_in_ TFM_Sizing_Accuracy_Statistic al_Findings_from_a_ Round-Robin_Programme_2.pdf 9. Bajgholi, M. E., Viens, M., Rousseau, G., Ginzel, E., Thibault, D., & Gagnon, M. (2024). Ultrasonic testing techniques for integrity assessment of hydraulic turbine runner. The ReJNDT special issue'Frontiers in Nondestructive Testing and Evaluation: Academic Insights. www.ndt.net/search/docs.php?id=29989
10. ASTM International. (2026). ASTM E3517/ E3517M-26: Standard practice for flaw sizing using total focusing method. ASTM International. https://doi.org/10.1520/E3517_E3517M-26. 11. \BS ISO 23864: 2021 BSI standards publication nondestructive testing, ultrasonic testing, use of automated total focusing technique (TFM) and related technologies. 12. ISO23865:2021; Non-Destructive Testing— Ultrasonic Testing—General Use of Full Matrix Capture/Total Focusing Technique (FMC/TFM) and Related Technologies. International Organization for Standardization: Geneva, Switzerland, 2021. 13. ASME Section V, Article 4 (2023), Mandatory Appendix XI, Full Matrix Capture.
14. ASME, Full Matrix Capture Training Manual, PTB-152023, American Society of Mechanical Engineers, New York, USA. 15. CIVA computer simulation package, www.extende.com/
Industrial Eye July/August 2026
INDUSTRY NEWS
NDT World Event Calendar The 4th World Congress on Condition Monitoring (WCCM2026) 25 to 27 August | Milan, Italy
The primary objective of the WCCM is to facilitate the global exchange of research and applications in Condition Monitoring and related areas, with a strong emphasis on scientific and technological advancements, industrial applications and international cooperation. The Congress serves as a worldwide platform for scientists and professionals from both academia and industry to share knowledge and insights. The event is organised in collaboration with condition monitoring and NDT societies worldwide. For further information, visit: aimnet.it/wccm2026
NDT 2026: BINDT’s 63rd Annual Conference 8 to 10 September | Telford, United Kingdom
From 8 to 9 September over 70 companies are expected to exhibit at NDT 2026, one of the leading international exhibitions for the NDT, condition monitoring, diagnostic engineering and quality testing industries. NDT 2026 will consist of three parallel technical sessions, with talks and seminars covering a broad range of NDT technologies and applications. The British Institute of Non-Destructive Testing encourages the submission of papers from both academia and industry. For further information, visit: bindt.org/events-and-awards/ndt-2026/
ASNT 2026
12 to 15 October 2026 | Ohio, USA ASNT 2026 is your opportunity to experience the very best of non-destructive testing—innovations, insights, and the people shaping what comes next. Over four days, thousands of professionals come together to learn, connect, and explore the technologies and approaches advancing the field. With over 100 technical sessions, 200 exhibitors, technical talks will cover all the major methods and industries, the latest on codes and standards, and new innovations. The theme, Together We Lead, reflects a shared commitment to progress. For further information, visit: asnt.org/events/asnt-2026
DE for Safety 2026
11 to 13 November | Společenský dům, Františkovy Lázně The NDE for Safety conference will cover all topics related to non-destructive testing and evaluation of materials and structures in all areas of technical activities. It is an opportunity to come together with
Industrial Eye July/August 2026
like-minded professionals interested in NDT research and development, as well as practice, standardisation and application of NDT methods. Manufacturers and suppliers of NDT instruments and services are invited to present their products and innovations. For further information, visit: cndt.cz/en/conference
NDE 2026
15 to 17 November | Hyderbad, India This premier event with bring together over 2,000 professionals, researchers, and industry leaders to exchange transformative ideas, innovations, and advancements in the ever-evolving domain of NDE. These breakthroughs will be demonstrated by an exhibition featuring over 100 companies, showcasing best-in-class achievements. With the theme Innovation for Strategic and Economic Excellence, sessions will cover critical sectors like defence, aerospace, renewables, oil and gas, manufacturing and more. For further information, visit: isntnde.in
8th Malaysia International NDT Conference and Exhibition (MINDTCE) 17 to 18 November | Selangor, Malaysia
The 8TH MINDTCE is the definitive biennial event for the NDT community in southeast Asia. Organised by the MSNT, the event bridges the gap between academic research and industrial application. It brings together scholars, engineers and key decision-makers to explore the technologies that ensure the safety and integrity of our world’s infrastructure. It will cover topics like NDT methods and techniques, NDT 4.0 and digital transformation, safety, compliance, education and professional development, and more. For further information, visit: mindtce.com.my
8th African Conference on Non-Destructive Testing (ACNDT) 18 to 19 November | Tunis, Tunisia
Organised by the African Federation for Non-Destructive Testing (AFNDT), ACNDT 2026 will bring together experts, researchers, engineers, industry professionals, and decision-makers from around the world to share the latest scientific, technological, and industrial advances in the field of non-destructive testing. The conference offers a unique platform for knowledge exchange, development, networking, partnerships, and the promotion of innovation. For further information, visit: sapri.tn/acndt-2026
49
PRODUCTS & SERVICES
AXT
D R May Inspections was Quality Tube Heads Backed with Local Support
AXT has been selling quality tube heads from Rigaku and Comet (formerly Yxlon) for over 20 years. Rigaku’s tube heads were the first product AXT offered to the NDT industry and are renowned for their robustness and reliability. About 10 years ago, AXT added the award-winning Comet EVO series of tube heads which also offer fine focal spot and water-cooled models. These were recently augmented by the new ECO range of lightweight/ergonomic tube heads.
For those who have already have a Rigaku or Comet tube head, or are in the market for one (or more), you can rest easy in the knowledge that AXT backs purchases of these systems with local servicing. In the rare event of
OMS Engineering
OMS Engineering is a NATAaccredited Non-Destructive Testing (NDT) services provider, delivering reliable inspection solutions to the mining, manufacturing, and fabrication industries. Their experienced and qualified technical team is committed to providing high-quality workmanship, professional service and dependable inspection outcomes. They provide a comprehensive range of NDT services to support the integrity, safety and reliability of critical plant, equipment and fabricated components. Their capabilities include Magnetic Particle Testing (MT), Liquid Penetrant Testing (PT), Ultrasonic Testing (UT) Eddy Current Testing (ET) and Visual Inspection.
QuadSonics
Advanced Ultrasonic Inspection Without Compromise
QuadSonics is an Australianowned specialist NDT company focused exclusively on advanced ultrasonic inspection technologies. Established by experienced ISO 9712 Level 3 personnel, they provide technically driven inspection solutions across the oil and gas, mining, defence, power generation and infrastructure sectors.
Their capabilities include PAUT, TOFD, FMC/TFM, corrosion mapping, encoded UT and Zonal AUT for pipeline girth welds. Every inspection is supported by robust procedures, calibrated equipment and experienced personnel committed to delivering reliable, repeatable and code-compliant results.
QuadSonics continues to invest in emerging technology. Their latest PipeWizard iX AUT platform provides multi-technique inspection capability, combining zonal 50
your system going down, AXT has engineers in Sydney and Perth who can get you back up and running in the shortest possible time, with no need to send your system overseas to the manufacturer.
In the worst case, your system cannot be turned around in a reasonable timeframe, or if you need to continue working, AXT also has a fleet of hire systems. Pending availability, these can usually be dispatched immediately to keep your job running on schedule, ensuring you meet your deadlines. AXT’s NDT and radiography portfolio also includes Fujifilm industrial X-ray film and Protec automated film processors. AXT holds local stock of Fujifilm film and chemicals available for same day delivery. If you haven’t already done so, contact AXT for a competitive quote at info@axt.com.au or call 02 9450 1359.
Their inspection capabilities cover welds, forgings and castings, including the detection of surface, nearsurface and subsurface discontinuities. Ultrasonic services include inspection of welded components, forgings and castings, ultrasonic thickness measurement, lamination scanning of rolled plate, and in-situ examination of shafts, pins and bolts.
With a strong focus on quality, safety, responsiveness and technical expertise, OMS Engineering works closely with clients to provide practical NDT solutions suited to both workshop and field environments. Their goal is to help clients maintain equipment integrity, identify defects early and support safe, reliable operations. OMS Engineering – Professional NDT and Inspection Solutions You Can Rely On. For further information, visit: oms.net.au
discrimination, conventional PAUT, TOFD, transverse scanning and TFM within a single system. This allows rapid deployment, improved productivity and comprehensive inspection coverage while maintaining the highest technical standards.
Beyond field inspections, they provide Level 3 consultancy, procedure development, qualification support, technical audits, training, equipment validation and project-specific inspection advice. Their focus is on delivering practical solutions that improve inspection quality, reduce project risk and support informed integrity decisions. At QuadSonics, technical excellence is the priority. They believe advanced NDT should deliver more than compliance—it should provide confidence in every inspection result.
Whether supporting major shutdowns, new construction, pipeline projects or complex integrity assessments, QuadSonics combines experience, innovation and responsiveness to help clients achieve safe, efficient and reliable outcomes. For further information, visit: quadsonics.com.au
Industrial Eye July/August 2026
PRODUCTS & SERVICES
SmartChem Industries
SmartChem Industries is your trusted partner for magnetic particle and dye penetrant requirements, with over 100 years combined experience in the manufacture and distribution of magnetic particle and dye penetrant consumables.
Established in 2012, Smartchem is 100% Australian owned and proudly manufactures in Australia with Australian resources where possible. SmartChem prides itself on service, both technical and in the delivery of our products. The SmartCheck MPI range complies with the requirements ISO-9934.2 and other relevant standards. The SmartCheck dye penetrant range has been third party type tested to ISO 3452.2 by MPA Hanover in Germany. This range now includes the SmartCheck Dye Pen Fluoro: a level three water washable and solvent removable fluorescent dye penetrant.
Total Asset Solutions More Reliable Infrastructure.
Delivering Asset Integrity for Safer,
Total Asset Solutions is a Tasmanian-owned and operated business dedicated to helping organisations improve the safety, reliability and performance of their assets through advanced inspection and monitoring services.
Working across a range of industries, Total Asset Solutions specialises in thermographic inspections and drone-based asset inspections, providing clients with valuable insights into the condition of critical infrastructure and equipment. By identifying potential issues before they become costly failures, Total Asset Solutions helps businesses minimise downtime, reduce risk, and make informed maintenance decisions. Using advanced infrared thermal imaging technology,
Wood Group
With 35,000 professionals across 60 countries, Wood Group is one of the world's leading consulting and engineering companies operating across energy and resources markets. Here in Australia, the broad range of services Wood Group offers its clients includes machinery vibration and lubrication analysis for all types of equipment, across all industries. Their certified personnel can provide end-to-end routine measurement, analysis, and reporting; alternatively, they will supplement your people to match your needs. Wood Group is vendor-agnostic and work with a wide range of wireless, wired, and portable hardware and software platforms to provide routine and troubleshooting services to the very highest level. Wood Group does not stop at finding and diagnosing problems – from skid to piping to vessel, they have an unrivalled track record of engineering actionable Industrial Eye July/August 2026
All CoC and SDS are available on the SmartChem website, which is a useful reference tool for an audit or where a copy is required in the field. SmartChem is the exclusive distributor for the Matcon range of magnets and equipment. They are also exclusive distributors for Promag UV lights and equipment.
SmartChem supplies direct and has a network of resellers throughout Australia. Please contact them for your nearest reseller on the east coast. Heatleys Safety and Industrial (www.heatleys.com.au) are their distributor in Western Australia, ensuring all SmartChem products available via a well-established distribution network. SmartChem’s products are now available in New Zealand, stocked in both the North and South Island through their new distributor Accurate Instruments (www.accurate.kiwi). For further information, visit: smartchem.com.au
the team can detect hidden defects in electrical and mechanical systems, solar installations, buildings, and other key assets. These inspections provide a noninvasive method of assessing asset condition while supporting improved safety and operational efficiency.
In addition, licensed drone services enable safe and effective inspections of structures and locations that may be difficult, costly, or hazardous to access using traditional methods. This approach allows for detailed visual and thermal assessments while reducing risks to personnel and minimising disruption to operations.
With a strong commitment to professionalism, innovation, and customer service, Total Asset Solutions continues to support businesses and organisations throughout Tasmania and Australia. Through the use of modern inspection technologies and practical asset management solutions, the company helps clients protect their investments and maintain reliable operations for the future. For further information, visit: totalassetsolutions.com.au/ solutions. They also offer machinery alignment and balancing, optical motion amplification, thermography, bearing failure analysis, root cause analysis facilitation, FEAs, flow analysis, noise studies and much more.
They also practice what they teach. Wood Group offers vibration and lubrication analysis training per ISO 18436 Parts 1 to 4, with optional AINDT certification. Their public courses are delivered in Perth and Brisbane by active principal practitioners with decades of experience; alternatively, they can provide bespoke courses at your site or venue. Wood Group currently offers LCAT1, VCAT1 and VCAT2 training, and will be expanding their catalogue soon. The LCAT I and VCAT I courses each provide three days of training, plus a two-hour certification examination. The VCAT2 duration is four days of training, plus a three-hour certification examination. For further information, visit: woodgroup.com/ solutions/expertise/vibration-and-noise-training
51
Be Ready for What’s Next
The New OmniScan™ X4 Flaw Detector Engineered for Speed & Simplicity Advanced imaging technology and an easy-to-use interface allow users of all skill levels to perform fast, accurate inspections—boosting performance and streamlining workflows. Proven to Perform, Trusted to Deliver An all-in-one imaging platform, coupled with unmatched portability and versatility, delivers exceptional results in even the most challenging inspection environments. Designed to Evolve with Your Needs With free quarterly software updates, the OmniScan X4 empowers you to continuously adapt to future inspection needs—ensuring that you’re always ready for what’s next. Scan to learn more
ims.evidentscientific.com