THE OFFICIAL JOURNAL OF THE AUSTRALIAN INSTITUTE FOR NON-DESTRUCTIVE TESTING
RADIOGRAPHY ULTRASONICS EDDY CURRENT PENETRANT MAGNETIC PARTICLE VIBRATION ANALYSIS LUBRICATION ANALYSIS THERMOGRAPHY ACOUSTIC EMISSION






THE OFFICIAL JOURNAL OF THE AUSTRALIAN INSTITUTE FOR NON-DESTRUCTIVE TESTING
RADIOGRAPHY ULTRASONICS EDDY CURRENT PENETRANT MAGNETIC PARTICLE VIBRATION ANALYSIS LUBRICATION ANALYSIS THERMOGRAPHY ACOUSTIC EMISSION
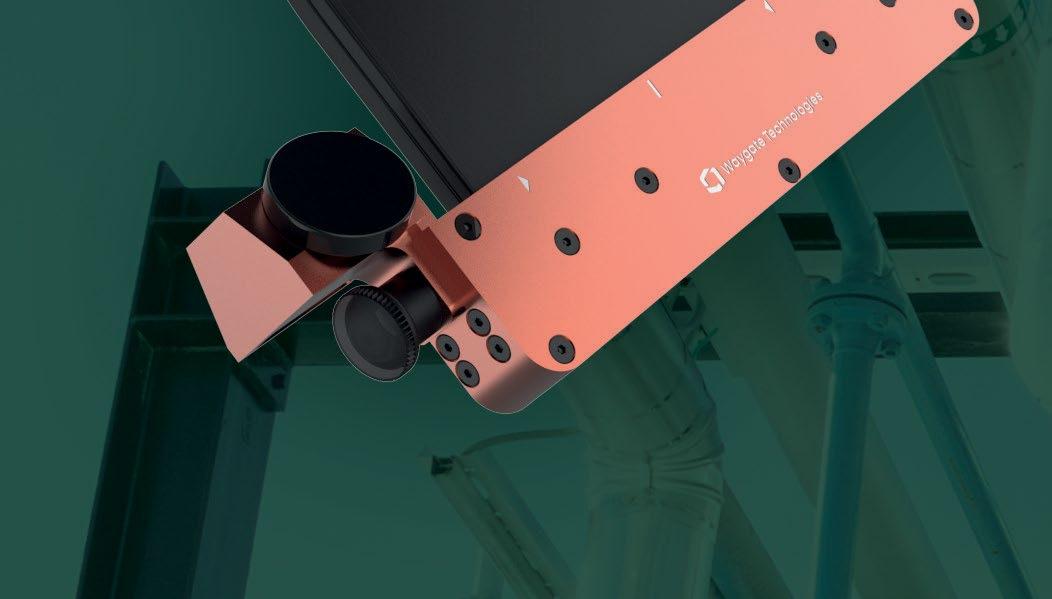
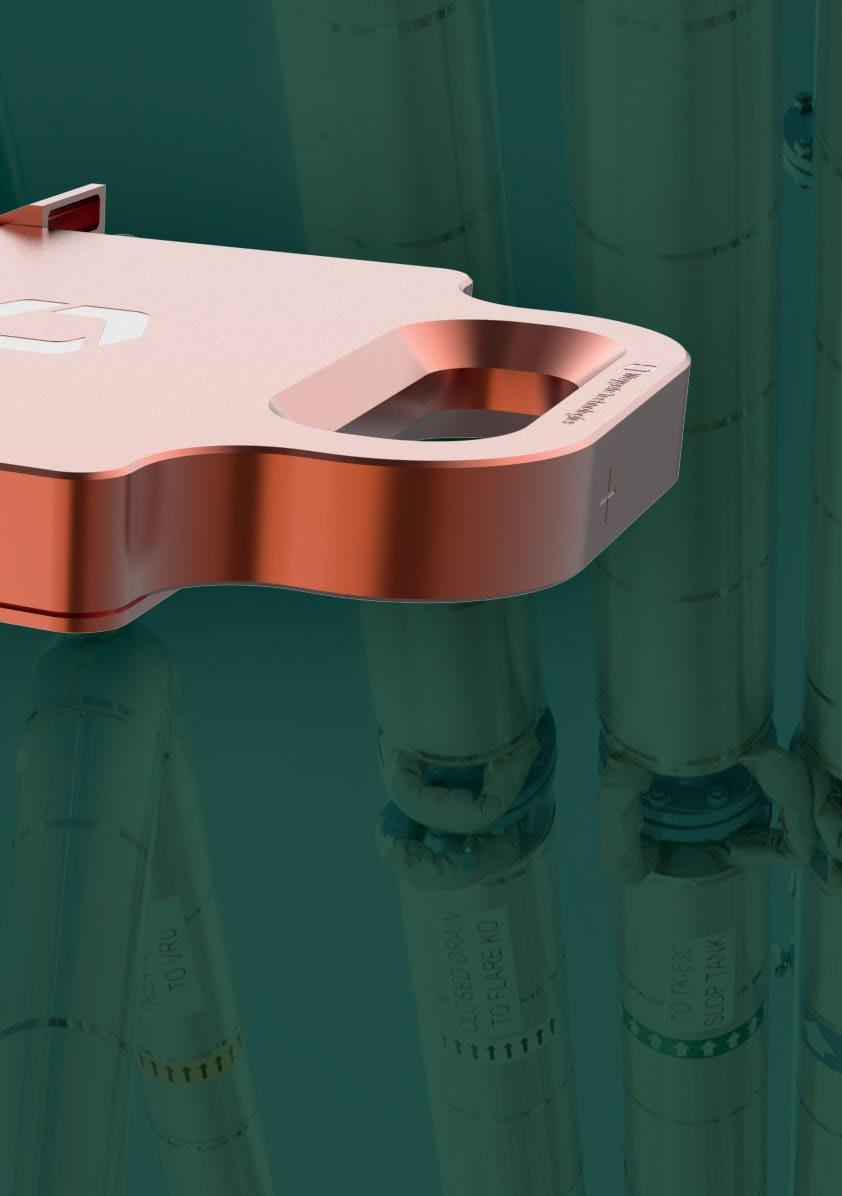
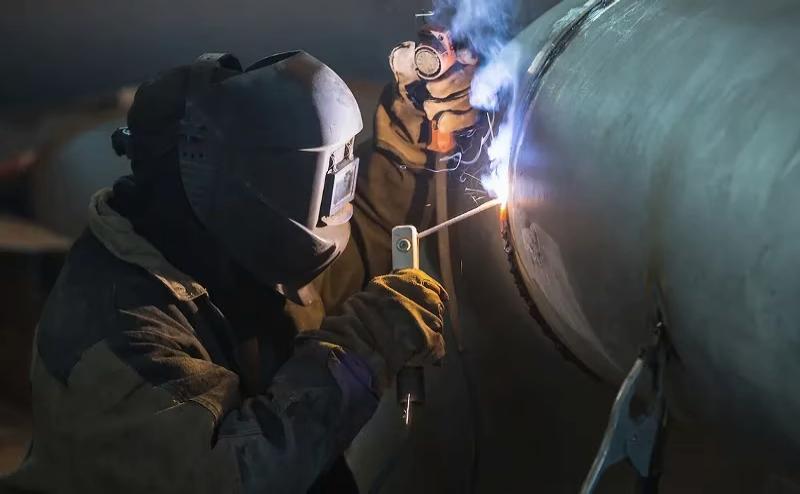
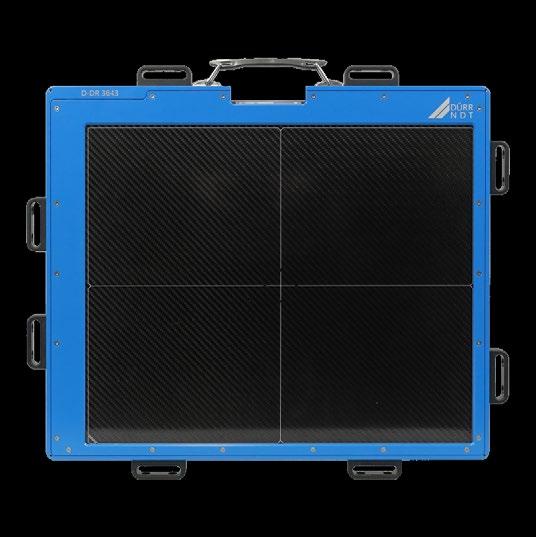
Dedicated to industrial use, this customer driven design of the next generation of DXR detectors combines image quality with rugged reliability, perfectly matching the criteria for the inspection of a wide range of weldments.
The new DXR Flex is a perfect fit for a wide range of weld related applications:
• pipeline weld inspection
• fabrication shop inspections (pipe spool, vessels, tanks, etc.)
• weld inspection (piping)
• crack detection

to know more? Scan this code or go to waygate-tech.com
As we move deeper into 2026, the internal heavy lifting is beginning to pay dividends.

The transition to the new ISO 9712 standards, which frankly tested the patience of many, is stabilising. The data now confirms that processing times are improving, and the workflow has normalised.
While we continue to fine tune the bottlenecks, we have moved past the crisis point. Australian technicians now hold a globally recognised passport for their skills, and the system is working.
Similarly, our Constitution Refresh is progressing from a concept to a draft framework. This work is vital to ensure our governance structure is agile enough to represent a diverse membership, from the tier one asset owner to the independent contractor.
But fixing the house is not enough. We must invite people in, which brings me to the most critical event on our calendar. The AINDT Summit in Newcastle this April.
We chose Newcastle deliberately. It is a historic industrial heartland currently standing at the jagged edge of the energy transition. It is the perfect backdrop to discuss the industry's challenges…..How do we maintain the integrity of aging heavy assets while simultaneously building the new infrastructure of the future?
The Summit is not just a strategy session for managers. It is a look at the future of our trade.
We will be tackling the convergence of traditional NDT methods with the new digital reality of asset management. For the technician, this is about understanding what skills, tickets, and technology you will need to stay relevant and employed in 2030.
We are moving the Institute from a reactive stance (fixing standards) to a proactive one (shaping the market). We have the standards, we are building the governance, and in April, we will have the conversation.
I look forward to seeing you in Newcastle.
Sam Hallifax President, AINDT Global SME & Business Improvement Manager, EnerMech
President:
Secretariat
CEO:
President
Vice
Production Sally Wood
Design Alarna O’Connell
AINDT
PO Box 52, Parkville Vic 3052
P: (03) 9486 9267
www.aindt.com.au
E: federaloffice@aindt.com.au
ADVERTISING
AINDT Federal Office
P: (03) 9486 9267
E: sally@wordly.com.au
Manuscripts should be submitted in electronic form:
1. in word
2. typed with single spacing
3. with figures as tif or jpeg files at better than 300dpi
Manuscripts should include:
1. symbols and abbreviations conforming to recognised standards; metric units (SI)
2. references listed, after the text, in the order in which they occur in the paper
3. references indicated in the text by arabic numerals in square brackets
4. tables and figures numbered separately but consecutively with Arabic numerals and brief, descriptive titles
5. a reference in the text to all tables and figures
6. graphs and diagrams made with lines of sufficient thickness to reproduce well
7. titles and address of authors
Procedure for submission of manuscripts:
1. articles should be sent to: journal@aindt.com.au
2. manuscripts will be submitted to referees who will remain anonymous
3. reprints of each paper will be supplied free to the author
Published by:
The Australian Institute for Non-Destructive Testing, PO Box 52, Parkville, Vic 3052 Australia
ISSN: 2203-2940
Welcoming Shane Walton to the AINDT

I am pleased to share that AINDT has secured Shane Walton as keynote speaker and technical workshop presenter for the AINDT Summit 2026. This is a strong outcome for the Summit and reflects our focus on practical, credible and internationally informed content that strengthens capability across Australian industry.
Shane brings a rare mix of hands-on field experience, Level III technical leadership, and proven training capability. As General Manager and Instructor at the University of Ultrasonics in Houston, he is widely recognised for an application-driven approach to ultrasonic testing education.
Shane’s work spans conventional UT, Phased Array, TOFD, and Full Matrix Capture and Total Focusing Method (FMC/TFM) techniques, with a clear emphasis on realworld inspection outcomes rather than theory alone. His professional pathway—from heavy-industry and refinery inspection work through to Level III responsibilities and specialist instruction—will resonate strongly with many Australian practitioners.
For the Summit keynote address, Shane will speak on the importance of mentoring in our industry. With sustained skills shortages, increasing technical complexity, and an ageing workforce, the challenge of transferring tacit knowledge from experienced practitioners to the next generation has never been more acute.
Mentoring is not simply a workforce development initiative; it is fundamental to maintaining technical integrity, inspection quality, and professional standards across all NDT methods. It also plays a critical role in shaping professional culture, confidence, judgement, and the next generation of technical leaders.
In addition to the keynote, Shane will deliver a dedicated technical workshop titled Comparing Phased Array to FMC/TFM (and related techniques) for common code applications. This workshop will provide delegates with a clear, experience-based comparison of where Phased Array remains the most appropriate and efficient solution, where FMC/TFM offers genuine technical advantage, and how both approaches can be applied responsibly within existing codes, standards, and client expectations.
The emphasis will be on informed technical judgement rather than technology for technology’s sake, aligning strongly with AINDT’s focus on competency, certification integrity, and fit-for-purpose inspection outcomes.
Securing Shane Walton underscores the intent of the AINDT Summit 2026: to bring internationally respected practitioners to Australia, elevate technical discussion, and support both the current and future NDT workforce through leadership, mentoring, and high-quality professional education.
The AINDT Summit 2026 Gala Dinner will be a highlight of the program, bringing delegates together for an evening that recognises achievement, contribution, and the individuals who continue to shape our profession. The Gala Dinner provides an opportunity to reflect on the standards, values, and leadership that underpin non-destructive testing in Australia.
Central to the evening will be the presentation of AINDT’s highest honours. The J H Cole Award recognises outstanding technical contribution and leadership within the profession, acknowledging work that has delivered sustained impact through innovation, professionalism, and technical excellence. Life Memberships will also be conferred on individuals whose long-standing service and commitment to AINDT and the broader NDT community have left a lasting legacy.
The Gala Dinner will also feature the presentation of the Tony Sonneveld Meritorious Service Award, recognising exceptional service to AINDT through governance, volunteering, advocacy, and leadership. This award acknowledges the often unseen work that strengthens the Institute and supports members.
Together, these presentations reinforce the importance of service, mentoring, and professional contribution, and reflect AINDT’s commitment to recognising those who have helped protect the integrity of the NDT profession.
Full Matrix Capture Training
Full Matrix Capture (FMC), together with Total Focusing Method (TFM), continues to gain momentum across industrial applications. When applied appropriately, these techniques can deliver enhanced imaging, improved flaw characterisation, and greater insight in complex inspection scenarios. As with any advanced technique, however, the value of FMC and TFM lies not only in the technology itself, but in the competence of the personnel applying it and the rigour of the training that underpins its use.
In recognition of this, the AINDT Certification Board has formally approved ATTAR and Kuzer to deliver FMC training within the AINDT certification framework. This reflects a structured approach to the introduction of advanced ultrasonic techniques, ensuring training delivery supports the integrity of existing certification schemes.
The approval of these providers gives industry confidence that FMC training is being delivered by organisations with appropriate technical capability, instructional expertise,
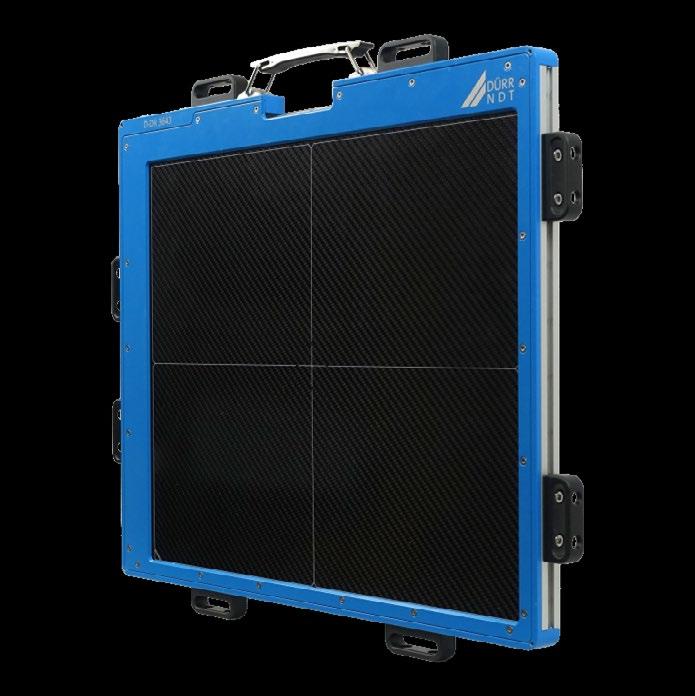

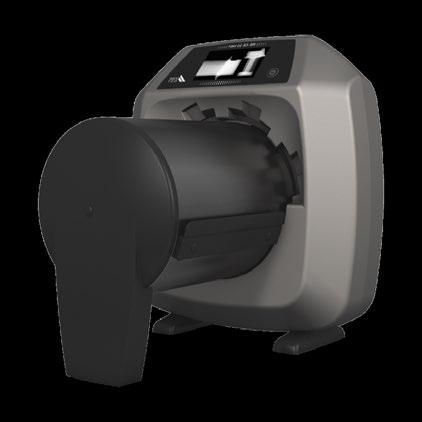
DIGITAL & COMPUTED RADIOGRAPHY MADE FAST. MADE SIMPLE.
Why Choose DÜRR NDT?
•Rapid image acquisition
•Streamlined Inspection workflow
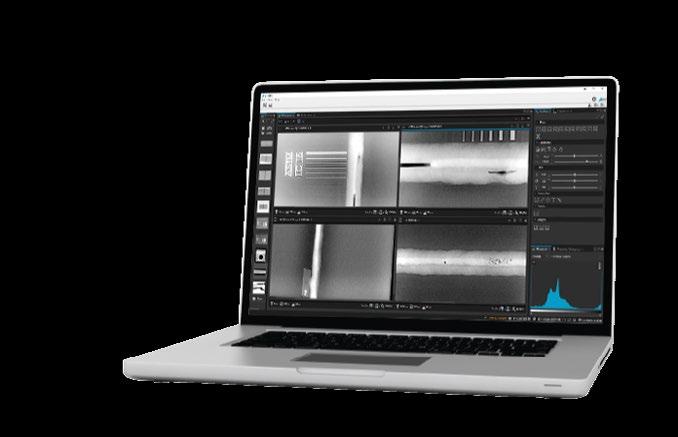
•Powerful reporting with intuitive software
•Built for industrial environments

and a clear understanding of certification requirements. It reinforces that FMC is not a replacement for established ultrasonic methods, but a complementary technique that must be applied with a clear understanding of limitations, code compliance considerations, and suitability for the inspection objective.
From an AINDT perspective, this development supports a balanced progression toward advanced inspection technologies while remaining consistent with ISO 9712 principles and the broader competency-based certification model.
As FMC and related techniques continue to evolve, AINDT will continue to support innovation through structured training pathways, clear certification governance, and engagement with industry. This approach ensures technical advancement is matched by competence, confidence, professional judgement, and sustained trust across the Australian NDT sector.
Stuart Norman Chief Executive Officer, AINDT







If you’ve been waiting for the right time to commit, this is it. The 2026 Summit is shaping up to be our biggest yet, with game-changing speakers, future-focused discussions, and the kind of networking that fuels real opportunity.
Preparations are well underway for the AINDT Summit 2026, to be held in Newcastle, New South Wales, from 20–22 April 2026. With the majority of exhibition booths already sold and a strong lineup of sponsors confirmed, momentum is building for what promises to be a standout event for the non-destructive testing (NDT) and condition monitoring (CM) community.
The Summit is designed to bring together key decisionmakers, senior professionals, and technicians from across the NDT and CM fields. Whether you’re a seasoned practitioner or looking to expand your technical knowledge, the program will deliver diverse opportunities for learning, collaboration, and professional growth.
While the educational component is central to the Summit, there will also be plenty of time to network and reconnect with peers. Between sessions, delegates can mingle at Newcastle Town Hall, explore the bustling exhibition space, or join one of several social events planned throughout the three days.
The event will officially commence with a Welcome Reception in the exhibition hall on the Sunday night.
On Tuesday night, the Gala Dinner will celebrate excellence in our profession. For those eager to keep the celebrations going, a Gala Dinner After Party will follow at a nearby venue. Expect plenty of networking, music, and sponsor giveaways to carry the camaraderie well into the evening.
Importantly, attendance supports your professional development and certification pathway. Delegates will receive a Certificate of Attendance confirming professional development hours, which can assist with certification renewals and recertification requirements, including earning points through the Structured Credit System.
This year’s theme, The Power of Inspection, explores the concept of power both as a generative force—driving progress, energy and innovation—and as the detailed insight that inspection provides into the integrity and performance of critical assets.

Gala Dinner Host: Dave
O’Neill
AINDT is pleased to announce that the host for the AINDT Summit 2026 Gala Dinner is Dave’ O’Neill.
Dave O’Neil has been in comedy for over 30 years and is one of Australia’s most recognisable stand-up comics, having performed at over 20 Melbourne International Comedy Festivals.
Dave has appeared on numerous Australian television shows including Have You Been Paying Attention?, The Project, Utopia, Talkin’ ‘Bout Your Generation, Spicks & Specks. Dave also stars in Kitty Flanagan’s ABC sitcom Fisk playing Bob Stanley, the inept lawyer. As well as his stand up and television career, Dave is a skilled radio broadcaster.
In 2017 Dave launched his podcast The Debrief with Dave O’Neil – each episode, Dave drives a comedian home from a gig and discusses comedy and their career. Dave is also the co-host of podcasts Somehow Related with Glenn Robbins, and The Junkees with Kitty Flanagan.
As part of the program, AINDT invites researchers, practitioners, and innovators to submit original papers showcasing new developments, technologies, or case studies that advance our industry’s understanding.
Delegates will receive a certificate of attendance reflecting professional development hours, which can assist with certification renewals or recertification requirements.
The AINDT Summit will once again bring together some of the most respected specialists in the field. This year’s expert presenters represent a diverse cross-section of industry, research and technology, offering valuable insights into the latest advancements shaping the future of NDT.
Just some of our speakers include: Salah Attia (MCS), Nick Elefethroiu (Evident Australia), Frank Galea, Jake Graham (Iris NDT), Paul Grosser (Level 3 NDT), Chris Howson (QINDT), Brett Hyland (NATA), Simon Krismer (WQMS), Jim Molinaro (FujiFilm), Fahad Mudayeq (SABIC), Nestor Sequera (SN Integrity), Khalid Sheltami (SABIC), Pranay Wadyalkar (OMS Software) and Simon Welding (Red Earth NDT).

Internationally recognised ultrasonics
expert Shane Walton will headline the 2026 Summit with a keynote on the global NDT industry, sharing bold insights into what will make the profession stronger, smarter and more future-ready. He’ll also be delivering a workshop on ‘Total Focusing Method – Phased Array’.
Based in Texas, Shane is General Manager at the University of Ultrasonics, where he trains inspectors and engineers in cutting-edge techniques including Phased Array and Total Focusing Method, and consults across oil and gas, aerospace and power generation, making him the perfect speaker for anyone wanting to stay ahead of what’s next in NDT.
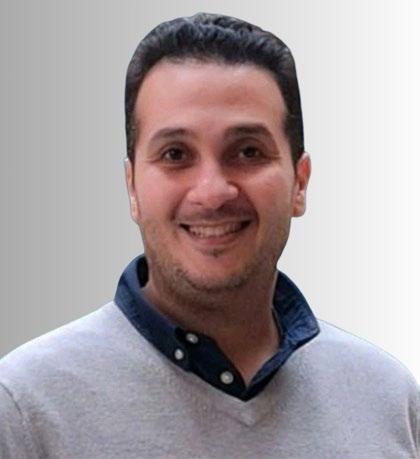
Salah Attia Technical Director, Machinery Consultation and Services (MCS)
Remote condition monitoring and diagnostics are no longer theoretical. They’re happening now, at scale. At the Summit, Salah Attia will present:
‘Remote Balancing of a 155MW Steam Turbine in Turkey from Australia – Challenges, Diagnostics, and Lessons Learned’.
In this session, Salah will share a real-world case study of remotely balancing a large 155MW steam turbine located in Turkey while working from Australia. The presentation walks through the technical, diagnostic and logistical challenges involved, and how they were successfully overcome.
This presentation will be particularly valuable for vibration analysts, rotating equipment specialists, and those looking to deepen their understanding of real-world balancing applications.
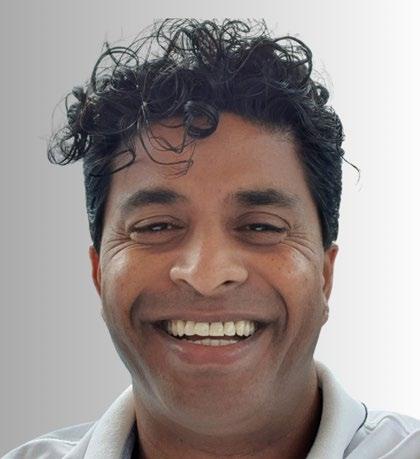
Pranay Wadyalkar Managing Director, OMS Software
Pressure equipment inspection has been part of industry practice for decades, but the way inspection data is captured, transferred and reused often falls short.
At the Summit, Pranay Wadyalkar will present: ‘Power of Pressure Equipment Details for Integrity Monitoring’.
This session examines a common industry challenge: pressure equipment inspections conducted by different inspectors, at different times, often relying on limited historical information.
Pranay will explore how the lack of detailed, structured inspection data impacts long-term integrity monitoring, risk assessment and decision-making. The presentation will highlight why capturing meaningful integrity parameters (not just producing a generic report) is critical to effective pressure equipment management over its lifecycle.
This session will be particularly relevant for inspectors, engineers, asset owners and anyone involved in pressure equipment governance who wants to improve continuity, traceability and inspection outcomes.
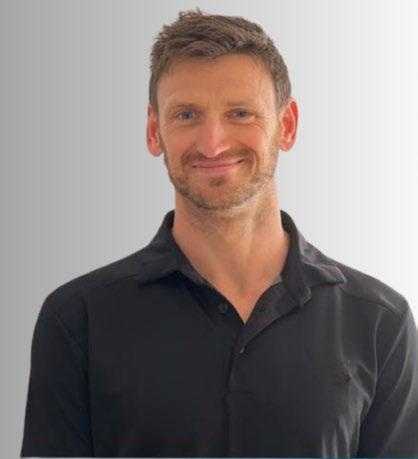
Chris Howson Director, Quantum Integrity Non-Destructive Testing (QINDT)
Chris Howson will present ‘What Lies Beneath?’
In high temperature and high-pressure steam raising equipment such as power station boilers, oxide scale formation on the internal surfaces of tubing is an unavoidable byproduct of continuous operation, particularly in elevated temperature zones.
Chris will cover how, while this internal oxidation can sometimes offer protective benefits, over time it contributes to thermal resistance and increasing inefficiencies. As oxide thickness builds, it can obscure the true rate of wall loss, posing significant challenges for accurate ultrasonic thickness measurement.

Brett Hyland Stakeholder Engagement Manager, NATA
Personnel certification has fundamentally reshaped how NDT is practiced, governed and assured in Australia, but that didn’t happen overnight.
Brett Hyland will present: ‘Reflections on Personnel
Certification in Australian NDT Facilities’.
Drawing on first-hand experience as NATA’s NDT Field Manager (2000–2011) and a long-serving member of AINDT’s NDT Certification Board, Brett will reflect on the evolution of personnel certification in Australian laboratories from the early 2000s onward.
This presentation offers valuable historical context and practical insight for laboratory managers, quality professionals, technical authorities and anyone involved in certification, accreditation or compliance.

Nick Eleftheriou Product Manager and Applications Specialist NDT, Evident Industrial
Advanced ultrasonic imaging techniques continue to push the limits of defect detection in challenging materials.
At the AINDT Summit 2026, Nick Eleftheriou will present: ‘Evaluations of Phase Coherence Imaging (PCI) Techniques for CRA’.
This presentation examines how Phase Coherence Imaging (PCI) is extending the capabilities of Full Matrix Capture (FMC) and Total Focusing Method (TFM), particularly in difficult inspection scenarios.The session will also explain how statistically defined noise
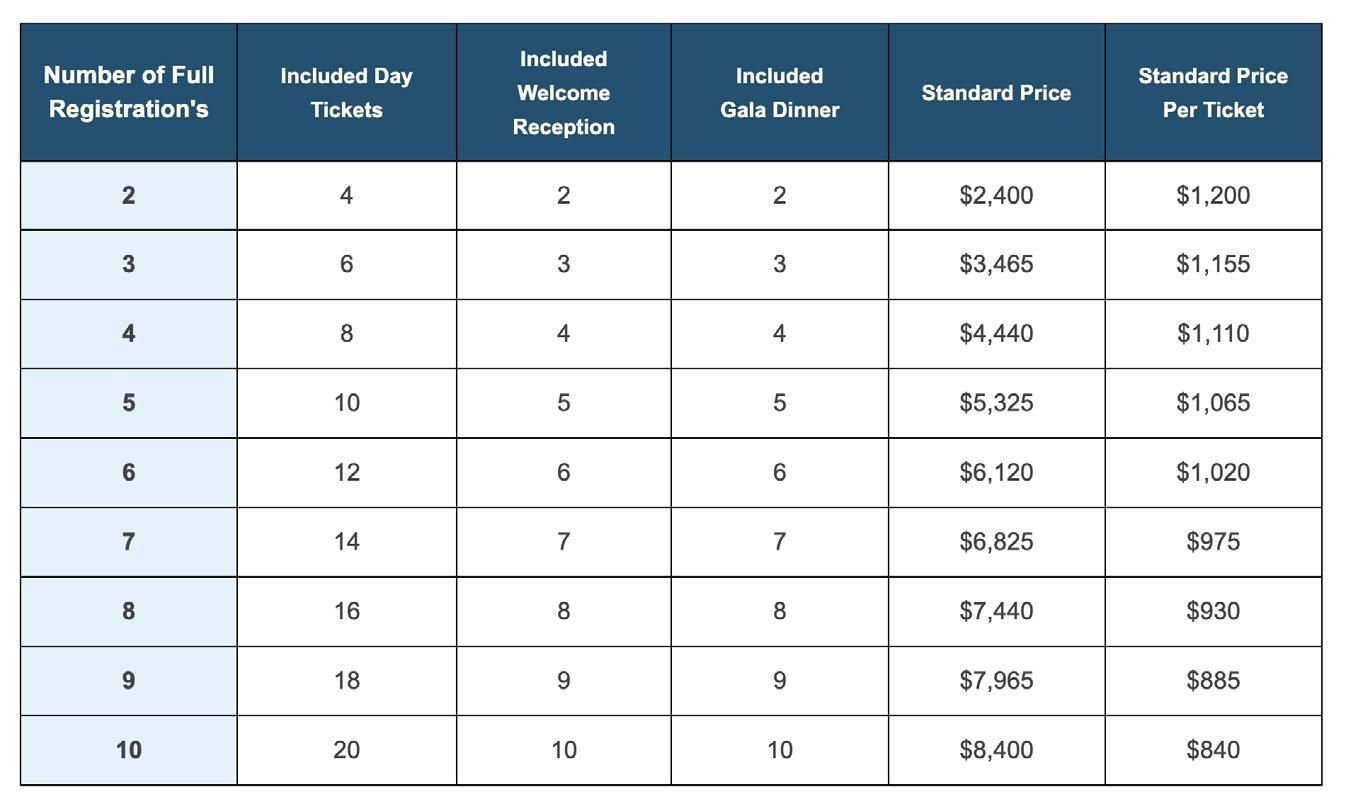
Planning to bring your team? Our Corporate Registration packages offer exceptional value, with significant savings increasing as your group size grows. Each package includes full Summit access, Day Tickets, Welcome Reception passes and Gala Dinner tickets. Unlock big value for your organisation. Pay $7,400 now for 10 people compared to $12,000 for 10 individual early bird registrations. To book corporate registrations, please email federaloffice@aindt.com.au
Join us in Newcastle this April to celebrate The Power of Inspection — three days of innovation, insight, and industry connection that you won’t want to miss To secure your place, visit the Summit website: aindtevents.eventsair.com/ aindt-summit-2025/register
coherence thresholds can help separate meaningful indications from background noise, improving confidence in interpretation.
This presentation will be particularly valuable for practitioners working with difficult materials where conventional techniques reach their limits.

Jake Graham Advanced NDT Technician, Iris NDT
Jake will speak on the topic: ‘Rope Access PAUT of Wind Turbine Blades for the inspection of discontinuities.’
The structural integrity of wind turbine blades is critical to the performance and safety of wind energy systems. The application of Phased Array Ultrasonic Testing (PAUT) using Rope access techniques as a high-resolution, adaptable technique for the inspection of discontinuities such as delamination's, Inclusions, wrinkles and adhesive issues within wind turbine blades.
PAUT enables dynamic beam steering and focusing, allowing for comprehensive coverage of curved and layered composite surfaces. The results highlight PAUT’s advantages in terms of sensitivity, imaging clarity, and inspection speed compared to conventional ultrasonic methods.


As the Australian Institute for Non-Destructive Testing continues to grow and evolve, I’d like to take this opportunity to remind members of the many ways you can maximise the value of your AINDT membership — not only for your professional development, but also for your long-term career security in a fast-changing industrial landscape.
Non-destructive testing plays a critical role across Australia’s key industries, from oil and gas, construction and defence, through to energy, manufacturing and infrastructure.
With increasing regulatory expectations, higher standards for asset integrity and growing demand for skilled technicians and engineers, your professional standing matters more than ever. AINDT membership is one of the most practical ways to strengthen that standing.
First and foremost, membership supports your credibility. Being part of Australia’s recognised professional body for NDT and condition monitoring demonstrates commitment to industry standards, best practice and continuing professional development. Whether you’re working on major shutdowns, pipeline integrity programs, fabrication inspections or critical infrastructure projects, that credibility can set you apart.
Secondly, membership gives you access to knowledge and community. The AINDT network includes experienced practitioners, trainers, technical experts and industry leaders. Make the most of this by attending events, webinars and technical presentations, engaging
with your local branch and contributing to discussions. The relationships built through AINDT can lead to career opportunities, mentoring connections, and valuable technical insight, particularly in niche or emerging areas of inspection technology.
Thirdly, use your membership to stay informed. Industry methods, equipment and standards continue to shift from advanced ultrasonic techniques and digital radiography to remote inspection, automation and datadriven asset management. Your AINDT communications, publications and member updates are designed to keep you current and connected to what’s happening nationally and internationally.
A key part of maximising value is also ensuring your membership details remain up to date. Accurate contact information helps ensure you receive important notices, renewal reminders and access to member resources. If your employment, email address, or postal address has changed recently, please take a moment to update your details via our portal: https://portal.cbdb.aindt.org/ login.php
Finally, I encourage every member to think of AINDT not simply as an annual fee, but as an investment in your professional identity. When you actively engage — attend, connect, contribute and stay current — the return is significant.
Thank you for your continued support of AINDT. We’re proud to represent and strengthen the NDT profession in Australia, and we look forward to supporting you in getting the most from your membership.
Craig Taylor Membership Registrar, AINDT
February 2026
The AINDT is a national peak body that promotes the professional practices of non-destructive testing and condition monitoring personnel. Our mission is to provide members, industry and the community with independent and professional service in relation to the science and practice of non-destructive testing.
Through the work of our state branches and federal office, AINDT is committed to fostering a community of professionals and organisations dedicated to the fields of non-destructive testing, engineering, and materials and quality testing.
We offer a tiered membership structure, inviting businesses to enhance their professional standing and industry influence by becoming a Company, Corporate, or Sustaining member. Our memberships unlock a suite of benefits, including marketing opportunities, heightened support, streamlined staff certification management, and much more.
AINDT would like to thank the companies below for their valued support.
ATTAR
D R May Inspections
EnerMech
SRG Industrial Pty Ltd
Intertek
SUPPORTING MEMBERS
Chevron
COMPANY MEMBERS
NSW
AXT Pty Ltd
Barry Evans Lifting World
Bluescope Steel (Port Kembla)
ENDETEK
HVT Inspection Services
Monnoo Engineering Services Pty
Ltd
NBQC and Inspection Services
NDT Equipment Sales Pty Ltd
Noble Engineering Services
Reliance Hexham
Russell Fraser Sales
Simplifi Nii P/L
SmartChem Industries Pty Ltd
Sonix NDT Pty Ltd
Thermal Imaging Services (AUS)
QLD
Australian Biosecurity Services Pty Ltd
AXS Pty Ltd (Mackay)
Azure NDT Quality Services Pty Ltd
Bureau Veritas Australia
Chemetall (Australasia) Pty Ltd
Evident Australia Pty Ltd
GFS NDT
Hofco Oilfield Services
IRISNDT
OMS Engineering Pty Ltd
SafeRad SE Asia Pty Ltd
School of Engineering
TR Pty Ltd
Industrial Mining Inpsection Solutions
International Tube Testing Pty Ltd
M-Test Mackay Pty Ltd
Queensland Alumina Limited
Testing Inspection and Calibration Services
VIC / TAS
ATCL
Defence Science and Techology
Organisation (DSTO – Fishermans Bend)
Gippsland NDT Services Pty Ltd
Global Inspections & Engineering Services Pty Ltd
Iron Training and Consulting
iTest NDT
LMATS Pty Ltd (Williamstown)
NATA
OMS Software Pty Ltd
SA / NT
ASC Pty Ltd
Kuzer Technical
WA
Alliance Solutions Group
Applecross Electrical and Testing Services
Asset Reliability Inspections Pty Ltd
Assurity NDT & Consulting
GoldFields NDT
ICM Training Solutions
MJ Engineering Inspection Services (Welshpool)
J & S Castlehow Electricial Services
Vertech
Weld Integrity
Wood – Asset Performance
Optimisation
Welcome back everybody! I hope everyone has had a refreshing and safe break and are now back in full swing.
I would like to remind people about the importance of keeping records around your NDT certifications, whether it be for initial certification, renewal or recertification. The scramble in the final few days before application or expiry is not the time to be hunting for records. Logbooks remain the best way to capture hours.
In addition, under the new renewal process, certificate holders can choose to either successfully complete a practical examination in the relevant method, or renew via the Structured Credit System.
There have also been changes to the prerequisite training for RT Level 2 certification. While the EA612 course remains a valuable pathway for obtaining the required radiation safety licence, the required radiographic training for certification purposes is now ISO 9712 RT Level 1.
To assist in the transition the following will be in force:
• Candidates who have completed EA612 aligned training (40 hours) before 1 March 2026 will be able to continue to use this as the prerequisite for AINDT RT2 training until 1 January 2027.
• From 1 March 2026, new candidates must complete RT1 training with an approved training organisation to meet the pre-requisite requirements for AINDT RT2 Certification.
Several Authorised Qualifying Bodies (AQB) are now approved to run this training. Candidates should seek them out if the training is required. For further details, see page 17 of this journal.
The AINDT has not, and does not, have certification for RT Level 1. Since the ISO 9712 RT 1 training hours are now being carried out, we have received some questions around why there is not a RT level 1 certification?.
To this end, I would like to extend an invitation to all stakeholders to put their position forward on the matter. A courteous and professional email addressed to the Honorary Secretary of the AINDT NDT CB entitled, ‘ISO 9712 RT Level 1 Certification’ can be send to federaloffice@aindt.com.au.
Please outline whether you are in favour of, or opposed to, RT Level 1 certification and provide the reasons supporting your position. All correspondence will be reviewed and considered by the AINDT NDT Certification Board. While some feedback has already been received, we wish to provide all stakeholders with the opportunity to submit their comments.
Mark Welland
Chair,
AINDT NDT Certification Board
BY ERIK THORUP, DIRECTOR IR TECHNOLOGY AUSTRALIA PTY LTD CATEGORY 3 THERMOGRAPHER, ELECTRICAL/MECHANICAL (AINDT/BINDT)
“Analysis and investigation on thermal anomalies found on 2 Ampact connectors in 22KV HV supply"
In a thermographic survey of a client's 22KV HV supply line in a Construction Products facility (crushers and conveyors), 2 AMPACT Wedge Pressure Tap Connectors on the Red phase were found to run at elevated temperatures compared to other similar connectors on the other 2 phases.
Each connector was feeding separate substations (22KV/433V Transformers) via the 2 cable heads. One straight down and the other over the top of the cross arm.
Zoomed in image of the 2 Red phase Ampact connectors showing warmest in the middle of the top connector and warmer towards the cable head side on the lower connector. (Image edited. Logo removed))
Above are the 2 images shown in Temperature Linear mode, taken on site on the 18th December 2025, using
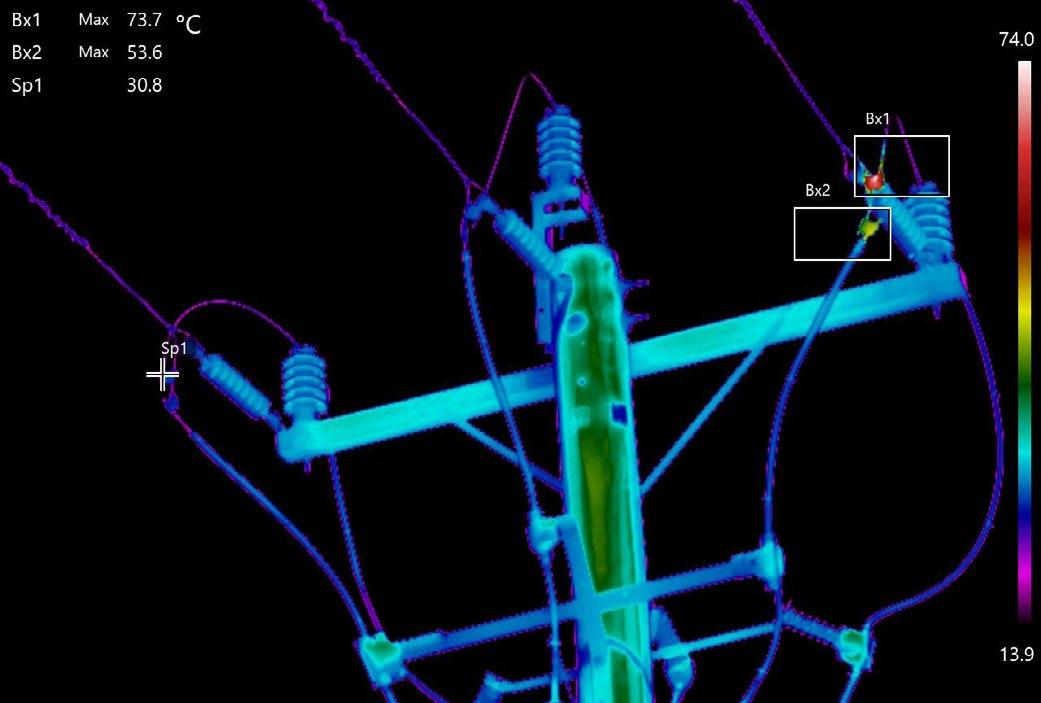
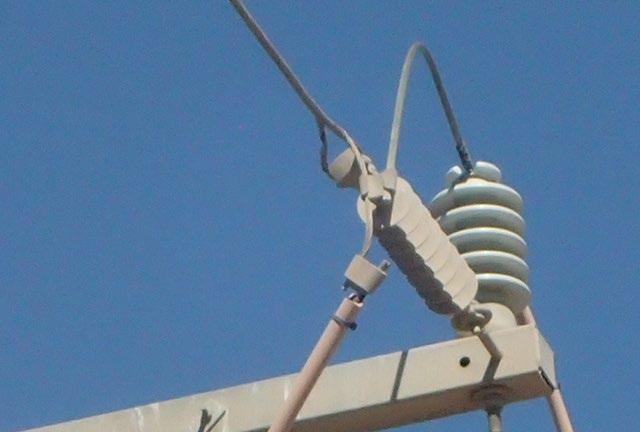
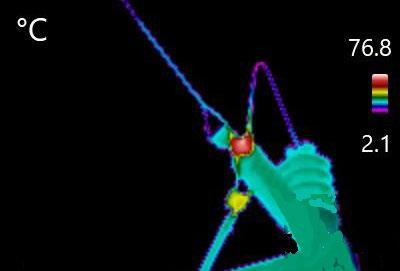
the same FLIR T660 camera with NFOV 12° lens and 640x480 resolution. The Emissivity was set at 1.00 and it was attempted to focus the images as well as possible. Load on the main supply was 50A at the time. No information was available for what the maximum load might be.
The load on the LV side of the transformers was read at the Air Circuit Breakers at the LV side of the Transformer Sub Stations. The LV load on the Transformer fed by the top (warmer) Ampact was found to be 1500A, while the LV load on the lower Ampact transformer was found to be 750A, which means a ratio 2 to 1 load. It is therefore assumed that also the HV load in this case will be split in the same ration 2 to 1 through the Ampact connectors.
Analysis
Visually it can be seen in the Zoomed in image that the lower Ampact is warmer at the Cablehead side, so the heating of that connector is not mainly due to thermal conduction through the wire from the hotter top Ampact connector. It is assumed that the temperature of the lower Ampact is due to a high resistance connection at
the lower Ampact (only). Likewise it is assumed that the high temperature of the top Ampact is due to a high resistance at the top Ampact connector only.
Assuming the measurements in the images are fairly correct, we will see if the temperature equation for a given load would be able to give us additional information.
We know Ohms law: V = I * R and we know Watts law: P = V * I which results in P = I2 * R
Assuming that the reason we have the deltaT in these electrical connections, is purely due to an electrical resistance, and that the resistance stays constant even at higher loads and temperatures, then this law gives us that the power lost in the resistive connection will all be turned into heat and therefore an increase in temperature. A load ratio of 1:2 will therefore give us a power increased not two fold but 22 = 4 times as high.
From the first overall image, we get that the deltaT is 74°C - 31°C = 43°C for the top Ampact and 54°C31°C = 23°C for the lower Ampact.
Under the assumption of the load ratio between the 2 connectors is 2:1, it would mean that the lower Ampact would possibly show a deltaT of 4 x 23°C = 92°C which is double the deltaT of the top Ampact - and in an ambient of 31°C possibly run at 123°C IF the load on the lower Ampact was increased to the same load as on the top Ampact connector.
The re-calculation of the expected temperature of the lower Ampact connector at the same load as the top Ampact connector, was to get an idea of which connector might be the "worst" connection of the 2. Just because one of 2 identical connectors is hotter than the other, does not mean the resistance in the hotter one is higher than the other. In this case the Ampact connector with the lower temperature seems to have a higher resistance than the hotter one. To prepare a recommendation for this "fault" condition, further information needs to be taken into account.
Unlock the future of your career with top-tier condition monitoring training from trusted providers.
These training centres have earned the endorsement of AINDT, aligning perfectly with the national syllabi approved by the AINDT Certification Board. This ensures that you receive the highest standard of education and training.
To maximise your learning experience, AINDT recommends obtaining a copy of the training module—either directly from the training provider or by downloading it from the AINDT website. This will ensure you are well-prepared for your course.
For those seeking certification, it's crucial to successfully complete the specified training program and required training hours outlined in ISO18436. This is essential for achieving certification in your desired conditioning monitoring method, category, and industry sector. All examinations are conducted by the AINDT. For exam dates and further details, please contact AINDT via: federaloffice@aindt.com.au.
Elevate your skills and advance your career with the industry's best training and certification programs.
Victoria
Industrial Precision Instruments
A: Unit 12, 634-644 Mitcham Road, Vermont 3133
T: 1300 781 701
E: training@ipi-inst.com.au
W: ipi-inst.com.au
IR Technology Australia
A: 39-45 James Street, Lara 3212
T: 0418 569 698
E: erik.t@bigpond.com
W: irta.com.au
University of Melbourne
A: Parkville 3010
T: 03 9810 3348
E: claudine.evans@unimelb.edu.au
W: unimelb.edu.au
Wood – Asset Performance Optimisation
A: Level 3, 171 Collins Street, Melbourne 3000
T: 08 6314 2000 or (08) 6314 2280
E: svt.bu.training@woodplc.com
W: woodplc.com
Western Australia
ICM Training Solutions
A: 45 Delawney Street, Balcatta 6021
T: 0419 993 233
E: rainingacademy@icmt.com.au
W: icmt.com.au
SRG Training Academy
A: 109 Bannister Road, Canning Vale 6155
T: 08 9232 0300
E: trainingacademy@srgglobal.com
W: srgglobal.com
Wood – Asset Performance Optimisation
A: Level 1, 240 St Georges Terrace, Perth 6000
T: (08) 6314 2000 or (08) 6314 2280
E: svt.bu.training@woodplc.com
W: woodplc.com
Queensland
Advanced Infrared Resources Australia AIRA
A: PO Box 372, Hervey Bay 4655
T: 0467 565 836
E: jeff@irtau.com.au
W: irtau.com.au
Machinery Diagnostics Institute
A: 16 Wheeler Avenue, Gracemere 4702
T: 0499881 294
E: training@mcsturbo.com
W: mdiaustralia.com
SRG Training Academy
A: 7 Brisbane Road, Riverview 4303
T: 07 3816 5500
E: training@mcsturbo.com
W: mcsturbo.com
Wood – Asset Performance Optimisation
A: Level 20, 127 Creek Street, Brisbane 4000
T: (08) 6314 2000 or (08) 6314 2280
E: svt.bu.training@woodplc.com
W: woodplc.com
AQBs are authorised to offer AINDT-approved training and initial and recertification examinations in any Australian state, at any time throughout the year.
The AINDT also conducts scheduled examination rounds twice yearly, with dates advertised in The Industrial Eye and the AINDT e-newsletter.
While the AINDT strives to notify certificate holders of impending certification expirations, it remains the responsibility of the certificate holder to initiate the renewal and recertification process before their certification expires. Please note that late fees apply to overdue certification applications.
South Australia
Kuzer Technical
T: 1300 199 086
E: info@kuzer.com
W: kuzer.com
NDT methods, levels, and industry sectors offered:
• Magnetic Particle Level 1, 2 and 3 Multisector (ISO 9712)
• Dye Penetrant Level 1, 2 and 3 Multisector (ISO 9712)
• Ultrasonics Level 1, General Engineering (ISO 9712)
• Ultrasonics 2 and 3 Welds (ISO 9712)
• Phased Array Level 2 and 3 Multisector (ISO 9712)
• Time Of Flight Diffraction Level 2 and 3 Multisector (ISO 9712)
• Radiographic Testing Level 1, Level 2 and 3 Welds (ISO 9712)
Full Matrix Capture Level 2 Welds (ISO 9712)
• Visual Testing Level 1 and 2 Multisector (ISO 9712)
• Eddy Current Level 1, 2 and 3 Multisector (ISO 9712)
• Level 3 Basic Exam Prep (ISO 9712)
• OCTG drill pipe inspection
• Material Science in NDT – Multisector
• NDT for Managers & Engineers
• Radiation Safety (exceeding the syllabus of national module EA612)
Victoria
ATTAR
T: 03 9574 6144
E: training@attar.com.au
W: attar.com.au
NDT methods, levels, and industry sectors offered:
• Computed and Digital Radiography 2, 3
• Ultrasonic Testing 1,2,3 Welds, Casting, Wrought,
• Aerospace, Thickness
• Radiographic Testing Level 1, Level 2 and 3 Welds (ISO 9712)
Full Matrix Capture Level 2 Welds (ISO 9712)
• Magnetic Particle Testing 1,2,3 Multisector, Aerospace
• Penetrant Testing 1,2,3 Multisector, Aerospace
• Eddy Current Testing 2,3 Multisector, Aerospace
• Magnetic Flux Leakage 2
• Tank Bottom Testing
• Phased Array levels 2 and 3 Ultrasonics 2 Multisector
• Visual/Optical Testing 2 Multisector
• Time of Flight Diffraction (TOFD) levels 2 and 3 Welds
• Heat Treatment
• ISO 9712 UT Level 2 Corrosion/Erosion Detection and Mapping (CDM)
Western Australia
ATTAR
T: 03 9574 6144
E: training@attar.com.au
W: attar.com.au
NDT methods, levels, and industry sectors offered:
• Computed and Digital Radiography 2, 3
• Ultrasonic Testing 1, 2,3 Welds, Casting, Wrought,
• Aerospace, Thickness
• Radiographic Testing Level 1, Level 2 and 3 Welds (ISO 9712) Full Matrix Capture Level 2 Welds (ISO 9712)
• Magnetic Particle Testing 1,2,3 Multisector, Aerospace
• Penetrant Testing 1,2,3 Multisector, Aerospace
• Eddy Current Testing 2,3 Multisector, Aerospace
• Magnetic Flux Leakage 2
• Tank Bottom Testing
• Phased Array 2, 3 Ultrasonics 2 Multisector
• Visual/Optical Testing 2 Multisector
• Time of Flight Diffraction (TOFD) 2, 3 Welds
• Heat Treatment
• ISO 9712 UT Level 2 Corrosion/Erosion Detection and Mapping (CDM)
SRG Training Academy T: 08 9232 0300
E: trainingacademy@srgglobal.com
W: srgglobal.com
NDT methods, levels, and industry sectors offered:
• Ultrasonic Testing 1,2 Welds
• Magnetic Particle Testing 1,2 Multisector
• Penetrant Testing 1,2 Multisector
• Phased Array Ultrasonic Testing 2 Multisector
Queensland
Protecs Global
T: 07 3492 9213
E: hamed.madani@protecsglobal.com.au
W: protecsglobal.com.au
NDT methods, levels, and industry sectors offered:
• Ultrasonic Testing 1 ( General Engineering) 2 Welds
• Magnetic Particle Testing, 2 Multisector
• Penetrant Testing, 2 Multisector
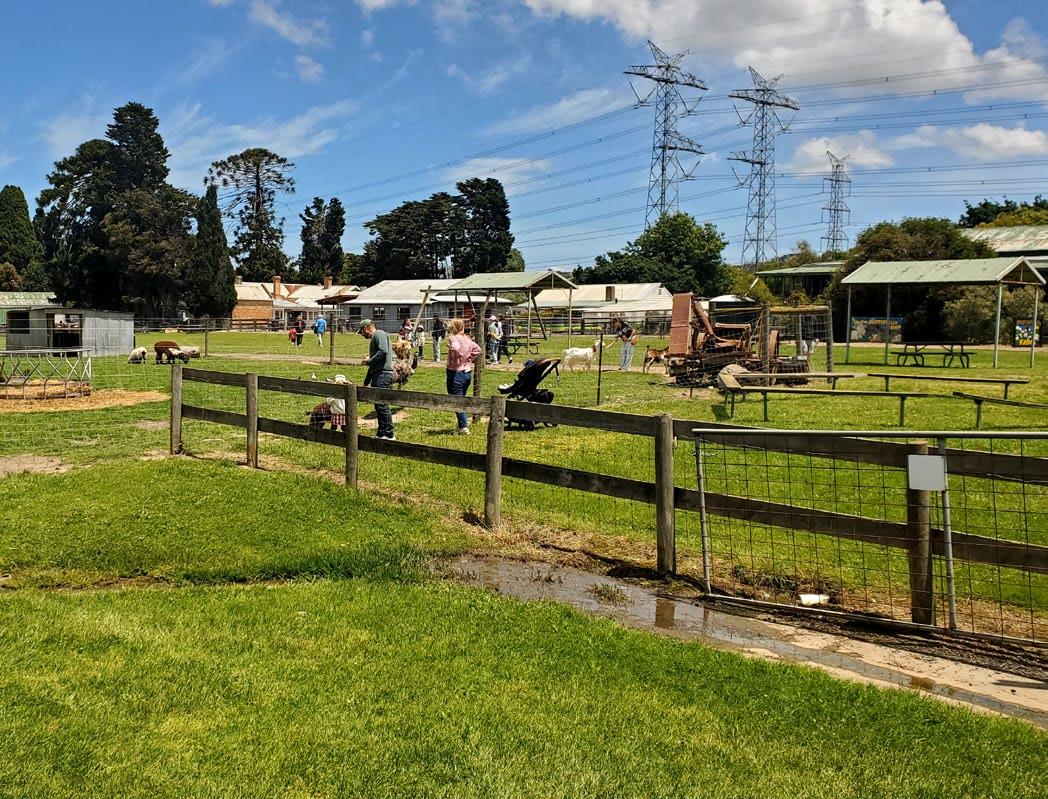
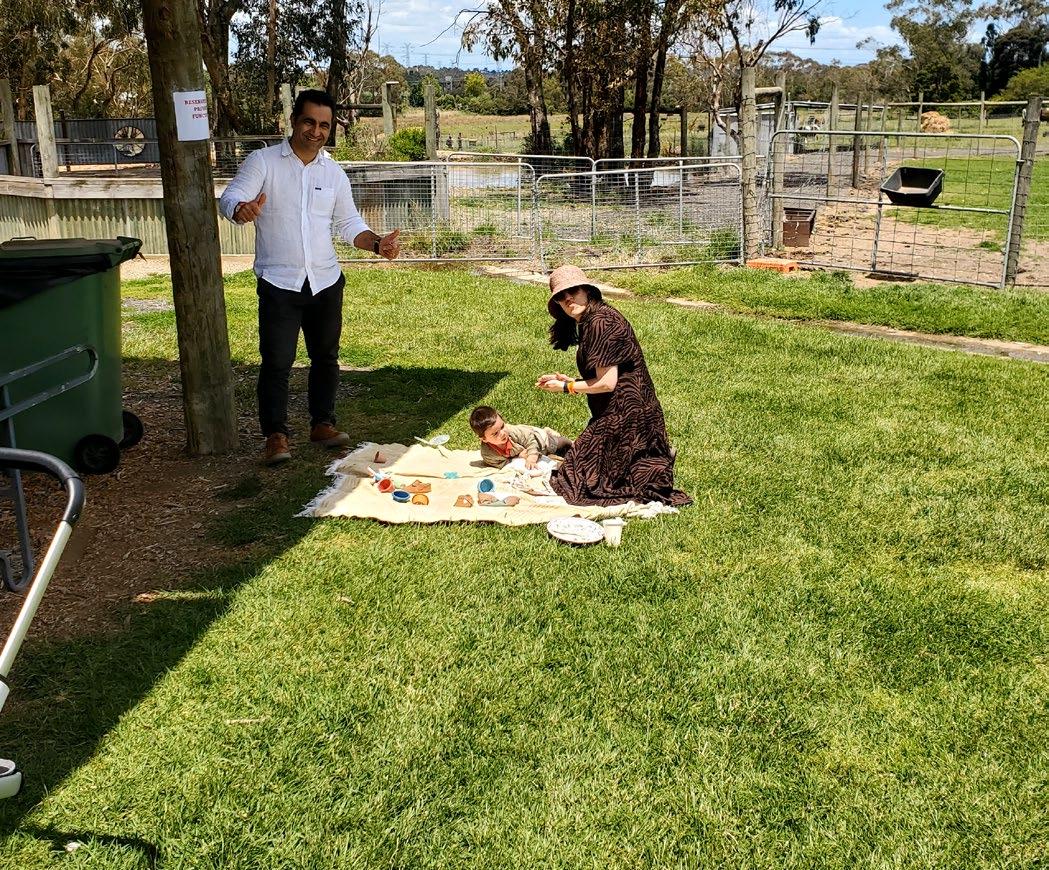
The Victorian Branch of AINDT held its annual Family Christmas BBQ at Chesterfield Farm in early December 2025, bringing members and their families together for a relaxed day of community connection and festive celebration.
Despite a sky filled with threatening clouds, the weather held off long enough for everyone to enjoy the occasion, with members, partners and children taking the opportunity to celebrate Christmas early with the wider AINDT community in a welcoming, family-friendly setting.
The event was well supported by the Branch, with a complimentary BBQ lunch, drinks, and Christmas presents for the kids provided to all attending families. It was wonderful to see so many members able to step away from busy schedules and enjoy quality time together in a more informal environment — a reminder that AINDT is not only a professional association, but also a strong and supportive community.
Chesterfield Farm proved to be the perfect venue for the day. A historic working homestead dating back to 1859, the farm offers an excellent snapshot of traditional farming life in Melbourne’s south-east. Families had plenty of time to explore the many experiences on offer, including tractor rides, pony rides, animal encounters, and visits to the animal nursery. Highlights for many children (and adults!) included the milking displays, working dog demonstrations, and the chance to get up close with a range of farm animals.
Adding to the atmosphere, Chesterfield Farm is set alongside Dandenong Creek and surrounded by river gums, wetlands and abundant birdlife. The natural setting created a calm and enjoyable backdrop for the day, with something to interest visitors of all ages and abilities. The farm’s hands-on experiences also ensured that everyone could participate and take part in the fun.
The event was very well attended, with many families choosing to stay well into the afternoon. It was a fantastic turnout and a great way to round out the year, strengthening connections across the Branch and creating a memorable day for members and their families.
A sincere thank you to everyone who attended and helped make the day such a success.
Regards
Glen Haberl

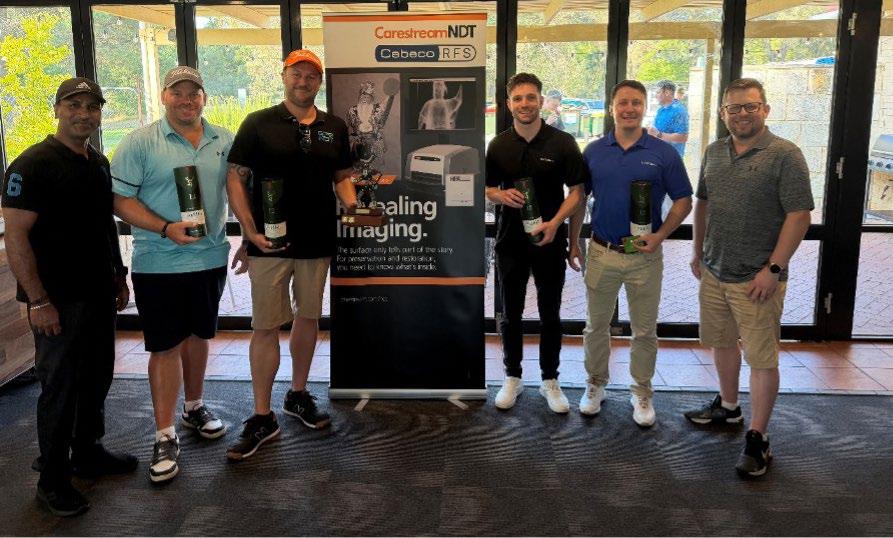
Another year has passed and, once again, the Western Australian Branch of AINDT has delivered a highly successful annual golf event for members.
With an excellent turnout of 60 golfers, we tee’d off at 10:45am under perfect playing conditions—a beautiful, 25 degree day. Before heading out on the course, preround bacon and egg burgers and light refreshments prepared all our golfers for a social, but competitive round of four-ball Ambrose.
Handicaps were in play, to give all teams the chance to have their name engraved on the annual trophy and ultimate bragging rights.
At the end of the day, there can only be one winning team, but the success of the event was clear, with members already looking forward to the 2026 event. I think I speak for everyone when I say, see you again next year.
The 2026 Winners
Winning Team, sponsored by Russell Fraser Sales (Cebeco): Jay Sloper, James Stewart, Peter Rakic and David Carter.
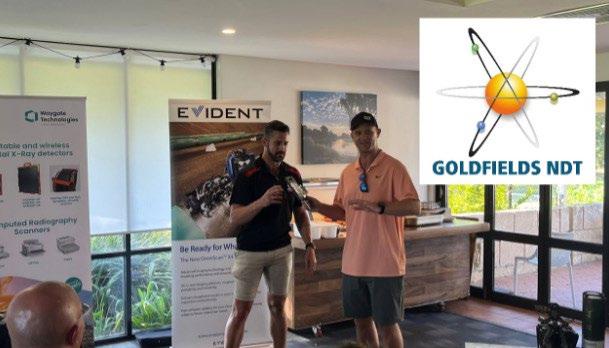
Longest Drive, sponsored by Goldfields NDT: Chris Billings.
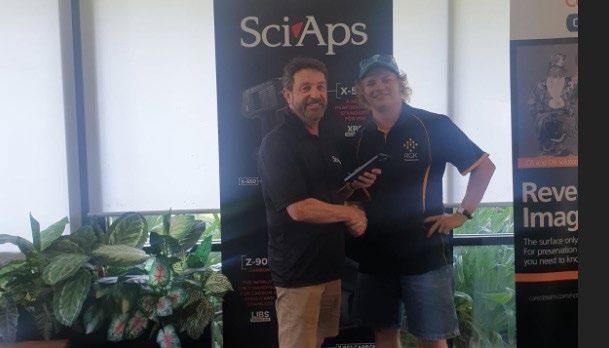
Closest to the pin, sponsored by SciAps: Lachlan Linn.
You
As always, our events in the West are supported amazingly by the local service and product suppliers. Thank you to all sponsors who give generously and provide amazing value to the WA membership.
Our Gold Sponsors were Evident Industrial and GFS NDT. Our Silver Sponsors were Waygate Technologies and Russell Fraser Sales (Cebeco).
Our thanks also goes to the WA Branch for committing their time to make these events happen, particularly Josh Wilkinson who organised the event but was had to
With thanks to our sponsors



As we head into 2026, the Standards Australia MT007 Committee will be looking to address several issues, including participation in the ISO Committee hybrid meetings to be in held in Italy around mid-year.
The main items to be discussed the potential to adopt ISO Standards relating to Acoustic Emission, Thermography and advanced NDT methods during the first meeting to be held this year.
The public ballot for the revised AS 39878 was completed and the result will be available shortly.
ISO 4386-1:2019 Plain bearings — Metallic multilayer plain bearings
ISO 16809:2025 Non-destructive testing — Ultrasonic thickness determination
ISO 4993:2024 Steel and iron castings — Radiographic testing
Current ISO Standards which have been which have been proposed for direct adoption by MT 007 are as follows.
Voting is available on the Standards Australia website with the closing date for the public comment being 16 February 2026.
AS/NZS 2824.1:202X Supersede AS 2824-2003
AS/NZS ISO 16809:202X Supersede AS ISO 16809:2020
AS/NZS ISO 4993:202X Supersede AS ISO 4993:2020

Other projects currently being worked on by ISO Committees are as follows with internal ballots being held at present.
Non-destructive testing — Infrared thermographic testing — General principles for thermoelastic stress measuring method.
Non-destructive testing — Characterization and verification of ultrasonic test equipment — Part 3: Combined equipment
Non-destructive testing — Ultrasonic testing with arrays — Vocabulary
Non-destructive testing — Equipment for eddy current examination — Part 1: Instrument characteristics and verification
Non-destructive testing — Evaluation of vision acuity of NDT personnel
Non-destructive testing — Thermographic testing — Active thermography with laser excitation
Non-destructive testing of welds — Ultrasonic testing — Acceptance levels
Non-destructive testing of welds — Ultrasonic testing — Techniques, testing levels, and assessment
Non-destructive testing of welds — Ultrasonic testing — Phased array technique for thin-walled steel components
Non-destructive testing of welds — Ultrasonic testing — Characterization of discontinuities in welds
Non-destructive testing — Infrared thermography — Vocabulary
Please contact me using the details below if you have any questions or require further information and I will reply at the first opportunity.
Angelo Zaccari
MT007 Standards Chairperson angelo.zaccari@outlook.com

B E C O M E A N A I N D T M E M B E R T O D A Y
Whether you're looking to enhance your knowledge, expand your network, or influence industry standards, AINDT is your gateway to success Connect with top professionals and thought leaders in an environment that celebrates innovation and progress. Just some of the member benefits are outlined below.
Regular editions of the AINDT Journal (6 per year)
Discounted certification and renewal fees
Free and discounted advertising on the AINDT website
On and off-site technical advice
Exclusive Corporate Member benefits
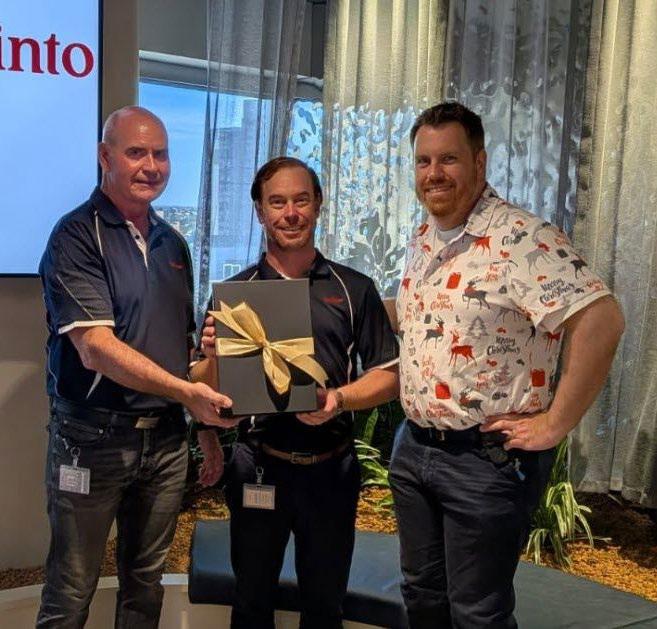
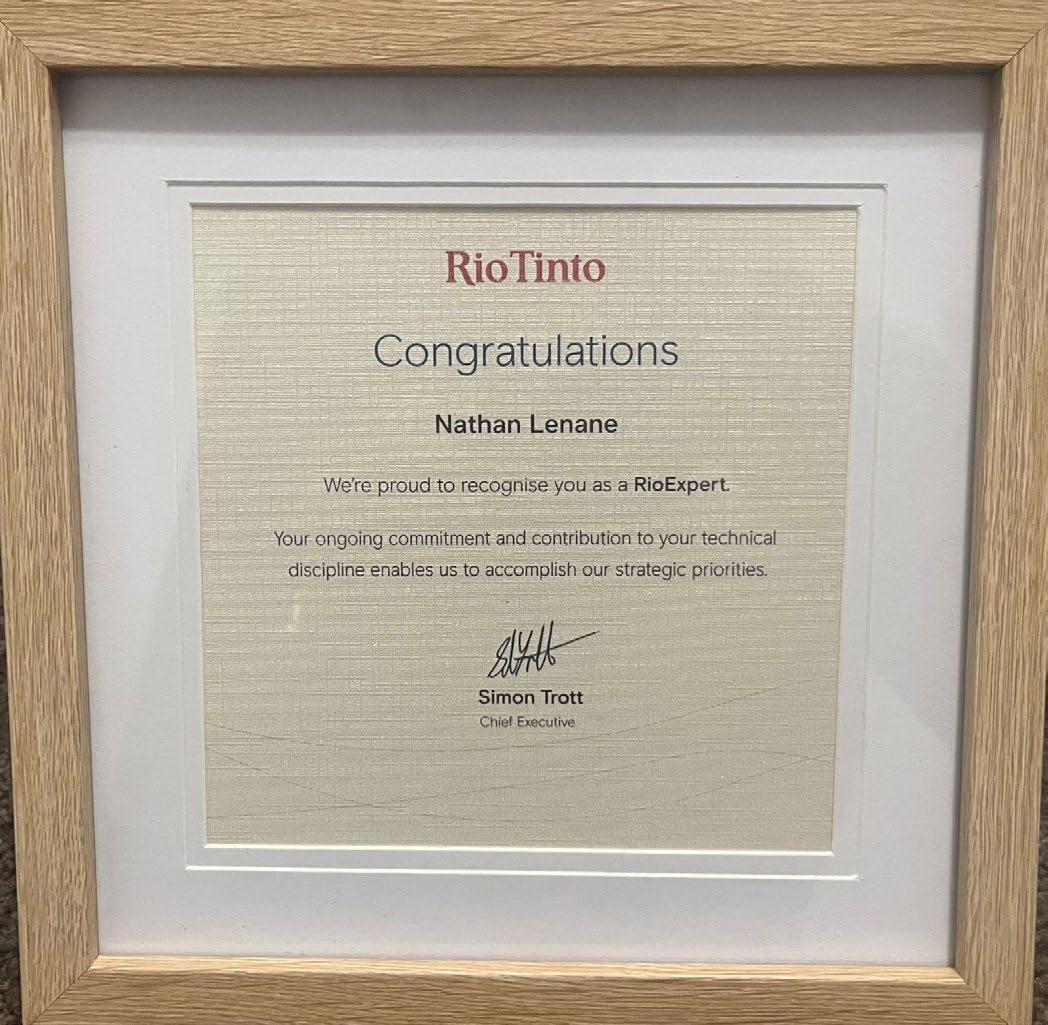
The Australian Institute for Non-Destructive Testing is proud to recognise and congratulate one of our members, Nathan Lenane, who was recently awarded Rio Expert status. This is an outstanding achievement and a major milestone in any technical professional’s career.
In technical professions, recognition often comes quietly, in the form of trust. Trust to sign off critical work. Trust to interpret ambiguous results. Trust to make the call when the consequences matter. For AINDT member Nathan Lenane, that trust has been built over more than 20 years of inspection and testing experience, across sectors where quality, safety and compliance are non-negotiable.
That track record has now been recognised on a global stage, with Nathan recently awarded Rio Expert status. This is a rare and highly regarded professional designation within Rio Tinto.
Nathan is one of only 199 Rio Experts worldwide. These 199 employees all have specialised skill sets in their area of expertise and have been recognised for demonstrating elite technical competence in their field.
While the title comes with prestige, it also represents something deeper: an acknowledgement that technical specialists can — and should — be recognised as leaders in their own right, without needing to move into management to progress.
“What does this mean apart from a groovy new title and a black box full of rock samples?” Nathan joked. But the reality is that Rio Expert status is reserved for those operating at the very top of their discipline; specialists who deliver measurable outcomes, build capability across the organisation, and influence technical direction.
What is a ‘Rio Expert’ and Why Does it Matter? Across industry, technical specialists have traditionally faced a common dilemma: remain in technical roles and risk career stagnation, or move into management to progress. Rio Tinto’s expert recognition program helps solve that problem by establishing a pathway that values deep expertise and recognises its strategic importance.
For Nathan, the recognition is both personal and professional. “December 26th 2025 marked three years
at Rio Tinto… what an adventure,” he says. “In that three-year period, I have been supported amazingly internally and achieved many individual and team initiatives and improvements.”
Rio Expert status is not awarded based on tenure alone. Candidates must demonstrate impact that goes beyond role expectations and provide evidence across four key categories.
“In order to achieve this title, I needed to provide at least five examples in four categories where I exceeded expectations for someone in my position,” Nathan explains. “These categories were Technical Knowledge, Commercial and Strategic Outcomes, Knowledge Community Contribution, and Professional Recognition.”
These criteria reflect a broader truth about modern NDT and integrity management: it’s not enough to be technically skilled. The most valuable professionals are those who apply expertise to reduce risk, improve performance, strengthen systems and uplift others.
Nathan’s career reflects the kind of professional depth that only comes from experience across diverse, high-stakes environments. He spent six years in the aerospace sector, an industry defined by stringent standards, controlled processes and uncompromising attention to detail.
From 2013 onwards, Nathan gained valuable experience across a wide range of heavy industrial assets and operating environments, including piping, pressure equipment, storage tanks, compliance testing, process plant, mining, heavy mobile equipment, fixed plant, power generation and gas.
It’s a portfolio that many in the NDT profession will recognise: complex equipment, varied degradation mechanisms, competing priorities, and operational pressures that demand both technical clarity and professional confidence.
It’s also a career path that highlights the value of broad exposure, understanding not only the methods, but the assets, the risks, and the operational realities that sit behind inspection decisions.
In his role with Rio Tinto Iron Ore, Nathan’s work has direct influence on how inspection and NDT risks are managed across the business.
“In my role at Rio Tinto Iron Ore, I oversee the way we manage risks to the business within my area of expertise,” Nathan says. “I write internal NDT standards, procedures and written instructions.”
Nathan’s responsibilities also extend beyond documentation and oversight into research and capability-building. “I carry out research and development tasks, and I visit our sites regularly to train, coach and verify competency through proficiency and internal examination,” he says.
This combination — standards, verification and coaching — reflects best practice in inspection governance. It ensures the technical system doesn’t rely on individual knowledge alone, but is embedded into organisational capability.
While Nathan’s award recognises individual excellence, he is quick to acknowledge the people around him.
“To say I’m proud of this achievement is an understatement,” Nathan says. “It goes without saying, none of this would be possible without encouragement and support from leadership and all of those around me.” He also extends specific thanks to Erik Lichter, Jason Fry, David Morgan and Guy Salathiel.
Nathan Lenane’s recognition as a Rio Expert is a proud moment for the wider NDT profession and for the AINDT community. It reflects what is possible when technical professionals pursue mastery, apply their expertise to improve systems and outcomes, and actively contribute to building capability in others.
On behalf of AINDT, we congratulate Nathan on this outstanding achievement and thank him for the professionalism and leadership he brings to the inspection and testing industry.
It is essential to have additional formal training to understand key image quality requirements.
BY JAMES F. MOLINARO JR.
Recently, the nondestructive testing industry has made great strides to change their radiography process from film to digital radiography. These changes and advancements have allowed many companies to reduce the overall cost of their RT process and increase production. These are great for any NDT process and company, however, a radiographer needs to recognise and understand the key differences between film and digital radiography.
Many of the industrial standards that govern the qualification and certification of NDT personnel require additional formal training and experience hours (OJT) to transition from film (RT) to non-film or digital radiography. This requirement applies to current or previously certified film Level 1, 2, or 3 radiographers under ISO 9712 and equivalent certification schemes. The purpose of this article is to ask: Is it really essential for well experienced certified film radiographers to receive additional formal training and experience? After all, radiography is radiography. In my opinion, the answer is yes! It is absolutely essential to have additional formal training to understand key image quality requirements of both the computed radiography (CR) and digital radiography (DR) systems used in digital radiography!
I’m not saying that because I am an NDT instructor, nor am I writing this article to discourage film radiographers from converting their film process to digital. My goal is to educate you on key items to consider prior to making a purchase. In my experience, I have seen a few occasions where companies spent hundreds of thousands of dollars on CR systems to find the system doesn’t meet the requirements set forth by their customers.
I always tell my experienced film certified students that they already possess the knowledge and fundamentals of film radiography. Most of these are still relevant, but now they have to learn new image quality calculations, terms, and acronyms used in digital radiography. I often say it is comparable to learning a new language and my job is to make you bilingual in both film and digital radiography.
Today’s qualification and certification standards used within the NDT industry require current and previously certified film radiographers to receive additional formal training and experience hours to transition their certification to include digital radiography.
• ISO 9712 / AINDT (Australia): AINDT administers ISO 9712 certification in Australia. For CR/DR Level 2 certification, candidates require 105 hours of formal training and 1260 hours of industrial experience. Importantly, candidates seeking RT2 CR/ DR certification must also show evidence of having viewed and assessed a minimum of 1000 radiographs/ images. The prerequisite for RT2 CR/DR is existing RT2 (welds) certification—film radiographers must hold this qualification before adding the CR/DR endorsement.
• SNT-TC-1A (US): Recommends that current Level II radiographers need 24 hours of additional training (16 hours equipment familiarisation training and then 8 hours of formal training).
• NAS410 (US aerospace): Requires current film Level II radiographers to receive 40 hours of formal training in non-film, and 200 hours of experience. Personally, I agree with the requirements of additional formal training and experience because of new technical items and subject matter involved with digital radiography that was not considered or applicable for film radiography.
Although X or Gamma Ray fundamentals still work within digital technology similarly as with film, a radiographer must be aware of the limitations of digital radiography (DR/DDA) and computed radiography (CR) systems.
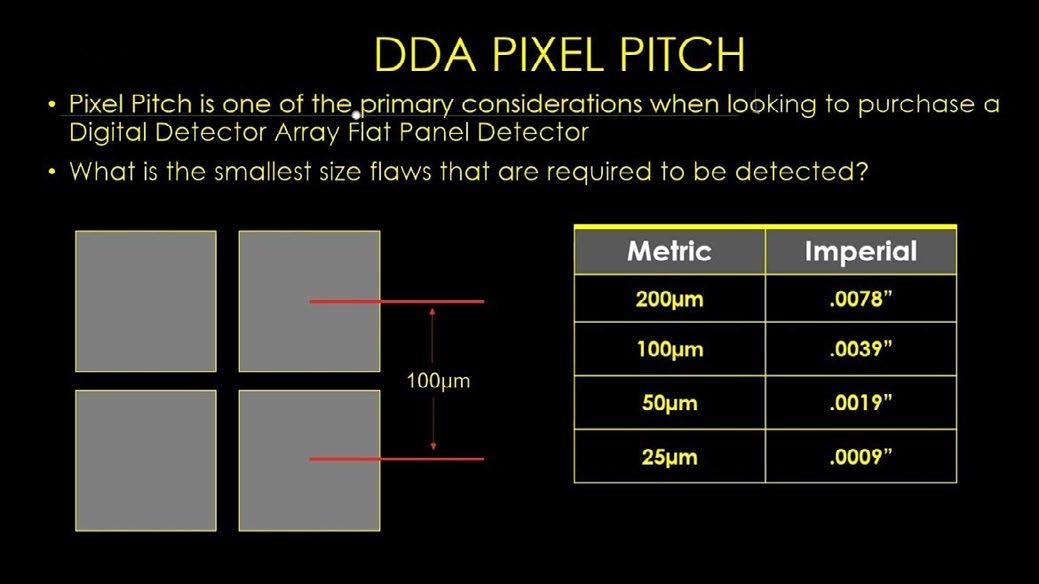
One of the most important characteristics when selecting a CR or DR system is the basic spatial resolution. Basic spatial resolution is defined as the smallest degree of visible detail within a digital image that is considered the effective pixel size. This measurement aids in determining if a digital system is capable detecting the smallest size flaw required to be viewed in the radiograph.
Film has always been the gold standard for resolution within the NDT industry. Film is still considered to have better inherent spatial resolution than CR and DR when placing a test object directly on film, CR imaging plate or DR flat panel detector.
Many automated DR systems use geometric magnification to replicate resolution achieved with film, however this is only possible with a mini-focus (< 1mm focal spot) or micro-focus (< .1mm focal spot) X-Ray tube. This may not be an option for companies that use conventional X-Ray tubes (~1 to 7 mm focal spot) with larger focal spots for their film process. Using geometric magnification with conventional X-Ray Tubes would result in the radiographic image to be very blurry or unsharp. Detecting flaws are almost impossible with this situation.
While using a CR system, the operator can choose to scan the imaging plate at a specific pixel pitch (i.e.,100, 50, or 25-microns). Will this result in the image having a basic spatial resolution of 100, 50, or 25-microns? No, depending on the CR scanner performance and imaging plate characteristics there can be approximately a 15 to 55 micron larger measurement in SRbdetector
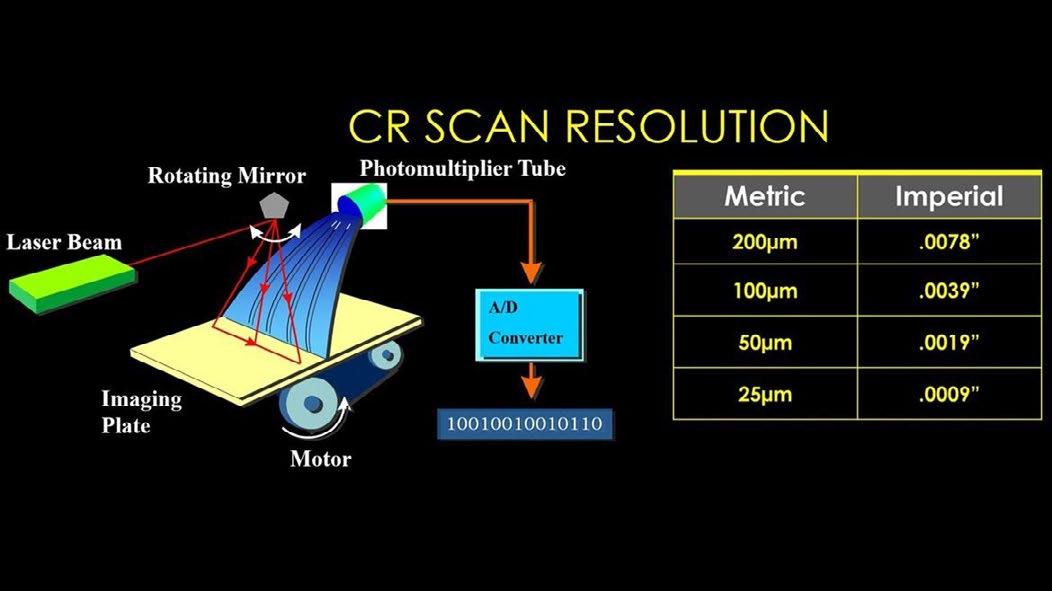
Even with indirect DDA flat panel detectors of a specific pixel pitch (i.e., 75, 100, or 200 micron) the actual SRbdetector can be approximately 5-50 microns larger than the listed pixel pitch. Indirect DDA flat panel detectors typically use either a Cesium Iodide or Gadolinium Oxide scintillator to convert the X or
Gamma Ray photons into a visible light that is measured by the photodiode array of the Amorphous Silicon TFT substrate. The thickness of this scintillator does influence the SRbdetector and basically, the thicker the scintillator is, the larger your SRbdetector measurement will be, while a thinner scintillator will have a slightly larger SRbdetector than the listed pixel pitch. The thickness of the scintillator is typically dependent on the intended application (i.e., material type and thickness). There are advantages and disadvantages when choosing a thinner or thicker scintillator. Most manufacturers will help you decide which scintillator best suits your application.
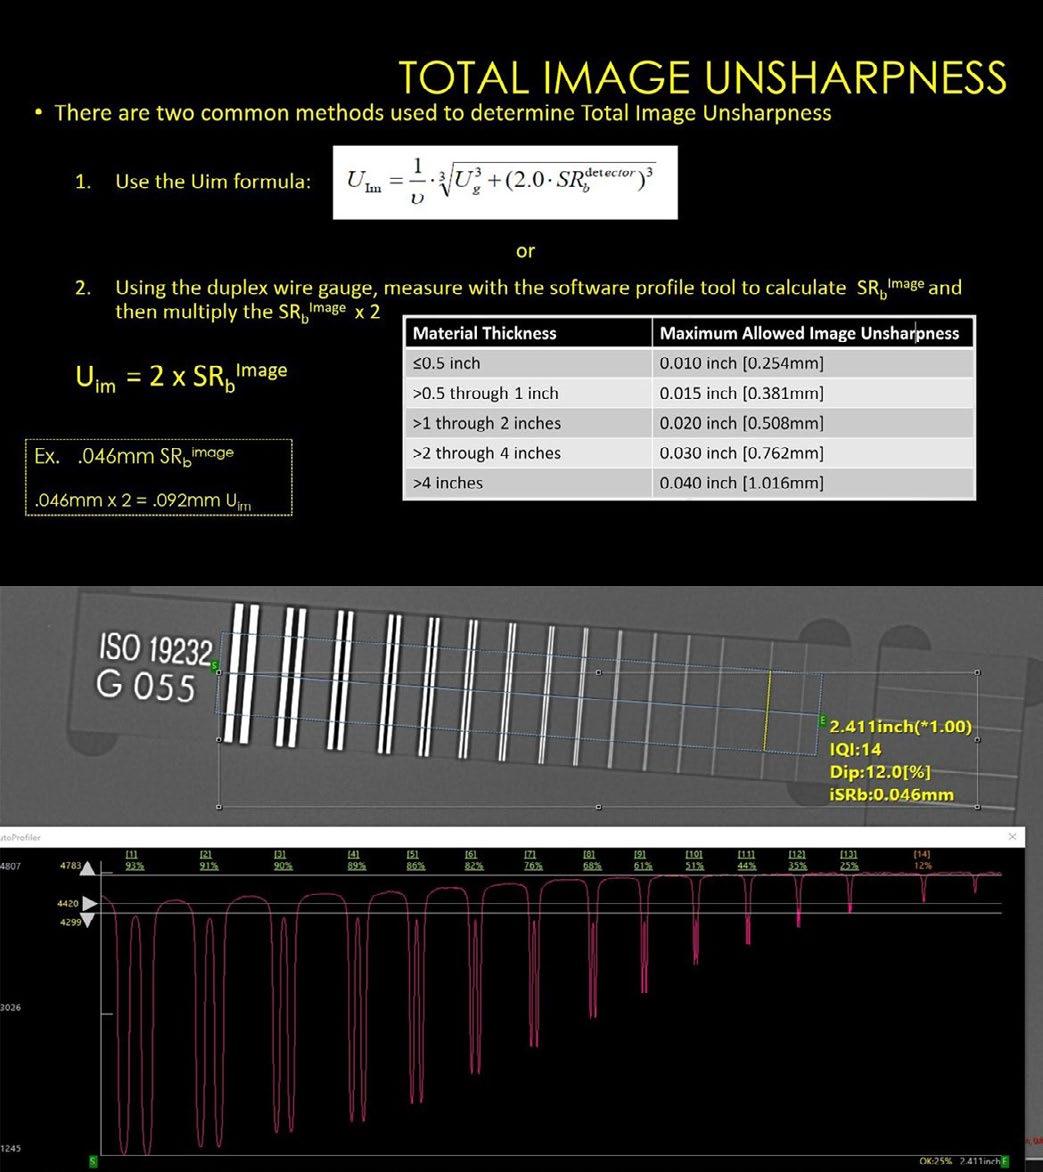
One of the most critical calculations used in the film radiography process is known as Geometric Unsharpness (Ug). Ug is the measurement of the blur (aka penumbra) in a film radiograph. If this measurement is above the value stated in the standards, the radiograph will lack the definition or sharpness required to find flaws. This measurement is calculated by knowing the source to object distance (SOD), object to film distance (OFD), and focal spot size of the X or Gamma Ray source.
Ug is still a factor with digital radiography, however there are more image attributes that also need to be considered. We must consider (Ug) Geometric Unsharpness, but now we need to know the (SRbdetector) basic spatial resolution of the detector, and what the geometric magnification (Distance from the top of the part to the detector) is. We refer to the combination of these attributes as Image Unsharpness (Uim). This calculation/formula is new to an experienced film radiographer.
There are two common methods used to calculate this measurement. Method One is to use the Duplex Wire Gauge per ASTM E2002 or Method Two is to calculate with the Uim formula listed in ASTM E2033 & E2698. If radiographers are not aware of this requirement and use only the (film) Ug formula, they could produce a digital radiograph that is missing the definition or sharpness required to locate flaws.
When using CR or DDA it is important to know if you have enough pixel coverage for the flaw size needed to discern. When purchasing a DDA System pixel pitch is extremely important value to consider.
If pixel coverage is not sufficient, you may be able to use geometric magnification to achieve pixel coverage and Uim that’s required. Again, to use geometric magnification a mini or micro focus X-Ray tube will be needed.
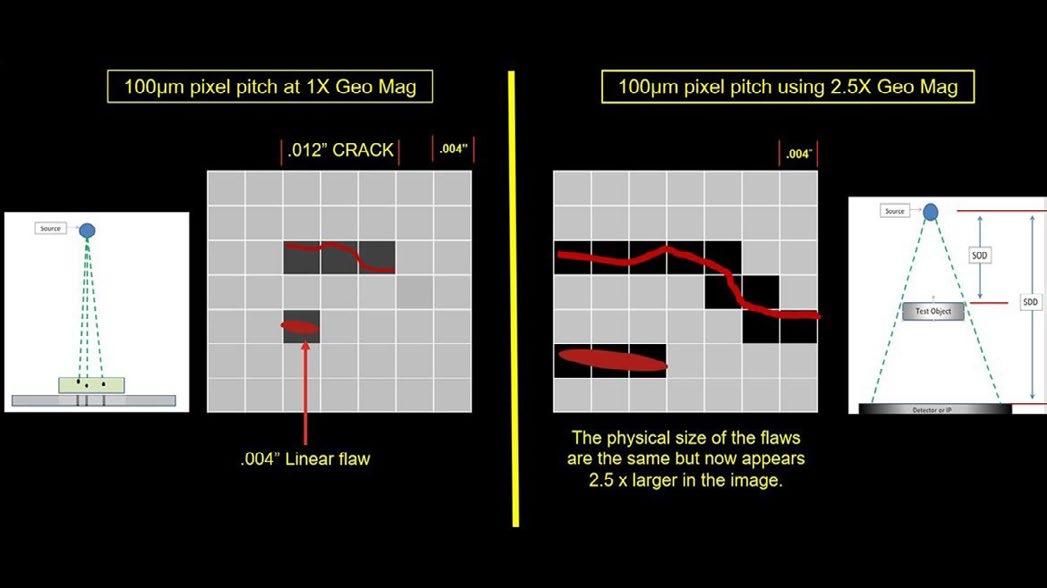
ASTM E2736 has a recommendation regarding the minimum number of effective pixels to cover the longest dimension of a defect. The recommendation states that >6 pixels covering the longest defect is the best practice if available. Keep in mind that the SRbdetector is the measurement used for this recommendation and not the pixel pitch or CR scan resolution.
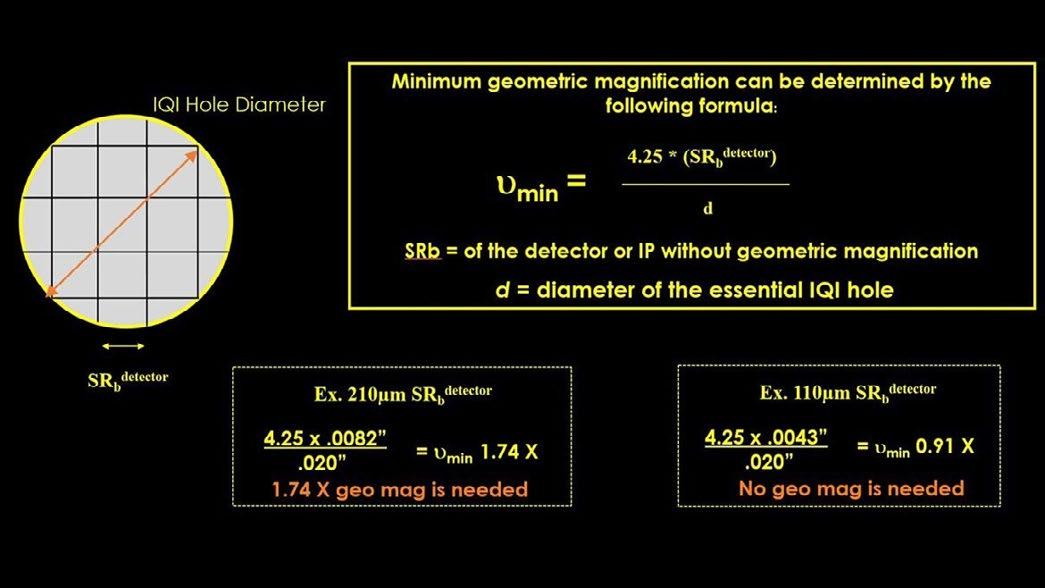
Many aerospace manufacturers use the 3x3 pixel matrix rule to determine if it needs any geometric magnification
to compensate for the lack of pixel coverage. Basically, a 3x3 pixel matrix needs to fit inside the smallest penetrameter essential T-hole size. If this is not achievable, geometric magnification will be required or you will have to select a CR or DR system that has a smaller SRbdetector measurement.
Previously, I’ve witnessed companies purchase digital systems based upon price tag instead of system capabilities. They meant well, attempting to save the company money, but later found their customers wouldn’t approve the new system due to not having enough pixel coverage and/or meeting qualifying requirements.
These items are just a few examples of why additional formal training and experience in digital radiography is beneficial. I highly recommend having manufacturers demo their digital systems at your facility using your existing X-Ray tube and an actual part with the smallest defect that is to be detected.
If you are only familiar with film radiography, I highly recommend having a consultant educated in digital radiography prior to making any system purchases.
As part of the purchasing decision, the manufacturer should provide Spider Charts for their systems as listed in ASTM E2446 & E2597. Spider Charts show the performance characteristics of their digital system (ex. SRbdetector , Contrast Sensitivity, Signal to Noise Ratio, MTR, EPS,etc.).
Note on Standards: This article references ASTM standards (E2033, E2698, E2002, E2736, E2446, E2597) which are widely used in American industry. Australian practitioners may also work with ISO 176362 (radiographic testing of welds using digital detectors) and ISO 19232 (image quality indicators). The technical calculations and principles described apply regardless of which code governs the specific application.
Appendix: AINDT Training Requirements
Reference
Extracted from AINDT-005-NDT-Guide-toCertification-Issue 22-Rev-06 (December 2025) for verification:
RT Level 2 Requirements (Table 1)
Certification
Radiographic Testing (RT2) 105 1260
Computerised/Digital Radiography (RT2 CR/ DR) 105 1260
Additional RT Requirements (Section 3.7)
• "Candidates seeking RT2 & RT3 certification must show evidence of having viewed and assessed a minimum of 1000 radiographs/images."
Prerequisite for RT2 CR/DR (Note 7, Section 3.8)
• "The prerequisite for radiography Level 2 is completion of a minimum of 35 hrs of training following the training syllabus as set out in ISO TS 25107 for training ISO 9712 RT Level 1."
RT2 CR/DR Examination (Table 17)
The AINDT RT2 (welds) CR/DR examination includes:
• Specific theory: 30 multiple choice questions (1 hr 30 min, closed book)
• Practical specimens: Inspection of 2 specimens to ISO 17636-2
• Image viewing: 12 digital images (70% pass per image)
• Work instruction: To ISO 17636-2 (70% pass)
This demonstrates that AINDT treats CR/DR as a distinct certification requiring method-specific training and examination, not merely an extension of film RT qualifications.
KEYWORDS: computed radiography digital radiography manufacturer scan cameras scanner x-ray
James F. Molinaro Jr., ASNT Level III ( RT, PT, MT) & NAS410 Level 3 (Film & Non-Film) is the technical training specialist at FUJIFILM North America Corporation / Industrial Products Division. For more information, call (864) 437-9780 or email james.molinaro@fujifilm.com.
Australian Adaptation Note: This article has been adapted for Australian audiences. In Australia, the Australian Institute for Non-Destructive Testing (AINDT) administers ISO 9712 certification. AINDT requires 105 hours of formal training and 1260 hours of industrial experience for RT2 CR/DR certification, plus evidence of viewing and assessing a minimum of 1000 radiographs/images.
For full details, refer to AINDT-005 "Guide to Qualification and Certification - Non-Destructive Testing" available at www.aindt.com.au. Technical principles and calculations in this article remain unchanged.
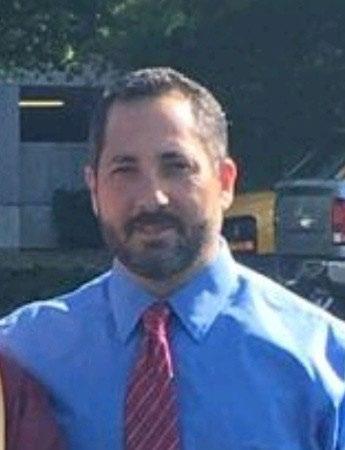
Jim Molinaro will appear at the AINDT Summit in Newcastle in April. He will be speaking on the topic: Why Additional Training Is Needed When Transitioning From Film Radiography To Digital Radiography (RT). Register now, to hear Jim’s insights.
International radiography expert Jim Molinaro is heading to the AINDT Summit in Newcastle this April to tackle one of the industry’s most important transitions: moving from film radiography to digital radiography (RT). In this must-see session, Jim will explain why additional training is critical, what skills inspectors need to adapt, and how organisations can avoid costly gaps in capability. When these key items are not understood by a film radiographer there is a potential for misinterpretations.
Jim Molinaro is a Technical Training Specialist with Fujifilm NDT Training Services. He holds certifications as an ASNT Level 3 in Radiographic Testing (RT), Penetrant Testing (PT), Magnetic Particle Testing (MT), as well as NAS 410 Level 3 for both film and digital methods. With over 22 years of experience in the nondestructive testing (NDT) industry, Jim is actively engaged in professional organizations, including ASNT and ASTM. He regularly contributes to the ASTM E07 committee and the ASME BPVC Section V committee meetings. In his current role at Fujifilm, Jim delivers formal training programs for customers seeking Level 1, 2, and 3 certifications in Computed Radiography (CR) and Digital Radiography (DR).
Register now to hear Jim’s expert insights. aindtevents.eventsair.com/aindtsummit-2025/register
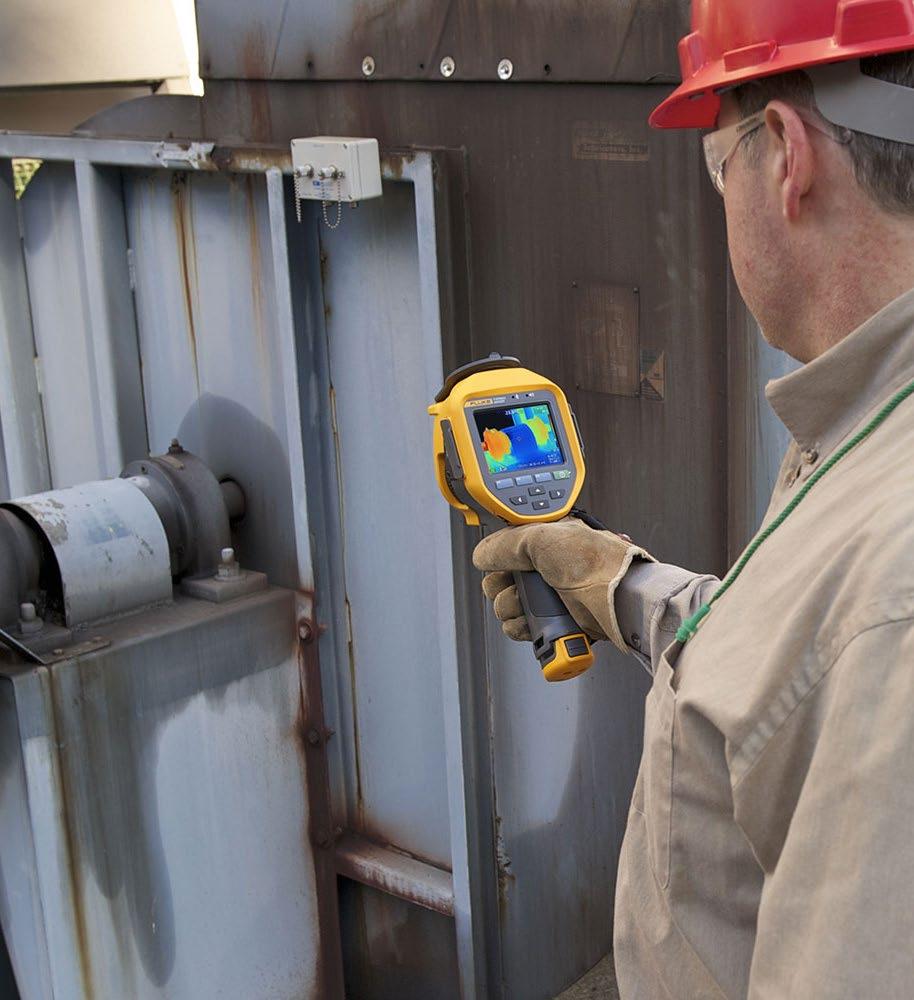
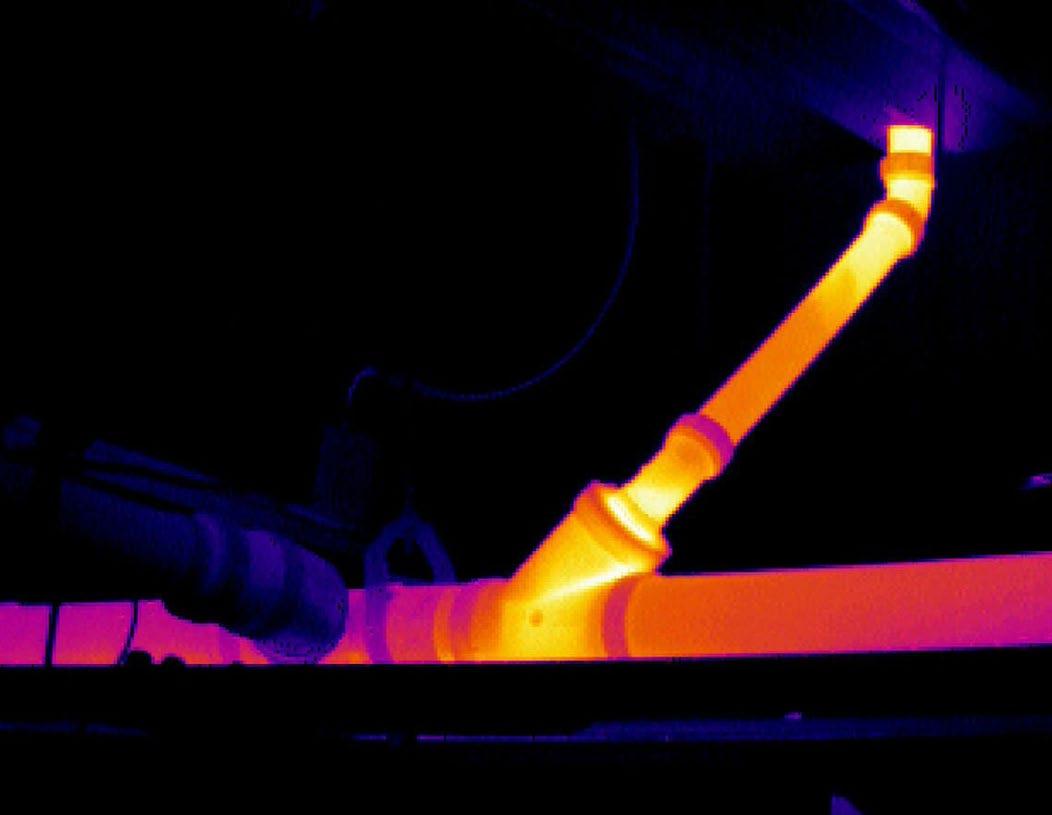
In the past several years, thermal cameras have transformed from a specialist - only device to the perfect tool for process equipment maintenance — from troubleshooting to scheduled maintenance. By using a thermal camera for troubleshooting, the technician can diagnose the root cause more efficiently while also often identifying other potential problems during the same inspection, PdM-style.
Unlike regular digital cameras that capture images of the vis-ible light reflected by objects, thermal cameras create pictures by measuring infrared energy or heat. The thermal camera then assigns colors based on the tem-perature differences it measures. In a “radiometric” imager, each pixel of colour on screen represents an individual temperature.
Thermal cameras read the surface temperature of objects. The trick is that surfaces don’t all emit thermal energy equally well. Emissivity is the material property that describes the efficiency with which an object radiates or emits heat.
Emissivity is expressed as a value from zero to onepoint-zero:
• Shiny metals have low emissivity
• Non-metals or painted or heavily oxidised metals have a higher emissivity
Objects with low-emissivity are—at the same time— highly reflective of their thermal sur-roundings. Because of this, the reflected energy a thermal camera sees may be different than actual temperature. To compensate (and improve temperature accuracy), follow these tips:
• Avoid measuring shiny metal surfaces
• In an electrical cabinet, focus on those object that are highly emissive such as the rubber insulation on the power cable
• Apply black paint or electrician’s tape to highemissivity surfaces where necessary
• Know or control your background temperature
The other way to compensate is to take qualitative readings. In other words, in many cases,
you can compare heat signatures between like components or units, or to previous readings on that same object. If the tempera-ture is markedly different, then there may be a problem. Know-ing the precise temperature in that case may not be necessary.
guidelines
To capture the best thermal images, follow these best practices:
• Verify that the target is operating at a minimum 40 % of load (lighter loads don’t produce much heat, making it hard to detect problems).
• Within the safe zone of your equipment, get as close to your target as you can.
• Don’t “shoot” through doors; thermal gradients within an electrical cabinet make it impossible to understand the thermal impact inside the cabinet.
• Infrared doesn’t go through glass or plastic safety shields so you need to work around these items.
• Account for wind and air currents that could cool the abnormal hot spots.
• Account for ambient air temperatures, especially outdoors. Hot/cool weather can mask component temperatures.
• Not all problems are hot! Restricted flow in a cooling system could be indicated by a cooler than normal signature.
• Think about how the equipment in question works and what its heat-related failure signatures are. It is important to understand the base line thermal pattern of the equipment you are thermally scanning.
• Consider sources for reflective infrared radiation when working with low emissivity assets.
• When trending electrical or mechanical assets it’s impor-tant to have consistent loads for accurate temperature data over time.
Note: While thermal imaging is non-contact, if you measure live electricity with the enclosure doors removed, safety standards still apply. Wear appropriate per-sonal protective equipment, try to stay four feet away from the object, and minimise time spent in the arc-flash zone.
Process applications for thermal imaging
• Measure operational tem-peratures in motors or other rotating equipment.
• Identify leaks, blockages and settling in sealed vessels, pipes, steam systems, and heat exchangers.
• Capture process temperature readings.
Inspecting motors and other rotating equipment
Key inspection points for motors include:
• Bearings
– Bearings under equal load should display equal temperatures
– A hotter bearing on sheave side of motor could indicate over-tightened belts
• Belts
– Sheaves that are hotter around circumference could indicate slipping belts
– Belts that do not cool between the motor and blower sheaves could indicate slipping belts
– Belts with unequal ther-mal patterns can indicate misalignment
• Couplings
• Electrical connections
• Overall temperature, especially
– Poor cooling, or
– Internal problems
Take the time to understand:
• How heat moves in the equip-ment via conduction and convection,
• How the equipment functions and fails. Understand the manufacture’s operating speci-fications for the equipment
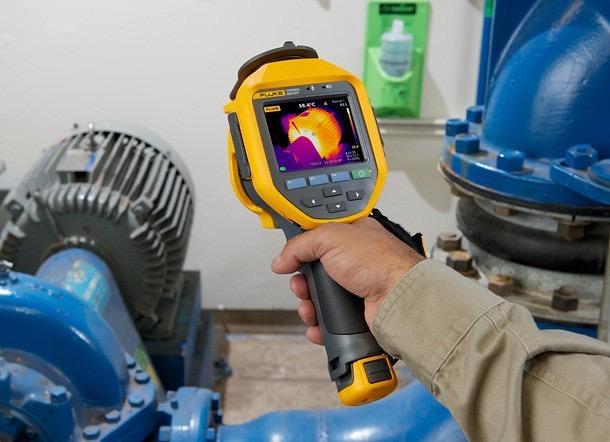
Thermal signatures are often associated with machine health. Normal operation has a verifi-able signature and problems often show up as differentials. To understand these, however, requires knowledge of the machine and how it fails.
With the help of your trouble-shooting thermal camera, it pays to quickly check the overall motor temperature every so often, especially for smaller motors that may not get the kind of maintenance they should.
Often these motors overheat before anyone notices otherwise. Use the motor temperature rating on the nameplate as a guide.
Exterior motor temperatures are generally about 2 °C cooler than the interior temperatures.
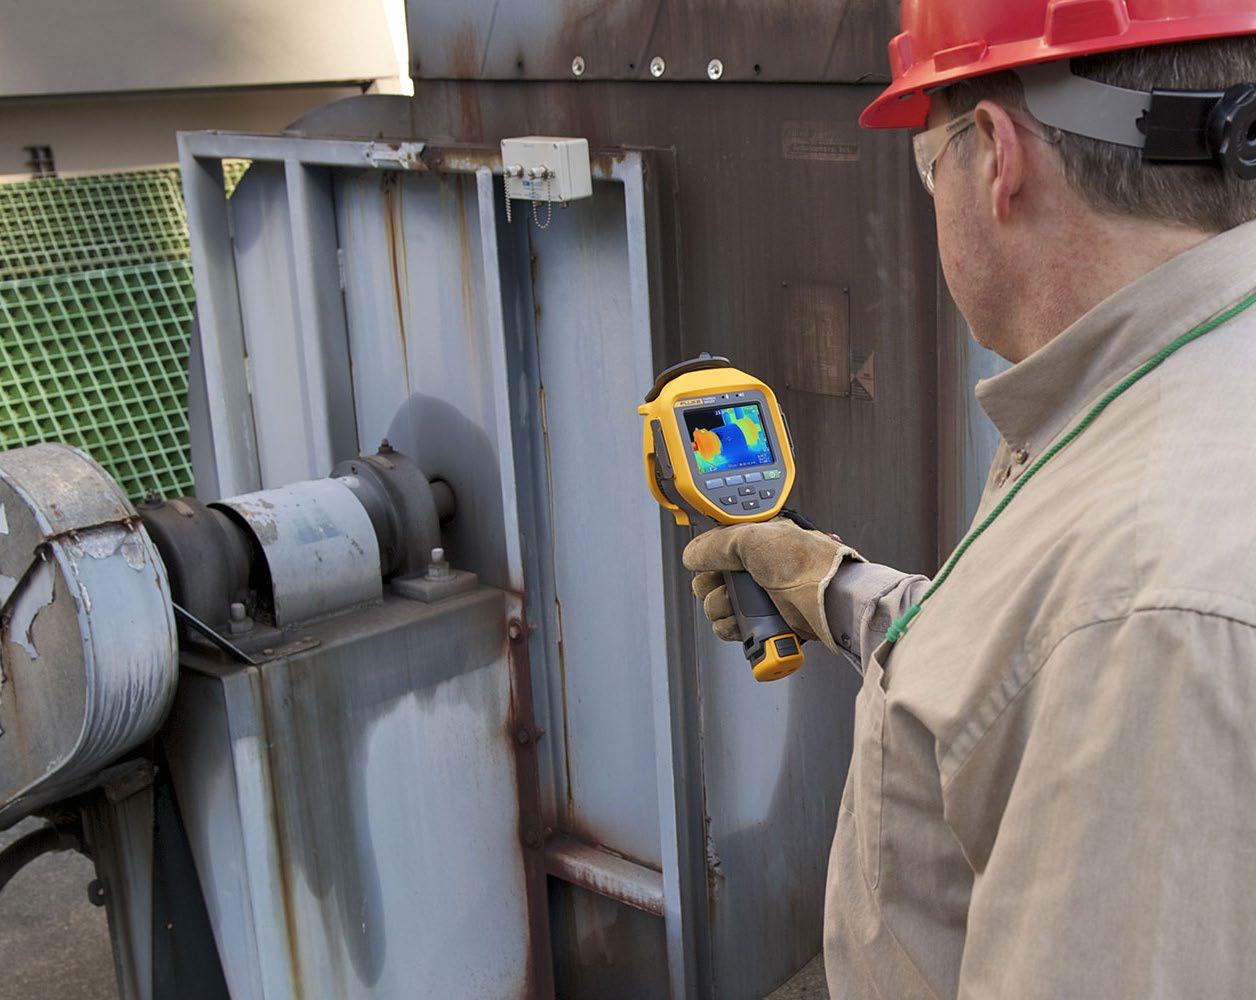
For a routine or preventive maintenance program, it’s ideal to start with a newly commis-sioned and freshly lubricated motor and take a snap shot of the key inspection points, while the motor is running. Use these images as baselines.
Tip: On new motors, watch the initial motor start up through your thermal camera. A wiring problem, alignment or lubrication issue will show up thermally before permanent damage is incurred.
As the motor ages, the components become worn, and heat-producing friction develops, the housings will begin to heat up. If possible, take additional thermal images at regular intervals, comparing them to the baseline to analyse the motor’s condition. When the thermal images indicate overheating, generate a maintenance order.
When you are looking at small bearings:
• Compare thermal patterns of one bearing to other similar ones in the same operation.
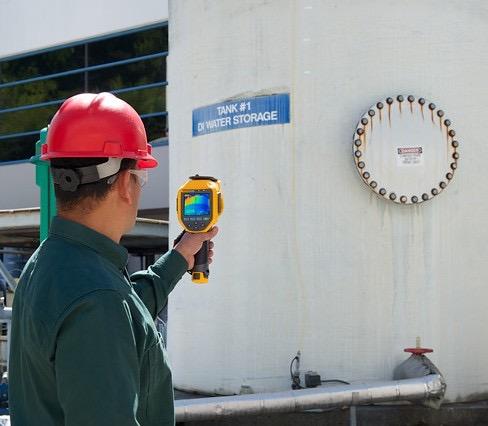
• Gases have a higher heat capacity than the liquids, meaning the liquid products change temperature much more slowly than the gas in the headspace.
• Since most tanks are located outside, their contents heat up during the day due to solar loading, and cool off at night. This temperature difference between the product and the headspace can usually be observed through most tank walls. This technique can work any time during the day but keep in mind that there will be times when the air and liquid or solid will be the same temperature and no apparent level will be visible. The level will start to become visible as the air gains or looses thermal energy.
• A thermal image of a tank that is completely empty or completely full, or that has a shiny reflective skin, will appear uniform and no product level will be apparent. Otherwise, the product level will appear as an obvious thermal separation between the headspace and the product.
• If the tank surface is shiny, or it has insulated walls, it may be difficult to inspect using thermal imaging.
• Remember that small bear-ing failures can result in fire, mechanical stress, belt wear and increased electrical loads.
Inspecting small bearings is one inspect these and problems, while they may seem insig-nificant at first, can be serious. Another benefit is that the inspection is done while the equipment is operating.
When you are looking at belts and sheaves:
• Guards may restrict your view.
• Be sure to re-inspect belts and sheaves after corrective action is taken. While it is not always possible to get a clear view of the belts, thermog-raphy can provide valuable information about the condi-tion of the belt and sheave.
When inspecting pumps and fans, focus on the coupling:
• Look for irregularities—a healthy coupling should have a consistent thermal signature. Component wear will cause abnormal heat.
• Alignment issues will show up as excess heat before they cause bearing problems and then irreversible damage.
Inspecting tanks and other sealed vessels
Key inspection points:
• Scan the outside surface of tanks for differences in temperature at different points
• Gaskets, seals, and valves at openings
• Tank levels—locate fluid, solid, “floater” levels and sludge
• Refractory
Tank levels
When a tank or silo is chang-ing temperature, it’s often possible to see the thermal patterns associated with the various levels inside. Knowing the sludge level, for instance, is invaluable when it comes to operating a continuous process or preparing to clean out a tank. Thermography can also reveal floating materials such as wax and foam as well as layers of different liquids, gases and even solids, such as the layer of paraffin that sometimes forms between the oil and water layers in separators, hindering their normal operation.
Spotting leaky gaskets and seals
Most leaks develop in or around a gasket or seal. Less often, corrosion will cause a weakness to develop and rupture the vessel.
To find a leaky gasket or seal, scan the imager along the seal looking for thermal eccentricities. A large change in temperature along the seal or gasket indicates a loss of either heat or cold – the signature of a failure.
A thermal camera can moni-tor process control valves for leakage, stiction (sticking) or excess friction. Also, a valve’s excitation coil may overheat from working too hard, pointing to a problem such as current leakage or valve size mismatch.
When thermography indicates a problem, technicians can follow up by calibrating the valve or the valve’s positioner.
Under the right conditions, a damaged refractory or liner will show up as hot or cool spots.
Most leaks occur because of the failure of a seal or gasket, although sometimes corrosion will lead to a leak in a vessel’s wall.
Whatever its origin, a leak is likely to manifest itself as a temperature anomaly. When inspecting refractory
insulation, look for hot areas associated with refractory thinning or failure. Cold areas associated with internal product build-up.
High temperature refractory is designed to control heat transfer; as it degrades, it allows more heat to transfer to the outside of the device. In some cases, the cooler areas are the ones of interest as they may show product buildup inside a device.
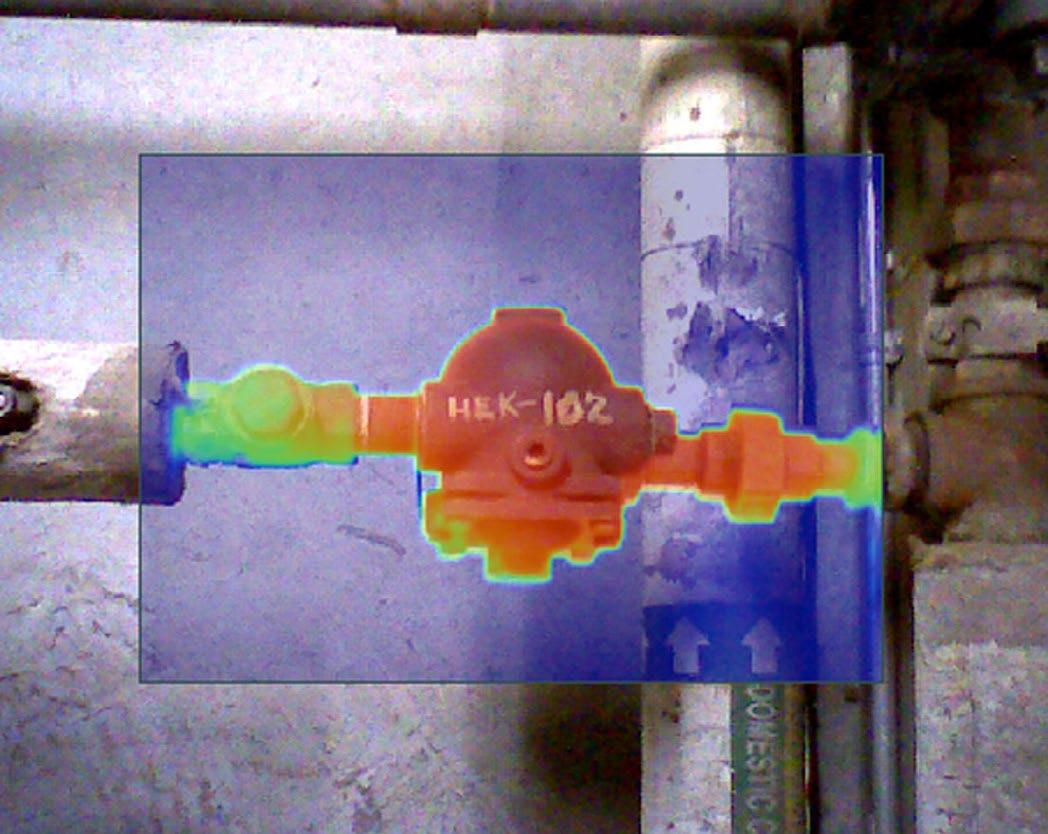
Thermal cameras can quickly see the trap and line temperatures into and out of steam traps. Check all transmission lines and follow pipe temperatures to the source of problems.
• If temperature is low in steam pipe, low in trap and low in condensate return, trap may be stuck closed.
• If temperature is high in steam pipe, high in trap, and high in condensate return, trap may be stuck open.
• If temperature is high in steam pipe, high in trap, and slightly lower in condensate return, trap is probably operating properly.
A trap that has failed to open can go undetected for weeks or months and can be very costly. To a thermal camera, these traps will appear warm on both sides. If you find a trap like this, make sure it has not just cycled. If, after a few minutes, it remains hot on both sides, it is probably not working properly.
Heat exchangers/ steam radiators
Thermal inspection of heat exchangers can quickly and safely identify areas of corrosion, mineral deposits, and sludge buildup, as well as a lack of heat transfer due to external damage like hail, abuse, or lack of maintenance.
It is important to remember however, that mechanical heat transfer is one area in which clear, sharp lines of temperature difference rarely exist. Unlike the typical “hot spots” one is able to see in overheating or malfunctioning equipment, heat exchangers are constructed to facilitate a diffuse and monolithic tempera-ture exchange. Higher resolution cameras with on-camera level-and-span adjustments typically help with capturing lower thermal differences (called Delta T) often exhibited by blocked passages or clogged strainers of plate-type exchangers.
Inversely, shell-type heat exchangers often times show clear and definitive areas of blockage caused by solid buildup of materials. In these cases, infrared inspection will allow you to diagnose specific areas of trouble.
1. Not all problems are hot. If a fuse or switch has failed, for example, you may see an uncommonly cold connection.
2. If a panel or other piece of equipment has an internal fan, you won’t get an accurate surface temperature reading. (Obviously, take care when disabling a fan critical to equipment cooling.)
3. You can take a thermal camera into messy process areas—just cover the camera with a thin plastic bag. The plastic is transparent to infrared.
4. Over lubrication is just as much of a problem as under lubrication! Similarly, belts can be both over and under tightened.
5. Water holds on to heat far longer than air. That means that after a hot day, the liquid inside a tank will stay warm long after the air has cooled, giving you the greatest thermal differentiation to detect tank levels with.
Conclusion
The missing ingredient in all of the above is personal experience. Troubleshooting by nature is scenario specific. The more time spent using thermal cameras, the better the user becomes at identifying anomalies. That thermal skill, blended into existing knowledge of line and equipment function-ality, can make for a formidable troubleshooter and better, long-term maintenance.
Fluke’s Ultra Series thermal imaging cameras offer advanced thermal sensitivity, high-resolution imaging, and precise temperature measurement capabilities— making them ideal tools for identifying and diagnosing process anomalies with accuracy and efficiency.
For more information about Fluke, visit: www.fluke.com Fluke. Keeping your world up and running®
Non-Destructive Testing operates within one of the most regulated professional environments in engineering. Technicians are trained, examined, and certified. Instruments are calibrated. Procedures are approved. Records are maintained. On paper, compliance is well established.
BY JOHN DUENZL, FOUNDER, SIMPLIFI NII
Yet despite this, some organisations across the NDT sector encounter difficulties during audits, certification renewals, incident investigations, and regulatory reviews. These difficulties rarely stem from a complete absence of records. More often, they arise from an inability to reconstruct evidence to clearly demonstrate continuity, context, and defensible decision-making when questioned.
This article does not argue that standards are inadequate, nor does it propose alternative requirements. Instead, it examines a practical and increasingly common challenge: the gap between documented compliance and defensible evidence.
Records Exist, But Evidence Breaks Down
Most NDT organisations can readily produce certificates, calibration reports, training records, and inspection documentation. Individually, these records often meet the stated requirements of applicable standards.
However, when scrutiny increases, a different question emerges:
Can the organisation clearly demonstrate how those records connect over time?
Audits and reviews do not simply assess what exists. They often require organisations to demonstrate how compliance was achieved and maintained over time. This requires continuity not just documentation.
In practice, records are frequently distributed across multiple systems:
• Spreadsheets maintained by individuals
• Shared drives with evolving folder structures
• Emails containing critical attachments or approvals
• Paper records stored on-site or off-site
• Knowledge retained informally by experienced staff
Each of these systems can function adequately in isolation. The challenge emerges when evidence must be assembled quickly, consistently, and under pressure.
Fragmentation as the Primary Failure Mode
Compliance challenges are sometimes attributed to human error or administrative oversight. In reality, many difficulties are systemic.
Fragmentation occurs when:
• Responsibility for records is implicit rather than defined
• Information ownership changes with staff movement
• Records are created for immediate tasks, not longterm reconstruction
• Systems are optimised for daily operation rather than scrutiny
In such environments, compliance appears robust during routine activity but becomes fragile when challenged. The issue is not that records are missing, but that relationships between records are unclear or undocumented.
The following examples are not presented as standard requirements, but as common questions raised during scrutiny when reconstructing inspection history. For example, it may be possible to show:
• A technician’s certification
• An instrument’s calibration certificate
• An inspection report
Yet still be difficult to demonstrate:
• Which instrument configuration was used for a specific inspection
• Whether calibration context was appropriate for that application
• How experience was accumulated across multiple employers or projects

• How acceptance decisions can be supported using information available at the time This distinction is subtle, but critical.
The Difference Between Records and Evidence
Records are static artefacts.
Evidence is reconstructive.
Evidence allows an independent party to understand what occurred and whether it can be reasonably supported using information available at the time.
This distinction helps explain why audits rarely fail on missing certificates alone. Instead, they fail when continuity cannot be demonstrated, when information exists but cannot be reliably linked.
This is not a criticism of existing standards. Most standards deliberately avoid prescribing rigid systems, allowing flexibility across organisations of different sizes and operating models.
However, flexibility places greater responsibility on how systems are designed and implemented.
Modern NDT workforces are increasingly mobile. Contract-based engagement, project work, and crossborder employment are now common. While this provides flexibility and access to skills, it also introduces continuity risk.
Experience records are often stored and maintained by employers, even though experience itself accrues to individuals. When technicians move roles, records may remain technically compliant but practically inaccessible.
This can create challenges when:
• Experience must be demonstrated for certification renewal
• Employers change and records are incomplete or inconsistent
• Certification bodies request clarification beyond summary totals
• Incident investigations require historical context
These challenges are rarely intentional. They arise from systems that were designed for more stable employment models that no longer reflect operational reality.
Day-to-day operations place different demands on systems than audits or investigations. Under routine conditions, informal processes often suffice. Under scrutiny, they do not.
Audits do not break because information is absent. They break because information is fragmented.
Audits assess evidence against defined criteria, rather than relying on intent. When evidence cannot be produced efficiently or coherently, confidence is reduced, regardless of the quality of work originally performed.
This dynamic places significant pressure on technicians, supervisors, and quality managers, who may find themselves reconstructing history rather than performing technical work.
Across regulated industries, there is an observable shift away from people-dependent compliance toward system-based evidence models. This shift does not remove professional responsibility; it supports it.
System-based evidence:
• Reduces reliance on individual memory
• Improves continuity during staff turnover
• Enables faster, clearer audit responses
• Supports technicians without increasing administrative burden
This does not remove professional judgement or accountability, but supports it through clearer information structures.
Importantly, this shift does not require additional standards or oversight. It requires clearer thinking about how records are structured, connected, and retained over time.
What This Article Does — and Does Not — Claim
To avoid misinterpretation, it is important to be explicit:
• This article does not suggest that existing NDT standards are insufficient
• It does not propose new compliance requirements
• It does not criticise technicians, laboratories, or auditors
• No interpretation in this article should be read as extending or redefining any standard requirement
Instead, it highlights a practical reality: systems built for convenience may not withstand scrutiny, even when all required records exist.
Where readers interpret this differently, that difference itself illustrates how easily compliance intent can fragment across organisations.
Conclusion
Non-Destructive Testing relies on trust, in people, processes, and outcomes. That trust is reinforced not by the volume of records, but by the clarity of evidence those records can produce.
As the industry continues to evolve, so too must the systems that support professional practice. By focusing on continuity, context, and evidence reconstruction, organisations can reduce risk without increasing burden and strengthen confidence in the work they already perform.

About the Author: John Duenzl
John Duenzl is the founder of Simplifi NII, where he works at the intersection of non-destructive testing, compliance, and practical systems design. With more than two decades in the NDT industry, John has learned that most technical failures don’t come from bad inspections, they come from good people working with disconnected systems under pressure.
He spends his time helping inspection teams make compliance boring, evidence easy to find, and audits far less dramatic than they need to be. John believes that if a system only works when the “right person” is around, it isn’t finished yet.
When he’s not working with ultrasonic, EMAT, or inspection data systems, John enjoys translating complex standards into plain English, usually with a whiteboard, a question, and the occasional uncomfortable silence that leads to better thinking.
Join the vibrant team of volunteers at your local state branch and turn your passion for progress into action. Volunteer with us and connect with a community of professionals dedicated to making a difference in our industry.

Network with industry leaders and peers


The use of structural health monitoring systems on spacecraft structures can play a crucial role in ensuring the safety, reliability, and longevity of the structure by gathering and analyzing onboard sensor data.
DEMIS THOMAS, CAITRIN DUFFY-DENO, MICHAEL S. GRYGIER AND ROBERT E. GRADY
Of specific importance is monitoring for excessive loading at critical interfaces as any unexpected structural excitations experienced by spacecraft structures can cause early unpredicted high structural life consumption and/or damage. The availability and cost of flight-certified sensors along with the size of spacecraft structures and allowable payload mass drives the need for a method to estimate loads using sparselylocated sensors. Numerous approaches such as physicsbased, statistical learning, and physics-enhanced statistical learning algorithms have gained popularity among structural prognostics applications. However, developing noise-robust prediction models to assess loads and structural life predictions from a sparse multisensor data acquisition system can be a challenging task.
This paper discusses the evaluation of physics-based versus machine learning algorithms for predicting loads and structural life at mission-critical locations on the spacecraft structure using a finite element loads analysis with the application of simulated noise and noise reduction techniques.
To estimate the loads from accelerations, the physicsbased algorithm leverages a loads transformation matrix (LTM) from a Hurty-Craig-Bampton (HCB) reduced finite element model. A System Equivalent Reduction Expansion Process (SEREP) and a pseudoinverse approach are considered to expand from the onboard sensor degrees of freedom to the HCB model degrees of freedom. The machine learning algorithm provides a data-driven solution/mapping of the sensor
D. Thomas1, C. Duffy-Deno2, M. Grygier1, R. Grady3
accelerations to the loads at the mission-critical locations using a high dimensionality analysis. Although these strategies produce comparable loads prediction without noise, the limitations of these strategies with incorporating simulated noise and noise reduction techniques with low signal to noise ratio signals are evaluated. The study demonstrates the immense potential of statistical learning algorithms for sparse structural prognostic models and enhancing signal denoising techniques. These findings also highlight the need for noise-resilient prognostic models and low-noise data acquisition systems onboard spacecraft structures.
Existing methods for loads estimation for spacecraft center around reconstructing forcing functions using downlinked accelerometer time histories during dynamic events. The method for reconstructing forcing functions is a long-standing inverse problem investigated in the aerospace industry with various estimation techniques proposed based on a sum of the weighted accelerations1, integrating the sum of the weighted accelerations to obtain velocity and displacement, and solving the equations of motion2, or using a set of inverse system Markov parameters from a pulse response in which the role of input and output forces are switched3. In recent years, deep learning approaches infused with physics information have also been proposed for recovering forcing functions from kinematic response data4. Although these methods can be used for loads estimation during specific events like docking, the scope of the investigation of this paper involves assessing a much more stable, versatile, and noise-resilient near-real-time monitoring algorithm of applied loads at multiple critical interface locations from all operational, structurally dynamic activities induced at different locations on the spacecraft structure.
1Amentum, NASA Johnson Space Center, Mail Code JE38, Houston, TX 77058, USA 2HX5, LLC - Amentum JETS II Contract, NASA Johnson Space Center, Mail Code JE38, Houston, TX 77058, USA
3NASA Johnson Space Center, Mail Code ES6, Houston, TX 77058, USA
To assess the applicability of a structural health monitoring (SHM) loads estimation model for a spacecraft structure, a Hurty-Craig-Bampton (HCB) reduced finite element model5 of a modular space station structure with 2 primary elements, as shown in Figure 1, is utilized. Elements I & II are equipped with a set of accelerometers which can be modeled as point masses since they are small and lightweight relative to the size and mass of the structure. A loads transformation matrix (LTM) is obtained from the HCB model reduction, which enables a matrix transformation from the reduced model boundary grid displacements to the internal forces and moments. The forces and moments at three mission-critical interface locations on the space station are recovered- two at the solar array interfaces in Element I and one at the docking interface between the two elements. The HCB reduced model enables the efficient evaluation of sensor acceleration and loads responses to a large variety of forcing functions for various activities, including docking operations and plume impingement due to reaction control system firings from visiting vehicles. The analytical sensor node accelerations and the interface loads data required for the development and validation of the SHM prognostic model is generated by solving for the structural responses to either a set of forcing functions applied at the docking ports of Element II to represent docking and/or a set of exhaust plume surface interaction forcing functions applied on the surface elements of the spacecraft model using the modal equations of motion and the LTM from the HCB reduced model.
The analytical acceleration and loads response data generation process is displayed in Figure 2. A fatigue life consumption indicator is also computed for each critical interface, but evaluation of the fatigue life predictions is not within the scope of this paper.
The interface loads time histories and fatigue life consumption indicators must be predicted from onboard sensor accelerometer data for near-real-time structural health monitoring. Therefore, the following physicsbased and machine learning algorithms for predicting these loads time histories and fatigue life consumption indicators from the sensor acceleration responses are considered.
The physics-based algorithm leverages the LTM from the HCB reduced finite element model with the employment of a System Equivalent Reduction Expansion Process (SEREP)6 to predict the interface loads from the onboard sensor accelerations. The LTM from the HCB reduction is used to compute the loads at the critical interfaces from the HCB boundary displacements. The sensor displacements can be computed using a cumulative trapezoid integration from the sensor accelerations, but the sensor accelerations must be expanded from the sensor degrees of freedom to the HCB boundary degrees of freedom to be able to leverage the HCB LTM. SEREP is used to develop a transformation matrix to expand from the sensor degrees of freedom to the HCB boundary degrees of freedom.
SEREP is one of many reduction/expansion schemes to form a mapping between the very large set of finite element degrees of freedom and the relatively small set of sensor degrees of freedom using a modal projection.
The effectiveness of the SEREP expansion depends on selecting an optimal base of modes to achieve a good expansion from the sensor degrees of freedom to the HCB degrees of freedom.
This can be a computationally heavy process even with a moderate number of modes. A set of HCB boundary displacement responses to a set of docking and plume forcing functions are generated for the SEREP target
mode set selection process. A target mode set for the SEREP expansion is selecting by generating different combinations of the primary modes and selecting the mode set which gives the best displacement expansion from the sensor degrees of freedom to the HCB boundary degrees of freedom.
A simpler alternative to the tedious process of the selection of an optimal target mode set for the SEREP expansion was also evaluated using a Moore–Penrose generalized inverse (pseudo inverse)9 approach. The transformation matrix is computed using Equation 1 and the HCB model displacement responses from a docking or plume forcing function. Figure 3 outlines the structure and process of the physics-based loads estimation algorithms.
Transformation Matrix = [HCB Model Displacements] [Sensor Displacements]+ (1)
The machine learning algorithm provides a data-driven mapping of the sensor accelerations to the critical interface loads responses using a high dimensionality analysis.
The initial objective of the machine learning based algorithm was to establish whether a mapping can be established under a simplified scenario before applying it to more complex real-world scenarios.
Loads analysis responses of the HCB model to a set of simplified sine wave forcing functions within a limited frequency range applied at two different docking ports of Element II are used to train a multi-layer perception (MLP) neural network model. The input features for the machine learning model training are the analytical sensor acceleration time history responses to the
simplified sine wave forcing functions. The output features are the loads time history responses at the critical interface locations. To improve the performance of the machine learning model predictions, the training features are scaled by applying a min-max scaler which linearly scales down the training data into a fixed range. Two additional features are also added as input features to the sensor accelerations using the labels generated from a k-means clustering. Labels are assigned based on the sensor acceleration data at each time step and the sensor acceleration data in a 10 second interval. The MLP neural network model is trained with five fully-connected hidden layers and sigmoid activation functions to predict interface loads time histories.
Three studies will be discussed that were each designed based on findings from the preceding study. The physics-based and machine learning algorithms are assessed with and without the addition of simulated noise to the analytical sensor accelerations by evaluating the predicted interface loads responses. The baseline noise level to evaluate the performance of these algorithms with noise is based on the sensor accelerometer design maximum allowable spectral noise requirements for a modular space station SHM system.
Study I - The analytical and predicted interface loads time histories at the three interfaces from a set of 500 docking and 500 plume forcing functions are assessed using the SEREP and pseudo inverse algorithms with and without adding simulated noise as displayed in Figure 4 & 5. The forcing function behavior for docking tends to be transient with residual decay, whereas plume tends to be composed of a series of square waves. A 10 second example of the predicted interface loads time histories at the three interfaces from a docking forcing function response using the SEREP and pseudo inverse algorithm is presented in Figure 6. The Normalized Root Mean Square Error (NRMSE) values per each forcing function case were determined using the formula shown in
equation 2, where x represents the analytical loads time history, y represents the predicted loads time history, i is each sample, and N is the total number of samples, and Xmax and Xmin are the maximum and minimum analytical time history values, respectively. (2)
A docking forcing function response was used to generate the pseudo inverse expansion matrix. The pseudo inverse algorithm predictions perform better than the SEREP algorithm without noise for all elements except for a few plume forcing functions.
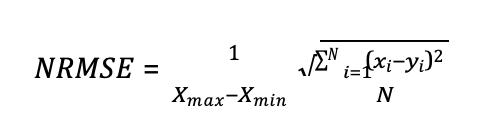
The performance of the SEREP algorithm is dependent on the mode set selected for the SEREP expansion. A mode set with 11 modes is selected from a set of primary modes for the SEREP expansion to give the best predictions for a large set of plume and docking forcing functions from the assessed mode combinations.
For the assessment with noise, the noisy sensor accelerations are filtered using a low pass infinite impulse response (IIR) filter but the accumulation of noise in the SEREP from the sensor degrees of freedom to the HCB degrees of freedom causes the predicted loads to be very large and incomparable to the analytical loads. The pseudo inverse method is also generally known to be unstable and highly sensitive to small perturbations in the data therefore even the slightest noise retained or accumulated after the filtering can lead to larger variations in the interface loads
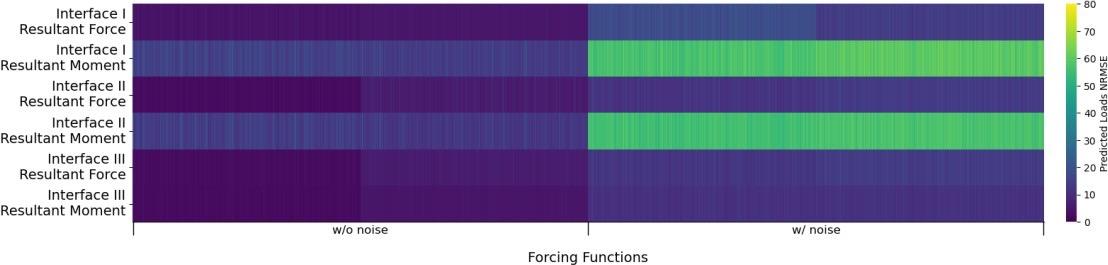
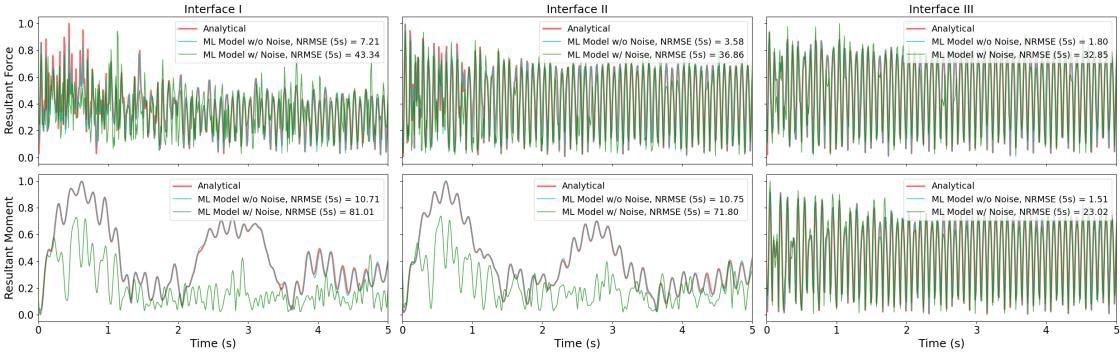
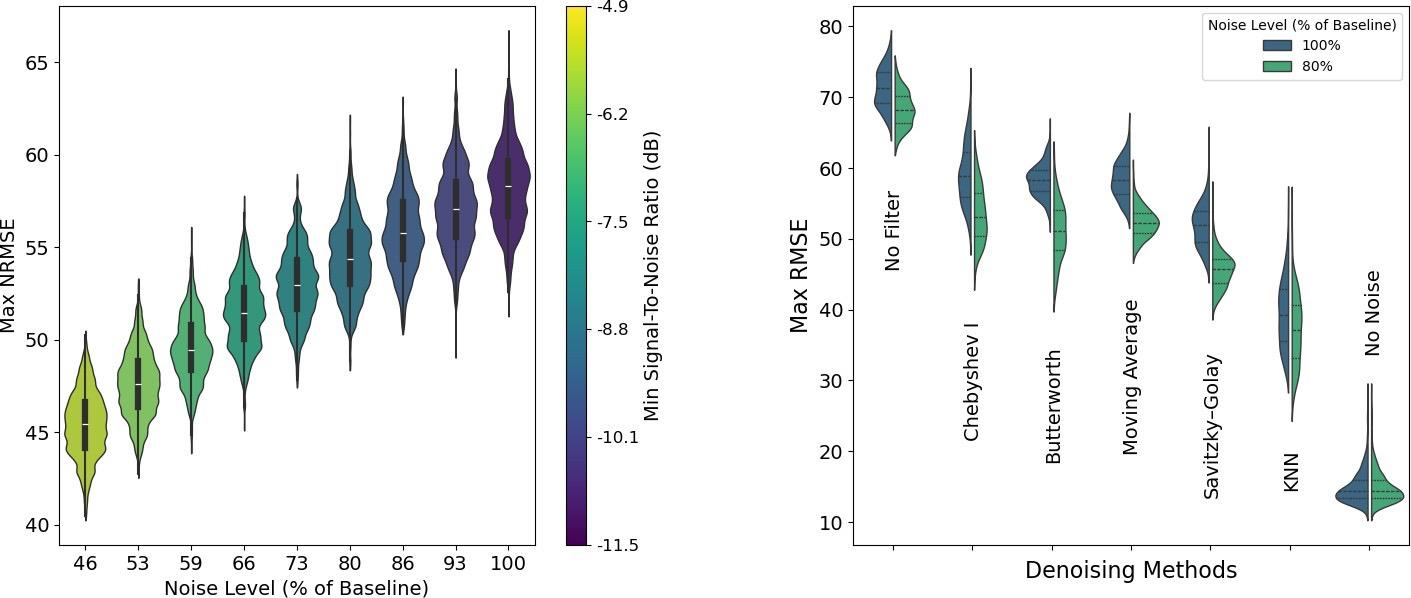
predictions. The predicted interface loads NRMSE for all three interfaces are very large for the SEREP and the pseudo inverse algorithms making these physics-based algorithms unreliable for applications with low signalto-noise ratios.
Study II - The analytical and predicted interface loads time histories at the three interfaces from a set of 1,000 simplified sine wave forcing function responses using
the machine learning approach with and without adding simulated noise to the analytical sensor acceleration is assessed in Study II as displayed in Figure 7. A 5 second example of the predicted interface loads time histories at the three interfaces from a simplified sine wave forcing function response using the machine learning approach is presented in Figure 8. The machine learning algorithm can perform very well without noise and is
also able to produce comparable results with noise unlike the physics-based algorithms.
Study III - The machine learning algorithm is also assessed with the simulated noise scaled down from the baseline noise level to evaluate performance at noise levels below the max allowable sensor noise. The predicted interface loads NRMSE across all degrees of freedom (DOF) with the machine learning algorithm assessed at different scales of the gaussian noise standard deviation for 1,000 forcing functions is presented in Figure 9a with the lowest accelerometer signal to noise ratio (SNR) across all degrees of freedom highlighted for each noise level. The SNR is calculated using Equation 3 where TS is the true signal without noise and NS is the noise signal applied to the analytical sensor accelerations.
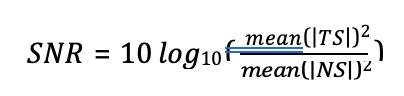
(3)
Different methods for denoising the noisy sensor accelerations with the baseline noise level are also assessed in study III including a k-nearest neighbor (KNN) learning-based approach for denoising the sensor accelerometer along with various conventional filters to improve the performance of the machine learning algorithm with noise10 as presented in Figure 9b. The KNN denoising method provides the best solution compared to conventional denoising/filtering methods. The KNN model is fitted with noisy sensor accelerations as the input feature and the analytical sensor accelerations as the output features. It stores the training dataset and uses a distance metric to identify nearest neighbors for denoising an unseen signal. The KNN denoising algorithm would require the operational noise profile for practical application. It is also limited by the size of the data fitted and may also be computationally heavy depending on the size of the training data.
Conclusion
The objective of these investigations was to assess the applicability of a near-real-time, continuous, and versatile loads estimation algorithm using sparse acceleration sensor data for the structural health monitoring of a modular space station to predict loads time history responses.
Studies I and II demonstrate the applicability of a physics-based and machine learning based loads estimation algorithm from accelerometer data.
Although these approaches produced comparable loads prediction without noise, the machine learning based algorithm displayed greater resilience to simulated noise. Studies II & III demonstrate the immense potential in further evaluating statistical learning algorithms for sparse structural prognostic models and signal denoising techniques.
These findings also highlight the need for noise-resilient prognostic models and low-noise data acquisition systems onboard spacecraft structures.
1. Carne, T.G., V.I. Bateman, and R.L. Mayes. Force Reconstruction Using a Sum of Weighted Accelerations Technique. in 10th International Modal Analysis Conference. 1992. San Diego, CA.
2. Genaro, G. and D.A. Rade. Input Force Identification in the Time Domain. in 16th International Modal Analysis Conference. 1998. Santa Barbara, CA.
3. Steltzner, A. D., & Kammer, D. C. Input force estimation using an inverse structural filter. Proceedings of the 17th International Modal Analysis Conference. 1991.
4. Shaikh, S. A., Cherukuri, H., & Khan, T. (2023). Recoverig the Forcing Function in Systems with One Degree of Freedom Using ANN and Physics Information. Algorithms, 16(5), 250.
5. Craig, R.R. and Bampton, M.C. (1968) ‘Coupling of Substructures for Dynamic Analyses’, AIAA Journal, 6(7).
6. O'Callahan,J.C., Avitabile,P., Riemer,R., "System Equivalent Reduction Expansion Process", Seventh International Modal Analysis Conference, Las Vegas, Nevada, February 1989.
7. Aglietti, G.S., Walker, S.J.I. and Kiley, A. (2012) ‘On the use of SEREP for satellite FEM validation’, Engineering Computations, 29(6).
8. Johansson, A.T. and Abrahamsson, T.J. (2011) ‘Selectig appropriate analytical mode basis for SEREPexpansion of experimental modes’, Conference Proceedings of the Society for Experimental Mechanics Series.
9. Moore, E. H. (1920). "On the reciprocal of the general algebraic matrix". Bulletin of the American Mathematical Society. 26 (9).
10. Engelsman, D., & Klein, I. (2023). Data-driven denoising of stationary accelerometer signals. Measurement, 218, 113218.
The realization of an efficient Structural Health Monitoring (SHM) system strongly depends on the availability of tools that can accurately detect the structural condition during operational life.
MARCO ESPOSITO, MATTEO SORRENTI, VINCENZO BISCOTTI AND MARCO GHERLONE
Marco Esposito, Assistant professor
Email: marco.esposito@polito.it. Department of Mechanical and Aerospace Engineering, Politecnico di Torino, Torino, Italy.
This detection can be achieved by means of physical sensors, which can provide information on the mechanical state of a structure. However, the installation of several sensors is often impractical or even impossible for systems operating in complex environments, such as aerospace, marine, and civil structures. In this context, the inverse Finite Element Method (iFEM) was developed. This algorithm is based on the finite element discretization of the structural domain. iFEM is able to reconstruct two physical quantities crucial for assessing the health status of a structure, the displacement and the stress fields, from a reduced number of easily installable physical strain sensors and without the need to know the loading conditions and the material properties.
The method is extremely accurate and computationally efficient. These characteristics make it suitable for the real-time monitoring of structures and crucial for feeding the SHM framework with sufficient data using only a few sensors installed.
Several works have proved the method’s accuracy when strain data are collected and processed offline. For the first time, this work presents an overview of the implementation of structural digital twins of several structures through the use of iFEM as a real-time monitoring system. In this study, both simple structures, such as a cantilevered beam, and more complex ones, such as a half-wing, are monitored live. In the presented applications, the data from the real structure is broadcast through an internet network so that the data from the sensors can feed the digital twin model remotely. These applications demonstrate that iFEM enables real-time monitoring, representing a significant step forward in the realization of the digital twin paradigm.
Introduction
The structural maintenance of aerospace, civil, and marine structures is often com-plex and costly. Structural Health Monitoring (SHM) techniques help
improve safety and reduce maintenance efforts [1]. In this context, the inverse Finite Element Method (iFEM) was developed [2]. This monitoring algorithm uses easily obtainable discrete strain sensor data to reconstruct key structural responses such as displacements and stresses. The method is inspired by FEM and is based on a Finite Element modelization of the structure.
iFEM has been successfully applied to the monitoring of marine, civil, and aerospace structures [3–6]. However, in all the existing applications, the method has been applied off-line, i.e., data collected from the sensors have been post-processed to feed the algorithm at the end of the loading process. In this paper, real-time monitoring with iFEM is performed. The iFEM structural model is continuously fed with strain data, and the digi-tal model is updated with the computed displacements at each time step. This procedure led to the realization of a proper structural digital twin.
The digital twin has been successfully implemented for two structures with an in-creasing level of complexity: a cantilevered aluminum beam and the half-wing of a commercial aero-model. Different communication systems between the sensors and the model are evaluated: serial communication is considered for the beam, whereas a Wi-Fi TCP/IP communication protocol is used for the half-wing. Moreover, for the halfwing, a recently developed formulation of iFEM, the Single Sensor Based iFEM (SSB-iFEM) [7], is tested. This formulation removes the standard iFEM requirement for back-to-back sensors, allowing the sensorization of thin-walled structures with single-sided sensor configurations.
The performed experimental tests on the two structures prove the impressive accu-racy and efficiency of iFEM and SSB-iFEM. These characteristics allowed the two formulations to successfully implement a proper structural digital twin for structures with different features and sensor setups.
Ifem And Ssb-Ifem Formulations
This section introduces the iFEM and its Single Sensor Based (SSB) enriched for-mulation. The iFEM is based on the discretization of the structural domain into
finite elements (FE). It allows for the computation of the FE discretized displacement field of a deformed structure by minimizing, in a least-squares sense, a functional based on the error between the analytical and the experimental strains measured in some discrete locations on the structure. In its original formulation for shell elements [2], the iFEM error functional is not based directly on the strain measurements. Firstly, they must be converted into strain measures. The analytical strain measures are defined in the context of Firstorder Shear Deformation Theory for thin plates and shells as derivatives of the theory’s kinematic variables (displacements and bending rotations) [8]. The top and bot-tom in-plane strain measurements and transverse shear measurements, respectively ε+, ε , and εt, relate to the strain measures, ek, through simple expressions:

where t is half of the thickness of the structure, and the strain measures, ek, are sub-divided into membrane (k = 1, 2, 3), bending (k = 4, 5, 6), and transverse shear ones (k = 7, 8). To compute the error functional associated with each inverse element, the analytical strain measures are related to the nodal degrees of freedom (DOFs) of the element, ue, through proper shape function derivatives [9]. Similarly, Eq. 1 is used to compute the experimental strain measures, em, from the experimental strain measurements:

This operation requires the back-to-back in-plane strain measurements, (εm)+ and (εm)−, on the top and bottom surface of the corresponding inverse element. The resulting ex-pression for the iFEM error functional is the following:

where Ae is the area of the inverse element, the coefficient we guarantees the dimensional consistency between the strain measures [8], and the coefficient λe is used to account for sparse strain sensor configurations. It is set to 1 if the corresponding strain measure is measured, or to a small value (10−5) if it is not: for instance, since the transverse shear strains are not measurable through strain sensors, the values of λe for k = 7, 8 are always set to 10−5.
To directly compare the SSB formulation to the original one, the SSB-iFEM func-tional is presented hereafter:

It can be noticed immediately that the SSB formulation does not make use of the strain measures: the error is based on the strain measurements, and the eight terms
that are summed in the functional are now related to the three components of the in-plane strain measurements, either on the top (k = 1, 2, 3), or on the bottom (k = 4, 5, 6) of the element, and to the transverse shear strain measurements (k = 7, 8). Notably, as per Eq. 2, the transverse shear strain measures and the corresponding measurements coincide; thus, the related terms in the functionals are identical. On the contrary, the use of the in-plane measurements substantiates the difference between the two formulations. As the SSB-iFEM does not require the computation of the strain measures, single-sided sensor configurations are now employable: in such cases, similarly to the iFEM, the coefficients (λ′ ) e corresponding to the unknown strain measurements are set to 10−5. For both iFEM and SSB-iFEM, the minimization of the error functional with respect to the nodal DOFs leads to a system of linear algebraic equations:
To compute the vector of the global DOFs, U, the local contributions of the element coefficient matrix, ke or (ke)′ , and constant vector, fe or (f e)′ , as in the standard FEM assembly procedure, are used to generate the system of linear global algebraic equations,
where F takes into account the mesh, the strain sensor configuration, and the values of the discrete strain measurements, whereas K takes into account only the mesh and the strain sensor configuration. Therefore, it can be observed that the algebraic system is independent of the material properties and loading conditions of the structure and can be solved indifferently under static and dynamic loads. Moreover, it is important to highlight that the matrix K does not change for a selected sensor configuration. This observation can be exploited to achieve the real-time monitoring of the displacement of a structure through iFEM and SSB-iFEM: the inversion of the matrix, which has a high computational cost, is performed only once. Thus, the real-time computation of U is possible, as it requires only matrix-by-vector multiplications.
In this work, two structures with different characteristics and sensorization schemes are analyzed to prove the versatility of iFEM. Furthermore, the two presented iFEM formulations best adapt to each of the selected test cases. Therefore, the live monitoring capabilities of iFEM are verified in different scenarios.
To demonstrate the live monitoring capabilities of iFEM, initially, a simple struc-ture is used: a cantilevered
aluminum beam made of 7075 T6 alloy, 3 mm thick. As highlighted in [7], the displacements of flat plate structures can only be reconstructed using the standard iFEM formulation, with a back-to-back configuration of strain sen-sors. Consequently, for this structure, eight mono-axial strain gauges are installed in a backto-back layout to measure the axial strain along the x-direction in four locations. The beam geometry and sensor layout are shown in Fig. 1. The iFEM discretization is also presented in Fig. 1. It consists of 4 iQS4 elements with a total of 10 nodes.
For this application, the strain data are recorded through an acquisition system based on Arduino and Hx711 A/D 24-bit converters developed for this experiment. This system is connected and shares the sensors’ data with a computer through a serial communica-tion port. On the computer, the standard iFEM algorithm is implemented and fed with the strain data in real-time.
The beam is clamped on one end during the experiment, and transverse loads are applied manually at various points along the beam. The strain data, acquired at a fre-quency of 50 Hz, are processed with the standard iFEM to reconstruct the displacements and, from them, the stress fields. In the animated figure 2, it is possible to watch some extracted frames from the experiment. The entire experiment video can be watched at https:// youtu.be/UZSije1ikhw. The system is responsive and accurate, with no noticeable reconstruction delay.
The second experiment is a more complex one that is performed to demonstrate the impressive versatility of SSB-iFEM. The monitored structure is the half-wing of a commercial hotliner produced by the Robbe modelsport company, Fig. 3. More specifically, the selected one is the ”Limit PRO” hotliner, with a Glass-Fiber-Reinforced Polymer/Carbon-Fiber-Reinforced Polymer (GFRP/ CFRP) structure. This test is partic-ularly significant since it focuses on a commercial product, and the manufacturer has not released information on the geometry and material characteristics. Moreover, the internal surfaces of the half-wing are not accessible. For these reasons, the recently for-mulated SSB-iFEM represents the only feasible choice for the monitoring. In fact, the method allows for the sensorization of the thin-walled structure’s sole external surface, widening the standard iFEM’s applications. Moreover, although the material properties are not known, both the iFEM and the SSB-iFEM can still perform the displacement and strain field reconstruction, as only the geometrical properties of the structure are needed. The geometrical features were derived through a reverse engineering process employing computed tomography. The data retrieved through this process are summarized in Fig. 4, and include the thickness of the skin, t = 1.45 mm. No information about the internal wing-box is presented, as it is not needed to reconstruct the whole displacement field of the half-wing outer shape.
Fig. 4 also shows the strain sensor configuration adopted for the application. In this case, fiber optic distributed strain sensors based on the Rayleigh backscatter principle are used. In particular, six measuring
lines along the wingspan are installed by means of a unique optical fiber. Three lines are placed on the upper surface and three on the lower surface of the half-wing. The adopted fiber sensor has a high density of sensing locations on the fiber, which enables the sensorization of all the elements of the inverse mesh (Fig. 4) that lie underneath the sensor.
The first analysis performed on the specimen is a static test to validate the accuracy of the SSB-iFEM for this application. This test is performed by applying a concentrated transverse load Fz at the tip of the wing
(Figs. 3 and 4). The root of the wing is clamped through aluminum blocks fixed on a test bench. The structure is mounted upside down, so that the application of the weights generates a load that is in the same direction as the lift in operative conditions. To asses the accuracy of the displacement reconstruction, two transverse deflections (w1, w2) of the wing are measured on the upper surface of the half-wing employing two timeof-flight laser sensors. One deflection (w3), on the lower surface, is measured with an LVDT. The sensors are distributed on the surfaces as shown in Fig. 4. The static test results are reported in Table I and show very accurate reconstruction of the measured displacements, with errors that do not exceed 5.6% and that are very small (1.1%) for the maximum measured displacement, i.e., w1.
Once the method’s accuracy is verified, its real-time capabilities are tested. This test case represents a more challenging application with respect to the aluminum beam for multiple reasons.
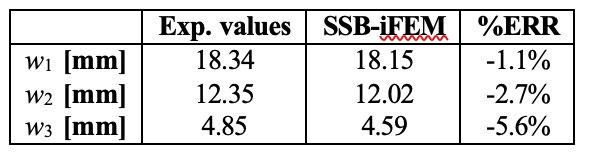
The inverse model of the structure consists of 941 elements and 994 nodes. The model size has an impact on the computational cost for real-time reconstructions. Moreover, the amount of information from the strain sensors is sensibly higher and requires a significant data exchange between the sensing and computing systems. For this experiment, the communication system between the sensors and the computer running SSB-iFEM is more complex. The strain data from the fiber sensors are acquired using a Luna ODISI 6100 acquisition system. The data are then streamed to the com-puting system through a Wi-Fi TCP/IP protocol, and the data packets are elaborated in real-time to reconstruct the displacement and strain field with SSB-iFEM. The stresses cannot be computed since the material characteristics are not disclosed for this applica-tion. The Von Mises strains are computed and plotted together with the displacement field, instead. The test is run using the maximum acquisition frequency of the ODISI 6100 system, i.e., 12.5 Hz. This limit is imposed by the acquisition system technology, and not by SSB-iFEM or the computing system. The final result of the real-time moni-toring, when loading the wing dynamically by hand, is shown in the animated Fig. 5. A more detailed video of the experiment can be seen at https://youtu.be/xV8KFxSgB0A. The video proves the realization of a structural digital twin for a representative aerospace commercial structure.
Concluding Remarks
This paper presents two experimental applications of the inverse Finite Element Method (iFEM) for the realtime monitoring of structures. Two test cases and two dif-ferent formulations of the iFEM are considered. The first test case is a simple one, a cantilevered aluminum beam, and is analyzed using the standard iFEM formulation. The second experiment consists of the real-time monitoring of the half-wing of a commercial hotliner aero-model. For this application, a novel iFEM formulation, the SSB-iFEM, is used. This formulation allows for the sensorization of the structure with sensors on one surface only, removing the constraint of backto-back sensor configurations. The two experiments show that the iFEM is computationally efficient in both its formulations and can manage the real-time monitoring of simple and complex structures receiving streaming data from different sensors via different communication protocols. For both experiments, a structural digital twin is successfully realized with iFEM.
Acknowledgment
Vincenzo Biscotti acknowledge the support of the Italian Ministry of University and Research and the Sustainable Mobility Center through the project PNRR - M4C2 - CNMS - Spoke 1, funded under the
scheme CN00000023 - PNRR – M4C2 Inv. 1.4 with grant agreement num. 55 PRR22 1155 22 GG002138. The authors gratefully ac-knowledge the Fondazione Compagnia di San Paolo for supporting this research activity by funding the DIMOSS project in the framework of the PoC Instrument 2022/2024, cut-off 3.
References
1. Farrar, C. R. and K. Worden. 2007. “An Introduction to Structural Health Monitoring,” Philo-sophical Transactions of the Royal Society A: Mathematical, Physical and Engineering Sci-ences, 365(1851):303–315, ISSN 1364503X, doi:https://doi.org/10.1098/ rsta.2006.1928.
2. Tessler, A. and J. L. Spangler. 2005. “A least-squares variational method for full-field recon-struction of elastic deformations in shear-deformable plates and shells,” Computer Methods in Applied Mechanics and Engineering, 194:327–339, ISSN 00457825, doi:10.1016/j.cma. 2004.03.015.
3. Kefal, A. 2019. “An efficient curved inverseshell element for shape sensing and structural health monitoring of cylindrical marine structures,” Ocean Engineering, 188:106262, ISSN 0029-8018, doi:https://doi.org/10.1016/j. oceaneng.2019.106262.
4. Wang, J., L. Ren, R. You, T. Jiang, Z. Jia, and G. xin Wang. 2021. “Experimental study of pipeline deformation monitoring using the inverse finite element method based on the iBeam3 element,” Measurement, 184:109881, ISSN 0263-2241, doi:https://doi.org/10.1016/ j.measurement.2021.109881.
5. Miller, E. J., R. Manalo, and A. Tessler. 2016. “FullField Reconstruction of Structural Defor-mations and Loads from Measured Strain Data on a Wing Using the Inverse Finite Element Method,” Report NASA/TM2016-219407, NASA; Edwards, CA United States.
6. Oboe, D., L. Colombo, C. Sbarufatti, and M. Giglio. 2021. “Shape sensing of a complex aeronautical structure with inverse Finite Element Method,” Sensors, 21(4), ISSN 1424-8220, doi:10.3390/ s21041388.
7. Biscotti, V., M. Esposito, and M. Gherlone. 2025.“A new Single Sensor Based iFEM formu-lation for shapesensing of thin-walled structures instrumented with single-sided sensor con-figurations: Formulation, numerical assessment, and experimental validation,” Mechanical Systems and Signal Processing, 232:112700, ISSN 0888-3270, doi:https://doi. org/10.1016/j. ymssp.2025.112700.
8. Esposito, M., M. Mattone, and M. Gherlone. 2022. “Experimental Shape Sensing and Load Identification on a Stiffened Panel: A Comparative Study,” Sensors, 22, ISSN 14248220, doi:10.3390/s22031064.
9. 016. “A quadrilateral inverse-shell element with drilling degrees of freedom for shape sensing and structural health monitor-ing,” Engineering Science and Technology, an International Journal, 19:1299–1313, ISSN 22150986, doi:10.1016/j. jestch.2016.03.006.
20 to 22 April 2026 | Newcastle, Australia
The 2025 AINDT Summit will bring together industry leaders, innovators, and NDT professionals for three days of knowledge sharing, networking, and professional development in Newcastle from 18 to 20 November 2025. With the theme The Power of Inspection, the Summit will explore how inspection services deliver crucial insights about critical assets across industries. This timely theme also addresses Australia's evolving energy landscape and the expanding role of inspection services in supporting our future energy infrastructure.
For further information, visit: aindt.com.au
The 17th Asia Pacific Conference for Non-Destructive Testing (APCNDT)
11 to 14 May 2026 | Hawaii, USA
APCNDT is set to be an unmissable event for NDT professionals across the globe. Held under the theme Breaking Barriers: NDT Solutions for a Changing World – Innovate, Adapt, Transform, this premier conference will showcase the latest innovations and emerging technologies that are redefining non-destructive testing. Attendees will have the opportunity to connect with global experts, share knowledge, and explore new solutions to address the evolving challenges faced by industries worldwide. Join us to discover how NDT is driving transformation, and paving the way for a dynamic future.
For further information, visit: apcndt2026.com
19 to 21 May 2026 | Lyon, France
COFREND Days 2026 is one of Europe’s premier international events dedicated to Non-Destructive Testing (NDT). The three-day program combines technical conferences, plenary sessions, workshops and an extensive exhibition, featuring over 160 scientific presentations and more than 80 exhibitors. It brings together industry professionals, researchers, equipment providers and educators to showcase innovation, exchange knowledge and explore NDT applications across sectors like aerospace, energy, civil engineering and petrochemicals.
For further information, visit: cofrend2026.com
The 14th European Conference on NonDestructive Testing (ECNDT 2026)
15 to 19 June 2026 | Verona, Italy
ECNDT 2026 is a leading international event hosted by the European Federation for Non-Destructive Testing. Bringing together experts, researchers, and professionals, the conference is a hub for sharing innovation, research, and emerging technologies shaping the future of inspection and quality assurance. The program features technical presentations and case studies across a range of sectors, complemented by a dynamic exhibition. This connection between research and practical application encourages collaboration, networking, and advancement of NDT worldwide.
For further information, visit: ecndt2026.org
European Workshop on Structural Health Monitoring
7 to 10 July 2026 | Toulouse, France
Organised every two years, EWSHM is the main European event dedicated to structural health monitoring, a key technology for infrastructure maintenance and integrity monitoring. This unmissable event attracts worldrenowned experts from the academic and industrial sectors, as well as from research laboratories around the world, to discuss innovations and applications in this constantly evolving field. This year, the always-popular event will be held in, Toulouse (France), a city known for its aeronautics and space industry.
For further information, visit: ewshm2026.com
12 to 15 October 2026 | Ohio, USA
ASNT 2026 is your opportunity to experience the very best of non-destructive testing—innovations, insights, and the people shaping what comes next. Over four days, thousands of professionals come together to learn, connect, and explore the technologies and approaches advancing the field. With over 100 technical sessions, 200 exhibitors, technical talks will cover all the major methods and industries, the latest on codes and standards, and new innovations. The theme, Together We Lead, reflects a shared commitment to progress.
For further information, visit: asnt.org/events/asnt-2026
NDT: Ionix Expands Its Inspection Portfolio
Phased array inspection at elevated temperatures remains one of the hardest challenges in NDT. Probes degrade, signals drift, and thermal instability can make it difficult to gather reliable data, especially when inspections need to take place on live assets. Conventional probes aren’t built to survive these conditions, so inspectors need tools to deliver stable performance where others fail.
The HotSense HeatMaster Kit is built specifically for high temperature PAUT corrosion inspection, enabling true on stream corrosion mapping during elevated temperature surveys. Compatible with a range of linear arrays (10, 11, 12, 32, 32), it offers continuous operation up to 200°C with no duty cycling. Its low profile design integrates easily with high temperature crawlers and

Efficient Automated Inspection and Quality Control with ECO Line X-ray Systems
VisiConsult’s ECO Line X-ray inspection systems deliver a robust, cost-effective platform for industrial non-destructive testing with strong emphasis on automation and rapid quality assurance.
Designed for demanding production environments, ECO systems integrate full CNC-controlled inspection sequences that allow users to automate repetitive workflows and reduce manual intervention, streamlining throughput while maintaining consistent imaging quality. The standardised design and intuitive software enable fast deployment and quick adoption on the shop floor, minimising training needs and accelerating time to inspection readiness.
Active in the NDT industry since 1978, Charlie Panos has over 40 years of experience. He provides International Tube Testing (ITT) was established by Charlie Panos in 2000. With over 40 years of industry experience, Charlie has in-depth expertise and qualifications in the engineering, testing and inspection industry.
ITT was formed to fill a growing need for accurate, dependable specialised engineering testing services. ITT provides specialised IRIS and RFT tube testing and has tested almost every boiler design in the process,
scanners, while TempCheck indicators help prevent overheating.
A water free, glycol based cooling system keeps the probe stable without the need for shutdowns or complex cooling setups. The couplant delivery system allows silicone based, pumpable couplants to be applied directly to the hot surface, and an optional cable management system protects cables, couplant lines, and cooling tubes during inspections.
With Ionix’s compensation guidance, inspectors can achieve consistent, accurate, and repeatable measurements even in extreme environments. While most PAUT performance fails as temperatures rise, the HeatMaster reverses that expectation, delivering stable, on stream capability that transforms a difficult inspection into something workable.
For more information or support, contact Ionix at contact@ionix.at or our in country partner ASGNDT Supplies at chris@asgndtsupplies.com.
A key advantage is built-in Automated Defect Recognition (ADR) capabilities — powered by advanced image processing and AI-derived algorithms — which support automatic detection and measurement of porosity, inclusions, cracks and other anomaly types. With definable criteria for defect size, density and spatial metrics, ADR facilitates repeatable, high-confidence evaluations that reduce operator variability and enable faster, more reliable quality control decisions. Combined with powerful image enhancement tools and real-time inspection macros, the ECO Line empowers NDT teams to increase throughput, improve defect visibility, and optimise inspection efficiency across a wide range of components.
VisiConsult’s full range of standard and customdesigned X-ray inspection systems are available through AXT. For more details contact info@axt.com.au or call 02 9450 1359.
petrochemical and power industries in Australia, the Pacific Islands, Papua New Guinea, Indonesia, Malaysia, Philippines and India.
The company can test tube sizes from 16mm up to 200mm, including straight tubes and tubes with bends for industries as diverse as pulp and paper, fabrication, maritime and aerospace.
ITT prides itself on delivering personalised, ethical service every time and has the field proven experience, technology and determination to ensure all your requirements are exceeded.
For further information, visit: tubetesting.com.au
OMS is the only all-in-one NDT business management software, verified for vulnerability, and boosted with AI (Augmented Intelligence) advanced LIMS to manage Laboratory’s Operations Management Systems as per ISO 17025, ISO 17020, NATA, ISO 9001.
OMS executes mundane repetitive tasks, 24/7 for NDT, inspection, metallurgy, mechanical and chemical testing and hydro pressure testing. The system can generate one-click reports instantly, complying with standards and NATA, and without transcription errors. It facilitates secure signing of reports, and emails without an external email program.
OMS includes automation for accounts book-keeping, timesheet, productivity reports, auto-debt collection, assets and calibration, staff inductions and certificates, document SharePoint, CRM, quotations, and more.
Russell Fraser Sales
Russell Fraser Sales (RFS), a leading supplier of NonDestructive Testing (NDT) and inspection equipment, is proud to announce they have recently joined the Cebeco Group — strengthening their position as Australia’s trusted partner in NDT solutions. Bending the Limits of DR Carestream INDUSTREX HPXARC is a revolutionary, bendable digital radiography (DR) design. It conforms to various objects and quickly delivers the high-resolution images you need for gamechanging speed and certainty.
The Carestream INDUSTREX HPX-ARC 1043 PH is a 98 µm detector that delivers high-resolution images for better defect recognition and code compliance in a smooth and bendable design. With bendable DR Technology, customers will realize

Industries
Smartchem Industries is your trusted partner for magnetic particle and dye penetrant requirements, with over 100 years’ combined experience in the manufacture and distribution of magnetic particle and dye penetrant consumables. Smartchem is 100% Australian owned and proudly manufactures in Australia with Australian resources where possible. Smartchem prides itself on service, both technical and in the delivery of their products.
The Smartcheck MPI range complies with the requirements ISO-9934.2 and other relevant standards. The Smartcheck dye penetrant range has been third party type tested to ISO 3452.2 by MPA Hanover in Germany, including Smartcheck Dye Pen Fluoro—a level 3 water washable/solvent removable fluorescent dye
OMS can save companies up to $200,000 per annum per branch by eliminating most IT hardware (computers, servers, laptops), software (Windows, MS Office, Antivirus) and human resources cost, NCRs, QA and rework cost.
OMS saves you time by eliminating data entry multiple times, by replacing several fragmented generic apps, at the cost of one coffee per day. It provides continuous automation and addition of features at no extra cost by 33 programmers and subject matter experts. Plus, OMS doesn’t charge any upfront cost for implementation, customisation or training, and there are no lock-in contracts, and zero exit fees.
OMS includes customised modules for VT, MT, PT, ET, RT, RTT, UT, UTT, PAUT, TOFD, Vacuum box, VI, PVI, Tank, Weld Supervision, Coatings, Hydro, PMI, CA and all mechanical testing. Since 2009, OMS is validated for over two million use-hours.
Email: systems@omssoftware.com.au to learn more.
easier set-up, faster time to image, less dose required to capture images, and instant image processing versus film or CR. It has the flexibility to go from a flat position down to a 4-inch diameter to get next level images instantly. No film, no chemistry, and no plates. You get an incredibly simpler workflow and instant access to images that drive better operational outcome.
Powerful Software INDUSTREX Digital Viewing Software incorporates industry-leading image analysis tools, file sharing and storage management features. Our modular architecture is an all-in-one software suite that eliminates the need to purchase add-on modules for both CR and DR image acquisition.
Explore our Digital Radiographic products range at www.carestream.com/en/us/nondestructive-testingndt-solutions
complete product range at www.rfsales.com.au or call (02) 9545 4433 to speak with an NDT specialist today.
penetrant. All CoC and SDS are available on the website which is a useful reference tool for an audit or where a copy is required in the field.
SmartChem is the exclusive distributor for the Matcon range of magnets and equipment. They are also exclusive distributors for Promag UV lights and equipment.
SmartChem supplies direct and has a comprehensive network of resellers. Heatleys Safety and Industrial (heatleys.com.au) are their exclusive distributor in Western Australia, while Accurate Instruments (accurate.kiwi) cover both the North and South islands in New Zealand. For distributors on the east coast of Australia, contact Smartchem direct.
Quality products and service at a reasonable price, that’s the Smartchem difference.
For further information, visit: smartchem.com.au

TraceMATE Passport is a digital technician logbook and compliance record system designed specifically for the realities of non-destructive testing.
Developed in Australia by Simplifi NII, TraceMATE Passport gives NDT technicians a structured, standardsaligned way to capture experience, certification history, training records, and competency evidence without relying on spreadsheets, scattered PDFs, or memory during audits.
Unlike generic form builders or HR systems, TraceMATE Passport is purpose-built around the intent of ISO 9712 and related certification frameworks. It allows technicians to maintain a single, portable record of
With 35,000 professionals across 60 countries, Wood PLC is one of the world's leading consulting and engineering companies operating across Energy and Resources markets.
Here in Australia, the broad range of services they offer their clients includes machinery vibration and lubrication analysis for all types of equipment, across all industries. Their certified personnel can provide end-to-end routine measurement, analysis, and reporting; alternatively, they will supplement your people to match your needs. They are vendor-agnostic and work with a wide range of wireless, wired, and portable hardware and software platforms to provide routine and troubleshooting services to the very highest level.
But Wood does not stop at finding and diagnosing problems – from skid to piping to vessel, they have an unrivalled track record of engineering actionable
their professional history that travels with them across employers, projects, and certification bodies.
For inspection companies, TraceMATE Passport reduces audit risk by improving the quality, consistency, and traceability of technician evidence before it is ever requested. For technicians, it removes the administrative burden and uncertainty that often appears during certification renewals, employer changes, or third-party audits.
The system is designed to support calm, evidence-led recertifications rather than last-minute reconstruction of records. Information is captured once, structured correctly, and maintained continuously.
TraceMATE Passport is part of the broader TraceMATE compliance ecosystem, developed to support audit readiness, asset traceability, and technician accountability across the NDT industry, without increasing administrative load.
For more information, visit: simplifi-nii.com.au
solutions. They also offer machinery alignment and balancing, optical motion amplification, thermography, bearing failure analysis, root cause analysis facilitation, FEAs, flow analysis, noise studies and much more.
And, they practice what they teach. Wood offer vibration and lubrication analysis training per ISO 18436 Parts 1 to 4, with optional AINDT certification. Their public courses are delivered in Perth and Brisbane by active principal practitioners with decades of experience. Alternatively, they can provide bespoke courses at your site or venue.
Wood currently offers LCAT1, VCAT1 and VCAT2 training, and will be expanding our catalogue soon. The LCAT I and VCAT I courses each provide three days of training, plus a two-hour certification examination. The VCAT2 duration is four days of training, plus a three-hour certification examination.
For further information, visit: https://vdn.woodplc.com
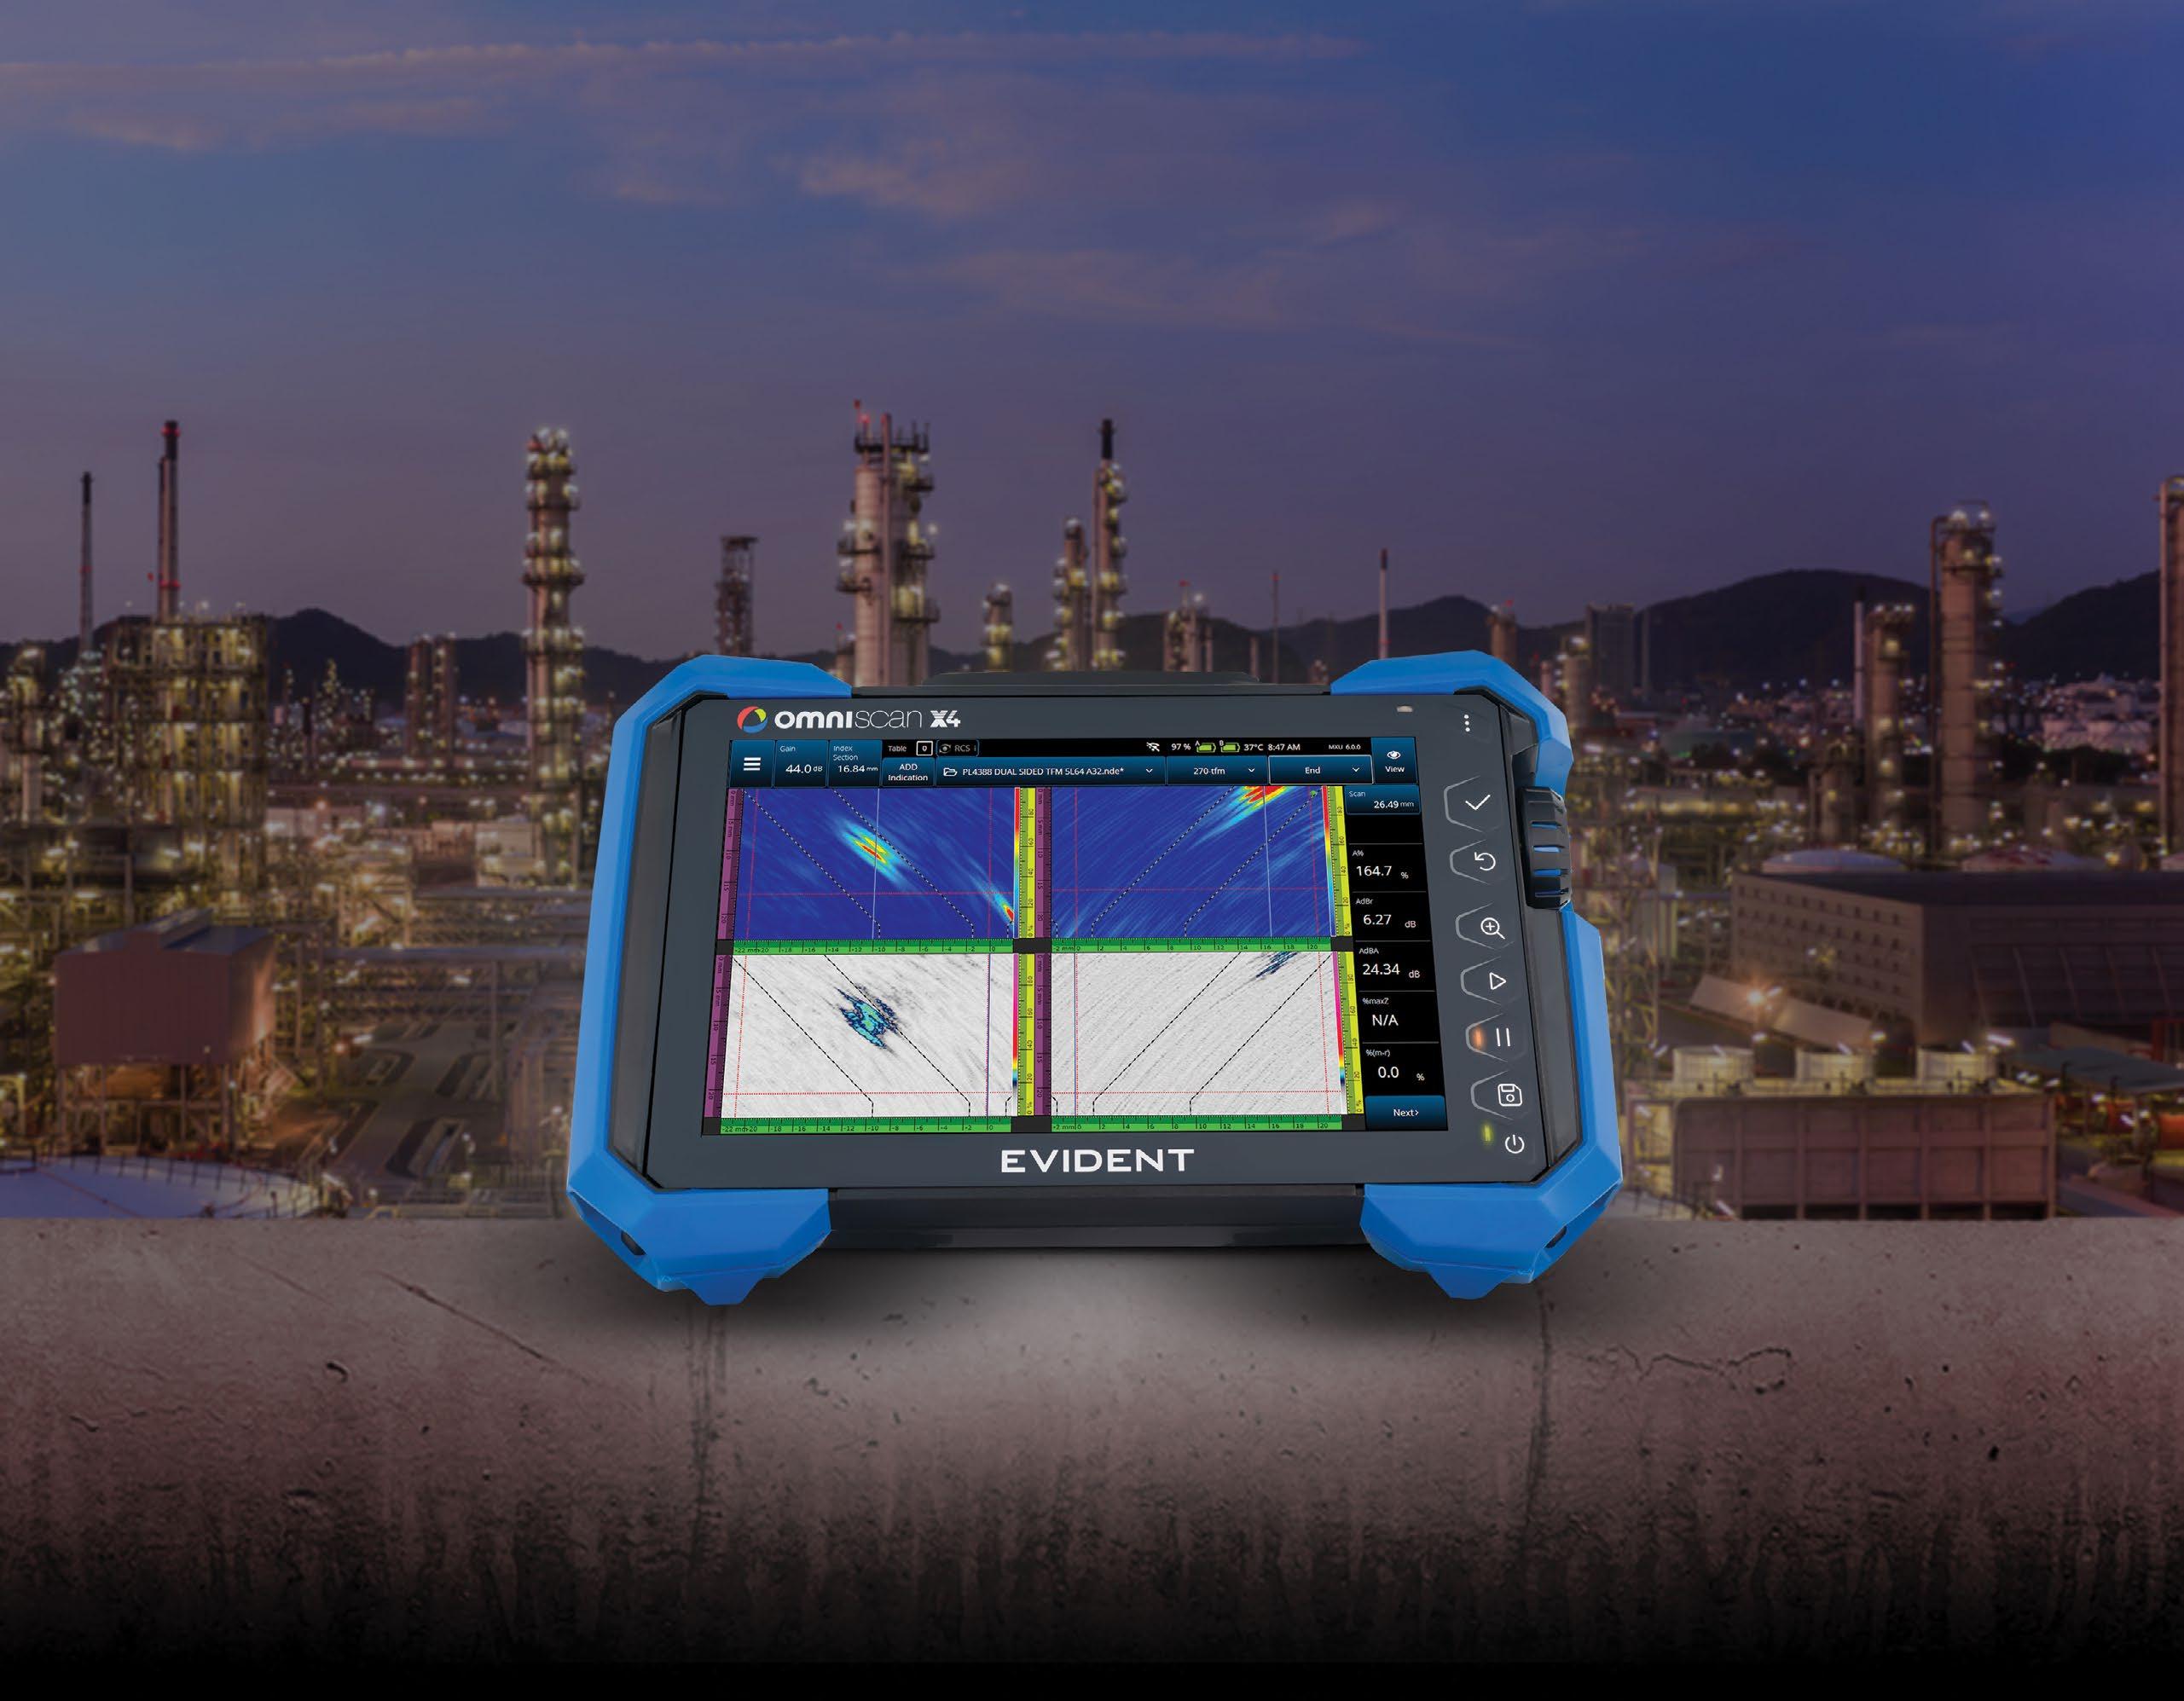
Engineered for Speed & Simplicity
Advanced imaging technology and an easy-to-use interface allow users of all skill levels to perform fast, accurate inspections—boosting performance and streamlining workflows.
Proven to Perform, Trusted to Deliver
An all-in-one imaging platform, coupled with unmatched portability and versatility, delivers exceptional results in even the most challenging inspection environments.
Designed to Evolve with Your Needs
With free quarterly software updates, the OmniScan X4 empowers you to continuously adapt to future inspection needs—ensuring that you’re always ready for what’s next.