lt al M u ilingua
lE n
I nte
tio
rn
ion
di
at
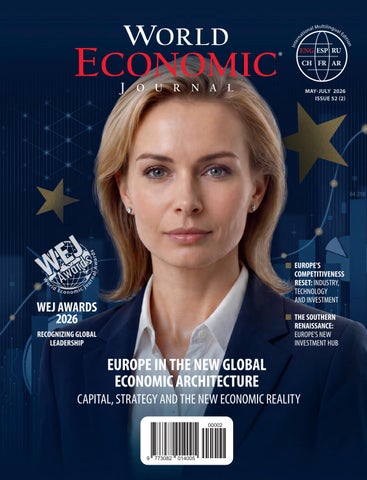
MAY-JULY 2026 ISSUE 52 (2)
E UROPE’S COMPETITIVENESS RESET: INDUSTRY, TECHNOLOGY AND INVESTMENT
WEJ AWARDS 2026
T HE SOUTHERN RENAISSANCE: EUROPE’S NEW INVESTMENT HUB
RECOGNIZING GLOBAL LEADERSHIP
EUROPE IN THE NEW GLOBAL ECONOMIC ARCHITECTURE
CAPITAL, STRATEGY AND THE NEW ECONOMIC REALITY 00002
9 773082
014005
VILLA ATALAYA — A STATEMENT OF CONTEMPORARY MEDITERRANEAN ELEGANCE
PRICE 4 500 000€ 6 EN-SUITE BEDROOMS 653 M² BUILT 2,059 M² PLOT *The price does not include taxes, notary fees, registration fees or administrative expenses.
Overlooking the coastline of Sant Andreu de Llavaneres, Villa Atalaya is a residence conceived as a private architectural retreat where scale, design and landscape exist in perfect balance. Bold contemporary volumes, sculptural lines and expansive living spaces define the character of the villa, while carefully framed sea views create a constant sense of openness and sophistication. The property offers 653 m² of refined interiors on a private 2,059 m² plot, featuring 6 en-suite bedrooms, panoramic terraces, landscaped gardens and a spectacular swimming pool designed for elevated outdoor living and entertaining. Every space has been created to deliver comfort with distinction — combining premium craftsmanship, contemporary aesthetics and the relaxed exclusivity of the Barcelona coastline. A residence where architecture becomes a lifestyle experience.
+34 664 58 33 11
info@ggbarcelona.com en.ggrealestate.barcelona
[ INSIDE ]
10
24 56 36
[ WORDS ]
MARIO DRAGHI
8
[ IN FOCUS ]
EUROPE’S COMPETITIVENESS RESET: INDUSTRY, TECHNOLOGY AND INVESTMENT
10
[ INVESTMENT ]
THE SOUTHERN RENAISSANCE: EUROPE’S NEW INVESTMENT HUB
24
[ FINANCE ]
SWITZERLAND AS A CAPITAL HUB IN THE NEW EUROPEAN FINANCIAL ARCHITECTURE
4
WEJ | May-July 2026
MANUFACTURING REALIGNMENT IN ASIA: INDIA’S POSITION IN GLOBAL SUPPLY CHAINS [ MARKETS ]
• VIETNAM • MEXICO
56 68
78
[ ANALYTICS ]
UZBEKISTAN’S REFORMS AS A CATALYST FOR ECONOMIC GROWTH
88
[ AWARDS ]
36
[ TECHNOLOGY ]
BIG TECH IN THE NEW ECONOMIC REALITY
[ ANALYTICS ]
46
WORLD ECONOMIC JOURNAL AWARDS 2026
96
[ TRENDS ]
EVENTS
104
Editor-in-Chief Robert Gubernatorov Editorial Team Daniella Smithson, Antoine Tigneres, Dylan Waller, Hunter Hughes, Michael Stroup, Gene Lim, Jovan Nikolic, Jagat Prirayani, Victoria Soll, Julico Swanidze, Tatiana Zyatkova, Kirungero Design by Gera Lu Editorial Office Address World Economic Group Rambla de Catalunya 125, 3º 2ª 08008 Barcelona, Spain
56
Tel.: +34 936 559 647 WA Business: +34 658 700 069 E-mail: editorial@world-economic.com www.world-economic.com Publisher: Robert Gubernatorov, trabajador autónomo, operating under the commercial name “World Economic Group”, Barcelona, Spain Address: Rambla de Catalunya 125, 3º 2ª, 08008 Barcelona, Spain Publisher in Central Asia and South Caucasus under WEJ license: “World Organization for Development” LLC 61, Kulatova str., Bishkek city, Kyrgyz Republic Fonts: Adobe Fonts ISSN 3082-0146 (online) Depósito Legal: B-3749-2026 Published in Barcelona, Spain Language: English The journal has been published since 2009. Published bimonthly. The opinions expressed by contributors do not necessarily reflect those of the editorial board. No part of this publication may be reproduced without prior written permission from the publisher. The editors accept no responsibility for the content of advertising materials or inserts. Professional affiliation: Editorial representatives of World Economic Journal include members of the Sindicat de Periodistes de Catalunya / Sindicat de Professionals de la Comunicació (SPC) and the International Federation of Journalists (IFJ).
78
For advertising please inquire: Tel.: +34 936 559 647 WA Business: +34 658 700 069 E-mail: adv@world-economic.com www.world-economic.com Cover concept: The Face of Europe The cover image is based on a licensed Shutterstock photograph and has been artistically adapted by A. Connick to reflect the editorial vision of Europe in the new global economic architecture.
5
Robert Gubernatorov Editor-in-Chief World Economic Journal
FOLLOW US: LinkedIn: https://www.linkedin.com/company/world-economic-journal X: https://x.com/WorldEcoJournal WEJ Facebook: https://www.facebook.com/WorldEconomicJournal
6
WEJ | May-July 2026
In this issue of World Economic Journal, we deliberately return to Europe—not as a geography, but as a central component of the emerging global economic architecture. Europe today stands at a point where strategic choices will determine not only its internal resilience, but its position in a world increasingly shaped by systemic competition, capital allocation, and technological sovereignty. The space between the United States and China is no longer a zone of balance—it is a space of decision. At the core of this issue lies a question that extends well beyond Europe itself: whether Europe can move from diagnosis to execution. This shift—from identifying structural challenges to effectively addressing them—is becoming the defining test of Europe’s competitiveness, investment appeal, and long-term role in the global system. The central focus of this issue is captured in our cover story, Europe’s Competitiveness Reset: Industry, Technology and Investment. The article examines how Europe is redefining its industrial base, technological capabilities, and investment framework in response to growing global competition. The key challenge is no longer strategic intent, but execution capacity—how effectively Europe can translate policy into measurable economic outcomes. We further explore The Southern Renaissance: Europe’s New Investment Hub, where Southern Europe is repositioning itself as a key platform for capital deployment, industrial activity, and energy transformation. Structural shifts in logistics, infrastructure, and regional capital flows are redefining the role of Spain, Portugal, Italy, and Greece within the broader European system. Switzerland is examined as a critical node in Europe’s financial architecture—a stable and highly specialized capital hub operating within, and alongside, the evolving European framework. Beyond Europe, this issue expands into a broader analytical context. Our focus on global manufacturing reconfiguration highlights how the geography of production is being reshaped. India, Vietnam, and Mexico are not simply alternative locations—they are active drivers of a new industrial and investment landscape. This transformation is further reinforced by the growing systemic role of Big Tech—not only as a sector, but as a structural force influencing infrastructure, capital concentration, and market dynamics. This issue is not about Europe in isolation. It is about Europe within a wider transformation—where capital, technology, production, and policy intersect. Our editorial approach remains consistent: to combine analytical depth with structural clarity. In a world of increasing informational volume, value lies not in the quantity of data, but in the ability to construct meaning and identify underlying dynamics. That is the role we see for World Economic Journal.
PHOTO: WORLD ECONOMIC JOURNAL
[ EDITOR’S LETTER ]
BELLA TRANSPARENCIA Located in the prestigious hills of Teià, just minutes from Barcelona and the Mediterranean coast, Bella Transparencia is a striking modern villa designed for those who value architecture, privacy and refined coastal living.
PRICE: 4 900 000 € CONSTRUCTED METRES: 611,5 M² LIVING ÁREA: 480,7 M² PARKING: 250,75M² GARDEN: 244,25 M² BEDROOMS: 6 BATHROOMS: 5
*The price does not include taxes, notary fees, registration fees or administrative expenses.
Defined by natural light, transparency and seamless indoor-outdoor living, the residence features panoramic floor-to-ceiling glass walls, expansive terraces and breathtaking sea views. Elegant open-plan interiors, premium materials and sophisticated contemporary architecture create an atmosphere of serenity, comfort and effortless luxury. Set in one of the most exclusive residential areas near Barcelona, close to international schools, marinas and golf clubs, Bella Transparencia offers a rare combination of tranquility, design and Mediterranean lifestyle. Fully completed and move-in ready.
+34 664 58 33 11 info@ggbarcelona.com en.ggrealestate.barcelona
[ WORDS ]
8
WEJ | May-July 2026
ILLUSTRATION: KIRUNGERO
Mario Draghi
Italian economist, banker and statesman Prime Minister of Italy (2021–2022), former President of the European Central Bank (2011–2019)
« It is that, over time, we will inexorably become less prosperous, less equal, less secure and, as a result, less free to choose our destiny » « The European Union exists to ensure that Europe’s fundamental values are always upheld: democracy, freedom, peace, equity and prosperity in a sustainable environment »
IF EUROPE CANNOT ANY LONGER DELIVER THESE VALUES FOR ITS PEOPLE, IT WILL HAVE LOST ITS REASON FOR BEING
« The core problem in Europe is that new companies with new technologies are not rising in our economy » « Innovative companies that want to scale up in Europe are hindered at every stage by the lack of a Single Market and an integrated capital market, stopping the cycle of innovation in its tracks » « For Europe to succeed, investment in technology and in people cannot substitute for each other. They must go hand in hand » « Europe faces a trade-off » « Increasing reliance on China may offer the cheapest route to meeting our climate targets. But China’s State-sponsored competition represents a threat to otherwise productive industries, and to the promise that the green transition will bring ‘good green jobs’» « To be clear: this should not be read by anyone as a call for blanket protectionism »
THE FIRST PRIORITY IS TO LOWER ENERGY PRICES
« Europe faces a choice between paralysis, exit or integration » SO, INTEGRATION IS OUR ONLY HOPE LEFT Address by Mr. Draghi – Presentation of the report on the Future of European competitiveness, European Parliament, Strasbourg, 17 September 2024
9
[ IN FOCUS ]
10
WEJ | May-July 2026
WORLD ECONOMIC JOURNAL
PHOTO: SHUTTERSTOCK
EUROPE’S COMPETITIVENESS RESET: INDUSTRY, TECHNOLOGY AND INVESTMENT By Jovan Nikolic Serbia
11
[ MARKETS IN FOCUS ]
12
WEJ | May-July 2026
period. EU R&D intensity stood at ~2.2% of GDP in 2024, broadly unchanged over a decade and substantially below comparable indicators in the United States (3.45 percent), Japan (3.44 percent), and South Korea (5.10 percent). Venture capital deployed in Europe in 2025 amounted to 22 percent of the US total, despite the two economies being of broadly comparable size. Industrial electricity prices for energy-intensive users averaged roughly twice US levels through 2025. Foreign direct investment into the European Union declined by 58 percent in 2024, the steepest regional contraction recorded that year. These figures describe an economy that has correctly identified the distance between its present position and the one it needs to occupy, and is attempting to close that distance from within an institutional architecture designed for a different set of problems. A union of twenty-seven partially integrated economies, calibrated for consensus, is now seeking to execute industrial strategy at the pace global capital markets and frontier technology cycles require. That is the European competitiveness reset. The question this analysis takes up is whether it is yet happening and whether the policy convergence and the new architecture of instruments are producing measurable change in the economic data they were designed to move.
INDUSTRIAL CAPACITY AND PRODUCTION BASE
Europe's industrial base has not collapsed. Throughout the trade and energy shocks of 2022–2024, the production system has kept up, though in places visibly weakened, but recognisably the same continental manufacturing complex that has anchored European GDP for three decades. The
PHOTO: SHUTTERSTOCK
S
omething has shifted in the way Europe talks about its own economy. For most of the past decade, the conversation about European competitiveness ran on a familiar track: a slow productivity drift, a tech sector that never quite arrived, an industrial base everyone agreed was world-class but somehow always on the defensive. The diagnoses were available. They were just rarely said out loud, and almost never acted on. That changed between 2024 and 2026. Mario Draghi's report landed in September 2024 and named the problem in language European institutions had spent twenty years avoiding: productivity, scale, capital, energy, fragmentation. Enrico Letta's report on the Single Market, published months earlier, said much the same thing in a different register. The Commission picked up the language and built a policy architecture around it: the Competitiveness Compass in January 2025, the savings-and-investments union, the Clean Industrial Deal, the Scaleup Europe Fund. The ECB endorsed it. National capitals signed on. By late 2025, ECB President Christine Lagarde was describing Europe as facing an "existential crisis," and the characterisation registered as analysis rather than rhetoric. This represents a substantive shift. After a prolonged period of analytical drift, European institutions have converged on a coherent reading of the structural challenge. The more consequential question is whether that reading can be reflected in measurable economic outcomes. The evidence to date is mixed at best. Hourly labour productivity in the euro area grew by 0.9 percent between the fourth quarter of 2019 and the second quarter of 2024; in the United States, it grew by 6.7 percent over the same
WORLD ECONOMIC JOURNAL
Four years of disturbance EU27 industrial production index, January 2021 – February 2026
Index (2021 = 100, seasonally and calendar adjusted)
106
Peak Sep 2022 104.4
104 102
Feb 2026 99.7
100 2021 base = 100 98 96
Trough May 2024 97.9 2021
2022
2023
2024
2025
2026
Source: Eurostat (sts_impr_n). NACE Rev.2 section B-D (mining, manufacturing, energy). Monthly data, seasonally and calendar adjusted
headline numbers from Eurostat tell a story of stagnation rather than decline. EU industrial production rose by 1.5 percent across 2025 as a whole, recovering modestly from a difficult 2024. The index sat at 101 against a 2021 baseline of 100 by the end of the year. Four years of disturbance, and output essentially flat. Beneath the aggregate, the picture is more revealing. The first month of 2026 brought a 1.6 percent contraction across the EU, with capital goods, durable consumer goods, and intermediate goods all retreating in tandem. Germany has been the recurring source of weakness, recording monthly contractions of 5.2 percent in August 2025, 2.9 percent in December, and 1.3 percent in January 2026. The euro area's largest economy is not in freefall, but it is not growing either, and the industrial cycle that historically pulled the rest of the continent forward has gone quiet. What has changed the most visibly is sectoral performance across the EU. Pharmaceuticals, specialty chemicals, advanced machinery, and parts of aerospace continue to generate trade surpluses and command global market positions. However, the automotive industry is the visible casualty. The European People's Party leader Manfred Weber noted in September 2025 that the European car industry had lost roughly 90,000 jobs over the previous twelve months. This figure captures the convergence of pressures the sector now faces: the transition to electric vehicles, Chinese competitive entry into European mass-market segments, and a structural cost base that has become difficult to sustain. Energy-intensive industries are absorbing similar pressure through a different channel. Ineos announced the closure of two German chemical plants in 2025, citing
untenable energy prices. ExxonMobil moved to close its Scottish chemical facility and indicated it might withdraw from European chemicals altogether. The competitive map beyond Europe is also being changed. The Trump administration’s return to broad tariff use in 2025, with average U.S. tariff rates rising significantly from their pre-2025 levels, reinforced the broader shift toward a more protectionist trade environment. Mexican FDI inflows grew 11 percent in 2024, the standout performance in Latin America, on the back of nearshoring to serve the North American market. Vietnam's industrial FDI continued to rise through 2024 before cooling in 2025, as firms recalibrated their China-plus-one strategies. ASEAN as a region attracted a record $235 billion in FDI in 2024. India added 13 percent. None of this is happening at Europe's expense in a direct sense, but each represents a reshaping of the global manufacturing map in which Europe is neither the principal beneficiary nor a credible alternative for the production European multinationals are themselves relocating. Against this backdrop, the Commission has assembled the ambitious EU-level industrial policy framework. The Clean Industrial Deal set the strategic direction by binding decarbonisation to competitiveness through affordable energy, lead markets for low-carbon products, and a Clean Industrial State Aid Framework to channel investment into energy-intensive sectors and clean technology. The Industrial Accelerator Act gives that framework its operational instrument: accelerated permitting, sustainability and resilience criteria embedded in public procurement, and a commitment to raise the share of industrial manufacturing in EU GDP from 14.3 percent in 2024 to 20 percent by 2035. 13
[[ANALYTICS IN FOCUS ]]
R&D intensity (gross domestic expenditure on R&D as % of GDP), latest available year R&D expenditure as % of GDP 5.10% (2024)
South Korea United States
3.45% (2023)
Japan
3.44% (2023) 3.13% (2024)
Germany China
2.70% (2024)
OECD average
2.70% (2024) EU 3% target
2.24% (2024)
EU27 0
1
2
3
4
5
6
In terms of industrial capacity, however, the reset has not yet become visible in measurable economic outcomes. Output is flat against its 2021 baseline, the German cycle has gone quiet, and a policy framework only finalised in 2025 and 2026 has not had time to move an indicator that responds in years rather than quarters.
TECHNOLOGY AND INNOVATION GAP
The technology gap between Europe and its principal competitors is not, in the first instance, a research gap. European science remains globally competitive. European universities still produce some of the world's most-cited research. On the other hand, individual European firms such as ASML, Novo Nordisk, SAP, Airbus sit at the frontier of their respective sectors. The gap is at the next stage: the chain that converts research into commercial scale. Twenty years of comparative data make the same point in different ways, and the post-pandemic period has widened rather than narrowed the divergence. The headline indicator is R&D intensity. EU gross domestic expenditure on research and development reached €403.1 billion in 2024, equivalent to ~2.2% of GDP, remaining broadly unchanged from 2.28 percent in 2020 and well short of the 3 percent target the European Council set in 2002. Comparatively, R&D intensity in 2023 stood at 3.45 percent in the United States, 3.44 percent in Japan, 5.1 percent in South Korea, and 2.7 percent in China. The EU has not closed that gap in twenty years; on most current trajectories it is widening it. What is striking in the recent data is the rate of change among competitors: US R&D expenditure increased by roughly 146 percent in nominal terms between 2014 and 2023, while EU spending grew at a substantially slower pace. 14
WEJ | May-July 2026
At the firm level and according to the European Commission's 2025 EU Industrial R&D Investment Scoreboard, US-headquartered companies in the global top 2,000 invested an average of €48,700 per employee in R&D in 2024, which represents nearly three times the EU figure of €16,800. Of the world's top fifty corporate R&D investors, only twelve are headquartered in the EU. The most consequential analytical point underneath these numbers is that the gap is largely a problem of sectoral specialisation. Roughly 60 percent of the EU–US private R&D intensity gap is explained by industrial mix rather than by lower research effort within sectors. The top three US corporate R&D investors shifted from automotive and pharmaceuticals in the 2000s to software and hardware in the 2010s, and to digital and AI in the 2020s. The EU's top three have remained dominated by automotive throughout. Europe is not under-spending in the sectors it has; it has not built the sectors that now define the global research frontier. The post-2022 AI investment cycle has compounded this asymmetry. AI funding is concentrating geographically and competitively in ways that work against any economy operating outside the US–China axis. The Bay Area alone absorbed more than half of global venture investment in AI in 2024. Europe has produced credible frontier players including Mistral in France, Lovable in Sweden, a small cluster of UK and German specialists. Their growth capital, however, is increasingly American: Lovable's $330 million Series B in December 2025 was led by CapitalG (Alphabet) and Menlo Ventures. The companies remain headquartered in Europe; the financial gravity sits elsewhere. As Christine Lagarde observed at the Atlantic Council in October 2024, reflecting on the Draghi diagnosis, "you need capital, and
PHOTO: KUKAGROUP; EMDEE / CC BY-SA 4.0; SHUTTERSTOCK
Source: Eurostat (rd_e_gerdtot, December 2025) for EU27 and Germany; OECD Main Science and Technology Indicators (March 2026) for all others
WORLD ECONOMIC JOURNAL
15
[ IN FOCUS ]
Annual VC Investment, 2025 VC Investment (€ billion)
300
200
100
0
EU
United States
Source: Banque de France, "How can Europe scale up its venture capital market?" (February 2026)
Cumulative VC Investment, 2014–2023 VC Investment (€ billion)
1000 750 500 250 0
EU
United States
Source: CEPR, "The venture capital challenge for Europe" (February 2026)
you need capital that is prepared to take risks. This is not something that we are very good at in Europe." The Competitiveness Compass and the Strategic Technologies for Europe Platform represent the EU's first serious attempt to address this geography directly. Their effectiveness will depend on whether the policy framework can change a corporate research base whose sectoral specialisation has been stable for two decades. That is a longer test than the political cycle generally accommodates. What the recent data shows is a corporate research base that has not yet begun to shift and an AI investment cycle concentrating outside Europe rather than inside it. In this dimension, the reset is closer to being designed than being measured.
CAPITAL AND INVESTMENT ENVIRONMENT
European households accumulated over €4 trillion in deposits and securities holdings during the post-pandemic period, pension systems hold roughly €4 trillion in assets, 16
WEJ | May-July 2026
and the EU as a whole runs persistent current-account surpluses. Therefore, the problem is not the stock of capital but the architecture that deploys it. The European financial system converts a smaller share of savings into productive equity investment than its principal competitors, and a meaningful share of what is converted leaves the continent to be deployed elsewhere. Villeroy de Galhau framed the diagnosis directly in September 2025: "Europe has a wealth of savings but it lacks equity capital, which is vital to enable firms to innovate." He quantified the gap as 85 percent of GDP in non-financial corporation equity financing in the euro area, against 220 percent in the United States. The cleanest illustration is venture capital. According to CEPR research published in February 2026, total VC deployed in Europe across 2025 reached €66.2 billion, against roughly $300 billion in the United States. In other words, Europe is operating at 22 percent of the US level for two economies of broadly comparable size. The cumulative gap is more visible: between 2014 and 2023, European VC investment totalled €89 billion against US deployment exceeding €1,000 billion. The shortfall concentrates in latestage rounds, where Jacques Delors Centre research puts EU funding at $21.3 billion against $133 billion in the US which is the segment where companies scale from regional to global. One part of the explanation is institutional architecture. US venture capital draws roughly 72 percent of its funds from institutional sources: pension funds, endowments, sovereign wealth funds, insurance companies. The equivalent share in Europe is around 30 percent, with the balance dominated by public sources including the European Investment Fund. European pension funds invest approximately 0.02 percent of their assets in venture capital, against roughly 2 percent for US pension funds. The largest pool of long-duration capital in Europe is structurally precluded by twenty-seven national prudential regimes. What this geometry produces is a continent whose corporate frontier does not refresh: as Mario Draghi observed, no EU-headquartered company with a market capitalization above €100 billion has been founded from scratch in the past fifty years, while all six US firms above €1 trillion were. This is the policy-versus-data gap in its clearest form. The capital exists. The diagnosis has been delivered. What is missing is the architecture that converts one into the other at frontier speed. The same pattern is visible in broader investment data. Foreign direct investment into the European Union collapsed by 58 percent in 2024, the steepest regional contraction UNCTAD recorded that year. The 56 percent rebound in 2025 was driven substantially by conduit flows through low-tax jurisdictions rather than by greenfield commitments. Over the same period US FDI grew 23
WORLD ECONOMIC JOURNAL
COUNTRY
R&D INTENSITY 2024
SOURCE
Israel
6.8%
OECD MSTI March 2026
South Korea
5.1%
OECD MSTI March 2026
United States
3.45% (2023)
OECD MSTI March 2025 / Eurostat
Japan
3.44% (2023)
OECD MSTI / Eurostat
Germany
3.13% (2024)
Eurostat
2.7%
OECD MSTI March 2026
China
2.7% (2024, caught up with OECD)
OECD MSTI March 2026
EU27
2.2% (2024, unchanged since 2020)
Eurostat / OECD MSTI
OECD average
No EU-headquartered company with a market capitalization above €100 billion has been founded from scratch in the past fifty years percent on more than 2,100 greenfield projects, Indian inflows rose 13 percent, Mexican inflows grew 11 percent on nearshoring momentum, and ASEAN attracted a record $235 billion. Global capital is reallocating across a broader competitive set than the United States and China alone, and Europe is not the principal beneficiary of that reallocation in any segment. The Commission's response, formalised in March 2025, was the savings-and-investments union: the most ambitious effort since the 2015 Capital Markets Union to unify European capital markets and channel domestic savings into productive investment. Its instruments include a Scaleup Europe Fund launched in October 2025 with €1 billion of public capital intended to catalyse €4 billion of private commitments, alongside regulatory simplification for cross-border investment products and phased harmonisation of insolvency, securities, and prudential rules. The strategy is the right one. The execution challenge is that capital markets reform requires twentyseven national legal systems to converge on instruments designed at EU level, and historically that convergence
has proceeded at a pace measured in decades rather than years. Whether the savings-and-investments union becomes the architectural shift its name implies, or another framework that compresses ambition into communiqué, is the single most important open question for European competitiveness in the second half of the 2020s.
ENERGY AND INFRASTRUCTURE CONSTRAINTS
The acute phase of Europe's energy crisis ended in 2023. Wholesale gas prices, having peaked above €300 per megawatt-hour in August 2022, returned to roughly €30 by early 2024. The rolling blackouts that European industry feared through the winter of 2022–2023 did not materialise. The structural consequence, however, has been less reassuring than the headline normalisation suggests. Across 2024 and 2025, European energy prices did not settle at pre-crisis levels, but at a new, structurally elevated baseline that European industry now treats as the operating environment of the rest of the decade. The IEA's Electricity 2026 report, published in March 2026, places EU industrial electricity prices at approximately twice the United States level and around fifty percent above prices in China and India. The wholesale picture confirms the same gap: the EU wholesale electricity benchmark averaged roughly $95 per megawatt-hour across 2025, up ten percent year-on-year, and futures markets are pricing $95 per megawatt-hour for 2026 and $85 per megawatt-hour for 2027. On the gas side, OECD's 2025 survey of the European Union estimated EU wholesale gas prices at roughly five times US levels through 2024, with industrial retail electricity 17
Exclusivity and Serenity by the Mediterranean
A rare architectural retreat on the Costa Brava, Spain, where luxury meets nature in one of the Mediterranean’s most privileged enclaves. With panoramic sea views, absolute privacy and extraordinary contemporary design, this exceptional residence offers a lifestyle defined by elegance, tranquility and refined comfort. Premium finishes, noble sustainable materials and meticulously crafted details create sophisticated yet welcoming interiors filled with warmth and natural light.
Expansive terraces, infinity pool, wellness area, panoramic suites and elegant living spaces create a unique atmosphere suspended between sky and sea. More than a home — a private Mediterranean sanctuary and a timeless investment opportunity.
Price 15 000 000 € 9 Suites 2,400 m² built 4,800 m² private plot *The price does not include taxes, notary fees, registration fees or administrative expenses.
+34 664 58 33 11
info@ggbarcelona.com en.ggrealestate.barcelona
[ INVESTMENT ]
THE SOUTHERN RENAISSANCE: EUROPE’S NEW INVESTMENT HUB By Antoine Tigneres France
24
WEJ | May-July 2026
WORLD ECONOMIC JOURNAL
F
or more than a decade, the international financial community viewed Southern Europe exclusively through the lens of sovereign risk. In the wake of the 2008 crisis, the pejorative acronym “PIIGS” had cast Spain, Portugal, Italy, and Greece in the role of fragile, structurally dependent, and financially unstable peripheries. Today, the continent’s economic narrative has reversed. As the traditional industrial powerhouses of Northern Europe— weighed down by the end of cheap energy and the complexity of their globalized supply chains—struggle with stagnation, a quiet transition has shifted the center of gravity of growth toward the Mediterranean basin. The central argument behind this shift is clear: Southern Europe is no longer content merely to catch up; it is now establishing itself as Europe’s leading new hub for investment and industry. This structural transformation is driven by three distinct factors: a major competitive advantage in carbonfree energy, the massive injection of European capital (the NextGenerationEU plan), and the geographic reconfiguration of global supply chains toward nearshoring. However, investing in this new center of gravity requires clear-eyed pragmatism. To fully capture the region’s long-term investment potential, institutional investors must carefully balance these unprecedented capital inflows and growth opportunities against significant structural constraints— including elevated public debt levels under restrictive ECB monetary conditions, accelerating demographic decline, and persistent bureaucratic execution risks. This article offers a comprehensive analytical map of this renaissance. From macroeconomics to sector analysis, here’s why “smart money” is flowing back into Spain, Portugal, Italy, and Greece, and how investors can navigate between these generational opportunities and systemic constraints.
PHOTO: JAKUB ŻERDZICKI / UNSPLASH
THE SOUTHERN RENAISSANCE: THE EMERGENCE OF A NEW EUROPEAN INVESTMENT PLATFORM
The Growth Differential: Genuine Expansion in Volume: The macroeconomic contrast within the eurozone has never been more pronounced. In its April 2026 report, "World Economic Outlook: Global Economy in the Shadow of War", the International Monetary Fund (IMF) highlights a fundamental divergence. While the Franco-German “engine” is idling, hampered by sluggish growth forecasts (0.8% for Germany and 0.9% for France), Southern Europe is emerging as the driving force. Spain posts a robust projection of 2.1% for 2026, closely followed by Portugal (2.0%) and Greece (1.8%). The eurozone average, held back by its core, is capped at 1.1%. It is crucial for analysts to understand that this outperformance is not a cyclical artifact or an inflationary mirage. Eurostat data on the real GDP growth rate (volume) confirm that this represents a genuine expansion of the
productive capacity, net of price effects. Microeconomic Mechanism: The Energy Dividend on Margins: This resilience in volumes stems from a profound restructuring of the energy mix. Take the case of Portugal, which now derives nearly 70% of its electricity from renewable sources. At a time when the IMF is concerned about the consequences of tensions in the Middle East on global supply, this energy sovereignty provides a massive competitive advantage. On the microeconomic level, the structural and local decline in energy costs (particularly due to decoupled gas pricing) is translating into a collapse in input costs for Iberian heavy industry and manufacturing. Consequently, this leads to a dramatic expansion of operating margins (EBITDA) for companies in Southern Europe compared to their German counterparts, the latter of which remain heavily burdened by the importation of expensive LNG. This “energy competitiveness spread” is now the primary driver of foreign direct investment (FDI). The Fuel for Recovery: Mitigating the Crowding-Out Effect Through the RRP: While structural reforms paved the way, Southern Europe’s acceleration can be attributed to a powerful European financial leverage effect. Data from the Recovery and Resilience Scoreboard (RRP) reveal an unprecedented injection of capital, acting as the central catalyst for this resurgence. • Greece: The country is receiving a colossal allocation representing 15.96% of its GDP, or €35.95 billion (comprising €18.22 billion in grants and €17.73 billion in loans). • Italy: The undertaking is massive. With €194.38 billion (€71.78 billion in grants and €122.60 billion in loans), Rome is mobilizing 9.12% of its GDP. Although the country is posting more modest growth (0.5%) due to friction in the implementation of this plan, Italy’s PNRR remains the largest modernization program in Europe. • Portugal: The allocation of €21.91 billion (8.18% of GDP, including €16.33 billion in grants and €5.58 billion in loans) directly fuels its technology hubs and decarbonization efforts. • Spain: The country receives €102.56 billion (6.84% of GDP), with a large proportion coming in the form of direct grants: €79.85 billion, compared with just €22.71 billion in loans. Macroeconomic Mechanism: The Antidote to ECB Rates This is where the RRP’s financial engineering comes into its own for the current cycle. The European Central Bank’s (ECB) maintenance of restrictive key interest rates aims to curb stubborn inflation (estimated at 2.6% in the eurozone for 2026, with Spain sitting at a virtuous 2.3%). Under normal circumstances, this tight monetary policy would trigger a strong “crowding-out effect”: the cost of capital becomes so high that public borrowing drains liquidity and discourages private investment. However, RRP funds—particularly the tens of billions in grants (non-repayable subsidies, such as the nearly €80 25
[ INVESTMENT [ MARKETS ] ]
The Repricing of Sovereign Risk: The Adjustment of External Accounts: The historical argument that had been holding back asset allocation to Southern Europe—the risk of default or a balance of payments crisis—is now obsolete. Long labeled “European debtors” by the Bretton Woods institutions, Spain and Portugal now post structural current account surpluses. This paradigm shift validates the renewed competitiveness of their exports and the strength of their domestic savings. The culmination of this normalization process is illustrated by Greece. After a decade of exclusion, the return of Greek sovereign debt to investment-grade status (confirmed by Moody’s in March 2025, following S&P and Fitch) has unlocked billions of euros in locked-up capital, leading to a dramatic compression of its risk premium. With inflation kept in check at 2.7%, Athens is proving its ability to grow without overheating. Strategic Implications: The Investor’s Handbook (2026– 2030): For finance professionals, the current landscape in Southern Europe demands an immediate revision of strategic asset allocation matrices. For private equity (PE) funds and M&A: Despite sluggish GDP growth in the short term, Italy represents a once-ina-generation opportunity for the middle market. The €194 billion PNRR, heavily focused on the digitalization of the industrial sector, is driving the consolidation of Italian SMEs. Private equity has an ideal hunting ground here: using European funding as leverage to create regional champions in light industry and robotics, with counterparty risk largely diluted by the government. 26
WEJ | May-July 2026
For Real Estate and Infrastructure Strategists (Real Assets): The combination of volume growth and massive subsidies (the famous RRP grants) makes Spain and Greece the most attractive markets for real assets. In Spain, €79.85 billion in subsidies guarantee the profitability of electric charging infrastructure and eco-friendly logistics parks. In Greece, the 15.96% of GDP allocated via the RRP is transforming coastal areas into world-class logistics hubs, directly targeting sovereign wealth funds and Core Plus managers. For Asset Managers and Institutional Investors (Asset Allocation): The “Safe Harbor Trade” is in play. With Northern Europe facing prolonged geopolitical pressures and persistent energy uncertainty, Southern Europe increasingly offers one of the continent’s most attractive risk-return profiles for long-term investors. Overweighting Iberian sovereign debt and the Milan and Madrid stock indices is no longer a tactical recovery bet, but rather a structural defensive core portfolio position. Institutional investors find in the South what the North can no longer guarantee: real growth, subsidized by Europe, and immune to the shocks of a war economy.
SOUTHERN EUROPE AS A NEW INVESTMENT HUB–STRATEGIC SECTORAL OPPORTUNITIES
The Iberian Peninsula: Energy Arbitrage and Green Reindustrialization: The first seismic shift reshaping the map of European asset allocation is energy-related. Spain and Portugal have capitalized on their geography to orchestrate an energy transition of unprecedented speed, creating an economic anomaly from which manufacturers and infrastructure funds are the primary beneficiaries. In 2024, Spain crossed the critical threshold where renewable energy accounted for 57.5% of its total electricity generation (data from Red Eléctrica de España). This shift is driven by a robust energy mix: wind power accounts for approximately 24% (64 TWh), while solar photovoltaic power is growing exponentially, reaching 17 to 18.5% of the mix (45 TWh). Together, these two zero-marginal-cost sources account for more than 41% of the country’s electricity (according to Ember’s European Electricity Review 2024). The macroeconomic mechanism at work is relentless: this glut of green electrons has caused a structural collapse
PHOTO: RED ELÉCTRICA
billion in Spain)—completely bypass this mechanism. They act as a sovereign equity injection directly into the real economy without passing through the bond markets. Southern European countries thus finance their green and digital infrastructure at zero cost, avoiding the crowding-out effect and allowing private capital to co-invest in projects where the initial risk (CapEx) has been absorbed by Brussels. However, while these massive EU capital inflows provide an unprecedented growth shield, they do not erase the underlying reality of highly leveraged national balance sheets, forcing investors to constantly weigh project returns against broader sovereign constraints.
WORLD ECONOMIC JOURNAL
in wholesale prices. On the Iberian market (OMIE) in 2024–2025, electricity prices fluctuated between €40 and €55/MWh, with lows of €20/MWh during spring production peaks. In contrast, Germany, forced to maintain 26% coal and 16% gas to balance a post-nuclear grid, faces wholesale prices in the range of €75 to €90/MWh. France, stabilized by its nuclear fleet (EPEX SPOT), remains between €66 and €75/MWh. Implications for Investors (Infrastructure & Private Equity): For fund managers (GPs) and industrial companies, this price gap of nearly 50% compared to Germany alone justifies the relocation of energy-intensive operations. In an environment where the ECB is keeping interest rates at restrictive levels, the predictability of energy OPEX (operating expenses) becomes the primary lever for securing IRRs (Internal Rates of Return). This explains the flood of Foreign Direct Investment (FDI) into the Iberian green heavy industry. The giant Cepsa is rolling out its “Positive Motion” strategy (€7 to €8 billion over the decade), with 60% focused on green hydrogen and biofuels, backed by an €80 million loan from the European Investment Bank (EIB) to support 227 MW of solar capacity in Andalusia. “Solar energy is a key ingredient for the production of green hydrogen, which enables the decarbonization of heavy transport and industry, as well as other energy-intensive uses. Andalusia is proving to be the ideal location where we are developing one of the most ambitious green hydrogen projects in Europe.” — Maarten Wetselaar, CEO of Cepsa (2023) Asian sovereign and industrial funds are following this logic of energy arbitrage, as illustrated by the joint venture between CATL and Stellantis, which is investing 4.1 billion euros near Zaragoza in a 50 GWh LFP battery plant.
PHOTO: MOEVE
COUNTRY / MARKET
The Italy-Greece Axis: The Digital Epicenter and Hyper-Automation (Industry 4.0): While the Iberian Peninsula provides the energy hub, the central and eastern Mediterranean basin is digitizing the continent. Southern Europe is now shattering the persistent stereotype of an economy driven exclusively by tourism services, establishing itself as the engine of Industry 4.0 and European cloud infrastructure. Italy perfectly illustrates this symbiosis between hardware and software. The peninsula maintains its status as a titan of Industry 4.0, boasting a robot density of over 250 robots per 10,000 employees in the manufacturing sector—far exceeding the European average (231) and ranking among the world’s top 10 (according to the IFR). To drive this automation amid a declining population, Italy’s computing infrastructure is booming. The Milan hub surpassed 300 MW of data center capacity by the end of 2024 and is targeting 500 MW by 2026 (Data Centers EMEA Report Q4 2025, Knight Frank). Further east, Greece is making rapid strides. Once shunned by venture capital, Athens is doubling its secure data center capacity year over year, aiming for 100 MW. The country is capitalizing on its geography by becoming a critical hub for the undersea cables connecting Europe to Africa and Asia. Implications for Investors (Digital Infrastructure & Tech Buyouts): For digital infrastructure strategists, the appeal of the South lies in the availability of land and energy—resources that have become scarce in the saturated “FLAP” markets (Frankfurt, London, Amsterdam, Paris). The “Hyperscalers” validate this investment thesis with massive inflows of equity capital: Microsoft is committing €4.3 billion (Milan/Turin) to AI and the Cloud, and nearly €1 billion in Greece (the “GRforSURE” project). Google is deploying a cloud region in Athens, with an estimated GDP impact of €2.2 billion by 2030 (representing 20,000 induced jobs), complementing the more than €2 billion invested by AWS in Italy. In the private equity sector, Italian mid-market companies specializing in robotics and mechatronics now represent one of Europe’s most resilient sources of leveraged buyout (LBO) opportunities, offering pure exposure to the megatrend of automation.
AVERAGE WHOLESALE ELECTRICITY PRICE (€/MWH)
SHARE OF FOSSIL FUELS IN THE ENERGY MIX
Iberian Peninsula (OMIE)
€40 – €55 / MWh
Low (< 20%)
France (EPEX SPOT)
€66 – €75 / MWh
Very Low (Nuclear dominant)
Germany (EPEX SPOT)
€75 – €90 / MWh
High (Coal 26%, Gas 16%)
Sources: Ember European Electricity Review 2024 / OMIE
27
[ [INVESTMENT ANALYTICS ] ]
transshipment activity surge by 17.6%, generating record revenues of €250.8 million.
28
WEJ | May-July 2026
A STRUCTURAL RECONFIGURATION: COMPETITIVENESS AND CAPITAL CAPTURE
For decades, Southern Europe was perceived as the weak link of the eurozone—a systemic risk to be hedged. Today, through a combination of balance sheet repair, wage competitiveness, and energy security, the region has reversed this narrative: it is no longer the “sick man” of Europe, but an emerging engine of resilience within the European economy. A cross-analysis of wage dynamics, tax burdens, and capital flows reveals a radical transformation in Europe’s economic geography. Southern Europe, historically viewed through the lens of sovereign vulnerability and confined to the role of a “low-cost” periphery, is now emerging as a strategic and resilient investment hub. While Northern Europe grapples with deep-seated structural challenges, Mediterranean countries now offer unprecedented leverage for profitability within the single market, supported by sophisticated institutional engineering. Southern Europe’s competitive advantage is most clearly reflected in its labor cost structure. Eurostat projections for 2025 highlight severe wage inflation in Northern Europe, pushing the average hourly labor cost in Germany to €45.00. This level—approaching saturation for many exportoriented sectors—stands in stark contrast to Mediterranean benchmarks.
PHOTO: SHUTTERSTOCK
Mediterranean Ports: Monetizing Resilience through Nearshoring: Decarbonized energy and AI computing power must be underpinned by resilient logistics. The third pillar of Southern Europe’s resurgence lies in logistics and port real estate, fundamentally reshaped by geopolitical fragmentation, persistent risks in the Red Sea, and the urgent need for industrial players to drastically shorten their supply cycles. The shift from efficiency (just-in-time flows) to resilience (buffer inventories) is no longer theoretical. The 2024 Global Supply Chain Leader Survey by McKinsey & Company confirms that 60% of executives are actively working toward regionalizing (nearshoring) their supply chains. The 2025 European Real Estate Logistics Census (Savills/Analytiqa) translates this into real estate terms: 68% of industrial players expect nearshoring to dictate their future warehouse needs. Trade flows confirm this trend: the Mediterranean basin now accounts for more than 8% of total European sourcing, with a sharp increase in industrial audits in Morocco (+53%) and Turkey (+27%), according to QIMA. This reorientation directly benefits Southern port infrastructure. In 2024, the Port of Rotterdam saw its traffic decline by 0.7%. By contrast, Port of Valencia recorded growth of +14.15%, surpassing 5.47 million TEUs. Port of Genoa handled 2.8 million TEUs and is securing its future through the €1.3 billion “New Breakwater” mega-project. Port of Piraeus, benefiting from substitution effects, saw its
Implications for Investors (Core/Core+ and Value-Add Real Estate): For real estate funds and REITs, Southern Europe currently offers the most attractive risk-return profile in the logistics sector. The market is experiencing a classic “scissor effect”: on one side, rental demand is intensifying due to nearshoring (with Spain ranking as the third most targeted European market for expansion); on the other, supply is tightening dramatically. The prolonged maintenance of high interest rates by the European Central Bank has severely constrained development financing, leading to a 28% decline in the European speculative project pipeline since early 2023. This shortage ensures strong pricing power for owners of existing assets. In strategic hubs such as Milan and Barcelona, vacancy rates are collapsing and prime rental values are reaching new highs. For institutional investors, these rental growth dynamics enable outperformance against inflation and offset cap rate expansion, positioning Southern European logistics real estate as the most defensive and alpha-generating asset class on the continent. Yet, capturing the alpha in these booming sectors requires highly selective execution. Investors must balance this structural growth with local bureaucratic frictions and the looming reality of a shrinking active workforce that could strain future operations.
WORLD ECONOMIC JOURNAL
Comparative Metrics of Competitiveness – Southern Europe vs. Germany (2023–2025) COUNTRY
STATUTORY AVERAGE HOURLY CORPORATE TAX LABOR COST RATE (OECD 2024) (EUROSTAT 2025 EST.)
INBOUND FDI INFLOWS (UNCTAD 2023)
KEY COMPETITIVE ADVANTAGE
Spain
25.00%
€26.40
$35.9 Billion
Renewable energy, market size, IT hub
Italy
24.00%
€32.00
$18.2 Billion
Logistics, high-end manufacturing
Portugal
31.50%*
€19.40
$7.2 Billion
Tech/R&D hub, ultra-competitive labor costs
Greece
22.00%
€18.20
$5.4 Billion
Attractive taxation, real estate, pharma hub
Germany (Ref.)
30.06%
€45.00
(Structural slowdown)
Central hub, infrastructure, but saturated costs
Note: Portugal's statutory rate remains high, but effective rates for foreign investors are significantly lower due to R&D tax credits and innovation incentives (SIFIDE)
Hiring in Greece (€18.20 per hour) or Portugal (€19.40) is now less than half the cost of Germany. Spain maintains a remarkable balance, with a controlled hourly cost of €26.40, while Italy—historically a manufacturing powerhouse— stabilizes at €32.00. However, the attractiveness of these countries no longer rests on simple wage “dumping” for lowvalue execution tasks. Investors are now targeting an optimal cost-to-skill ratio. The engineering talent pool in Portugal and Spain offers significantly higher marginal productivity than that of Eastern European countries (where labor costs are rapidly converging toward the EU average), enabling the deployment of high-value R&D centers and technology hubs.
capital. The government deploys powerful tax credits (notably SIFIDE) targeting innovation, transforming an apparently heavy tax burden into a strong incentive mechanism for the technology and healthcare sectors.
Fiscal Engineering and Capital Capture (FDI): Beyond labor costs, Southern Europe’s competitiveness is increasingly shaped by fiscal policy, justifying the large-scale reallocation of capital. 2023 data from UNCTAD confirms this trend, with robust inbound FDI flows: $35.9 billion for Spain, $18.2 billion for Italy, $7.2 billion for Portugal, and $5.4 billion for Greece. These performances reflect distinct yet highly effective fiscal engineering strategies, far removed from Germany’s corporate tax rate, which exceeds the psychological threshold of 30% (30.06%). Greece and Italy have adopted aggressive nominal rate strategies. Greece offers a highly attractive rate of 22.00%, the result of a post-crisis supply-side policy aimed at recapitalizing the economy. Italy, with its national IRES corporate tax set at 24.00%, provides reassurance to industrial investors. Spain captures the lion’s share of regional FDI through a moderate and predictable 25.00% rate, combined with the critical mass of its domestic market. Portugal represents a more complex case: while its nominal rate remains high (31.50% in 2024, with a projected decline to 30.50% by 2025 according to the OECD), its effective tax rate is significantly lower for foreign
SPAIN AS A CORE HUB: THE TRANSATLANTIC AND EUROPEAN GATEWAY
Strategic Implications for Investors: The resilience of Southern Europe is not a cyclical anomaly, but the result of a structural rebalancing. By combining wage moderation, energy security, fiscal attractiveness, and institutional maturity, the Mediterranean bloc is positioning itself as the primary engine of profitability within a European economy undergoing deep transformation.
While the broader Southern European region is experiencing a systemic revival, Spain has definitively separated itself as the structural anchor of this new investment platform. It is no longer evaluated by institutional investors merely as a large domestic market, but rather as the central logistics, financial, and infrastructural hub connecting Latin America, North Africa, and the European Union. Spain operates as a functional economic bridge, actively reshaping post-2020 capital redistribution trends within the EU. The Latin American Connection: Capital and Corporate Networks: The most profound shift in Spain's investment geography is its consolidation as the primary European destination for Latin American capital. Historically, Foreign Direct Investment (FDI) flowed overwhelmingly from Europe to Latin America. Today, that dynamic has structurally reversed. According to the VI Global LATAM 2024 report by ICEXInvest in Spain and the Ibero-American General Secretariat 29
[ INVESTMENT ] Hourly labor costs in Europe (Eurostat estimates for 2025) (in €, whole economy*, enterprises with 10 or more employees) 59.3 43.1 39.4
€ per hour 56.2
59.3 (Iceland) 40 20 12.0 (Bulgaria)
21.1 16.3
51.7
44.2
17.8
Data not available 47.9 45.0 48.2 56.8
EU €34.9 44.3 Malta 19.0
19.1 19.8 46.3
32.0
29.7
19.8 15.2
13.6
18.4 19.4
26.4
12.0
Liechtenstein
18.2 19.0
21.7
*Excluding agriculture, forestry and fishing, public administration, defence and compulsory social security, activities of households as employers, and activities of extraterritorial organizations and bodies. Austria, Spain, Finland and Iceland: data from national sources. Malta: data estimated based on LCS2016. Belgium: 2024 estimates Source dataset: lc_lci_lev
30
WEJ | May-July 2026
increasingly utilizing Spain as their operational springboard to access the EU’s 500 million consumers. "Spain strengthens its position as the second global destination for investment flows from Latin American companies, after the United States, and consolidates itself as the gateway for Latin American investment into Europe, above all, but also into North Africa." — Elisa Carbonell, CEO of ICEX Spain Trade and Investment, 2024 They leverage shared linguistic and cultural frameworks, highly compatible legal systems, and the deep presence of Spanish corporate networks—such as Santander, BBVA, and Telefónica—which facilitate seamless cross-border banking and corporate structuring.
PHOTO: ICEX
(SEGIB), global outward FDI from Latin America reached $47.74 billion in 2023. Capturing a massive share of this outward flow, Spain solidified its position as the secondlargest global destination for Latin American companies, trailing only the United States. In 2023, LatAm FDI into Spain surged by 138% year-over-year, reaching €2.83 billion. This capital influx is not highly speculative; it represents long-term corporate entrenchment. The accumulated stock of Latin American investment in Spain now stands at €47.15 billion. When factoring in investments through Foreign Securities Holding Entities (ETVEs)—Spain's highly competitive corporate holding framework—the total volume reaches €66.88 billion, representing 11% of all foreign investment received by the country. This capital supports over 600 companies and generates 47,000 direct jobs within Spanish borders. Mexico drives this influx, accounting for 58% of the capital (€1.64 billion), followed by Honduras, Argentina, and Uruguay. Latin American multinationals (multilatinas) are
WORLD ECONOMIC JOURNAL
Sectoral Shift: From Real Estate to Tech and Greenfield Infrastructure: Crucially, the nature of this investment is pivoting. While real estate and traditional services historically dominated, the current wave is characterized by high-value greenfield investments and a rapidly expanding tech ecosystem. The technological sector is now the primary generator of transnational investment initiatives by Latin American firms. The Global LATAM 2024 report highlights an "explosion of Latin American startups" utilizing Spain to scale globally. Concurrently, heavy capital is being deployed into the energy transition. The largest greenfield investments recorded are directly tied to the decarbonization of the European economy, specifically targeting green hydrogen production and mineral extraction for electric vehicles (EVs). The Dual-Engine Economy: Madrid and Barcelona: Spain’s positioning within the EU economic structure is uniquely driven by its dual-hub model, which absorbs distinct profiles of capital, preventing regional economic overheating while maximizing sectoral reach. Madrid operates as the undisputed financial and corporate headquarters. It captures the vast majority of Latin American wealth management and ETVE holding structures. For institutional investors and multinational boards, Madrid offers a highly competitive corporate taxation framework and institutional stability that rivals, and increasingly surpasses, traditional hubs like Frankfurt or Paris, especially given lower operational costs and the direct pipeline to Latin American boardrooms. Conversely, Barcelona functions as the industrial, technological, and logistical engine. The Catalan capital is one of Southern Europe’s premier tech startup ecosystems, heavily absorbing venture capital and digital infrastructure FDI. Furthermore, its maritime infrastructure serves as a critical node for heavy industry and Mediterranean trade.
"In 2023, greenfield investment surpassed 20 billion dollars [globally for LatAm], highlighting very positive trends such as the firm commitment of Ibero-American business leaders to projects aimed at a green and sustainable transformation." — Andrés Allamand, Ibero-American Secretary-General (SEGIB), 2024 Positioning within the EU Economic Balance: From a macroeconomic perspective, Spain is systematically altering the EU's internal balance. Its physical infrastructure— anchored by the ports of Valencia, Algeciras, and Barcelona—dominates Mediterranean container traffic and acts as the primary transshipment point for the EU-Latin America and EU-Africa logistics corridors. While Northern European supply chains grapple with structural energy deficits and labor saturation, Spain offers a compelling alternative: an abundance of zero-marginalcost renewable energy, deep Atlantic and Mediterranean port connectivity, and an influx of transatlantic capital. Consequently, Spain is not merely a peripheral consumer base for German or French goods; it has matured into an independent, highly capitalized production and distribution platform for the broader European single market.
RISKS AND STRUCTURAL LIMITATIONS
Demographic decline is no longer a distant prospect, but an immediate structural constraint on growth potential across Southern Europe. Without a significant acceleration in productivity and disciplined management of sovereign debt trajectories, population aging will increasingly weigh on economic expansion, the transmission of monetary policy, and the overall financial stability of the euro area. This concern is consistently highlighted in recent analyses by the European Central Bank and the European
PHOTO: SEGIB
Table 4.1: Latin American Investment Metrics in Spain (2023-2024) METRIC
VOLUME / DATA POINT
TREND / CONTEXT
Total Global LatAm Outward FDI
$47.74 Billion
Highest volume since 2014 (excluding record year 2022)
Annual LatAm FDI into Spain
€2.83 Billion
+138% Year-over-year growth
Total Accumulated Stock (incl. ETVE)
€66.88 Billion
Accounts for 11% of total FDI in Spain
Primary Origin Country
Mexico (€1.64 Billion)
Represents 58% of the total LatAm influx
Corporate Footprint
> 600 Companies
Generating approximately 47,000 direct jobs
Data Source: ICEX-Invest in Spain & SEGIB, VI Global LATAM 2024 Report
31
A PARISIAN-STYLE GRAND RESIDENCE IN BARCELONA’S ZONA ALTA An extraordinary residence where timeless European elegance meets contemporary refinement in one of Barcelona’s most prestigious addresses. Set within a distinguished 1929 building, this exceptional apartment offers grand proportions, soaring ceilings and interiors designed with remarkable attention to detail. More than 300 meters of walls upholstered in handcrafted French silk create a rare atmosphere of warmth, sophistication and acoustic serenity. Elegant reception rooms, refined entertaining spaces and bespoke finishes evoke the spirit of a private Parisian residence in the heart of Barcelona. *The price does not include taxes, notary fees, registration fees or administrative expenses.
The designer kitchen, equipped with Sub-Zero refrigeration and a La Cornue range, combines architectural beauty with culinary excellence. The carpets, sourced from the Real Fábrica Española and signed by Miguel Stuyck, are true collector’s pieces. Climate control features Mitsubishi air-conditioning and English cast-iron radiators that add depth, character and timeless charm. Notably, the residence remains entirely untouched since its complete renovation — never lived in, with all furnishings, finishes and appliances in pristine, unused condition.
A rare turnkey property for those who seek individuality, artistry and exceptional living at the highest level
Price – 3 950 000 € Bedrooms - 4 Bathrooms – 4 250 m² built
+34 664 58 33 11 info@ggbarcelona.com en.ggrealestate.barcelona
100
[ FINANCE ]
SWITZERLAND AS A CAPITAL HUB IN THE NEW EUROPEAN FINANCIAL ARCHITECTURE Why Switzerland still channels the world’s wealth—and what could reshape its role. By Gene Lim Singapore
36
WEJ | May-July 2026
PHOTO: HENRIQUE FERREIRA / UNSPLASH
WORLD ECONOMIC JOURNAL
37
[[MARKETS FINANCE ]]
T
he old story of Swiss finance was easy to tell: discreet banking, a hard currency, neutrality, and a quiet role moving wealth between Europe and the rest of the world. Much of that story is now out of date. The Automatic Exchange of Information regime and related transparency reforms have stripped away much of the old secrecy edge. Credit Suisse's collapse in 2023 removed a 167-year-old institution and left Switzerland with a single domestic G-SIB that the Financial Stability Board has described as the world's largest relative to its home jurisdiction's GDP. The striking part is that capital has not left. Assets under management at Swiss banks reached CHF 9,284 billion at the end of 2024, exceeding the previous record set in 2021. Cross-border private client wealth managed in Switzerland reached CHF 2,427 billion that same year, up roughly 10%.
The annual average EUR/CHF rate, based on ECB daily reference rates, fell below parity in 2023. Reputation still helps, but it no longer carries the argument. Switzerland's role today is built on a harderto-copy mix: a currency investors still buy in stress, banks and advisers built for cross-border clients, a regulatory system that has had to become more transparent, and a position just outside the EU but still deeply tied to European capital markets. That matters because Europe's financial architecture is still incomplete. The Capital Markets Union remains more ambition than architecture; Brexit moved London's wholesale infrastructure outside the EU without solving the bloc's problem of fragmented capital markets. Switzerland's role exists in part because of those gaps. It is not inside the EU, but it is not detached from it either.
The franc's safe-haven path against the euro, 2005–2023
1.50
1.25
1.00
20 05 20 06 20 07 20 08 20 09 20 10 20 11 20 12 20 13 20 14 20 15 20 16 20 17 20 18 20 19 20 20 20 21 20 22 20 23
0.75
Source: ECB daily EUR/CHF reference rates; annual averages calculated from daily observations
38
WEJ | May-July 2026
PHOTO: ALIN ANDERSEN / UNSPLASH
CHF per EUR, annual average
1.75
WORLD ECONOMIC JOURNAL
Negative headline FDI is conduit activity, not retreat
Net FDI inflows (US$ bn)
0 -50 -100 -150
-115.5
-108.4
2023
2024
-161.8
-200 -238.6 -250
2018
2020
Source: World Bank WDI. Headline net FDI inflows are volatile and should be read as a balance-of-payments/conduit indicator, not as a simple measure of capital attraction or capital flight
Its banks, asset managers, and advisers help capital move across the seams of a European system that does not yet operate as a single system. That role is now under pressure on three fronts at once, and each one cuts both ways. UBS's absorption of Credit Suisse stabilized the system at the cost of concentrating it. The franc remains the signal of Swiss credibility and a lasting drag on the export economy that helps generate that credibility. And as Asian and Gulf centers take a larger share of new global wealth, Switzerland is growing in absolute terms while its relative lead narrows. The model is more demanding to run than it used to be—and more useful to Europe, in a system that still does not intermediate capital as seamlessly as its scale suggests it should.
THE MECHANICS OF CAPITAL ATTRACTION
Switzerland is usually described as stable. That is true, but not very useful unless one asks how that stability reaches investors. The first channel is the franc. During periods of global stress—and, in particular, during episodes of stress within Europe—the currency tends to appreciate and often remains strong after the immediate shock has passed. A reliable European-facing currency platform sitting outside the eurozone is part of what makes the Swiss model functionally distinct. The annual average EUR/CHF reference rate, compiled from ECB data, clearly shows the pattern. In 2007, the franc traded at 1.64 to the euro. By the height of the euro-area debt crisis in 2011, it had reached 1.23. The SNB introduced its EUR/CHF floor that September; by 2014, reserves had climbed from roughly CHF 220 billion to around CHF 490 billion. After the floor was abandoned in 2015, the rate fell
to 1.07 on an annual average basis. By 2022, it had reached parity. By 2023, it stood at 0.97. Jean-Pierre Danthine, then Vice Chairman of the SNB, summarized the underlying dynamic in a 2015 speech: “The financial crisis has exacerbated the global appetite for Swiss franc investments because of their safe haven status.” The SNB's 2015 Quarterly Bulletin study on the debt crisis period showed how widening sovereign spreads in the euro-area periphery pushed money into francdenominated assets, strengthening the currency and compressing yields. The IMF Executive Board, in its 2024 Article IV consultation on Switzerland, made the same point from a risk perspective, warning that “downside risks arise from intensification of regional conflicts and an abrupt global slowdown, which could result in slower growth and trigger safe haven flows.” Switzerland benefits when global investors look for safety, but the same flows can make domestic policy harder. Capital that arrives in stress can strengthen the franc, tighten conditions, and make life more difficult for exporters. Below the currency story, the capital-flow picture is less intuitive. Net foreign direct investment into Switzerland was negative USD 161.8 billion in 2018, negative USD 238.6 billion in 2020, and negative USD 108.4 billion in 2024. Taken at face value, those figures might suggest a country in retreat. That would be a misleading interpretation. As both the SNB's balance of payments work and the IMF's 2016 working paper on Switzerland's international investment position make clear, the country's net creditor status is anchored in multinational headquarters, merchanting activity, and asset-management income 39
[ [ANALYTICS FINANCE ] ]
the post-2008 period aligning prudential standards, transparency rules, and resolution frameworks with international peers, with particular intensity after the 2015 abandonment of the EUR/CHF floor and again following the 2023 collapse of Credit Suisse. The Financial Stability Board's 2023 Peer Review of Switzerland concluded that the country has made “important strides” in implementing an effective too-big-to-fail regime. Global investors do not benchmark Swiss regulation against the Swiss past. They compare it with current Basel, FSB, and EU expectations, and Switzerland still clears those bars. But the same regulatory adaptation that made the Swiss system more acceptable to global counterparts also stripped out the secrecy premium that once underwrote part of the model's economics. The result is a more legitimate platform that is also more expensive to run and less forgiving of mistakes.
Global investors do not benchmark Swiss regulation against the Swiss past rather than in transactional FDI volume. The FDI series mostly tracks how global firms restructure their internal balance sheets through Swiss entities. It is a measure of conduit activity. The other part of the story is regulation. FINMA, the SNB, and the Swiss Federal Department of Finance spent
A decade of accumulation, briefly erased (2014–2024)
9000 8000 7000 6000 2014
2016
2018
Source: Swiss Bankers Association. Comparable year-end data are shown where available
40
WEJ | May-July 2026
2020
2022
2024
PHOTO: DANIEL REUST / CC BY-SA 4.0
AUM at banks in Switzerland (CHF bn)
10000
WORLD ECONOMIC JOURNAL
The CHF 9,284 billion figure is impressive, but it needs unpacking. It shows scale; it does not explain why so much money is managed in Switzerland rather than elsewhere. Part of the answer is that European wealth itself is not consolidated, and Switzerland has spent decades building the infrastructure to hold and service it across jurisdictions. The clearest evidence of that role is the AUM-toGDP ratio: 219 percent at the end of 2022, on EFAMA's measurement—the highest among major European markets and several multiples of the equivalent figure in Frankfurt or Paris. EFAMA places Switzerland third in Europe by AUM, behind the United Kingdom and France and ahead of Germany. The ratio says less about the domestic economy than about Switzerland's role in financial exports. Much of the activity is managed from Switzerland for clients whose money, lives, and liabilities are elsewhere—frequently in several elsewheres at once. The ecosystem beneath that AUM is layered. UBS, post-merger, dominates the universal-banking layer alongside Raiffeisen, the cantonal banks, and foreign-owned subsidiaries that handle a meaningful share of cross-border activity. Private banks such as Pictet, Lombard Odier, Julius Baer, and Mirabaud sit alongside a longer tail of smaller, often family-owned houses. They run discretionary mandates, structured products, and multi-jurisdictional advisory work that requires tax, succession, and trust expertise. Independent asset managers, family offices, and external wealth managers then use the banks as custodians and execution platforms rather than competing with them directly. The Federal Department of Foreign Affairs reports that of the CHF 7,847 billion in AUM at end-2022, roughly half was held on behalf of foreign clients. The value is in the operating system. A Brazilian family office, a German asset manager, and a Singaporean private bank can all use Swiss custody, settlement, structuring, and reporting services without relying on the same counterparty. They can do so within a regulatory framework recognized by European, US, and Asian regulators. What Switzerland exports here is not a single product. It is the ability to hold, report, advise on, and move wealth across borders without the system feeling improvised. That kind of infrastructure is easy to understate because it rarely appears as a single headline transaction. Its value is cumulative: fewer points of failure, familiar documentation, experienced advisers, and a banking ecosystem used to clients whose financial lives cross borders. For capital that wants European exposure without a purely domestic setup, that is part of the Swiss offer. The export numbers remain large, even as the competitive picture has become less comfortable. The Swiss Bankers Association's 2025 report stated that cross-border private
Directional estimates suggest Switzerland’s global share has narrowed 28 Estimated share (%)
WEALTH MANAGEMENT AS FINANCIAL INFRASTRUCTURE
26 24 22 2018
2019
2020
2021
2022
2023
Sources: SBA, FDFA, Deloitte. Estimates use different methodologies and should be read directionally, not as a continuous time series
client wealth managed in Switzerland reached CHF 2,427 billion in 2024, up roughly 10 percent year-on-year, and described Switzerland as still the world leader in this segment. Deloitte's 2024 International Wealth Management Center Ranking described Switzerland as a leading international wealth-management center, while indicating that its lead over other hubs has narrowed. BCG's 2025 work on booking-center competition points in the same direction: Switzerland remains a leading global booking center, but Hong Kong, Singapore, and the UAE are becoming more serious competitors. The pattern is consistent across providers. Switzerland's absolute scale is rising; its relative lead is thinner.
OUTSIDE THE BLOC, INSIDE THE SYSTEM
On paper, Switzerland should sit at the edge of Europe's capital markets project. The country is not a member of the European Union, has no passporting rights for financial services, and operates outside the European Securities and Markets Authority's supervisory perimeter. EFAMA's data nonetheless place it third among European assetmanagement centers by AUM, with EUR 1,679 billion managed at end-2022, compared with EUR 4,493 billion in the United Kingdom, EUR 2,890 billion in France, and EUR 2,252 billion in Germany. The six largest centers—the UK, France, Switzerland, Germany, the Netherlands, and Italy—jointly accounted for roughly 85 percent of European AUM in 2022. The integration runs through market practice rather than institutional membership. Swiss banks, asset managers, and private-client platforms manage portfolios with significant European exposure. Swiss-based managers serve international clients with European mandates. Cross-border wealth managed in Switzerland is typically deployed across global and European securities markets. The details differ from one institution to another, but Switzerland is tied to Europe through market practice, not EU membership. 41
[ TECHNOLOGY ]
BIG TECH IN THE NEW ECONOMIC REALITY
“Tenuous resilience amid persistent uncertainty” describes the prevailing global economic condition, characterized by the International Monetary Fund in its World Economic Outlook Update (January 2026). by Daniella Smithson Saint Kitts and Nevis
46
WEJ | May-July 2026
WORLD ECONOMIC JOURNAL
C
ontraction, exposure, tightened risk tolerance, and heightened states of caution. With pressures accumulating worldwide, global growth remains steadier than anticipated, with a revised upward forecast of 3.3% in 2026 and 3.2% in 2027. Whether this calculation reflects grounded adjustment or deferred pressure remains a persistent observation in a landscape stressed by growing structural strain. The United Nations presents a more sobering future. “A combination of economic, geopolitical and technological tensions is reshaping the global landscape, generating new economic uncertainty and social vulnerabilities,” said UN Secretary-General António Guterres. Despite pockets of resilience, risks are increasingly heading toward slower growth, persistent inflation, and heightened policy uncertainty, leaving the recovery uneven across countries and sectors. With rising prices continuing to “erode real incomes and strain affordability,” high debt burdens, weak investment, and slowing global trade are increasingly limiting governments’ ability to respond to future shocks.
SIGNALS OF UNEVEN TRADE RECOVERY ACROSS GOODS AND SERVICES
PHOTO: SHUTTERSTOCK
Rising international tensions and uneven policy landscapes are creating a patchwork of fragility and resilience across global trade in goods and services. Merchandise trade growth remains structurally weak, reflecting higher input costs, tighter financing conditions, and persistent supplychain realignment. Trade in manufactured goods has failed to regain its pre-pandemic growth trajectory, with volumes increasingly concentrated in a limited number of regional corridors rather than globally distributed flows.
“Tariffs remain historically high, and global policy remains highly uncertain, with only a few countries having reached fully fleshed-out trade agreements,” said Pierre-Olivier Gourinchas, Chief Economist of the International Monetary Fund, in the opening remarks of the July 2025 World Economic Outlook Update. 47
[ TECHNOLOGY ]
6.8% 4.6%
4.4% ~2.4%
N/A
~0.5%
2024 Global services trade growth (%)
2025
2026 Global merchandise trade growth (%)
Global services trade continues to outperform goods trade, highlighting a structural divergence in post-pandemic recovery.
Source: WTO, Global Trade Outlook and Statistics (October 2025 Update)
Foreign Direct Investment: Concentration Over Expansion
All other sectors
Data centers
<14%
>20%
Digital infrastructure, semiconductors, high-tech assets of global greenfield project value ~66%
Despite rising headline FDI flows, new investment in 2025 remained highly concentrated in technology-driven greenfield projects.
Source: UNCTAD, Global Investment Trends Monitor (January 2026)
While the initial trade shock may prove less severe than once feared, its scale remains meaningful, and evidence is mounting that it is weighing on the global economy. Gourinchas further stated that the Fund “continues to project a persistent decline in global trade as a share of output despite the recent front-loading, from 57% in 2024 to 53% in 2030,” adding that “the current trade environment remains precarious.” Services tell a different story, with services trade continuing to outperform goods trade and providing a partial buffer to global trade activity despite broader fragmentation. Expanding by 6.8% in 2024 and moderating to 4.6% in 48
WEJ | May-July 2026
2025, global services exports are expected to ease further to around 4.4% in 2026, according to the Global Trade Outlook and Statistics (October 2025 Update) published by the World Trade Organization. Meanwhile, merchandise trade growth has been sharply revised downward to roughly 0.5% for 2026 after reaching about 2.4% in 2025. Within services, digitally delivered services remain the fastest-growing component of global trade, expanding across business services, finance, logistics coordination, and information services, even as physical trade faces mounting constraints.
FOREIGN DIRECT INVESTMENT CONCENTRATION OVER EXPANSION
In Foreign Direct Investment (FDI), intense concentration and targeted specificity within sector selectivity define controlled, cautious, cross-border capital allocation. Appearing robust, headline FDI inflows rose by 14% in 2025, as highlighted by the United Nations Trade and Development Global Investment Trends Monitor (No. 50). The figures indicate that inflows to developed markets jumped 43%, largely driven by European economies, yet investment into developing economies declined by 2%, with lower-income countries experiencing stagnation, illustrating the concentration of capital allocation. Greenfield investment further consolidated with fewer, larger projects. Overall project counts fell, while total project value concentrated within a smaller number of large-scale commitments. Data reveal that technology-driven projects absorbed a dominant share of new capital, with digital infrastructure, semiconductors, and related high-tech assets together accounting for roughly two-thirds of global greenfield project value, with data center investment exceeding 20% of capital-concentrated activity. High investment in some areas, very restrictive in others, generous allocation in some sectors, and tight dispersion in others, together, emphasize the motive of interest behind the investment trend.
FOCUSED INVESTMENT PATTERNS AND NARROW MARKET LEADERSHIP
Shifts in national policy, international frictions, and ongoing disruptions mean that recovery is uneven across markets and regions. Recent data show that some sectors are recovering faster than others, while overall volatility remains high. While allocation diversification remains a key objective for investors, capital is concentrating in industries with scale, strategic importance, and consistent demand. Even as select export-oriented services and traditional industries like transport, hospitality, and industrial metals show renewed activity, dispersion across sectors
PHOTO: SHUTTERSTOCK
Global Trade: Services vs Goods Divergence
WORLD ECONOMIC JOURNAL
continues; many remain cautious, keeping investors in defensive positions. Market leadership is dominated by large technology firms, reflecting where growth is strongest and earnings are concentrated. In 2024, large-cap technology earnings per share grew 37.6%, compared to 7.7% for the broader S&P 500, reinforcing the narrowness of earnings expansion. With aggregate FDI flow in fragmented, concentrated recovery, and global trade structurally subdued, financial markets are increasingly shifting focus from traditional capital-intensive investment to a landscape of asset-light, digital, and service-based activity.
DIGITALIZATION AS A FOUNDATIONAL ECONOMIC LAYER
Similar patterns are visible across OECD economies, where software, data services, and digital platforms make up a growing share of economic output, a trend mirrored globally. At the user level, this value creation is accessed through simple, portable technologies rather than capital-intensive equipment or infrastructure. Across both advanced and emerging economies, the smartphone is often the primary, and, at times, the only, means of accessing the internet and managing functions of everyday life. Approximately 54% to 63% of the world's population now own a smartphone, with roughly 4.6 billion people using mobile internet.
Beyond the adoption of digital devices, mobile apps, and payment platforms, the expansion of ‘digital utility’ is not confined to consumer-facing services. Increasingly embedded into fundamental social and economic functions, the integration of digital technologies into traditional sectors and services, while rapidly evolving, increasingly depends on accessibility or division of the digital infrastructure. While digital technology is physically intensive, its complex infrastructure is largely invisible.
Narrow Market Leadership in Equity Earnings 37.6% Large-cap technology EPS growth Broader S&P 500 EPS growth
7.7%
Earnings growth in 2024 was heavily concentrated in large-cap technology firms, underscoring narrow market leadership.
49
[ TECHNOLOGY ]
Privately owned and operated, behind the corporate entities commonly grouped as Big Tech, including Alphabet, Amazon, Apple, Meta, and Microsoft, sits a dense layer of infrastructure, platforms, data, and services that deliver digital capacity at a global scale. Hyperscale data center campuses, often located in remote regions and extending across millions of square feet, are no longer unusual environments. Tens of thousands of kilometers of subsea fiber-optic cabling span oceans and continents, largely unseen, yet critical and increasingly vulnerable infrastructure. At scale, individual data center campuses can require hundreds of megawatts of energy capacity, sufficient to power cloud network architectures of global reach. These globally interconnected connectivity networks, engineered for high-speed routing, distributed computation, and interoperability, bypass traditional telecommunications bottlenecks, instead functioning as a backbone layer of global communication and economic productivity. In this sense, Big Tech not only delivers global digital capacity, but they also shapes access, rules, and economics of that capacity. 50
WEJ | May-July 2026
SYSTEMIC DOMINANCE AS A CATALYTIC FORCE
Although 'digital transformation’ has occurred in waves, it is within the last decade that Big Tech firms have consolidated their dominance and influence. Shifting from a hardware-led era to one centered on software and internet services reflects not just technological continuity, but a change in who holds power. While technology endures, tech companies that dominate the market today (Big Tech) are fundamentally different from those that dominated in earlier cycles. Driven by unprecedented capital inflows, reinforced by ownership and control over global digital capacity, and amplified through acquisitions and digital ecosystem lock-in, Big Tech has strengthened its hold across markets and infrastructure, shaping the rules and levers of digital activity and both the market perceptions and political opinions indicative of it. Coupled with data-driven power and extensive intellectual capital, these forces converge to create a formula of dominance across the sector and their position within the broader economic system. To this effect, Big Tech’s role now extends far beyond that of a passive utility provider. It functions as an active, tangible,
PHOTO: SHUTTERSTOCK
FROM REVENUE TO CAPACITY: A STRATEGIC INTEGRATION
WORLD ECONOMIC JOURNAL
and dynamic enabler of the global economic and social system. A complex position that carries significant and farreaching implications.
PRODUCTIVITY TRANSMISSION BEYOND THE TECHNOLOGY SECTOR
Studies by the OECD and national research institutions indicate that digital adoption raises firm-level productivity across a wide range of sectors and markets. In the Netherlands, results from the analysis of digital adoption for firm-level productivity, measured by digital skill intensity, suggest a positive impact on productivity and growth in the services sector and for younger firms. In African regions such as Tanzania and Nigeria, World Bank research indicates that digital inclusion is associated with increased employment and income. However, digital transformation is not yet widespread, and largely, digital divides and deficits remain. In India, companies are heavily investing in analytics to improve customer-centric growth and operational agility. Between 2005 and 2011, India’s IT sector emerged as a transformative force for economic mobility. Academic research suggests that the nation became a global hub for IT services despite only 25% of households having computer access. This digital transformation created particular opportunities for women and disadvantaged groups, with business process outsourcing firms providing new career pathways through digital skills training. The economic relevance of Big Tech also extends beyond direct productivity output and employment. Evolving data suggests that the uptake of generative artificial intelligence technology usage is spreading rapidly across both workplace and non-workplace contexts and already altering task composition, lowering coordination costs, and reshaping skill demand across the economy.
DIGITAL INFRASTRUCTURE AS A SOURCE OF STABILITY
As the multilateral trading system faces mounting strain, digital infrastructure has become an increasingly significant component of global economic activity. “The digital economy is booming,” notes the United Nations Trade and Development, in its Digital Economy Report 2024. Annual smartphone shipments “have more than doubled since 2010, reaching 1.2 billion in 2023,” while the number of internet-of-things devices is projected to rise “to 39 billion by 2029.” Across 43 countries representing roughly three-quarters of global GDP, business e-commerce sales “grew nearly 60% from 2016 to 2022, reaching $27 trillion.”
World Bank research indicates that digital inclusion is associated with increased employment and income The extent to which digital integration can offset disruptions in physical trade and production remains uncertain, although these figures highlight how digital systems increasingly underpin global flows of services, information, and coordination. Under these conditions, the economic contribution of large technology firms becomes more visible, not as drivers of acceleration, but as stabilizers of continuity. By maintaining investment in digital infrastructure, advanced computing, and research-intensive systems, large technology firms have helped preserve elements of future growth potential even as near-term conditions remain uncertain. In this sense, their contribution lies not in driving cyclical expansion but in limiting the erosion of the productive base during a period of prolonged adjustment. While digital infrastructure helps preserve productive capacity, growth is no longer enough. For much of the previous decade, large technology firms were rewarded for scale and speed; yet, with rising borrowing costs and elevated debt levels, investors are being forced to rethink long-term capital allocation as financing costs rise and economic growth expectations moderate.
DEBT DISTRESS DRIVING A SHIFT TO CAPITAL DISCIPLINE
Because interest rates are higher and the economy feels uncertain, investment capital is now allocated with caution. Money has become more cautious. Increasingly, investors are allocating capital to assets that are durable enough to survive shocks, predictable, and cash-ready. The OECD Global Debt Report 2025: Financing Growth in a Challenging Debt Market Environment, indicates that with aggregate central government debt in its member countries approaching 85% of GDP, the era of “cheaper” money has reversed, limiting the capacity to finance future investment needs. This distinction has reshaped the composition of capital expenditure rather than its overall direction. Tech is still attractive to investors, but the rules have changed. Rather than rewarding expansion for its own sake, markets now place stricter weight on capital efficiency, which tech companies qualify with the capacity to sustain investment through the cycle. This has altered the ‘free pass’ subjective calculus of investor allocation, now encouraging 51
[ ANALYTICS ]
MANUFACTURING REALIGNMENT IN ASIA: INDIA’S POSITION IN GLOBAL SUPPLY CHAINS
PHOTO: VISHAL KUMAR / UNSPLASH
By Michael Stroup The United States
56
WEJ | May-July 2026
WORLD ECONOMIC JOURNAL
57
G
lobal supply chains are evolving through the confluence of two important impacts, each creating a new layer of uncertainty in developing and maintaining cross-border production networks. First, the imposition of American tariffs on China in 2018, imposed under Section 301 of the U.S. Trade Act, which was followed by subsequent rounds of Chinese retaliatory measures. This deteriorating relationship altered the landscape of global manufacturing and impacted major emerging economies like India. Second, the COVID-19 pandemic exposed vulnerabilities in geographically concentrated supply chains, prompting both developed and emerging nations to reassess their risks associated with a heavy reliance on single-country sourcing for trade and supply chain relationships. Much debate has arisen over whether the global economy is entering a period of deglobalization. This has spawned the term “China+1”, or a strategy where multinational firms maintain a substantial production presence in China while adding additional manufacturing locations in other countries. While the phrase has become widely used in business and policy discussions of this era, this strategy does
58
WEJ | May-July 2026
not imply a wholesale exit from China supply chains. Rather, it reflects a risk-management approach where firms seek to diversify production processes geographically to reduce economic risks. Rather than deglobalization, much of the available empirical evidence suggests global markets are exhibiting a more nuanced pattern of supply chain involving a reconfiguration of the existing manufacturing geography. Effectively, production networks are being reorganized rather than systematically dismantled. Understanding this distinction is essential for properly evaluating the expected impact on the Indian economy. For example, tariff changes may induce trade diversion, which essentially is a substitution effect wherein production shifts from one country to another in response to relative price changes. Such diversion can generate rapid export growth in alternative suppliers without fundamentally altering the value added derived from their domestic industrial structure. This contrasts with structural upgrading, which involves deeper transformations within an economy. Such upgrading raises the value added to a nation’s domestic production via shifts in technological capability or supplier networks. Assessing the difference is key. Today, India is the fourth largest economy in the world (4.5 trillion US$), offers the world’s second largest labor force (600 million people), and engages in over 1.3 trillion US$ of global trade annually (World Bank, 2026). The Indian economy has experienced rising foreign investment inflows and rapid growth in certain export sectors. The Indian government has instituted an expansion of industrial policy initiatives such as the Production Linked Incentive (PLI) schemes (OECD, 2023a). The Indian population exhibits a comparatively young demographic profile, and a commitment to expanding infrastructure investments, all of which have strengthened perceptions that India may benefit from global supply-chain diversification. In all, it appears India is well-positioned to capitalize on this evolving world. Yet significant challenges remain that raise questions about the depth and sustainability of such a transformation, including overcoming logistics constraints and reducing existing regulatory complexity. This analysis conceptually examines the incidence of trade diversion within the Indian economy relative to structural upgrading to glean insights into this challenge. This requires examining the sectoral dynamics of the broader Indian economy to draw comparisons with competing exporters like China, Southeast Asia, and Mexico. Such insights can reveal the long-term sustainability of India’s manufacturing expansion to take advantage of the tumultuous trade relations between the U.S. and China. India has selectively benefited from global diversification pressures in certain manufacturing sectors. However, the depth of such structural transformation remains uneven
PHOTO: AJ33 / PEXELS.COM
[ ANALYTICS ]
WORLD ECONOMIC JOURNAL
across those sectors most affected by the restructuring of global value chains. It appears that long-term outcomes are closely tied to the quality and scope of India’s domestic infrastructural, regulatory, and technological adjustments.
GLOBAL SUPPLY CHAIN RECONFIGURATION: MECHANISMS AND EVIDENCE
The shifts in global manufacturing geography since 2018 are highly correlated with changes in U.S. trade policy (Alfaro & Chor, 2023). Tariffs imposed under Section 301 of the Trade Act were applied to a broad range of Chinese goods and were implemented in several waves, raising hundreds of billions of dollars from U.S. imports. While the direct objective of these measures was to address trade imbalances and technologyrelated national security concerns, their cumulative effect was to alter the relative prices from across a myriad of global supply chains. The effects were far-reaching, where even moderate tariff differentials had a significant impact on firms operating within highly integrated production networks and supply chains. One measurable consequence has been a reorientation of U.S. import shares, as appear in Table 1. One U.S. government report found that China’s share of total U.S. imports declined by five percentage points from 2018 to 2022 (USITC, 2023). Alternative suppliers, like Vietnam and Mexico, experienced corresponding trade share increases during this time while India’s share of U.S. imports rose only modestly. These shifts do not imply that total export production simply “moved” from China to other countries. Indeed, intermediate goods for several sectors continued to be produced in China, with the final assembly being shifted elsewhere to defray tariff exposure. This implies these trade number adjustments cannot be fully explained solely by changes in tariff policies. For example, the COVID-19 pandemic exposed vulnerabilities in supply chains that were highly geographically concentrated. Temporary factory shutdowns, shipping bottlenecks, and semiconductor shortages exposed the risks associated with depending highly upon a single country’s economy for the supply of critical imported goods. Afterwards, multinational firms reassessed the resilience of their production cost structures to global supply chain shocks. When the tariff-filled disputes between the world’s two largest economies was imposed upon this transitional environment, production decisions increasingly re-examined the tension between economic efficiency and supply security. It is within this global context that the concept of “friendshoring” (a term originated by Javorcik et al., 2022) gained prominence, which describes a strategy where sectors in national economies prioritize trade and investment relationships with politically aligned or strategically trusted trading partners. While the traditional concept of offshoring is driven primarily by the pursuit of cost
Table 1. Post 2018 U.S. Import Share Reorientation U.S. Import Share (%)
2017
2023
China
21.6
13.5
Mexico
13.4
15.2
Vietnam
2.1
4.3
India
2.0
2.8
minimization, friend-shoring incorporates geopolitical risk into supply chain sourcing decisions. This focus contrasts with the concept of “nearshoring,” which involves relocating production geographically closer to end markets (like U.S. firms expanding operations in Mexico). It also contrasts with the concept of “regionalization,” which reflects increasingly concentrated supply chains that arise within geographic trade blocs. The current tariff environment has intensified businesses to diversify supply risks by avoiding certain trade exposures, raising questions about whether global trade is entering a phase of deglobalization or geopolitical divergence. While deglobalization implies a sustained contraction in cross-border trade and value chains, divergence reflects a reorganization of production into more regionally or politically aligned blocs without an overall collapse in trade intensity. Aiyar et al. (2023) argue that aggregate trade data reveal reconfiguration rather than contraction in global supply chains. After the pandemic-induced decline in 2020, merchandise trade volumes rebounded and cross-border production networks remained interconnected. Intermediate goods continue to represent a substantial share of global trade, indicating ongoing multinational integration. As the WTO (2023) observes, “Trade is not retreating but is being reconfigured along geopolitical lines.” To clarify this reconfiguration dynamic, it is useful to compare three economies—China, Vietnam, and Mexico—each representing a distinct supply-chain model and serving as a benchmark for alternative manufacturing hubs. China China remains the world’s largest manufacturing economy in terms of value added and export scale (World Bank, 2026). Over several decades, it has developed dense industrial clusters that integrate upstream suppliers, component producers, logistics providers, and final assemblers (World Bank, 2020). Its manufacturing ecosystem spans electronics, machinery, chemicals, textiles, and capital goods, among 59
[ ANALYTICS ]
Vietnam Vietnam represents an agile export-platform model. Over the past decade, it has integrated rapidly into East Asian electronics value chains, attracting significant foreign direct investment in assembly operations (Freund et al., 2023). Its export-to-GDP ratio is high relative to its economic size (World Bank, 2024) and multinational firms have used it as a supplementary production base under “China+1” strategies. Vietnam’s gains in U.S.-bound exports following the tariff escalation illustrate how smaller economies can capture trade diversion when they are closely embedded in regional supply networks (UNCTAD, 2024). Mexico Mexico reflects a situation of nearshoring within a regional trade bloc. Under the United States–Mexico–Canada Agreement (USMCA), Mexico enjoys preferential access to the U.S. market and deep integration in sectors such as automotive manufacturing and electronics (Freund et al., 2023). Geographic proximity reduces shipping times and inventory costs, making Mexico an attractive location for firms seeking to shorten supply chains while maintaining access to North American consumers (UNCTAD, 2024). In recent years, nearshoring dynamics have reinforced Mexico’s role as a regional manufacturing hub. These three cases illustrate distinct pathways in global manufacturing evolution: ecosystem depth, export-platform agility, and regional integration. Rather than disappearing, trade flows are being redistributed as firms diversify geographically. Whether India can structurally adapt to capitalize on this shift remains the central question. 60
WEJ | May-July 2026
“China+1” is a strategy where multinational firms maintain a substantial production presence in China while adding additional manufacturing locations in other countries INDIA’S INDUSTRIAL CAPACITY: STRENGTHS AND STRUCTURAL CONSTRAINTS
India’s ability to benefit from global supply-chain reconfiguration depends on the strength of its domestic industrial capacity and the quality of its institutional environment. These key characteristics will determine the underlying economic strengths of its current economic infrastructure, the effectiveness of its regulatory environment, and the capacity to deeply integrate its manufacturing sectors to adapt to evolving global value chains.
Structural Strengths of India’s Economy Perhaps India’s most immediate advantage lies in the mere scale of its domestic production. As one of the largest and fastest-growing global economies, India offers multinational firms both a viable export platform and access to its expanding domestic market. And unlike smaller exportdependent economies, India’s economic growth does not rely primarily on volatile, external demand. Further, its young national demographic profile fuels a steadily growing consumer demand, providing a valuable counterbalance to the high volatility that external markets exhibit. India holds three structural advantages over many regional competitors. First, its working-age population
PHOTO: ADANI GROUP
other sectors. Even where final assembly shifts abroad, Chinese firms frequently remain embedded in upstream segments of production (Freund, et al., 2023). As such, China serves as the baseline case: a deeply integrated, large-scale manufacturing ecosystem that is difficult to replicate quickly.
WORLD ECONOMIC JOURNAL
PHOTO: SHUTTERSTOCK
continues to expand, unlike the aging demographics of China and several Southeast Asian economies (OECD, 2023a; World Bank, 2024). Second, manufacturing wages remain below China’s, preserving cost competitiveness in labor-intensive and assembly sectors. Third, expanded tertiary and technical education over the past two decades has produced a large cohort of engineering and IT graduates supporting both services exports and emerging manufacturing capabilities. Together, these factors strengthen India’s long-term prospects as a diversified production base. India’s public sector has pursued targeted industrial policy to strengthen its regional competitiveness. Introduced in 2020, the Production Linked Incentive (PLI) scheme provides performance-based fiscal incentives to firms that expand domestic manufacturing beyond a defined base level (Ministry of Commerce and Industry, 2020). Rather than offering unconditional subsidies, it ties support to incremental production and investment in sectors such as electronics, pharmaceuticals, and automotive components. The policy aims to attract investment, expand capacity, and deepen participation in global value chains. In parallel, public investments in highways, freight corridors, and port modernization seek to reduce logistics bottlenecks (World Bank, 2023a). Infrastructure, Logistics, and Regulatory Frictions in India’s Economy Together, economic scale, advantageous demography, and public policy focus help explain why India is frequently identified as a candidate beneficiary of global supply-chain diversification. Yet these strengths coexist with structural constraints that complicate the translation of global trade reallocation opportunities into accommodating industrial transformation. While India has improved its logistics performance over the past decade, much room for improvement remains. For example, the World Bank (2023b) has developed a Logistics Performance Index (LPI) for 139 countries. While India’s economy improved from 54th in 2014 to 38th in 2023, the report noted that this still middling ranking was partly the result of Indian business logistics costs (expressed as a share of GDP) remaining relatively high compared to its major manufacturing competitors. For just-in-time global production networks, like electronics and automotive components, supply predictability and production speed can be just as important as wage levels (OECD, 2023a). While India’s federal system has focused on subsidizing specific sectors under policies like the PLI, it also allows for a highly complex and varied system across its states governing land acquisition procedures, contract enforcements, and administrative processes. Such an environment reduces predictability and consistency in facilitating economic
opportunities, weighing heavily on multinational corporations seeking long-term capital commitments (World Bank 2023b). India’s financial system presents an additional structural constraint. Although the banking sector has strengthened, credit access remains uneven, with small and medium-sized enterprises (SMEs) facing higher risk-adjusted barriers than large firms (Reserve Bank of India, 2024). As SMEs are often key suppliers within manufacturing ecosystems, such limited access to capital constrains upgrading and reduces sectoral flexibility. This financial sector scenario favors expansion at the assembly stage while limiting deeper upstream development. Manufacturing Depth and Global Value Chain Integration Despite policy emphasis on industrial expansion, Table 2 reveals India’s value-added manufacturing as a share of GDP remains lower than most East Asian benchmarks. India’s growth path over the past two decades exhibits a much larger expansion of its services sector than its manufacturing sector (World Bank, 2026). While a services orientation in an economy provides strengths in digital integration and business services, it also reduces India’s dependency on export-intensive manufacturing sectors. Countries deeply embedded in global value chains (GVCs) rely on imported intermediate goods for processing and re-export, often supplying inputs used in other countries’ final exports. In this way, India participates in global production networks across pharmaceuticals, chemicals, textiles, and certain electronics segments (World Bank, 2020). Backward integration in complex manufacturing supply chains remains shallower in India
61
[ ANALYTICS ]
than for regional competitors, such as Vietnam or China (OECD, 2023a). This configuration has two implications. First, India’s relatively higher domestic value-added share in some exports may reflect less intensive integration into multi-country production networks, rather than deeper technological sophistication. Second, limited upstream component ecosystems can constrain the speed at which new assembly operations translate into the broad-based industrial upgrading needed for sector restructuring. India’s ability to navigate global restructuring will depend on the balance between its structural strengths and weaknesses. Strengths include domestic market scale, favorable demographics, relatively low wages, and targeted industrial policy. Weaknesses include regulatory inconsistency and persistent logistical inefficiencies across states. As a result, manufacturing transformation is likely to proceed incrementally rather than through rapid systemic change.
SECTORAL TRANSMISSION CHANNELS: DIVERSIFICATION AND INDUSTRIAL DEPTH
Global supply-chain reconfiguration does not affect all sectors of a nation’s economy uniformly. To evaluate how India will likely respond to global diversification pressures, it is useful to distinguish between those sectors with high trade diversion with moderate upgrading potential, and those with moderate trade diversion with higher upgrading potential. This distinction helps clarify why rapid export growth in some industries may not automatically translate into durable industrial deepening. High Trade Diversion with Moderate Upgrading Potential A clear example of high trade diversion with moderate upgrading potential is electronics manufacturing, particularly mobile phone assembly. Tariff escalation has encouraged multinational firms to diversify assembly across multiple countries to reduce tariff exposure and minimize geopolitical risk. Because electronics production is modular, final assembly can relocate without restructuring upstream component supply. Semiconductor fabrication, advanced components, and design functions therefore remain concentrated elsewhere (Freund et al., 2024). India’s mobile phone exports rose from roughly $3–4 billion in 2017–18 to over $15 billion by 2023–24, making electronics one of its fastest-growing export categories (Ministry of Commerce and Industry, 2024). Total electronics exports now exceed $25–30 billion annually, reflecting rapid assembly expansion under the PLI scheme (Ministry of Commerce and Industry, 2024). This growth aligns with “China+1” strategies, as firms retain core operations in China while adding supplementary assembly capacity elsewhere. However, the upgrading potential within this configuration is relatively moderate. A substantial share of 62
WEJ | May-July 2026
intermediate components continues to be imported, limiting domestic value-added growth. Supplier ecosystems in India remain less dense than in established East Asian production hubs (Ministry of Commerce and Industry, 2024). The result is a pattern in which export volumes expand rapidly, but upstream integration and technological depth advance more gradually. Such sectors illustrate how trade diversion can generate visible gains without immediately producing comprehensive industrial transformation. Moderate Trade Diversion with High Upgrading Potential Other sectors of the Indian economy may exhibit less dramatic tariff-driven relocation impacts but still possess greater long-term upgrading potential. While India is already a major exporter of generic drug formulations, many parts of its pharmaceutical supply chain remain dependent on imported intermediate goods (World Bank, 2020). While global concerns about supply resilience in health-related industries have encouraged diversification of product sourcing around the world, value chain relocation in this sector is more complex than in electronics assembly. This means India’s existing drug manufacturing sector already is heavily reliant on regulatory compliance, quality assurance systems, and capital-intensive production facilities for both imports and exports. Upstream chemical synthesis, process engineering, and compliance expertise contribute to higher value-added segments of the production chain. This means achieving deeper pharmaceutical and chemical sector upgrading involves acquiring more substantial skilled labor accumulation and technological integration than most assembly-driven sectors. Consequently, sectors in this category tend to expand more gradually but potentially offer greater prospects for lasting structural deepening. These sectors are less sensitive to short-term tariff changes and more dependent on sustained investment, regulatory credibility, and skill development.
Table 2. Value-Added Manufacturing Country
Manufacturing (% of GDP)
Services (% of GDP)
China
26
52
Vietnam
24
41
Mexico
18
60
India
16
54
PHOTO: SHUTTERSTOCK; JEAN-MICHEL GOBET / CC BY-SA 3.0; KAVALI CHANDRAKANTH KCK / CC BY-SA 4.0
WORLD ECONOMIC JOURNAL
63
PHOTO: SHUTTERSTOCK
[ MARKETS ]
68
WEJ | May-July 2026
WORLD ECONOMIC JOURNAL
VIETNAM AS A MANUFACTURING ALTERNATIVE: EXPORTS, INDUSTRY, AND SUPPLY CHAINS UNDER U.S. TARIFF PRESSURE By Hunter Hughes The United States
69
[ MARKETS ]
Vietnam's Exports to the United States (2017–2025) $180B $163B $160B
Exports (USD Billions)
$142B $140B
Tariffs on China reach 145%
$120B
Phase One agreement
$100B
$96B
$109B
$115B
2021
2022
2023
Section 301 tariffs on China begin
$80B
$77B $60B
$61B
$47B $49B
$40B 2017
2018
2019
2020
2024
2025
Source: U. S. Census Bureau; General Administration of Customs of Vietnam
THE NEW GEOGRAPHY OF GLOBAL MANUFACTURING
When the United States began imposing sweeping tariffs on Chinese goods in 2018, the immediate question for multinational corporations was not whether to diversify their supply chains, but where to go. Seven years later, the answer has become increasingly clear: Vietnam has emerged as one of the most significant beneficiaries of the global manufacturing realignment, transforming itself from a lowcost assembly base into a critical node in the world's most sophisticated supply chains. The numbers tell a striking story. Vietnam's total export turnover reached a record USD 475.1 billion in 2025, representing 17 percent year-on-year growth. Its trade surplus with the United States hit USD 123.5 billion in 2024, making it the fourth-largest source of the American trade deficit after China, the European Union, and Mexico. The country's GDP grew at 8.02 percent in 2025, one of the highest rates in nearly three decades, driven in large part by an industrial production surge of 9.23 percent and manufacturing output growth of 10.5 percent. Yet this rapid ascent raises fundamental questions about sustainability, structural vulnerabilities, and the limits of an export-led growth model that remains deeply dependent on foreign capital and external demand. This article examines how U.S. tariff policy has reshaped manufacturing flows toward Vietnam, the sectors driving this transformation, the constraints that threaten to slow it, and the country's 70
WEJ | May-July 2026
competitive position within an increasingly contested landscape of alternative manufacturing destinations.
HOW U.S. TARIFFS RESHAPED GLOBAL MANUFACTURING GEOGRAPHY
The U.S.-China trade war, which began with tariffs on USD 34 billion worth of Chinese goods in July 2018 and escalated to cover the vast majority of bilateral trade, set in motion the largest reallocation of global supply chains in modern economic history. Between 2017 and mid-2025, China's share of U.S. imports fell from 21 percent to approximately 9 percent, according to analysis by the National Bureau of Economic Research. The trade that left China did not disappear; it was redistributed, primarily among existing top-20 U.S. trading partners. Vietnam was among the most prominent recipients. The logic was straightforward: the country offered low labor costs, an established light-manufacturing base, geographic proximity to Chinese supply networks, a young and growing workforce, and an expanding portfolio of free trade agreements. For companies seeking to maintain access to the American market while reducing exposure to China tariffs, Vietnam represented a viable, if imperfect, alternative. The "China Plus One" strategy, adopted by corporations across industries from electronics to textiles, was not a rejection of Chinese manufacturing capabilities but an insurance policy against tariff risk. Vietnam's appeal
WORLD ECONOMIC JOURNAL
was that it could absorb portions of Chinese production without requiring companies to abandon their existing Chinese supplier relationships entirely. The country's shared border with China, its established logistics corridors connecting Vietnamese industrial zones to Chinese component suppliers, and its cultural familiarity with East Asian business practices made it a natural secondary manufacturing base for firms already embedded in Chinese supply chains. The acceleration intensified under the second Trump administration. In 2025, tariffs on Chinese goods reached 145 percent during peak escalation periods, before settling at a base rate of approximately 30 percent following a U.S.-China trade agreement. During this period, Vietnam faced a lower, though still significant, tariff threat of 46 percent, which was paused for most of 2025. This differential created a powerful incentive for Chinese manufacturers themselves to relocate production to Vietnam. The New York Times reported in May 2025 that Chinese factories producing everything from jeans to Christmas wreaths were accelerating moves to Vietnam, with e-commerce platforms helping businesses find manufacturing alternatives outside China. The pattern is visible in the data. Vietnam's exports to the United States grew from approximately USD 47 billion in 2017 to USD 142.4 billion in 2024, a threefold increase in seven years. In the first half of 2025 alone, the U.S. trade deficit with Vietnam surged to USD 81.3 billion, up 44 percent year-on-year. Vietnam now accounts for approximately 30 percent of its GDP in exports to the United States—the highest ratio of any U.S. trading partner, according to Reuters.
PHOTO: HUỲNH TẤN HẬU / UNSPLASH
THE INDUSTRIAL STRUCTURE: WHAT VIETNAM ACTUALLY MAKES
Vietnam's export profile has undergone a dramatic transformation over the past decade. What was once an economy dominated by agricultural commodities, crude oil, and low-end garment manufacturing has become one of the world's leading exporters of electronics, computers, and telecommunications equipment. Electronics now dominate. In 2025, exports of electronics, computers, and components reached USD 107.74 billion, a 48.4 percent increase over the previous year. Phones and components added another USD 56.7 billion, bringing the combined electronics-related total to approximately USD 164.4 billion—more than a third of Vietnam's total export revenue. Electronic components alone accounted for USD 72.56 billion, up 27 percent yearon-year. Vietnam now ranks as the fourth-largest electronics exporter globally. Textiles and garments remain a significant sector, though their relative share of total exports has declined as
electronics have surged. Footwear and apparel continue to be important export categories, with major brands including Nike maintaining substantial production operations in the country. The textile sector provides employment to millions of workers and serves as an entry point for lower-skilled labor into the formal manufacturing economy. Vietnam is the world's third-largest garment exporter, behind China and Bangladesh, and the second-largest footwear exporter globally. These sectors, while less headline-grabbing than electronics, remain foundational to the country's employment structure and export base. The semiconductor and advanced components segment represents a newer but rapidly expanding frontier. Vietnam imports semiconductors and electronic components primarily from China, which supplies approximately 45 percent, and South Korea, which provides around 30 percent. These inputs are essential for assembly operations that constitute the bulk of Vietnam's electronics output. The value chain position is clear: Vietnam performs mid-stream assembly and testing rather than upstream design or wafer fabrication. Nevertheless, ambitions are growing. Foxconn's USD 80 million chip manufacturing project in Bac Giang and increasing investment in semiconductor testing and packaging point toward gradual movement up the value chain, even if the gap with leaders such as Taiwan, South Korea, and the United States remains vast. Machinery and mechanical equipment have also grown as an export category, reflecting a gradual broadening of Vietnam's industrial capabilities. However, the overall pattern remains one of concentration: the top export categories are overwhelmingly electronics-related, and 71
[ MARKETS ]
Vietnam's Export Composition by Sector (2018–2025)
$350B
Electronics & Phones
Footwear
Textiles & Garments
Machinery
Export Value (USD Billions)
$375B
$331B $305B
$292B
$300B $250B
Other
$243B
$264B
$323B
$252B
$200B $150B $100B $50B $0B
2018
2019
2020
2021
2022
2023
2024
2025
Sources: Vietnam General Statistics Office; Vietnam Customs
the production is overwhelmingly conducted by foreigninvested enterprises. According to Vietnam's General Statistics Office, foreign-invested firms accounted for approximately 77 percent of total exports in 2025, while the domestic enterprise sector weakened noticeably.
VIETNAM IN GLOBAL SUPPLY CHAINS: THE FDI ENGINE
Vietnam's manufacturing transformation is, in essence, a story of foreign direct investment. The country attracted USD 38.42 billion in registered FDI in 2025, with realized FDI reaching USD 27.62 billion—the highest in the 2021–2025 period. Manufacturing accounted for 82.9 percent of disbursed FDI in the first eleven months of 2025, underscoring the sector's dominance in the country's investment profile. Samsung Electronics is the single most consequential investor. Since entering Vietnam in 2008, Samsung has committed over USD 23.2 billion, operating six factories and one R&D center. Vietnam has become Samsung's largest mobile phone production base outside South Korea. In early 2026, Samsung announced an additional USD 1.8 billion investment in its Bac Ninh Display factory, expanding OLED screen production for smartphones, IT equipment, and automobiles. Apple's supply chain diversification has been equally significant, if more distributed. CEO Tim Cook stated in the second quarter of 2025 that the majority of products sold in the United States would be sourced from India and Vietnam. The number of Apple suppliers with 72
WEJ | May-July 2026
"Vietnam's continued appeal as a competitive manufacturing base will support growth, particularly from a recovery in global trade." — World Bank, Vietnam Economic Update, September 2025 manufacturing facilities in Vietnam grew from 27 in 2022 to 35 in 2023, making Vietnam the top destination for Apple's suppliers in Southeast Asia and the fourth-largest globally. Chinese electronics firm Desay Group, a core Apple supplier, announced an additional USD 25 million investment in Bac Ninh province. LG Display has injected an additional USD 1 billion into its Vietnamese operations, raising its total investment to USD 5.65 billion for OLED screen production. Foxconn announced an USD 80 million chip manufacturing project in Bac Giang. SpaceX revealed plans to invest USD 1.5 billion in Vietnam in September 2024. Intel continues to operate its largest global assembly and test facility in Ho Chi Minh City. This concentration of high-profile investors has created a self-reinforcing dynamic. As anchor tenants establish operations, their suppliers follow, creating clusters of manufacturing activity in provinces such as Bac Ninh, Bac Giang, Hai Phong, and Binh Duong. The result is an
WORLD ECONOMIC JOURNAL
increasingly dense network of production facilities, though one that remains largely controlled by foreign capital and managed within global corporate supply chains rather than domestic value chains. The geography of this investment is sharply concentrated. Northern Vietnam, particularly the Red River Delta provinces surrounding Hanoi, has become the center of gravity for electronics manufacturing. Bac Ninh province alone hosts Samsung's largest smartphone production complex and a growing cluster of display and component manufacturers. Neighboring Bac Giang has attracted Foxconn, Luxshare, and other firms supplying Apple and other global brands. Hai Phong, with its deep-water port and established industrial parks, serves as the primary logistics gateway for northern manufacturing output. In the south, Binh Duong and Dong Nai provinces anchor a more diversified manufacturing base that includes furniture, textiles, and consumer goods alongside electronics. Ho Chi Minh City functions as the commercial and financial hub supporting southern industrial operations, while also hosting Intel's assembly and test facility. Vietnam's system of industrial parks and export processing zones has been central to this geographic concentration. The country operates over 400 industrial parks nationwide, offering standardized infrastructure, streamlined regulatory procedures, and tax incentives to foreign investors. Occupancy rates in the most soughtafter parks in the north have exceeded 90 percent, driving up land rental costs and pushing newer entrants toward less-developed provinces. This pressure has prompted the government to accelerate industrial park development in central Vietnam and the Mekong Delta, though these regions currently lack the supplier density and logistics connectivity that make the northern and southeastern corridors attractive to electronics manufacturers.
PHOTO: QUANG NGUYEN VINH / PEXELS
INFRASTRUCTURE, LOGISTICS, AND LABOR: THE BINDING CONSTRAINTS
Vietnam's rapid industrial expansion has exposed significant infrastructure gaps that threaten to constrain future growth. The World Bank's March 2025 Economic Update identified energy, logistics, and transport infrastructure as priority areas requiring greater investment. The ASEAN Investment Report 2025 flagged port congestion and logistics capacity limitations as critical constraints affecting supply chain operations across the region, with Vietnam no exception. Energy infrastructure is perhaps the most pressing concern. As manufacturing scales up—particularly in energy-intensive sectors such as electronics and semiconductor assembly— Vietnam faces growing pressure on its power generation and distribution systems. Several industrial zones have experienced intermittent power shortages, and the country's transition from coal-dependent generation to renewable energy sources
Cumulative FDI by Investor In Vietnam (as of 2025) $23.2B
Samsung $5.7B
LG Intel
$1.5B
Foxconn
$1.5B
SpaceX
$1.5B
Other Major FDI
$0B
$5.0B
$5B
$10B
$15B
$20B
Cumulative Investment (USD Billions) Sources: Vietnam Ministry of Planning & Investment; corporate disclosures
remains a work in progress. Vietnam's Power Development Plan VIII, approved in 2023, aims to increase total installed capacity to 150 gigawatts by 2030, with an emphasis on offshore wind, solar, and liquefied natural gas. However, implementation has lagged behind targets, and investors have cited energy reliability as a factor in site selection decisions. Logistics performance, while improving, lags behind more developed manufacturing economies. Vietnam's port infrastructure has expanded considerably, with Hai Phong's Lach Huyen deep-water terminal and the development of the Cai Mep–Thi Vai port complex in the south representing major upgrades. However, inland connectivity—particularly road and rail networks linking industrial zones to ports— remains uneven. Lead times for small-batch production are competitive at seven to fifteen days, compared to China's thirty to sixty days, but large-scale logistics operations encounter bottlenecks. 73
[ MARKETS ]
MEXICO AS A MANUFACTURING ALTERNATIVE: NEARSHORING EXPORTS AND U.S. TARIFF PRESSURE By Jagat Prirayani Indonesia
78
WEJ | May-July 2026
PHOTO: DANIEL ESCOBEDO / CC BY-SA 4.0
WORLD ECONOMIC JOURNAL
79
[ MARKETS ]
G
80
WEJ | May-July 2026
"Mexico is the United States' top trading partner in 2023, with total goods exceeding $798.8 billion" — U.S. Census Bureau extreme debt crisis in 1982, Mexico liberalized its trade policy by reducing tariffs and privatizing state enterprises. Furthermore, Mexico joined the General Agreement on Tariffs and Trade (GATT) in 1986, thereby accelerating the country’s trade openness. Moreover, Mexico joined the North American Free Trade Agreement (NAFTA) in 1992, which became the basis for closer international trade among the United States, Mexico, and Canada. NAFTA provides Mexico with broad access to the U.S. market and has transformed Mexico from an oil-exporting country into an automotive and electronics exporter. Since the implementation of this agreement, trade between Mexico and the U.S. has increased significantly. In November 2025, Mexico exported $44.5 billion to the U.S. and imported $26.6 billion from the U.S.3 Mexico's top exports to the U.S. are computers, motor vehicles, and cars. On the other hand, Mexico's main imports from the U.S. are petroleum, motor vehicles, and petroleum gas. Due to a more intense trade relationship with the U.S., Mexico has become one of the most prominent nearshoring destinations for companies serving the U.S. market. Many countries seeking access to the U.S. market regard Mexico as the top destination for foreign direct investment or company relocation. 1 2
https://wits.worldbank.org/CountryProfile/en/Country/MEX/Year/2015 https://tradingeconomics.com/mexico/exports-by-category
PHOTO: DENNIS SCHRADER / UNSPLASH
lobalization has had a tremendous effect on how countries conduct international trade. With globalization, two countries with different competitive advantages can focus only on what they do best. By focusing on production competitiveness, the country can reduce production costs and set prices more competitively than those of other countries. Furthermore, this lower price can facilitate exports to countries that favor our products but have less competitive advantage. With higher exports, countries can earn income and use it to import goods they are not well-suited to produce. This scheme applies to all open countries nowadays, including Mexico. As an open-market economy, Mexico actively contributes to international trade. Some of the country’s commodities, such as automotive manufacturing and electric vehicles, have dominated international markets and become the primary imports of many countries. In the last decade, Mexico has shown an impressive export performance. The export surged from US$414 billion in 20151 to US$665 billion in 2025. Among exported commodities, vehicles other than railway accounted for 26%, followed by electrical equipment (17%) and machinery, nuclear reactors, and boilers (17%)2. However, while Mexico's exported commodities are diversified, international trade is less diversified in terms of its trading partners. By trading partner, most of these exports are directed to the United States, to which 85% are exported. Given their proximity, trade between the United States and Mexico is inevitable. According to the gravity theory, the very close geographic proximity between these two countries, only 2000 miles apart, can increase the potential benefits of trade for both parties. However, geography is not the only reason behind the tight international trade relationship between these two countries. Following an
WORLD ECONOMIC JOURNAL
2024-01-01
2020-01-01
2016-01-01
2012-01-01
2008-01-01
2004-01-01
2000-01-01
1996-01-01
1992-01-01
1988-01-01
1984-01-01
1980-01-01
Source: World Bank WDI
Source: World Bank WDI
Imports
Nov-25
Oct-25
Sep-25
Aug-25
Jul-25
Jun-25
May-25
60,000.00 50,000.00 40,000.00 30,000.00 20,000.00 10,000.00 0.00
Apr-25
Mexico's trade with the United States (million USD)
Mar-25
The concept of nearshoring is gaining popularity, particularly amid the recent, unprecedented U.S. tariff policy. In April 2025, U.S. President Donald Trump imposed high import tariffs on many U.S. trading partners to protect domestic producers and the long-run competitiveness of the U.S. trade sector. The country imposes double-digit import tariffs on many developing countries and is open to negotiation rather than a reciprocal response. However, what is more important is not which countries negotiated or disputed reciprocally, but that this situation has transformed the way the global economy shifts its trade policy. One policy response to the U.S. higher tariffs is firms' nearshoring to Mexico. This situation is evidenced by the companies' decision to relocate its operations to Mexico. The nearshoring of global firms to Mexico occurred long before Donald Trump’s recent import tariff policy. In 2017, the U.S. imposed higher import tariffs on China by gradually increasing the rate from 2.7% in 2017 to 19% by 2023, and then reached 164% in April 20254. The U.S.-China trade war intensified until it culminated in a 49% import tariff on U.S. products from China. However, although the policy was specifically imposed on China, as a global powerhouse, many countries that outsource component production to China faced significant challenges when entering the U.S. market due to higher costs. Mexico emerged as a primary alternative amid this situation. Given its proximity to the U.S. market, producing in Mexico can minimize transportation costs. Truck and rail transport from Mexico to the U.S. can take only days, rather than weeks, when it originates in China.
$ 700,000,000,000 $ 600,000,000,000 $ 500,000,000,000 $ 400,000,000,000 $ 300,000,000,000 $ 200,000,000,000 $ 100,000,000,000 $0
Feb-25
HOW U.S. TARIFFS AND TRADE POLICY SHIFTS HAVE ACCELERATED NEARSHORING TO MEXICO
Mexico Export Value ($)
Jan-25
Nearshoring is the relocation of business operations to locations near target markets. The objective of nearshoring is to serve the primary market more efficiently through supply chain strategy and transportation costs. Nearshoring is the opposite of offshoring, where the latter is defined as the movement of production to a distant country to reduce labor costs. Nearshoring differs from reshoring, which involves bringing production back to the home country. Finally, nearshoring differs from friend-shoring, which involves relocating supply chains to politically aligned or strategically trusted countries. This article examines the nearshoring phenomenon in Mexico, in which firms from other countries and global firms are relocating operations to Mexico to enter the U.S. market. Economic reasons are the primary motive for companies to nearshore their operations in Mexico. However, beyond that motive, the impact of this activity on Mexican economy is not necessarily positive. This article analyses Mexico's role in serving nearshoring demand from multiple dimensions. The analysis will be divided into several key questions.
Exports
"The average U.S. tariff on Chinese exports has risen sharply since 2018, significantly altering global supply chains" — Chad P. Bown Peterson Institute for International Economics, (PIIE), 2024 This can help companies reduce transportation costs and thus maintain competitive prices. Given the situation, firms strategically integrated their supply chains to increase production capacity in Mexico, alongside their existing manufacturing activities in China. In response to increased demand for nearshoring, Mexico also implemented strategies to capitalize on this momentum. One of the most important strategic decisions was to secure 3 4
https://www.census.gov/foreign-trade/balance/c2010.html https://www.congress.gov/crs-product/IF12990
81
[ ANALYTICS ]
the country's continued participation in the North American Free Trade Agreement (NAFTA). By participating in the agreement, Mexico secured free access to the U.S. market and long-term cooperation among the U.S., Mexico, and Canada. This guaranteed market access and proximity to the U.S. were strong selling points for attracting global firms to nearshore their operations in Mexico. Many countries
Mexico Total Exports (USD Billion) • US$414 billion (2015) • US$665 billion (2025) • US$416 billion (2020) • US$494 billion (2021) Source: https://data.worldbank.org/indicator/NE.EXP.GNFS. CD?locations=MX
82
WEJ | May-July 2026
positioned Mexico as a preferred site for component production to meet compliance thresholds. Furthermore, to support nearshoring demand, Mexico reformed its customs systems and border procedures. The reform involved digitalization efforts in cooperation with the U.S. authorities. In addition, Mexico implemented programs to attract additional investment, established workforce training partnerships, and offered tax incentives. The country also supported rising nearshoring demand by providing more stable macroeconomic conditions, such as a stable exchange rate, well-managed public debt, and an independent monetary policy, thereby ensuring long-run price stability.
THE ROLE OF USMCA IN SHAPING INVESTMENT, TRADE FLOWS, AND SUPPLY CHAIN DECISIONS
The United States-Mexico-Canada Agreement (USMCA) played a central role in shaping investment, trade flows, and supply chain decisions for countries nearshoring to Mexico. The agreement replaced NAFTA and entered into force in July 2020, serving as a basis for securing Mexico's market access to the United States and Canada. The USMCA provides free trade among the U.S., Mexico, and Canada for most goods, which signals legal certainty for global firms to locate operations in Mexico. For investors, this legal agreement is an essential factor in investment decisions. Since its implementation in 2020, Mexico has experienced robust trade growth with the US, making it the second-largest U.S. export market. The USMCA also has a significant role in promoting foreign direct investment in the country. The agreement has created a more predictable regulatory environment for investors, making them feel
PHOTO: KUKA GROUP
"The USMCA Modernizes NAFTA and strengthens North American competitiveness in the global economy" — Office of the United States Trade Representative (USTR) USMCA Fact Sheet, 2020
WORLD ECONOMIC JOURNAL
Vehicles Units exported (million unit) 4 3.5 3 2.5 2 1.5 1 0.5 0
2.7
2020
2.9
3.2
3.3
3.48
Monthly Automotive Exports (Units) • December 2025: 227 thousand units • Peak month (June 2025): 331 thousand units
2021
2022
2023
2024
Source: Trading Economics (based on INEGI data)
Source: World Bank WDI
safe to invest and relocate more companies. This decision creates additional employment opportunities for local residents and increases income. However, recent global economic turmoil has contracted the Mexican economy. In the third quarter of 2023, the Mexican economy contracted by 0.3%. Although the economy rebounded by 0.80% in the following quarter due to export activity, this indicates the need to examine the USMCA from both the U.S. and Mexican perspectives. The agreement remains a lifeline for Mexico, sustaining its economic growth, particularly amid the U.S.-China trade war, which has made Mexico the preferred alternative for other countries seeking to enter the U.S. market. Nevertheless, the agreement remains vulnerable to threats, including rising tariffs, political tensions, and water management issues. The U.S. president warned that a 5% tariff on Mexican exports would be imposed unless water flows to the U.S. increased. This could be a tradeoff between prioritizing the U.S. market and the Mexican domestic economy (including foreign investment in Mexico), which could affect foreign investors' preferences for nearshoring to Mexico.
MEXICO’S INDUSTRIAL STRUCTURE: AUTOMOTIVE, ELECTRONICS, MACHINERY, AND INDUSTRIAL MANUFACTURING
Automotive manufacturing is a key industry in Mexico. In 2024, Mexico was the fifth-largest vehicle producer worldwide, with total production of 3.99 million units, of which 3.48 million were exported5. This export activity has increased consistently over the past five years. Exports declined during the 2020 pandemic to 2.7 million units, increased to 2.9 million in 2021, and reached 3.48 million in 20246. Overall, vehicle exports have shown a positive trend over the last five years, signaling the resilience of this commodity in the Mexican market. This consistent export
dynamic not only reflects the resilience of the Mexican economy but also shows the growing demand for vehicles from other countries in Mexico. Most vehicle units are exported to the United States (80%), the top export destination, followed by Canada (8.5%), Germany (3.6%), Brazil (1.2%), and Colombia (0.9%). The primary centers of automotive production are located in Northern and central Mexico, near the U.S. border, which facilitates logistics management. Key manufacturers include GM, Volkswagen, Nissan, BMW, and Ford, which are distributed across various regions. For example, General Motors, Mazda, and Honda operate in the Bajío region; Nissan operates in Aguascalientes; Volkswagen operates in Puebla; Kia and Tesla operate in Nuevo León; and Stellantis and Ford operate in Estado de México. Electrical machinery and electronics are also another major manufacturing industry in Mexico. The country exported $113 billion in machinery and electronics, accounting for 3.28% of global exports. Most of the exports went to the United States as a top export destination, followed by India and Hong Kong. This performance put the country as the 9th largest exporters in electrical machinery and electronics in the world. Some of the major companies in this industry are Bosch, Deere, and Ford Motor. At the same time, the country also imports electrical machinery and electronics from other countries, notably from the United States, China, Vietnam, and Malaysia, making it the 8th largest importer in the world. Nearshoring has played a significant role in Mexico’s impressive export performance, particularly in automotive, electronics, machinery, and industrial manufacturing. Although some key manufacturers were already operating in the national market, nearshoring has accelerated 5 https://www.swissinfo.ch/spa/la-producci%C3%B3n-y-exportaci%C3%B3n-deautos-en-m%C3%A9xico-sube-m%C3%A1s-del-5-%25-en-2024/88698450? 6 https://www.importglobals.com/blog/mexicos-automotive-export-industry-acomprehensive-overview?
83
[ ANALYTICS ]
UZBEKISTAN’S REFORMS AS A CATALYST FOR ECONOMIC GROWTH By Dylan Waller The United States
88
WEJ | May-July 2026
WORLD ECONOMIC JOURNAL
PHOTO: SHUTTERSTOCK
U
zbekistan has significantly transformed its economy during the past decade, focusing on market reforms, export diversification, and other economic measures. Its economy has had resilient economic performance since the 1990s, most notably demonstrated by its ability to grow by over 8% during the Great Financial Crisis. While the economy has transformed significantly since 2017, Uzbekistan still has many market reforms that have been newly implemented or will be implemented by 2030. These initiatives could serve as a catalyst to help Uzbekistan develop a more robust private sector economy and fully exploit its resources and demographic dividend. Uzbekistan
stands out globally due to its high youth population, consistent economic growth, abundant natural resources, and geopolitical significance as Central Asia rises in power. There are still many hurdles for Uzbekistan to overcome. Uzbekistan’s cost of capital remains very high, putting a strain on SME oriented growth, and the private sector has been unable to keep up with the rapid influx of new youth entering the job market. Uzbekistan also needs to move forward with another wave of privatizations to help encourage continued foreign interest in the economy and stock market. The full realization of its potential depends on the success of continued economic reforms in the coming years. 89
[ ANALYTICS ]
“Over the past nine years, together with you and our people, we have gone through a significant path of development. Our economy has acquired the new quality, we have expanded market relations and social protection, and strengthened the rule of law. Most importantly, the results of our reforms are felt in every mahalla, every family, and by every individual in their daily lives,” said the Head of State in the beginning of his speech. “When we started this work, one-third of our population lived below the poverty line. Thanks to the implementation of a completely new social protection system, providing over 100 types of services—such as loans, subsidies, and compensations—delivered through the ‘seven’ in mahallas, more than 8.5 million people have risen out of poverty, and unemployment has been reduced by half. As a result, this year we achieved the target set three years ago to halve poverty by the end of 2026,” stated the President. —Shavkat Mirziyoyev President of the Republic of Uzbekistan Address to the Oliy Majlis, December 26, 2025 90
WEJ | May-July 2026
PHOTO: THE PRESS SERVICE OF THE PRESIDENT OF THE REPUBLIC OF UZBEKISTAN
EXAMINING REFORMS SINCE 2017
Beginning in 2017, Uzbekistan implemented a series of new reforms, including a liberalization of its exchange rate, price liberalization, adjustment of energy tariffs, and a focus on decreasing the state’s role in the economy. The Uzbek soum depreciated by over 50% overnight in September 2017, after the government moved away from this pegged rate. The combination of increased competitiveness in its exports and other reforms helped drive strong economic growth. Uzbekistan’s government continued to introduce other foreign-friendly initiatives in the 2020s designed to reduce the role of the state in the economy. Some of these reforms included abolishing business regulations of the government, introducing an anti-corruption agenda, creating additional international arbitration laws, abolishing select licenses and permits for new companies, and creating an E-government digital system. Uzbekistan’s economy also worked to obtain international credit ratings for 23 SMEs, and introduced new laws in 2023-2024 to improve the efficiency of state property management and reduce conflicts of interest in state organizations. These collective reforms played a key role in improving governance, reducing corruption risks, liberalising the economy, and helping Uzbekistan attract a new wave of foreign capital. Uzbekistan's position in the Corruption Perceptions Index improved from 157 in 2017 to 124 in 2025, placing it ahead of frontier and emerging markets like Egypt, Peru, Kenya, Pakistan, and Bangladesh. State asset privatizations between 2021 and the first half of 2025 reached $3.7 billion, including Ipoteka Bank, one of the country’s largest banks. The government is committed to following through with a further wave of privatizations through the 2030s, including the privatization of leading companies in the country’s banking sector. The country’s latest vision will focus on privatizing leading companies in banking, many of which have been pivoting to commercial lending, as well as other state-dominated companies. These privatization efforts have led to increased investments in Uzbekistan’s economy since 2017. Uzbekistan attracted around $12 billion in FDI in 2024, compared to only $7.2 billion in the previous year. By 2025, Uzbekistan was the second fastest-growing economy in the CIS, and its current growth outlook for 2026 and 2027 is favorable. Uzbekistan’s capital markets are still underdeveloped relative to some of these peers, which boast much larger stock markets. Uzbekistan’s stock market currently stands at slightly over $20 billion, which is well below 20% of GDP. Further privatization of the economy can help draw more attention to Uzbekistan’s economy and capital markets. These characteristics have helped to attract increased institutional interest in Uzbekistan’s capital markets. Marius Dan, who is the CEO for Central Asia at Templeton Global
WORLD ECONOMIC JOURNAL
PHOTO: SHUTTERSTOCK; AFC
Investments (Franklin Templeton), commented on their approach to unlock value in state-owned companies through their new investment fund in a June 2025 article. “Our mandate is to focus on transforming the stateowned companies, increasing their efficiency, their profitability, and attracting international investment into the country through the listing of the fund itself, as well as the listing of the underlying portfolio companies.” The President of Uzbekistan also recently announced its plan to modernize the stock market through a partnership with Nasdaq.
Scott Osheroff, CIO of the Asia Frontier Capital Uzbekistan Fund, commented on how this move could help the country’s stock market in a recent October 2025 interview. “If the Nasdaq indeed gets involved with improving Uzbekistan’s capital market, it would be a vote of confidence in Uzbekistan’s potential and hopefully with it come more streamlined infrastructure, enabling more market participation and hopefully more listings.” Overall, Uzbekistan’s stock market has received increased interest, and there is room for the depth and liquidity of the market to improve in the coming years.
UZBEKISTAN’S STABLE ECONOMIC PROFILE
Uzbekistan’s economy has grown by over 5% per annum since 2017 and has ample growth potential ahead of it. The Asian Development Bank projects that Uzbekistan’s economy will grow by 6.7% in 2026, well ahead of the average growth rate in frontier and emerging markets. Uzbekistan stands out in the region for its comparatively lower GDP per capita, which has still been rising rapidly in the past few decades. Uzbekistan currently has a population of over 37 million and a GDP per capita of slightly over $3,000, compared to the Europe and Central Asia average of over $30,000. Uzbekistan is the most populous country in Central Asia and still has a much lower GDP per capita relative to peers like Kazakhstan. Its GDP per capita has nearly doubled since 2017 and could grow substantially in the upcoming years. Uzbekistan’s Central Bank has also kept inflation under control and implemented massive improvements over the past decade. Inflation recently fell to 7.3%, compared to its high in 2018 following the Uzbek soum’s devaluation and implementation of market reforms. As inflation has improved, Uzbekistan’s Central Bank has been slowly beginning to lower the cost of capital for businesses. SMEs are a huge driver of the economy in Uzbekistan, as they account for around 75% of employment and 55% of GDP. Uzbekistan’s Central Bank has been able to lower rates from its high of 17% to 14%, and could potentially further cut rates in 2026 and 2027 if inflation is subdued. The ADB projects that inflation will remain at 7% in 2026, which should help support subsequent rate cuts in the future. Uzbekistan’s stable economic profile is underpinned by its relatively low debt levels and diverse sources of reserves. 91
[ ANALYTICS ]
Uzbekistan's Annual Inflation Rate: 2017–2026 (F) 20.0%
Annual inflation rate
15.0%
17.5% 14.5%
13.9%
12.9%
10.0%
11.4%
10.8%
10.0%
9.6% 7.3%
7.0%
2025
year 2026 (forecast)
5.0% 0.0%
2017
2018
2019
2020
2021
2022
2023
2024
Uzbekistan's Public Debt: 2017–2025 39.0%
Public Debt ( % of GDP)
40.0% 30.0% 20.0%
28.3%
29.7%
2018
2019
38.0%
36.4%
37.9%
35.0%
2021
2022
2023
2024
33.5%
18.7%
10.0% 0.0%
2017
2020
2025
year
Source: Trading Economics
Uzbekistan’s government has also been boosting its foreign reserves, most notably focusing on increasing its holdings of gold. Data from the World Bank in 2024 shows that Uzbekistan’s foreign exchange reserves covered 10 months of imports, well above the IMF’s suggestion of 3 months of import cover. Uzbekistan’s public debt currently stands at around 34% of GDP, while debt to GDP levels have reached around 75% in frontier markets. While many frontier and emerging markets are struggling with the debt they built up following the Covid-19 pandemic, Uzbekistan’s government has still been able to keep its debt at reasonable levels. Uzbekistan’s currency has been more stable following its massive devaluation in 2017, and the Uzbek soum even appreciated by around 7% in 2025. At the same time, Uzbekistan remains export competitive in the region due to its currency and wage structure, which can support sustainable export-oriented growth in new sectors in the coming years.
UZBEKISTAN POSSESSES MANY HIGH POTENTIAL INDUSTRIES
While Uzbekistan’s overreliance on commodity exports and state-dominated industries was previously a limitation for the economy, new reforms have helped diversify its economy 92
WEJ | May-July 2026
and improve the efficiency of state-dominated industries. Moves to liberalize and devalue its currency, and to combat state corruption, have allowed Uzbekistan to develop existing industries and emerge as a competitive export powerhouse in the Central Asian region. Uzbekistan also benefits from its abundant resources, geographical significance, and favorable demographics. Uzbekistan is Central Asia’s most populous country, with a population of over 37 million, and a median age of 27. The country is ranked globally for various resources, and is most significantly transforming its economy through robust private sector growth, attempting to pivot away from traditional areas like mining and agriculture. There is also ample potential for local companies to tap into the rising consumer market, due to gradually rising wages and favorable demographics. Uzbekistan has a very favorable export structure, with key markets like Russia, China, and Kazakhstan accounting for around 27% of its exports. Uzbekistan still has a very diversified export structure, with the potential to expand into new markets as export quality improves and it further develops its manufacturing base. Uzbekistan has been targeting new markets like the United States, where its exports soared by over 90% per annum from 2021 to 2024. Uzbekistan’s economy may be able to benefit from
PHOTO: SHUTTERSTOCK
WORLD ECONOMIC JOURNAL
increased economic cooperation with the United States, while other economies may be less shielded from the impact of tariffs. Uzbekistan recently signed a critical minerals deal with the United States, which provides the opportunity for it to exploit its current resources and further boost trade with the United States. Uzbekistan could also be positioned as an alternative to peers like China and India because of the lower tariff rates. Uzbekistan has mainly focused on exporting commodities, services, and industrial goods, while having high machinery imports to help support its rising industrialization. The country’s low wages have made it very favorable in the region, allowing it to emerge as a manufacturing powerhouse. The country’s minimum wage is less than $100/month, making it competitive in both the region and among other frontier markets. One of Uzbekistan’s obvious strengths is its abundance of natural resource reserves, at a time when many commodities like copper, gold, and uranium have rallied substantially. Uzbekistan is 16th globally for natural gas reserves, 11th globally for copper reserves, 5th globally as a uranium supplier, and 10th in global gold production. Uzbekistan's textile industry is also a strong driver of growth in the country, with a lot of untapped potential. Efforts to remove state control of the industry have allowed Uzbekistan’s textile exports to boom, and it currently stands as one of the world’s largest cotton producers. By 2023, Uzbekistan was also able to convert all of its raw cotton into yarn, helping it move up the value chain in its textile exports. Uzbekistan’s focus on improving efficiency and reducing state corruption has also helped strengthen the international reputation of its export sector. The country was recently removed from the Watch List in the U.S.
Trade Representative’s (USTR) 2024 Special 301 Report on intellectual property protection. Uzbekistan’s banking industry also has ample growth potential, as growth in the country remains robust, and household debt levels in Uzbekistan are still reasonably low, even after rapid growth in consumer loans. Credit levels to individuals and small businesses remain relatively low, and Uzbekistan’s banking industry has ample potential to fill these gaps, as seen by its recent focus on commercial credit growth. Banks also have room to improve efficiency in the coming years as they become the target of the next wave of privatization efforts through the end of the 2020s. The combination of economic liberalization and rising FDI will help Uzbekistan continue to diversify outside of traditional commodity markets and to find new export markets. Uzbekistan also shows a lot of promise in other areas, such as its chemicals and pharmaceutical industries. Uzbekistan has nearly doubled its chemical exports following the market reforms in 2017 and currently exports more than $1 billion worth of chemical products. Uzbekistan also currently has five special economic zones dedicated to pharmaceutical manufacturing and has begun exporting pharmaceutical products. Uzbekistan’s tourism industry was one of the fastestgrowing globally, and the Uzbekistan's government has strong plans to expand tourism through 2030. The Uzbekistan's government plans to attract 20 million tourists by 2030, allowing the tourism industry’s contribution to GDP to rise from 3.5% to 7%. Uzbekistan has currently built up manufacturing infrastructure to help it continue to pivot away from agriculture and resource-driven growth. At the moment, Uzbekistan has over 30 special economic zones, with 93
thousands of companies participating in its SEZs, SIZs, and technoparks. This setup will allow Uzbekistan to pivot away from the resource-driven FDI narratives that have previously dominated Central Asia and tap into manufacturingoriented growth.
SECURING UZBEKISTAN’S FUTURE
Uzbekistan's privatization efforts will likely continue strongly through 2030, leading to its growth surpassing that of other Central Asian peers. While its previous agriculture and resource-driven growth has a long benchmark of success, Uzbekistan needs to continue cutting the role of the state in the economy and diversifying into new manufacturing industries to continue delivering sustainable, higher-value growth. Uzbekistan’s growth efforts are largely part of a broader narrative taking place in the Central Asian region, which has attracted massive inflows of FDI from China and other dominant countries. Uzbekistan is one of the prime targets of China’s Belt and Road Initiative, as China strives to fortify its regional influence in Central Asian economies. This geopolitical setup for Uzbekistan, and the Central Asia region in general, is a unique catalyst for the economy of Uzbekistan, which is a key target for many countries that are vying for influence in the Central Asia region. 94
WEJ | May-July 2026
The growth of the private sector is a must for Uzbekistan, as the previous state and resource-driven economy has failed to supply adequate career opportunities for Uzbekistan’s highly educated youth population. Uzbekistan’s youth unemployment rate has been over 10% in previous years, highlighting how the private sector has failed, making it difficult for Uzbekistan to fully realize its demographic attractiveness. Key steps for Uzbekistan to take include continuing economic reforms and addressing inflation so that the country’s Central Bank can cut interest rates in 2026 and 2027. This move would help solidify growth and provide much-needed support for smaller enterprises in Uzbekistan, which struggle with higher rates and relatively lower credit availability. Uzbekistan is in the early stages of building a solid manufacturing industry, helping to diversify its economic growth and provide more opportunities for its high youth population. At the same time, Uzbekistan is wellpositioned in terms of resource growth and is positioned to meet energy and critical mineral needs as data centers, electric vehicles, and other economic developments drive the growth for these materials. These multifaceted growth sources can help support the economy as Uzbekistan’s government continues to push through with new measures to transform the economy.
PHOTO: SHUTTERSTOCK; GRIGORIY AISENSHTAT / ADB
[ ANALYTICS ]
INTERNATIONAL BUSINESS MEDIA PLATFORM
TARGET AUDIENCE
EXPAND YOUR GLOBAL MEDIA PRESENCE World Economic Journal has operated internationally since 2009, and the magazine has been published since 2011 in the USA, Canada, the EU, and other international markets.
Scan to explore media opportunities
WE OFFER: • Business features and interviews • Company profiles and PR publications • Industry rankings and indices • Sponsored analytical reports and insights • International media exposure
Investors CEOs Entrepreneurs Policymakers Tech Leaders
DIGITAL PLATFORMS A PPSTORE G OOGLE PLAY I SSUU Z INIO M AGZTER
START YOUR MEDIA CAMPAIGN TODAY adv@world-economic.com
[ AWARDS ]
EXPLORE THE AWARDS & APPLY
SUBMISSION DEADLINE: JULY 30, 2026
96
WEJ | May-July 2026
WORLD ECONOMIC JOURNAL
WORLD ECONOMIC JOURNAL AWARDS 2026 NOMINEE · FINALIST · LAUREATE
SHAPING THE FUTURE THROUGH RECOGNITION GLOBAL RECOGNITION PLATFORM FOR LEADERS, ORGANIZATIONS AND INSTITUTIONS GENEVA · MADRID · BARCELONA HYBRID INTERNATIONAL FORMAT · IN-PERSON RECOGNITION IN EUROPE
An international recognition program by World Economic Journal, an independent publication established in 2009
97
[ AWARDS ]
INTERNATIONAL AWARDS SERIES FOR CHANGE LEADERS
WEJ Awards 2026 is an international award series established by World Economic Journal. It recognizes companies, entrepreneurs, institutions, and innovative projects that contribute to economic development, business growth, innovation, and transformation.
The WEJ Awards 2026 program includes multiple award directions throughout the year. The first stage of the 2026 series focuses on two categories with nominations open until July 30, 2026: • WEJ Business Award 2026 • WEJ Innovation Award 2026 These awards highlight practical achievements, entrepreneurial leadership, scalable solutions, and realworld results across industries and regions. The mission of WEJ Awards is to recognize those who drive growth, innovation, and transformation in today’s economy.
LEGACY AND CONTINUITY
For over 17 years, World Economic Journal has been highlighting transformative global trends, publishing analytical reports, and recognizing the people and institutions that drive change. The WEJ Awards build on this legacy, focusing on impact, innovation, and long-term development. The awards are inspired by the ideas of inclusive and equitable institutions as a foundation for sustainable growth, reflecting the research of leading global economists. “I definitely believe that we need more research into emerging markets, and hence, World Economic Journal plays a very important role. The world is changing fast, and there is a danger that trends in AI, globalization, and geopolitics can adversely affect emerging markets. This is an important topic for research.” — Daron Acemoğlu, a 2024 Nobel laureate in economics and Institute Professor of Economics at MIT
ORGANIZERS AND SUPPORTING INSTITUTIONS ORGANIZERS: World Economic Group (Spain)
OFFICIAL AWARDS PAGE: https://world-economic.com/ contacts-award CONTACT FOR NOMINATIONS AND PARTNERSHIPS: awards@world-economic.com
98
WEJ | May-July 2026
Global Initiative for Sustainable Development of Territorial Entities (GITE Association) Geneva, Switzerland
ANALYTICS PARTNER: SustainaNet AITE — a nextgeneration AI-powered ESG analytics platform
WORLD ECONOMIC JOURNAL
WEJ AWARDS — SELECTED LAUREATES WEJ Awards recognizes leaders, companies and projects creating measurable impact across business, innovation and global development. DARON ACEMOĞLU NOMINATION: PERSON OF THE YEAR
SHIFERAW TEKLEMARIAM NOMINATION: SECURITY
2024 Nobel laureate in economics and Institute Professor of Economics at MIT
Commissioner, Ethiopia Disaster Risk Management Commission
For studies of how institutions are formed and affect prosperity
For launching an inclusive early warning system for vulnerable communities.
HIS HIGHNESS SHEIKH KHALED BIN MOHAMED BIN ZAYED AL NAHYAN NOMINATION: EMPLOYMENT Crown Prince of Abu Dhabi and Chairman of the Abu Dhabi Executive Council For launching the Mawaheb Talent Hub, an AI-powered employment platform for underrepresented talents. CLARA BRUGADA NOMINATION: SOCIETY Mayor of Mexico City For the UTOPÍAS project — community centers aimed at reducing inequality and revitalizing public life. SILVIA GRECCO NOMINATION: PUBLIC SERVICES Secretary for Persons with Disabilities, São Paulo
CHRISTEL HEYDEMANN NOMINATION: AI CEO of Orange Group For adapting AI-based language tools to support African languages and digital inclusion. PETRA OLSCHOWSKI NOMINATION: DEVELOPMENT STRATEGY Minister of Science, Research and the Arts, Baden-Württemberg For the Citizens’ Jury on AI — promoting ethical governance and public participation in AI policymaking. STEVE ADLER NOMINATION: HOUSING Former Mayor of Austin, Texas
For establishing 24/7 sign language interpretation centers enabling access to public services.
For pioneering a housing investment model to support essential low-income workers.
TARIQ HILAL AL BARWANI NOMINATION: LABOR MARKETS
YVONNE AKI-SAWYERR NOMINATION: ENVIRONMENT
Founder of Knowledge Oman
Mayor of Freetown
For creating the KO Academy to connect academic knowledge with real-world skills for youth.
For the Transform Freetown plan — focusing on climate resilience, reforestation, and job creation.
JOYCE LIU NOMINATION: TECHNOLOGY
CLAUDIA LÓPEZ HERNÁNDEZ NOMINATION: GENDER INCLUSION
Director of TECH4ALL Digital Inclusion Program Office, Huawei For implementing TECH4ALL — promoting inclusive education and reducing the digital divide.
For launching Care Blocks — neighborhood-based support centers for unpaid caregivers.
View winners and profiles Scan to explore WEJ Awards winners
Former Mayor of Bogotá
APPLY FOR WEJ AWARDS 2026 — BUSINESS & INNOVATION CATEGORIES NOW OPEN
WEJ Awards® is an international recognition platform by World Economic Journal. All rights reserved.
99
[ AWARDS ]
WEJ INNOVATION AWARD 2026 FOR BREAKTHROUGH IDEAS, SCALABLE SOLUTIONS AND REAL-WORLD IMPACT WEJ Innovation Award 2026 recognizes startups, companies and teams developing breakthrough solutions with measurable impact. The award focuses on projects that can scale, attract investment and transform industries, cities and communities. It is designed for fast-moving teams— from early-stage startups to growing companies—seeking international visibility, recognition and strategic positioning. If your solution is already working and delivering results, this is your platform to showcase it globally.
AWARD CATEGORIES Scalable startup or innovationdriven company Digital solution with proven market traction Product or platform with measurable impact AI, data or deep tech solution EdTech, HealthTech or SocialTech innovation Sustainable or ESG-driven innovation
CALL FOR NOMINATIONS APPLICATIONS OPEN Submissions for WEJ Innovation Award 2026 are accepted until July 30, 2026
Contact:
awards@world-economic.com Submission:
https://world-economic.com/contacts-award
WEJ Awards® is an international recognition platform by World Economic Journal. All rights reserved.
100
WEJ | May-July 2026
WORLD ECONOMIC JOURNAL
WEJ BUSINESS AWARD 2026 FOR BUSINESS PERFORMANCE, GROWTH AND MARKET LEADERSHIP WEJ Business Award 2026 recognizes companies demonstrating strong performance, sustainable growth, and effective market strategies. The award is open to small and mediumsized businesses, entrepreneurs, and growing companies across sectors. It focuses on real business results— revenue growth, market expansion, operational excellence, and competitive advantages. This is a fast-track recognition format designed for companies that want to strengthen their positioning and gain international visibility.
AWARD CATEGORIES Fast-growing company SME with strong market performance Export or international expansion Business transformation or scaling Industry leadership Entrepreneurial achievement
CALL FOR NOMINATIONS APPLICATIONS OPEN Submissions for WEJ Business Award 2026 are accepted until July 30, 2026
Contact:
awards@world-economic.com Submission:
https://world-economic.com/contacts-award
WEJ Awards® is an international recognition platform by World Economic Journal. All rights reserved.
101
[ AWARDS ]
CEREMONY FORMAT AND INTERNATIONAL PRESENCE
WEJ Awards ceremonies are conducted in a hybrid international format, combining inperson recognition events in Europe with remote participation options. Laureates and finalists receive official diplomas, award distinctions, and extended international visibility. In-person recognition sessions are held in European locations, reinforcing the global positioning of the awards. Main ceremony of the current stage: July 2026 Europe (Spain)
WHO CAN BE NOMINATED?
• Small and medium-sized enterprises • Entrepreneurs and business founders • Startups and innovation-driven teams • Organizations with proven results and growth • Individual leaders and practitioners
RECOGNITION. VISIBILITY. POSITIONING.
WEJ Awards is an international recognition platform highlighting companies, entrepreneurs, and projects that deliver real impact. Participation provides: • enhanced brand credibility • increased international exposure • the ability to leverage award status in marketing and communications We recognize those who already demonstrate results—not concepts, but real execution and growth. If your project creates measurable value and drives progress—this is your platform.
EXPLORE THE AWARDS & APPLY
Review participation terms and apply via the official awards page https://world-economic.com/contacts-award awards@world-economic.com
LEGAL NOTICE
WEJ Awards® is an international recognition program by World Economic Journal. All award names, visual identity, and materials are protected under international copyright and trademark law. Unauthorized use is strictly prohibited.
WEJ Awards® is an international recognition program by World Economic Journal.
102
WEJ | May-July 2026
GLOBAL INITIATIVE FOR SUSTAINABLE DEVELOPMENT OF TERRITORIAL ENTITIES (GITE) #SDGAction33410
GLOBAL PLATFORM FOR TERRITORIAL DEVELOPMENT & LEADERSHIP International Association, Geneva, Switzerland
UNITING GOVERNMENTS, BUSINESS AND INNOVATION FOR TERRITORIAL DEVELOPMENT
Featured on the UN SDG Partnerships Platform (#SDGAction33410)
2009 – 2018
Scientific development
since 2010
Implementation
2021
UN SDG Good Practice
GITE supports the sustainable development of territorial entities by promoting innovation, technology, economic growth, social progress and the exchange of best governance practices to achieve the Sustainable Development Goals.
GITE develops a supranational Global Governors Platform and promotes international cooperation between territorial leaders, institutions, business and expert communities.
GITE CONSISTS OF THREE SPACES: 1. INTELLECTUAL SPACE
2. EVENT SPACE
3. M EDIA SPACE
The intellectual foundation of GITE, including research, analytics and AI-based tools for the sustainable development of territorial entities worldwide.
A platform for international dialogue through forums, summits and awards, connecting governors, regional leaders, business and development institutions.
An international media environment for sharing best practices, innovative approaches and modern solutions for achieving the Sustainable Development Goals.
SCAN TO VIEW GITE ON THE UN SDG PARTNERSHIPS PLATFORM
[ TRENDS ]
MAY – JULY 2026 2-6
3-6
MAY
MAY
LONDON, ENGLAND
2026 ANNUAL MEETING – INTERNATIONAL TRADEMARK ASSOCIATION (INTA) INTA’s Annual Meeting is one of the world’s leading gatherings for intellectual property, trademarks, brand strategy, and legal-business coordination. The event brings together senior counsel, policymakers, brand owners, law firms, and corporate decision-makers from more than 100 jurisdictions to shape the global agenda in brand protection, enforcement, licensing, and innovationdriven IP strategy. Website: inta.org
6-7 MAY
NATIONAL HARBOR, MARYLAND, USA
SELECTUSA INVESTMENT SUMMIT 2026 (U.S. DEPARTMENT OF COMMERCE / ITA) The SelectUSA Investment Summit is the U.S. government’s flagship foreign direct investment event. International investors engage directly with U.S. states, economic development agencies, and federal officials to explore investment opportunities across technology, manufacturing, infrastructure, and clean energy. The summit strengthens crossborder capital flows and public-private partnerships. Website: selectusasummit.us
NEW YORK, USA (UN HQ)
MULTI-STAKEHOLDER FORUM ON SCIENCE, TECHNOLOGY AND INNOVATION FOR THE SDGS (STI FORUM) – UNITED NATIONS The UN STI Forum accelerates SDG implementation through science, innovation, and digital partnerships. Governments, research institutions, startups, and multilateral agencies exchange policy tools and best practices to scale sustainable technologies. Website: sdgs.un.org/tfm/sti-forum
3-6 LOS ANGELES, USA
MILKEN INSTITUTE GLOBAL CONFERENCE 2026 The Milken Institute Global Conference is one of the most visible cross-sector leadership forums in the United States, convening top figures from finance, government, health, technology, philanthropy, and media. It serves as a high-level platform for strategic discussions on global capital flows, economic resilience, innovation, public policy, and long-term growth in a changing international environment. Website: milkeninstitute.org
104
WEJ | May-July 2026
PHOTO: JACK FINNIGAN / UNSPLASH; JDFORRESTER / CC BY 4.0
MAY
WORLD ECONOMIC JOURNAL
18-23 MAY
GENEVA, SWITZERLAND
79TH WORLD HEALTH ASSEMBLY (WHA79) – WORLD HEALTH ORGANIZATION (WHO)
6-8 MAY
LEIPZIG, GERMANY
INTERNATIONAL TRANSPORT FORUM (ITF) ANNUAL SUMMIT 2026 – OECD
PHOTO: RAMSEY CARDY / SPORTSFILE; NOAH LOVERBEAR / CC BY-SA 3.0
The ITF Summit is the world’s largest gathering of transport ministers and mobility stakeholders. It addresses infrastructure investment, sustainable mobility, decarbonization, digital logistics, and supply chain resilience. The outcomes influence transport policy coordination across OECD and partner countries. Website: summit.itf-oecd.org
12-23 MAY
11-14 MAY
The World Health Assembly is the highest decision-making body of the World Health Organization. Health ministers and delegations adopt global health priorities, pandemic preparedness strategies, financing mechanisms, and regulatory frameworks impacting international public health systems. Website: who.int/news-room/events/ detail/2026/05/18/default-calendar/ health-and-climate-change-at-the79th-world-health-assembly
VANCOUVER, CANADA
WEB SUMMIT VANCOUVER 2026 Web Summit Vancouver is the North American flagship of the Web Summit platform, bringing together founders, global investors, technology companies, media, and public-sector leaders. The event is positioned as a major international marketplace for venture capital, scaling, platform strategy, AI, and startup ecosystem building across North America and the Pacific innovation corridor. Website: vancouver.websummit.com
19-20 MAY
MOUNTAIN VIEW, CALIFORNIA, USA (+ ONLINE)
GOOGLE I/O 2026
Google I/O showcases major technological advancements across AI, Android, cloud computing, and developer tools. The event shapes global software development trends and digital ecosystem strategies, influencing startups, enterprises, and platform economies worldwide. Website: io.google/2026
CANNES, FRANCE
FESTIVAL DE CANNES 2026 (79TH CANNES FILM FESTIVAL) The Cannes Film Festival is one of the most prestigious cultural and media events globally, influencing international film markets, cultural diplomacy, and global creative industries. It serves as a strategic platform for distribution deals and global media visibility. Website: festival-cannes.com
105
[ TRENDS ]
MAY
19-21 MAY
MADRID, SPAIN
SAP SAPPHIRE MADRID 2026 SAP Sapphire Madrid is one of SAP’s flagship international enterprise technology events for the EMEA market, focused on AI, cloud applications, business transformation, data, and digital operations. It convenes senior enterprise leaders, technology executives, implementation partners, and customers to discuss how AIenabled enterprise platforms are reshaping decision-making, operations, and competitiveness. Website: sap.com
106
WEJ | May-July 2026
ROTTERDAM, NETHERLANDS
WORLD HYDROGEN SUMMIT & EXHIBITION 2026 The World Hydrogen Summit is a premier global platform for hydrogen deployment strategies, investment mobilization, and policy alignment. Governments, energy companies, and infrastructure investors discuss large-scale hydrogen production, transport corridors, and decarbonization pathways. Website: world-hydrogen-summit.com
29 MAY– 2 JUNE CHICAGO, USA
ASCO ANNUAL MEETING 2026 (AMERICAN SOCIETY OF CLINICAL ONCOLOGY) The ASCO Annual Meeting is one of the world’s most influential oncology congresses, presenting breakthrough clinical research and treatment innovations. It shapes global cancer care standards and pharmaceutical research strategies. Website: asco-meeting.org
PHOTO: SAP
19-21
WORLD ECONOMIC JOURNAL
1-5 JUNE
VIENNA, AUSTRIA
THE COMMISSION ON CRIME PREVENTION AND CRIMINAL JUSTICE (CCPCJ) WILL ORGANIZE ITS THIRTY-FIFTH SESSION The CCPCJ session addresses rule of law, anti-corruption frameworks, transnational crime, and justice reform. Governments and international organizations coordinate policies aimed at strengthening legal systems and international cooperation in criminal justice. Website: ecosoc.un.org/en/ events/2026/commission-crimeprevention-and-criminal-justice
2-3 JUNE
SAN FRANCISCO, USA (+ ONLINE)
MICROSOFT BUILD 2026
Microsoft Build is the company’s principal developer conference and a major global platform for software engineering, cloud infrastructure, enterprise AI, and developer tools. It brings together engineers, architects, founders, and enterprise developers to explore Microsoft’s newest platforms, coding frameworks, AI systems, and infrastructure strategy across enterprise and cloud ecosystems. Website: build.microsoft.com
2-4 JUNE
3-6 JUNE
ST. PETERSBURG, RUSSIA
ST. PETERSBURG INTERNATIONAL ECONOMIC FORUM (SPIEF) 2026 SPIEF remains one of the largest and most cited international economic forums in Eurasia, bringing together government officials, corporate leaders, investors, development institutions, and policy experts. The forum is designed as a platform for discussion of macroeconomic trends, trade, finance, industrial policy, infrastructure, and emerging-market development within a rapidly changing global economic order. Website: forumspb.com
6-8 JUNE
AMSTERDAM, NETHERLANDS
MONEY20/20 EUROPE 2026
1-12 JUNE
PHOTO: KSENIIA ZAPIATKINA, YAROSLAV MUZYCHENKO / UNSPLASH
GENEVA, SWITZERLAND
114TH SESSION OF THE INTERNATIONAL LABOUR CONFERENCE – ILO The International Labour Conference is the highest standard-setting forum of the International Labour Organization and one of the central annual assemblies in global labour governance. Government, employer, and worker representatives from the ILO’s member states gather to debate labour standards, platform work, gender equality at work, social dialogue, and the future architecture of employment policy. Website: ilo.org/internationallabour-conference/114th-sessioninternational-labour-conference
Money20/20 Europe is one of the most influential international fintech gatherings, convening banks, payment networks, regulators, merchants, investors, and fast-growing technology firms. The event serves as a strategic platform for discussions on digital payments, banking transformation, regulation, embedded finance, financial infrastructure, and cross-border fintech partnerships. Website: europe.money2020.com
RIO DE JANEIRO, BRAZIL
82ND IATA ANNUAL GENERAL MEETING (AGM) & WORLD AIR TRANSPORT SUMMIT (WATS) The IATA AGM and WATS is the most important annual gathering of the global airline industry, convening airline CEOs, regulators, aircraft manufacturers, suppliers, and aviation associations. It shapes high-level industry dialogue on aviation economics, sustainability, capacity, safety, connectivity, and the strategic future of global air transport. Website: iata.org
107
[ TRENDS ]
8-11 JUNE
RIO DE JANEIRO, BRAZIL
WEB SUMMIT RIO 2026 Web Summit Rio is one of the largest technology gatherings in Latin America, bringing together founders, investors, media, enterprise leaders, and innovators from across the region and beyond. The event functions as a major cross-border platform for venture capital, AI, digital infrastructure, entrepreneurship, and the international positioning of the Latin American tech ecosystem. Website: rio.websummit.com
8-12
9-11 JUNE
15-18 JUNE
BARCELONA, SPAIN
SHOPTALK EUROPE 2026
JUNE
LONDON, ENGLAND
LONDON TECH WEEK 2026 London Tech Week is one of Europe’s largest and most visible technology gatherings, bringing together founders, investors, enterprises, policymakers, and global technology leaders. It serves as a pan-European platform for AI, digital infrastructure, scale-ups, deep tech, public policy, and Europe’s competitive positioning in the next phase of global technological transformation. Website: londontechweek.com
8-18
Shoptalk Europe is one of the leading international events for retail, e-commerce, consumer brands, retail media, and commerce technology. It convenes senior retailers, consumer goods companies, investors, consultants, and technology innovators to discuss consumer behavior shifts, AI in commerce, retail media, data, and digital transformation across the European retail market. Website: europe.shoptalk.com
9-11 JUNE
JUNE
SAN FRANCISCO, USA (+ VIRTUAL)
DATA + AI SUMMIT 2026 – DATABRICKS Data + AI Summit is one of the world’s largest conferences focused on enterprise data, analytics, open source, and applied AI. It convenes engineers, data leaders, researchers, executives, and developers to discuss practical deployment of data platforms, machine learning, GenAI systems, and enterprise-scale AI adoption. Website: databricks.com
17-20 JUNE
BRUSSELS, BELGIUM (+ ONLINE)
The June Climate Meetings under the UNFCCC are among the most consequential preparatory negotiations in the annual global climate diplomacy cycle. Delegations, negotiators, experts, and observers gather in Bonn to advance technical and political work on mitigation, adaptation, finance, transparency, and implementation ahead of the next COP process. Website: unfccc.int
108
WEJ | May-July 2026
EUROPEAN SUSTAINABLE ENERGY WEEK (EUSEW) 2026 EUSEW is the European Union’s flagship annual event dedicated to renewable energy, energy efficiency, and the policy architecture of the energy transition. Organized by the European Commission system, it brings together policymakers, industry leaders, cities, researchers, and civil-society actors to discuss energy security, affordability, decarbonization, innovation, and Europe’s clean energy agenda. Website: eusew.eu
PARIS, FRANCE
VIVA TECHNOLOGY 2026 VivaTech is one of Europe’s most important international technology events, bringing together major corporations, startups, investors, governments, and researchers. It is a central platform for AI, climate tech, mobility, cybersecurity, digital policy, and the role of innovation in Europe’s economic and technological competitiveness. Website: vivatechnology.com
PHOTO: SHOPTALK EUROPE
BONN, GERMANY
JUNE CLIMATE MEETINGS (SB64) – UNFCCC
WORLD ECONOMIC JOURNAL
PHOTO: ASHISH KAPOOR / UNSPLASH; WORLD ECONOMIC FORUM
22-25 JUNE
SAN DIEGO, USA
BIO INTERNATIONAL CONVENTION 2026 The BIO International Convention is one of the biotechnology industry’s most important annual gatherings, convening biotech companies, pharmaceutical leaders, regulators, investors, service providers, and patient advocates. It is a major global platform for biotech partnering, innovation showcases, policy discussion, and commercialization pathways across health, therapeutics, manufacturing, and life sciences. Website: convention.bio.org
22-26 JUNE
CANNES, FRANCE
CANNES LIONS INTERNATIONAL FESTIVAL OF CREATIVITY 2026 Cannes Lions is the world’s most prestigious global festival for advertising, marketing, creative communications, and brand strategy. The event convenes major brands, agency networks, media groups, platforms, creators, and investors, setting annual benchmarks for creative excellence and the commercial direction of the global communications industry. Website: canneslions.com
23-25 JUNE
DALIAN, CHINA
ANNUAL MEETING OF THE NEW CHAMPIONS 2026 – WORLD ECONOMIC FORUM Often referred to as “Summer Davos,” the Annual Meeting of the New Champions is the World Economic Forum’s flagship event focused on innovation, growth, and emerging markets. It brings together leaders from business, government, academia, civil society, and entrepreneurship to explore new growth models, technology-driven transformation, and the economic outlook across Asia and other fastevolving regions. Website: weforum.org
30 JUNE– 1 JULY BERLIN, GERMANY
GITEX AI EUROPE 2026 GITEX AI Europe is the updated and currently confirmed Berlin edition of the GITEX platform for 2026, bringing together technology companies, investors, policymakers, scientists, and startup ecosystems. The event is positioned as a major European forum for AI, digital transformation, deep tech, and technology investment, with a strong crossborder orientation. Website: gitex-europe.com
109
[ TRENDS ]
7-10 JULY
GENEVA, SWITZERLAND
AI FOR GOOD GLOBAL SUMMIT 2026 – ITU / UNITED NATIONS
13-16 JULY
NEW YORK, USA (UN HQ)
HIGH-LEVEL SEGMENT OF ECOSOC 2026 The ECOSOC High-level Segment is one of the UN system’s principal annual policy forums for coordinating economic, social, and sustainable development priorities. It provides a ministerial-level setting for governments and international actors to connect the HLPF agenda with broader UN economic and development policy processes. Website: ecosoc.un.org
7-15
15-17
JULY
JULY
NEW YORK, USA (UN HQ)
HIGH-LEVEL POLITICAL FORUM ON SUSTAINABLE DEVELOPMENT (HLPF) 2026 – UNITED NATIONS The HLPF is the United Nations’ central annual platform for reviewing progress on the Sustainable Development Goals and aligning multilateral policy around sustainable development. It brings together ministers, UN bodies, international institutions, and stakeholder groups to assess implementation, national reviews, and cross-cutting global challenges affecting the 2030 Agenda. Website: ecosoc.un.org
110
WEJ | May-July 2026
19-29 JULY
BUSAN, REPUBLIC OF KOREA
48TH SESSION OF THE WORLD HERITAGE COMMITTEE – UNESCO The World Heritage Committee session is one of UNESCO’s most visible annual governance events, where member states review inscriptions, conservation concerns, and strategic issues concerning World Heritage properties worldwide. It is a major international forum at the intersection of heritage, diplomacy, cultural policy, and global governance. Website: whc.unesco.org
20-24 JULY
PARIS, FRANCE
2026 GLOBAL CONFERENCE ON THE INTERNATIONAL DECADE OF SCIENCES FOR SUSTAINABLE DEVELOPMENT (2024–2033) – UNESCO This UNESCO global conference is one of the most important multilateral sciencepolicy gatherings of the year, focused on the role of science in sustainable development. It will bring together policymakers, scientists, institutions, and international stakeholders to align science agendas with development strategy, cooperation, and evidencebased policymaking. Website: unesco.org
FARNBOROUGH, ENGLAND
FARNBOROUGH INTERNATIONAL AIRSHOW 2026 Farnborough International Airshow is one of the world’s premier aerospace, aviation, and defence trade events, bringing together manufacturers, airlines, governments, defence stakeholders, investors, and innovators. The airshow is a major platform for high-value deals, industrial announcements, technology showcases, and strategic discussion on the future of aviation, defence, space, and aerospace manufacturing. Website: farnboroughairshow.com
PHOTO: COLIN W / CC BY-SA 3.0; ALEXANDER SMAGIN / UNSPLASH
AI for Good is the United Nations’ leading global summit on artificial intelligence, organized by the International Telecommunication Union with broad multi-stakeholder participation. It convenes governments, regulators, scientists, companies, UN agencies, and civil society to address AI governance, standards, inclusion, innovation, and practical applications of AI for sustainable development and public good. Website: aiforgood.itu.int
REACH A GLOBAL DIGITAL AUDIENCE World Economic Journal is distributed across leading international digital platforms, reaching readers worldwide.
DIGITAL DISTRIBUTION INCLUDES:
PUBLISH AND DISTRIBUTE YOUR CONTENT WORLDWIDE adv@world-economic.com
• Mobile apps and marketplaces • Global magazine platforms • Library and institutional systems • Multi-region audience access
ACCESS THE FULL DIGITAL EDITION Explore all available platforms and subscription options
Scan to explore digital platforms
GLOBAL INITIATIVE FOR SUSTAINABLE DEVELOPMENT OF TERRITORIAL ENTITIES (GITE) #SDGAction33410
GLOBAL PLATFORM FOR TERRITORIAL DEVELOPMENT & LEADERSHIP Connecting governments, business and innovation to develop territorial economies and achieve the SDGs
GITE is an International Association headquartered in Geneva, Switzerland
Scan to explore partnership and membership opportunities
Featured on the UN SDG Actions platform #SDGAction33410