This work is a product of the staff of The World Bank with external contributions. The findings, interpretations, and conclusions expressed in this work do not necessarily reflect the views of The World Bank, its Board of Executive Directors, or the governments they represent. The World Bank does not guarantee the accuracy, completeness, or currency of the data included in this work and does not assume responsibility for any errors, omissions, or discrepancies in the information, or liability with respect to the use of or failure to use the information, methods, processes, or conclusions set forth. The boundaries, colors, denominations, links/footnotes and other information shown in this work do not imply any judgment on the part of The World Bank concerning the legal status of any territory or the endorsement or acceptance of such boundaries. The citation of works authored by others does not mean the World Bank endorses the views expressed by those authors or the content of their works. Certain artificial intelligence (“AI”) tools may have been used in creating this work, as indicated in the work, but all transformative and creative effort expressed in the work was performed by the World Bank staff or external contributors. The World Bank is not responsible for any claims, including for errors or inaccurate information, generated by AI programs not controlled or owned by the World Bank.
Nothing herein shall constitute or be construed or considered to be a limitation upon or waiver of the privileges and immunities of The World Bank, all of which are specifically reserved.
Rights and Permissions
This work is available under the Creative Commons Attribution 3.0 IGO license (CC BY 3.0 IGO), http://creativecommons.org/ licenses/by/3.0/igo. Under the Creative Commons Attribution license, you are free to copy, distribute, transmit, and adapt this work, including for commercial purposes, under the following conditions:
Attribution—Please cite the work as follows: World Bank. 2026. Challenges of Conflict and Industrial Policy for Development. Middle East, North Africa, Afghanistan & Pakistan Economic Update (April 2026). World Bank. doi: 10.1596/978-1-4648-2328-2. License: Creative Commons Attribution CC BY 3.0 IGO.
Translations—If you create a translation of this work, please add the following disclaimer along with the attribution: This translation was not created by The World Bank and should not be considered an official World Bank translation. The World Bank shall not be liable for any content or error in this translation
Adaptations—If you create an adaptation of this work, please add the following disclaimer along with the attribution: This is an adaptation of an original work by The World Bank. Views and opinions expressed in the adaptation are the sole responsibility of the author or authors of the adaptation and are not endorsed by The World Bank
Third-party content—The World Bank does not necessarily own each component of the content contained within the work. The World Bank, therefore, does not warrant that the use of any third-party-owned individual component or part contained in the work will not infringe on the rights of those third parties. The risk of claims resulting from such infringement rests solely with you. If you wish to re-use a component of the work, it is your responsibility to determine whether permission is needed for that re-use and to obtain permission from the copyright owner. Examples of components can include, but are not limited to, tables, figures, or images.
All queries on rights and licenses should be addressed to World Bank Publications, The World Bank, 1818 H Street NW, Washington, DC 20433, USA; e-mail: pubrights@worldbank.org.
ISBN (electronic): 978-1-4648-2328-2
DOI: 10.1596/978-1-4648-2328-2
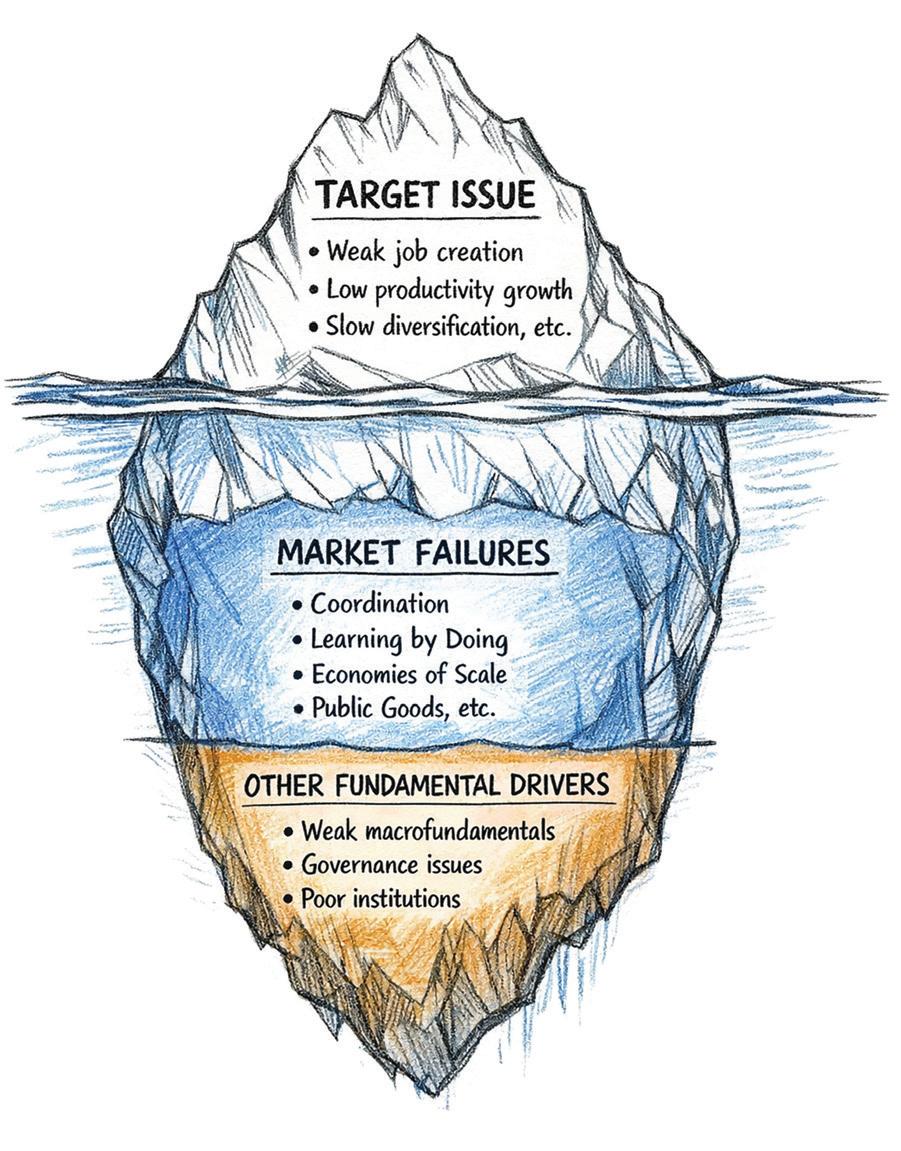
AI Disclosure Statement: mAI Claude Sonnet 4.6, World Bank Group, was used in February 2026 to generate figure 2.1, and in March 2026 for editing purposes. All content underwent thorough human review.
Cover design: Design and Creative Services, Global Corporate Solutions, World Bank Group.
The cutoff date for the data used in the report was March 27, 2026.
Acknowledgments
The Middle East, North Africa, Afghanistan & Pakistan (MENAAP) Economic Update (formerly the MENA Economic Update) analyzes the near-term macroeconomic outlook, key development challenges, and appropriate policy responses across the MENAAP administrative region of the World Bank. The biannual reports are produced by the MENAAP Office of the Chief Economist. This edition of the report was written by Roberta Gatti (Regional Chief Economist), Çaglar Özden (Regional Deputy Chief Economist), Federico Roberto Bennett (Task Team Leader), Asif M. Islam, Sumin Chun, Yuting Fan, Nelly Elmallakh, Rana Lotfi, Ilias Suvanov, and Richard Newsome. Exceptional administrative support was provided by Asma Saleh Al-Hanshali and Sara Fassil Baheta.
The team is grateful to Indermit S. Gill, Chief Economist and Senior Vice President for Development Economics; Ousmane Dione, Vice President of the MENAAP region; John F. Gandolfo, Vice President and Chief Financial Officer and Acting Regional Vice President of the MENA region, International Finance Corporation; Ethiopis Tafara, Regional Vice President of the Africa region, International Finance Corporation; and Junaid Kamal Ahmad, Vice President of Operations at the Multilateral Investment Guarantee Agency, for their strategic guidance. Helpful comments were provided by Boutheina Guermazi, Sandeep Mahajan, Ayhan Kose, Stephane Guimbert, Iva I. Hamel, Joao Leonel Antunes Morgado, and Michel Rogy.
The team acknowledges with many thanks the technical advice and guidance of Ana Margarida Fernandes, Tristan Reed, Gianluca Mele, Charl Jooste, Remzi Baris Tercioglu, Ergys Islamaj, and Paolo Agnolucci.
Helpful support, inputs, comments, and guidance on the analysis were received from the World Bank’s Fiscal Policy and Growth team, Jasmin Chakeri (Practice Manager), Hoda Youssef, Sara
B. Alnashar, Majid Kazemi, Razieh Zahedi, Norbert Matthias Fiess, Sibel Kulaksiz, Muhammad Khudadad Chattha, Mohamed Ahmed Mahmoud Ashour, Yasmine Osman, Miguel Eduardo Sanchez Martin, Daniel Prinz, Ruslan Piontkivsky, Mamadou Ndione, Olivier Lavinal, Saorlaith Ni Bhroin, Khadija Shaikh, Fatma Ibrahim Mohamed Elashmawy, Lahcen Bounader, Javier Diaz Cassou, Georgiana Pop, Vincent Palmade, Tobias Akhtar Haque, Fahad Hasan, Umer Khan Baloch, Hijab Tahir, Anna Godfriedovna Okutu Twum, Rafay Khan, Nur Nasser Eddin, Zeina Alsharkas, Naji Abou Hamde, Diderot Guy D Estaing Sandjong, Alief Aulia Rezza, Lodewijk Smets, and Khaled Alhmoud; the World Bank’s Distributional Impact of Policies team, Salman Zaidi (Practice Manager), Alan Fuchs Tarlovsky, Laura Liliana Moreno Herrera, Aziz Atamanov, Ganesh Kumar Seshan, Trang Van Nguyen, and Bilal Malaeb; the World Bank’s Development Economics Prospect Group, Carlos Arteta (Manager), Sahiti Sarva, Paolo Mauro, Nikita Makarenko, Rodrigo Deiana, and Naotaka Sugawara; and the World Bank Group’s International Finance Corporation, Cheick-Oumar Sylla, Georges Vivien Houngbonon, Khawaja Aftab Ahmed, Femi Akinrebiyo, David Tinel, Rozita Kozar, Ifeoma Ezeokafor, Maiko Miyake, Marcelle Ayo, Muneer Ferozie, Zeina Mouawad, Marwa Mahgoub, Sahar Etezaz, Mohammed Raza Mirza, Nehal Rasmy, Ingy Salem, Saad Sabrah, Menan Omar, Muhammad Bilal Bin Nadeem, Mohammed Mehany, Kareem A. Aziz, Thomas Pellerin, Asogan Moodaly, Ewelina Julia Timofijewicz-Wasniowska, Sarah Morsi, Rebecca Kachmar, and Ghita Hannane.
Invaluable comments and contributions were provided by Zsoka Koczan, Alba Suris Coll Vinent, Oleg Konoval, Helena Schweiger, Cevat Giray Aksoy, Salim Rouhana, Zishan Faiza Karim, Milaine Rossanaly, Thomas A. Vis, Hind Kadiri, Jan Alexander Kazimierz Orlowski, Mariem Malouche, Ahmadou Moustapha Ndiaye, Jean-Christophe
Carret, Stefan W. Emblad, Safaa El Tayeb ElKogali, Faris H. Hadad-Zervos, Bolormaa Amgaabazar, and Hind Kadiri.
Nicholas Keyes, Ebrahim Mohammed Yahya Al-Harazi, and Serene Jweied guided the dissemination of the messages of the report. We thank James
L. Rowe, Jr., for editing the manuscript; Jihane El Khoury Roederer for the cover design; and the World Bank’s Global Corporate Solutions team for typesetting, translation, and printing. The team is also thankful for the feedback provided by our MENAAP Chief Economist Office colleagues Jesica Torres and Ernest Sergenti.
Executive Summary
Ripple effects through the global economy
The Middle East, North Africa, Afghanistan, and Pakistan (MENAAP) is mired in conflict, causing human suffering in the region and economic repercussions around the globe.
The Strait of Hormuz, a strategic choke point through which about a fifth of the world’s oil and gas flows, has been effectively closed since the beginning of the conflict. Recent satellite images show tankers queued on each side awaiting passage. The subsequent halt in production, compounded by strikes on energy infrastructure, resulted in a significant oil supply shock.
Oil markets entered this period with an oversupply, providing a potential buffer against price pressures. Still, as of March 27, the price of Brent crude oil stood at US$112 per barrel, close to 60 percent higher than before the start of the conflict. Oil futures indicate some optimism, and prices for end-of-year delivery are trading at around US$85 per barrel. Similarly, European natural gas prices increased by almost 70 percent in the same time frame.
If oil, natural gas, and related energy prices remain elevated for a sustained period, the inflationary consequences will ripple outward through multiple transmission channels. The pressure is already more pronounced in Europe and Asia than in the United States—the latter is now a net oil exporter and self-sufficient in natural gas, giving it some insulation. For oil importers, the higher import bill can widen current account deficits and feed into production costs, which often are passed on to consumers. In some countries, shortages already have emerged, prompting blackouts and rationing. Moreover, the prices of derivatives of oil and natural gas, such as some fertilizers, have risen. Higher fertilizer prices may compromise future crop yields and eventually lead to higher food prices. These
inflationary pressures might compel central banks to keep interest rates higher for longer than markets previously expected.
The severity and persistence of these effects will depend critically on the duration and intensity of the conflict. But, if there is one certainty now, it is uncertainty itself. Geopolitical risk rapidly emerged as the prevailing concern among investors and policymakers alike, with the Geopolitical Risk Index reaching its highest daily level since 2003.
Conflict brings destruction and exposes economic and social vulnerabilities in the region
The conflict weighs most heavily on the MENAAP region. This report assesses its economic repercussions, which, by no means, capture the full toll of lives lost, livelihoods destroyed, and populations displaced. Whatever its course, the conflict will leave a lasting scar on the region and its people.
The nature and magnitude of the impacts vary considerably across countries, shaped primarily by their proximity to the conflict and exposure to the economic channels it has disrupted. At the epicenter are the Islamic Republic of Iran, Iraq, Lebanon, and the Gulf Cooperation Council (GCC) members— Bahrain, Kuwait, Oman, Qatar, Saudi Arabia, and the United Arab Emirates. These economies are most impacted through geography, with maritime trade constrained by the closure of the Strait of Hormuz, and through damages to production and civilian infrastructure.
The economy of the Islamic Republic of Iran was already showing signs of vulnerability prior to the conflict. Sanctions had prompted social unrest, severe shortages, and soaring food prices. The conflict has brought the country’s economy to an
effective halt with widespread destruction. The United Nations High Commissioner for Refugees estimates that, in the first two weeks of March alone, up to 3.2 million people fled their homes. The conflict has also triggered a severe humanitarian emergency in Lebanon, with one-fifth of its population being displaced.
For GCC countries and Iraq, the most immediate economic impact stems from the effective closure of the Strait of Hormuz to shipping traffic, which blocked oil and gas exports. With storage capacity rapidly filling up, production facilities were forced offline—and many have been damaged. These compounding disruptions are driving a significant contraction in hydrocarbon output.
The current conflict is exposing fault lines. The Gulf economies and Iraq depend heavily on a single export route. Geography is part of the constraint—especially for Kuwait and Qatar—but so is inadequate infrastructure, as in Iraq. Even before the conflict, Iraq’s pipeline to Türkiye was able to handle only a fraction of its intended capacity due to disrepair and political disputes. By contrast, Oman, Saudi Arabia, and the United Arab Emirates can partially divert their oil output to ports outside the Gulf.
Gulf countries’ exposure to the economic effects of the conflict depends not only on the concentration of their trade routes but also on how relatively undiversified their economies remain. Oil-related activity accounts for a large share of gross domestic product (GDP) across the Gulf, albeit with varying degrees of diversification. The United Arab Emirates, for example, has made significant strides in reorienting their economies toward financial services, tourism, and manufacturing. At the other end of the spectrum, the economies of Iraq and Kuwait remain heavily concentrated, making them acutely vulnerable to both production disruptions and prolonged uncertainty.
Further from the frontlines, economies such as the Arab Republic of Egypt, Jordan, and Pakistan face indirect but potentially significant negative spillovers, transmitted through elevated hydrocarbon prices, energy shortages, and a decline in remittances
from the Gulf and tourism. In oil-importing countries, oil and gas prices may bring inflationary pressures or increase fiscal imbalances, especially if energy prices are stabilized via subsidies, as has been the case in Tunisia. Early signs of the impact on tourism are emerging with severe flight disruptions, particularly in hubs close to areas of active hostilities. For many of these countries, the conflict arrives at a moment of pre-existing vulnerabilities— heavy dependence on workers’ remittances from the Gulf (as in the Republic of Yemen) or high levels of sovereign debt paired with persistent fiscal deficits in an environment of heightened global risk aversion (as in Egypt).
The conflict’s consequences will outlast its immediate disruptions. Costs associated with recovery could strain public finances and crowd out longterm development priorities, while deteriorated investor confidence may take years to rebuild. Meanwhile, population displacement also carries lasting costs through eroded human capital and persistent disruptions to labor and housing markets.
The current conflict in the Middle East is not the only source of instability in the region. Tensions between Afghanistan and Pakistan have been rising, the Republic of Yemen’s humanitarian crisis has further deteriorated with acute food insecurity, and the fragile ceasefire in Gaza is increasingly strained. In the Syrian Arab Republic, after 14 years of conflict, recent political transitions and the easing of sanctions opened opportunities for stabilization, reconstruction, and recovery, although significant challenges remain.
An uneven macroeconomic outlook
Varying exposure to the conflict is reflected in diverging macroeconomic outlooks across MENAAP. Excluding the Islamic Republic of Iran, economic activity in the region grew 4.0 percent in 2025. GCC economies were seeing robust growth in both oil and non-oil sectors, and Egypt was ready for a strong rebound thanks to declining
inflation, rising private consumption and investment, and structural reforms. Pakistan’s economy gained momentum in the second half of 2025, supported by an industrial rebound and stronger consumer and business confidence. In January 2026, the World Bank forecast an uptick in the regional growth rate to 4.2 percent, driven by anticipated expansion of oil production, recovering export growth, and strengthening private investment.
World Bank forecasts have since been revised, with 2026 real GDP growth (excluding the Islamic Republic of Iran) now projected at 1.8 percent. For GCC countries, growth is now forecast at 1.3 percent, down from 4.4 percent in January. The outlook for Saudi Arabia—the largest economy in this group—has edged down, with a projection of 3.1 percent, whereas real GDP in Iraq, Kuwait, and Qatar is forecast to contract by 8.6, 6.4, and 5.7 percent, respectively, following sizable downward revisions. By contrast, growth expectations for oil importers remained relatively unchanged, while forecasts for oil exporters outside the Gulf— such as Algeria and Libya—have edged upward, as a result of higher oil and gas prices.
Risks are firmly tilted to the downside. Uncertainty is pervasive, and the economic outlook could shift significantly if the conflict intensifies or protracts. The striking differences across projections made by public- and private-sector organizations since the conflict began speaks to just how difficult forecasting has become in this environment. As of March 27, the average gap between the highest and lowest 2026 growth forecasts for Gulf countries exceeds 12 percentage points—an extraordinary spread that underscores just how fluid the situation remains.
Moving from today’s turmoil to tomorrow’s resilience
Addressing the short- and medium-term effects of the conflict is urgent and consequential. Yet these effects also underscore a deeper point. While the overall outlook was improving, the economies of MENAAP did not enter this period of extreme
turbulence from a position of consistent and diversified growth. Rather, many economies were already suffering from long-standing structural weaknesses, including low productivity growth, limited private-sector dynamism, overdependence on oil and gas exports, and persistent labor market challenges.
While war compels policymakers to confront immediate macroeconomic and social pressures, sustained growth depends on building the institutions, capabilities, and competitive sectors that can strengthen and grow economies over time. In turn, prosperity will help reduce the likelihood of future conflicts and civil wars.
The lure of industrial policy
This Economic Update turns to the question of industrial policy, defined as government actions expected to increase strategic business activity as a potential driver of economic growth. Under this framing, industrial policy includes a wide range of tools: tailored public inputs such as industrial parks, workforce training, quality standards, and market access support; market incentives such as subsidies, tariffs, quotas, and local content requirements; and specific macroeconomic interventions such as competitive exchange rate devaluations.
Industrial policies have gained prominence in the global discourse and in MENAAP. Over the past decade, industrial policies, measured by the number of official announcements, have increased threefold in the region. A review of the 19 national development plans (NDPs) reveals a striking degree of common purpose. Unemployment is identified as a key challenge in 15 out of 19 plans, job creation appears as an objective in all 19, and human capital development appears in 18. In addition, economic diversification features prominently as well.
Yet the picture is far from homogeneous. High-income Gulf economies, middle-income oil importers, developing oil exporters, and fragile or conflict-affected states differ sharply in their fiscal space, institutional capacity, market size, and exposure to external shocks. These differences shape not only why governments
turn to industrial policy but also which tools they can realistically deploy and through which institutions those policies are carried out.
GCC economies rely more heavily on subsidies as tools of industrial policy, in line with other high-income countries. However, unlike their global counterparts, GCC economies also implement local-sourcing requirements for products and services. In contrast, developing countries in the region make greater use of import-related policies.
Governments across the region also identify a wide range of strategic sectors in their NDPs—a majority of the countries list at least five. The most frequently targeted sectors are tourism (16 out of 19), agricultural production (14), chemicals (8), and heavy manufacturing (7). In practice, policy support is clustered around a narrower set of activities, often following a gradual “small steps” logic that favors sectors closer to existing capabilities.
MENAAP is also distinctive in the way industrial policies are implemented. In the region, they often operate via indirect channels, not only through ministries and formal policy announcements but also through quasi-public institutions such as stateowned enterprises and sovereign wealth funds. In the United Arab Emirates, sovereign wealth funds manage assets equivalent to roughly 460 percent of GDP, highlighting the scale of financial firepower available for state-led transformation.
The effectiveness of industrial policy depends less on ambition than on fit. Countries with stronger government bandwidth (technical competence and independence of their bureaucracy), more fiscal space, and larger effective markets can use a wider range of instruments, including more targeted ones with fewer unintended consequences. Where those conditions are absent, governments are more likely to rely on second-choice tools, such as tariffs and broader market interventions.
Importantly, industrial policy is not a substitute for sound macroeconomic management, stronger governance, or private-sector reform. Moreover, in settings marked by weak institutions or close ties between political and business interests, it can
easily become captured, poorly targeted, or have unintended consequences.
The MENAAP region offers useful examples of industrial policy—from Morocco’s automotive industry, where output grew by about 14 percent per year between 2012 and 2024, to Dubai’s digital ecosystem, where information and communication technology activities account for about 4.7 percent of GDP. Egypt trained nearly 43,000 specialized workers in 2024 as the tourism industry doubled its share of GDP in the last decade.
Overall, industrial policy can help MENAAP countries diversify, build capabilities, and support transformation. It works best when it is selective and disciplined, embedded in credible public-private coordination, matched to country capabilities, and subject to clear objectives, monitoring, evaluation, and sunset mechanisms. In MENAAP, the central question is no longer whether industrial policy is being used. It increasingly already is. The key question is whether it is being used in ways that are feasible, accountable, and aligned with countries’ constraints and development goals.
Peace and resilience for a better future
The current conflict in the Middle East is testing the resilience of MENAAP economies. The region has endured a sequence of global shocks, from the pandemic to the Russian Federation’s invasion of Ukraine, to regional ones, such as the conflict centered in Gaza and civil wars in many countries. Each shock has compounded the region’s longterm vulnerabilities and narrowed the space for the structural reforms that could have strengthened resilience. These crises unfold against a backdrop of secular global trends such as climate change, increasing demographic imbalances, and rapid advances in artificial intelligence that are already reshaping the region’s ever-evolving economic and social landscape.
Now more than ever is the time for reform. Despite the dark clouds of another conflict, the
governments in the region cannot afford to lose sight of a long-term vision of job-rich growth. Resilience requires building the productive foundations that support durable growth and shared prosperity in the long run. Well-designed industrial policy, tailored to overcome market failures and backed by macroeconomic fundamentals and capable institutions, can be instrumental to that effort. The region has offered examples of what is possible.
Yet all reforms depend on peace. Conflict is “development in reverse”: It costs lives and can destroy in weeks what takes generations to build. The evidence is stark: Seven years after the onset of a conflict, per capita incomes in affected countries in the region are about 45 percent lower than they would have been in the absence of conflict—equivalent to losing roughly 35 years of development. The peace dividend for MENAAP is substantial, forming a much-needed foundation for long-term prosperity.
Abbreviations
ABC Al Ahram Beverages Company
ADEX Abu Dhabi Exports Office
AFG Afghanistan
AI artificial intelligence
AMDIE Agence marocaine de développement des investissements et des exportations (Moroccan Investment and Export Development Agency)
AMICA Association marocaine pour l’industrie et la construction automobiles (Moroccan Association for Automotive Industry and Construction)
ARE United Arab Emirates
BHR Bahrain
CBI Centre for the Promotion of Imports from Developing Countries
CDS credit default swap
Comtrade United Nations Commodity Trade Statistics Database
COVID-19 coronavirus disease 2019
CPC Central Product Classification
DJI Djibouti
DOE developing oil exporters
DOI developing oil importers
DZA Algeria
EBRD European Bank for Reconstruction and Development
ILOSTAT International Labour Organization Statistics Database
IMF International Monetary Fund
IRN Islamic Republic of Iran
IRQ Iraq
ISIC International Standard Industrial Classification
ISO International Organization for Standardization
ISOFAR International Society of Organic Agriculture Research
JOR Jordan
KNOMAD
Global Knowledge Partnership on Migration and Development
KWT Kuwait
LBN Lebanon
LBY Libya
LNG liquefied natural gas
LTFF Long-Term Finance Facility
MAR Morocco
mb/d million barrels per day
MENA Middle East and North Africa
MENAAP Middle East, North Africa, Afghanistan, and Pakistan
MMbtu 1 million British thermal units
MoTA Ministry of Tourism and Antiquities (Egypt)
MPO Macro Poverty Outlook
MSCI Morgan Stanley Capital International
NDP national development plan
NFE North Field East
NTL nighttime lights
OEC Observatory of Economic Complexity
OECD Organisation for Economic Co-operation and Development
OEM original equipment manufacturer
OMN Oman
OPEC+ Organization of the Petroleum-Exporting Countries Plus OTC over-the-counter
PA Palestinian Authority
PAI Plan d’accélération industrielle (Industrial Acceleration Plan) (Morocco)
PAK Pakistan
PIF Public Investment Fund (Saudi Arabia)
PME petites et moyennes entreprises (small and medium-sized enterprises)
PNEI Programme national d’excellence industrielle (National Industrial Excellence Program) (Morocco)
PPP purchasing power parity; public-private partnership
PSE West Bank and Gaza
QAT Qatar
SAU Saudi Arabia
SEZ special economic zone
SOE state-owned enterprise
SOMACA Société marocaine de construction automobiles (Moroccan Automotive Manufacturing Company)
STEM science, technology, engineering, and mathematics
SWF sovereign wealth fund
SYR Syrian Arab Republic
TUN Tunisia
UAE United Arab Emirates
UCDP Uppsala Conflict Data Program
UK United Kingdom
UN United Nations
UNHCR
United Nations High Commissioner for Refugees
US United States
USA
United States of America
US$ United States dollar
WDI
World Development Indicators
YEM Republic of Yemen
Macroeconomic Outlook
KEY
MESSAGES
• On February 28, 2026, a new conflict broke out in the Middle East, centered around the Gulf. As of March 27, 2026, the conflict is still unfolding across the region, with the Islamic Republic of Iran, Iraq, Lebanon, and Gulf Cooperation Council (GCC) countries directly impacted, while others, notably the Arab Republic of Egypt, Jordan, and Pakistan, are increasingly exposed to its broader economic and social effects.
• Uncertainty has spiked worldwide, as the conflict sends ripples across the global economy. Oil and natural gas markets have been particularly impacted by a supply disruption stemming from the effective blockade of the Strait of Hormuz, through which approximately 20 percent of global oil consumption and liquefied natural gas trade flow.
• The Islamic Republic of Iran and Lebanon were already in a state of economic vulnerability. Their preexisting fragility leaves both countries poorly placed to withstand the destruction and widespread economic shocks caused by the conflict.
• For GCC and Iraq’s economies, a key concern is the disruption to their production, processing, and export of oil and natural gas. With the Strait of Hormuz effectively closed and storage facilities reaching capacity limits, production has declined. In addition, mounting damage to energy infrastructure can have longer-lasting impacts, weighing on exports and economic welfare in these countries even after shipping lanes reopen.
• There has been serious conflict-related damage to the production and civilian infrastructure in Lebanon. Several economies in close proximity, such as Egypt, Jordan, and Pakistan, are also affected through inflationary pressures from spiking oil and gas prices and disruptions to tourism and remittances incomes, as well as deteriorating investor sentiment.
KEY MESSAGES (continued)
• The economic outlook of the region was evolving rapidly as this report was prepared. The coming weeks will be critical in determining the intensity and duration of the conflict, with consequences for the region’s economic prospects in the near and medium term. The wide dispersion in forecasts across public- and private-sector organizations highlights the exceptional uncertainty surrounding the outlook and the difficulty of making projections.
• The conflict hit MENAAP the hardest. Regional growth (excluding the Islamic Republic of Iran) is projected to decelerate from 4.0 percent in 2025 to 1.8 percent in 2026. This reflects a sharp slowdown in the GCC economies, where growth is expected to decline from 4.4 percent in 2025 to 1.3 percent in 2026. By contrast, growth in the economies further away from the conflict is forecast to remain broadly steady.
• This latest conflict is only one of the sources of fragility for economies in MENAAP. Afghanistan, the West Bank and Gaza, and the Republic of Yemen all face a tenuous outlook as they grapple with their own crises and search for paths to recovery.
On February 28, 2026, a new conflict erupted in the Middle East, sending shockwaves across the region and the world. This chapter assesses its economic repercussions—but in doing so, it necessarily offers a partial account of the conflict’s true toll. The loss of life, mass displacement, and widespread destruction of homes and infrastructure represent a profound human cost that defies quantification and will continue to deepen depending on the trajectory, scale, and duration of hostilities. The negative economic impacts may fall heaviest on the most vulnerable populations who have limited buffers to absorb income disruptions and recover from the shocks. This dynamic is more troubling in the MENAAP region, where poverty has halted its decline since 2017, diverging from global poverty reduction trends.
Global effects of the conflict in the Middle East
The outbreak of the conflict in the Middle East has tested the resilience of the global economy. As hostilities began, geopolitical risk rapidly emerged as the prevailing concern among investors and policymakers alike. Up until now, the Trade Policy
Uncertainty Index had been the dominant source of market anxiety, reaching a record high in April of 2025 (figure 1.1, panel A). Since the beginning of the conflict, the Geopolitical Risk Index has spiked, reaching its highest daily reading since 2003 (figure 1.1, panel B). Historically, elevated readings on either index have foreshadowed weaker investment and employment, particularly among firms and industries most exposed to external shocks, as well as greater downside risks to gross domestic product (GDP) growth (Caldara et al. 2020; Caldara and Iacoviello 2022).
The conflict continues to unfold across the MENAAP region as of March 27, 2026, with the Islamic Republic of Iran, Iraq, Lebanon, and GCC countries directly impacted by the hostilities. Beyond the devastating human toll, the conflict has caused widespread damage to critical infrastructure, concentrated in, but not limited to, the Islamic Republic of Iran and Lebanon. The effective closure of the Strait of Hormuz is of particular consequence for the global economy and the region. Since hostilities began, several oil tankers have been struck and damaged near the strait, bringing maritime traffic to a near-standstill. Between March 2 and March 22, an average of just five ships per day crossed the
FIGURE
1.1 Global developments
range (max. and min.
Sources: world bank calculations based on caldara and Iacoviello (2022) and caldara et al. (2020).
Note: For both panels, the last observation corresponds to march 23, 2026. the red line denotes a rolling 7-day average, and the
denotes the
(maximum and minimum daily values) on a 7-day rolling basis.
FIGURE 1.2
of ships traversing the Strait of Hormuz
No. of ships traversing the Strait of Hormuz
Source: International monetary Fund, Portwatch, https://portwatch.imf.org/. data accessed on march 27, 2026.
Note: the yellow line indicates the 7-day moving average of ships transits, overlaid against the raw
to account for baseline seasonality.
strait, compared to 96 over the same period a year prior—a 95 percent decline (figure 1.2).
The most immediate transmission channel of the conflict’s economic impact on the global economy has been through oil and gas markets. As one of the
totals (dark
and
world’s most consequential maritime choke points, the Strait of Hormuz handles roughly 20 percent of global oil consumption, drawing exports primarily from Bahrain, the Islamic Republic of Iran, Iraq, Kuwait, Saudi Arabia, and the United Arab Emirates. It is also the principal route for liquefied
natural gas (LNG) from Qatar, accounting for about 20 percent of total global LNG trade. With few viable alternative routes, the closure has effectively severed a major artery of global energy supply.1 While damages to oil infrastructure and precautionary halts to oil production may have longer-term implications, as long as the Strait of Hormuz is closed, disruption to shipping will remain the most immediate constraint on global oil supply.
The resulting supply shock has sent oil and gas prices soaring. Brent crude, the international benchmark, closed at US$72.5 per barrel on February 27—already elevated relative to the US$60–63 per barrel range that prevailed in December 2025 as tensions in the Gulf mounted. Following the outbreak of conflict, prices climbed almost 40 percent within a week and surpassed US$112 per barrel by March 27 for the first time since 2022. European natural gas prices, which are heavily influenced by LNG spot rates, surged from around US$11/ million British thermal units (MMbtu) before the conflict to over US$18/MMbtu by March 27, an almost 70 percent increase.
Futures’ trends offer a telling signal about how markets are estimating the conflict’s likely duration. Short-term oil futures contracts for May 2026 delivery rose by about 58 percent over the first month of hostilities, while longer-dated futures contracts for December delivery climbed to approximately US$84 per barrel—a more modest increase of about 25 percent. This suggests that markets expect some normalization over the medium term, even as near-term disruption remains severe (figure 1.3). A similar pattern is visible in European natural gas futures, where short-term contracts rose by about 70 percent while longer-term contracts rose by comparatively less. To make matters worse, shipping costs have also risen, not only because fuel prices are higher but also due to rising insurance premia. In the month following the start of the conflict, Baltic Dirty and Clean Tanker
1The Saudi Arabia east‒west pipeline can handle 7 mb/d—equivalent to about 70 percent of the kingdom’s preconflict oil production—and the Abu Dhabi crude oil pipeline could funnel less than half the United Arab Emirates’ preconflict output. The Iraq‒Türkiye pipeline is in disrepair and has recently handled only 0.2 mb/d—less than 5 percent of the output of February 2026.
Indices—which measure the cost of shipping different types of oil—have roughly doubled.
Historical precedents underscore the significance of the current shock. When roughly 2.5 million barrels per day of Russian Federation oil exports— approximately 30 percent of its exports and 3 percent of global supply (IEA 2022)—were cut off from world markets following the 2022 invasion of Ukraine, Brent crude surged more than 30 percent within 2 months and remained elevated for another 4 months. The Gulf War of 1990 removed approximately 4 million barrels per day from the global supply, around 6–7 percent of the total at the time (IMF 2013), causing prices to more than double within 3 months. The current disruption is larger in scale, affecting an estimated 20 million barrels per day (mb/d), or 20 percent of the world supply.
The macroeconomic consequences of a sustained oil price shock are well understood. Higher energy costs raise input prices across energy-intensive industries, and over time, these firms tend to pass these costs to their consumers, pushing up core inflation and eroding real incomes. The resulting drag on household purchasing power and business investment translates into slower growth. As a critical example, fertilizer prices exhibit this dynamic. Moreover, the supply of urea from major exporters in the Gulf is constrained. Agricultural yields will be at risk if elevated fertilizer prices persist into the planting season, with knock-on effects on global food supply. As in past episodes of commoditydriven food price spikes, the burden falls disproportionately on poor and vulnerable populations (Gatti et al. 2023). Should the conflict prove protracted and global inflation prove persistent, central banks may be compelled to tighten monetary policy to anchor expectations—adding a further headwind to global growth at a moment of already elevated uncertainty.
The extent to which these global risks materialize depends critically on how the conflict evolves and how long it lasts. In the MENAAP region, economic impacts are already being felt—most acutely in countries directly involved and in those in close geographical proximity to the conflict. The
FIGURE
1.3
Spillovers of the conflict through oil and gas prices, January 2024 to July 2027
2026
Sources: bloomberg L.P. and world bank commodity Price data (the Pink sheet).
Note: mmbtu = million british thermal units.
Panel A: the black lines indicate the spot price of generic brent crude oil, and the dashed lines illustrate the futures prices as of, respectively, February 23, 2026, and march 27, 2026. Latest futures observation is december 2027.
Panel b: the black lines indicate the spot price of generic us natural gas and european natural gas (title transfer Facility). the dashed lines show the futures prices as of, respectively, February 27, 2026, and march 27, 2026, for each commodity.
Panel c: brent crude price in monthly frequency since 1980, in constant 2025 us$. Price for march 2026 is represented by month-to-date average daily brent closing prices until march 27.
following section examines these regional effects in detail.
Regional effects of the conflict in the Middle East
The most severe and immediate economic consequences of the conflict will be felt within the MENAAP region itself. The nature and magnitude of the impacts vary considerably across countries and sectors, shaped by two principal factors: (1) proximity to the conflict and (2) exposure to the economic channels it has disrupted.
At the epicenter of the conflict are the Islamic Republic of Iran, Iraq, Lebanon, and the GCC members—Bahrain, Kuwait, Qatar, Oman, Saudi Arabia, and the United Arab Emirates. These economies are most impacted through geography— their maritime trade is constrained by the closure of the Strait of Hormuz—and through severe damage to productive and civilian infrastructure.
Further from the front lines, a broader set of economies face indirect but potentially significant spillovers. Oil-importing economies will face similar balance-of-payment and inflationary pressures from elevated hydrocarbon prices as do oil importers elsewhere in the world. These challenges are compounded, however, by their proximity to the conflict and closer economic ties with the countries directly involved—exposing them to additional shocks through declining tourism and remittances incomes and weakened investor confidence. The conflict arrives at a moment of pre-existing vulnerability, marked by dependence on workers’ remittances from the Persian Gulf, especially in fragile economies, or by fiscal positions ill-suited to sustain elevated public debt in an environment of heightened risk aversion.
Scarring can outlast the conflict itself. In directly affected economies, damages to infrastructure, the erosion of human capital, lower investor confidence, and negative touristic perception can be slow to recover, compromising future growth.
menAAP economies at the epicenter of the conflict are the most affected
The Islamic Republic of Iran and Lebanon have already experienced mounting loss of life, mass displacement, destruction of infrastructure, and severe economic disruptions—immediate human and physical capital costs that risk leaving lasting scars. Both countries entered the conflict from positions of significant economic fragility.
Hit by sanctions, social unrest, acute water shortages, and electricity and gas outages, the Islamic Republic of Iran’s economy was already severely weakened heading into the current conflict. In 2025, the country was in recession, with GDP shrinking by 0.7 percent in the first half of the Iranian fiscal year (April‒September 2025). Inflation accelerated, with food prices rising at a record 99 percent for the year ending in February 2026. The current conflict compounds these pre-existing vulnerabilities: Ruptures in trade routes and infrastructure destruction are layering new pressures onto an alreadyfragile economic base. The Islamic Republic of Iran’s dependence on oil—which accounted for nearly half of all exports and close to 10 percent of GDP over the past decade—leaves the economy acutely exposed to the trade and shipping disruptions.
Since the sovereign default in 2020, Lebanon’s economy has been devastated by what has been described as one of the worst banking, currency, and sovereign-debt crises since the mid-19th century (World Bank 2021). Economic conditions have been marked by high inflation, deep economic contraction, a paralyzed banking sector, and rising poverty. In 2025, signs of recovery emerged, with growth estimated at 3.5 percent alongside falling inflation, a stabilizing exchange rate, and notable step toward banking sector reform—though these gains remained fragile. The ongoing conflict threatens to severely set back this incipient recovery. With limited fiscal buffers, no access to international capital markets, and weak productive capacity, the economy is poorly positioned to absorb the additional strains of widespread asset destruction and
mass displacement that the conflict brings—especially when potential buffers, such as remittances from the Gulf, are at risk.
Oil and gas production and exports have been heavily impacted by the Strait of Hormuz closure
Other countries at the epicenter of hostilities— Bahrain, the Islamic Republic of Iran, Iraq, Kuwait, Oman, Qatar, Saudi Arabia, and the United Arab Emirates—share two structural characteristics that define their exposure to the conflict’s economic fallout. First, their economies depend heavily, albeit to varying degrees, on hydrocarbon exports. Second, the effective closure of the Strait of Hormuz disrupts the primary export route through which their oil and gas reach world markets.
The scale of the Strait’s importance to regional energy flows cannot be overstated. More than half of the volume of crude oil produced by Gulf countries transited the choke point, representing approximately 20 percent of global crude oil and condensate supply (figure 1.4, panel A). The degree of exposure, and thus risk, from having exports concentrated in a single export route varies by country. Notably, a vast majority of the total oil exports of Bahrain, Iraq, and Kuwait traverse the Strait of Hormuz (figure 1.4, panel B). Qatar is also exposed: Over 90 percent of its LNG production—equivalent to approximately 20 percent of global LNG exports—passes through the strait. Some countries have partial alternatives: Oman, Saudi Arabia, and the United Arab Emirates can divert a portion of their exports through pipelines and ports outside the Gulf. For Bahrain, Iraq, Kuwait, and Qatar, no such alternatives exist at a meaningful scale. Storage capacity provides some buffer, allowing production to continue and inventories to accumulate while the strait is closed, partially mitigating the immediate impact on output.
Compounding the disruption to export routes, oil fields, refineries, and other productive infrastructure have ceased operations across the Gulf as a result of physical damage, precautionary shutdowns, or storage facilities that have reached capacity with no viable export outlet. In Saudi Arabia, the Safaniya and Zuluf offshore fields, with a
combined capacity exceeding 2 mbpd—equivalent to approximately 20 percent of the kingdom’s output in February 2026—have been shut down. Iraq’s Rumaila and West Qurna-2 fields, which together account for approximately 2 mbpd, or over 40 percent of the country’s February 2026 output, have also been shut down. Qatar has halted LNG production entirely following military strikes on facilities at Ras Laffan Industrial City, where virtually all of the country’s LNG exports originate.
The International Energy Agency projects immediate and substantial reductions in Gulf crude output for March 2026 (figure 1.4, panel C). The steepest declines are in Iraq and Qatar—with month-over-month production falling by 67 percent and 79 percent, respectively, from February levels—reflecting their near-total dependence on the Strait of Hormuz. Saudi Arabia and the United Arab Emirates, benefiting from partial rerouting capacity, face comparatively smaller but stillsizeable contractions of 23 percent and 25 percent, respectively.
How much these production cuts translate into broader and longer-term economic slowdowns depends on each country’s structural reliance on the oil and gas sector. Hydrocarbon-related activity accounts for a large share of GDP across all Gulf economies, but the degree of diversification varies considerably. In past decades, Bahrain and the United Arab Emirates have made the most significant strides in reorienting their economies toward financial services, tourism, and manufacturing, with oil and gas rents amounting to approximately 16 percent to 18 percent of GDP by 2021—leaving them comparatively less exposed to a hydrocarbon shock (figure 1.4, panel D).2 At the other end of the spectrum, Iraq and Kuwait remain heavily concentrated in oil and gas, whose rents add up to over 40 percent of GDP, making them acutely vulnerable to both the production disruptions and the prolonged uncertainty that the conflict has introduced.
2Oil and gas rents are the difference between the value of oil and gas output at regional prices and total costs of production.
FIGURE 1.4 Direct effects of the conflict through oil and gas exports
of
C. Projected month-over-month change in crude production from February to March 2026
B. Share of oil and gas exports that traverses the Strait of Hormuz, given alternative routes
Sources: International energy Agency; un comtrade; world bank world development Indicators; Fitch Ratings; world bank calculations.
Note: doe = developing oil exporters; gcc = gulf cooperation council; mbpd = million barrels per day.
Panel A: volumes of oil, including both crude and products, transported through the strait of hormuz, expressed as a share of total production.
Panel b: Represents the share of oil and gas exports that traverse the strait of hormuz, subtracting out the share for which alternatives exist. saudi Arabia’s east–west pipeline is assumed to operate at 7 mbpd, and the united Arab emirates’ habshan–Fujairah pipeline at 1.7 mbpd.
Panel c: values indicate projected declines in crude oil production for the month of march relative to February production.
Panel d: oil and gas rents are the difference between the value of oil and gas output at regional prices and total costs of production. data from all countries are for 2021, with the exception of kuwait, for which 2020 data are used.
The medium- and long-term picture is highly uncertain. A short-lived conflict that inflicts limited damage to infrastructure could allow output to recover quickly once trade flows resume. Sustained damage to production infrastructure—wells, processing and storage facilities, and pipelines—could impair the ability to restore normal operations long after hostilities cease, with scarring repercussions that outlast the conflict itself.3 If the conflict were to protract, deteriorating perceptions about the region could become entrenched and have longterm impacts on growth through multiple channels—for example, through lower tourism or lower foreign investment—in addition to extending the trade disruptions and potentially bringing about more damage to infrastructure.
The costs of damage to infrastructure are difficult to assess at this stage
The conflict has caused direct damage to productive and civilian infrastructure across the countries at its epicenter. As of this writing, the full extent of that damage remains difficult to assess, as hostilities continue and destruction accumulates.
Productive capacity has been directly threatened by strikes on energy infrastructure. Oil and gas fields, refineries, and other facilities, as well as ports, have been targeted across the region. The severity of the consequences has varied considerably. Saudi Aramco’s Ras Tanura refinery—one of the world’s largest oil-processing facilities—was temporarily shut down on March 2, 2026, following strikes, but reopened 11 days later. Qatar’s Ras Laffan Industrial City—the world’s largest LNG export hub—suffered greater disruption after the March 18–19 strikes that QatarEnergy reported has affected around 17 percent of Qatar’s LNG exports.
Civilian infrastructure has not been spared. Airports and electricity and desalination facilities have also been targeted. In the arid Middle East, populations
3Note that shutting in oil wells carries risks to future production rates, which worsens as restarting production is delayed. This is an indirect form of damage that stems from the induced halt in oil activity due to the closure of the Strait of Hormuz.
are heavily dependent on desalination to meet their freshwater needs, accounting for 40 percent or more in Bahrain, Kuwait, Qatar, and the United Arab Emirates in 2018 (Jägerskog and Barghouti 2022). Similarly, the Islamic Republic of Iran was already facing acute water shortages before the conflict began.
The broader fiscal implications are significant. Governments face rising spending pressures on multiple fronts: repairing damaged infrastructure and sustaining military defense systems. Recovery costs will ultimately depend on the duration, intensity, and geographic scope of the conflict. Compounding these pressures are foregone revenues from reduced economic activity—the result of security concerns, the effective blockade of the Strait of Hormuz, and direct damage to productive infrastructure.
Fiscal resilience varies sharply across the region. Countries such as Qatar, Saudi Arabia, and the United Arab Emirates have sufficient fiscal space to absorb temporary spending pressures and recover relatively quickly from a short conflict. Others face far more constrained circumstances. Lebanon, still operating under severe fiscal stress following its 2020 sovereign default, has limited financing options. Bahrain was already carrying a sizeable fiscal deficit—10.8 percent of GDP in 2025—and elevated public debt. Fiscal space may tighten further as conflict disrupts the oil sector, which is still a principal source of revenue for Bahrain.
menAAP economies in the periphery of the conflict stand to be significantly affected
The immediate effects of the conflict are primarily felt in the directly involved countries. Yet, the conflict’s economic impact reverberates in the region through various channels. These include heightened oil prices, declines in tourism activity, higher financial outflows, lower remittance inflows, and displacement of people from conflict-affected areas. As was the case for the direct effects, the relative importance that each indirect effect may have on a given economy in the region will depend on its exposure and structural vulnerabilities.
Increasing energy and fertilizer prices pose risks to balance of payments and food security
The increase in oil and gas prices translates to a negative terms-of-trade shock across MENAAP oil importers, as average prices of imports become more expensive relative to exports. For oil importers, persistently high oil and gas prices reduce the purchasing power of the economy, depressing private consumption and investment and hindering economic growth. Moreover, higher import bills can deepen existing trade imbalances. These pressures compound long-standing patterns of low economic growth and persistent trade deficits among oil importers in the region.
MENAAP oil importers vary in their degree of exposure to negative terms-of-trade shocks. For a given increase in oil and gas prices, countries whose oil and gas imports account for a larger share of imports will be more impacted. This is the case for Lebanon, Pakistan, and the Republic of Yemen, where oil and gas imports averaged approximately 25 percent of the total merchandise import bill between 2015 and 2024 (figure 1.5). These countries are among the world’s most oil- and gasdependent importers. In Egypt, Jordan, and Tunisia, oil and gas imports account for a smaller share,
close to 15 percent during the same period, but still substantially higher than the global average of 5 percent in 2024.
Trade disruptions extend well beyond oil and gas prices and export quantities. In 2024, the region accounted for approximately 35 percent of global exports of urea nitrogen, a key input for inorganic fertilizers. Between February 27 and March 27, urea prices surged by approximately 50 percent, driven by a sharp contraction in exports as shipping through the Strait of Hormuz became severely constrained. Moreover, a sustained rise in energy prices would feed directly into higher fertilizer costs globally.
Farmers facing elevated input costs may reduce fertilizer application or forgo it altogether, leading to lower crop yields. As output declines, food prices would rise—though these effects are likely to materialize with a lag, contingent on the timing of the growing season. The resulting food price pressures may extend well into the medium term.
MENAAP countries are highly exposed to food price shocks, reflecting high cereal import dependence, fertilizer-intensive cereal production, and the prominence of food in household budgets, as evident in its high Consumer Price Index weight. Cereal import dependency exceeds 80 percent across much of the region, reaching near-total dependence in Djibouti, Jordan, and several Gulf economies, with ratios approaching 100 percent in Kuwait, Qatar, and the United Arab Emirates (figure 1.6).4 The impact of higher international prices—particularly for energy and food—can manifest through higher prices passed on to consumers or through increased fiscal costs when governments intervene to keep prices artificially low via subsidies or price controls.
Higher import prices put pressure on countries’ exchange rates, which can compound the burden of rising international prices. A weaker local currency raises the domestic price of all imported goods, amplifying the effect of already-elevated international commodity prices. For food and oil importers in particular, the combination of high global
4Note that the United Arab Emirates maintains a food and water reserve that can mitigate near-term transmission risk.
prices and a depreciating currency can be especially damaging.
A clear illustration of this dynamic emerged following the Russian Federation’s invasion of Ukraine. Inflation—food inflation in particular—hit developing economies in the region that experienced currency depreciation the hardest. Analysis suggests that, had their currencies remained stable, inflation in these countries would have been significantly more contained (Belhaj et al. 2022; Gatti et al. 2023). Economies operating under pegged exchange rate regimes were largely shielded from this compounding effect.
Furthermore, governments across the region engage in product market interventions such as price controls and consumption subsidies to hold down prices of specific goods or services. However, this is difficult for countries with high levels of debt and limited fiscal space, as is the case of some oilimporting economies in the region. In contrast, GCC economies with substantial fiscal space could contain inflation along with fuel subsidies and other product market interventions. Thus, while conflict in the Middle East exposes them to acute supplychain risks—more than 70 percent of their food imports transit the Strait of Hormuz, and sustained instability drives up freight rates, war-risk insurance premia, fuel prices, and fertilizer costs—the fiscal resources available to many of the GCC economies can buffer against some of these challenges.
High food prices, combined with heavy food import dependency, can be particularly burdensome for poorer countries and, within countries, for low-income households, who spend a larger share of their budgets on food than their wealthier counterparts. Across developing MENAAP countries, household budget surveys show that the bottom consumption quintile devotes 35–50 percent of total spending to food, against 15–35 percent for the top quintile, with the shares reaching 85 and 59 percent, respectively, in Djibouti. Although the overall weight of food in the consumption basket is significantly lower in GCC economies, similar distributional patterns emerge. In Oman, transferdependent households allocate nearly 40 percent of income to food, more than double the share of
Sources: Food and Agriculture organization (FAo) global monitoring database (gmd) database. calculations by the menAAP poverty and equity team (Atamanov et al. 2026).
Note:
Panel A: estimates for bahrain, Libya, and the west bank and gaza are not available. the cereal import dependency ratio measures how much of a country’s available domestic cereal food supply comes from imports versus its own production. the cereal import dependent ratio is calculated as (cereal imports – cereal exports) / (cereal production + cereal imports – cereal exports) × 100. the ratio ranges from negative values to a maximum of 100. A score of 100 indicates complete dependence on imports for cereal supply, while a score of 0 reflects full self-sufficiency. negative values indicate net exporters—countries whose domestic cereal production exceeds internal consumption.
Panel b: data for morocco come from https://datatopics.worldbank.org/consumption/country/morocco. data for tunisia come from annex 3 of the official Report. data from Lebanon are not representative for the whole country.
wage-employed households (18 percent) and well above the national average (19 percent); in Saudi Arabia, food’s share of household budgets rises markedly in less affluent regions with lower median per capita expenditure.
Across these varied contexts, the evidence consistently points to the same conclusion: Food price shocks fall heaviest on the most vulnerable—transferdependent households, residents of poorer regions, and migrant workers with limited income buffers.
FIGURE 1.6 Dependence on cereal imports and share of household expenditures on food
Cereal import dependency ratio (percent, 3-year average)
Share of food consumption (percent)
B. Share of food consumption by quintile across developing MENAAP
(ALG)
Conflict will affect tourism-dependent countries in the region
The ongoing conflict has severely disrupted the regional airspace, with direct consequences for tourism—a major income source across the region. The magnitude of economic impact varies across countries, as the degree of airspace disruption and the economy’s dependence on tourism revenues vary.
During the first weeks of the conflict, flight disruptions were most pronounced at airports closest to active conflict, including those in the Gulf, the Islamic Republic of Iran, Jordan, and Lebanon. Arrivals to Tehran have halted, while average arrivals to Amman declined by half and to Beirut by twothirds by March 25, 2026, relative to the last week of February. Arrivals to some of the region’s major aviation hubs—Abu Dhabi, Doha, and Dubai— fell by more than 70 percent over the same period (figure 1.7). Arrivals dropped by approximately 20 percent in Cairo and Karachi, while Algiers
(DXB) SAU (JED) PAK (KHI)
EGY (CAI) MAR (CMN)
(RUH)
(DOH)
(percent of GDP)
Sources: Aviation stack; un tourism; world bank world development Indicators (wdI).
Note: Percent change in arrivals represents the percent decline in average daily arrivals for the period march 1–25, compared against the week immediately preceding the conflict (February 22–27). tourism receipts data are sourced from un tourism’s total inbound tourism expenditure indicator. that figure is expressed as a percent of gdP using the wdI gdP figure. change in arrivals is an airport-specific statistic while tourism as a percent of gdP is a country-level statistic. data points are labeled by Iso country codes, with 3-letter International Air transport Association codes in parentheses identifying airports. the following airports are represented above: ALg (houari boumediene Airport, Algiers), Amm (Queen Alia International Airport, Amman), Auh (Zayed International Airport, Abu dhabi), bey (beirut–Rafic hariri International Airport), cAI (cairo International Airport), cmn (casablanca mohammed v International Airport), doh (hamad International Airport, doha), dxb (dubai International Airport), Ik A (Imam khomeini International Airport, tehran), Jed (king Abdulaziz International Airport, Jeddah), khI (Jinnah International Airport, karachi), Ruh (king khalid International Airport, Riyadh), and tun (tunis–carthage International Airport). tourism receipts data represent the most recent available year for each country, which are as follows: Algeria (2023); egypt, Arab Rep. (2024); Iran, Islamic Rep. (2018); Iraq (2023); Jordan (2023); Lebanon (2023); morocco (2023); Pakistan (2024); Qatar (2024); saudi Arabia (2024); tunisia (2023); and the united Arab emirates (2021).
and Casablanca, the farthest from the conflict, saw declines of less than 10 percent.
Economic consequences are most acute where flight disruptions coincide with high international tourism dependence. Jordan and Lebanon are particularly exposed—international tourism receipts reached 28 percent of GDP in Lebanon and 17 percent in Jordan in 2023, and both experienced flight arrival declines of more than 60 percent in the first week of the conflict. Bahrain, Qatar, and the United Arab Emirates, where tourism accounts for between 8 and 11 percent of GDP, also face significant risk. For these economies, the combination of airspace disruption and structural reliance on tourism suggests potentially substantial near-term tourism income losses.
Even as airway traffic normalizes, the initial decline in tourism could be followed by lasting effects due to traveler aversion affecting countries close to a conflict. In the 12 months after October 2023, tourist arrivals were lower by 12.6 percent in Lebanon and 2.7 percent in Jordan, the two countries closest to the active conflict (figure 1.8), relative to the 12 months earlier. By the second year, as the conflict continued, arrivals in Jordan had recovered to 1.1 percent higher than preconflict arrivals, but declines continued in Lebanon. Arrivals between October 2024 and September 2025 were 18.3 percent lower than the year before the conflict. In January 2025, 15 months after the start of the conflict, Jordan for the first time achieved two consecutive months of year-over-year growth in arrivals. Lebanon achieved the same 3 months later in April 2025. Tourist arrivals in countries farther away from the conflict continued to grow, although at a slowing pace after a large rebound coming out of the pandemic in 2020.
Displacement is increasing
Intensifying conflict in the Islamic Republic of Iran could trigger a major refugee crisis across a region, which is already one of the world’s most heavily affected from displacement. Conflict in the Syrian Arab Republic displaced more than half of its pre-war population, including more than 6 million refugees
in neighboring countries—Jordan, Lebanon, and Türkiye. Afghanistan also looms large in the regional displacement picture: 2.9 million Afghans returned in 2025, primarily from the Islamic Republic of Iran (around 1.9 million) and Pakistan (around 1 million). Pakistan is still hosting about 1.6 million Afghan refugees and asylum-seekers, while Iran hosts roughly 750,000 registered Afghan refugees on top of much larger populations of other Afghans with different legal statuses in both countries.5
As of March 27, 2026, the United Nations High Commission for Refugees (UNHCR) estimates that up to 3.2 million internally displaced Iranians fled their homes during the first two weeks of the conflict, based on data from the government of the Islamic Republic of Iran. At the time of writing, this remains the most recent estimate on internal displacement in the Islamic Republic of Iran, yet given the fluidity of the situation, the number of internally displaced persons in the country could shift. Most Iranian households are reported to be temporarily fleeing from Tehran and other major urban centers toward the north of the country and rural areas to seek safety (UNHCR 2026a). On the cross-border front, UNHCR has also reported that 60,600 Iranian nationals have crossed into Türkiye.
Escalating hostilities have also triggered a humanitarian crisis in Lebanon. Heavy displacement has been reported across southern Lebanon, the Bekaa Valley, and the southern suburbs of Beirut following Israeli evacuation warnings. As of March 27, 2026, according to Lebanon’s Ministry of Social Affairs, more than 1.2 million people, nearly one-fifth of the population, have been displaced in Lebanon since March 2, including over 350,000 children.6 Cross-border movements have also intensified, with 28,633 Lebanese nationals crossing into Syria according to the Syrian government, as of March 27, 2026.7
Source: official Aviation guide schedules Analyzer.
Note: the figure shows air travel arrivals to given countries, measured by number of seats, by year, normalized to arrivals between october 2021 and september 2022. each bar represents a single year’s arrivals, starting october 1 and ending september 30.
At the same time, the conflict in the Middle East has prompted an increase in return movements among displaced Syrians. Since the onset of the conflict, 175,134 Syrians have returned to Syria as of March 27, 2026 (UNHCR 2026b). The current conflict could further intensify returns via increased fragility and declining safety, tightened migration enforcement, and increased deportations, as well as a rapidly declining economy.
The greatest risk is a large-scale outflow from the Islamic Republic of Iran, a country with a population of more than 90 million people. This would not be an isolated humanitarian emergency but potentially a massive shock to a region whose host communities, public services, and aid systems are already strained by some of the worst refugee crises in recent history. Whether such an outflow materializes will depend in part on the extent of the conflict’s regional spillovers, while whether displacement remains temporary or becomes protracted will hinge on its duration and intensity. If cross-border movements occur on a large scale, the consequences for host countries could be profound, including added pressure on labor markets, public services, and housing, alongside the immediate humanitarian toll on the welfare and well-being of displaced populations themselves.
FIGURE 1.8 Annual tourist arrivals before and after the conflict centered in Gaza
Spillover risk to financial markets in MENAAP
Assessing the full toll of the conflict on foreign direct investment (FDI), balance of payments, and fiscal positions of the MENAAP economies remains difficult at this stage. These statistics are reported at quarterly or annual frequency and will take months to appear in official sources. Certain high-frequency data from financial markets offer a more immediate window into investor sentiment, sovereign risk, and capital flows—though they require careful interpretation. Financial markets aggregate information and expectations, but during periods of heightened uncertainty, they can be prone to speculative behavior rather than faithfully reflecting economic fundamentals (De Long et al. 1990; Shiller 1981). With that caveat in mind, the signals they are sending are discussed below.
Equity markets reacted sharply to the outbreak of conflict, with stocks falling across the region in the first days of the conflict (figure 1.9, panel A).
Following Iranian drone strikes on the United Arab Emirates, exchanges in Abu Dhabi and Dubai suspended trading for two days—March 2–3, 2026— to protect the financial system and prevent panic selling. After reopening, both exchanges continued on a downward trajectory. By March 27, the main market indices for Abu Dhabi and Dubai were down by 8 and 15 percent, respectively, relative to February 26. The fallout extended well beyond the Gulf. Stock markets in Egypt and Morocco— geographically removed from active hostilities—fell by 12 and 9 percent, respectively, within a week of the conflict’s onset. Pakistan’s stock exchange was also affected, where the primary benchmark, the Karachi Stock Exchange-100 index, experienced its largest-ever single-day drop on March 2, plunging by nearly 10 percent. This triggered a marketwide circuit breaker that halts trading temporarily to curb panic-selling during periods of extreme volatility.
Large market swings during conflict periods can be transient, and some of the initial declines have since partially reversed. But the directional moves matter less than what underlies them: sustained volatility
and instability. In Morocco, for instance, stock market volatility—measured by the weekly deviation of the benchmark Morgan Stanley Capital Index (MSCI)—reached its highest level since 2021. When asset prices fluctuate sharply, firms tend to defer capital expenditure, banks tighten lending standards, and foreign investors may exit the market altogether. This dynamic was already visible in Egypt and the United Arab Emirates in the days leading to the start of the hostilities: Foreign investors had taken a sustained net selling position in equities during the military buildup, a trend that intensified after the conflict erupted (figure 1.9, panels B and C). Reflecting these capital market reactions, the Egyptian pound weakened by approximately 10 percent by March 27—even as the spread between official and parallel market rates remained stable.
Sovereign bond market reactions expose underlying fiscal vulnerabilities. Risk premia—the additional return investors demand for bearing uncertainty— have risen since the conflict began, as evidenced by widening sovereign bond spreads across the region, particularly in more indebted economies such as Bahrain, Egypt, Iraq, and Pakistan (figure 1.9, panel D). Increases in credit default swap (CDS) yields—which function as insurance against sovereign default—further underscore the elevated vulnerability of Bahrain and Egypt (figure 1.9, panel E). Countries that entered the conflict with limited fiscal buffers have little room to absorb the conflict’s knock-on effects, including rising energy and food import bills. Higher bond yields for those same countries translate into higher borrowing costs—making it more expensive to service existing debt, roll over maturing obligations, and access new financing—further narrowing the ability to respond to the shocks.
Rising volatility and credit risk premia also threaten to dampen foreign direct investment (FDI), which has grown increasingly important as a source of long-term financing in MENAAP, particularly in the GCC (figure 1.10). Prior to the conflict, GCC countries had made progress in positioning themselves as global destinations for private equity, venture capital, and digital infrastructure investment.
FIGURE 1.9 Spillover effects of the conflict through financial channels
A. Equity market indices in MENAAP as of March 27, 2026
(percent)
Markets Index change
Sovereign bond spread
Percentage point difference relative to US 5-year bond yields
(US$,
C. Net foreign trading flows in Egyptian equities Net foreign trading equities, fixed income, and OTC (US$, millions)
Sources: bloomberg L.P.; International monetary Fund (ImF) balance of Payments.
Note: euR = euros; mscI = morgan stanley capital Index; otc = over-the-counter; PPP = purchasing power parity; uAe = united Arab emirates.
Panel A: graph shows percent change of equity indices relative to their values on February 27, 2026. equity Indices per country (the mscI country equity indices) are market capitalizationweighted indices aggregating the performance of companies representing 85 percent of each market, mainly consisting of large- and mid-cap companies. emerging markets mscI Index is constituted of large and mid-cap companies from 24 emerging market countries, with a total of 1,195 constituents (approximately covering 85 percent of the free float-adjusted market capitalization in each country). these indices are quoted in us$. Panel shows data for march 27, 2026 countries are ordered in ascending 2024 gdP per capita (constant 2021 $PPP).
Panel b: shows daily net foreign equity, fixed-income, and otc purchases in the Arab Republic of egypt, us$, millions. Panel shows data as of march 27, 2026.
Panel c: shows daily net foreign equity purchases in the united Arab emirates, us$, millions. Panel shows data as of march 27, 2026.
Panel d: sovereign spreads are calculated as the difference between the yield to maturity of the representative eurobond per country and that of the generic 5-year us-treasury note. bond yields are all quoted in us$. All eurobonds are issued in us$, except for morocco (issued in euR). each country’s representative eurobond is chosen as the bond that matures the closest to 2030: tunisia’s eurobonds mature in 2027; Iraq’s bond matures in 2028; Jordan’s, kuwait’s, Lebanon’s, Qatar’s, saudi Arabia’s, the united Arab emirates’, and the united states’ bonds mature in 2030; bahrain’s, morocco’s, oman’s, and Pakistan’s bonds mature in 2031; and egypt’s bond matures in 2032. countries are ordered in ascending 2024 gdP per capita (constant 2021 $PPP). Panels show data as of march 27, 2026.
Panel e: credit default swaps are in basis points, on February 27, 2026, and the latest date available (march 27, 2026). countries are ordered in ascending 2024 gdP per capita (constant 2021 $PPP).
FIGURE 1.10 Foreign direct investment, net inflows
Source: world bank world development Indicators.
Note: doe = developing oil exporters; doI = developing oil importers; FdI = foreign direct investment; gcc = gulf cooperation council.
Panel A: net FdI inflows aggregates by country groupings by year, with averages computed using nominal gdP country weights.
Panel b: 2024 net FdI inflows, broken down to individual countries. All countries in panel b have data for all 6 years presented in panel A and are the only countries included in country group aggregates. omitted countries are those with limited or no available data for the time period. note that the egypt, Arab Rep. figures reflect an unexpected rise from the Ras el hekma proceeds in Fy24.
The conflict—including targeted attacks on digital infrastructure—puts these gains at risk. Even after a ceasefire, a sustained shift in risk perceptions could slow the return of investment flows, and the timeline for recovery will depend heavily on how quickly and credibly regional stability is restored. Given that FDI data from national accounts are updated less frequently, these effects would be reflected in the data with a lag.
Remittances represent one of the most consequential financial flows for the region’s most vulnerable economies—and the one for which real-time data are rather limited. The Gulf has historically been the primary source of remittance flows to neighboring countries and South Asia. Egypt, Jordan, Pakistan, and the Republic of Yemen all rely significantly on the incomes of expatriate workers based in GCC countries (figure 1.11). Although remittance flows by source country are not available for the Republic of Yemen, the Gulf countries host more than 80 percent of Yemeni migrants. In the case of Lebanon, the majority of remittances come from outside the region.
Under normal circumstances, historical correlations suggest rising oil prices would strengthen
remittance flows, as higher revenues in host economies support expat employment and earnings. The current context, however, is not typical. Recent oil price increases are accompanied by production disruptions, damaged infrastructure, and blocked export routes—supply-side constraints that may offset much of the revenue windfall. A slowdown in economic activity across GCC economies could weaken labor markets for migrant workers, reducing employment levels and wages, particularly in construction—a sector that has historically absorbed large numbers of low-income migrants.
The potential reduction in remittances would disproportionately affect households that depend on them. The Arab Barometer data show that, in countries across the region, 2–19 percent of households received remittances in the 2021–24 period, with the highest shares in Lebanon. Remittances play a key role in maintaining consistent levels of consumption, particularly for lower- and middleincome households with limited access to formal safety nets. Even modest declines could carry welfare and poverty impacts, particularly where constrained fiscal space limits countercyclical social spending.
FIGURE 1.11 Remittances in MENAAP
B. Remittances received from GCC, 2021
C. Share of households receiving remittances
Sources: world bank world development Indicators; knomAd; Arab barometer; and Pakistan household Integrated economic survey 2018.
Note: gcc = gulf cooperation council; knomAd = global knowledge Partnership on migration and development; wdI = world development Indicators.
Panel A: Presents the most recent value available for the indicator “Personal remittances received, percent of gdP” from the wdI. countries for which the most recent data are more than a decade old are omitted, as are oil exporters, as none receives remittances greater than 1 percent of gdP. the data are current as to the following dates: Afghanistan (2023); egypt, Arab Rep. (2024); Jordan (2024); Lebanon (2023); Pakistan (2024); the west bank and gaza (2024); and the Republic of yemen (2018).
Panel b: bars indicate the proportion of remittances received from gcc countries in 2021, as available from knomAd oil-exporting economies and countries for which bilateral remittance inflows are unavailable are omitted.
Panel c: calculations by the menAAP poverty and equity team (Atamanov et al. 2026). household shares are from the Arab barometer wave 7 (2021–22; egypt, Arab Rep.) and wave 8 (2023–24; Jordan, Lebanon, and the west bank and gaza), and from the Pakistan household Integrated economic survey 2018.
scarring and the risks of prolonged conflict
Some of the economic impacts of the current conflict are immediate and could fade when hostilities cease. Some may outlast the conflict itself with medium- to long-term consequences. Many disruptions filter through economic channels with a lag. For example, rising fertilizer prices today could reduce crop yields and increase food prices next year, while elevated oil and gas prices will gradually raise production costs through supply linkages. Infrastructure damage may take years to repair and restore to full capacity. For example, damage to Qatar’s Ras Laffan Industrial City on March 18–19 responsible for around 17 percent of Qatar’s LNG exports is expected to take up to 5 years to repair.8 Policy responses compound these effects: Monetary tightening to curb inflationary expectations, fiscal pressures from rising spending and falling revenues, and diversion of resources toward reconstruction could slow broader economic development agendas
and leave governments with limited resources to manage ongoing pressures.
These effects could prolong a hit to investor confidence, delaying the resumption of portfolio flows and FDI. Lingering security concerns may also suppress tourism even after airways reopen, as seen in Jordan, where tourist arrivals took 15 months to return to positive growth following the start of the conflict centered in Gaza. Together, these lagged economic and confidence effects indicate how the consequences of the conflict may outlast the hostilities themselves.
The economic toll of the conflict scales with its duration and intensity. A prolonged conflict would inflict greater damage on human and physical capital, leaving lasting scars on long-term growth, while sustained disruptions to oil and gas markets would generate broader knock-on effects for global inflation and economic activity. Extended instability could also entrench risk perceptions of the region, potentially raising financing costs and prompting a recalibration of trade relationships. That said, adaptability among affected economies could help offset some of the erosion in confidence and mitigate economic impacts.
Macroeconomic outlook
conflict exposure drives diverging economic outlooks across menAAP
The April 2026 World Bank’s Macro Poverty Outlook forecasts that the region’s aggregate (excluding the Islamic Republic of Iran) GDP growth will decelerate to 1.8 percent in 2026, down from 4.0 percent estimated for 2025 (see table 1.1). The 2026 forecast has been downgraded by 2.4 percentage points since the January projections, reflecting the adverse effects of the ongoing conflict.
Growth in the GCC is projected to slow to 1.3 percent in 2026, a significant downgrade of 3.1 percentage points since the January projections for 2026. The downward revision for 2026 is driven primarily by lower projected hydrocarbon revenues due to disruptions caused by the conflict. Qatar’s economy is forecast to contract by 5.7 percent in 2026 following the halt in LNG production, while prospects of medium-term recovery hinge on whether LNG sector projects—such as North Field East—can resume progress toward expanding production capacity. Kuwait is forecast to contract by 6.4 percent, driven by oil sector disruptions. As storage capacity is expected to be exhausted within weeks from the Strait’s closure, oil production faces potential delays or curtailments. Deceleration in Saudi Arabia is less pronounced, reflecting steady expansion of non-oil sectors and the possibility to divert exports away from the Strait of Hormuz.
Prolonged disruption to hydrocarbon exports, declining investor confidence, and reduced services activities, including tourism, aviation, and maritime transit services, remain common risks to the GCC outlook, while the conflict adds to pre-existing fiscal pressures in Bahrain, Kuwait, and Saudi Arabia.
The outlook for the Islamic Republic of Iran is subject to exceptionally high uncertainty, to the point where the World Bank is not publishing forecasts beyond the 2025/26 fiscal year. Real GDP is estimated to contract by 2.7 percent in the 2025/26 fiscal year ending on March 20, 2026, a
1.6 percentage point downgrade from the projection made in January, reflecting the economic toll of the conflict’s escalation in the final month of the fiscal year, as well as widespread protests and internet shutdown in late December to early January.
The GDP of the other three developing oilexporting countries—Algeria, Iraq, and Libya— is forecast to contract by 1.0 percent in 2026. The 2026 forecast has been downgraded sharply for Iraq since January, reflecting contracting oil GDP and non-oil activity due to the combination of a sharp drop in oil exports and limited storage capacity, while the previous-year’s fiscal stimulus wanes. Algeria and Libya’s growth projections have edged up, reflecting potential positive spillovers from surging oil prices. Despite a modest upgrade, Algeria’s GDP growth is forecast to decelerate in 2026 with the implementation of the medium-term fiscal consolidation plan, including slowing wage growth and decreasing investment expenditures. Libya’s outlook is supported by investments to expand oil production capacity to 2 mbpd by 2030, along with robust non-oil sector growth and consumption.
Growth in developing oil importers is expected to decelerate moderately, from an estimated 3.8 percent in 2025 to a forecast of 3.7 percent in 2026, driven by growth projections in Egypt and Pakistan, the group’s two largest economies. In Egypt, the 2026 forecast is driven by robust growth in the first half of the fiscal year, resilient private consumption, and growing private investment, offset by slower moderation of inflation due to the conflict. Sustained agricultural recovery in Morocco and Tunisia is expected to support growth in 2026, while growth is projected to soften in Djibouti, reflecting the impact of the conflict in the Middle East on freight costs and the resulting trade disruptions along the country’s main trade corridors.
However, significant downside risks dominate the outlook of developing oil importers due to the conflict. Rising energy and commodities prices exert pressures on current and fiscal accounts, while rising spending needs pose headwinds for fiscal consolidation in
TABLE 1.1 Real GDP growth forecasts
Economies not included in aggregates
Source: world bank’s macro Poverty outlook, April 2026.
Note: changes are relative to the world bank’s Global Economic Prospects (January 2026) and macro Poverty outlook (october 2025), respectively. countries are listed in descending order based on 2023 gdP per capita (constant 2021 PPP$) within each category. data are rounded up to a single digit. data for Islamic Republic of Iran and Afghanistan are for fiscal years beginning march 21–22 and ending on march 20–21. data for the Arab Republic of egypt and Pakistan are for fiscal years beginning July 1 and ending June 30. Regional and subregional weighted averages are calculated using previous year’s real gdP as weights. Islamic Republic of Iran, Lebanon, the syrian Arab Republic, and the Republic of yemen are not included in regional and subregional averages due to uncertain values. the real gdP values for Iraq and Pakistan are based on constant factor prices. Figures for syria are provisional, may be subject to revision, and may diverge from official projections. e = estimate; f = forecast; n/A = not available; PPP = purchasing power parity.
Morocco and Pakistan. Other risks of the conflict include softer remittances from the Gulf for Jordan and Pakistan, slower tourism in Jordan, potential disruptions in the Red Sea for Djibouti, and slower European market growth for Morocco.
The conflict is expected to severely stress Lebanon’s fragile economic recovery in 2025. Tourism is set to stall amid flight disruptions and displacement, while heightened uncertainty will weigh on consumption and investment. Rising oil prices could widen the current account deficit and fuel inflation, given Lebanon’s dependence on energy imports. These pressures are likely to strain the 2026 budget and increase external financing needs.
MeNaap’s outlook is highly uncertain, with widely diverging forecasts for the region
The economic outlook for the MENAAP region is clouded by uncertainty. Gauging critical determinants of future economic activity—the duration and intensity of the conflict—is exceptionally difficult in the current environment.
One manifestation of this uncertainty is the degree of disagreement across projections made by different forecasters. Within weeks of the conflict’s outbreak, public- and private-sector institutions revised
downward—without exception—their growth forecasts for economies at the epicenter. More striking than the direction of revisions is the widening dispersion across them. Prior to the conflict, the average range between the highest and lowest growth projection for 2026 across forecasters for these countries stood at 2.7 percentage points (figure 1.12). In the weeks following the onset of hostilities, that range has expanded to an average of 12.7 percentage points—exceeding 15 percentage points for Iraq and Qatar. To put these figures in context: In the first year of the COVID-19 pandemic—a period of exceptionally high global uncertainty when forecast dispersion reached its widest on record—the average range for this group of countries reached its maximum at 5.7 percentage points.
The World Bank’s Macro Poverty Outlook (MPO) forecasts for the Gulf economies sit at the upper end of the ranges of private-sector forecasts, with the exception of Iraq, Kuwait, and Qatar. The wide dispersion across forecasts reflects differences in underlying assumptions—most importantly, how long economic activity will remain disrupted, which in turn drives projections for global oil and gas prices and output levels among the major exporters in the Persian Gulf. The baseline assumption of the World Bank’s current forecasts are that disruptions to the Strait of Hormuz will last about three months and will dissipate by the end of 2026. They also assume that—for some countries—energy production infrastructure could face medium-term operational constraints. From this baseline, risks are tilted to the downside.
Downside risks are not only present in the forecasts of Gulf oil exporters. The conflict can affect a wider range of countries in the region through indirect economic channels, even without any direct disruption to oil exports (as is the case in GCC countries and Iraq) or close physical proximity (as in Egypt and Jordan). Heightened uncertainty can slow trade by raising shipping, insurance, and transport costs, forcing firms to reroute cargo and making imported food and manufactured goods more expensive even in countries thousands of miles away. At the same time, higher global oil and gas prices matter, especially for importing economies like Morocco, Pakistan, and Tunisia: They worsen trade balances,
increase inflation, strain foreign exchange reserves, and force governments and firms to absorb much higher fuel and input costs. Financial spillovers can amplify these pressures further, as weaker investor confidence leads markets to demand higher risk premia from all developing economies, pushing up sovereign spreads, borrowing costs, and currency pressures, particularly in countries with existing fiscal or external vulnerabilities. The conflict’s economic effects can spread well beyond the Gulf region through a combination of higher trade costs, more expensive imports, and tighter financial conditions that weigh on growth and stability across more distant trading partners.
existing fragilities and tenuous path to recovery
West Bank and Gaza
The ceasefire in October 2025 created an important window for stabilization. It eased humanitarian access in Gaza, reaching about 1.6 million people through food assistance and 332,000 through digital cash transfers, even though social protection systems remain limited. The forthcoming Rapid Damage and Needs Assessment by the World Bank, United Nations, and European Union estimates total recovery and reconstruction needs in Gaza at approximately US$71.5 billion, highlighting the unprecedented scale of destruction, reversal of decades of development, and recovery needs. The prospects for reconstruction depend largely on logistical access, financing, and durable institutional arrangements.
Despite nascent normalization under the ceasefire, persistent volatility and destruction have left most productive sectors paralyzed, with only minimal activity in subsistence trade and a narrow set of public services. In Gaza, real GDP rose an estimated 30 percent in 2025, driven by a low base effect following the historic 83 percent contraction in 2024 rather than a meaningful economic recovery. By late 2025, Gaza’s real per capita income had plummeted to US$200, and unemployment reached 78 percent.
In the West Bank, workers’ limited access to Israel and suspension of clearance revenue transfers have severely curtailed primary income streams for
households and the Palestinian Authority (PA). Insufficient aid and declining domestic revenues pushed the PA to resort to domestic bank borrowing to manage fiscal deficit. An incremental resumption of worker access and resulting gains in income drove the 3.2 percent growth in the West Bank economy in 2025.
The Palestinian economy is projected to grow by 4.5 percent in 2026, assuming a continued ceasefire in Gaza and stability in the West Bank. These prospects are subject to high uncertainty, compounded by the escalation of the conflict in the Middle East. Rising global energy prices and import costs fuel inflationary pressures and severely strain the PA’s already-constrained fiscal space. In Gaza, logistical disruptions risk reversing recent gains in food availability and basic services observed since the ceasefire. Reduced tourism activity in Israel could affect small-scale seasonal employment in the West Bank. While direct linkages remain limited, combined pressures could add to existing risks and delay economic stabilization across the West Bank and Gaza.
The Syrian Arab Republic
Syria showed signs of steady but fragile economic recovery in 2025, 1 year after the fall of the Assad regime. Real GDP growth in 2025 is estimated to range between 2–4 percent, reflecting easing sanctions, resumption of trade, higher public-sector wages, and refugee returns. By March 19, 2026, UNHCR estimates 1.5 million Syrians had returned from neighboring countries since December 2024, while 1.7 million internally displaced people had returned home by February 5, 2026. Syria also advanced a broad reform agenda aimed at modernizing institutions, supporting economic stabilization, and reconstruction. Reflecting these gains, the Syrian pound strengthened since December 2024, as inflation is estimated to have eased to 11.5 percent in 2025. However, the World Food Programme’s Minimum Expenditure Basket remained far above the minimum wage, leaving nearly 90 percent of households facing difficulty in meeting basic needs. External funding fell short of needs, with Syria’s 2025 humanitarian plan being only 35 percent funded.
Subject to high uncertainty, economic activity in Syria is projected to continue its momentum
and strengthen modestly. However, the outlook is fraught with risks due to evolving security dynamics, institutional arrangements, and disruptions to natural gas supplies and electricity generation since the onset of the most recent conflict. In a highly uncertain regional context, investment pledges may be reprioritized, affecting prospects for external financing and reconstruction support. Return movements are expected to raise short-term pressures on public services and humanitarian assistance, though they may support medium-term growth.
Afghanistan
Afghanistan’s economy was marked by a series of significant external shocks in 2025—sharp reductions in foreign aid, prolonged border closures with Pakistan, drought, earthquakes, and large-scale refugee returns from the Islamic Republic of Iran and Pakistan. These shocks have led to an estimated 11 percent population increase in FY2025, largely driven by net migration.9
Afghanistan’s economy remained fragile in 2025, still recovering modestly from the sharp contractions of 2021–22. Aggregate GDP grew by an estimated 4.8 percent in 2025, driven mainly by private consumption and a rebound in nonagricultural activity—both partly attributable to the influx of returnees boosting domestic demand. However, per capita GDP contracted by 5.6 percent, as population growth outpaced economic expansion and inflation rose, reflecting demand recovery and higher trade and transport costs linked to border closures.
Afghanistan’s economy is projected to grow by 4.0 percent in 2026, supported by strengthening demand, higher private investment, and improved absorption of returnees into the labor market. However, the ongoing conflict in the Middle East poses a major risk, through disruptions to trade and accelerated migration flows. With around 60 percent of total trade routed through the Islamic Republic of Iran, closure of the corridor could reduce annual GDP growth and raise inflation, although trade rerouting could partially offset the impact. A large and sudden inflow of returnees
9Afghanistan’s 2025 fiscal year runs from March 21, 2025, to March 20, 2026.
could further intensify downward pressure on per capita incomes in the short term, as the domestic economy struggles to productively absorb additional workers.
The Republic of Yemen
The Republic of Yemen’s economy remains in deep crisis after a decade of conflict and fragmentation, with real GDP per capita down by nearly 60 percent since 2015 and the economy contracting for a third consecutive year in 2025. The continued blockade of oil exports, weak business environment, and tight liquidity constrain economic activity. Food insecurity reached a record high in 2025, with nearly two-thirds of households facing inadequate food consumption as of December, despite some improvement from a peak of 70 percent in July.
Exchange rate stability in Aden and reform commitments by the Internationally Recognized Government in early 2026 offer a window of opportunity for economic recovery, but the ongoing conflict in the Middle East poses acute downside risks. The economic outlook remains subdued, with a projected 0.5 percent contraction in real GDP in 2026 amid the ongoing blockage of oil exports, institutional fragmentation, and spillovers from the conflict in the Middle East. With high import dependence, the Republic of Yemen is highly vulnerable to rising energy and food prices. Prolonged conflict could further disrupt remittances and aid flows.
Conflict sets back the long-run development trajectory
The human and economic costs of conflict are immediate, visible, and often severe. But the larger cost may lie in the lasting damage conflict inflicts on development. Across the region, conflict has repeatedly left deep and lasting scars on living standards, productivity, and growth. Counterfactual estimates suggest that, in the absence of major conflict episodes, income per capita in affected countries could have been about 45 percent higher on average after 7 years—roughly equivalent to 35 years’ worth of progress in the region.
Evidence from major conflicts in Algeria, the West Bank and Gaza, Iraq, the Republic of Yemen, and Syria shows a strikingly consistent pattern of economic deterioration.10 In the year immediately following the onset of conflict, income per capita declined by an average of 12 percent relative to preconflict levels. Critically, these losses are not transitory: Seven years after the start of the conflict, income per capita remains 24 percent below its preconflict level (figure 1.13). The country-level estimates reveal the scale of individual economies’ losses. In Syria, per capita income would have been nearly twice its actual level 7 years after the onset of the civil war in 2011 had the conflict never occurred. The picture is even more striking in the Republic of Yemen: By the end of the analysis period, per capita income could have reached three times its actual level, had the Yemeni crisis not started in 2011. In short, these are not temporary setbacks but persistent losses that weaken institutions, deter investment, disrupt human capital accumulation, and narrow the space for long-term development (Gatti et al. 2024).
The current conflict has reinforced these pressures. Its immediate effects are visible in disrupted trade and investment, heightened uncertainty and financial volatility, food insecurity, pressure on fiscal and external balances, and severe strains on energy markets. Yet these shocks have struck a region already grappling with deep structural weaknesses: low productivity growth, weak private-sector dynamism, persistent labor market challenges, and, in many countries, heavy dependence on hydrocarbons. The present turmoil is not only a short-term crisis to be managed. It is also a reminder of the region’s unfinished long-term development agenda.
10The conflict episodes are the Algerian civil conflict in January 1992; the West Bank and Gaza Second Intifada in September 2001; the Iraq war in March 2003; the beginning of the Yemeni Uprising in January 2011; and the Syrian civil war in March 2011. These conflict episodes are identified based on the severity of the conflict in those years. For each country–year pair, the conflict generated battle-related deaths, as share of population, above the 75th percentile of the world population (33 deaths per million inhabitants). Algeria is the only exception, as it was treated at the 50th percentile of the world distribution in 1992 (used as the beginning of the conflict) and reached the 75th percentile of the world distribution in 1994. In the Republic of Yemen, the uprising started in January 2011, which set the stage for the escalation into civil war in 2014.
FIGURE
countries in conflict
Conflict-affected MENA Counterfactual MENA
(0 = conflict)
Sources: International monetary Fund, Investment and capital stock dataset (Penn world table 10.01); uppsala conflict data Program georeferenced event dataset (ucdP); and world bank calculations and world development Indicators.
Note: PPP = purchasing power parity. Income per capita is relative to the frontier, united states (us = 1).to determine what the standard of living in a country in conflict would be were there no conflict, economists construct a group of countries that were so similar to the conflict country before the crisis that, taken together, their standards of living could reasonably proxy what would have happened in the conflict country. menA is the average of the impact of conflict on selected countries (Algeria, Iraq, the syrian Arab Republic, the west bank and gaza, and the Republic of yemen), while counterfactual menA is the average of each country’s counterfactual in the absence of conflict. Aggregate gdP for each country is obtained by applying growth rates from national accounts to the level of gdP in PPP in 2017. more precisely, the growth rate of real gdP at constant 2017 national prices is applied to the expenditure-side real gdP level at chained PPPs in 2017. Income per capita is then obtained by dividing aggregate gdP by population. the conflict variable is a dummy variable taking values equal to 1 when a country exceeds the 75th percentile of fatalities per million people (33), in the world distribution (best in ucdP). In the figure, 0 represents the start of the conflict. weights assigned to countries in the control group are used to create the counterfactuals.
This broader agenda motivates the next chapter. While the first part of this report examines how conflict is reshaping economic conditions in the short run, the second turns to what can shape growth trajectories in the long run. In particular, the second chapter considers the role of industrial policy in fostering structural transformation, supporting diversification, and building more productive private sectors. The shift in focus is intentional. While conflict forces policymakers to respond to immediate macroeconomic and social pressures, lasting prosperity depends on whether countries can build the institutions, capabilities, and competitive sectors needed for sustained growth. Moving from conflict to growth, therefore, is not a departure from the central theme of the MENAAP Economic Updates but a continuation of it: In a region marked by recurrent shocks, the central challenge is not only to withstand crises but also to create the foundations for stronger, more resilient, and more inclusive development.
1.13 Counterfactual estimates of income per capita for MENA
Income per capita relative to the frontier Year
ANNEX 1A Macro Poverty Outlook
TABLE 1A.1 Real GDP per capita growth, inflation, current account balance, and fiscal account balance estimates and forecasts, 2025–26
Economies not included in aggregates
Source: world bank’s macro Poverty outlook, April 2026.
Note: countries are listed in descending order based on 2023 gdP per capita (constant 2021 PPP$) within each category. data are rounded up to a single digit. data for Islamic Republic of Iran and Afghanistan are for fiscal years beginning march 21–22 and ending on march 20–21. data for the Arab Republic of egypt and Pakistan are for fiscal years beginning July 1 and ending June 30. Regional and subregional real gdP per capita growth rates are calculated as the growth rate of the sum of real gdP divided by the sum of population of the group. current account balance and fiscal balance regional and subregional averages are calculated using current year nominal gdP levels as weights. Islamic Republic of Iran, Lebanon, the syrian Arab Republic, and the Republic of yemen are excluded from regional and subregional averages due to uncertain values. Real gdP per capita growth for Iraq and Pakistan are based on real gdP at constant factor prices. current account balance and fiscal account balance values for Iraq are expressed as share of gdP at factor prices. Figures for syria are provisional, may be subject to revision, and may diverge from official projections. e = estimate; f = forecast; n/A = not available; PPP = purchasing power parity.
Industrial Policy in the MENAAP Region
KEY MESSAGES
• Over the past decade, the number of active industrial policies—government action expected to increase strategic business activity—has increased more than threefold in high-income and middle-income MENAAP (Middle East, North Africa, Afghanistan, and Pakistan) economies.
• Industrial policy often operates through indirect and less visible channels in the region, not only through ministries and formal policy announcements but also through state-owned enterprises, sovereign wealth funds, and other quasi-public institutions.
• Differences in fiscal space, government bandwidth, market size, and exposure to conflict mean that Gulf Cooperation Council (GCC) economies, developing oil exporters, oil importers, and fragile states face very different industrial policy options and constraints.
• GCC countries, given their larger resources, make more use of subsidies and localization measures, while developing oil exporters and oil importers depend more on import-related measures, reflecting more limited fiscal and institutional capacity.
• Industrial policy in MENAAP follows a “stepping stone” approach. Across the region, policymakers aim to move toward higher complexity industries that are close to existing capabilities while creating future growth opportunities.
KEY MESSAGES
(continued)
• Four case studies across the region in Dubai, the Arab Republic of Egypt, Morocco, and Pakistan highlight the heterogeneity in industrial policy experiences. From these experiences, two main elements emerge: an effective institutional setup for public-private dialogue and a public workforce with the expertise to engage in that dialogue.
• Industrial policy can help, but it cannot substitute for broader reform. Industrial policy is most likely to succeed when it addresses genuine market failures and is backed by capable institutions, clear objectives, discipline, and extensive data collection and rigorous evaluation. Where weak governance, macroeconomic instability, or political capture are the deeper constraints, industrial policy is unlikely to deliver lasting results.
Introduction
Industrial policy has returned to the center of economic policy debates worldwide, but its role in the MENAAP region is shaped by a set of characteristics that make the region unique. In addition to increased fragility, MENAAP economies face a particularly difficult combination of challenges: weak private-sector productivity, chronically underperforming labor markets, limited job creation for rapidly growing populations, and, in many countries, a heavy dependence on hydrocarbons or other narrow sources of growth. At the same time, the region is highly heterogeneous. High-income Gulf economies, middle-income oil importers, developing oil exporters, and conflict-affected states differ sharply in their fiscal space, institutional capacity, market size, and exposure to external shocks. These differences matter because they shape not only why governments turn to industrial policy but also which tools they can realistically deploy and through which institutions those policies are carried out.
There are many definitions of industrial policy. The working definition employed throughout this chapter is the one offered by Fernandes and Reed (2026): Industrial policy is a government action expected to increase strategic business activities. Based on this definition, this chapter shows that industrial policy in MENAAP is both more widespread and more distinctive than standard measures often suggest. In line with global trends, official announcements—an accepted measure of industrial policy—have risen sharply over the past decade, faster than among comparable countries elsewhere. Furthermore, industrial
policy in MENAAP often operates through less evident channels, including state-owned enterprises (SOEs) and sovereign wealth funds (SWFs), meaning that counts based on official announcements may understate its true prevalence.
The mix of industrial policy tools also differs across country groups. GCC economies make more use of subsidies and local sourcing requirements, while developing oil exporters and oil importers rely more on import-related policies. Across the region, governments tend to target sectors already viewed as strategic in national development plans (NDPs)—the strategic blueprints that outline a country’s economic and social goals—such as tourism and chemicals. However, actual policy support is often clustered around a narrower set of activities, following a gradual “small steps” logic that favors sectors closer to existing capabilities while seeking entry into more complex products with higher long-term opportunity gain.
The chapter argues, however, that the effectiveness of industrial policy in MENAAP depends less on ambition than on fit. Countries with greater government bandwidth, more fiscal space, and larger effective markets can deploy a broader set of instruments, including more targeted ones with fewer unintended consequences. Where those conditions are absent, governments are more likely to rely on second-choice tools such as tariffs or broad market incentives. This prioritization is also recommended by Fernandes and Reed (2026). However, industrial policy is not a substitute for sound macroeconomic management, stronger governance, or broader privatesector reform. Moreover, in environments marked
by weak institutions or close ties between political and business interests, industrial policy can be captured, poorly targeted, or used in ways that reinforce existing distortions.
The main conclusion is, therefore, an optimistically cautious one. Industrial policy can help MENAAP countries diversify, build capabilities, and support structural transformation, and the region offers important examples of partial success—from Morocco’s automotive industry to Dubai’s digital ecosystem. But industrial policy works best when it is selective and disciplined, embedded in credible public-private coordination, matched to country capabilities, and subject to clear objectives. Rigorous data collection and monitoring and evaluation must be part of the industrial policy design from the initial stage. Finally, policies should be governed by a sunset mechanism, with a clearly defined end date that is strictly adhered to unless a transparent review justifies extension. In conclusion, the question is not whether industrial policy should be used in MENAAP. It increasingly is. The relevant question is whether it is being used in ways that are feasible, accountable, and aligned with the region’s deeper economic constraints and long-term development objectives.
The road map for the chapter is as follows. It begins by defining industrial policy and showing why, in the MENAAP context, the concept extends beyond formal policy announcements to include the role of SOEs, SWFs, and other quasi-public institutions. It then examines why governments in the region turn to industrial policy, focusing on key challenges: weak productivity, limited job creation, and slow diversification. Next, the chapter documents the increase in industrial policy use across MENAAP and shows how the mix of instruments differs across GCC economies, developing oil exporters, oil importers, and fragile states according to differences in fiscal space, government bandwidth, and market size. It then explores which sectors are being targeted and argues that industrial policy often follows a stepping-stone logic in the region, favoring activities close to existing capabilities while also seeking future gains in complexity. Finally, it assesses the institutional vehicles through which industrial policy is implemented and argues that, while industrial policy can support diversification
and structural transformation, its success depends on strong institutions, clear objectives, and disciplined implementation and is based on complementary reforms in governance, competition, and macroeconomic management.
Industrial policy: An elusive concept
Industrial policy “means different things to different people.”1 The late economist Paul Geroski opined in 1989 that a “random collection of six economists is sure to produce at least a dozen different opinions on the subject” of industrial policy. The definition used in this chapter—industrial policy is a government action expected to increase strategic business activities—is broader than generally used in academic literature. It focuses on the expected impact of the implemented policies in terms of increasing certain types of economic activity in a certain sector rather than any other objectives stated when policies were announced.
This definition has three elements: The first is “government,” which includes the institutions that design and implement industrial policy. Government comprises official entities, ministries, and agencies but also less common ones like national development banks (NDBs), SOEs, and SWFs when it comes to implementation of industrial policy. The second element is “actions”—the policies themselves, the tools that are deployed. The third element is “strategic business activities,” which present the notion that an industrial policy is expected to affect some activities and not others.
element 1: government
Government institutions charged with undertaking industrial policy should have the best managerial talent with the right academic and professional
1This is a sentiment voiced by the OECD’s competition committee in their Series Roundtable on Competition Policy No. 96, “Competition Policy, Industrial Policy and National Champions” and echoed in Evenett (2003) in “Study on Issues Related to a Possible Multilateral Framework on Competition Policy”; Vyshnevsky and Dementiev (2011) in “Industrial Policy for Ukraine: Theoretical Aspects”; and Pack and Saggi (2006) in “Is There a Case for Industrial Policy? A Critical Survey.”
credentials. These technocrats should be shielded from politics—which can be difficult to achieve in the MENAAP region because political power and business interests are closely intertwined. In addition to formal government institutions, such as ministries, a number of other entities can play roles in industrial policy: (1) NDBs, (2) SOEs, (3) SWFs, (4) cluster initiatives, (5) public-private dialogue and coordination agencies, (6) innovation and research and development (R&D) agencies, (7) investment promotion agencies, and (8) export promotion agencies. This chapter examines the roles played in carrying out industrial policy by SOEs, because they are so ubiquitous in the region, and SWFs, because of their importance in GCC economies.
element 2: Policy tools
Industrial policy tools cover three broad categories: (1) tailored public inputs, (2) market incentives, and (3) macroeconomic interventions.
Tailored public inputs
In general, public inputs, such as skills development programs or industrial parks, can affect all industries. But when they are designed for a specific industry, they become an industrial policy tool. They are often referred to as “soft” industrial policy and encompass skills development programs, industrial parks, quality standards, and market access assistance. MENAAP countries regularly use tailored public inputs as part of their industrial policies.
Skills development
In Morocco, with a wide range of industrial policies targeting the auto industry, professional training centers were created to offer apprenticeships and firm-specific training for the automotive workforce. These programs are closely aligned with industry needs; the centers operate under a public-private partnership model in which training programs are developed in collaboration with the companies.
In the Arab Republic of Egypt, personnel training is one of the core activities of tourism-sector development. State-led workforce training, publicprivate joint initiatives, and multisectoral partnerships enhance service quality and strengthen human
capital in Egypt’s accommodation and hospitality sector. For instance, in 2024, nearly 43,000 tourism workers were trained across various fields, including hospitality, food safety, and sustainable tourism. Moreover, public-private training collaborations are helping expand workforce capacity. For example, joint initiatives among the Ministry of Tourism and Antiquities (MoTA), industry associations, and private companies trained hundreds of hospitality professionals in such important destinations as Cairo, Sharm el-Sheikh, and Hurghada on the Red Sea.
Industrial parks
Dubai Internet City was created as a specialized “ecosystem” to host the information and communications technology (ICT) sector. It provided such tailored inputs as solid telecommunication connections with much lower faults rates and offered technology companies access to digital networks at a price other advanced economies could (or would) not match. In so doing, the government created an environment specifically optimized for the operational and connectivity needs of global technology firms as part of Dubai’s desire to become a digital hub.
Industrial clusters were at the heart of Morocco’s effort to grow an auto industry. Six industrial parks host auto suppliers in the country. Around Tangier, the Tanger-Med Industrial Platform connects local free zones with the Tanger-Med port. These free zones combine features of industrial parks—such as the infrastructure needed for production and distribution—and the features of special economic zones, which include tax and customs benefits, efficient customs procedures, and access to capital flows. The areas near special economic zones have seen an increase in economic activity, as proxied by nighttime light intensity (box 2.1).
Quality standards
In 1999, Tunisia enacted national organic regulations, delineating requirements in production, processing, handling, and marketing of organic food. In setting standards, Tunisia referenced international standards, such as the European Union’s organic regulation, which facilitated the European Union’s
BOX 2.1 Special economic zones drive growth in surrounding areas: Evidence from nighttime lights’ intensity
Evidence suggests that special economic zones (SEZs) are linked to higher economic activity in nearby areas, as measured by growth in nighttime lights (figure B2.1.1). The analysis covers 132 SEZs in MENAAP countries and 1,821 SEZs in 22 other countries from a sample created by the European Bank for Reconstruction and Development (EBRD) for which the year of establishment—or, if unavailable, the year of announcement—is known. It combines SEZ location data with a harmonized global data set on nighttime lights covering 1992–2021 (Li et al. 2020).
To see how effects vary with distance, the analysis looks at a set of rings around each SEZ. It starts with
the area within 2 kilometers of the zone, then moves outward in bands of 2–4 km, 4–6 km, 6–8 km, and so on, using the outer 70–100 km band as a benchmark. It then compares the change in nighttime light intensity in each band between the year before the SEZ was established or announced and three years later.
Figure B2.1.1 shows that the economic effects of SEZs are strongest close to the zone and fade with distance. In MENAAP countries, these effects appear stronger than in the European countries in the comparison group. As in the rest of the EBRD sample, the largest growth spillovers in MENAAP are found within about 40 km of the SEZ.
FIGURE B2.1.1 Association between the establishment of SEZs and the growth in nighttime lights
SEZ (km)
Sources: ebRd (2024) data set on seZs, Li et al. (2020), and world bank calculations.
Note: to estimate the spatial spillover effects of seZs, we use a harmonized global ntL data set (1992–2021) as a proxy for localized economic growth, restricting our analytic sample to seZs established between 1993 and 2018. For each seZ, we construct concentric, donut-shaped distance bands at 0–2, 2–4, 4–6, 6–8, 8–10, 10–15, 15–20, 20–30, 30–40, 40–50, 50–70, and 70–100 km, calculating the log difference in mean ntL density for each ring between the year prior to establishment (t–1) and three years’ postestablishment (t+3). we estimate a two-way fixed effects regression—controlling for seZ-level and establishment year fixed effects to isolate macroeconomic and temporal shocks—using the outermost 70–100 km ring as the baseline counterfactual to capture standard background growth. using conditional marginal effects, the resulting plot displays the relative distance band estimates alongside their 95 percent confidence intervals separately for the menAAP region and the rest of the world. the ebRd sample consists of select countries in the menAAP region and ecA region. ecA = europe and central Asia; km = kilometers; ntL = nighttime lights; seZs = special economic zones.
endorsement of Tunisia’s regulations. In addition to setting standards, Tunisia gave a 30 percent subsidy of the cost of equipment used in organic agriculture and subsidized 70 percent of certification fees— which helped farmers absorb the costs of transitioning from traditional to organic production (ISOFAR 2016). In 20 years, by 2019, Tunisia had become the world’s largest exporter of organic olive
oil—accounting for 65 percent of global exports (CBI 2024). Tunisian organic dates have also had a significant growth in exports.
Market access assistance
In Egypt’s tourism sector, MoTA has also expanded market access through sector-specific promotional
campaigns and strategic partnerships to promote its diverse tourism offerings. It also enacted such regulatory reforms as streamlined visa procedures to lower entry barriers for foreign visitors and reduce transaction costs associated with travel to Egypt. These measures constitute indirect market access assistance by lowering regulatory and informational barriers for foreign consumers to enhance international demand for Egypt’s tourism services.
Market incentives
Market incentives are policies that encourage activities in one specific industry over another by changing the relative price of inputs or outputs. These include subsidies—on production, R&D, exports, or consumption of a product or service. Commodity export bans, tariffs and quotas on imports, and local content requirements are also considered market incentives. Technology transfer quid pro quos— which require foreign investors to form joint ventures with local businesses and share knowledge—are also in this category. The region abounds with examples of industrial policy market incentives.
Public procurement
The government of Dubai boosted demand for digital services through its 2000 e-Government initiative, which aimed to digitalize the government. This policy generated guaranteed contracts for private tech firms, effectively guaranteeing a market for their services.
Production subsidies
Egypt took several steps to support local fertilizer production. The price of natural gas, the principal input in fertilizer, is controlled and heavily subsidized. Fertilizer makers must sell a portion of their production to the Egyptian government, which sells it to Egyptian farmers at below-market rates (Kurdi et al. 2020). Any additional production can be sold on the international market. As a result, foreign sales of the heavily subsidized output have made Egypt the world’s eighth-largest exporter of fertilizer (OEC 2024).
In the early 1960s, Pakistan subsidized production for the soccer ball manufacturing cluster in the
city of Sialkot. The government implemented an export rebate scheme that enabled manufacturers to reclaim customs duties, sales tax, and excise paid on imported inputs used to make exported products, which improved cash flow and international competitiveness.
Production subsidies include subsidies for capital investments. Morocco supported funding for the automotive firms that invested in projects such as buildings and capital equipment. Similarly, in 2024, the Central Bank of Egypt, funded by the Ministry of Finance, launched a credit facility offering EGP 50 billion in loans at a preferential interest rate to companies that built new hotel capacity. The program supports hotel construction, renovation, and the reopening of nonoperational properties. By reducing financing costs in a high-interest environment, the scheme operates as a targeted financial subsidy to accelerate accommodation expansion and strengthen sector capacity.
Macroeconomic interventions
Macroeconomic interventions do not target specific industries but change the relative prices of certain activities. This industrial policy includes strategic exchange rate devaluations and R&D tax credits, which are used more prominently in advanced economies.
element 3: being strategic
The desire to affect some activities and not others is at the heart of industrial policies. They can, and often are, aimed at more than manufacturing. Governments may identify agriculture, mining, or services sectors as “strategic” to achieving some objective. For example, a government with chronic foreign exchange shortages might make tourism strategically important because of its potential to bring in foreign currency.
Industrial policies have a differential effect on some sectors and not others. General education policies— such as those affecting primary or secondary school policy—are not typically considered industrial, but specialized vocational training programs—say for welding in shipbuilding—could be an industrial policy favoring sectors that employ welders.
Why undertake industrial policy in MENAAP?
Industrial policy is often understood differently by economists and policymakers, but these perspectives are more complementary than contradictory. Economists typically justify industrial policy as a response to market failures, where private markets underprovide activities with high social returns. Policymakers, by contrast, tend to frame industrial policy in terms of the concrete challenges confronting their economies: weak job creation, low productivity, limited diversification, skills mismatches, or environmental vulnerability.
A useful way to think about this distinction is through the image of an iceberg (figure 2.1). Above the waterline are the problems policymakers observe directly: high unemployment, insufficient private-sector dynamism, overreliance on hydrocarbons, or gaps between workforce skills and firms’ needs. Below the surface lie the underlying causes.
Some are consequences of market failures—such as coordination failures, lack of knowledge spillovers, or underinvestment in worker training—while others reflect deeper institutional weaknesses, regulatory distortions, or governance failures. This distinction between the perspectives of economists and policymakers is critical, because industrial policy is most effective in addressing visible symptoms when the underlying causes relate to market failures. In cases where weak governance, macroeconomic instability, or political capture are the deeper constraints, industrial policy is unlikely to deliver lasting results.
Consider skills mismatches. Policymakers may observe firms struggling to find workers with the capabilities they need. From an economist’s perspective, one explanation is that firms underinvest in training because they cannot fully appropriate its benefits: Trained workers may leave for competitors, even though the whole economy benefits from a more skilled labor force. This is a textbook externality and, therefore, a legitimate rationale for intervention (Brunello and De Paola 2004). At the same time, skills gaps may also reflect weak education systems or poor-quality regulation (such as teacher certification). Industrial policy can help in the first case, but it is less likely to succeed if the underlying problem lies elsewhere, such as weak education or poor regulation systems.
Industrial policy as a response to market failures
The standard economic justification for industrial policy is the correction of market failures (Rodrik 2008). One prominent example is coordination failure. Firms may benefit from physically locating near one another or investing simultaneously in related activities, yet no individual firm may be willing to move first unless others do the same. Governments can help overcome this problem through place-based interventions such as industrial parks, export zones, or enabling infrastructure. The same logic applies to emerging technologies. Consumers may be reluctant to adopt electric vehicles in the absence of charging networks, while firms may hesitate to build charging infrastructure until demand for electric vehicles has materialized.
FIGURE 2.1 Iceberg model of industrial policies
In such cases, public action can help shift the economy toward a higher-level equilibrium.
Another justification lies in learning-by-doing and support for infant industries. New sectors often require experimentation, capability building, and the gradual accumulation of know-how before they can become competitive. Firms may be reluctant to enter such activities because the costs are immediate, while some of the benefits—especially knowledge spillovers—accrue to other firms. When private incentives to invest in new activities fall short of their broader social returns, temporary public support may be warranted.
Industrial policy may also be justified where it helps generate agglomeration economies and productivity spillovers. Clustering firms in related activities can create a deeper labor pool, specialized suppliers, and opportunities for knowledge diffusion that reduce costs and raise productivity across the sector. Dubai Internet City illustrates this dynamic. Concentration of a large number of technology firms and workers in one location helped create specialized labor markets, foster supplier ecosystems, and support the faster circulation of ideas and capabilities.
Industrial policy as a response to structural transformation
In practice, however, governments rarely design industrial policy around explicit diagnoses of market failure. They are more likely to use it as a tool to address pressing structural challenges. In the MENAAP region, these challenges include insufficient
job creation, weak productivity, slow diversification, and rising environmental stress. NDPs provide a useful window into how governments themselves frame these priorities.
A review of 19 NDPs—including Saudi Arabia’s Vision 2030, Egypt’s National Agenda for Sustainable Development, and Iraq’s National Development Plan—reveals a high degree of convergence across countries with otherwise diverse income levels and economic structures. Figure 2.2 is a word cloud derived from these 19 documents, mapping the region’s policy landscape into widely identified challenges and objectives, where each term represents a recurring topic. Despite their differences, governments across the region consistently identify a similar set of concerns: inadequate job creation, sluggish economic growth, weak private-sector development, and insufficient diversification.
Industrial
policy for jobs
Employment generation stands out as the most immediate and widely shared priority. Unemployment is identified as a key challenge in 15 of the 19 plans, while job creation appears as an objective in all 19. In some cases, the scale of labor market distress is severe. Djibouti reports an overall unemployment rate of 47 percent and 70 percent among those under age 30. Even in higher-income economies, labor market pressures persist in the form of youth joblessness. In Kuwait, for instance, overall unemployment is relatively low, yet one in four Kuwaitis ages 15–24 who want work cannot find a job.
A. Challenges
B. Objectives
Note: google gemini AI (notebookLm) was used first to build a list of keywords for challenges and for objectives, then to count how many documents each word appeared in. A human and a Perplexity cross-check was conducted to produce the final statistics.
FIGURE 2.2 Challenges and objectives identified in national development plans
Sources: national development plans from Afghanistan; Algeria; bahrain; djibouti; egypt, Arab Rep.; Iraq; Jordan; kuwait; Libya; morocco; oman; Pakistan; Qatar; saudi Arabia; syrian Arab Republic; tunisia; united Arab emirates; the west bank and gaza; and yemen, Rep.
A closely related concern is the mismatch between labor supply and labor demand. Human capital development is a stated goal in 18 of the 19 NDPs. Pakistan emphasizes shortages of skilled labor, while Saudi Arabia notes the gap between education outcomes and market needs. These challenges are often intensified by persistent emigration of skilled workers from some countries, which weakens domestic capabilities and complicates the transition toward higher-value, knowledge-intensive activities.
Weak growth and low productivity are also pervasive concerns. Seventeen of the 19 plans identify slow or stagnant growth as a major challenge. Although many of these plans were prepared in the early 2020s, during or just after the COVID-19 shock, the diagnosis is more fundamental: The region has long faced weak productivity growth and insufficient private-sector dynamism. It is, therefore, not surprising that all 19 plans place strong emphasis on empowering the private sector (Gatti et al. 2025a).
Firm-level evidence reinforces this picture. World Bank Enterprise Surveys suggest that sales-per-worker growth and employment growth in MENAAP coun-
tries have generally lagged those of income peers (Gatti et al. 2025b). At the same time, productivity dispersion (as measured by the interquartile range of sales per worker) within sectors appears relatively high, pointing to possible misallocation, weak competition, or other distortions (figure 2.3). When similar firms within the same industry perform very differently, governments may view industrial policy as a means of raising efficiency, easing bottlenecks, and supporting structural upgrading.
Industrial policy for diversification and resilience
For many countries in the region, industrial policy is also a response to the limits of hydrocarbon-led growth. Reliance on oil and gas revenues exposes economies to commodity price volatility while generating too few jobs, given the capital-intensive nature of the sector. Iraq illustrates the scale of this vulnerability: In recent years, oil revenues have accounted for more than 90 percent of federal revenues, leaving public finances highly exposed to swings in global prices.
Against this backdrop, economic diversification has become a central policy objective across the region,
Source: world bank calculations on data from the world bank enterprise surveys.
Note: Panels show the interquartile range (75 percentile minus 25 percentile) of firm-level log labor productivity, measured as firms’ average sales growth per full-time worker between the last fiscal year and two years prior based on recall variables. AFg = Afghanistan; bhR = bahrain; dJI = djibouti; egy = egypt, Arab Rep.; IRQ = Iraq; JoR = Jordan; kwt = kuwait; Lbn = Lebanon; mAR = morocco; PAk = Pakistan; sAu = saudi Arabia; tun = tunisia; Fy = fiscal year; IQR = interquartile range; PPP = purchasing power parity. data represent the latest survey year for each country after 2009. For bahrain, Jordan, and tunisia, it was imputed for 2024 year using values from 2023; for djibouti, gdP per capita data were imputed for the 2013 year using values from 2012. the following surveys are included for menAAP (survey year in parentheses): AFg (2014), bhR (2024), dJI (2013), egy (2020), IRQ (2022), JoR (2024), kwt (2025), Lbn (2019), mAR (2023), PAk (2022), sAu (2022), and tun (2024).
FIGURE 2.3 Dispersion of sales per worker in specific industries
for there has been measurable progress. Hydrocarbon income as a share of GDP have fallen substantially across the Gulf since 1980, including large declines in Bahrain and Qatar. Yet the underlying challenge remains unresolved. The region still faces the task of building more diversified, employment-intensive, and productivity-enhancing growth models.
As is the case globally, MENAAP countries are confronting mounting environmental and climaterelated pressures. More than two-thirds of the NDPs identify environmental vulnerability and water scarcity as major challenges, while all 19 recognize food security as a strategic objective. Countries such as Iraq and Jordan face chronic water stress, while Pakistan remains highly exposed to both flooding and increasing water stress. In 2022, floods reduced Pakistan’s GDP by an estimated 2.2 percent.2 Djibouti, by contrast, has experienced repeated droughts that have weakened domestic agriculture and increased dependence on food imports. These pressures help explain why environmental sustainability and green growth now feature prominently in national development strategies across the region.
That said, the region is not homogeneous. Highincome GCC countries face a different set of constraints than lower-income or conflict-affected economies. Food insecurity, informality, and postconflict recovery are more central in some developing economies than in the Gulf. This heterogeneity underscores the importance of tailoring industrial policy to country-specific conditions rather than applying a uniform template across the region.
Industrial policy is not a substitute for broader reform
A visible economic challenge does not, by itself, mean that industrial policy is the right response. Some problems reflect market failures, but others stem from weak institutions, poor regulation, low-quality education systems, or deeper political economy constraints. Liaqat and Nugent (2015), for example, argue that low private investment in training in the Middle East and North Africa
reflects not only firm-level incentives but also shortcomings in labor regulation and basic education.
This distinction matters because industrial policy is most effective when it is directed at the right problem. When it is used to address challenges rooted instead in weak institutions, poor regulation, or broader governance failures, it may be ineffective or even counterproductive. This risk is especially acute in the MENAAP region, where political and business interests are often closely intertwined. In such settings, targeted support can be captured by politically connected firms or sectors, turning industrial policy into a vehicle for rent-seeking rather than structural transformation and reinforcing, instead of correcting, existing distortions. Before 2011, Tunisia offers an example: Politically connected firms at that time accounted for a disproportionate share of employment, output, and profits, especially in sectors subject to restrictions on foreign direct investment (Rijkers, Freund, and Nucifora 2014). Although causality is difficult to establish conclusively, the evidence suggests that these politically connected firms were able to use regulation for private gain. Because industrial policy, by definition, grants preferential support to selected sectors, industries, or groups of firms for strategic reasons, the absence of transparency, discipline, and accountability creates significant scope for such support to be steered toward private interests rather than broader development objectives.
2Estimates of the direct impact of the floods from Pakistan Floods 2022
Post-Disaster Needs Assessment (World Bank 2022a).
That is why the institutional setting matters so much. Rodrik (2008) argues that institutions supporting industrial policy should possess three core qualities: embeddedness, discipline, and accountability. Embeddedness means structured and credible engagement between government and business, allowing policymakers to understand private-sector constraints without becoming captured by them. Discipline requires both “carrots and sticks”: incentives to encourage investment in new activities but also credible mechanisms to withdraw support from firms or projects that fail to perform. Accountability requires agencies to be answerable both to other parts of government and to the public through clear mandates, measurable targets, transparency, and regular reporting. Ideally, the institutions involved in industrial policy should operate as a meritocratic
technocracy. Fernandes and Reed (2026) similarly call for “a body of skilled civil servants with broad authority over industrial policy tools, insulated from political and interest-group pressures.”
Industrial policy is, therefore, not a substitute for the basic foundations of a healthy economy. It cannot compensate for weak governance, macroeconomic
instability, poor contract enforcement, burdensome regulation, or an uneven competitive playing field. Its effectiveness depends heavily on the broader policy environment in which it operates (Fernandes and Reed 2026).
This point is particularly relevant in MENAAP, where deeper structural constraints remain binding
B. Political instability as a major/severe constraint
Share of firms complaining about political instability being a major constraint (percent)
YEM, 2013 PAK, 2022 DJI, 2013 MAR, 2023 JOR, 2024 EGY, 2020 TUN, 2024 LBN, 2019 IRQ, 2022 KWT, 2025 BHR, 2024 SAU, 2022
2022 IRQ, 2022 KWT,2025 BHR, 2024 C. Business licensing and permits as a major/severe constraint
2014 YEM, 2013 PAK, 2022 DJI, 2013 MAR, 2023 JOR, 2024 EGY, 2020 TUN, 2024 LBN, 2019
Source: world bank calculations based on world enterprise surveys.
AFG, 2014 YEM, 2013 PAK, 2022 DJI, 2013 MAR, 2023 JOR, 2024 TUN, 2024 LBN, 2019 SAU, 2022 EGY, 2020 IRQ, 2022 BHR, 2024
D. Inadequately educated workforce as a major/severe constraint
of firms complaining about inadequately educated workforce being a major constraint (percent) AFG, 2014 YEM, 2013 PAK, 2022 DJI, 2013 MAR, 2023 JOR, 2024 TUN, 2024 LBN, 2019 SAU, 2022 EGY, 2020 IRQ, 2022 KWT, 2025 BHR, 2024
Note: AFg = Afghanistan; dJI = djibouti; egy = egypt, Arab Rep.; IRQ = Iraq; JoR = Jordan; Lbn = Lebanon; mAR = morocco; sAu = saudi Arabia; tun = tunisia; yem = yemen, Rep. PPP = purchasing power parity. All four panels are based on the latest survey available per country after the year 2009. the surveys included are (survey year in parentheses): AFg (2014), bhR (2024), dJI (2013), egy (2020), IRQ (2022), JoR (2024), kwt (2025), Lbn (2019), mAR (2023), PAk (2022), sAu (2022), and tun (2024).
Panel A shows the share of firms that consider corruption a major/severe constraint.
Panel b shows the share of firms that consider political instability a major/severe constraint.
Panel c shows the share of firms that consider business licensing and permits a major/severe constraint.
Panel d shows the share of firms that consider inadequately educated workforce as a major/severe constraint. Income group averages (excl. menAAP) are across nonmenAAP countries in the corresponding income groups. the income group averages are based on historical world bank income group classification for the year of the survey and excludes menAAP countries. countries are ordered in ascending 2024 gdP per capita (2021 $PPP) within income categorizations.
FIGURE 2.4 Major constraints cited by MENAAP firms
in many countries. On measures such as economic freedom, rule of law, and control of corruption, the region often underperforms relative to income peers. World Bank Enterprise Surveys point in the same direction: Formal firms in low- and middle-income MENAAP countries are more likely than firms in comparable economies to cite corruption, political instability, burdensome licensing, and an inadequately educated workforce as major obstacles to doing business (figure 2.4).
In conclusion, industrial policy can be a useful instrument when it addresses genuine market failures or supports economies through major structural transitions. In MENAAP, governments are pursuing it in response to a set of visible and pressing challenges: weak job creation, low productivity, limited diversification, and growing environmental vulnerability. These concerns are real, and, in many cases, they reflect deeper coordination failures, spillovers, and capability gaps that justify public intervention.
But industrial policy is not a silver bullet. Its success depends on careful diagnosis, sound design, and strong implementation capacity. Above all, it requires distinguishing between problems that industrial policy can help solve and those that instead demand broader institutional, regulatory,
or governance reform. Where that distinction is made clearly, industrial policy can support diversification, productivity growth, and resilience. Where it is not, it risks becoming costly, poorly targeted, or captured by private interests.
Industrial policy trends in MENAAP
menAAP countries increasingly turn to industrial policy tools
Over the past decade, the number of newly announced industrial policies in the MENAAP region has tripled. According to the Global Trade Alert (GTA) database, since 2016, the average number of new industrial policy measures has increased across income groups worldwide, but the rise has been especially pronounced among high-income and middle-income MENAAP countries relative to their income peers (figure 2.5). This pattern is consistent with broader global trends of renewed interest in industrial policy, as highlighted in earlier editions of this economic update (Gatti et al. 2025a).
tools
of preference in menAAP
The GTA data set makes it possible to classify newly announced industrial policies by the policy tools they use. Between 2016 and 2024, GCC economies relied primarily on subsidies (figure 2.6), broadly mirroring the pattern observed in other high-income economies. However, while highincome economies made greater use of import protection measures, GCC countries more frequently imposed local sourcing requirements for goods and services—an instrument rarely used by other high-income peers. By contrast, developing oil exporters and oil importers in the MENAAP region tended to rely more heavily on import-related policy measures.
Source: global trade Alert (gtA) data set.
Note: menAAP countries include Afghanistan; Algeria; bahrain; djibouti; egypt, Arab Rep.; Iran, Islamic Rep.; Iraq; Jordan; kuwait; Lebanon; Libya; morocco; oman; Pakistan; Qatar; saudi Arabia; syrian Arab Republic; tunisia; the united Arab emirates; the west bank and gaza; and yemen, Rep. time series in the panels represent the unweighted average of country-level indices for menAAP and non-menAAP country groups, where the cumulative count of active trade measures in 2016 is indexed to 1. Active measures are those implemented and not yet removed during the given year. when no removal date is provided, a trade measure is counted as active if its status in the gtA data set is indicated as “in force.” trade measures without implementation date are not considered. countries with zero active measures in the base year (2016) are excluded from the sample.
country characteristics determine the tools
The case for industrial policy rests on its potential to address market failures. The most effective
FIGURE 2.5 Indexed cumulative count of countries’ trade measures, by income group (averages)
FIGURE 2.6 Share
of policy
tools in
Source: global trade Alert (gtA) data set.
Note: FdI = foreign direct investment. Policy tools are categorized based on the united nations commission on trade and development classifications. “export policy” encompasses both export incentives and export restrictions. “FdI policy” aggregates foreign direct investment measures and capital controls. “Import policy” aggregates tariffs and non-tariff barriers. “Localisation policy” refers to trade-related investment measures requiring local content. “Procurement policy” covers government procurement restrictions. “subsidy” combines direct subsidies with state finance measures. “trade defence” includes contingent trade-protective measures. “other” captures all remaining measures, including migration and intellectual property.
instruments are “first-choice” policies that address the source of the failure directly—such as the underprovision of critical inputs—while minimizing unintended costs (Fernandes and Reed 2026). When such direct approaches are not feasible, governments often turn to broader marketwide interventions. These “second-choice” policies are less precise, may correct the underlying failure only imperfectly, and can impose additional costs by distorting incentives more broadly than necessary. In general, the public provision of tailored inputs falls into the first-choice category, whereas interventions such as tariffs and local content requirements are second-choice tools; macroeconomic interventions are also typically second-choice.
Implementing first-choice policies, however, requires a high degree of precision, not only in diagnosing the constraint but also in tailoring support to the specific needs of firms and sectors. This is where government bandwidth becomes critical: the state’s capacity to engage effectively with multiple industries and firms at once. Fernandes and Reed (2026) argue that, with the exception of industrial parks, all first-choice industrial policy tools require high government bandwidth (table 2.1). Beyond
administrative capacity, they also highlight fiscal space and country size as key determinants of which industrial policy tools are feasible in practice. The next section evaluates MENAAP countries along these three dimensions—government bandwidth, domestic market size, and fiscal space—to assess the scope each country has to deploy industrial policy.
Government bandwidth reflects the strength of a country’s institutional capacity: the effectiveness of its public administration, the quality of its technical staff, the degree of interagency coordination, and the intensity of its engagement with investors and private firms. Market access policies, for example, often depend on export promotion agencies and, therefore, require an efficient bureaucracy with the technical capability and organizational reach to work closely with private-sector actors. In the United Arab Emirates, the Ministry of Economy and Tourism’s export development program has set a national strategy for nonoil export growth, identifying 14 priority sectors and more than 180 target markets. Local agencies such as the Abu Dhabi Exports Office (ADEX) and Dubai Exports support this strategy through trade missions, financing partnerships, guarantees, and business-matching services, including ADEX-backed exports of United Arab Emirates’ firefighting vehicles to Tanzania and power infrastructure to Angola. Fernandes and Reed (2026) argue that government effectiveness, as measured by the World Bank, provides a useful proxy for government bandwidth.
Local market size captures the extent to which industrial policy can be sustained by domestic demand. Proxied here by GDP, it reflects whether an economy is large enough to attract investment and support economies of scale at home.3 Some industrial policy instruments are viable only in sufficiently large markets. Import tariffs and demand-side subsidies, for example, are more likely to be effective when there is a sizable domestic market that firms can profitably serve.
Finally, fiscal space—the government’s ability to raise spending or cut taxes without jeopardizing
3The size of preferential markets can also be added to the market size.
2.1
fiscal sustainability—shapes whether some industrial policy tools are simply too costly to deploy at scale. It can be approximated using indicators such as the tax-to-GDP ratio and the debt-to-GDP ratio. In GCC economies, however, a low tax-toGDP ratio does not necessarily imply limited fiscal space, since governments rely heavily on nontax revenues, including hydrocarbon-related income and transfers from national oil companies. Fiscal space matters especially for costly instruments such as production and innovation subsidies, whereas tools like import tariffs can be used even where budget room is limited, because they actually generate revenue. Thus, wealthy oil exporters such as Saudi Arabia may be well placed to deploy generous production and innovation subsidies, while economies such as Egypt and Pakistan, facing
tighter fiscal constraints, may find import tariffs more feasible.
Using bandwidth, fiscal space, and local market size as criteria, MENAAP countries can be sorted by which types of industrial policy are more feasible (figure 2.7). The rich, oil-exporting GCC economies have substantial fiscal space but, in some cases, smaller market size and some degree of bandwidth. Developing oil-exporting economies have more limited fiscal space, low government bandwidth, and small local markets. Certain oil-importing economies such as Egypt and Pakistan have large local markets but limited fiscal space and government bandwidth. Other developing oil importers have small markets, have little fiscal space, and vary with respect to government bandwidth. For
Source: Fernandes and Reed (2026).
FIGURE 2.7 Country characteristics
Sources: Fernandes and Reed (2026), International monetary Fund world Revenue Longitudinal database, and world bank world development Indicators.
Note: the dashed horizontal lines represent global 25th and 75th percentile (black) and the median (red) for the respective indicators.
Panel A: tax revenue as a percentage of gdP comprises the total taxes paid to the government, including taxes on profits of companies operating in the oil and gas and mining sectors, as a share of gdP. tax revenue as a percentage of gdP excludes revenue from profit-sharing agreements, other revenue from natural resources (such as royalties and dividends), and hydrocarbon export revenue. the data for each country represents the average of tax revenues as a percentage of gdP over the 2020–22 period.
Panel b: Public debt as a percentage of gdP is the country’s average over the period 2021–23. A country is considered to have large fiscal space if its tax revenue-to-gdP ratio exceeds the global median and its public debt-to-gdP ratio is below the global median.
Panel c: government effectiveness captures perceptions of the quality of public services, the civil service, policy formulation and implementation, and the credibility of a government’s decisions. the government effectiveness indicator is normally distributed with a mean near zero and typically ranges between –2.5 and 2.5. the data for each country represent the average of government effectiveness scores over the 2022–24 period. government bandwidth is considered large if the government effectiveness score is above the global median.
Panel d: market size is defined as domestic size only (gdP), for ease of measurement. however, for most industrial policy tools (except tariffs), the concept of market size also includes the size of destination markets with preferential access. the data for each country represent the average of gdP over the 2021–23 period. market size is classified as large if the country’s gdP exceeds the global median.
countries in the region in fragile and conflict situations—Afghanistan, the Syrian Arab Republic, and the Republic of Yemen—most industrial policy tools are out of reach.
Morocco illustrates how a country with moderate fiscal space, moderate government bandwidth, and an effectively medium-to-large market can deploy a broad range of industrial policy tools. Although its domestic market is not especially large, its proximity to Europe gave firms access to a much larger
external market, enabling the government to pursue an export-oriented strategy to build the automotive industry. To support the sector’s development, Morocco relied on local content requirements rather than export bans, while also making skills development a central pillar of its strategy. That effort demanded substantial government bandwidth, which Morocco strengthened through public-private partnerships in professional training centers that helped align workforce development with industry needs. Its combination of moderate fiscal space
and administrative capacity also made targeted investment subsidies feasible. Morocco used these subsidies—rather than export subsidies—to attract foreign original equipment manufacturers and suppliers into specific automotive ecosystems.
targeted sectors in menAAP
An NDP often singles out specific sectors or industries as being of strategic importance. NDPs in all MENAAP economies (except Kuwait) mention at least one target sector, and most list at least five (figure 2.8, panel A). The most frequently targeted sectors are tourism (nine out of 10 MENAAP countries) and agricultural commodities (four of every five), followed by chemicals (one out of every two) and heavy manufacturing (two of every five) (figure 2.8, panel B).
Although MENAAP countries, like economies elsewhere, often identify a wide range of strategic sectors, they have not necessarily acted with equal
intensity across all of them. A count of official policy announcements shows that three sectors— food and textiles, chemicals and materials, and metals and machinery—received the largest number of policy measures across all country groups in the region (figure 2.9), broadly mirroring patterns among income peers outside MENAAP. Within this overall pattern, however, important differences emerge. GCC countries have directed relatively greater policy attention toward business services, trade and transport, and community services—including tourism-related activities—than other high-income economies. By contrast, developing oil importers and developing oil exporters in MENAAP have concentrated more heavily on food and textiles and on chemicals and materials, and less on metals and machinery, than other middle-income peers. This distinction matters: While NDPs indicate which sectors governments consider strategic, the tally of policy announcements reveals where governments have actually taken action.
Sources: world bank calculations based on data from Fernandes and Reed (2026) and individual country national development plans.
Note: ARe = united Arab emirates; dZA = Algeria; bhR = bahrain; dJI = djibouti; egy = egypt, Arab Rep.; IRQ = Iraq; JoR = Jordan; kwt = kuwait; Lby = Libya; mAR = morocco; omn = oman; PAk = Pakistan; Pse = west bank and gaza; QAt = Qatar; sAu = saudi Arabia; syR = syrian Arab Republic; tun = tunisia; yem = yemen, Rep. doe = developing oil exporters (Algeria; Iran, Islamic Rep.; Iraq; Libya; syrian Arab Republic; and yemen, Rep.). doI = developing oil importers (djibouti; egypt, Arab Rep.; Jordan; Lebanon; morocco; Pakistan; tunisia; and the west bank and gaza). gcc = gulf cooperation council (bahrain, kuwait, oman, Qatar, saudi Arabia, and the united Arab emirates); hs = harmonized system.
Panel A shows the number of unique two-digit hs codes explicitly mentioned in national development plans per country. the income group average shows the average of countries in each income group (excl. menAAP countries).
Panel b shows the percentage of menAAP countries in the sample that target each sector, as specified in the x-axis. Agricultural commodities represents hs2 codes 01 to 10 and 12 to 14. heavy manufacturing represents hs2 codes 68 to 89 and 93. chemicals represent hs2 codes 28 to 40. oil, gas, and mining represent hs2 codes 25 to 27. Food and beverage manufacturing represent hs2 codes 11 and 15 to 24. textiles and apparel represent hs2 codes 50 to 65. other light manufacturing represents hs2 codes 48, 49, 66, 67, 90 to 97, and 99. Leather and furs represents hs2 codes 41 to 43. Forestry represents hs2 codes 44 to 47.
FIGURE 2.8 Sector targeting in national development plans in MENAAP
Share of sectors in policy announcements
Source: global trade Alert (gtA) data set.
Note: gtA identifies affected economic activities using common Product classification (cPc, version 2.1) at the three-digit level. the details of this classification and its correspondence to others are available from the united nations statistics division. the three-digit level products are grouped to the one-digit section level. “Food and textiles” comprises cPc section 2 (Food, beverages, textiles, and apparel); “chemicals and materials” corresponds to cPc section 3 (other transportable goods, including fuels and chemicals); “metals and machinery” covers cPc section 4 (metal products, machinery, and equipment); and “mining and energy” represents cPc section 1 (ores, minerals, electricity, and gas). service sectors follow the standard cPc divisions for construction, trade and transport, Finance, business, and community services.
Product complexity is an important consideration for industrial policy because it is associated with higher productivity and faster development (Felipe et al. 2012).4 But structural transformation rarely occurs in a single leap: Countries cannot move directly from producing olives to manufacturing microchips. Instead, policymakers often proceed through “stepping-stone” sectors5—industries that are close to existing capabilities while also being more proximate to sophisticated activities in the product space. In this way, developing intermediatecomplexity sectors can create pathways into more advanced industries over time. A classic example is textiles, which have often served as a bridge from
4The Product Complexity Index captures the sophistication, in relation to the productive know-how required to produce a product. It takes into consideration how commonly these products are produces around the world and the economic complexity of the countries that do. The most complex products include sophisticated machinery, electronics, and chemicals. The least complex products are those produced more widely around the world including raw materials and simple agricultural products (Growth Lab at Harvard University 2026).
5Hausmann and Klinger (2007) show that an economy’s ability to develop competitiveness in a new industry (measured by revealed comparative advantage) depends heavily on whether that industry is closely related to products the country already produces competitively.
low-complexity, labor-intensive production to light manufacturing. The concept of “opportunity gain” captures this idea by measuring how entry into one product can expand future possibilities in more complex sectors.
The pattern of industrial policy announcements in MENAAP broadly reflects this logic. In GCC countries and developing oil exporters, policymakers appear to favor sectors that are closer to existing capabilities, consistent with a gradual, “small steps” approach (figure 2.10). Developing oil importers, by contrast, tend to target sectors that are less closely related to their current export baskets. At the same time, across GCC countries, developing oil exporters, and developing oil importers alike, industrial policy tends to favor more complex products with higher opportunity gain.
FIGURE 2.10 DOI and GCC countries target product categories effectively
Sources: world bank calculations using data from global trade Alert (gtA) and harvard Atlas of economic complexity.
Note: doe = developing oil exporters (Algeria; Iran, Islamic Rep.; Iraq; Libya; syrian Arab Republic; and yemen, Rep.); doI = developing oil importers (djibouti; egypt, Arab Rep.; Jordan; Lebanon; morocco; Pakistan; tunisia; and the west bank and gaza); gcc = gulf cooperation council (bahrain, kuwait, oman, Qatar, saudi Arabia, and the united Arab emirates); gtA = global trade Alert; hs = harmonized system; oLs = ordinary least squares. the bars denote coefficients from an oLs regression at the country-product level (hs 2-digit) accounting for country fixed effects. countries with fewer than 10 total policy announcements are excluded. Regressions are run separately for each country group: gcc members, which include bahrain, kuwait, oman, Qatar, saudi Arabia, and the united Arab emirates; doe, which include Algeria, the Islamic Republic of Iran, and Iraq; and doI, which include djibouti, egypt, Arab Rep., Jordan, morocco, Pakistan, and tunisia. the dependent variable measures, for each product-country pair, the share of a country’s total gtA announcements that target a given product, expressed as a percentage. Regressions are run separately for three independent variables: (1) “Proximity” is a measure (from 0 to 1) that captures how closely related a product is to a country’s current exports, (2) the “Product complexity index” captures the amount of sophistication of know-how required to produce a product, and (3) “opportunity gain” measures how many high-complexity sectors a country would get “close to” by developing a given product. For more information and variable definitions, refer to the glossary of the Atlas of economic complexity (https://atlas.hks.harvard.edu/glossary).
FIGURE 2.9
how intensely is industrial policy being pursued?
Industrial policies are not deployed with equal intensity. Three small tariffs introduced under one policy may have far less economic effect than a single large subsidy under another. Measuring intensity is, therefore, inherently difficult, not least because different policy tools require different metrics: Subsidy intensity is better captured by the amount of public resources committed, while trade protection is more meaningfully measured by tariff rates. Because these instruments operate through different channels and are measured in different units, combining them into a single summary indicator of industrial policy intensity may be misleading. A more informative approach is to assess the intensity of business subsidies and tariffs separately.
business subsidies
Business subsidies include both direct support— such as cash grants—and tax expenditures, that is, revenue forgone through special tax provisions and exemptions. They do not, however, include indirect forms of support such as subsidized inputs or energy. In Egypt, business subsidies amounted to about 3.6 percent of GDP in 2023, slightly above the 2009–24 average for middle-income economies worldwide. By contrast, Morocco (2024) and Jordan (2022) devoted smaller shares of GDP to business subsidies than the middle-income average. In all three countries, direct subsidies accounted for roughly 70 percent of total business support, outweighing tax expenditures (figure 2.11). This contrasts with the pattern in other middle-income economies, where tax expenditures make up a larger share—approximately 60 percent—of total business subsidies.
tariffs
Tariffs are taxes on imports and can be an important industrial policy tool when used to protect domestic producers. On average, MENAAP countries impose tariff rates similar to those of their income peers (figure 2.12). As elsewhere in the world, tariff
2.11 Business subsidies in MENAAP
Total business subsidies (percent of GDP, average, latest year)
Sources: world bank calculations based on ImF government Finance statistics (gFs), world bank boost database, and global tax expenditures database.
Note: egy = egypt, Arab Rep.; JoR = Jordan; mAR = morocco; mIcs = middleincome countries; PPP = purchasing power parity. the figure shows spending on business subsidies on direct funding and tax expenditures, as a share of gdP, for the latest year available, as indicated in the country labels on the y-axis. For the mIcs’ average, it includes the latest datapoint available for lower- and uppermiddle-income countries (ranging from 2009 to 2024). countries are ordered in ascending 2024 gdP per capita (2021$ PPP).
rates in the region tend to decline with income: They average about 13 percent in low-income countries, 10 percent in lower-middle-income countries, 7 percent in upper-middle-income countries, and 5 percent in high-income economies. Djibouti and the Islamic Republic of Iran stand out, with average tariff rates above 20 percent. For lower-income countries, tariffs are often a more accessible policy instrument because they require less fiscal space than subsidies or other forms of direct support.
The dispersion of tariff rates across products within a country provides a useful indication of how selectively tariffs are being used to protect or promote particular industries. The greater the dispersion, the more targeted the tariff structure; if the same tariff were applied uniformly across sectors, dispersion would be low. Among middle-income MENAAP eonomies, average tariff dispersion is higher than among their income peers. Egypt stands out in particular, with relatively high dispersion also observed in the Islamic Republic of Iran, Morocco, and the West Bank and Gaza. In these economies, tariffs are applied unevenly across products, suggesting that policymakers are using them strategically rather than uniformly.
FIGURE
MICs
EGY, 2023
JOR, 2022
MAR, 2024
FIGURE 2.12 Import tariffs in MENAAP
Source: world bank calculations based on the world Integrated trade solution (wIts) data set.
Note: AFg = Afghanistan; ARe = united Arab emirates; dZA = Algeria; bhR = bahrain; dJI = djibouti; egy = egypt, Arab Rep.; IRn = Iran, Islamic Rep.; JoR = Jordan; kwt = kuwait; Lbn = Lebanon; Lby = Libya; mAR = morocco; omn = oman; PAk = Pakistan; Pse = west bank and gaza; QAt = Qatar; sAu = saudi Arabia, syR = syrian Arab Republic; tun = tunisia; yem = yemen, Rep. PPP = purchasing power parity. country-level import tariff averages and standard deviations are for 2023 (latest year available) and are weighted by import values. Pakistan’s para-tariffs are not included. egypt’s tariffs excluded hs6 category 22 (beverages, spirits, and vinegars) to avoid outliers in the analysis. Income group averages exclude menAAP countries and are simple averages of country-level averages of the countries constituting each group (panel A is an average of the average country tariff rate; panel b is an average of the standard deviation of the country tariff rate). countries are ordered in ascending 2023 gdP per capita (current $PPP) within each income group.
menAAP countries may be using industrial policies more than they announce
The April 2025 edition of this economic update showed that counts of industrial policy interventions in MENAAP, based on the GTA database, may underestimate the prevalence of industrial policy in the region.
Fernandes and Reed (2026) note that lower-income economies are likely to be underrepresented in the GTA because they report less regularly. This underreporting may be more pronounced in MENAAP than in other regions. An assessment found that the number of industrial policies in place in Egypt, Morocco, Saudi Arabia, and the United Arab Emirates were substantially higher than data from the GTA database suggested (Gatti et al. 2025a).
One factor in the underreporting may be how industrial policy is conducted or announced in the region. Sometimes industrial policies in the MENAAP region are executed by an entity other than the government—such as an SWF or an SOE—that does not officially announce industrial policy initiatives. For example, in 2018, Saudi Arabia’s SWF created the Jada Fund of Funds to “accelerate economic diversification, create sustainable value, and shape
the future of Saudi Arabia’s investment landscape.”6 While clearly a vehicle for industrial policy implementation, the Jada initiative is not captured in the GTA database. Because there are many SOEs in the region—and in high-income countries, SWFs that manage the most domestic assets (as a percentage of GDP) in the world—the undercount in MENAAP may be bigger than in other regions.
The subtle vehicles of industrial policy in MENAAP
Institutions in industrial policy
Industrial policy is not implemented only through the most visible government institutions—such as ministries, export promotion agencies, special economic zone administrators, or large subsidy programs. It is also carried out through a broader and often subtler institutional ecosystem that includes SOEs, SWFs, regulatory bodies, standards agencies, investment authorities, and public-private partnerships. Many of these institutions do not appear overtly “industrial” in form, yet they shape firm incentives, channel capital, build productive capabilities, and influence which sectors expand.
Among these various vehicles, this section focuses primarily on SOEs because of their pervasive role in the MENAAP region, as well as on SWFs because they have become an important and often more indirect instrument of industrial policy, especially in GCC economies.
state-owned enterprises
SOEs can directly implement industrial policy by, among other things, providing public inputs and subsidies for production, innovation, and exports. Many SOEs have explicit mandates to coordinate and link various sectors. Others specifically target emerging industries that private businesses are reluctant to enter. But weak governance can make them less-than-ideal vehicles for industrial policy.
SOEs in MENAAP tend to have a larger footprint in the region’s economies than they do in other middle- and high-income economies (Gatti et al. 2025a). According to official reports, Djibouti had 84 SOEs in 2020; Egypt had 381; Morocco had 269 public enterprise and 44 limited liability companies (LLCs); Oman had 170 entities; and Tunisia had 110 entities (Colvin and Ladegaard 2024). The Organisation for Economic Co-operation and Development (OECD) reported in 2012 that SOEs accounted for 30 percent of total employment in the MENA7 region, compared with the global average of 5 percent (OECD 2012). Others report that SOEs in MENA account for at least 20 percent of GDP (Ramirez Rigo et al. 2021), significantly more than the 15 percent they account for in the OECD and some African economies, and 8 percent in Latin America. Data from the World Bank’s Business of the State show that revenues of firms with state participation were 47.3 percent of GDP in Egypt, 39 percent in Jordan, and 36 percent in Tunisia—compared to the world average of 17 percent of GDP in 2019 (Colvin and Ladegaard 2024; World Bank 2023a). Colvin and Ladegaard (2024) estimate that more than 50 percent of firms with state participation in Tunisia, 30 percent in
Egypt and Jordan, and 20 percent in Morocco were unprofitable.
The large presence of SOEs undermines market contestability, the ease with which firms can enter, grow, and exit a market, and, in doing so, weakens competitiveness. In most countries, the share of sectors with at least one SOE is higher in MENA than in high-income economies. More importantly, SOEs in MENA operate in sectors that, in other economies, are typically served by the private sector. For example, Egypt, Jordan, Kuwait, Morocco, Saudi Arabia, Tunisia, and the United Arab Emirates all have one major SOE operating in construction, whereas fewer than 30 percent of high-income countries do. In many economies, line ministries simultaneously hold ownership stakes in state enterprises and fulfill policy and regulatory functions—an institutional arrangement that can give rise to tensions and potential conflicts of interest, particularly where the boundaries between these roles are not clearly delineated. The same ministries may appoint the SOE’s chief executive officer, prepare and approve its budget and strategy, and set the tariffs and regulations under which it operates. SOEs also benefit from easier access to finance because of implicit government guarantees. State-owned banks may, in turn, lend disproportionately to SOEs for strategic rather than commercial reasons, contributing to higher levels of nonperforming loans while restricting credit to the private sector (Cardarelli, Vera Martin, and Lall 2022).
7MENA (the Middle East and North Africa) refers to all countries in MENAAP except Afghanistan and Pakistan, which were added to the region in July 2025.
There are many examples of SOEs serving as vehicles of industrial policy in MENAAP. In the United Arab Emirates, the state-owned TECOM Group manages a portfolio of industrial parks, including Dubai Internet City, which serves to position Dubai as a digital hub. In Morocco, SOMACA was established to support the growth of what was then the country’s infant auto industry. Saudi Aramco, the Saudi national oil company, launched the In-Kingdom Total Value Added (iktva) program, a form of local content requirement in procurement. The iktva program “helps attract, establish, and promote domestic energy-related industries that are globally competitive” and has “the goal to retain 70 percent of Aramco’s procurement spend in-Kingdom.” More broadly, GCC countries have adopted economic
strategies that use SOEs to expand into new hightech sectors such as aviation, semiconductors, and green energy (Cardarelli et al. 2022).
Good governance, supported by clear mandates and targets, independent oversight, and effective accountability, is essential to the success of any institution that implements industrial policy. However, SOE governance is weak across much of MENAAP. Decision-making within SOEs is often subject to political influence that goes beyond the legitimate administration of policy, and systems for monitoring performance are frequently inadequate. Although specific examples from the region show that SOEs can serve as vehicles for industrial policy, policymakers should proceed with caution, particularly where these governance criteria are not met.
sovereign wealth funds
SWFs are a primary tool for transforming natural resource income into diversified financial assets (Gatti et al., forthcoming). Successful SWFs are multipurpose investment vehicles that typically serve as (1) stabilization funds that accumulate assets during periods of high commodity prices and release these assets during commodity-price downturns; (2) intergenerational wealth funds that convert finite resource revenues into permanent financial assets for future generations; and (3) strategic development funds that invest domestically as well as internationally to support innovation, infrastructure, or industrial development and the creation of national capabilities more broadly, which is the function most germane to industrial policy. As with SOEs, SWFs can be vulnerable to political patronage, misallocated capital, and corruption. Successful SWFs maintain strict commercial principles, publish audited accounts, and recruit professional investment managers.
SWFs—nearly all of them in the high-income GCC countries—are being used increasingly to support domestic diversification, including by financing sectors such as tourism and green energy (Gatti et al., forthcoming). SWFs in the high-income MENAAP economies are among the largest in the world relative to GDP, manage the highest levels of domestic assets relative to GDP, and are investing domestically in ways that are increasingly consistent
with industrial policy. For example, in the United Arab Emirates (figure 2.13), SWFs manage assets equivalent to 460 percent of GDP, of which 30 percent are domestic assets. The United Arab Emirates ranks fourth globally in total assets under management as a share of GDP and first in domestic assets under management as a share of GDP.
SWFs in the region have become more important in recent years, especially after the spike in oil prices in 2022. Assets under management of the Saudi Arabia Public Investment Fund (PIF) roughly doubled between 2020 and 2024 (figure 2.14). More-
FIGURE 2.13 Sovereign wealth funds, assets under management
Domestic assets under management (percent of GDP)
Source: swFglobal January 2026.
FIGURE 2.14 PIF assets under management by investment pools
over, the share of local investment pools in the total increased from 47 percent in 2020 to 79 percent in 2024. Investments seem to be shifting inward, reflecting a domestic focus that underscores the prominence of industrial policy in the PIF.
Dubai offers a clear example: Emirates is part of The Emirates Group, whose owner is the Investment Corporation of Dubai (ICD), the principal investment arm of the Government of Dubai, and ICD describes aviation as a sector of key importance to Dubai’s economy. In this sense, a state-owned airline is not only a commercial firm; it can also anchor a wider ecosystem in tourism, logistics, airport services, maintenance, and related business activities. Saudi Arabia’s Public Investment Fund plays a similar role on a broader scale. PIF describes itself as a driver of Vision 2030 and economic transformation, and its portfolio includes companies and projects such as Riyadh Air, NEOM, ACWA Power, Diriyah Company, Qiddiya, Alat, and Elm. Together, these examples show how SWFs in the region are used to direct longhorizon capital toward sectors the state wants to build, expand, or localize—making them important, and often less visible, vehicles for industrial policy.
Yet, the quality of governance of MENAAP SWFs gets a mixed review. On the Governance, Sustainability, and Resilience scorecard from SWF Global, three of the 14 SWFs in the GCC countries were in the top quartile of 100 SWFs from around the world in 2025. The Saudi PIF was one of four SWFs that received the maximum score of 100 percent.8 But four SWFs from GCC countries scored in the bottom quartile.
Bridging theory and evidence
Four case studies illustrate how industrial policy has been carried out in the region and examine how the principles of conducting industrial policy are
8The GSR Scoreboard is comprised of 25 binary questions that are answered based on publicly available information only. Each element receives equal weight, covering aspects related to governance, sustainability, and resilience. For example, under the governance umbrella, elements assess whether details of the investment portfolio are publicly available, whether annual returns figures are public, and whether assets under management figures are publicly available.
reflected in real situations. These examples were chosen to represent the wide spectrum of countries in the region, of income levels and economic structures, and the range of industries, including the manufacturing and services sectors. This section briefly describes each case study and draws lessons from the practice of industrial policy in the MENAAP context. Each of these industrial policy efforts is explored in annex 2A. Box 2.2 provides a summary of each case study.
comprehensive industrial policy framework requires high government capacity
What can be learned from these diverse experiences in MENAAP? The main elements of government bandwidth are an effective institutional setup for public-private dialogue and a public workforce with the expertise to engage in that dialogue (Fernandes and Reed 2026). Industrial policies in Dubai, Egypt, Morocco, and Pakistan illustrate how these elements of bandwidth can either function well or fall short.
Beginning in the early 2000s, Morocco embarked on an active industrial policy that placed the automotive sector at its center. The policy combination, including investment subsidies, industrial parks, special economic zones, and workforce training, required substantial expertise within the relevant agencies, as well as high-quality interagency coordination. Equally important, private firms played an active role in policy design and implementation through the business association AMICA (the Moroccan Association for Automotive Industry and Construction).
Morocco’s Industrial Acceleration Plan prioritized the development of industrial ecosystems, including such subsectors as wiring, interiors and seats, metal pressing, batteries, heavy vehicles and industrial bodywork, and motors and transmission. Policies were tailored to the specific needs of each subsector, providing targeted support accordingly. This institutional setup, with its strong emphasis on coordination with the private sector, helped complement the government’s capacity to respond to the granular needs of the automotive industry.
BOX 2.2 Industrial policies in action in MENAAP
morocco starts to make cars
Morocco’s automotive industry illustrates how welldesigned industrial policy can support sectoral growth. Between 2012 and 2024, automotive output expanded rapidly in the North African country, growing at an annual rate of about 14 percent. By 2024, Morocco had nearly caught up with South Africa as the continent’s largest vehicle producer, while sector value added more than doubled between 2019 and 2022. Strengthening integration and building capabilities of local companies remain key priorities for advancing the sector further.
A proactive and comprehensive industrial policy— centered on attracting investment from multinational original equipment manufacturers (OEMs)—helped underpin the sector’s growth. The automotive industry was first prioritized under Morocco’s Plan Emergence (2009–15) and later under the Industrial Acceleration Plan (2014–20). The government deployed policy instruments that Fernandes and Reed (2026) classify as “first-choice” tools, including the development of industrial parks alongside special economic zones, workforce training support, and investment subsidies. Private companies were also actively involved in policy design and implementation through institutionalized channels such as the business association AMICA (the Moroccan Association for Automotive Industry and Construction).
dubai seeks to be a digital and artificial intelligence hub
Ranked number one in artificial intelligence (AI) adoption by Microsoft in 2026, Dubai has transformed from a logistics hub half a century ago into a regional center of the digital economy. This transformation began with state-led infrastructure investment. Dubai achieved 100 percent digital switching a decade ahead of the United States and the United Kingdom, creating the conditions for the 1999 launch of Dubai Internet City—an industrial park for foreign-owned companies that is tax-free and has attracted global technology firms to meet demand for digital services supported by e-government mandates. Industrial pol-
icy instruments included public infrastructure investment, skills development, and innovation subsidies. Specialized institutions, including the Executive Office of Dubai and TECOM, were established to strengthen coordination capacity and translate strategic priorities into implementation.
Dubai has since expanded its ambitions to include innovations that would position it as a global hub for AI. It has leveraged its world-leading fiber networks and attracted investments such as the partnership between Microsoft and Emirates Integrated Telecommunications Company to build sovereign data centers and secure advanced computing capacity. These industrial policy initiatives coincided with, and may have contributed to, a broader economywide shift in composition. By the 2010s, the nonhydrocarbon sector accounted for about 98 percent of Dubai’s GDP, up from less than 50 percent in the early 1980s (Al Faris and Soto 2016). As of 2025, information and communications technology activities alone accounted for about 4.7 percent of GDP.a
the Arab Republic of egypt wants to attract more tourists
Tourism has long been a cornerstone of Egypt’s economy, generating foreign exchange, supporting millions of jobs, and driving infrastructure investment. Egypt aims to significantly increase annual tourist arrivals— with targets of up to 30 million visitors a year by 2031, double the number recorded in 2023—and to improve the quality and sustainability of its tourism ecosystem.
Egypt’s tourism strategy has focused investment on priority zones through four main channels: (1) providing land that is immediately available for construction (serviced land); (2) investing in enabling infrastructure, such as roads and airports; (3) supporting sector-specific workforce development; and (4) offering targeted incentives. The government has introduced a National Accommodation Master Plan to identify regional investment priorities and market gaps, alongside financing initiatives for hotel renovation, expansion, and new construction. The Red Sea coast is a
prominent example of how these four policy actions have been combined to expand capacity and improve connectivity. First, serviced land and coordinated site development were advanced through state-backed publicprivate projects that clustered investment in priority coastal zones and expanded hotel capacity. Second, enabling infrastructure was expanded to better connect the Red Sea to domestic and international markets through airport capacity upgrades, improved roads, and aviation route incentives. Third, sector-specific workforce development is led by the Ministry of Tourism and Antiquities, which aims to train nearly 43,000 workers in hospitality, food safety, and sustainable tourism, supported by public-private training initiatives and multisector partnerships. Fourth, Egypt introduced targeted incentives and market-access measures, including streamlined e-visas and visas on arrival, promotional campaigns, and tourism-focused credit programs such as the 2024 facility funded by the Ministry of Finance and implemented through the Central Bank of Egypt to help finance the expansion of accommodation capacity. According to data from the Ministry of Planning and Economic Development, accommodation and food service activities accounted for about 4 percent of GDP in 2024. This share has been increasing since 2020, partly reflecting a post-COVID-19 recovery. Still, although Egypt’s tourism sector has generated strong growth and job creation dividends, international comparisons suggest that it could become more inclusive and sustainable. Moreover, only 3 percent of jobs per US$1 million invested are in sectors linked to tourism. Egypt’s indirect employment multiplier—0.6 indirect jobs per US$1 million invested— lags behind peers, which average 1.6 indirect jobs per US$1 million invested. Strengthening local supply chains in food, crafts, maintenance and repair, boats,
and digital services would enhance the sector’s overall performance (World Bank 2023b).
Pakistan stiches more soccer balls
The cluster of soccer ball manufacturers in the Pakistani city of Sialkot provides an example of industrial policy with deep historical roots. Between 1955 and its peak in 1997–98, soccer ball exports grew at an average annual rate of 10 percent. At that peak in the late 1990s, 47 percent of US soccer ball imports came from Pakistan. In recent years, however, Pakistan’s market dominance has diminished as competition from China has increased. By 2024, only 16 percent of United States soccer ball imports originated from Pakistan. Even so, the country continues to dominate the production of high-quality, hand-stitched balls, including those used in the World Cup and at the Summer Olympics.
The cluster in Sialkot generated important benefits for the private sector: A deep labor pool, strong knowledge spillovers, and ready access to specialized inputs all contributed to the development of the soccer ball industry. Two industrial policies materially supported the formation of the Sialkot cluster. First, the government established a dedicated industrial estate in Sialkot, offering plots at about 50 percent of market value to encourage firm entry and expansion. Second, to improve firms’ cash flow and international competitiveness, an export rebate scheme allowed manufacturers to reclaim customs duties, sales taxes, and excise taxes paid on imported inputs used to produce balls for export. Suggestive evidence indicates that this rebate scheme may have been effective. By 2010, more than half of the 181 Sialkot enterprises that identified soccer balls as their primary product had been founded in the 1980s and 1990s, when the export rebate program was active.
Within government, the Ministry of Industry and Trade led industrial policy; the investment and export promotion agency (Moroccan Investment and Export Development Agency, or AMDIE) played an important role in attracting foreign investment; and Maroc PME, the national agency for the promotion of small and medium-sized enterprises, provided targeted incentives for firms seeking to supply the industry. AMICA led sectoral coordination and contributed to policy design by suggesting sectoral targets and identifying key industry needs. It also played a central role in workforce development. Professional training centers for the auto industry operated under publicprivate partnerships, three of which are managed by AMICA and one by Renault.
The Executive Office of Dubai is an example of a government institution capable of engaging with the private sector at a granular level as the emirate worked to become a digital and artificial intelligence (AI) hub. The office functions as a model “delivery unit,” reporting directly to government leadership to analyze specific constraints—such as Dubai’s small domestic market—and strengths—such as its relatively large fiscal space—and to design targeted strategies without becoming bogged down in implementation. This high-level oversight allowed Dubai to move beyond generic incentives and tailor its policies to the emirate’s specific context. For example, the government established TECOM to launch, among other business districts, Dubai Internet City—a specialized cluster offering dedicated infrastructure and regulatory exemptions. At the same time, to address the “small-market” bottleneck, the government stimulated demand in the sector through an e-government mandate, effectively becoming the primary client for the private technology firms it had attracted.
While TECOM managed physical clusters, the Smart Dubai Office was created to serve as a central coordinating agency, driving regulatory innovations such as the 2015 Dubai Data Law and the 2017 Paperless Strategy to accelerate digital adoption across all departments. As the sector matured, the government expanded its use of skills and financial instruments. The “One Million Arab Coders” initiative aimed to build the necessary skill base, while
the Dubai Future District Fund addressed financing needs for high-risk startups. These tailored measures—from infrastructure to regulation and from skills development to fiscal support—were critical in helping propel the United Arab Emirates to first place globally in AI adoption by 2025.
Conversely, Egypt’s industrial policies between 2004 and 2011 show how weak coordination across government institutions can lead to industrial policy failure. In 2006, Egypt introduced the Egypt Industrial Development Strategy, which targeted eight traditional sectors and six additional ones identified as “target niches” through a broad set of industrial policy tools, including on-the-job training, land provision, funds for “modernization efforts,” and export subsidies (Loewe 2013). Yet even though Egypt’s post-2004 industrial policies boosted investment and exports and improved the business environment—by expanding access to finance, simplifying taxes, and reducing red tape—they did little to promote structural transformation: Export technology content, firm sophistication, technology absorption, and applied research and innovation changed very little. Between 2004 and 2011, Egypt’s industrial policy suffered from coordination failures, as three separate strategies were implemented in parallel by different ministries. The result was overlapping bureaucracies, weak coordination, and unclear accountability (Loewe 2013). There were also no independent mechanisms to assess the effectiveness of policy instruments. Some measures may even have hindered structural transformation: Generous transfers helped exporters compete globally but reduced their incentives to innovate and strengthen competitiveness.
The soccer ball cluster initiative in Sialkot, Pakistan, illustrates how industrial policy can foster engagement between government and the private sector through a partnership designed to strengthen productivity in a specific location. Public-private partnerships of this kind tend to be “embedded”—that is, in the sense defined by Fernandes and Reed (2026), they constitute an institutional arrangement that encourages two-way exchange and coordination between government and the private sector. Subsidized land and export rebates were
the main industrial policy tools used. Beyond that, however, the private sector remained largely in control of the cluster initiative, even building the first private airport in Pakistan.
objective setting and evaluation
Industrial policy, like most policy ventures, carries significant risks. It is, therefore, essential to recognize when a policy no longer serves its purpose and should be withdrawn. Policymakers need to be willing to course-correct, learn from failure, and continue experimenting with alternative approaches. This “learning” mindset should guide the entire industrial policy process—from design, to implementation, to sunset, when policies are phased out.
At the design stage, policymakers should set measurable objectives that clarify what the policy is intended to achieve. These objectives should be realistic, so they provide a clear sense of the expected benefits and allow costs to be weighed against those benefits from the outset. Sunset clauses should also be established at the start, defining both the period during which the policy will remain in force and the explicit criteria under which it may be extended.
The Moroccan Ministry of Industry and Trade committed to supporting the automotive industry through a range of initiatives—including land concessions, training programs, local integration programs, and investment subsidies—and, together with the automotive industry association AMICA, set targets for job creation, revenues, exports, and gains in local integration (IFC 2019).
Including sunset clauses in industrial policies from the outset and making credible commitments to uphold them can create incentives for firms to act quickly, accelerating investment before support expires (Fernandes and Reed 2026). In some cases, however, when market failures are permanent in nature, there may be little justification for making interventions temporary. For example, permanently higher taxes may be warranted to address the negative externalities associated with pollution. More often, however, industrial policies are intended to “kickstart” an industry until it reaches a stage at which support is no longer needed. As a general
rule, industrial policies should, therefore, be introduced with end dates, or sunset clauses, as standard practice.
Globally, there has been a shift over the past decade toward greater use of sunset clauses. The share of industrial policies introduced with an explicitly announced end date rose from an average of 17 percent in 2010–13 to 27 percent in 2019–22, suggesting growing global recognition of the importance of time-bound assistance rather than permanent support for industries.
In the early 2010s, many MENAAP countries did not attach end dates to their industrial policies (figure 2.15, panel A). This was true not only in countries with relatively few industrial policies, such as Iraq, but also in countries where such policies were more widespread, such as Saudi Arabia. Of the 144 industrial policies deployed by Saudi Arabia between 2010 and 2013, none included an end date. In contrast, during the same period in Pakistan, one-third of the 44 industrial policies introduced during that period included sunset clauses, while in Egypt, 5 of 13 industrial policies were capped with end dates.
By the end of the decade, sunset clauses were being incorporated much more extensively (figure 2.15, panel B). Even so, some economies remained reliant on open-ended policy tools: In Jordan and Tunisia, no sunset clauses were introduced. In contrast, by the end of the decade, 52 of the 134 industrial policies in the Pakistan sample specified end dates. Between 2019 and 2022, more than onethird of the industrial policies introduced in Egypt and Morocco included end dates. Saudi Arabia also added sunset clauses to 8 of its 96 industrial policies introduced between 2019 and 2022.
Even when industrial policies include sunset provisions, they should not automatically continue until their end date. When evidence shows that a policy is not having its intended effect, governments should be prepared to terminate it. Setting intermediate objectives and monitoring progress throughout implementation allow governments to make that judgment. Having the right data is essential for tracking progress accurately and in a timely
FIGURE 2.15 Industrial policies and end dates
2010–13
B. 2019–22
Source: ebRd (2024). gtA policy descriptions are classified as industrial or nonindustrial using a fine-tuned chatgPt prompt (building on Juhász et al.’s [2024] supervised machine learning approach), with only same-year entries counted to ensure comparability over time.
Note: dZA = Algeria; egy = egypt, Arab Rep.; gtA = global trade Alert; mAR = morocco; PAk = Pakistan; sAu = saudi Arabia. each dot represents a country, plotted by the number of industrial policies adopted (x-axis) against the number of those policies with specified end dates (y-axis). Red dots denote menAAP countries; navy dots denote non-menAAP countries. the black dashed line represents the 45-degree reference line, along which all policies would have end dates; the orange dashed line represents the cross-country average relationship for menAAP countries only. Panel A covers the period 2010–13, and panel b covers 2019–22. note that not all end dates were enforced.
manner. It is equally important to shield decisions about continuation or termination from political influence and private interests. Corruption can enter industrial policy at any stage if governance is weak.
Timely monitoring during implementation also allows policymakers to adjust policies as they go. Initiatives with built-in capacity to course correct are likely to navigate challenges more effectively and durably than fixed policies (Venugopalan and Misra 2025).
The ability to design and implement industrial policy with a learning mindset depends on both the state’s technical capacity (expertise) and its statistical capacity (data). Technical capacity requires adequately staffed government agencies. Statistical capacity enables governments to track progress and evaluate policy outcomes. Policies should be extended beyond their termination dates only
when there is clear evidence of productivity gains that justifies continued support.
Industrial policy places considerable demands on statistical capacity, which MENAAP economies often lack. For example, 8 of 21 economies have not fielded a labor force survey since 2021. Business surveys conducted by national statistical offices are rare. Gatti et al. (2025a) found that only six economies in the Middle East and North Africa have adequate firm-level administrative data to evaluate firm dynamics. Yet the ability to assess the effects of industrial policy on employment and private-sector performance is essential for sound decision-making.
But data alone are not enough. Metrics that track the effects of policies—including the creation of high-quality jobs and new businesses—are essential, but evaluations must go beyond aggregate statistics to ensure that observed effects can actually
be attributed to the policy. For example, although the case studies report several positive outcomes, important questions remain about how those outcomes should be interpreted. Were they the result of a specific industrial policy or part of the industry’s natural evolution? Would outcomes have improved even without industrial policy? Were there unintended consequences? Did a given policy generate negative spillovers or divert resources from other sectors? And, ultimately, was the policy cost-effective— did its benefits justify its cost?
Evaluations are rare in the region, but a handful of cases illustrate what they can look like. The Tasdir+ program in Tunisia aimed to lower the cost of accessing foreign markets by awarding grants to business plans that required support for exporting or for establishing an affiliate abroad. Export support included visits to trade fairs, market research and marketing expenditures, online marketing, certification, and spending on regulatory compliance for products. Eligible expenses for setting up a foreign affiliate included technical assistance, the costs of operating and monitoring a foreign office, and expenditures on trademark registration in a foreign country. Program evaluators found a positive, statistically and economically significant increase in exports, with estimates ranging from 27 to 48 percent growth in foreign sales. However, there were no significant effects on the extensive margin of exporting—that is, on the variety of products exported or the number of destinations served—and there is little evidence that these would have differed whether or not a firm received assistance. In other words, Tasdir+ increased the scale of exports but not the range of destinations or products exported. Another example from Tunisia is the Export Market Access Fund (FAMEX), a matchinggrants program that combined market access support with technological upgrading. FAMEX firms experienced faster growth and greater diversification than firms outside the program, but these effects disappeared after three years, possibly because product quality did not improve (Cadot et al. 2015).
Another Tunisian example is the evaluation of wage subsidies for the country’s high-tech industries. Tunisia’s Start-Up Act aims to foster innovative firms through a bundle of incentives
(Ali, Cali, and Rijkers 2025), including tax incentives in the form of social security contribution coverage and profit tax exemptions, eased foreign currency restrictions, and simplified customs procedures. For firms less than a year old, the program may also provide a stipend to support up to three founders who have no other employment. Evaluations show that firms in the Start-Up program were 18 percentage points more likely to survive than nonparticipants through the end of the sample period in 2022, employed two more workers, and had a wage bill that was 69,000 Tunisian dinars (US$23,000) higher. The program did not have a detectable effect on profits.
Policies in Pakistan have also been evaluated for two large export-finance support operations (Defever, Riaño, and Varela 2025). The Export Finance Scheme (EFS) and the Long-Term Finance Facility for Plant & Machinery (LTFF) provide loans at subsidized interest rates to help Pakistani exporters finance working capital and the purchase of machinery and equipment, respectively. Both subsidy programs had large and positive effects on the export performance of recipient firms. The growth rate of export sales for firms using EFS to finance working capital was 11.5 to 20.1 percentage points higher than it would have been without the subsidy. LTFF, which subsidizes investment in physical capital, increased export sales growth by 7.9 to 31.1 percentage points above what would have occurred in the absence of the scheme. The results also show that both subsidies had a significant, though smaller, positive effect on growth along the extensive margin.
In the case of Sialkot, although the soccer ball cluster succeeded in several respects—including increased exports and a larger number of firms in the industry—some elements of the industrial policy would have still benefited from evaluation. For example, the technology used by most firms in the cluster changed little over a 30-year period (Raza 2016). A study by Atkin et al. (2017b) showed how misaligned incentives within firms led employees to resist new technology. Moreover, independent initiatives by private firms make it harder to determine how central industrial policies were to the cluster’s success. Only when evaluation is built into the design
of industrial policy can outcomes be attributed with confidence to specific policies rather than to privatesector initiatives.
Industrial policies often do not work, and when they do not, course correction is essential. For example, industrial policies that sought to protect Pakistan’s sugarcane industry from competition have been found to create an inefficient industry (World Bank 2022a). The government is now taking steps to shift the sector from extensive state intervention toward a market-based framework, with pricing, trade, and investment decisions guided by market signals. Minimum price supports will be abolished, and farmers will have full discretion over sugarcane cultivation, including the choice of varieties and planting zones. The reform would also lift long-standing prohibitions on sugar imports and exports, eliminate subsidies for sugar exports and mill-specific export quotas, and remove the ban on establishing new sugar mills.
Jobs as an objective or as a welcome by-product of industrial policy
Jobs are an important consideration when it comes to industrial policy in the region. All 19 NDPs cite the need to create job opportunities as a key objective. The NDPs identify low employment, and education and skills mismatches as key challenges and concerns. MENAAP countries, like those around the globe, focus on labor-intensive sectors such as tourism and agricultural commodities.
Jobs were one of the key targets in the Moroccan auto sector. In 2014, the government and AMICA set overall job targets for 2020 and specific job objectives for each subsector. The private sector committed to generate 66,500 total jobs (Malouche and Partow 2019). By 2017, wire harness and batteries subsectors had exceeded their targets, and both the interior and the seating and metal stamping subsectors had more than twice as many workers as they did in 2014. Furthermore, Moroccan automotivesector industrial policies balanced skills-training and capital investment subsidies.
The quality of the workforce matters, too. Enterprise surveys show that an inadequately educated work-
force is a key hindrance for firms. In six of 13 MENAAP economies, more than 20 percent of surveyed firms report an inadequately educated workforce is a severe or major constraint to operations. Some industrial policy tools directly address a skills gap. For example, the United Arab Emirates built a regional pipeline of digital talent by offering courses and upskilling STEM graduates (those who studied science, technology, engineering, and mathematics) to become AI talent.
In the tourism sector, Egypt’s multipronged industrial policy strategy aims to enhance competitiveness and attract investment. Job creation is an important by-product of this policy approach. Although no study directly evaluates the causal impact of industrial policy instruments on job creation and job quality within the tourism sector, available evidence indicates that tourism generates substantial growth dividends for Egypt. In particular, the sector exhibits higher value-added and employment multipliers than in peer countries. Still, international comparisons indicate that Egypt’s tourism sector has room to improve in terms of sustainability and, especially, inclusiveness, reflecting persistent gender gaps and limited female participation in the labor market (World Bank 2023b).
Indirect job creation in the tourism sector in Egypt also is limited, indicating that there are many opportunities for the tourism sector to strengthen links with such other industries as food, maintenance, marine services, crafts, and digital solutions. (World Bank 2023b).
Employment growth in the four sectors most often targeted in NDPs—tourism, chemicals, heavy manufacturing and agriculture—has more often than not been lower than total employment growth (figure 2.16). Tourism, the sector most often targeted, grew in all four countries analyzed, although from a low base coming out of the COVID-19 pandemic. In Egypt and the United Arab Emirates, employment growth in the tourism sector outpaced overall employment growth.
But agriculture employment grew slower than the aggregate in Egypt and Pakistan. Low employment growth in agriculture might be one of the reasons
FIGURE 2.16 Annual employment growth in targeted sectors
magnitude to that of other emerging market and development economies (EMDEs; figure 2.17). Disaggregating into pre- and post-COVID subperiods, however, reveals a more nuanced picture. In the pre-COVID period, there is a negative association between lagged sectoral employment and the share of industrial policies directed at a given sector. In the post-COVID period, by contrast, industrial policy targeting in MENAAP countries is more strongly associated with baseline sectoral employment than in other EMDEs. A 1 percentage point increase in lagged sectoral employment is associated with approximately a 0.4 percentage point increase in the share of industrial policies targeting that sector—equivalent to a 2 percent increase relative to the mean. Strikingly, the estimated coefficient for MENAAP countries in the post-COVID period is nearly three times that of other EMDEs.
Source: International Labour organization (ILostAt).
Note: data of employment by economic activity (IsIc level 2) were used. start and end dates for each growth period are listed below Iso3 country codes. the following IsIc codes are used to define each sector. tourism: 51, 55, 56, and 79; Agriculture: 01 and 03; chemicals: 20; heavy manufacturing: 27, 28, 29, and 30. total refers to total employment across all sectors, not only those listed. IsIc = International standard Industrial classification.
why the sector has drawn the attention of policymakers, while the impacts of industrial policy have not yet materialized.
Jobs are not merely by-products of industrial policy; they can be deliberate objectives. Policymakers can target sectors with higher employment multipliers to maximize job creation. Consistent with this view, many NDPs in MENAAP explicitly identify job creation as a core objective of industrial policy.
However, it is unclear whether industrial policies in MENAAP and elsewhere are effectively targeting the sectors that are most likely to create more jobs and boost employment. Figure 2.17 examines the association between lagged sectoral employment (2015–17) and subsequent sector-specific industrial policy announcements over the following eight years. Taken as a whole, the association between lagged sectoral employment and industrial policy targeting is positive—meaning that sectors with higher employment growth are targeted more frequently—in MENAAP countries and similar in
FIGURE 2.17 Association between sectoral employment and share of sector-specific industrial policies in MENAAP countries versus other EMDEs
Pre-COVID Post-COVID
Sources: International Labour organization (ILostAt) and global trade Alert (gtA) data set.
Note: covId = coronavirus disease 2019; cPc = central Product classification; emdes = emerging market and developing economies; gtA = global trade Alert. bars represent coefficient estimates from a linear regression of the share of sectorspecific industrial policies on lagged sectoral employment rates. the menAAP coefficient reflects the total marginal effect for menAAP countries, computed as the sum of the baseline employment share coefficient and the interaction term between the employment share and the menAAP dummy. the main right-hand side variable is sectoral employment, measured as the share of individuals working in a given sector as a percent of total national employment, using the latest available year for each country between 2015 and 2017. the dependent variable is the share of industrial policies targeting a given 1-digit cPc sector, defined as the percent of all gtA announcements in a country falling within that sector over the 8 years following the employment observation. the “overall” estimates cover the full 2016–23 period, while “Pre-covId” and “Post-covId” estimates are restricted to 2016–19 and 2020–23, respectively. All regressions include sector fixed effects, a menAAP country dummy, and an interaction term between the menAAP dummy and the sectoral employment share.
Conclusion
Over the past two decades, the MENAAP region has experienced persistently weak growth and underperforming labor markets—with low participation and high unemployment, especially among youth and women—driven in part by a low-productivity private sector. Many economies also face a structural diversification challenge: Oil and gas dominate exports across both GCC high-income countries and developing oil exporters.
In response, governments have increasingly turned to industrial policy, often channeled through SWFs and SOEs. While such policies can address market failures, they are less effective when deeper constraints—macroeconomic weaknesses, governance gaps, and ineffective institutions—are binding.
Moreover, many first-choice industrial policy tools are bandwidth-intensive, a mismatch in countries with limited administrative capacity, particularly middle- and low-income economies in the region. Effective strategies require a tailored, capacity-aware approach, with clear objectives and rigorous evaluation to support a “learning state”: knowing when to exit, when to taper, and when to extend support. Although industrial policies can create jobs in specific instances, they should be pursued with caution when job creation is the primary objective.
Annex 2A Case studies
case study 1: becoming a digital dubai
Dubai, intent upon diversifying its economy, made becoming a major hub in the global digital economy a centerpiece of its development strategy. The high-income emirate decided to leverage its strategic location and advanced infrastructure to capture the opportunities presented by the global shift toward a knowledge economy.
UAE Vision 2021, the NDP put in place in 2010, reinforced this ambition by identifying digital infrastructure as a national priority and setting out the goal of “a competitive economy driven by knowledge and innovation” (UAE Government 2010).
Dubai has deployed a series of industrial policy instruments over the past decades to foster the development of a digital economy. Its progress toward digitalization is clear. By 2022, the digital economy accounted for 9.7 percent of the emirate’s GDP, and the government’s target is to reach 19.4 percent by 2031 (UAE Government 2022). ICT activities alone contributed about 4.7 percent of Dubai’s GDP.9
In regard to the three factors that Fernandes and Reed (2026) indicate as necessary for a government to feasibly deploy industrial policy tools—bandwidth, country market size, and fiscal space— Dubai features quite well.
Dubai has a large government bandwidth. It built the Executive Office of Dubai in 2003 as a central strategic “think tank” to monitor and coordinate industrial policy. Governments that have sizeable bandwidth can deploy so-called first-choice industrial policy tools—those which use public inputs to fill in missing development components. Dubai used a full range of these targeted public inputs: It created industrial parks to concentrate technology firms and their suppliers; it built quality infrastructure to make it easier to do business; it helped create training centers and other programs to upgrade worker skills; and it extended market access assistance.
Dubai has a small domestic market of approximately 10 million people, which makes trade-related instruments such as import tariffs or local-content requirements largely ineffective in fostering a new industry,
But Dubai commands large fiscal space, underpinned by SWFs and SOEs. That budget flexibility enables the government to make sustained public investment and direct subsidies where needed.
9Government of Dubai: “This sector recorded growth of 4.8 percent during the first nine months of 2025, reaching a value of AED 16.6 billion and contributing 4.7 percent to GDP.” https://www. digitaldubai.ae/newsroom/news/dubai-s-economy-records-aed355billion-gdp-in-first-nine-months-of-2025-posting-4.7-growth.
Industrial policy initiatives in support of the digital sector
Creating industrial parks
One of Dubai’s most important policy instruments is its network of purposefully built digital free zones. The flagship project, Dubai Internet City, was established in 1999 and offered high-capacity fiber connectivity, permitted 100 percent foreign ownership, and gave firms a corporate tax exemption for 50 years from the start of the business. These benefits attracted Microsoft, Oracle, Cisco, Google, and IBM as early anchor tenants, which generated the clustering effects and specialized labor pools that pull in successive waves of investment. This cluster model was extended to neighboring industrial parks: Dubai Silicon Oasis for hardware and R&D; Dubai Design District for creative and digital media; and the Dubai AI & Web3 Campus for frontier AI and distributedledger applications. Each park extended the cluster logic of Dubai Internet City into adjacent technology domains and deepened the overall ecosystem.
Investment in digital quality infrastructure
Industrial parks require world-class connectivity to function as solid regional hubs, and the government has invested in successive infrastructure layers as technology demands evolved. Starting in the 1980s, the state telecom operator Etisalat began to deploy a nationwide fiber-optic backbone (the infrastructure that is the foundation of the internet). Dubai achieved 100 percent digital switching by 1989, ahead of the United Kingdom (1997) and the United States (2000s), which gave the emirate an early and durable connectivity advantage. More recently, Moro Hub’s solar-powered data centers (2018) provided green computing capacity for regional workloads, and a US$545 million partnership between the Emirates Integrated Telecommunications Company (better known as “du”) and Microsoft (2026) is preparing a cloud infrastructure that is built specifically for AI workloads. These investments are meant to ensure that the physical and digital infrastructure underpinning Dubai’s free zones meets the operational requirements of the globally integrated firms they are designed to attract.
Skills development and global talent attraction
Attracting high-value headquarters of technology firms requires a supply of specialized talent, such as data scientists and engineers. The One Million Arab Coders initiative Dubai started in 2017 provided free coding and software training to a million young people across the region, which built a broad regional talent pool. So-called Golden Visas were extended to foreign software engineers and data scientists, providing them with the security of a longterm residency.
The results are measurable. The computer programming share of total employment in the United Arab Emirates was 0.2 percent in 2017; by 2023, it had risen to 1.6 percent (figure 2A.1). In absolute terms, 15,000 of 7.2 million total jobs in 2017 were in computer programming. By 2023, there were about 135,000 computer programming jobs of a total of 8.2 million. That surge in programmers provided a critical talent pool for the digital economy.
Market access assistance and foreign direct investment
Dubai aimed to attract foreign direct investment (FDI) to its hubs, the NextGenFDI initiative (2022) offered globally operating technology companies fast-tracked licensing, visa facilitation, and concierge setup support, hoping to persuade 300 firms to move their regional headquarters to Dubai in the first year. Dubai Global (2022) matched international startups with local corporate partners
FIGURE 2A.1 Jobs in computer programming (percent of total employment)
Source: International Labour organization (ILostAt database).
and procurement opportunities. The Expand North Star summit (2023) generated deal flow and supported Dubai’s profile as an entry point for technology investors and founders across the Middle East, Africa, and South Asia. The 2025 edition of the summit attracted 2,000 startups and 1,200 investors. Complementing these promotion programs, Comprehensive Economic Partnership Agreements have connected Dubai with 11 countries since 2022, helping reduce market access barriers for digital services trade and embedding Dubai within global technology supply chains (IMF 2023).
Government procurement as demand creation
By committing to digitalize all public services, Dubai government effectively became a primary buyer, creating guaranteed demand for enterprise software, systems integration, and digital services from the private technology firms it had attracted to Dubai.
The E-Government Mandate (2000) required all public departments to digitalize services, immediately generating demand for enterprise software and systems integration for tenants in Dubai Internet City. The action boosted the United Arab Emirates’ score on the UN E-Government Development Index so much that it surpassed the United States. The Dubai Data Law (2015) built on this foundation by mandating data publication and sharing across government entities. The Paperless Strategy (2017) eliminated physical documents from all government transactions by 2021, forcing a largescale information technology upgrade that, as a byproduct, produced data sets that companies could use to train their AI models.
Production and innovation subsidies
Alongside procurement-driven demand, the government has deployed financial instruments to stimulate innovation at the firm level. The Dubai Future District Fund (DFDF 2021) co-invests with private capital in deep-technology startups, filling a gap in early-stage financing that typically deters private investors from high-uncertainty innovation. Cloud credits available to certain startups reduce the cost of computationally intensive experimentation, which lowers the barrier to entry for resourceconstrained firms at the frontier of AI development.
The government has also sought to generate innovation demand from within its own institutions. The Dubai 10X program (2017) tasked each government entity with launching “moonshot” initiatives to place Dubai 10 years ahead of comparable global cities. Forty-two projects were initiated across a wide range of domains, including Police Without Policemen, an AI-powered predictive policing initiative; Digital DEWA, an automated utility grid management system; and Dubai REST, a platform for fully digital real estate transactions.
Tax and ownership incentives—such as permitting 100 percent foreign ownership and exempting businesses in Dubai Internet City from taxes for 50 years—help remove the two barriers most commonly cited by technology multinationals when they evaluate potential locations for regional headquarters.
Beyond the free zones, regulatory modernization can also reduce the legal uncertainty that often deters firm entry in fast-moving technology sectors. The Virtual Assets Regulatory Authority (VARA 2022) created a dedicated licensing framework for digital assets, and Web3 provided the regulatory clarity for an initial cohort of global crypto and blockchain firms. The Dubai International Financial Centre performs the equivalent function for fintech by allowing live product testing under regulatory supervision before full licensing.
Digital economy outcome
The United Arab Emirates ranks first globally in AI adoption; 64 percent of its working-age population was using generative AI tools by late 2025, compared with 60.9 percent in Singapore and 28.3 percent in the United States (Microsoft 2026). According to Dubai’s Ministry of Economy, its total digital services trade, which includes both exports and imports, reached AEDirham 345 billion, onethird of all United Arab Emirates’ services trade.10
Nevertheless, there are issues to still address in order to realize the United Arab Emirates’ goals in
10Dubai Ministry of Economy: https://www.wam.ae/en/article/ bj9uwlt-uae-foreign-trade-reaches-aed523-trillion-2024.
leading digital development and AI innovations at a global level.
The United Arab Emirates remains, still, among high-income countries, an expensive location for data transmission. The telecom duopoly (e& and du) keeps data transmission costs high, which is a critical input cost constraint on the computationally intensive AI services. Availability of a critical mass of specialists with advanced digital skills, AI skills, and deep experience in people and project management is also a core constraint that can be solved over time through migrant talent attraction, investments, and strengthening the United Arab Emirates as a global destination for quality tertiary education. Currently, the technology firms attracted to Dubai are tilted more toward regional sales, using code that was written elsewhere, which raises concerns that the large data centers being built in the region do not generate knowledge spillovers but serve only as warehouses for computation.
Dubai’s industrial policy for the digital economy has demonstrated a well-designed sequence of policy tools and contributed significantly to the economic diversification with a highly competitive digital infrastructure and meaningful technology services presence. But data costs and limited innovation capacity can still retard Dubai’s plans. The emirate must generate durable domestic spillovers for local firms, locally trained workers, and locally developed technologies.
case study 2: tourism and industrial policy in the Arab Republic of egypt
Tourism has long been a cornerstone of Egypt’s economy, providing foreign exchange, supporting millions of jobs, and driving infrastructure investment. In recent years, the government has actively shaped this sector through industrial policy interventions, including public investment in infrastructure expansion, regulatory reforms, destination-specific development strategies, and sustainability-focused initiatives.
As part of its National Tourism Strategy, Egypt aims to increase annual tourist arrivals significantly— with targets as high as 30 million visitors per year
by 2031, from over 13 million in 2019—and elevate the quality and sustainability of its tourism ecosystem.11
Industrial policy covers the services sector in addition to manufacturing. This case study focuses on tourism along the Red Sea. Unlike traditional industrial sectors, tourism is highly place-based, service-oriented, and dependent on the quality of ecosystems such as heritage assets, cities, connectivity, and local services. Egypt’s multipronged tourism industrial policy has four key levers that work together to expand capacity and improve connectivity:
• First, serviced land (which has all the infrastructure—such as water, sewers, and electricity—needed for immediate construction) and coordinated site development are advanced through state-backed public-private projects that concentrate investment in priority coastal zones and expand hotel capacity.
• Second, enabling infrastructure—airport capacity upgrades and improved road corridors—is expanded to link the Red Sea to domestic and international markets complemented by the Aviation Incentive Program to attract new markets and strengthen connectivity.
• Third, sector-specific workforce development, led by the Ministry of Tourism and Antiquities (MoTA), which has trained about 43,000 workers in hospitality, food safety, and sustainable tourism, through public-private training initiatives and multisector partnerships.
• Fourth, targeted incentives and market-access measures, such as streamlined e-visas and visas on arrival, promotional campaigns, and tourismtargeted, government credit programs to support building additional accommodations.
The Red Sea resorts are emblematic of Egypt’s coastal tourism revival. Coastal tourism is estimated to account for about half of Egypt’s tourism, 11https://sis.gov.eg/en/media-center/files/2025-yearender-the-year-ofthe-gem/.
which attracts a total of 13.6 million visitors and contributing about 12 percent to Egypt’s GDP in 2019 (World Bank 2022b).
A
multipronged industrial policy approach for tourism
Egypt’s tourism industrial policy adopts a multipronged approach to boost competitiveness and attract investment. In terms of institutional landscape, in addition to MoTA, key entities play a significant role in shaping Egypt’s tourism development, including the Tourism Development Authority, the New Urban Communities Authority, and other ministries involved in heritage, urban development, and infrastructure.
Serviced
land and coordinated site development
One of the main levers to expand tourism along the Red Sea coast is the provision of land that is ready to build on and the government’s involvement in site development. The Monte Galala Towers and Marina project exemplifies serviced land and coordinated site development through a state-backed public-private partnership aimed at expanding hotel capacity, upgrading transportation networks, and developing new tourism attractions. Set to begin in the second half of 2026 and take seven years to complete, the project involves a 10-tower development on 470,000 square meters along the Gulf of Suez. Developed by the private company Tatweer Misr in partnership with the Ministry of Housing and other state bodies, the initiative has a projected cost of about 50 billion Egyptian pounds (US$1.07 billion).12 The project reflects Egypt’s strategy to diversify tourism hubs and extend highend offerings beyond traditional sites, such as Luxor and Cairo.
Investment in enabling infrastructure
Because more than 95 percent of tourists arrive by air, Egypt aims to strengthen international air connectivity and improve domestic transport links.13
Aviation incentives and route expansion. MoTA launched an Aviation Incentive Program in late 2024 to attract airlines from priority source markets and stimulate charter operations. The program offers targeted incentive packages to promote travel to specific destinations and during low-demand periods, such as summer routes to Luxor and Aswan. Initially planned to run through April 2025, it was extended for the May–October 2025 season, with adjustments to sustain growth in passenger volumes and seat capacity.14
A number of international carriers have expanded service to Egypt under this framework—including 14 weekly direct flights from multiple UK cities to Sharm El-Sheikh and Hurghada that added about 169,000 seats in the first year. Other airlines added Egyptian destinations such as Marsa Alam and Marsa Matrouh.
Airport infrastructure and public-private partnership reform. In March 2025, the International Finance Corporation (IFC) signed an advisory agreement with the Government of Egypt to support public-private partnerships (PPPs) in the airport sector. The project includes transaction advisory services for a PPP at Hurghada International Airport, about 400 km southeast of Cairo, and a strategic assessment of private-sector participation models for 10 additional airports. Hurghada was selected because it is a primary gateway to the Red Sea and is Egypt’s second-busiest airport after Cairo International Airport.
Domestic connectivity and multidestination travel. Enhanced road construction complements the aviation investments. An upgraded desert corridor between Luxor and Hurghada strengthens links between coastal and cultural tourism hubs, facilitating itineraries that combine Red Sea beach tourism with Nile Valley heritage destinations. Hurghada is now connected to 86 destinations across 25 countries via nonstop flights operated by 36 airlines.
14Earlier charter incentive programs existed in 2014 and 2015. See, for instance: https://topaviation.com/pages/ArticleDetails.aspx?aid=c2c22d7f7af0-461b-8071-ca6bd4092093#:~:text=For%20direct%20 incentives%20on%20occupied,be%20submitted%20by%20the%20 companies.
Climate resilience and green infrastructure. Because of the tourism sector’s exposure to coastal and marine climate risks, environmental resilience has become a core component of enabling infrastructure. Under the NDP Egypt Vision 2030, climate adaptation and environmental standards are integrated into tourism planning, particularly along the Red Sea, where Egypt’s tourism climate risk index reached 0.56 in 2023 (above the national average of 0.52). Rising temperatures, coral bleaching, and coastal erosion threaten the region’s core assets, making adaptation in siting, building codes, reef management, and visitor regulation central to sector policy (World Bank 2024a).
Government-led “greening” initiatives include regulatory measures such as bans on single-use plastics and strengthened protected-area management. Complementary certification and standards programs, including internationally recognized certifications such as Green Star for hotels and Green Fins for marine tourism—alongside digital tools such as the Egyptian Sustainable Tourism Portal—support energy efficiency, waste management, and biodiversity protection (Yoshijima et al. 2024; World Bank 2024b).
Sector-specific workforce development
MoTA has made personnel training a core element of tourism-sector development—along with regulatory reform and infrastructure upgrades. Thousands of tourism workers get professional training each year. In 2024, about 43,000 workers were trained in such fields as hospitality, food safety, and sustainable tourism.15
In addition to state-led training programs, publicprivate collaborations help expand workforce capacity. For example, joint initiatives with industry associations and private companies—such as the Al Ahram Beverages Company (ABC) Hospitality Academy and Rhythm Hospitality Training Consultancy—aim to train hundreds of hospitality professionals in guest experience, operations, and service excellence for such key destinations as
Cairo, Sharm elSheikh, and Hurghada. The training includes two specialized training tracks, including an internationally recognized certification from the UK Institute of Hospitality. Since 2022, ABC has trained more than 4,000 food and beverage professionals across Egypt.16
Moreover, multisectoral partnerships supported by international organizations—such as the European Bank for Reconstruction and Development (EBRD) working with the MoTA and the Egyptian Tourism Federation—seek to establish sector skills councils and frameworks to strengthen market-relevant skills and align training with evolving industry needs.17
Market access measures and targeted incentives
With physical goods, market access policies are about taking firms to their clients; when it comes to tourism, they are about bringing prospective visitors to destinations and services on offer. With support from the Central Bank of Egypt, these initiatives were paired with financial incentives to develop and upgrade hospitality infrastructure.
Promotional partnerships and demand stimulation. MoTA has deployed coordinated promotional campaigns with international airlines and digital travel platforms to position Egypt across beach, cultural, religious, and sports tourism segments. They include targeted media campaigns in priority markets, documentary and destination-branding films, and expanded digital marketing through a newly contracted international firm managing tourism websites and social media channels.18
Regulatory facilitation: Visa liberalization. Visa reforms—including expanded e-visa systems and visas on arrival for selected nationalities—reduce entry barriers and transaction costs for travelers. As indirect industrial policy tools, these regulatory measures stimulate demand without requiring
direct fiscal outlays, improving Egypt’s competitiveness by lowering uncertainty and simplifying travel planning.19
Financial incentives for capacity expansion. In 2024, the Central Bank of Egypt, funded by the Ministry of Finance, launched a tourism credit facility offering EGP 50 billion in favorably priced loans to support hotel construction, renovation, and the reopening of nonoperational properties. By reducing financing costs in a high-interest environment, the scheme operates as a targeted financial subsidy to accelerate accommodation expansion and strengthen sector capacity.20
Tourism-sector performance
This case study does not assess the impact of the various policy instruments on the sector’s performance. Rigorous impact evaluation would need to be carried out to evaluate the effectiveness of the various tools implemented. In addition to sectorspecific characteristics, the evaluation of industrial policy in the context of the tourism sector would need to take into account additional considerations such as spatial integration, inclusion, and environmental sustainability. Egypt has become the second-largest destination in Africa by several metrics—behind Morocco in visitor volume and behind South Africa in international leisure visitor arrivals and spending. The sector is particularly exposed to volatility, given its sensitivity to domestic, regional, and external developments. Although Egypt still faces the economic effects and geopolitical risks of regional conflicts, inbound tourism in late 2025 was more resilient than in the years before the COVID pandemic in 2020.
In 2024, according to data from the Ministry of Planning and Economic Development, accommodation and food service activities accounted for about 4 percent of GDP. This share has been increasing since 2020, partly reflecting a postCOVID-19 recovery.
But if the tourism sector has progressed toward its growth goals, it still has some distance to go in other areas.
In 2024, the Egypt Travel and Tourism Development Index gave the industry a 4 of 7, citing needed improvement in environmental sustainability, infrastructure for mobility within (rather than between) destinations, and the quality of tourism services (World Bank 2024b).
Moreover, Egypt’s tourism sector—hotels, restaurants, and recreation—is less sustainable and inclusive than those in other countries. While larger or internationally exposed players in Egypt have invested in sustainability systems and accreditation, overall adoption remains limited. The industry is a mixture of newer and long-standing operations, and many smaller and older hotels struggle to meet new expensive sustainability grading criteria. Programs like the Green Star Hotel certification (over 180 hotels) and IFC’s partnerships in El Gouna show progress, yet overall investor awareness and understanding of sustainability’s business benefits remain low.
But when it comes to inclusion, Egypt ranks much lower than most countries (World Bank 2023b). In 2023, 47 percent of tourism-sector workers in Egypt were employed in rural areas (ILO 2026). This is more than the global average of 30 percent in 2023. In both cases, tourism employment in rural areas has been gaining relevance since 2016. On the contrary, tourism in Egypt is not creating inclusive opportunities for women. In 2023, just 3 percent of sector employment consisted of female employees. This percentage has been decreasing since 2016—most likely influenced by the COVID19 downturn—and is much lower than the global average of 46 percent women employment and also lower than some regional peers such as the Islamic Republic of Iran (7 percent tourism women employment in 2022), Lebanon (12 percent tourism women employment in 2019), or the United Arab Emirates (19 percent tourism women employment in 2023), indicating room for improvement.
In sum, Egypt’s tourism sector demonstrates strong growth dividends—high value-added and job multipliers and a relatively higher share of high-skilled
jobs than peers. Yet it creates fewer indirect jobs than tourism sectors in its peers. Strengthening local supply chains (food, crafts, maintenance/repair, boats, and digital services) would increase the sector’s performance (World Bank 2023b). Moreover, horizontal reforms are essential complements to any sector-specific intervention, addressing macro-level constraints (foreign exchange distortions, high inflation, and limited private-sector credit) alongside microeconomic fundamentals, the role of the state, the business environment, and human capital.
case study 3: the making of a moroccan auto industry
Around 1960, Morocco began to pursue import substitution industrialization—producing goods locally instead of importing them and relying on such industrial policy tools as import bans and local component requirement to nurture infant industries (WTO 1996).21 A SOE, SOMACA (Société marocaine de la constructions automobiles) was founded in 1959 to assemble vehicles for the local market (Hahn and Vidican-Auktor 2017).
But Morocco’s protected manufacturers, including SOMACA, never thrived.
In the early 2000s, the Moroccan government pivoted from an import substitution model to a comprehensive industrial strategy that embraced competitive industries. The country’s new industrial policy targeted six industries and, like the old one, one of them was the automotive industry.
It became a centerpiece of a succession of NDPs— beginning in 2005 with the Plan Emergence and followed by the National Pact for Industrial Development (PNEI) for 2009–15, and the Industrial Acceleration Plan (PAI) for 2014–20. The PAI prioritized building industrial ecosystems—that is, select subsectors that surround a lead enterprise.22 Policies were tailored to each
22Eight ecosystems were set up in the auto industry: Renault, Stellantis, wiring, interior and seats, metal pressing, batteries, heavy vehicles and
ecosystem to provide targeted support and to encourage industrial integration.
Morocco also signed free trade agreements with various partners, most importantly with the European Union in 2000, which liberalized trade in industrial products and would open up a large new market for Moroccan-made cars. By the end of 2023, the country had 10 regional trade agreements and 53 bilateral investment agreements in place (WTO 2024).
French automaker Renault responded to the Moroccan pivot in industrial strategy, vastly expanding its investments in Morocco and becoming the majority shareholder of SOMACA in 2005. That decision was a turning point for the automaker, which started to export Dacia Logan models in 2007. In 2012, Renault invested 600 million euros in a production site near Tangier that could make 400,000 vehicles annually—quadrupling its then-existing capacity. Production took off. Vehicle output grew 14.1 percent per year during 2012–22, up from 7.3 percent in 2000–10. Automotivesector production value increased by more than 30 percent, and value added more than doubled between 2019 and 2022 (figure 2A.2).
Renault’s investment attracted multinational component suppliers and another major OEM, PSA Peugeot Citroën (now Stellantis). According to AMDIE, Morocco now hosts more than 270 automotive suppliers, compared with 35 in 2000. In 2022, the auto industry accounted for 2.6 percent of GDP in value added and 8.7 percent of GDP in total production. Autos accounted for 19.4 percent of total exports. More recently, Morocco is developing the capability to produce electric vehicles—including a complete value chain for battery production and chips for electric cars. The modest level of electric vehicle production in Morocco is expected to rise significantly (Mendez Parra et al. 2025).
industrial bodywork, and motor and transmission (Ministry of Investment, https://www.mcinet.gov.ma/en/content/industry-0/automotive-0).
Industrial policy instruments in the NDPs were crucial to the growth in the automotive sector. The measures included investment subsidies, industrial parks, special economic zones, and workforce training support. Companies themselves played an active role in policy design and implementation through the business association, AMICA.
Investment subsidies
Investment promotion through capital investment subsidies began in 2000s and remained a key feature under the PNEI and PAI frameworks. The Hassan II Fund for Economic and Social Development gives financial assistance to companies making industrial investments in the country (Achy 2013). The automotive sector is eligible for grants from the fund, which finances 30 percent of the cost of buildings and 10 percent of capital equipment expenditures (WTO 2009). The Renault plant benefited from substantial public subsidies, including a 200million-euro grant from the Hassan II Fund and an additional 105-million-euro financing line from three Moroccan banks (Hahn and Vidican-Auktor 2017). Investments to develop industrial ecosystems were funded by the Industrial Development Fund under the PAI development plan and then by the Industrial and Investment Development Fund under the recent Industrial Recovery Plan (PRI, which covered 2021–23). Automotive suppliers and specialized manufacturers receive support for
up to 10 percent of an investment in a site located within a free zone.
Industrial parks and economic zones
Establishing industrial clusters was a critical component of both the PNEI and PAI framework. Clusters offer both the concentrated infrastructure needed for production and distribution operations (features of industrial parks), and tax and customs benefits, efficient customs procedures, and unconstrained capital flows (features of special economic zones).
Industrial zones were established in Tangier, Kenitra, Casablanca, Rabat, and Oudja. Around Tangier, the zones are located within the TangerMed Industrial Platform, a network of free zones, and the Tanger-Med port, which ranked fifth globally in the Container Port Performance Index in 2024 (World Bank 2025). The platform hosts a variety of export-oriented manufacturing sectors, offering advanced logistics, engineering, and utility services. If an investor in a free zone exports at least 70 percent of its production, it can benefit from more flexible procedures and fiscal aids—including (1) corporate tax exemption for the first 5 years, followed by a low tax rate of 8.75 percent for the next 20 years, (2) professional and urban tax exemptions for 15 years, (3) value-add tax exemptions, (4) free repatriation of capital and profits, and (5) simplified customs procedures (Malouche and Partow 2019).
Türkiye
A. Number of vehicles produced in Morocco and select countries, 1999–2024 B. Production and value added in the Moroccan automotive sector, 2019–2022
of dirhams
Training and skills development
A pillar of Morocco’s automotive-sector industrial policy is the specialized training programs it offers to create the types of skilled workers the auto industry needs. Four specialized professional training centers operate under public-private partnership model—three managed by AMICA and one by Renault. The centers provide practical training through apprenticeships and company-specific training. The programs are developed in cooperation with the industry to ensure they teach the skills required by the sector. Workforce training through the centers is subsidized by the state—up to 6,000 euros per person for the first year of employment, and a smaller subsidy is available for years 2 and 3 through the Hassan II Fund. Financial support can also be found through other programs, but the process to get it is bureaucratically cumbersome (Hahn and Vidican-Auktor 2017).
This model has produced a skilled workforce that adds to Morocco’s attractiveness as a manufacturing destination. One qualitative study found that companies, especially international ones, cited the quality of the workforce as one of the top three reasons for choosing Morocco, and no company reported having difficulties finding qualified employees. Companies in the study said that between 90 and 100 percent of employees were Moroccan (Hahn and Vidican-Auktor 2017).
Active private-sector involvement
The private sector is heavily involved in automotive industrial policy. The Ministry of Industry and Trade—the government entity responsible for the development and execution of industrial policy— works closely with private stakeholders through industry association, AMICA. AMICA commits the industry to the government’s industrial strategy, including the creation of ecosystems specified in the PAI. AMICA, in turn, provides inputs for government policy, such as setting sectoral targets and identifying key needs for the development of the industry and for attracting international companies. AMICA also plays a central role in workforce training.
Industrial policy has fallen short in value chains and technology
The industrial policy in the automotive sector was built around attracting foreign direct investment, including multinational OEMs and suppliers (Hahn and Vidican-Auktor 2017). Freund and Moran (2017) argue that this is an effective strategy for growing new sectors—finding a single or handful of large, first-mover investors that attract clusters of follower firms—thus transforming an industry and the export profile of a country. Indeed, a significant shift in Morocco’s export composition toward automobiles is reflected in measures of revealed comparative advantage, which placed Morocco fifth in the world in 2024 after major car manufacturers such as Georgia, the Slovak Republic, Japan, and Czechia.
But the extent to which the country’s industrial policy was responsible for attracting such investments is difficult to quantify. In a survey of multinational enterprises in the Moroccan automotive sector, firms said proximity to Europe and the qualifications and cost of the workforce were the two main factors in their decision to locate in the country (Alfaro-Moreno, Rivera-Galicia, and Bakkali 2024). Such industrial policy measures as sectoral strategies, free zones, quality of infrastructure, and tax incentives were also reported to have positive influence but were of less significance than geography and workforce quality. This suggests that, although industrial policies may have supported the country in leveraging its natural advantages, separating out the specific effects of these policies from other drivers of outcomes, such as proximity to key markets, is difficult. Moreover, data on the costs of policies, such as subsidies and infrastructure investments, are not available, which makes it hard to conduct a credible cost-benefit analysis.
Challenges remain in reaching all of Morocco’s industrial policy goals. The level of local integration remains limited. The industry had to import about 40 percent of the materials needed to assemble a vehicle in 2019 (Najib and Haddad 2024). A few studies, although dated given the continuous developments in the industry, show limited integration of
local companies into auto value chains. OEMs get parts and components either through direct imports or from tier 1 suppliers located in Morocco. But many tier 1 suppliers—those that directly supply OEMs—are local subsidiaries of international suppliers that import 80 to 100 percent of the inputs they supply auto assemblers (Hahn and Vidican-Auktor 2017). Value chains between these tier 1 suppliers and local tier 2 and 3 suppliers remain incomplete or weak.23 Local firms continue to face constraints such as restricted access to finance, capacity to meet quality standards, lack of scale and productivity to achieve international cost levels, and the general lack of capacity that can afflict firms starting in a new market (Malouche and Partow 2019).
Moreover, trade-in-value-added data from the Organisation for Economic Co-operation and Development shows that about 60 percent of the value of an auto exported from Morocco was created outside of the country in 2022 (figure 2A.3). Although this reflects Morocco’s downstream position in global value chains—similar to manufacturers in Czechia and the Slovak Republic—it also suggests limited integration with domestic suppliers. By contrast, about 60 percent of South Africa’s automotive export value is created domestically—over half of which originates in nonautomotive industries, which suggests that South African automakers are more integrated with adjacent domestic sectors than are manufacturers in Morocco.
Low value added has been noted as a weak point of the Moroccan automotive industry because much of what it does involves labor-intensive activities such as vehicle assembly and wiring (Malouche and Partow 2019). Najib and Haddad (2024) find that growth in value added between 2014 and 2019 was primarily driven by increased final demand rather than improvements in the value-added margin. However, value added per unit of output did show some increase over this period, suggesting a shift toward higher value-added activities in the Moroccan auto sector. Data from HautCommissariat au Plan show that value-added margin increased from 20 percent in 2019 to 30 percent in 2022.
Source: world bank calculations based on data from the trade in value Added (tivA) data set of the organisation for economic co-operation and development.
Note: “Foreign value added” is the value of imported intermediate goods and services that are embodied in a domestic industry’s exports. the value added can come from any foreign industry upstream in the production chain. “direct domestic value added” is the domestic value-added contribution made directly by an exporting industry to its exports. “Indirect domestic value added” is the value added originating from other, upstream, domestic industries that are incorporated in the exports of an exporting industry. “Re-imported domestic value added” is the domestic value-added content, which has been exported for the production of intermediate goods or services abroad and subsequently embodied in imports used in the production of exports. the automotive sector is defined by IsIc code 29: manufacture of motor vehicles, trailers, and semi-trailers.
Technological upgrading and transfer of knowledge to local firms is critical for the integration of local firms into the value chain and for a shift toward technology-based manufacturing. However, the Moroccan policy focus on technology acquisition through licensing or joint ventures appears to be limited (Hahn and Vidican-Auktor 2017). There is some evidence that points to technological upgrading and transfer of knowledge to local firms, but more is needed. Renault played a pivotal role in transferring knowledge and learning within the sector. In addition to its active role in training, the manufacturer monitors and offers assistance, as suppliers acquire standard certifications, and enforces high internal standards on products, which apparently have forced process changes in a supplier company. However, quality issues keep Moroccan firms from reaching a higher level in the automotive value chain.
case study 4: Pakistan manufactures soccer balls
They had been stitching soccer balls in Sialkot, Pakistan, for seven decades when the government took steps to the encourage the growth of an already-active industry. First around 1960, then
Domestic and foreign value added in gross exports in select automotive-exporting countries, 2022
again two decades later, authorities implemented tools that today would be recognized as part of an industrial policy that appeared to contribute to a golden age for Sialkot soccer ball makers.
In 1960, the government created a dedicated soccer ball manufacturing area and began to offer cheap land to encourage new firms to enter the business and established ones to expand. From the late 1970s to the mid-1990s Pakistan operated a taxrebate program to stimulate manufacturing exports (aimed at nontraditional exports). The soccer ball industry benefited, and it grew further—both in terms of sales and the number of firms.
Yet, it was an industry that by nearly all metrics should never have emerged in the late 19th century in what was then India. In Sialkot, like the rest of the subcontinent at the time, there was little interest in soccer. But if local demand was lacking, there were many occupying British soldiers garrisoned around Sialkot who played the sport. And one of them planted the seed of the industry by asking a local saddle maker to repair a soccer ball. The entrepreneurial saddler fixed the ball, then figured out how to use his leather-making skills to produce new ones. Soon he was making them for local British soldiers sick of waiting 8 months for deliveries from England.
Demand spread from soldiers in the Sialkot region to British troops across the subcontinent. Overwhelmed by demand, the saddler eventually engaged apprentices, who in turn founded their own businesses. After World War I disrupted English factories, the soccer ball makers that were clustered in Sialkot—in what is now the northeast of part of Punjab province of Pakistan—began to export to other British colonies.
Subsidized land and tax rebates encouraged growth
In 1960, authorities took steps to encourage the growth of soccer ball manufacturing—which was an anchor of what had become a broader sportsgoods manufacturing presence in Sialkot. The cluster in Sialkot contained the essential ingredients of a healthy industry—a deep labor pool and strong knowledge spillover, both of which had their roots in the saddler’s apprentices and ready access to specialized inputs. Indeed, in a survey conducted by Atkin et al. (2017a) more than a half-century later, five soccer ball manufacturers asserted that those three elements remained the most important undergirds of the Sialkot cluster (figure 2A.4).
After the government began to offer land at below market prices to new firms and those willing to expand operations in 1960, the number of manufacturers grew markedly. A total of 22 manufacturers had set up shops by the of the 1950s (including the saddle maker). In the ensuing two decades, another 41 firms started operations (Atkin et al. 2017a).24
The addition of the tax rebates on exports that permitted manufacturers to reclaim customs duties, sales tax, and excise paid on imported inputs used in export production appeared not only to increase the attractiveness of the industry but also stimulated foreign sales (Atkin et al. 2017a). Among firms still operating in 2010, more than half were founded in the 1980s and 1990s, the decades in which the export rebate program was active (32 manufacturers entered the business in the 1980s, and 66 did so
Source: Atkin et al. (2017a).
Note: Five sialkot firms were asked to rate the agglomeration force on a scale of 1–10, with 10 being the highest score of importance. the average of the scores was used to rank the causal elements.
24Atkin et al. (2017a) provide data on the number of firms established that identify soccer balls as their primary product. Data on firms going out of business or consolidating are not available.
FIGURE 2A.4 Dominant drivers of Sialkot’s soccer
in the 1990s). There was a pronounced acceleration of sporting good exports, of which soccer balls are an important component, that coincided with the tax rebate program (figure 2A.5).
Between 1955 and its peak in 1997–98, compound annual growth in soccer ball exports averaged 10 percent. At its peak in the late 1990s, 47 percent the of the soccer balls imported by the United States originated from Pakistan.25 In recent years, this market dominance has diminished, especially as competition from China has increased; in 2024, 16 percent of United States soccer ball imports and 15 percent of global inflatable-ball net exports originated from Pakistan. This is largely because the hand-stitched segment has been losing market share to machine-stitched balls, which tend to be lowerquality and are typically manufactured in China. But Pakistan continues to dominate the high-quality hand-stitched product category, including those used in such prestigious global sporting events as the World Cup and the Summer Olympics. The cluster continues to employ thousands of workers. By November 2011, Sialkot’s soccer ball cluster comprised approximately 135 manufacturing firms that employed about 12,000 workers. Another 24,000 stitchers made soccer balls at stitching centers or home-based outsourcing (Akin et al. 2017b).
Who takes the credit? Industrial policy, private-sector efforts, or both?
Despite the long-run success of the Sialkot soccer industry, how much of a role industrial policy played is uncertain. In the taxonomy of industrial policy devised by Fernandes and Reed (2026), Pakistan clearly engaged in industrial policy making—taking actions aimed at influencing activity in a specific industry. Creation of a dedicated
FIGURE 2A.5 Pakistan’s exports of sporting goods
25The United States is the largest importer of soccer balls and is one of the few with data that disaggregate inflatable sports balls by type.
Sources: economic survey of Pakistan (various issues) and Pacific exchange Rate services.
Note: values represent sports goods exports by fiscal year. values in rupees are converted to us$ using exchange rate data from Pacific exchange Rate services and deflated by the us urban consumer Price Index (2024 = 100). the blue line represents sports goods exports in millions of 2024 us$. the red line expresses its share in total Pakistani exports.
manufacturing area is among the tools Fernandes and Reed classify as a “tailored public input,” and the tax rebate scheme is a “market incentives.” Positive changes in the soccer ball manufacturing industry coincided with the implementation of both tools.
But coincidence is not causality. It is possible that it was not so much government intervention but independent initiatives by the business sector that propelled some of the success. For example, the Sialkot International Airport is the only private airport in Pakistan, and it was built by the local business community without government help. Disentangling the effects of firms’ clustering, industrial policy, and independent initiatives is only possible if evaluation is built into the design of an industrial policy, which, as is very often the case for industrial policies worldwide, was not the case for either example in Pakistan.
References
Achy, Lahcen. 2013. “Structural Transformation and Industrial Policy in Morocco.” Working Paper No. 796. Economic Research Forum.
Al Faris, Abdulrazak, and Raimundo Soto, eds. 2016. The Economy of Dubai. Oxford University Press.
Alfaro-Moreno, Karina, Luis F. Rivera-Galicia, and Imad Bakkali. 2024. “Why Do Multinational Enterprises in the Auto Parts Industry Set Up in Morocco?” Journal of Infrastructure, Policy and Development 8 (7): 4689. https://doi. org/10.24294/jipd.v8i7.4689.
Ali, Nadia, Massimiliano Cali, and Bob Rijkers. 2025. “Promoting Innovative Startups: QuasiExperimental Evidence from Tunisia.” Journal of Development Economics 177: 103539. https://doi. org/10.1016/j.jdeveco.2025.103539.
Atamanov, Aziz, Alan Fuchs Tarlovsky, Laura Moreno Herrera, Ganesh Kumar Seshan, and Trang Van Nguyen. 2026. “Welfare Impact from Spillovers from Regional Conflict in MENAAP.” Unpublished manuscript. World Bank.
Atkin, David, Azam Chaudhry, Shamyla Chaudry, Amit K. Khandelwal, Tariq Raza, and Eric Verhoogen. 2017a. “On the Origins and Development of Pakistan’s Soccer-Ball Cluster.” World Bank Economic Review 30 (Suppl. 1): S34–S41. https://doi. org/10.1093/wber/lhw015.
Atkin, David, Azam Chaudhry, Shamyla Chaudry, Amit K. Khandelwal, and Eric Verhoogen. 2017b. “Organizational Barriers to Technology Adoption: Evidence from Soccer-Ball Producers in Pakistan.” Quarterly Journal of Economics 132 (3): 1101–64. https://doi.org/10.1093/qje/qjx010.
Belhaj, Ferid, Roberta Gatti, Daniel Lederman, Ernest John Sergenti, Rana Lotfi, Mennatallah Emam Mousa, and Hoda Assem. 2022. A New State of Mind: Greater Transparency and Accountability in the Middle East and North
Africa. Middle East and North Africa Economic Update (October). World Bank. https://doi. org/10.1596/978-1-4648-1925-4.
Brunello, Giorgio, and Maria De Paola. 2004. “Market Failures and the Under-Provision of Training.” CESifo Working Paper 1286. Center for Economic Studies and ifo Institute.
Cadot, Olivier, Ana M. Fernandes, Julien Gourdon, and Aaditya Mattoo. 2015. “Are the Benefits of Export Support Durable? Evidence from Tunisia.” Journal of International Economics 97 (2): 310–24.
Caldara, D., and M. Iacoviello. 2022. “Measuring Geopolitical Risk.” American Economic Review 112: 1194–225. https://doi.org/10.1257/aer.20191823.
Caldara, D., M. Iacoviello, P. Molligo, A. Prestipino, and A. Raffo. 2020. “The Economic Effects of Trade Policy Uncertainty.” Journal of Monetary Economics 109: 38–59. https://doi. org/10.1016/j.jmoneco.2019.11.002.
Cardarelli, Roberto, Mercedes Vera Martin, and Subir Lall, eds. 2022. Promoting Inclusive Growth in the Middle East and North Africa: Challenges and Opportunities in a Post-Pandemic World. International Monetary Fund.
CBI (Centre for the Promotion of Imports from Developing Countries). 2024. “Entering the European Market for Olive Oil.” Accessed March 11, 2026. https://www.cbi.eu/market-information/ processed-fruit-vegetables-edible-nuts/olive-oil/ market-entry.
Colvin, James, and Peter Farup Ladegaard. 2024. Governance of State-Owned Enterprises in the MENA Region: Synthesis and Cross-Cutting Findings of SOE Governance Reviews of Six Countries. World Bank.
De Long, J. Bradford, Andrei Shleifer, Lawrence H. Summers, and Robert J. Waldmann. 1990.
“Noise Trader Risk in Financial Markets.” Journal of Political Economy 98 (4): 703–38.
Defever, Fabrice, Alejandro Riaño, and Gonzalo Varela. 2025. “Evaluating the Impact of Export Finance Support on Firm-Level Export Performance: Evidence from Pakistan.” Canadian Journal of Economics 58 (3): 1070–91. https://doi. org/10.1111/caje.70013.
DFDF (Dubai Future District Fund). 2021. “Dubai Future District Fund.” https://www.future districtfund.com/.
EBRD (European Bank for Reconstruction and Development). 2024. Transition Report 2024–25: Navigating Industrial Policy. EBRD.
Evenett, Simon J. 2003. “Study on Issues Related to a Possible Multilateral Framework on Competition Policy.” WTO Document WT/WGTCP/W/228. World Trade Organization.
Felipe, Jesus, Utsav Kumar, Arnelyn Abdon, and Marife Bacate. 2012. “Product Complexity and Economic Development.” Structural Change and Economic Dynamics 23 (1): 36–68. https://doi. org/10.1016/j.strueco.2011.08.003.
Fernandes, Ana Margarida, and Tristan Reed. 2026. Industrial Policy for Development: Approaches in the 21st Century. Policy Research Reports. World Bank. https://doi.org/10.1596/978-1-4648-2276-6.
Freund, Caroline, and Theodore Moran. 2017. “Multinational Investors as Export Superstars: How Emerging-Market Governments Can Reshape Comparative Advantage.” Working Paper 17-1. Peterson Institute for International Economics.
Gatti, Roberta, Daniel Lederman, Asif M. Islam, Federico R. Bennett, Bo Pieter Johannes Andree, Hoda Assem, Rana Lotfi, and Mennatallah Emam Mousa. 2023. Altered Destinies: The Long-Term Effects of Rising Prices and Food Insecurity in the Middle East and North Africa. Middle East and North Africa Economic Update (April). World Bank. https://doi.org/10.1596/978-1-4648-1974-2.
Gatti, Roberta, Jesica Torres, Nelly Elmallakh, Gianluca Mele, Diego Faurès, Mennatallah Emam Mousa, and Ilias Suvanov. 2024. Growth in the Middle East and North Africa. Middle East and North Africa Economic Update (October). World Bank. https://documents.banquemondiale.org/fr/ publication/documents-reports/documentdetail/ 099722110212426928.
Gatti, Roberta, Harun Onder, Asif M. Islam, Jesica Torres, Gianluca Mele, Federico Bennett, Sumin Chun, et al. 2025a. Shifting Gears: The Private Sector as an Engine of Growth in the Middle East and North Africa. Middle East and North Africa Economic Update (April). World Bank.
Gatti, Roberta, Caglar Ozden, Jesica Torres, Leila Baghdadi, Ernest Sergenti, Asif M. Islam, Isis Gaddis, et al. 2025b. Jobs and Women: Untapped Talent, Unrealized Growth. Middle East, North Africa, Afghanistan, and Pakistan Economic Update (October). World Bank.
Gatti, Roberta, Caglar Ozden, Ernest Sergenti, and Yuting Fan. Forthcoming. Resources to Resilience: Economic Diversification for Oil and Gas Exporters in the Middle East, North Africa, Afghanistan, and Pakistan. World Bank.
Global Trade Alert. 2026. “Global Trade Alert Database.” St. Gallen Endowment for Prosperity Through Trade. Accessed March 11, 2026. https:// www.globaltradealert.org/.
Growth Lab at Harvard University. 2026. “The Atlas of Economic Complexity.” Accessed March 11, 2026. https://atlas.cid.harvard.edu.
Hahn, Tina, and Georgeta Vidican-Auktor. 2017. “The Effectiveness of Morocco’s Industrial Policy in Promoting a National Automotive Industry.” Discussion Paper 27/2017. German Development Institute.
Hausmann, Ricardo, and Bailey Klinger. 2007. “The Structure of the Product Space and the Evolution of Comparative Advantage.” CID Working Paper 146. Center for International Development at Harvard University.
IEA (International Energy Agency). 2022. Oil Market Report—March 2022. IEA. https://www. iea.org/reports/oil-market-report-march-2022.
IFC (International Finance Corporation). 2019. Creating Markets in Morocco: Country Private Sector Diagnostic. International Finance Corporation. https://www.ifc.org/en/insights-reports/2010/ cpsd-morocco.
ILO (International Labour Organization). 2026. “ILOSTAT Database.” https://ilostat.ilo.org/data/.
IMF (International Monetary Fund). 2013. “Saudi Arabia: Selected Issues.” IMF Country Report 13/230. IMF. https://www.imf.org/external/pubs/ ft/scr/2013/cr13230.pdf.
IMF (International Monetary Fund). 2023. “United Arab Emirates: Selected Issues—Assessing the Impact of ICT Investments on Growth.” IMF Staff Country Report 2023/224. IMF.
ISOFAR (International Society of Organic Agriculture Research). 2016. “Country Report: Tunisia.” Archived November 24, 2020. https://web. archive.org/web/20201124093158/https://isofar. online/Country-reports/Tunesia/.
Jägerskog, Lars Anders, and Shawki Barghouti. 2022. Advancing Knowledge of the Water-Energy Nexus in the GCC Countries. World Bank Group. http://documents.worldbank.org/curated/en/ 099355009132215715.
Juhász, Réka, Nathan Lane, and Dani Rodrik. 2024. “The New Economics of Industrial Policy.” Annual Review of Economics 16 (1): 213–42.
Kurdi, Sikandra, Mai Mahmoud, Kibrom A. Abay, and Clemens Breisinger. 2020. “Too Much of a Good Thing? Evidence That Fertilizer Subsidies Lead to Overapplication in Egypt.” MENA Regional Program Working Paper 27. International Food Policy Research Institute. https://doi.org/10.2499/ p15738coll2.133652.
Li, Xuecao, Yuyu Zhou, Min Zhao, and Xia Zhao. 2020. “A harmonized global nighttime light
dataset 1992–2018.” Scientific Data 7 (1): 168. https://doi.org/10.1038/s41597-020-0510-y.
Liaqat, Zara, and Jeffrey B. Nugent. 2015. “Under-Provision of Private Training by MENA Firms: What to Do about It?” IZA Journal of Labor and Development 4 (1): 12. https://doi.org/ 10.1186/s40175-015-0034-6.
Loewe, Markus. 2013. “Industrial Policy in Egypt 2004–2011.” Discussion Paper 13/2013. German Development Institute.
Malouche, Mariem, and Zeinab Partow. 2019. Country Private Sector Diagnostic: Creating Markets in Morocco—A Second Generation of Reforms: Boosting Private Sector Growth, Job Creation, and Skills Upgrading. World Bank Group.
Mendez Parra, Max, Prachi Agarwal, David Luke, Noncedo Vutula, Agisanang Magooa, Inas El-Aidi, Asmita Parshotam, Eleni Iacovou, and Francesca Chapman. 2025. Impact of Geopolitical Dynamics on Global Trade: The Case of the African Automotives Sector. ODI Global Report.
Microsoft. 2026. Global AI Adoption in 2025—A Widening Digital Divide. AI Economy Institute. https://www.microsoft.com/en-us/corporateresponsibility/topics/ai-economy-institute/reports/ global-ai-adoption-2025/.
Najib, Ilham, and Eduardo Amaral Haddad. 2024. “The Automotive Sector in Morocco: An InputOutput Structural Decomposition Analysis.” Working Paper 2403. Policy Center for the New South.
OEC (Observatory of Economic Complexity). 2024. “Fertilizers (HS: 31) Product Trade, Exporters and Importers.” Accessed March 11, 2026. https://oec.world/en/profile/hs/fertilizers.
OECD (Organisation for Economic Co-operation and Development). 2012. Competitive Neutrality: Maintaining a Level Playing Field Between Public and Private Business. OECD Publishing. https:// doi.org/10.1787/9789264178953-en.
Pack, Howard, and Kamal Saggi. 2006. “Is There a Case for Industrial Policy? A Critical Survey.” World Bank Research Observer 21 (2): 267–97.
Ramirez Rigo, Ernesto, Christine J. Richmond, Oluremi Akin Olugbade, Gareth Anderson, Maria Atamanchuk, Hatim Bukhari, Iacovos Ioannou, et al. 2021. State-Owned Enterprises in Middle East, North Africa, and Central Asia: Size, Role, Performance, and Challenges. Departmental Paper 2021/019. International Monetary Fund.
Raza, Tariq. 2016. “Measuring Technology Differences Across Football Manufacturers in Sialkot.” Lahore Journal of Economics 21 (Special Edition): 237–51.
Rijkers, Bob, Caroline Freund, and Antonio Nucifora. 2014. “All in the Family: State Capture in Tunisia.” Policy Research Working Paper 6810. World Bank.
Rodrik, Dani. 2008. “Normalizing Industrial Policy.” Commission on Growth and Development Working Paper 3. World Bank.
Shiller, Robert J. 1981. “Do Stock Prices Move Too Much to Be Justified by Subsequent Changes in Dividends?” American Economic Review 71 (3): 421–36.
UAE Government. 2022. “UAE Digital Economy Strategy.” Official Platform of the UAE Government. https://u.ae.
UN Comtrade Database. n.d. UN Statistics Division. https://comtradeplus.un.org/.
UNHCR (United Nations High Commissioner for Refugees). 2026a. “Middle East Situation— As of 19 March 2026.” https://data.unhcr.org/en/ documents/details/121649.
UNHCR (United Nations High Commissioner for Refugees). 2026b. “UNHCR Syria Flash Update: Middle East Situation, 27 March 2026.” ReliefWeb. https://reliefweb.int/report/syrian-arabrepublic/unhcr-syria-flash-update-middle-eastsituation-27-march-2026.
VARA (Virtual Assets Regulatory Authority). 2022. “Law No. (4) of 2022 Regulating Virtual Assets in the Emirate of Dubai.” VARA. https:// www.vara.ae/.
Venugopalan, Vishnu, and Archita Misra. 2025. “The Ten Predicaments of New Industrial Policy in Practice.” Reimagining the Economy Policy Paper. Harvard Kennedy School.
Vyshnevsky, V. P., and V. V. Dementiev. 2011. “Industrial Policy for Ukraine: Theoretical Aspects.” Economic Herald of the Donbas 4 (26): 5–20.
World Bank. 2021. Lebanon Economic Monitor, Spring 2021: Lebanon Sinking (to the Top 3). World Bank. https://documents1.worldbank.org/ curated/en/394741622469174252/pdf/Lebanon-Economic-Monitor-Lebanon-Sinking-to-theTop-3.pdf.
World Bank. 2022a. Pakistan Floods 2022: Post-Disaster Needs Assessment—Main Report. World Bank.
World Bank. 2022b. Egypt Country Climate and Development Report. World Bank Group. https:// documents1.worldbank.org/curated/en/0995100110 12235419/pdf/P17729200725ff0170ba05031a8d4ac26d7.pdf.
World Bank. 2023a. The Business of the State World Bank.
World Bank. 2023b. “Country Climate and Development Report: Background Note—Jobs for a Green, Resilient, and Inclusive Recovery: The Case of Egypt.” World Bank.
World Bank. 2024a. “Prosperity Data360 Tourism Country Snapshots: Egypt.” Data360 Tourism Factsheets. World Bank.
World Bank. 2024b. “Transitioning Towards Sustainable and Climate-Smart Tourism in the Middle East and North Africa (MENA): Recommendations for the Tourism Sectors in Egypt, Lebanon, and Morocco.” World Bank. https://documentsinternal.worldbank.org/search/34407375.
World Bank. 2025. The Container Port Performance Index 2020 to 2024: Trends and Lessons Learned. World Bank.
WTO (World Trade Organization). 1996. “Morocco Continues Liberalizing Its Trade Regime but the WTO Raises Concerns in Some Sectors.” Press Release PRESS/TPRB/23. WTO. https:// docs.wto.org/dol2fe/Pages/SS/directdoc.aspx?filename=Q:/WT/PRESS/TPRB23.pdf&Open=True.
WTO (World Trade Organization). 2009. Trade Policy Review: Report by the Secretariat—Kingdom of Morocco. WT/TPR/S/217. WTO. https://docs. wto.org/dol2fe/Pages/SS/directdoc.aspx?filename=Q:/WT/TPR/S217-04.pdf&Open=True.
WTO (World Trade Organization). 2024. Trade Policy Review: Report by the Secretariat—Morocco. WT/TPR/S/453/Rev.1. WTO. https://docs.wto. org/dol2fe/Pages/SS/directdoc.aspx?filename=q:/ WT/TPR/S453R1.pdf&Open=True.
Yoshijima, Suiko, Hanan Elhadary, Fadi Doumani, Sherif Arif, Dalia Sakr, Pablo Ahijado Aparicio, and Tarek Temraz. 2024. Egypt—Country Environmental Analysis: Promoting Circular Economy and Blue Economy for Environmental Sustainability. World Bank.