
Alejandro De La Fuente, Miki Khanh Doan, and Samuel Freije-Rodríguez
This book, along with any associated content or subsequent updates, can be accessed at https://hdl.handle.net/10986/29311.
Scan to see all titles in this series.
INTERNATIONAL DEVELOPMENT IN FOCUS
© 2026 International Bank for Reconstruction and Development / The World Bank 1818 H Street NW, Washington, DC 20433
Telephone: 202-473-1000; Internet: www.worldbank.org
Some rights reserved
1 2 3 4 29 28 27 26
Books in this series are published to communicate the results of World Bank research, analysis, and operational experience with the least possible delay. The extent of language editing varies from book to book.
This work is a product of the staff of The World Bank with external contributions. The findings, interpretations, and conclusions expressed in this work do not necessarily reflect the views of The World Bank, its Board of Executive Directors, or the governments they represent. The World Bank does not guarantee the accuracy, completeness, or currency of the data included in this work and does not assume responsibility for any errors, omissions, or discrepancies in the information, or liability with respect to the use of or failure to use the information, methods, processes, or conclusions set forth. The boundaries, colors, denominations, links/footnotes, and other information shown in this work do not imply any judgment on the part of The World Bank concerning the legal status of any territory or the endorsement or acceptance of such boundaries. The citation of works authored by others does not mean The World Bank endorses the views expressed by those authors or the content of their works. Certain artificial intelligence (“AI”) tools may have been used in creating this work, as indicated in the work, but all transformative and creative effort expressed in the work was performed by The World Bank staff or external contributors. The World Bank is not responsible for any claims, including for errors or inaccurate information, generated by AI programs not controlled or owned by the World Bank.
Nothing herein shall constitute or be construed or considered to be a limitation upon or waiver of the privileges and immunities of The World Bank, all of which are specifically reserved.

This work is available under the Creative Commons Attribution 3.0 IGO license (CC BY 3.0 IGO) http://creativecommons.org/licenses/by/3.0/igo. Under the Creative Commons Attribution license, you are free to copy, distribute, transmit, and adapt this work, including for commercial purposes, under the following conditions:
Attribution—Please cite the work as follows: de la Fuente, Alejandro, Miki Khanh Doan, and Samuel FreijeRodríguez. 2026. Adapting to Adversity: Poverty and Climate Risks in Latin America and the Caribbean. International Development in Focus. Washington, DC: World Bank. doi: 10.1596/978-1-4648-2314-5.
License: Creative Commons Attribution CC BY 3.0 IGO
Translations—If you create a translation of this work, please add the following disclaimer along with the attribution: This translation was not created by The World Bank and should not be considered an official World Bank translation. The World Bank shall not be liable for any content or error in this translation.
Adaptations—If you create an adaptation of this work, please add the following disclaimer along with the attribution: This is an adaptation of an original work by The World Bank. Views and opinions expressed in the adaptation are the sole responsibility of the author or authors of the adaptation and are not endorsed by The World Bank.
Third-party content—The World Bank does not necessarily own each component of the content contained within the work. The World Bank therefore does not warrant that the use of any third-party-owned individual component or part contained in the work will not infringe on the rights of those third parties. The risk of claims resulting from such infringement rests solely with you. If you wish to re-use a component of the work, it is your responsibility to determine whether permission is needed for that re-use and to obtain permission from the copyright owner. Examples of components can include, but are not limited to, tables, figures, or images.
All queries on rights and licenses should be addressed to World Bank Publications, The World Bank, 1818 H Street NW, Washington, DC 20433, USA; e-mail: pubrights@worldbank.org
ISBN: 978-1-4648-2314-5
DOI: 10.1596/978-1-4648-2314-5
Artificial Intelligence: If AI tools were used in the development of this work, page ii of this work will have further information.
Cover photo [or image]: © TacioPhilip / istockphoto.com (left); © loeskieboom / istockphoto.com (right).
Photos used with permission. Further permission required for reuse.
Cover design: Debra Naylor / Naylor Design Inc.
The manufacturer’s authorized representative in the European Union for product safety is Mare Nostrum Group B.V., Doelen 72, 4831 GR Breda, The Netherlands. Email: gpsr@mare-nostrum.co.uk
Acknowledgments ix
About the Authors xi
Key Findings and Messages xiii
Executive Summary xix
Abbreviations xxxi
CHAPTER 1 Unveiling Harm’s Way 1
Introduction 1
A hazard-prone region 2
More poor people in harm’s way? 10
Floods in cities: Are poor individuals always more exposed? Not necessarily 19
One in four poor people live in high-value ecosystems, many exposed to climate hazards 23
Peering into the future 25
Notes 29
References 31
CHAPTER 2 Risk of Climate Hazards 35
Introduction 35
How many people in LAC are vulnerable to climate hazards, and who are they? 35
Climate hazards risk: The immediate impact on incomes, assets, and poverty 40
Climate hazards risk: Long-term consequences 45
Notes 54
References 55
CHAPTER 3 Protecting Poor People from Climate Hazard Risks 61
The case for adaptation now 61
Prevention 66
Insurance 83
Coping 90
CHAPTER 4
Stronger together: the power of combined instruments and systems for climate adaptation 99
Notes 102
References 103
Improving Adaptation 111
Introduction 111
Incentives 112
Information and technology 117
Investments 125
Institutions 132
Notes 141
References 142
Appendix A: Background Papers 149 Glossary 151
Boxes
1.1 Climate hazards data 5
1.2 Poverty measurement and poverty maps in LAC 14
1.3 Exposure to severe flood risk across socioeconomic groups 18
1.4 Summary of attribution studies 27
2.1 Channels through which climate hazards can affect incomes in the short term 41
2.2 The hidden mortality costs of droughts in LAC: Pollution from power swaps 47
2.3 The macroeconomic consequences of materialized climate hazards 52
3.1 Heat waves and inequality 75
3.2 Caribbean Catastrophe Risk Insurance Facility: Balancing benefits and challenges 86
3.3 Nicaragua’s experience with a hybrid insurance approach 88
3.4 Few climate risk financing mechanisms are catered to poor individuals 95
3.5 Paraguay’s conditional cash transfer program, Tekoporã, and its assetbuilding graduation program, Tenonderã 99
4.1 Warning and trust to reduce heat-related mortality 121
4.2 Public asset databases and prototype risk models in LAC 123
4.3 Climate adaptation financing sources in LAC 125
4.4 Unlocking private sector participation in insurance schemes outside LAC 129
4.5 How to judge the welfare benefits of adaptation policies 131
4.6 Fairness in adaptation investments: Weighing the impact on different groups 132
4.7 Anticipatory transfers and funding to adapt safety nets against climate hazards 138
4.8 Reducing drought vulnerability and clientelism in Brazil 140
ES.1 Number of casualties and people affected by climate disasters, 1970–2024 xxii
ES.2 Impact of climate shocks on the country poverty gap, by type of social protection system xxv
1.1 Components of climate hazard risk 2
1.2 Frequency of climate hazards in LAC 4
1.3 Number of climate disasters in LAC, by subregion, 2003–23 4
B1.3.1 Households in high-risk flood areas by wealth quintiles and rural and urban areas, Dominican Republic, 2021 18
1.4 Estimates and projections of levels of urbanization by major world regions, 1850–2050 19
1.5 Historical average temperature across LAC, 1900–2020 26
1.6 Frequency of Atlantic cyclones in the past 50 years, by maximum wind speed threshold (duration >2 days) 26
2.1 Number of people vulnerable to poverty induced by structural factors or by types of risk 37
2.2 Percentage of poor individuals and individuals with CRI vulnerability 38
2.3 Average income required per person to overcome gap between postshock income and the poverty line, by risk source 38
B2.1.1 An asset-based framework to explain household income generation 41
2.4 Number of casualties and affected people by climate disasters, 1970–2024 47
2.5 Deaths from and population affected by climate hazards, per 100,000 population, by country income level, 1970–2024 48
3.1 Conceptual framework to understand adaptation 63
3.2 Deaths by hurricane category and country-level capacity to provide climate services 67
3.3 Number of LAC countries by capacity to provide climate services and early warning systems 68
3.4 Poorer households search or receive less warning information against floods 69
3.5 Effects of floods on population 72
3.6 Annual decrease in flood-related mortality 73
3.7 Flood-related deaths in cities protected and not protected by a dam 73
3.8 City-level economic impact of floods and mitigation via critical infrastructure 74
3.9 Mean municipal change in household living standards (HLS) of FONDEN beneficiary municipalities a year after being affected by excessive rainfall 86
3.10 Poverty and risk-induced vulnerability to poverty 93
3.11 Percentage of vulnerable households with social assistance 94
3.12 Impact of climate shocks on the country poverty gap, by type of social protection system 97
4.1 Key factors to improve adaptation responses 112
4.2 Model forecasts of Hurricane Beryl’s trajectory 118
Maps
ES.1 Hazard exposure and poverty rates in LAC ($6.85, 2017 PPP) x xi
1.1 Population exposure to climate hazards 9
B1.2.1 Poverty rates in LAC using ($6.85, 2017 PPP), 2020–24 15
1.2 Climate hazard exposure and poverty rates in LAC (-$6.85, 2017 PPP) 16
1.3 Distribution of flood hazard and multidimensional poor population in Cali, Colombia 21
1.4 Poverty rates in areas of high-value ecosystems 24
B1.4.1 Attribution studies on the role of climate change in extreme weather events in LAC 28
B3.1.1 Land surface temperature and SUHI severity, multidimensional poverty, and their overlap for Barranquilla, Colombia, and Mexico City, Mexico 76
3.1 Overlays of monetary poverty and protected areas (as share of total land) in LAC 80
Tables
ES.1 L AC regional overview of climate exposure, vulnerability, climate risk impact, and adaptation: A traffic light system assessment x xvi
B1.1.1 Severe hazard definitions and sources of data 7
1.1 Distribution of exposure rates by climate hazard for total, poor, and nonpoor populations, LAC region 13
1.2 Exposure rates to flood hazard for total, MDP, and MDNP populations in selected cities 22
2.1 Typology of countries, by climate-risk-induced vulnerability to poverty and Global Climate Risk Index 49
3.1 Adaptation strategies to climate hazards and change 65
3.2 Policy levers for reducing deforestation and links to poverty reduction 78
3.3 Availability of disaster risk financing instruments by country, circa 2020–24 91
3.4 Number of countries within each level of adaptiveness by building block 95
3.4.1 Protection of poor individuals mentioned in laws and regulations by type of climate risk financing instrument in LAC circa 2020–24 96
3.5 L AC regional overview of climate exposure, vulnerability, climate risk impact, and adaptation: A traffic light system assessment 100
This report was prepared by Alejandro de la Fuente (Senior Economist), Miki Khanh Doan (Economist), and Samuel Freije-Rodríguez (Lead Economist). Overall guidance was provided by Bill Maloney (Chief Economist), Oscar Calvo Gonzalez (Director of Strategy and Operations), and Carlos Rodríguez-Castelán (Practice Manager). Ximena del Carpio was Practice Manager for Latin America and the Caribbean in the early stages of this project.
The team is grateful to the following authors for their contributions to the background papers for this report: Eric Arias, G. Sofía Alonso Beltrán, Ben J. Brunckhorst, Victor Cárdenas, Michael R. Carter, Denisse Rubí Cruz, Alejandro del Valle, Olivia D’Aoust, Mathilda Eriksson, Catalina García, Peter Hawthorne, Amanda Kennard, Alejandrina León Montes, Nancy Lozano Gracia, Prerna Mishra, Minh C. Nguyen, Salvador Perez Elizondo, Monserrat Serio, Juan Soriano Escobedo, Marcos M. Sugastti, Sara Turner, and Dawson Verley.
The team acknowledges the following colleagues for their valuable comments and insights, provided as assigned discussants during the author workshops held in February and April 2024: Sarah Coll-Black, Paul Corral, Susmita Dasgupta, Xavier Giné, Stéphane Hallegatte, Ruth Hill, Stuti Khemani, Mark Roberts, Julie Rozenberg, and Esha Zaveri. Inputs for this report from Anna Cabre Alvos and C. MacKenzie Dove from the Climate Change Knowledge Portal team, as well as from Rajat Kochhar, are also appreciated.
The team extends thanks to the following peer reviewers for their insightful comments that contributed significantly to this work: Stéphane Hallegatte (Chief Economic Adviser), William Wiseman (Practice Manager), Guillermo Beylis (Senior Economist), and Emmanuel Skoufias (Visiting Professor, Lee Kuan Yew School of Public Policy, National University of Singapore).
Finally, the team expresses its deep thanks to the administrative and operational colleagues who supported the completion of this report: Ana Carolina Leguizamo Baquero (Program Assistant) and Mirela Catuneanu (Operations Analyst).
This study is a deliverable under the World Bank’s Poverty and Equity Latin America and the Caribbean Advisory Services and Analytics (P506095), in coordination with the Chief Economist Office for Latin America and the Caribbean, supported by the Climate Support Facility Whole-of-Economy Program, administered by the World Bank.
Alejandro de la Fuente is a Senior Economist with extensive experience in the World Bank’s Poverty and Equity Unit and Social Sustainability and Inclusion Unit, across low- and middle-income countries, including fragile contexts. His current work involves providing high-quality analytics on poverty, program evaluation, and risk and vulnerability; policy guidance; and hands-on support to World Bank operations on statistics and social protection. de la Fuente currently serves as Global Program Lead on Climate Resilience in the Poverty and Equity Global Practice. Previous roles include positions with the United Nations Development Programme, the United Nations Office for Disaster Risk Reduction, and the Inter-American Development Bank and public service in Mexico’s Ministry of Social Development and the Office of the President. He holds a DPhil in development studies/development economics from the University of Oxford, is author of multiple peer-reviewed articles, and is coauthor or coeditor of six books.
Miki Khanh Doan is an Economist in the Distributional Impact of Policies Unit at the World Bank, where she leads and supports analytical work on climate resilience, agricultural policy, and poverty reduction. Her work focuses on the distributional impacts of climate and development policies, including the repurposing of agricultural subsidies; welfare effects of climate shocks; and pathways for resilient, low-carbon farming systems. She has conducted research on intra-household dynamics, rural livelihoods, and school meal programs in East Africa and South Asia, in collaboration with institutions such as the International Food Policy Research Institute, World Food Programme, US Agency for International Development, and Stanford’s Global Center for Gender Equality. Doan holds a PhD in agricultural and resource economics from the University of California, Davis.
Samuel Freije-Rodríguez joined the World Bank in 2008. His areas of work include labor economics, international development, and welfare economics. He has participated in World Bank studies on labor markets, poverty, inequality,
and distributive impact of tax policy in the Plurinational State of Bolivia, China, Colombia, the Dominican Republic, Mexico, Mongolia, the Russian Federation, Türkiye, and República Bolivariana de Venezuela. He was co–task team leader of Poverty and Shared Prosperity 2020 and team member of World Development Report 2013: Jobs. Before joining the Bank, Freije-Rodríguez was Associate Professor at Universidad de las Americas in Puebla, Mexico, and at Instituto de Estudios Superiores de Administración in Caracas, República Bolivariana de Venezuela. He was a member of the Scientific Committee of the Fondo para el Desarrollo Social of Consejo Nacional de Ciencia y Tecnología, was awarded Sistema Nacional de Investigadores level 1 in Mexico, and was also associate editor of Economía LACEA Journal. Freije-Rodríguez holds a PhD in labor economics from Cornell University, a master’s degree from Queen Mary University in London, and a bachelor’s degree from Universidad Católica Andrés Bello in Caracas.
This report focuses on poor and near-poor individuals and asks what can be done to strengthen their resilience to climate risks. By combining new data, case studies, and original research, it offers a detailed look at who is most at risk, how climate hazards interact with poverty, and what policies can best protect vulnerable populations in Latin America and the Caribbean (LAC). It highlights four critical questions for governments of the region:
1. Are poor people more exposed to climate hazards?
2. What risks do these hazards pose to households and societies?
3. What adaptation measures are already in place, and how effective are they?
4. Finally, how can adaptation efforts be improved and accelerated to ensure that poverty reduction continues despite a changing climate?
LAC has made huge strides in reducing poverty over the past two decades. In 2000, half of the region lived below the upper-middle-income poverty line defined by the World Bank; in 2024, it was one-quarter. Inequality, although still high, has fallen to historic lows. Millions of families have built better lives.
Yet this progress is under serious threat. Climate change is bringing more frequent and more intense hazards—hurricanes, droughts, floods, landslides, and heat waves—that risk undoing these hard-won gains. The region contributes little to global greenhouse gas emissions, but it is among the most vulnerable to their effects. For millions who are just one shock away from falling back into poverty, climate change is not a distant concern but an immediate risk to livelihoods and well-being.
The challenge is not simply about facing stronger hurricanes or hotter summers. It is about ensuring that development can withstand these shocks. The poorest individuals cannot afford to start over each time a climate event destroys their home, wipes out their harvest, or interrupts their children’s education. Building resilience is not only a matter of fairness but also one of economic necessity.
The scale of exposure in the region is staggering. As of 2020, more than a third of the region’s population—240 million people—lived in areas exposed to major climate hazards. Droughts are the most widespread, affecting more than 13 percent of the population, followed by heat waves, hurricanes, floods, and landslides. However, poor people face a disproportionate share of this burden: Nearly 45 percent of poor households are exposed to at least one of these severe climate hazards, compared with 34 percent among nonpoor households.
Hotspots where climate hazards overlap with high concentrations of poverty are scattered across the region, from Yucatán’s Caribbean coast; parts of Mexico’s southern and Gulf coasts; Central America’s Dry Corridor through to the Amazon basin; northeast Brazil and the Chaco region of the Southern Cone; and the Caribbean coastal zones. In total, some 64 million people live in these high-risk zones.
Exposure, however, tells only part of the story. Vulnerability determines whether a family can bounce back after a hazard hits or falls into long-term hardship. Poor households are often more vulnerable because they depend on fragile livelihoods, such as rain-fed farming, street vending, or low-paid labor. They tend to live in less resilient housing, lack savings or insurance to fall back on or recover quickly, and have limited access to safety nets. When a storm or drought hits, these families may be forced to sell what little they own or cut back on essentials such as food and schooling. Over time, these coping strategies deepen poverty rather than relieve it. Depending on the method used to estimate vulnerability, 3 to 16 percent of the region’s population is climate vulnerable.
The impacts of climate shocks go far beyond immediate damage and income losses. They disrupt children’s learning, increase malnutrition, worsen health, and reduce productivity, leaving lasting scars across generations. In many cases, climate events do not kill large numbers of people, but they steadily erode human capital and trap households in poverty. In this sense, climate risk is a risk to development. Adaptation policies are not just about managing disasters; they are long-term investments in people’s futures and long-term development.
Adaptation is not an abstract idea in LAC. Governments, communities, and international institutions have been experimenting with a wide range of adaptation tools, from early warning systems to critical infrastructure, insurance schemes, and social protection programs. Some of these efforts have shown clear benefits. Flood barriers and early warning systems have saved lives. Protected areas and recognition of Indigenous land rights have slowed deforestation. Disaster funds and parametric insurance tools—such as Mexico’s Fondo de Desastres Naturales, the Caribbean Catastrophe Risk Insurance Facility, and catastrophe-deferred drawdown options—have provided fast, predictable financing after climate hazards hit. Countries such as Mexico and Nicaragua have piloted innovative programs that link national insurance with local microinsurance to protect poor farmers. And adaptive social protection systems, where they are well established, such as in Argentina, Brazil, Chile, the Dominican Republic, or Uruguay, have cushioned poor people from falling deeper into poverty after climate shocks.
But progress remains uneven. Many countries still lack strong early warning systems or widespread critical infrastructure. Many countries still rely heavily on risk retention tools such as emergency funds or budget reallocations while more advanced options such as catastrophe bonds and parametric insurance remain rare. Innovative insurance mechanisms are concentrated in a handful of countries and often exclude those who are poorest. Social protection systems in much of the region remain nascent, reaching only a fraction of vulnerable households and with outdated registries that slow emergency response. Even where cash transfers exist, weak coordination or outdated registries often slow down support, leaving those who are most vulnerable unprotected. This unevenness means that although some countries are well positioned to manage future risks, others remain dangerously exposed.
Another challenge lies in prevention. Governments tend to invest heavily in recovery once a climate hazard strikes but underinvest in measures that could reduce losses in the first place. Forecasting systems are often underfunded. Many people remain on floodplains, drought-prone farmland, or landslide-prone hillsides because they lack safer, affordable alternatives. Deforestation and poor land management often worsen the impact of hazards. Addressing these structural issues requires not only technical solutions but also political will.
To protect recent development gains, LAC countries will need to accelerate adaptation and make it central to poverty reduction. This means building comprehensive systems that combine prevention, insurance, and coping mechanisms. The exact mix will vary by country, but the principle is the same: The more layered and integrated the approach across three fronts, the more resilient communities become.
Prevention—through resilient infrastructure, urban planning, and ecosystem protection—can reduce the scale of losses. For insurance, governments should expand access to affordable products while strengthening their own financial protection against hazards through private or regional schemes. For coping, social protection systems must become adaptive—able to expand rapidly during crises and reach the poorest people without delay to ensure they can recover quickly. Countries that invest in layered, coordinated systems across all three dimensions are far better equipped to safeguard both lives and livelihoods.
Information and incentives will play a key role. People need reliable climate forecasts, transparent communication, and fair insurance pricing to make safer choices. Stronger property rights, access to credit, and transport options can give families the means to move out of harm’s way. At the same time, institutions must be transparent and accountable, ensuring that resources are directed where they are needed most.
Financing adaptation is an urgent challenge. The United Nations Environment Programme estimates that the region may need to invest up to $55 billion annually in adaptation by 2030, yet current flows are limited and heavily skewed toward mitigation. Some promising initiatives exist—such as Mexico’s green resilience bond for climate-smart farming and new insurance programs for smallholder farmers in Central America—but scale remains insufficient. Mobilizing more financing will require legal and institutional reforms to attract private and multilateral investment while embedding adaptation goals in national development plans. Governments need to work together with development banks and the private sector to close this gap, using innovative tools such as resilience bonds and blended public-private partnerships. At the same time, governments can improve access to climate data, strengthen property rights, and embed adaptation into national development strategies to attract and channel funds more effectively.
Above all, adaptation is not only about money or technology; it is also about politics. Too often, governments prioritize short-term relief or visible reconstruction projects that bring quick political rewards while long-term resilience is overlooked. The poorest individuals, who have the least voice in political systems, often pay the highest price for this shortsightedness. Shifting the balance requires informed citizens who demand accountability, institutions that promote transparency in resource use, and leaders who are willing to invest in solutions that may not yield votes tomorrow but will protect lives and livelihoods for decades to come. Stronger institutions, greater transparency, and active citizen engagement are needed to shift these incentives and ensure adaptation policies serve those most in need.
LAC stands at a crossroads. The region has shown that progress against poverty and inequality is possible, even in the face of global challenges. But climate hazards threaten to reverse these hard-won gains. Policy makers now face a choice: continue reacting to these hazards as they come, or take bold steps to build resilience that safeguards both people and prosperity.
Adaptation is not a luxury; it is development. Protecting poor people from climate hazards means protecting the region’s future. By investing in prevention, expanding financial protection, strengthening social safety nets, and fostering transparent, inclusive institutions, LAC can weather the storms ahead and ensure that continued poverty reduction is not just progress of the past but a promise for the future.
Ultimately, adaptation in LAC is both an urgent necessity and an opportunity. The region has already pioneered some of the world’s most innovative climate risk management tools, and several countries have shown that resilience can be built even with limited resources. But accelerating progress requires scaling these lessons, closing gaps in social protection and infrastructure, and putting vulnerable households at the center of adaptation strategies. If governments can do so, they will not only safeguard recent gains against poverty and inequality but also lay the foundation for more inclusive, sustainable growth in the decades ahead.
Climate hazards threaten to reverse the recent progress made by Latin America and the Caribbean (LAC). Since the turn of the millennium, millions of Latin Americans have lifted themselves out of poverty. Whereas half of the population lived below the upper-middle-income poverty line of $6.85 per person per day in 2000, this had fallen to one-quarter by 2024 (2017 purchasing power parity). Inequality, although high by global standards, has also fallen to record lows.
The LAC region hosts some of the world’s most climate-risk-prone countries, with their poor and vulnerable populations bearing the brunt of the impact. Although the region has historically produced few greenhouse gas emissions, it now faces more and stronger climate hazards that could stall or even reverse poverty reduction. To stay on track, development efforts need to boost the ability of households, especially poor households, to avoid being plunged back into poverty. This report focuses on the resilience of poor and near-poor individuals to climate hazards, pointing to adaptation measures that prevent or diminish the risks of poverty, injury, damage, or even death. It also outlines strategies to ensure their effective implementation.
The report aims to deepen the conversation around climate risk, poverty, and adaptation, both in the LAC region and globally. First, it brings a distributional lens to recent climate analytics in the region, providing new evidence on the extent to which the poorest people are exposed and potentially affected by climate hazards. It estimates how many poor people are exposed to climate hazards across LAC, that is, in harm’s way, and maps them at the subnational level. It estimates how many people could be pushed into poverty— or become poorer—and identifies other losses tied to that risk. Second, the report tailors widely used conceptual and policy frameworks to the LAC context, producing new empirical insights by applying a poverty perspective to five major adaptation policies currently applied in the region. This complements past World Bank studies such as Rethinking Resilience (Shilpi, Kahn, and Berg 2025), the Roadmap for Climate Action in Latin America
and the Caribbean, 2021–2025 (World Bank 2022), From Resource Rich to Resource Smart (Beylis and Lozano Gracia 2025), and Taxing and Subsidizing Energy in Latin America and the Caribbean (World Bank 2025), as well as contributes to awareness about how climate adaptation policies can help sustain poverty gains. This report offers new data and tools to help regional actors assess climate risks and design better policies.
The report combines new and existing data, tools, and methods to assess climate risks and policies. Some of the analysis is informed by methods and tools already used by the World Bank globally and in LAC to undertake climate-informed Poverty and Equity Assessments and Country Climate and Development Reports. In other places, the report advances improved tools or new research to understand risk and guide policies that support low-income communities. The report draws on a series of background papers commissioned for this report featuring original research (refer to appendix A), case studies, and literature reviews, along with a review of academic studies on climate and adaptation mostly from the region.
LAC countries face four pressing questions about how climate hazards and responses affect poverty and inequality:
1. Are poor people more exposed to climate hazards?
2. What risks do climate hazards pose to the general population, and especially poor individuals?
3. What adaptation policies are already in place to manage these risks, and how effective are they?
4. How can countries improve and accelerate adaptation efforts to protect those who are poor and vulnerable?
The answers to these questions, provided by this report, are summarized next.
In this report, climate hazard risk refers to expected losses—in lives, income, assets, or well-being—caused by severe climate events. This risk depends on three factors:
1. Hazard represents the likelihood and intensity of a damaging climate event.
2. Exposure is the presence of people or assets in harm’s way.
3. Vulnerability captures the susceptibility to harm and the ability to cope or adapt.
The report examines all three components to better understand how climate hazard risks affect different populations.
This study analyzes hurricanes, floods, landslides, droughts, and heat waves, which together make up the bulk of climate hazards in LAC. As of 2020, about 240 million people—more than a third of LAC’s population—were exposed to at
least one of these five major climate hazards. Droughts are the most widespread, affecting 13.4 percent of the population, followed by heat waves (9.9 percent), hurricanes (7.9 percent), and floods and landslides (6.3 percent each).
Poor people in LAC face greater exposure to natural hazards; of them, 44.6 percent are exposed to at least one severe climate hazard, compared with 34.0 percent of nonpoor people. This pattern holds across all hazards except heat waves, where exposure is roughly equal (around 10.0 percent). The largest gap is in drought exposure, which affects 18.6 percent of poor people versus 11.4 percent of nonpoor people.
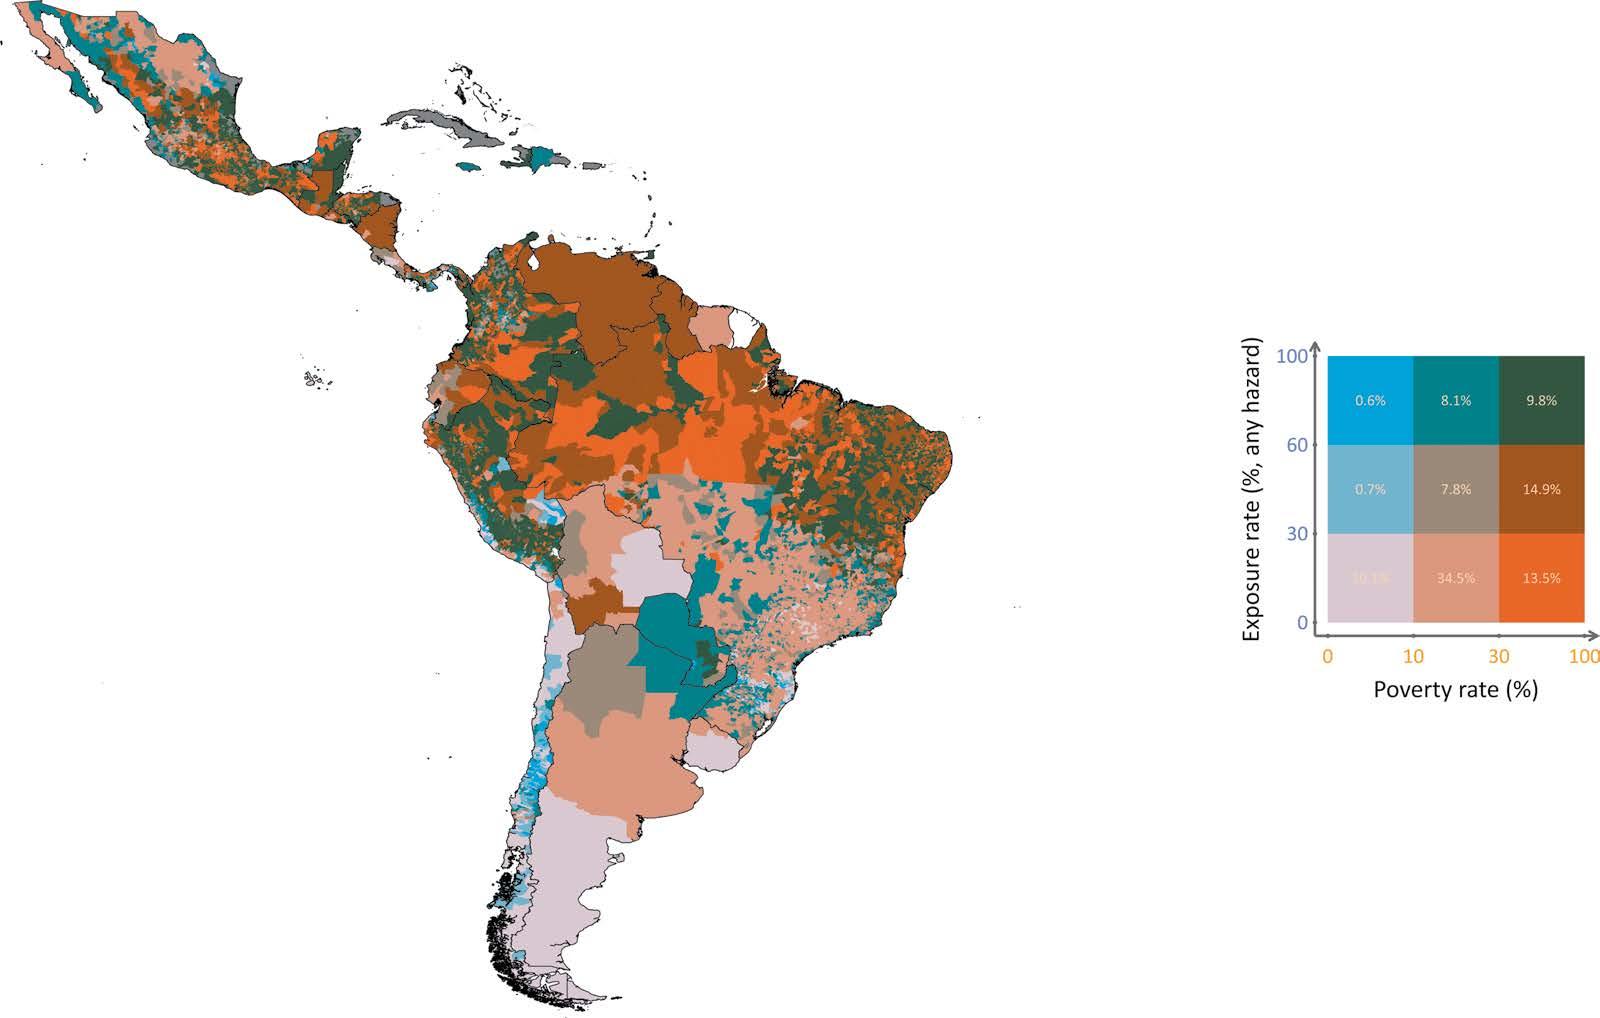
Hotspots where a high incidence of poverty and climate hazards overlap include the Yucatán’s Caribbean coast, along with parts of Mexico’s southern, Gulf, and Baja California peninsula coasts; the Central American Dry Corridor (parts of El Salvador, Guatemala, Honduras, and Nicaragua); parts of the Caribbean; northeast Brazil; the Amazonian areas of Brazil, Colombia, Ecuador, and Peru; and the Chaco region (Argentina, Bolivia, Brazil, and Paraguay) (refer to map ES.1). About 10 percent of the continent’s population—64.4 million people as of 2020—live in these high-risk zones.
MAP ES.1
Hazard exposure and poverty rates in LAC ($6.85, 2017 PPP)
Source: Brunckhorst et al., 2026.
Note: The legend shows the joint distribution of climate hazard exposure and poverty at the subnational level (municipalities, provinces, or countries). Climate exposure is measured as the share of the population living in grid cells where the probability of experiencing one or more severe climate hazards exceeds a predefined threshold, following Doan et al. (2023). Poverty is measured using the 2017 $6.85 PPP poverty line. Each color reflects the percentage of the local population that is both exposed to climate hazards and living in poverty. LAC = Latin America and the Caribbean; PPP = purchasing power parity.
ES.1
Climate hazards can drive nonpoor individuals into poverty and worsen hardship for those who are already poor. Together, these groups are considered vulnerable. Depending on the estimation method used in this report, between 3 and 16 percent of the region’s population is classified as climate vulnerable.
Poor individuals face greater climate risk. Not only are they more exposed because they are more likely to live in high-risk areas, but they are also more vulnerable because of the nature of their jobs (often agricultural, informal, or low paid) and their limited assets. As a result, when climate hazards hit, they are often forced to cut back on essentials or sell what little they have. Poor-quality housing and limited access to safety nets only add to their risk. Those who depend on fragile livelihoods such as rain-fed farming and ranching face an even harder road to recovery.
Beyond short-term drops in income and consumption, climate events also cause lingering social impacts. Comparatively few people die from climate disaster, but many more are affected (refer to figure ES.1), and this can translate into lost earnings, poor health and malnutrition, and disrupted schooling,
Number of casualties and people affected by climate disasters, 1970–2024 a. Number of casualties
b.
Number of deaths reported by EM-DAT
Source: Original figure for this publication, based on data from the Center for Research on the Epidemiology of Disasters, Université Catholique de Louvain.
Note: EM-DAT = Emergency Events Database.
which potentially affect their future productive capacity and living standards. This report draws on several studies that document these long-term impacts in the region. These studies (and the report’s own analysis) show that the direct consequences of climate hazards—deaths and destruction of assets— are proportionately greater in poor countries and that the poor people in each country are more vulnerable and suffer more. As such, well-designed adaptation policies represent a highly cost-effective investment in development. Although wealthier countries and subnational regions tend to be less affected, several poor countries have also managed to increase their resilience.
Government adaptation policies to reduce poor individuals’ exposure to climate risk are vital to tackling poverty. Because the impacts of climate hazards will only grow in the coming decades, individuals, governments, and businesses will need to adapt and protect themselves by lowering their exposure and vulnerability. Many adaptation efforts are private, but some actions require public coordination, such as establishing early warning systems or building flood barriers. Market failures such as poor access to information, weak property rights, and limited credit or insurance, together with equity concerns, also make government support necessary for the poorest and most vulnerable people.
A useful way to analyze climate risk adaptation is the prevention—insurance— coping framework. Prevention (for example, relocating people from flood zones) reduces the chance of losses, but when risks remain or prevention is too costly, people and governments turn to other mechanisms to manage residual risk. This can be self-insurance when the individual or government believe they have enough personal resources to finance the recovery or have market insurance (crop or property coverage, weather index products) to transfer risk and support recovery. Yet, not all risks are insurable, and many governments or individuals choose not to insure. Finally, coping mainly takes place after climate hazards occur, for example, giving cash to victims. Importantly, effective coping requires preparation and resources beforehand. The capacity to cope and adapt (or resilience) is sometimes built ex ante, through helping to stabilize incomes, so that households and communities have a greater capacity to cope effectively once climate hazards occur.
This report focuses on five adaptation efforts taken by different governments in LAC to address climate risk, spanning prevention, insurance, and coping systems. Under prevention, the report examines forecasting and early warning systems, protecting ecosystems such as forests through declaring protected areas and payments for environmental services, and smarter urban planning
with resilient infrastructure such as dams, sewers, roads, and clinics. Under insurance, the report looks at how governments use a mix of risk retention (their own funds) and risk transfer (paying others to take the risk) instruments to insure themselves. Retention involves ex post options, such as budget reallocations or issuing new debt, and ex ante ones that are planned ahead, such as disaster funds or credit lines. Risk transfer tools include insurance, reinsurance, and catastrophe bonds. Finally, under coping, the report studies how countries with different levels of adaptive social protection manage the impact of similar climate hazards. How widely are these five sets of tool kits (organized around prevention, insurance, and coping systems) used in the region, and how effective are they in protecting poor and vulnerable individuals?
The implementation of climate adaptation systems has so far had mixed results. Early warning systems and dams have saved lives. Effective forest management and protecting Indigenous land rights have helped fight deforestation and support inclusion, although legal titling alone has not always produced results on the ground. Gray infrastructure (such as dams, pipes, and roads) has sped up urban flood recovery. Small payments to incentivize sustainable practices can reduce poverty and deforestation but often have a modest impact because of weak enforcement and poor targeting.
LAC has been an incubator of innovative climate risk financing tools and index insurance to manage climate hazards. Colombia, Mexico, and Peru, among others, use weather insurance to fund disaster response. Catastrophe-driven drawdown options, first launched by the World Bank in 2008, followed by the Inter-American Development Bank and the Development Bank of Latin America and the Caribbean—have provided fast, reliable funding after disasters, which is especially useful for lowincome nations. The Caribbean Catastrophe Risk Insurance Facility, the world’s first regional parametric insurance fund, offers affordable coverage by pooling risks for 23 countries and has delivered more than $200 million in fast payouts since 2007. Mexico’s CADENA program allows states to buy weather insurance and receive payouts based on triggers such as rainfall deficits, with clear rules for distribution of funds to poor farmers. Nicaragua’s Climate Risk Insurance program, meanwhile, blends national-level insurance with local microinsurance to protect against climate hazards. Although the data are still accumulating, this report produces new evidence that some of these large-scale tools show promise in reducing poverty and improving cost-effectiveness in disaster response and preparation.
From 2021 to 2023, the World Bank assessed how well 14 countries were adapting their social protection systems to handle climate hazards. Protection systems were rated as nascent, emerging, or established on the basis of how well they scale support, coordinate across agencies, use data, and secure
financing. Where social protection systems are well established—as in Argentina, Brazil, Chile, the Dominican Republic, and Uruguay—the poverty gap tends not to widen after climate hazards materialize. In countries with nascent or emerging systems, however, the poverty gap can subsequently spike for years (refer to figure ES.2). Well-established adaptive systems are becoming more common, helping communities bounce back faster. Some countries are coupling cash transfers with asset-building programs to help people build sustainable livelihoods after the cash support ends, boosting climate-ready safety nets that speed recovery.
Most countries in LAC are taking steps to help people adapt to climate risks. Yet progress is uneven, with many countries still lacking key climate risk tools or having developed only partial adaptation systems. In the 14 LAC countries reviewed, risk retention tools (such as disaster funds) were used twice as often as risk transfer tools. This reflects the fact that the former are typically designed to cover frequent, low-impact events. Few countries use budget reallocations, and advanced tools such as parametric insurance or catastrophe bonds remain rare. Only Jamaica, Mexico, and Panama use a balanced, layered mix of tools.
Source: Sugastti and Carter 2025.
Note: Impulse response functions are calculated using 1981–2023 data from the Emergency Events Database and the World Bank’s World Development Indicators. Countries with nascent social protection systems include Belize, Honduras, and Paraguay. Countries with emerging social protection systems include Colombia, Costa Rica, Ecuador, Mexico, Panama, and Peru. Countries with established social protection systems include Argentina, Brazil, Chile, Dominican Republic, and Uruguay.
The World Bank assessment of adaptive social protection systems in the region finds that many remain nascent. In Honduras and Panama, fewer than 40 percent of vulnerable people receive cash transfers. Digital payments are improving, but many systems still lack modern platforms and updated registries. Weak coordination between disaster and social protection agencies further delays emergency response.
Countries should adopt climate adaptation instruments and systems that integrate prevention, insurance, and coping mechanisms. A traffic-light diagnostic across the region reveals wide disparities: Although some countries have built robust systems across all dimensions, others still face significant gaps. Brazil and Costa Rica, for instance, demonstrate strong readiness in multiple areas, enabling them to manage risks more effectively even under high exposure. In contrast, Honduras faces greater vulnerability and has fewer tools to mitigate the impact of climate hazards that materialize (refer to table ES.1). The traffic light assessment is not a ranking but a regional snapshot of risk profiles and a benchmark for progress. It highlights the need for tailored strategies based on each country’s specific vulnerabilities and risk profile. For some, the priority may be expanding access to resilient infrastructure and contingency financing; for others, scaling up social protection or early warning systems may yield the greatest impact. Ultimately, countries that invest in coordinated, layered adaptation instruments and systems are better positioned to protect their populations and limit long-term climate-related losses.
TABLE ES.1 LAC regional overview of climate exposure, vulnerability, climate risk impact, and adaptation: A traffic light system assessment (continued)
SYSTEMS
COUNTRY
Guyana
Haiti
Honduras
Jamaica
Mexico
Nicaragua
Panama
Paraguay
Peru
Puerto
St. Lucia
Suriname
Trinidad and Tobago
Uruguay
Venezuela, RB
EXPOSURE (% EXPOSED AND POOR)
VULNERABILITY
(% AT RISK OF POVERTY DUE TO CLIMATE)
ADAPTIVE
Source: Original calculations based on each dimension discussed in the chapter.
Note: Each cell in the table reflects a three-tier ordinal score (1 = low, 2 = medium, 3 = high). For the risk indicators—exposure, vulnerability, and climate risk impact—green indicates low risk, yellow indicates moderate risk, and red indicates high risk. For the adaptation systems, green signals strong performance or system readiness, yellow indicates moderate development, and red reflects weak or underdeveloped systems. Scores are assigned using a consistent methodology. For example, EWSs are scored from 1 to 3 on the basis of global classifications, from less than basic to advanced; adaptive safety nets are rated from nascent to established; and risk retention and risk transfer are based on the number of financial instruments in place. Other indicators, such as protected areas, critical infrastructure, exposure, vulnerability, and climate risk impact, are grouped into terciles based on their distribution across countries in the sample. Gray cells represent missing or unavailable data. EWS = early warning systems; LAC = Latin America and the Caribbean.
Ideally, decision-makers should assess their country policy systems and strive to build comprehensive climate adaptation systems simultaneously, encompassing prevention, insurance, and coping. Where this is not feasible, different priorities emerge depending on the country context.
More can—and should—be done. Development can be a good adaptation policy. Wealthier countries face fewer climate-related losses, but some poorer nations have made progress in building resilience. However, there is a notable gap across systems for some low- and low middle-income countries. To further reduce climate risks, the region needs a strategy to accelerate adaptation focused on providing more and better information for individuals and the private sector, stronger incentives to reduce their exposure, more investment in adaptation, and inclusive political institutions.
Adaptation policies can be improved and accelerated. Prevention saves lives and money, but governments often wait for climate hazards to strike. Forecasting and warning systems are underfunded and weak in some countries, and people do not always respond to alerts. Safe housing, dams, roads, and hospitals can reduce damage and speed recovery, but these investments sometimes get overlooked. Aid and insurance are not always fast or reliable. Many people across LAC still live in climate hazard–prone areas to be closer to work or services, and practices such as deforestation often make things worse, especially for poor people. Yet people’s choices to stay in danger zones are not always understood: They may underestimate risks or lack better options. Effective adaptation needs both individual and collective action focused on four things:
1. Providing smart incentives,
2. Getting the right information to people,
3. Making sure investments have benefits that outweigh costs, and
4. Ensuring political institutions support those most at risk.
Providing strong incentives helps encourage individuals and the private sector to take steps to reduce their exposure and vulnerability to climate hazards. Clear property rights, for instance, can boost resilience in urban slums by making it more likely that people will invest in floodproofing their homes. Building roads, providing buses to get to work, restoring parks, or even cutting back services in extremely hazardous locations can nudge people to reconsider their location, especially if their lives are at risk.
Good information is key to helping people and governments adapt. National climate science institutions can fine-tune their predictions, tapping into artificial intelligence and partnering with the private sector, and clear and trusted communication from the authorities helps people prepare and respond to climate hazards. Better data also support smarter economic tools, such as setting fair insurance premiums or targeting cash transfers during emergencies. When property values and insurance prices reflect real climate risks, people can make safer choices, and governments can plan better. Open access to data; active media; and transparent, trackable relief payments all help build trust and maximize impact, keeping public officials accountable.
As climate risks rise and budgets tighten, investment in adaptation is more urgent than ever, especially because many of those investments also boost broader development. According to the United Nations Environment Programme, LAC may need to invest up to $55 billion per year in climate adaptation in the remaining years until 2030, but funding remains slow, limited, and skewed toward mitigation. Grants are scarce and do not always reach those most in need. Development banks can help by scaling capital,
using innovative tools, and partnering with the private sector. Examples of the latter include Fideicomisos Instituidos en Relación con la Agricultura, the region’s first green resilience bond, which supports climate-smart farming in Mexico, and the Disaster Risk Insurance and Finance in Central America Consortium, a public-private collaboration to expand agriculture insurance for smallholder farmers in El Salvador, Guatemala, and Honduras. Governments can attract more private and multilateral finance by improving legal frameworks, expanding access to climate data, and embedding adaptation into their national development plans.
Accelerating climate adaptation in LAC is not just about money or improving technical aspects; it is also about politics. Political institutions shape how resources are used and often favor short-term relief or visible projects with immediate payoffs over long-term solutions such as resilient infrastructure or relocation. Relief often gets more attention than risk reduction because recovery and payouts bring votes. This short-term focus hurts the poorest people, who have the least political influence but need adaptation the most. Shifting incentives toward effective, long-term action requires informed citizens and stronger governmental accountability. Audits, transparency, and local oversight can push leaders to prioritize effective, equitable adaptation.
This report is organized into four chapters. Chapter 1 (“Unveiling Harm’s Way: Are Poor Individuals More Exposed to Climate Hazards?”) maps where climate hazards are more prevalent and intense and how they overlap with people—especially those who are poor—across countries and cities. Chapter 2 (“Risk of Climate Hazards: Assessing Vulnerability and Welfare Losses”) determines the extent and profile of those vulnerable to climate risk in the region, especially focusing on those who could fall into poverty (or become poorer) because of climate hazards. It then looks at impacts on mortality, assets, health, education, and (long-term) productivity, sometimes broken down by country income level. Chapter 3 (“Protecting Poor People from Climate Hazard Risks”) reviews the scope of five public adaptation systems in the region—early warning systems, gray (for example, dams and roads) and green (forests) resilient infrastructure, insurance, and adaptive safety nets— and how well they protect populations from climate risk. Chapter 4 (“Improving Adaptation”) explores why adaptation remains weak in many places, highlighting barriers such as low income, high costs, weak markets, and political disincentives. The chapter also offers solutions to strengthen adaptation through smarter policies to align incentives, better information systems, and political institutions to protect poor individuals, and mobilization of more resources for adaptation.
Beylis, Guillermo, and Nancy Lozano Gracia, eds. 2025. From Resource Rich to Resource Smart: Opportunities for Latin America and the Caribbean in the Energy Transition. Washington, DC: World Bank. https://openknowledge.worldbank.org/entities /publication/27c02170-0e65-4785-8731-da749f999a30
Brunckhorst, Ben James, Miki Khanh Doan, Alejandro de la Fuente, Samuel FreijeRodriguez, Catalina García, and Minh Cong Nguyen. 2026. “Are the Poor More Exposed to Climate Hazards in Latin America?” Policy Research Working Paper, World Bank Group, Washington, DC. http://documents.worldbank.org/curated/en /099352505202617344
Doan, Miki Khanh, Ruth Hill, Stéphane Hallegatte, Paul Andres Corral Rodas, Ben James Brunckhorst, Minh Nguyen, Samuel Freije-Rodriguez, and Esther Naikal. 2023. “Counting People Exposed to, Vulnerable to, or at High Risk from Climate Shocks—A Methodology.” Policy Research Working Paper 10619, World Bank, Washington, DC. http://documents.worldbank.org/curated/en/099602511292336760
Shilpi, Forhad, Matthew E. Kahn, and Claudia Berg. 2025. Rethinking Resilience: Adapting to a Changing Climate. Washington, DC: World Bank. https://doi .org/10.1596/978-1-4648-2158-5
Sugastti, Marcos M., and Michael R. Carter. 2025. “Asset Protection and Disaster Risk Financing to Improve Shock-Responsive Protection in Latin America and the Caribbean.” Background paper, Adapting to Adversity: Climate Risks and Poverty in Latin America, World Bank, Washington, DC.
World Bank. 2022. A Roadmap for Climate Action in Latin America and the Caribbean, 2021–2025. Washington, DC: World Bank. http://hdl.handle.net/10986/38001
World Bank. 2025. Taxing and Subsidizing Energy in Latin America and the Caribbean: Insights from a Total Carbon Price Approach. Washington, DC: World Bank. http://hdl.handle.net/10986/43174
AC air conditioning
AI artificial intelligence
ASI Agricultural Stress Index
CAPRA Central American Probabilistic Risk Assessment
CAT bonds catastrophe bonds
CBA cost-benefit analysis
CCKP Climate Change Knowledge Portal
CCRIF Caribbean Catastrophe Risk Insurance Facility
CCTs conditional cash transfers
CRI climate risk induced
CSA climate-smart agriculture
EM-DAT Emergency Events Database
ESI Environmental Stress Index
EWS early warning system
FAO Food and Agriculture Organization of the United Nations
FIRA Fideicomisos Instituidos en Relación con la Agricultura
FONDEN Fondo de Desastres Naturales
GCF Green Climate Fund
GCRI Global Climate Risk Index
GDP gross domestic product
GEF Global Environment Facility
GHSL Global Human Settlement Layer
GRMs grievance and redress mechanisms
LAC Latin America and the Caribbean
MDBs multilateral development banks
PB participatory budgeting
PCIC Philippine Crop Insurance Corporation
PES payment for ecosystem services
PI poverty induced
PM2.5 fine particulate matter
PPP purchasing power parity
PROGRESA Programa de Educacion, Salud y Alimentacion
RI risk induced
STORM Synthetic Tropical Cyclone Generation Model
VSL Value of Statistical Life
WFP World Food Programme
WMO World Meteorological Organization
All monetary amounts are US dollars unless otherwise indicated.
To understand the risk of climate hazards, it is necessary to understand the components of risk. Risk can be defined as the size of losses that are likely to occur because of an event. In the case of climate hazards, it refers to the expected of losses (in terms of lives, assets, incomes, livelihoods, or some other measure of loss) that are likely to occur because of a severe climate event.
Usually, climate hazard risk is understood as the result of the combination of three factors: hazard, exposure, and vulnerability. A hazard is the potential occurrence of a natural or human-induced physical event or trend that may cause loss of life, injury, or other health impacts, as well as damage to and loss of property, infrastructure, livelihoods, service provision, ecosystems, and environmental resources. Exposure is the presence of people, assets, livelihoods, infrastructure, and ecosystems in places and settings that could be adversely affected by climate hazards. Vulnerability is the propensity or predisposition to be adversely affected. It encompasses a variety of concepts and elements, including sensitivity or susceptibility to harm and lack of capacity to cope and adapt (sometimes called resilience). Figure 1.1 is a representation of this understanding of climate risk.
This chapter concentrates on the hazard and exposure components of climate risk in Latin America and the Caribbean (LAC). We compute the number of people, poor and nonpoor, exposed to a selected list of climate hazards of special importance to the region. Chapter 2 discusses the sources of vulnerability to these hazards and the risk they pose in terms of selected indicators of well-being.
FIGURE 1.1
Components of
Source: Brunckhorst et al. 2023, as drawn from Intergovernmental Panel on Climate Change 2012, 2022.
Climate hazards tend to strike many people or households in a community or region simultaneously, but, depending on multiple factors, they usually affect people and households differently. The frequency of hazards varies. Minor floods occur frequently, whereas category five hurricanes are rarer. Moreover, the severity of hazards can range from catastrophic, such as a drought that leads to famine, to minor, such as a few days with poor rains. Climate hazards also differ in their onset speed. For example, droughts and heat waves are slowonset events, but floods or hurricanes often have a rapid onset. In this section, we select and define levels of severity of the climate hazards affecting the population of the LAC region and account for the number of people, poor and nonpoor, exposed to these events.
Climate hazards are pervasive in LAC because of its geographical location. Lying within the North Atlantic basin hurricane belt, the Caribbean and Central America are subject to frequent hurricanes and intense storms that can lead to extensive damage from strong winds, storm surges, and extreme precipitation. Storms and hurricanes make landfall every year, and in some parts of the region they can occur as often as multiple times per year or as rarely as every five to 10 years. Additionally, river flooding is fairly frequent across the continent, and the region is also vulnerable to flash floods and landslides from severe storms.
Floods, hurricanes, and droughts are not new to the region. A severe drought coupled with deforestation may have contributed to the collapse of the Mayan civilization. Historical Spanish documents reveal the first reported Atlantic hurricane in the Caribbean basin occurred in 1494 at Isabella, Santo Domingo. When Columbus arrived at Hispaniola (the island in the western Caribbean that is now divided into the Dominican Republic and Haiti) on June 29, 1502, his ship had weathered a storm but was denied docking by the governor. Although Columbus himself survived the weather, the fleet that departed was later destroyed by a hurricane.
Although storms, floods, and droughts have gotten most of the attention, other hazards such as heat waves and wildfires are also becoming more common and more intense. This study looks at five key climate hazards in the region— hurricanes, floods, landslides, droughts, and heat waves—because they make up the bulk of climate events in the region.1 According to the Emergency Events Database (EM-DAT), floods and storms (dominated by hurricanes in LAC) are the most common, making up nearly half of all weather- and climate-related disasters between 2003 and 2023 (refer to figure 1.2). Droughts and landslides come next, followed by heat waves and wildfires.
Extreme climate hazards are not just happening more often, they are hitting harder than ever. The Amazon drought in 2023 was the worst on record, with the Negro River near Manaus, Brazil, dropping to its lowest level since measurements began 120 years ago. Hurricane Otis jumped from a tropical storm to a category five hurricane in just 12 hours, and Beryl became the earliest category five hurricane ever recorded. There is an urgent need to study the most effective ways to reduce the costs of these events, especially because the poorest households are those hit hardest. Weather- and climaterelated disasters have increased fivefold, according to the World Meteorological Organization. Our own analysis based on EM-DAT data corroborates this increase.2
Countries experience climate hazards in unique ways, but some contend with multiple hazards, each with varying significance. Hurricanes are recurrent on the Atlantic and Pacific coasts of Central America and Mexico and on the Caribbean islands. Floods and landslides affect coastal regions of South America and some of its inland areas. Droughts are more prevalent across semiarid tropical regions, such as northeast Brazil, the Central American Dry Corridor, and Northern Mexico. Figure 1.3 shows that Mexico and the Caribbean countries most often get hit by storms and floods. In Central America, droughts are also recurrent. In South America, the top climate hazard is mainly floods. But just tracking how often and where these events happen does not tell about how many people are actually exposed to them.
1.2 Frequency of climate hazards in LAC
Number of events
Time periods (years)
Source: EM-DAT, Centre for Research on the Epidemiology of Disasters (https://www emdat.be).
Note: The data analyzed by EM-DAT relate to disasters classified as “natural” that have unfolded in LAC between 1943 and 2023. A disaster needs to meet one of the following criteria to be listed in the database: (1) 10 or more people reportedly killed, (2) 100 or more people affected, (3) a declaration of a state of emergency, or (4) a call for international assistance. This report considers the natural disasters reported in EM-DAT as drought, extreme temperature, flood, landslide, storm, and wildfire as natural hazards. EM-DAT = Emergency Events Database; LAC = Latin America and the Caribbean.
Number of climate disasters in LAC, by subregion, 2003–23
Source: EM-DAT, Centre for Research on the Epidemiology of Disasters (https://www.emdat.be).
Note: LAC = Latin America and the Caribbean.
At the same time as climate hazards are increasing, years of economic expansion in Latin America may have spurred migration into and development of hazardprone areas. This trend is noticeable in booming coastal cities and towns across the Yucatán Peninsula and in growing cities in the Caribbean, Central America, and South American floodplains alike. Hispaniola’s population was sparse in the precolonial era but the Dominican Republic and Haiti now house millions exposed to hurricanes and rank among the world’s most storm-exposed nations. Similarly, the Yucatán Peninsula, where many cities were abandoned between 800 and 950 AD after the collapse of the Mayan civilization, has again become one of Mexico’s fastest-growing, high climate risk population zones. Migration into hazardous regions is not solely the result of lack of knowledge.
So, how many people are actually exposed to these hazards in LAC? To figure that out, one can combine maps of where climate hazards happen with maps showing where people live. By matching them up at the grid-cell level (basically, a small territorial unit defined by data availability), one can estimate how many people live in areas exposed to each hazard—or even multiple ones. This is a two-step procedure.
First, a map of the distribution of climate hazards over the territory of the continent is needed. Data for each hazard come with a spatial resolution, which refers to the geographic correlation of this hazard over a specific territory. For example, a data set with a 3-arcsecond spatial resolution has grid cells corresponding to a square area of approximately 100 meters by 100 meters at the equator. Then, for each hazard, an event is considered severe on the basis of specific thresholds of intensity and frequency. Hence, every unit of the territory is assigned a dichotomous variable if it is above or below these thresholds. Namely, the territory is designated as either prone to a high-severity event or not. Admittedly, every territory is exposed to some probability of a severe climate event, but, because the probability is above or below a certain predetermined threshold, this transformation designates a territory as either exposed to a severe event or not. Box 1.1 describes the sources of data for the five climate hazards included in this study, as well as the thresholds that define a severe event.3
This study looks at five climate hazards: floods, landslides, droughts, heat waves, and hurricanes. These events are defined by how intense they are and how often they occur (known as the return period ). For example, a 100-year return-period event is expected to happen once every 100 years or has about a 1 percent chance of happening in any given
year. The thresholds used focus on events likely to cause serious damage, following Doan et al. (2023) and Hill et al. (2025). The analysis uses modeled probabilistic hazard data that consider variability in the weather over several decades and do not represent a single historical year. Only drought is deterministic, given the availability of data sources.
•
Floods: The analysis covers three main types of flooding: fluvial (river), pluvial (surface water), and coastal floods. The flood hazard data are sourced from the 2019 Fathom global flood data set (version 2.0; https://www.fathom .global/product/global-flood-map/) for fluvial and pluvial floods and the Deltares coastal flood data set ( https://microsoft.github.io /AIforEarthDataSets/data/deltares-floods.html) for storm-surge-related flooding. The analysis considers a threshold of at least 50 centimeters maximum inundation depth for a 100-year return period.
• Landslides: Landslide hazards are assessed using the Global Landslide Hazard map ( https://datacatalog.worldbank.org/search /dataset/0037584/global-landslide-hazard -map), which estimates the annual frequency of landslides triggered by both rainfall and seismic activity. The analysis combines the highest frequency of either trigger to create a comprehensive hazard profile. Rainfall-induced landslides are based on historical data from 1980 to 2018, and seismic-induced landslides account for unpredictable but potentially widespread events. The analysis focuses on landslide size of at least greater than 100 square meters for a 100-year return period.
• Droughts: The analysis uses the Food and Agriculture Organization of the United Nations Historic Agricultural Drought Frequency data set, which identifies severe drought occurrences over a 39-year period (1984–2022). This data set is based on the Agricultural Stress Index ( https://www.fao.org/giews/earthobservation /asis/index_1.jsp?lang=en), which uses remote sensing data such as the Vegetation Health Index to monitor crop stress resulting from drought. Locations where at least 30 percent of cropland or grassland is affected in any growing season are classified as exposed in any year over a 39-year period.
• Heat waves: The study incorporates fiveday heat wave maps from the World Bank’s Climate Change Knowledge Portal ( https:// climateknowledgeportal.worldbank.org/), which uses the Environmental Stress Index (ESI) as a proxy for wet bulb globe temperature. The data set models heat wave intensities based on temperature, humidity, and solar radiation. To improve accuracy, the ESI is adjusted for underestimation using correction factors. Historical data from 1950 to 2022 are detrended and fitted to generalized extreme value distributions to estimate return levels for five-day heat wave events. The analysis then considers a threshold of at least 33°C maximum five-day average of daily peak ESI values for a 100-year return period.
• Hurricanes: Hurricane exposure is assessed with the Synthetic Tropical Cyclone Generation Model (STORM) by Bloemendaal et al. (2020). This data set extends historical hurricane track data from the International Best Track Archive for Climate Stewardship by resampling and simulating 10,000 years of hurricane activity. The analysis defines exposure on the basis of wind speed thresholds, categorizing locations as vulnerable if the 10-minute average maximum wind speed exceeds 37.6 meters per second (category two) for a 100-year return period. Although the STORM data set primarily focuses on wind hazards, associated storm surge and heavy precipitation impacts are incorporated through flood hazard maps.
The data for hazards and population come from different sources and vary in resolution. Among the five hazards, the flood layer has the highest spatial resolution; the other four hazards have lower spatial resolutions. The sources of data for each hazard and the thresholds for the definition of severe climate events (in terms of return period and intensity of the event) are summarized in table B1.1.1.
Box 1.1 Climate hazards data (continued)
TABLE B1.1.1 Severe hazard definitions and sources of data HAZARD
Flood Fathom Global flood data set (version 2.0; https:// www.fathom.global/product /global-flood-map/) (fluvial and pluvial)
Deltares coastal flood data set for 2021 (coastal stormsurge-related flooding; https://microsoft.github.io /AIforEarthDataSets/data /deltares-floods.html)
3″ (≈90 m)
Landslide World Bank (2020) ≈30″ (1 km)
Probabilistic 100 Inundation depth of at least 50 cm
Deterministic 100 Landslide size of at least more than 100 m2
Agricultural drought FAO (2023); Schiavina, Melchiorri, and Pesaresi (2023) ≈30″ (1 km) Deterministic 40
Heat wave CCKP (World Bank 2024b) CCKP ESI: 0.25° (≈30 km)
Hurricane Bloemendaal et al. (2020) 6″ (~11 km)
Probabilistic 100
At least 30% of cropland or grassland affected by severe drought in any season, confined to rural areas
At least 33°C maximum 5-day average of daily peak ESI values
Probabilistic 100 Wind speed of at least category 2 threshold (37.6 m/s, 10-min sustained)
Source: Brunckhorst et al., 2026.
Note: CCKP = Climate Change Knowledge Portal; ESI = Environmental Stress Index; FAO = Food and Agriculture Organization of the United Nations; GHSL = Global Human Settlement Layer; RP = return periods.
These are absolute thresholds for each hazard. This means that, like international poverty lines, they may not be as relevant in every country. They identify people relatively more exposed at a global or regional level. Some areas might have more heat waves compared with other parts of the same country, but this does not mean the level of heat is the same as that experienced in tropical regions. The results also depend on the variables used to measure hazards and the data sources that are documented. There are many ways to measure droughts and heat waves, for example. We are consistent across countries for global work. Country-specific work might use appropriate thresholds in the same way as it uses national poverty lines.
Moreover, it is important to underscore that these thresholds define a dichotomous variable of highor low-severity events and then define a population as exposed or not exposed. But the entire population is to some degree exposed to climate hazards. These thresholds are somewhat arbitrary, and a different definition of the
intensity and return period of the event would render different exposure rate estimates. The estimates included in this study follow previous research by the World Bank and are intended to facilitate international comparisons between countries and regions.
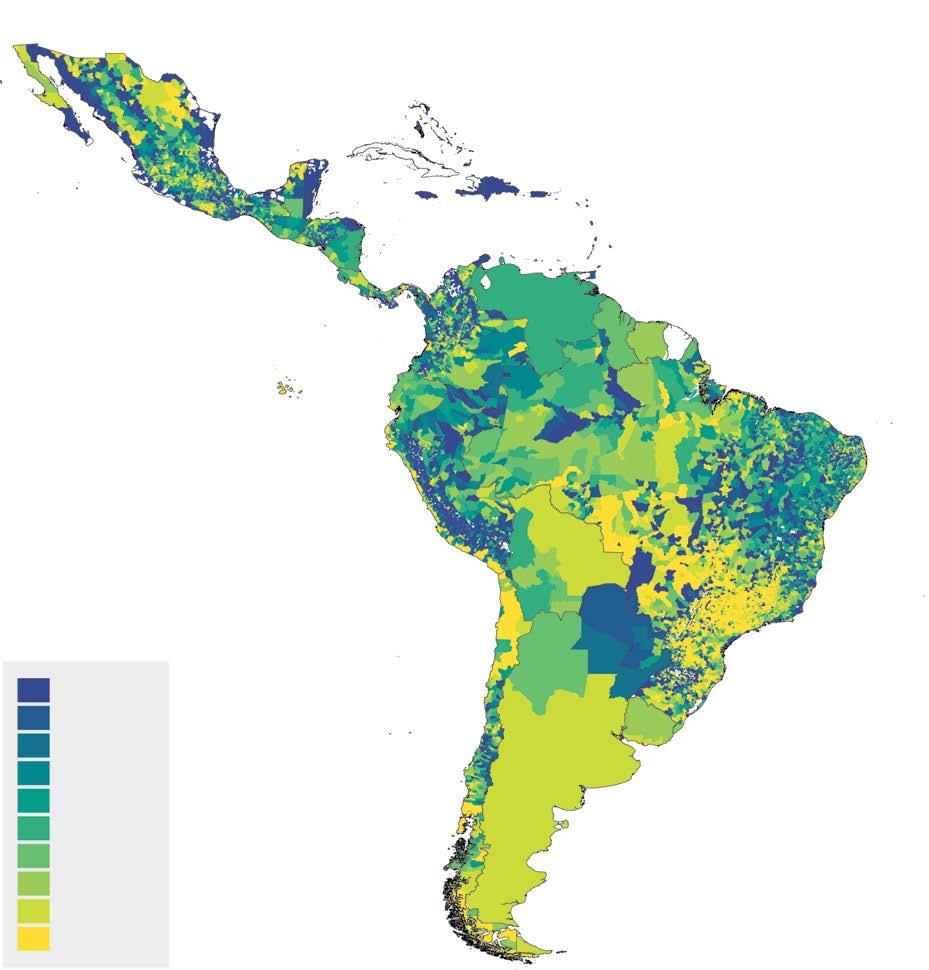
Second, a map of the percentage of the population exposed to severe hazards is produced for each hazard and a combination of hazards. The five binary hazard layers are combined into one multihazard layer, where each grid cell contains information on which hazards the cell is exposed to. The final step is to weight each of the single-hazard maps, as well as the multihazard map, with information about population in each similar cell. Given that these cells can be grouped into specific administrative units, this allows us to calculate the number of people exposed to any given combination of hazards without double-counting individuals exposed to multiple hazards. Exposure rates are then defined as the percentage of the population in cells of high-severity hazard within the total population of a given administrative unit.4 Map 1.1 shows the population exposure rate of the five hazards described in box 1.1, separately. Map 1.1f provides the population exposure rates to any of these five hazards.
High flood exposure (that is, more than 60 percent of the population exposed) of the total population of a given area is seen on the Pacific Coast and in the Amazonian plains of southern Colombia, some municipalities of western Ecuador, and the west and northwest jungles of Peru, as well as the upper and delta regions of the Amazon River in Brazil (refer to map 1.1a). High exposure to landslides is seen in the municipalities across the Andean mountain chain of Colombia, Ecuador, Peru, and the La Paz department of Bolivia, as well as some municipalities in the Atacama and Coquimbo regions of northern Chile, the western and eastern slopes of Sierra Madre del Sur in Mexico, and southern Guatemala (refer to map 1.1b).
High exposure to drought is seen in vast sections of the Brazilian northeast, Andean mountain chain in Peru, southern Bolivia, Paraguay, central Chile, the plains of western Colombia, the western half of Honduras, Nicaragua, the Pacific coast of Panama, and the Sierra Madre Occidental and Oriental in Mexico (refer to map 1.1c). High rates of population exposure to heat waves are
found on the coast of the Gulf of California; the coast of the Gulf of Mexico; the Caribbean coast of the Yucatán Peninsula; Belize and parts of Central America; the area of the Amazon River around Manaus in the Brazilian states of Amazonas and Para; and the Chaco region of Argentina, Brazil, and Paraguay (refer to map 1.1d).
Population exposure to climate hazards 90−100
a. Flood exposure rate of total population
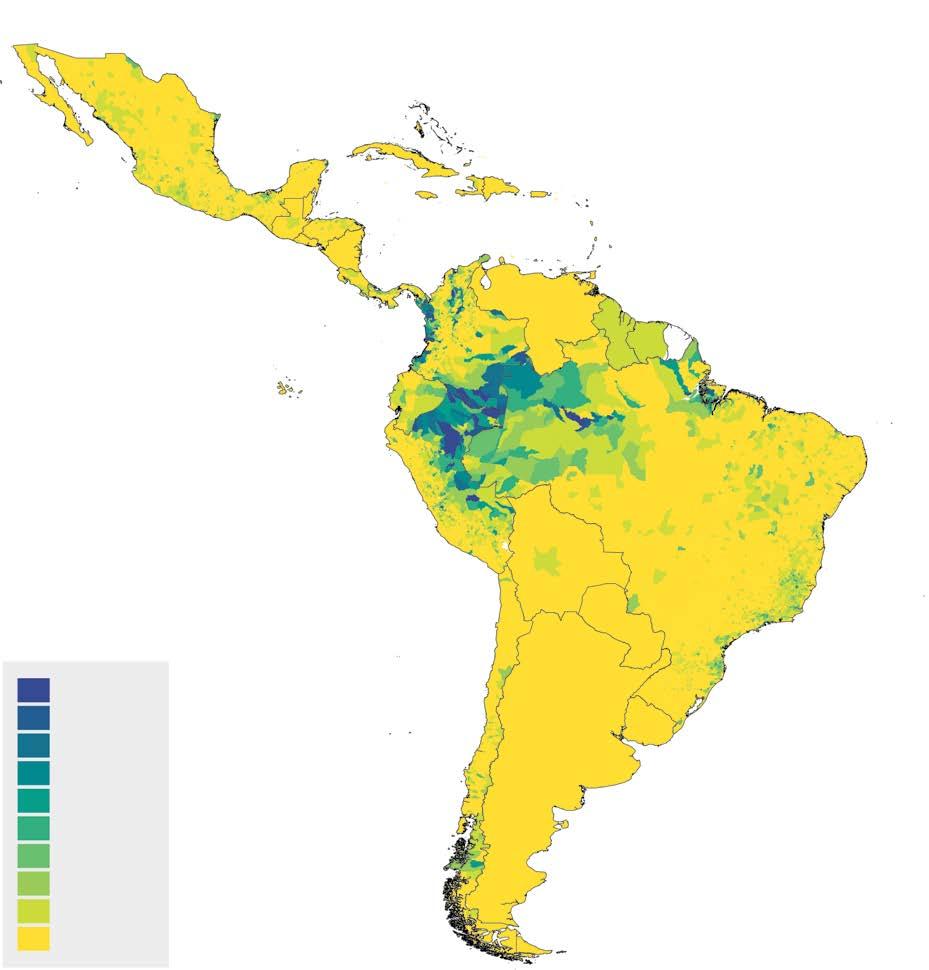
c. Drought exposure rate of total population
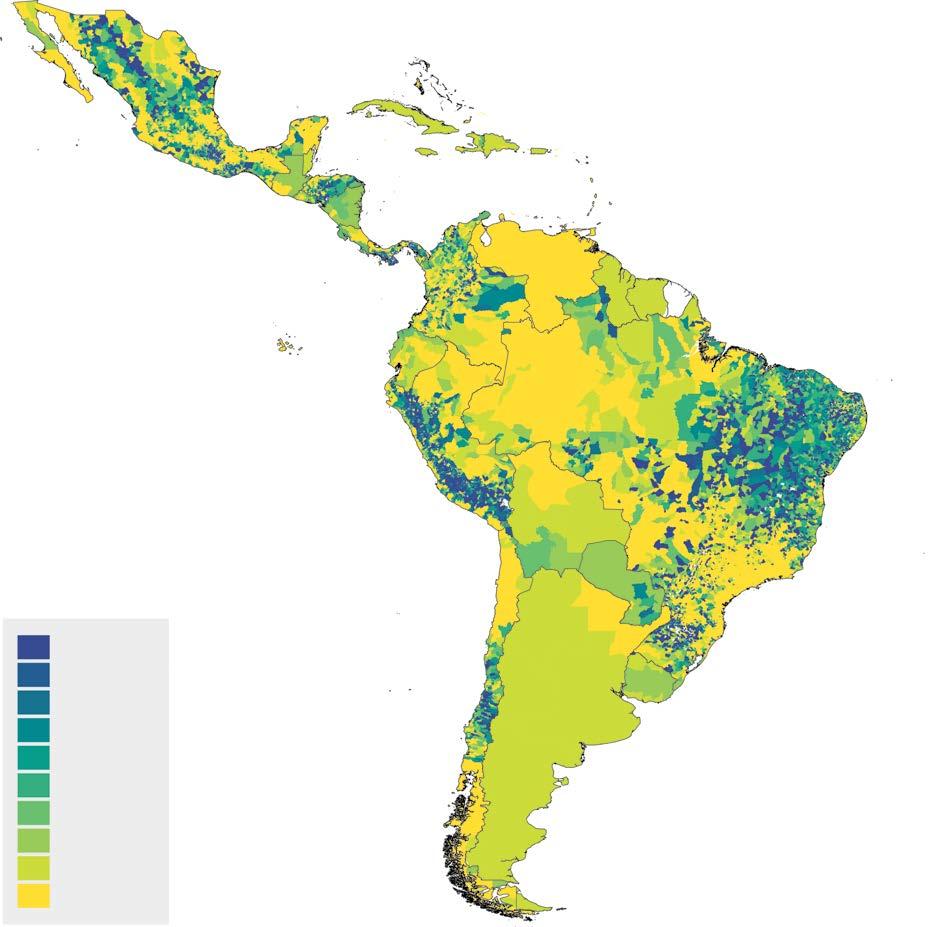
b. Landslide exposure rate of total population
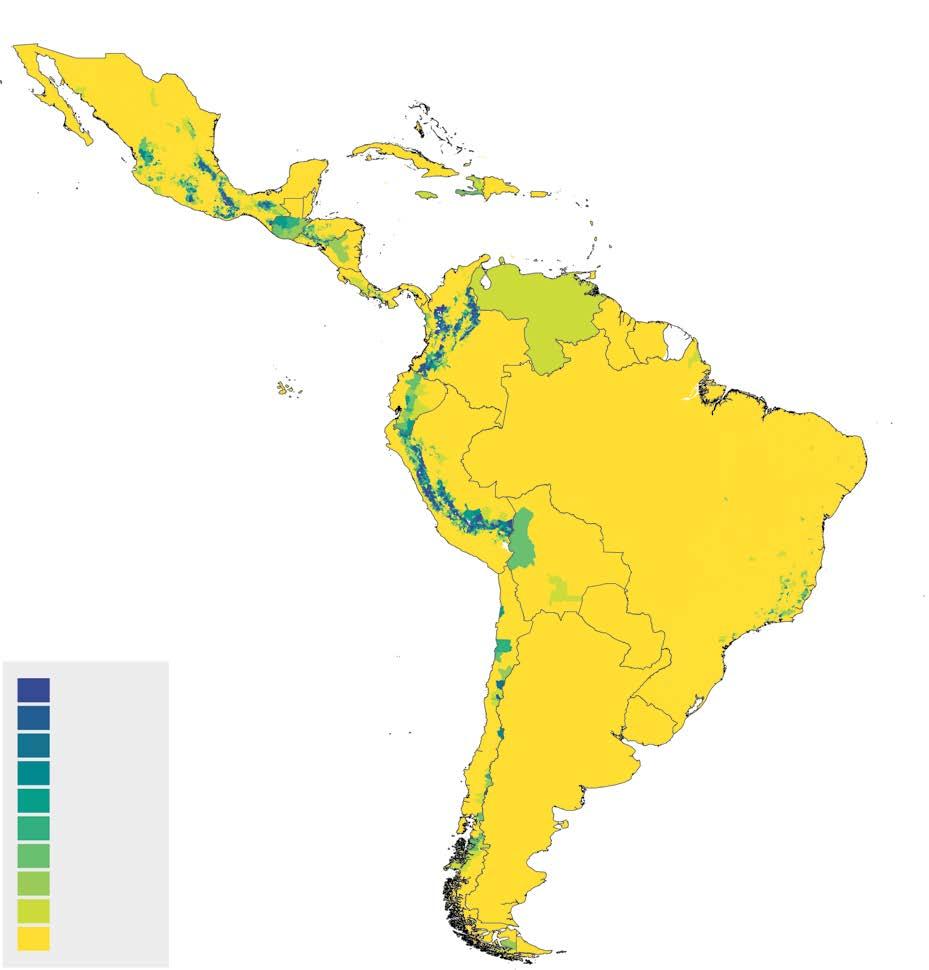
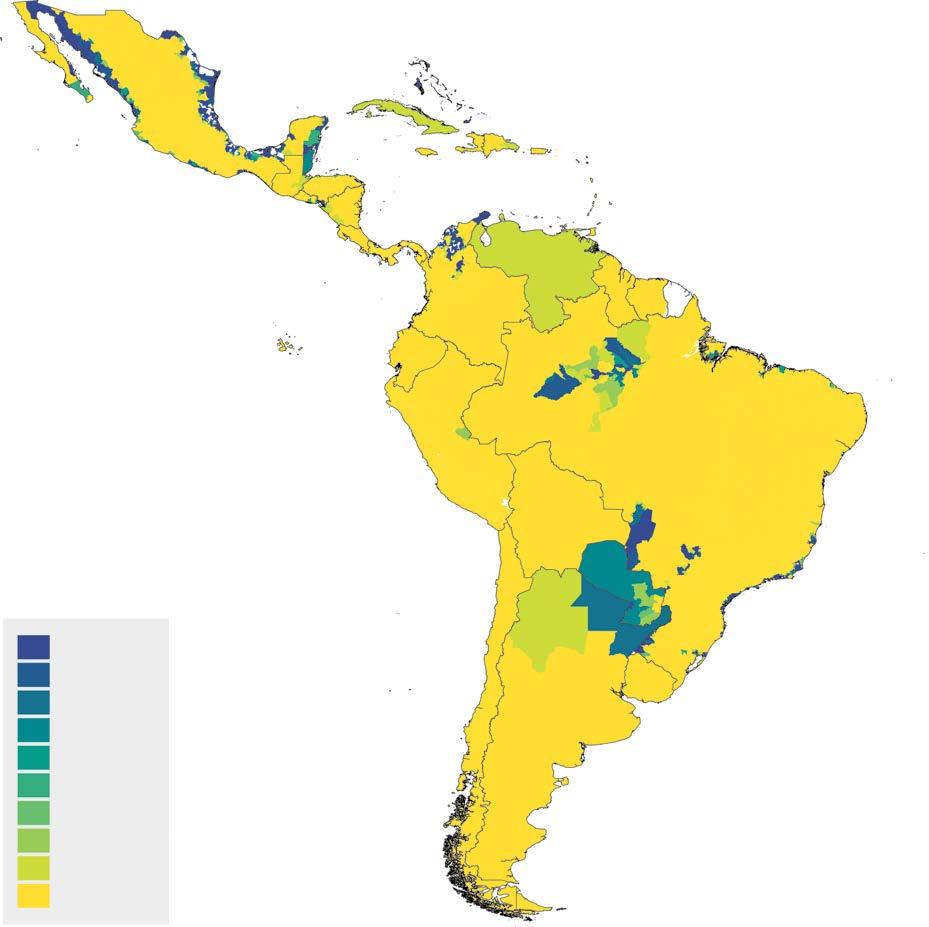
d. Heat exposure rate of total population continued
MAP
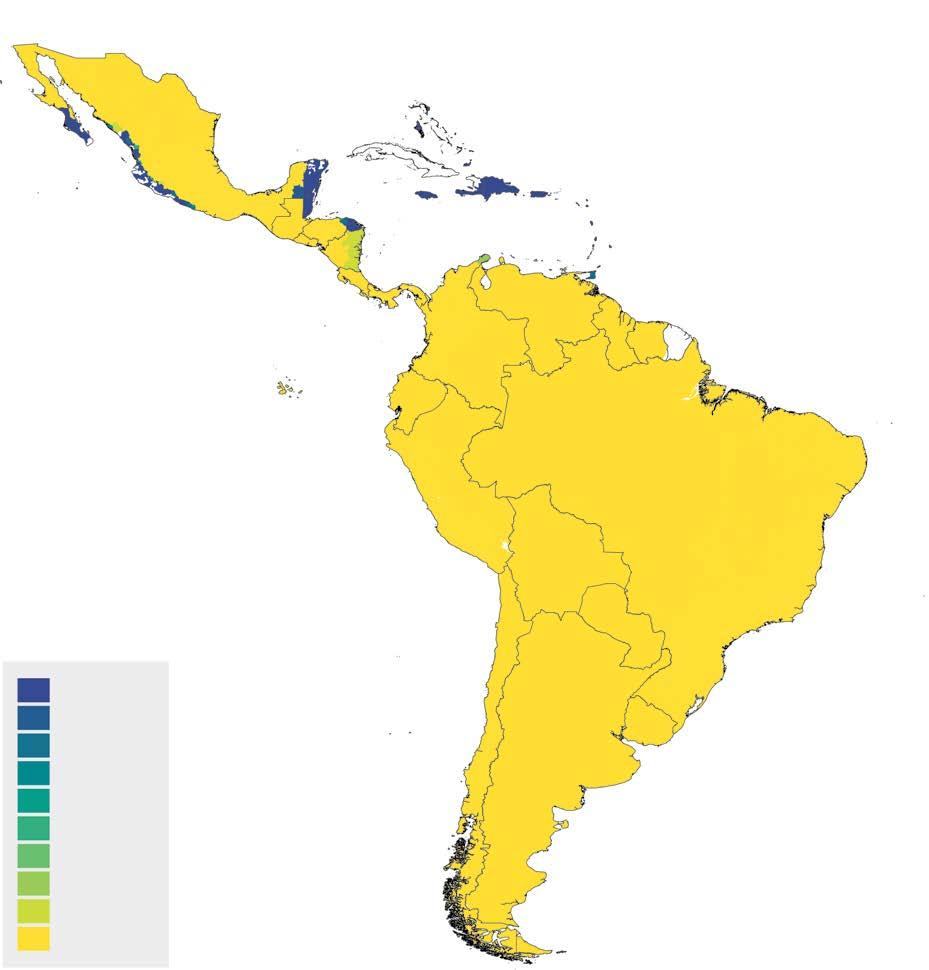
e. Cyclone exposure rate of total population f. Any hazard rate of total population
Source: Brunckhorst et al., 2026.
Note: The legend represents the percentage of the population of an administrative division (that is, county, province, or country) that lives in a geographic grid with a probability above a predetermined threshold that defines one or several severe climate events (Doan et al. 2023).
Finally, high population exposure to hurricanes is concentrated in the Caribbean islands, most of the coast of the Yucatán Peninsula, the eastern parts of Honduras and Nicaragua, the southern tip of the California peninsula, and the central-eastern Pacific coast of Mexico (refer to map 1.1e).
Although vast sections of the region have low exposure to some hazards (for example, all of South America has low exposure to hurricanes), almost the whole continent has a high proportion of the population exposed to any of the five considered in this study (refer to map 1.1f). This calls for preparedness suitable to the different climate hazards faced by different population groups and locations.
Severe climate hazards are spread across much of LAC’s territory, which is why so many people in the region live in high-risk areas. But are these highexposure areas also where poverty is most common? Are poor regions and neighborhoods more exposed to severe climate hazards than wealthier ones? In this section, we break down exposure rates by type of hazard, comparing poor and nonpoor populations across the region—and in a few selected countries.
According to most recent estimates, poverty in LAC dropped to its lowest point thus far this century, with one in four people living below the uppermiddle-income-country poverty line of $6.85 per person per day (2017 purchasing power parity).5 The poverty rate for the region was 27.1 percent in 2020 (the reference year for the maps), increased to 27.8 percent in 2021, and has since declined to 22.9 in 2024 (estimate), well below the poverty rate a decade ago (28.3 percent in 2015) and half the level at the beginning of the century (49.8 percent in 2000). This equates to around 151 million people experiencing poverty in the region as of 2024 (down from around 175 million in 2020). A profile of the poor in LAC shows that they are more likely to be younger, have lower levels of educational attainment, and live in rural areas than population in the vulnerable group and the middle class.
Latin America continues to be one of the most unequal regions in the world. However, there is an important dispersion among countries in the region. Brazil and Colombia are the countries with the highest inequality levels as measured with the Gini coefficient (53.9 points and 51.5 points as of 2023, respectively), whereas the Dominican Republic has the lowest inequality levels in the region, with a Gini coefficient below 40 points. However, over the past two decades, most countries in the region have experienced a slight decline in the Gini coefficient (World Bank 2024b).6
The link between climate hazards and poverty is elusive, and causality is difficult to establish empirically. Among other reasons is the two-way relationship between the vulnerability to poverty and climate hazards. Poor individuals struggle to protect themselves adequately from climate hazards because of their lower physical and human capital. Whole communities are often affected, undermining the effectiveness of coinsurance, particularly when combined with the limited resources of impoverished households. At the same time, whether in rural or urban settings, poor individuals are often compelled to inhabit hazard-prone areas, such as steep lands or squatter settlements where land ownership is more accessible and rents are affordable, to be closer to jobs. Poverty itself sometimes encourages practices that increase exposure to climate hazards. The use of inexpensive yet low-quality housing materials and engagement in unsafe or less-resilient activities, such as rain-fed agriculture, exacerbates exposure. Chapter 2 discusses this in more detail.
An initial method for examining the connection between climate and poverty involves quantifying the impoverished population in regions exposed to climate hazards without implying direct causal relationships.7 This entails overlaying poverty maps with modeled hazard maps for various events and probabilities. Beyond just the likelihood of facing a hurricane or coastal floods, understanding
the geographical distribution of hazards is crucial for decision-making. This enables the assessment of exposure, which includes evaluating the number of people that could be affected if a hazard occurs.
On the basis of map 1.1, produced for this report, just over a third of LAC’s population—around 240 million people as of 2020—is exposed to at least one of the five major climate hazards included in this study. Droughts top the list, affecting 13.4 percent of the population. Heat waves and hurricanes follow, reaching 9.9 and 7.9 percent of the region’s population, respectively, and landslides and floods each affect 6.3 percent. The rest of the population—about 63.0 percent—is also exposed to climate hazards, but not at levels considered severe in this study (refer to table 1.1).8
People living in poverty have a higher exposure to climate hazards than nonpoor people. About 44.6 percent of poor people are exposed to at least one severe climate hazard, compared with 34.0 percent of nonpoor people. Poor individuals have higher exposure rates than nonpoor individuals across all five hazards considered—except for heat waves, for which both groups are equally exposed (around 10 percent). The biggest gap in exposure rates between poor and nonpoor people is found for droughts: Nearly one in five poor people are exposed, versus just one in 10 nonpoor people (refer to table 1.1). This gap is partly explained by the higher incidence of poverty in rural areas, where droughts are more common.
Most people are exposed to only one hazard (30.7 percent), with far fewer exposed to two (5.6 percent) or three (0.6 percent). Fewer than 0.1 percent deal with four or five hazards. The trend is similar for both poor and nonpoor individuals, but poor individuals are more affected—37.8 percent versus 28.7 percent for one hazard and 7.8 versus 4.8 percent for two. So although a large percentage of the population is exposed to at least one hazard, very few are exposed to multiple ones. And most people are exposed to different hazards, which makes policies for prevention and protection more complex because a single policy may not be appropriate for the variety of climate hazards and risks involved. Chapters 3 and 4 dig into this more.
Table 1.1 shows how many poor people are exposed and how their exposure rates compare with those of nonpoor people. But where are poor individuals actually located? In terms of poverty incidence, the continent looks almost bimodal. Regions with low poverty (less than 10 percent) are mostly in Argentina, Chile, Uruguay, Santa Cruz in northern Bolivia, Lima in Peru, Cundinamarca and other central provinces in Colombia, southern Brazil, Panama, central Costa Rica, and parts of Mexico, such as the Valle de México and the area around Monterrey city in Northern Mexico. In most cases, these areas are usually connected to the large metropolitan areas of the capital cities, showing a clear rural-urban poverty divide in the region. Most of the rest of the continent, though, has poverty rates of more than 20 or even 30 percent (refer to box 1.2 for a description of the region’s poverty maps).
TABLE 1.1 Distribution of exposure rates by climate hazard for total, poor, and nonpoor populations, LAC region
Source: Brunkhorst et al. 2024.
Note: Difference in exposure incidence refers to poor minus nonpoor.
Poverty rates and profiles do not give a detailed description of the location of poor households beyond the urban-rural divide. In some cases, poverty rates can be produced at subnational, county, or locality levels, but in others such data do not exist. Poverty mapping is then a useful technique.
Poverty maps are a well-known approach to studying the geographical distribution of welfare in general and poverty in particular. They are used to add spatial granularity to welfare measurement that is not usually available from other sources of data (usually surveys) that are not representative at the local or even provincial level. Poverty maps use census and survey data, together with statistical and econometric techniques, known as small area estimation, to estimate measures of welfare at smaller levels of geographic territory than conventional surveys permit. There is now a large literature on the advantages of this type of measure and the methods used to build them— for instance, Bedi, Coudouel, and Simler (2007); Corral, Henderson, and Segovia (2025); Elbers, Lanjouw, and Lanjouw (2003); and Molina and Rao (2010).
This report uses poverty maps derived from Brunckhorst et al. (2026), who use data from two sources. First, national poverty maps at the
municipal level provide official estimates of the share of poor households at the administrative boundary level 2 (that is, county or municipality) using the national poverty threshold in the local currency units. These poverty maps are available for eight countries: Brazil, Chile, Colombia, Ecuador, Honduras, Mexico, Panama, and Peru. Second, the World Bank’s Poverty and Inequality Platform ( https://pip.worldbank.org/home) provides the share of poor households at the administrative boundary level 1, (that is, province or state), for most other countries in the region. In a few cases (for example, Suriname, República Bolivariana de Venezuela), the poverty map rate is at the national level. All the maps from this platform are produced using an international poverty line of $6.85 in 2017 purchasing power parity (PPP) units (refer to map B1.2.1). The authors use an iterative algorithm to convert poverty rates using official estimates into poverty rates under the international poverty line of -$6.85 in PPP units, so that poverty rates in the maps are under the same poverty line for all countries. Finally, the surveys and maps used for this exercise refer to, or are near to, 2020 (except for Panama, where they refer to data for 2015, and República Bolivariana de Venezuela, for 2006).
Box 1.2 Poverty measurement and poverty maps in LAC (continued)
MAP B1.2.1
Poverty rates in LAC using ($6.85, 2017 PPP), 2020–24
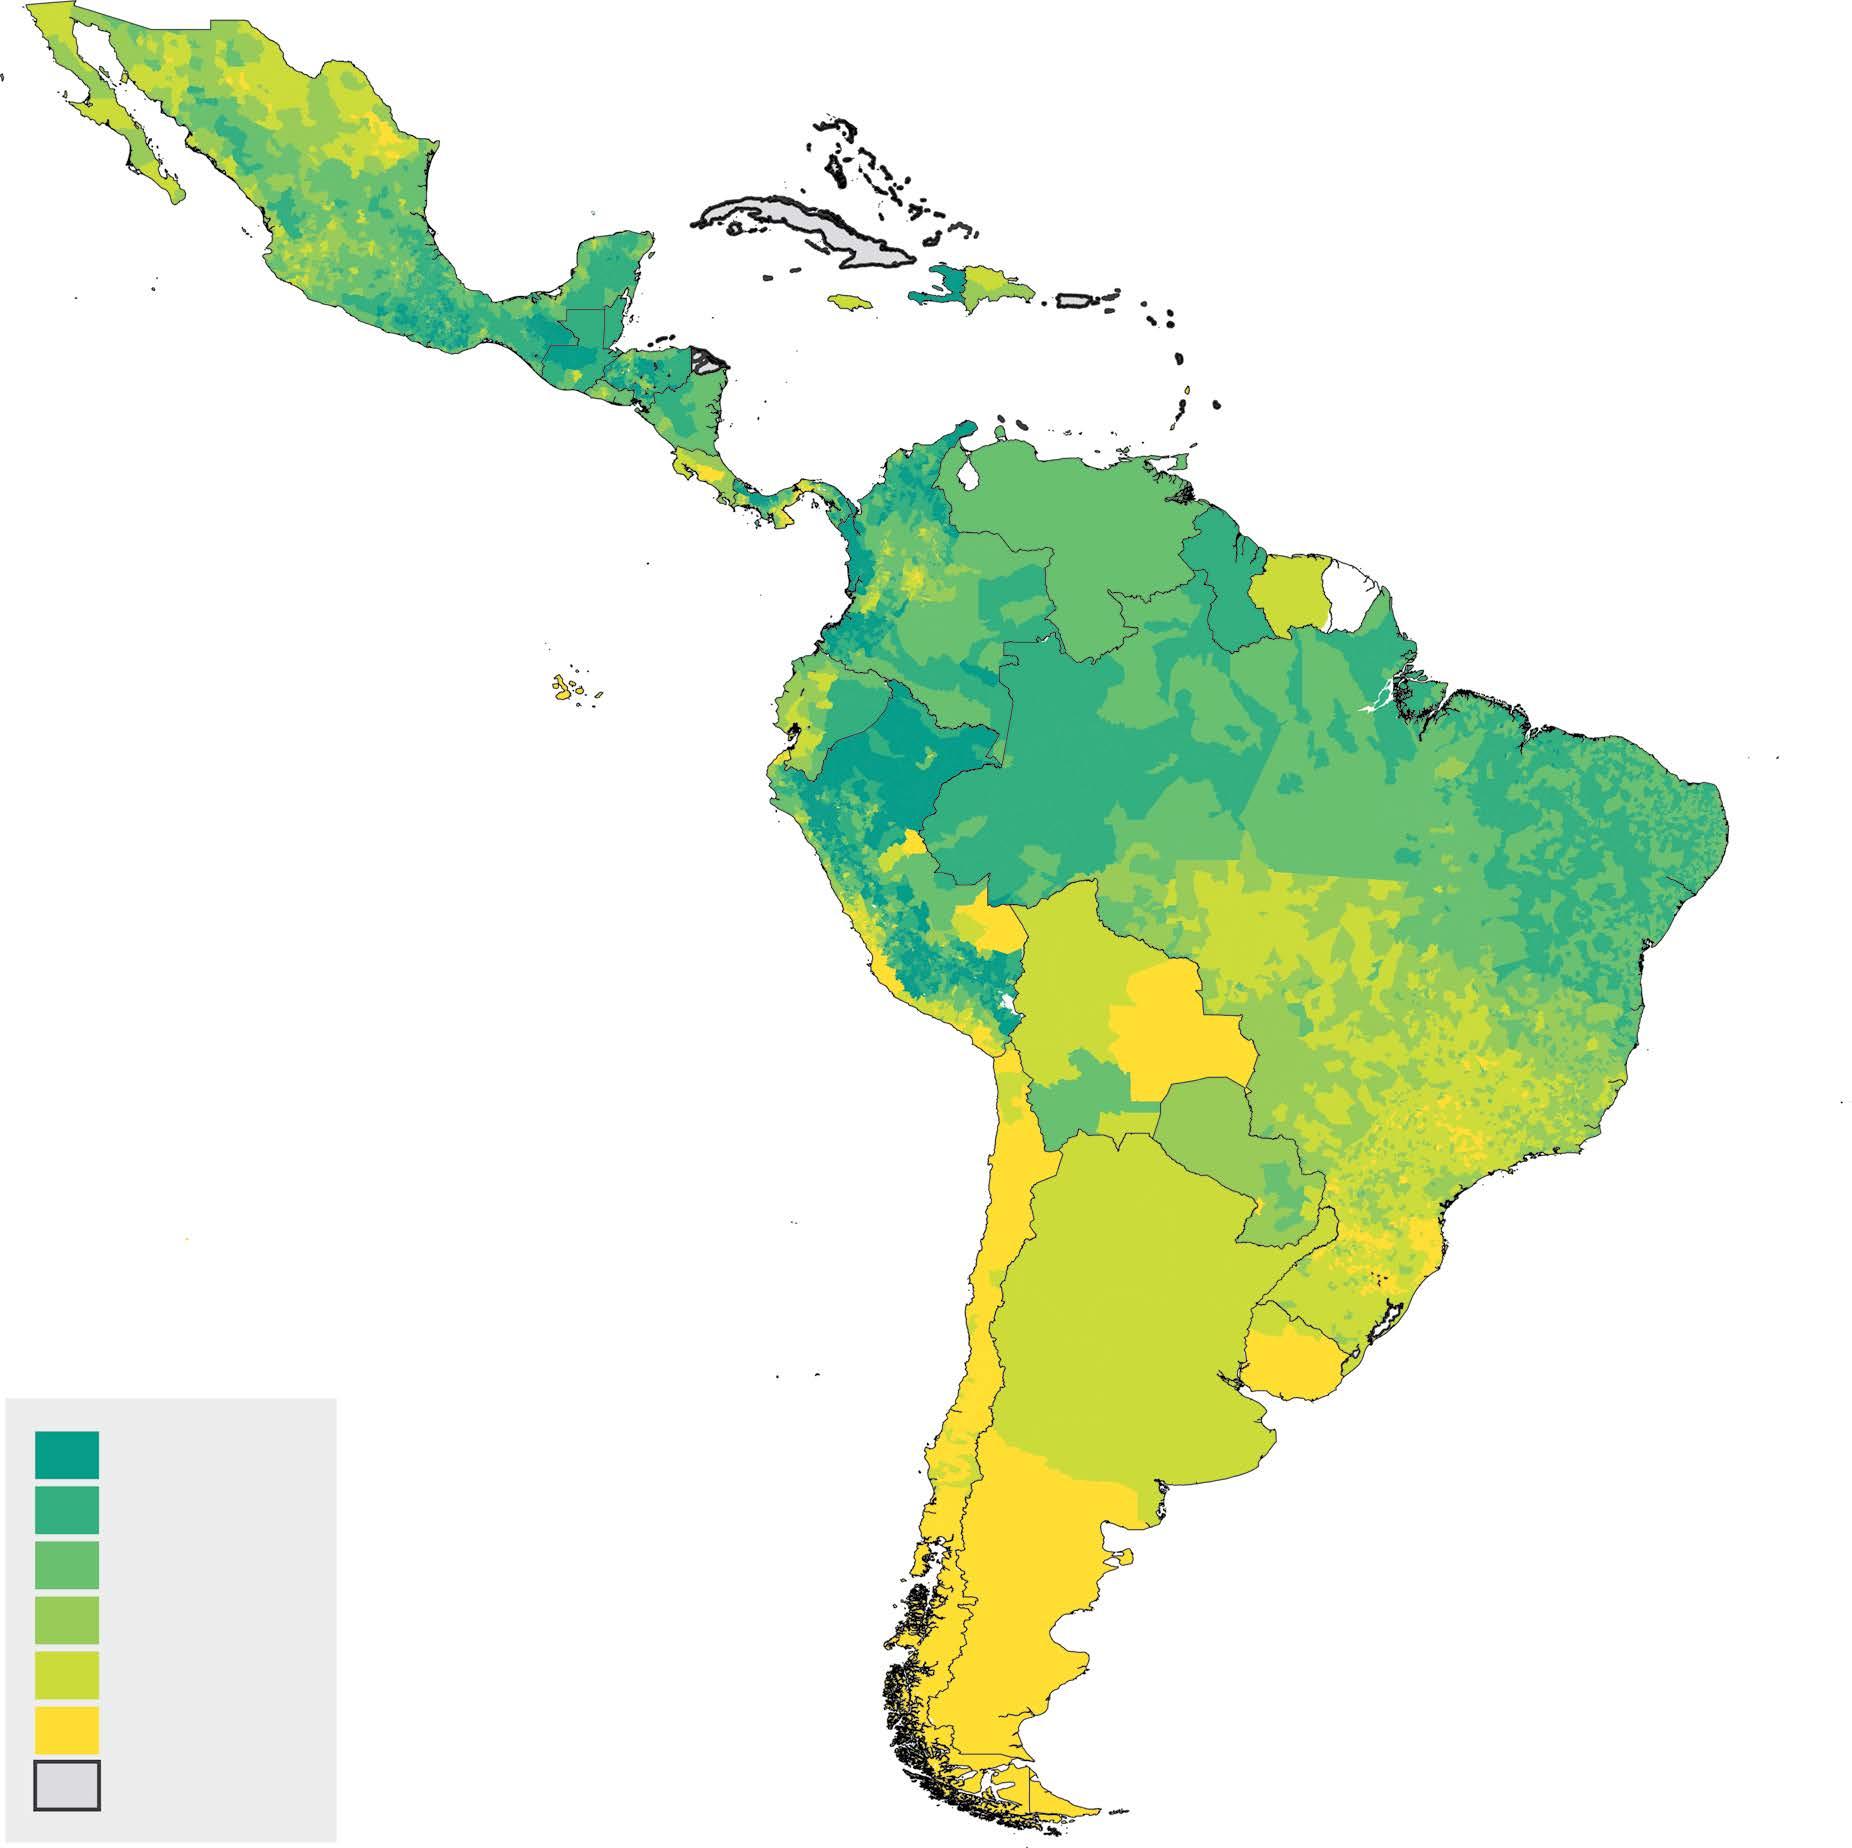
70−100
50−70
30−50
20−30
10−20
0−10
No data
Source: Brunckhorst et al., 2026.
Note: The legend shows the poverty rate at the subnational level (municipalities, provinces, or countries) measured using the 2017 -$6.85 PPP poverty line. Each color reflects the percentage of the local population that is living in poverty. LAC = Latin America and the Caribbean; PPP = purchasing power parity.
MAP 1.2
Laying a poverty map over a climate hazard exposure map (such as map 1.1f, the climate hazard map, with map 1.2.1, the poverty map) can serve to identify the hotspots of high incidence of poverty and exposure to climate hazards. The dark blue areas in map 1.2 show regions where more than 60 percent of the population are exposed to any hazard and poverty rates are above 30 percent. These hotspots include the Yucatán’s Caribbean coast along with parts of Mexico’s southern and Gulf and Baja California peninsula coasts; the Dry Corridor (parts of El Salvador, Guatemala, Honduras, and Nicaragua) and parts of the Caribbean; northeast Brazil; Amazonian areas of Brazil, Colombia, Ecuador, and Peru; and the Chaco region (Argentina, Bolivia, Brazil, Paraguay). About 10 percent of the continent’s population—64.4 million people as of 2020—live in these high-risk zones.
If one widens the lens to include areas with poverty rates above 10 percent and more than 30 percent of the population being exposed, that covers about 40.6 percent of the population in LAC.
Climate hazard exposure and poverty rates in LAC (-$6.85, 2017 PPP)
Source: Brunkhorst et al., forthcoming.
Note: The legend shows the joint distribution of climate hazard exposure and poverty at the subnational level (municipalities, provinces, or countries). Climate exposure is measured as the share of the population living in grid cells where the probability of experiencing one or more severe climate hazards exceeds a predefined threshold, following Doan et al. (2023). Poverty is measured using the 2017 -$6.85 PPP poverty line. Each color reflects the percentage of the local population that is both exposed to climate hazards and living in poverty. LAC = Latin America and the Caribbean; PPP = purchasing power parity.
Because of its size and shape, countries in LAC face very different exposures to climate events. On top of that, differences in socioeconomic development imply that exposure levels vary not just between countries, but also between the poor and nonpoor groups within them.9 A couple of examples help to illustrate these differences.
Chile has an exposure rate to any hazard well below the continent’s average. Only 15.8 percent of the population is exposed to severe climate hazards. Like all other countries, the exposure rate is higher among poor individuals (20.6 percent), and it is mostly high drought exposure (16.5 percent). In addition, there is almost no difference in exposure between poor and nonpoor people for the other four hazards. Only 1 percent of the population is exposed to two hazards, and none to two or more. Chile is—according to this methodology—a country with low exposure to severe climate hazards.
Colombia, in contrast, stands out with the highest rate of population exposure to any of these five hazards among the eight countries studied—40.5 percent of its population is exposed. It is followed closely by Honduras (39.7 percent), Mexico (38.9 percent), and Ecuador (36.6 percent). As with the regional trend, poor people in Colombia face a higher exposure rate than nonpoor people, especially to droughts and heat waves. But unlike the regional average, poor people in Colombia are more exposed to heat waves, likely because these occur in both large cities, such as Cartagena, and poorer areas, such as the Guajira Peninsula. Most of the population in Colombia are exposed to just one hazard, similar to the regional pattern, but a sizable group is exposed to two hazards. Here, the gap between poor and nonpoor people is significant: Of the poor people, 11.5 percent are exposed to two hazards, compared with just 5.2 percent of the nonpoor people—a 6.3 percentage point difference, the largest among all countries analyzed.
In summary, poor individuals are more exposed to climate hazards than nonpoor individuals in LAC, particularly to droughts and landslides. But nonpoor individuals also exhibit significant rates of exposure to these hazards and, in some cases, for some events (for instance, heat waves in Brazil, landslides in Ecuador, or hurricanes in Mexico), the exposure gap between poor and nonpoor individuals reverses. Most of the population is exposed to one hazard, with fewer people exposed to multiple hazards. Geographic hotspots include the Brazilian northeast, the upper Amazon region, the Chaco region, Caribbean islands, and parts of Mexico and Central America. These areas require special policy attention because of high hazard exposure and poverty rates.
Looking at countries with more disaggregated poverty data, major differences are seen in exposure to climate hazards across countries. For instance, some (such as Chile) have lower exposure rates and others (such as Colombia) have very high exposure rates; in some countries (such as Ecuador) high exposure rates are concentrated in only some parts of the country, and in others (such as Mexico) exposure rates are high in almost the entire territory. There is also a
highly differentiated exposure to floods between poor and noonpoor in the Dominican Republic, using an alternative method to stratify risk exposure (refer to box 1.3)
An innovative way to assess the exposure of households to climate hazards by wealth levels is to stratify risk exposure into a household survey with national coverage by geographic domains and then assess the population in high-risk areas. This is what a 2021 household flood risk survey did in the Dominican Republic. According to the survey, 2.8 million people, equivalent to 27 percent of the Dominican Republic’s population, live in areas at high risk of flooding. Almost half (46 percent) of the population who live in highly flood-prone areas are poor (belong to the bottom 40 percent of the wealth index).
Wealthier households are less likely to live in areas at high risk of flooding. Thus, poor households are the most vulnerable to flooding. Among the bottom two quintiles of wealth distribution, one in every four households is at high risk of flooding. In rural areas, the share of the poor population living in high-risk areas is around 29 percent, falling to 25 percent in urban centers. The incidence of high flood risk among better-off households (the top quintile of the wealth distribution) is around 14 percent in urban areas and 10 percent in rural areas (refer to figure B1.3.1).
The urbanization of Latin America has been very fast, with “no parallel in the history of the world” (Fox 2012; Kemper 2022).10 In 2024, 82 percent of the continental population was living in urban areas (refer to figure 1.4).
Urbanization plays a crucial role in development. The benefits of scale, agglomeration economies, and specialization increase productivity and prosperity. This draws people to migrate to cities from rural settings. The density of cities promotes productivity and offers opportunities to improve people’s livelihoods and quality of life, eventually helping to lift many out of poverty. For firms and workers in urban areas, proximity makes skills matching and job searching more efficient. For governments, basic public services and infrastructure can be provided at a lower cost, thanks to economies of scale.
Population growth in cities and urbanization may also imply that more people are moving into harm’s way. Rapid urban expansion can lead to congestion effects, including increasing vulnerability to climate hazards and amplifying strain on public services and infrastructure. Such challenges are especially prevalent in low- to middle-income nations where there is insufficient capacity for risk-aware urban planning and limited resources for investing in transportation and protective infrastructure, especially in unplanned and informal settlements.
1.4
Estimates and projections of levels of urbanization by major world regions, 1850–2050
Sources: Fox 2012, based on Grauman
Estimates suggest that as much as 80 percent of losses caused by climate hazards in Latin America occur in urban areas, where most of the population lives. Latin American cities are particularly exposed to floods, landslides, heat stress, and wildfires (Mukim and Roberts 2022). Furthermore, 60 of the 77 most densely populated cities in LAC are coastal and are experiencing sea levels rising at a faster rate than globally. The World Bank estimates that 2.6 percent of the region’s population, totaling some 17 million people, will be internally displaced because of climate change by 2050, which will increase urban growth by 10 percent over current projections (Clement et al. 2021).
The importance of urbanization in LAC makes it crucial to look closely at how cities are exposed to climate hazards. The previous section covered nationallevel exposure to climate hazards—how many are exposed and where. This section complements the preceding analysis by zooming in on selected cities in Colombia and Mexico to see how climate hazards and poverty intersect. These two countries were chosen for the new analytical work conducted for this report because data were available and the cities face varying levels of flood risk.11 Using global flood maps and local neighborhood vulnerability data, we estimate the number and location of people exposed to climate hazards and determine whether poorer communities are more exposed to climate hazards than nonpoor communities.
As in the preceding section, the maps are produced in two stages. First, flood hazard maps offer inundation depths along a continuous scale, and the values are aggregated into five hazard categories12 based on a 100-year return period for all types of flooding (that is, coastal, pluvial, and fluvial floods with an annual probability of occurrence higher than 1 percent) for all territorial units of 30 meters × 30 meters within each studied city. High hazard is then defined as floods with inundation depths above 0.50 meter. Second, a multidimensional poverty index using indicators of housing, demographics, education, labor, and health renders a six-category indicator ranging from 1 (most poor) to 6 (most affluent), where areas with a multidimensional poor population are those with an indicator below 4.13 Unlike the rest of the chapter, which looks at income-based poverty, this section uses multidimensional poverty because it relies on census data to measure wellbeing. The overlay of these two maps simplifies the distribution of the territory into four quadrants: low flood risk/low poverty, low flood risk/high poverty, high flood risk/low poverty, and high flood risk/high poverty.
Map 1.3 shows the city of Cali, Colombia. Map 1.3a shows flood hazard areas, where the Cauca River raises the threat in the northern part of the city. Map 1.3b displays where the multidimensional poor population lives,
mostly in the northwest and northeast fringes of the city. In map 1.3c, both layers are overlaid, showing precisely that the northeast part of the city has the highest overlap between flood hazard and vulnerable communities. Some less-poor groups are also exposed to high flood hazard—such as in the far south and along Calle 70 in the northeast—providing a reminder that exposure to high flood hazard is not limited to the poorest individuals.
For example, looking at the cities’ total population, the poorest residents are not always more exposed to flood hazard, but in some cities, they are. In Cali, the poor population is more likely to be exposed to high flood hazard than the less-poor population by more than 20 percentage points. In Barranquilla, Cartagena, Medellín, and Guadalajara, the poor population is also more exposed, but with a narrower difference. In contrast, Bogotá, Valle de México, and Puebla-Tlaxcala show the nonpoor population being more exposed than the poor population by a minimal margin. In Monterrey and Tijuana, both groups show similar exposure rates (refer to table 1.2).
Distribution of flood hazard and multidimensional poor population in Cali, Colombia
a. Flood hazard exposure (>0.50 m)
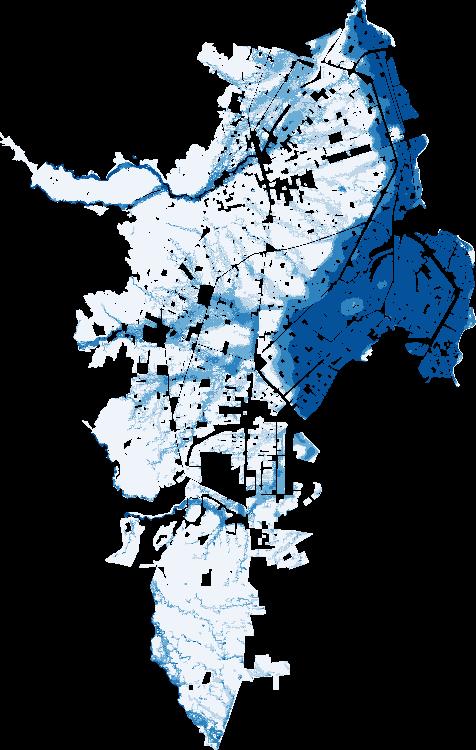
b. Level of multidimensional poverty (<3)
c. Overlay of high flood hazard exposure and multidimensional poverty
Source: D’Aoust, de la Fuente, and Lozano Gracia 2025.
Note: High flood hazard in panel a refers to blocks with inundation depths above 0.50 meter. High risk of flood in panel a refers to inundation depths above 0.50 meter. One study using a lower flood threshold (15 cm) shows similar patterns; results are available from D’Aoust, de la Fuente and Lozano (2025). M = meter.
TABLE 1.2 Exposure rates to flood hazard for total, MDP, and MDNP populations in selected cities
Source: D’Aoust, de la Fuente, and Lozano Gracia 2025.
Note: MDNP = multidimensional nonpoor; MDP = multidimensional poor.
In relative terms, poor individuals consistently suffer greater losses from floods than nonpoor individuals. Although wealthier individuals may experience higher absolute losses of assets or income from floods, this is expected to be because of their greater wealth. It is these relative losses, rather than the absolute figures, that have more significant implications for livelihoods and well-being (Hallegatte and Rozenberg 2017). Urban poor people exhibit lower coping abilities and slower recovery rates from climate hazard impacts, underscoring the detrimental cycle between poverty and disaster losses: Poverty significantly contributes to people’s vulnerability to natural disasters, which subsequently exacerbates poverty in a measurable and significant manner (Hallegatte et al. 2020).
However, urban flooding can cause significant disruption to cities’ amenities, such as roads, schools, and access to health centers, which can have wider impacts on the population, poor and nonpoor. Floods also cause damage to poor individuals’ businesses or homes, an important loss considering their crucial role in providing an income. Climate hazard events have the potential to inflict damage on a city’s infrastructure and disrupt essential services to everyone. Flooding can overwhelm unprepared water treatment facilities, leading to contamination of water supplies. Interruptions to the transportation system, including roads and public services, may isolate certain areas of a city from critical services, exacerbating the impact of the floods.
Many damaging impacts of floods can be prevented by improving institutions (such as having concerted and inclusive plans, improving clarity of land rights, and so forth); raising awareness and providing education through the dissemination of information, which can effectively protect individuals’ assets
from the adverse effects of floods; differentiating investments that benefit every resident from those focused on the most marginalized urban population and short-term from long-term support; and thinking about incentives to avoid trade-offs. Adaptation strategies strengthening resilience should not only address poor individuals’ higher exposure but also consider institutional and socioeconomic factors to effectively reduce vulnerability to climate hazards. It will be necessary to leverage existing and often affordable technologies such as community-tailored early warning systems and certain flood defenses (for example, public spaces) before carefully choosing gray infrastructure. More information is provided in chapters 3 and 4 of this report.
As indicated in the previous section, LAC is a highly urbanized region. However, although more people in urban areas live in poverty overall (62.8 percent of the total number of poor people as of 2023), rural areas face a higher poverty rate—41 percent compared with 26 percent in urban areas.14 Natural capital such as forests and land are vital for the livelihoods of poor individuals— particularly in rural areas—so paying attention to their exposure is crucial because these ecosystems are also highly vulnerable to climate hazards.
Agriculture is a key source of food and income for rural poor households in Latin America—often one of the few assets they rely on, alongside household labor and local resources. A study across nine countries found that the poorest households depend almost entirely on agricultural income, whether from their own farms or wage work, whereas wealthier households diversify away from agriculture (Gáfaro et al. 2023). The livelihoods of poor people disproportionally depend on the services and resources provided by ecosystems. In countries such as Bolivia, Guatemala, Haiti, and Honduras, the income sources and food security of 30–50 percent of the population depend on agriculture, which in turn largely depends on the quality of the soil, forest, and water sources. Forests can contribute to food security and provide fiber, fuel, and wood-based products.
LAC is home to a wide range of terrestrial natural landscapes and ecosystems, including, but not limited to, the Amazon, the Mesoamerican Biological Corridor, and the Gran Chaco and Pantanal regions (CAF 2023). Natural landscapes play a crucial role in climate resilience, poverty reduction, and agricultural productivity. Undisturbed, these landscapes mitigate natural event impacts, such as erosion or coastal flooding (IPCC 2022). They buffer against floods and storms, regulate temperature and rainfall, and mitigate slower-onset crises such as droughts. Land and coastal-marine ecosystems, for instance, provide crucial protection against hurricanes.
Poor people live in high-value ecosystem areas. A background paper for this report (Turner, Lozano Gracia, and Hawthorne 2025) suggests that at least 43 million people living in poverty reside near highly valuable (within the top
20 percent) ecosystems such as forests, representing 24 percent of the region’s poor households.15 Other studies suggest that at least 92 million people living in poverty reside near highly valuable local land ecosystems (refer to map 1.4) (Bagolle, Costella, and Goyeneche 2023). Thus, climate hazard can exacerbate mostly rural poverty if areas with high-value ecosystems are washed away. In the five countries of the region with the highest biodiversity (Brazil, Colombia, Ecuador, Mexico, and Peru), on average, 71.5 percent of poor people live in areas of high-value ecosystems.
If vast areas of natural ecosystems or productive land in the region are prone to climate hazards, their degradation poses a growing threat to impoverished households in regions benefiting from coastal habitats such as mangroves and coral reefs. Climate change, combined with deforestation, poor farming practices, resource overuse, and pollution, is severely damaging ecosystems and natural capital in LAC (IPCC 2022). Climate extremes, such as worsening droughts, increase tree deaths, intensify fires, and reduce forest carbon absorption (Turner et al. 2020). The depletion of environmental resources, particularly in rural areas where communities heavily rely on ecosystems for their livelihoods, disproportionately affects impoverished populations (IPCC 2022).
MAP 1.4
Poverty rates in areas of high-value ecosystems
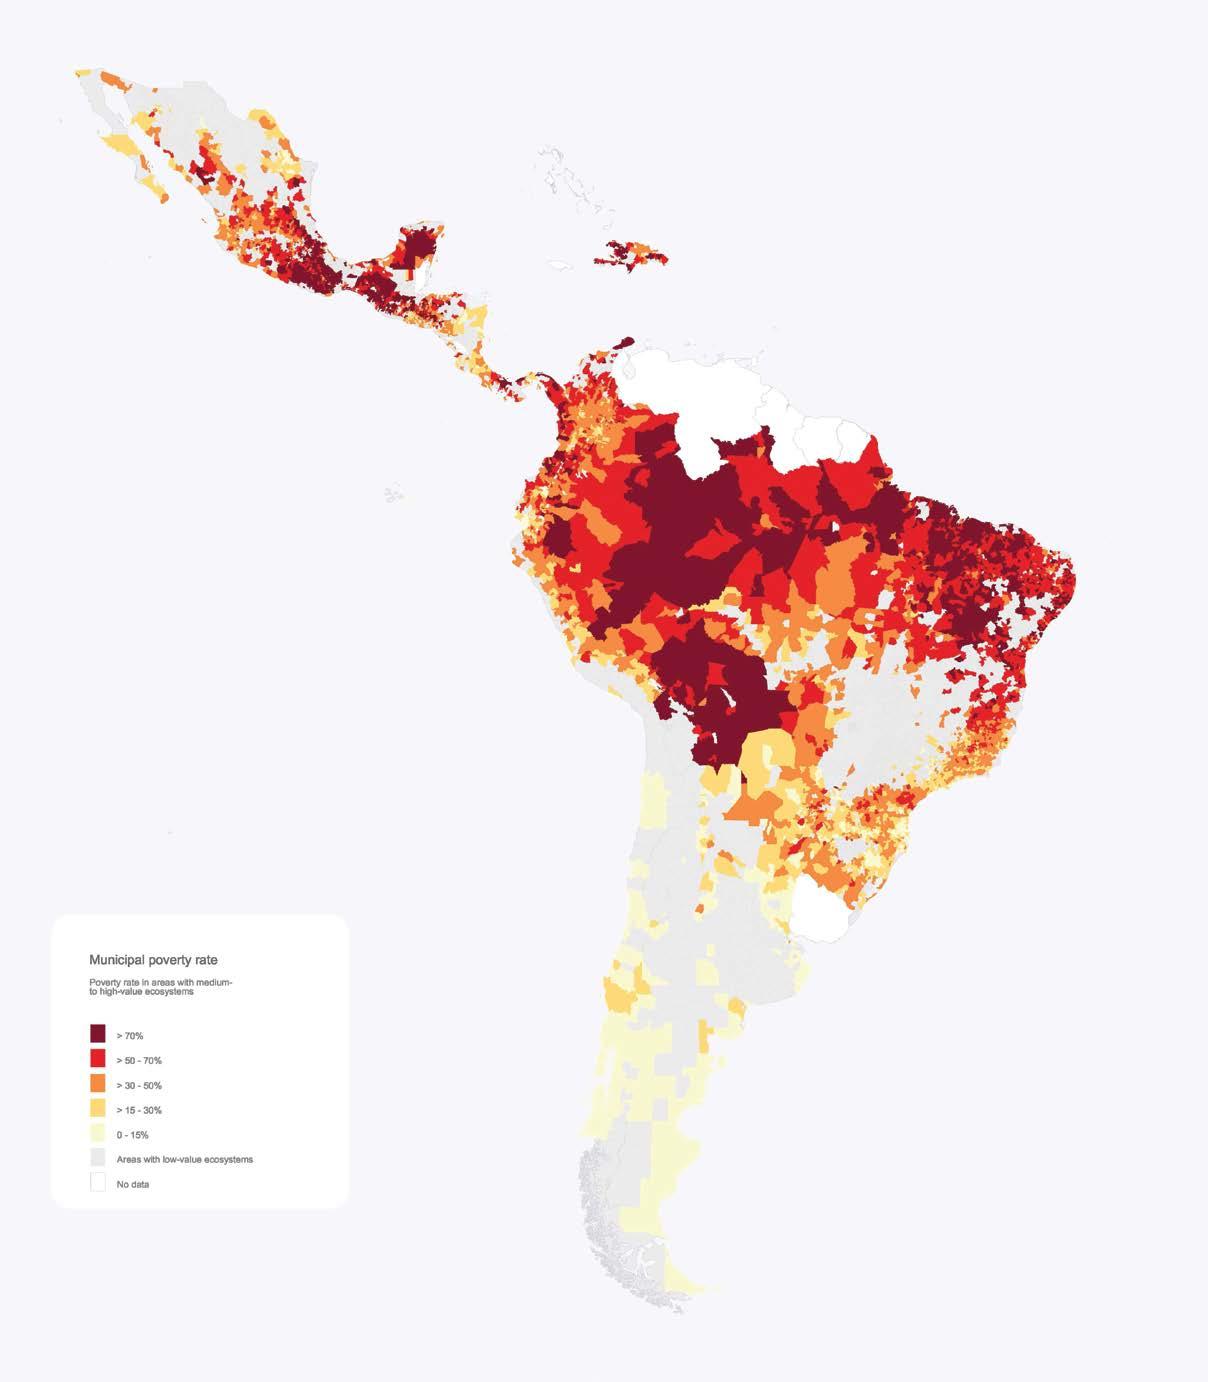
Municipal poverty rate
Proverty rate in areas with medium- to high-value ecosystems
> 70%
> 50–70%
> 30–50%
> 15–30% 0–15%
Areas with low-value ecosystems No data
Source: Bagolle, Costella, and Goyeneche 2023.
The evidence on climate hazard exposure described so far is based on historical data. In other words, the probability of events such as floods or droughts happening in specific areas (as described, for instance, in box 1.1) is determined by looking at patterns over past decades. These data already show that large parts of the region are affected by one or several climate hazards, and a substantial percentage of the population, poor and nonpoor, are in harm’s way. This alone justifies policy action to reduce the risk of lives and livelihoods being affected by these events. Climate change is likely to increase these risks, so there is even more reason to invest in prevention and protection policies now.
The high levels of exposure to climate hazards raises the question of how climate change will alter the region’s exposure to them in the future. As the IPCC (2022) has concluded, human beings are exposed to climate change through changing weather patterns (for example, more rainfall or more intense and frequent climate hazards) and indirectly through changes to water, air, ecosystems, agriculture, and the economy. Weather patterns can include climate-induced hazards and the slow-onset effects of climate change (such as sea level rise, increasing temperatures, and ocean acidification).
Climate change is already measurably affecting many parts of LAC. From 1900 to 1980, average temperatures were pretty stable—around 24.2°C in Central America and 21.6°C in South America. The Caribbean countries and Mexico saw a slight uptick in average temperature during that time (refer to figure 1.5). From 1980 to 2020, however, things changed fast. All four regions saw noticeable warming, with average temperatures rising between 0.7°C (Central and South America) and up to 1.5°C in Mexico.
The IPCC (2022) has concluded that climate change is making extreme weather more frequent and intense in LAC, with rising temperatures, heavier rainfall, and stronger hurricanes posing growing risks—especially in coastal areas. There is some evidence, for instance, that the number of Atlantic hurricanes has increased in recent years, with a larger proportion of them being major cyclones (refer to figure 1.6). LAC has also faced a surge of extreme climate hazard events recently—massive wildfires, severe droughts, deadly floods, and powerful hurricanes. From record fires in Brazil’s Pantanal and historic drought in the Amazon to hurricanes Beryl and Otis battering the Caribbean and Mexico, the region has been hit hard. Other impacts include blackouts and shipping delays. Although diverse, these events share a common driver: rising temperatures fueled by climate change.
FIGURE 1.5
across LAC, 1900–2020
America
America Mexico
Source: World Bank, based on data sourced from the Climatic Research Unit, University of East Anglia. Note: Solid lines show annual observations, while dashed lines represent fitted linear trends over time to highlight long-term patterns. LAC = Latin America and the Caribbean.
FIGURE 1.6 Frequency of Atlantic cyclones in the past 50 years, by maximum wind speed threshold (duration >2 days)
≥ 34 knots (tropical storms +)
≥ 95 knots (category 3+)
≥ 63 knots (category 1+)
Source: Atlantic hurricane database (HURDAT2) 1851–2024 (https://www.nhc.noaa.gov /data/#hurdat); Landsea and Franklin 2013.
Note: Annual number of Atlantic tropical hurricanes (1970–2023) exceeding specified maximum wind speed thresholds: ≥ 34 knots (tropical storms), ≥ 63 knots (category 1 hurricanes and higher), and ≥ 95 knots (category 3 hurricanes and higher). Storms with durations of two days or less are excluded. The category classification is based on the maximum wind speed attained during the hurricane’s lifetime. Over this period, the annual averages were 12 tropical hurricanes, 6.5 category 1 or higher hurricanes, and 2.6 category 3 or higher hurricanes. Decadal linear trends, with 95 percent confidence intervals (2-sigma), indicate an increase of 3.38 (SD = 0.68) tropical hurricanes, 1.41 (SD = 0.47) category 1 or higher hurricanes, and 1.03 (SD = 0.28) category 3 or higher hurricanes per decade. SD = standard deviation.
By 2050, regional temperatures could rise by 1.5–2.5°C, with some areas seeing up to 20 percent more heavy rainfall, increasing the threat of floods. Global temperatures have already climbed about 1.4°C since preindustrial times (that is, 1850–1900), mostly because of greenhouse gas emissions from fossil fuels, and they are projected to rise 2–3°C by the century’s end. The record-breaking heat of 2024, fueled in part by a strong El Niño, exemplifies how warming trends are amplifying extreme events such as heat waves, droughts, wildfires, and major hurricanes, many of which are now being linked to climate change through attribution studies (refer to box 1.4).
Without strong adaptation strategies, climate risks will continue to escalate. For example, the frequency of droughts in the region could increase by up to 25 percent by 2100, particularly in areas such as Central America and the Amazon. These changes are expected to have a big impact on agriculture, water resources, and ecosystems, leading to economic losses and tough challenges for local communities, including further rural-urban migration. The IPCC (2022) stresses the urgent need for comprehensive climate strategies to safeguard the region’s communities and ecosystems.
1.4
Attribution studiesa is a relatively new field of scientific research that measures whether and by how much climate change influences the intensity, frequency, or impact of extreme climate hazards such as droughts, floods, or hurricanes, either by increasing rainfall and winds in some cases or by causing temperatures to soar and drought to develop in others. They then examine the consequences for people and property and the nature of the changes in those events.
There are several ways to carry out an attribution study, but the most widely accepted method in the past two decades involves simulating extreme events in today’s climate and comparing them with a model of that event in a hypothetical world without human-caused warming. The differences show how rising emissions have affected the
event’s likelihood or severity. By comparing realworld data with this counterfactual “no-warming” scenario, scientists can determine whether global warming made the event more likely (Otto 2017).
As of November 2024, researchers had analyzed 32 extreme weather events in LAC from heat waves in Central America and Mexico, to drought in Brazil and the South Amazon, to heavy rainfall in Colombia and Peru and Hurricane Maria in Puerto Rico. They found that human-caused climate change was a significant driver in 23 of these events (refer to map B1.4.1) (McSweeney and Tandon 2024). For example, a 2022 study found that climate change made the deadly heat wave in Argentina and Paraguay 60 times more likely (Rivera et al. 2022).
Box 1.4 Summary of attribution studies (continued)
Attribution studies on the role of climate change in extreme weather events in LAC
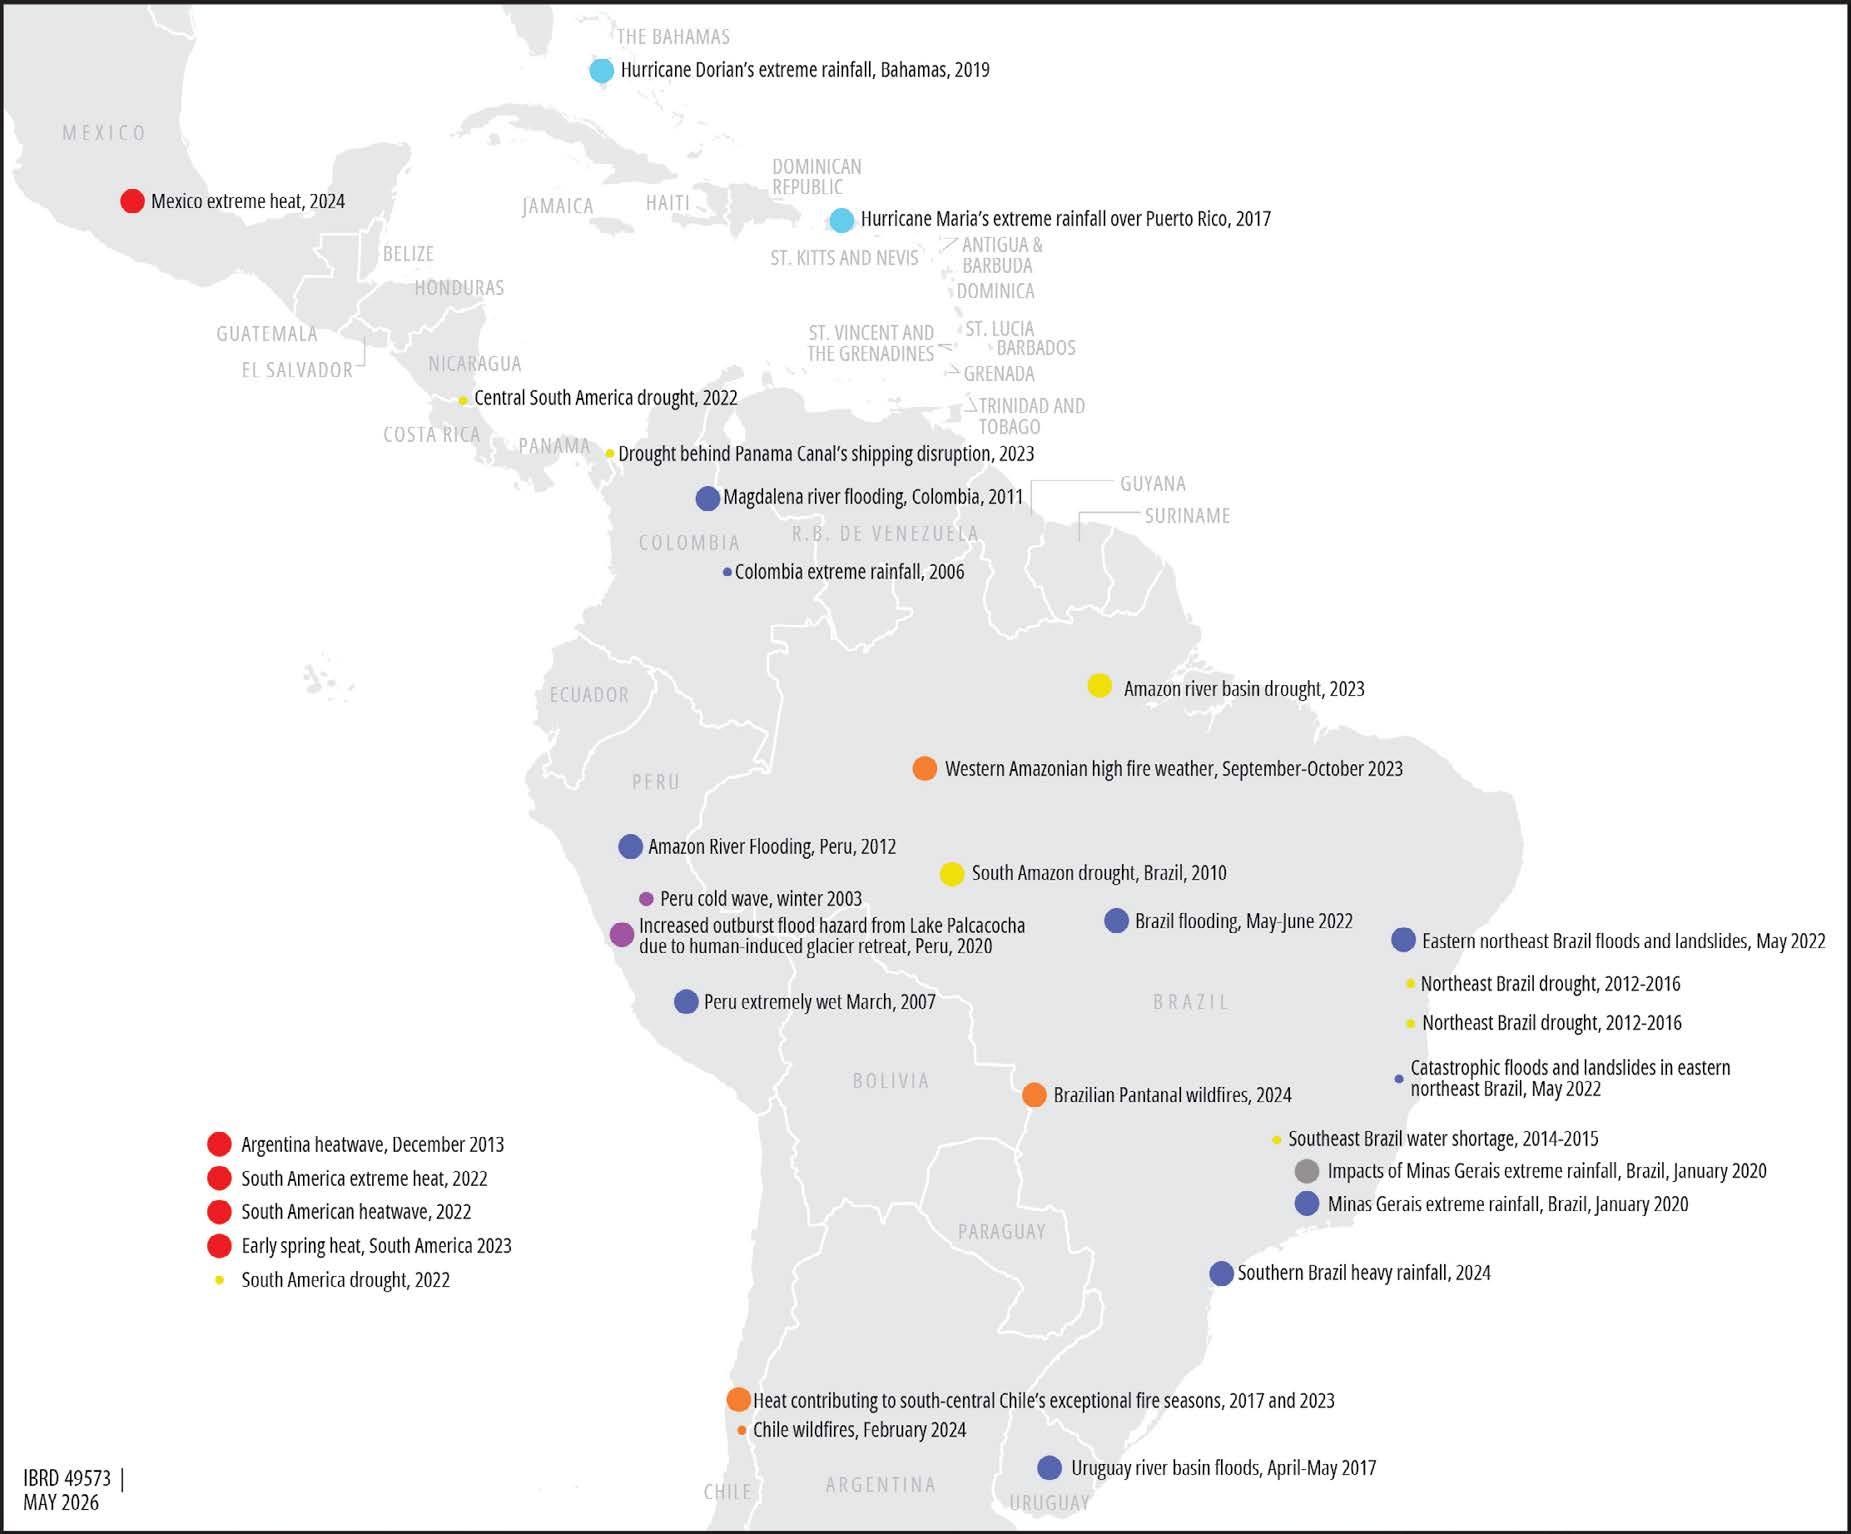
Source: McSweeney and Tandon 2024, CarbonBrief, https://interactive.carbonbrief.org/attribution-studies/index.html. Used with permission. Further permission required for reuse.
Note: Circle size reflects the magnitude of climate change influence: Large circles indicate events made more likely or severe by climate change, medium circles indicate events made less likely or less severe, and small circles represent inconclusive or no-influence findings. Some studies analyze the same event with different methodologies. Event locations are approximate. LAC = Latin America and the Caribbean.
continued
Box 1.4 Summary of attribution studies (continued)
The connection between an increase in the frequency and intensity of severe climate events and climate change has been established in multiple scientific studies, but more scientific work is needed to establish the impact of climate change on other variables, such as health or economic costs of extreme events (Otto 2023).
In Latin America, some specific studies have researched the connection between climate
change, hurricanes, and public debt (Cavallo et al. 2025), between extreme events and human well-being (Nagy et al. 2018), or between climate hazards and poverty (Rodríguez-Oreggia et al. 2013). In the introduction to a special issue with several studies on climate change and disasters in LAC, Cavallo, Hoffman, and Noy (2023) summarized a series of studies that document the negative impact of climate events on economic growth, trade, investment, fiscal accounts, and educational attainment.
a. In 2004, researchers studied how much human-caused climate change contributed to Europe’s deadly 2003 heat wave, which killed more than 70,000 people. They found that human activity had at least doubled the risk of such extreme heat. The findings grabbed global headlines and launched the field of extreme event attribution.
Source: https://www.worldweatherattribution.org/
1. The sixth event of importance, forest fires, is more difficult to measure with the methodology used for this report—which is explained in following paragraphs—so it is not included in this study. Moreover, it represents a minor percentage of the events occurring in the region.
2. Although recent improvements in measurement and reporting may contribute to an upward bias, the overall upward trend in the number of events is evident.
3. This approach centers on identifying who is directly in the path of such events, rather than considering indirect effects such as economic disruptions, price fluctuations because of crop damage, or impacts on infrastructure. This method also does not account for the cascading effects that often follow disasters, such as mass migrations or disease outbreaks.
4. This study uses maps at administrative level two, referring to county, district, or municipality, rather than at the departmental or province level. These level two maps are, however, only for a subset of eight countries for which official poverty maps exist. For the rest of the countries in the region, we use either provincial or even national population data and hazard maps.
5. Poverty rate estimates and trends are from the World Bank’s Poverty and Inequality Platform (https://pip.worldbank.org/).
6. For trends in the Gini coefficient over time for countries in the region, see the World Bank’s Poverty and Inequality Platform (https://pip.worldbank.org/home).
7. Refer to box 1.3 for other innovative methods to explore the connection between exposure to climate hazards like floods and poverty.
8. Hallegatte et al. (2016) published an early study with measures of differential exposure rates between poor and nonpoor individuals for floods and droughts only at the national level. A more recent global study (Hill et al. 2025) compares exposure rates across regions and finds that about 33.9 percent of the LAC population is exposed to any of four climate hazards (hurricanes, droughts, floods, and heat waves). This is below the exposure rates for South Asia and East Asia and Pacific (87.0 and 69.1 percent, respectively), but similar to exposure rates in SubSaharan Africa (38.2 percent), the Middle East and North Africa (34.5 percent), and North America (31.1 percent). The lowest exposure rate is in Europe and Central Asia (27.1 percent).
9. Moreover, these estimates include data from a mixture of poverty maps with different territorial detail. Some countries have data at the municipal or county level, whereas for others data are at the provincial or even national level. This implies that estimates may be less precise because vast tracts of territory are assigned a single exposure-plus-poverty rate. Analysis using data for Mexico and Peru at varying levels of geographic granularity (that is, municipality, district, province, and national) reveals that exposure-plus-poverty rates tend to be higher when assessed at smaller geographic units. One exception was observed for Peru, where heat-wave-related rates were similar—and slightly higher—at the department level compared with districts. Overall, however, coarser administrative units tend to underestimate exposure-plus-poverty rates, highlighting the value of more granular analysis. Importantly, the purpose of these maps is not only to quantify the number of poor and nonpoor people exposed to hazards but also to pinpoint their exact locations. The finer the geographic resolution, the more accurately risks can be identified and policy responses targeted. For a discussion, see the background study for this report by Brunckhorst et al. (2026). The methodology is based on a global study by Doan et al. (2023). Hallegatte et al. (2017) describe an early application of this approach to floods in Viet Nam.
10. This part of the report draws data and text from a background study by D’Aoust, de la Fuente, and Lozano Gracia (2025) that was commissioned for this report.
11. The cities analyzed are Barranquilla, Bogotá, Cali, Cartagena, and Medellín.
12. The definition of flood hazard here relies on Fathom 3, where high hazard is defined as more than 50 centimeters, which can disrupt livelihoods and economic activity and cause some risk to life for select populations, especially vulnerable groups such as children and disabled people. This data source, however, may not capture differences in drainage infrastructure (and maintenance) over the urban territory, which may lead to overestimating pluvial flood hazard in rich areas and underestimating it in poor areas.
13. These maps combine flood hazard and vulnerability rather than poverty. Vulnerability and poverty are different concepts, and, in this regard, these maps are not fully comparable with those in the preceding section. However, they illustrate a similar message and aim to answer the same question: whether the poor (or vulnerable) population is more or less exposed than the rest of the population. A more extensive treatment of the concept of vulnerability and its connection to climate hazards is developed in chapter 2.
14. Urban-rural distribution of the total poor individuals is from World Bank (2024b). Urban versus rural poverty rates are from ECLAC (2023).
15. If one considers an expansive definition of high ecosystem service valuation (any value in the top 80 percent), up to 17 percent of the total population and 79 percent of the poor population could be considered to live in an area with at least some ecosystem service valuation. See Turner, Lozano Gracia, and Hawthorne (2025).
Bagolle, Alexandre, Cecilia Costella, and Laura Goyeneche. 2023. “Social Protection and Climate Change: How Can We Protect the Most Vulnerable Households against New Climate Threats?” Policy Brief 375, Inter-American Development Bank, Washington, DC. https://publications.iadb.org/en/social-protection-and-climate-change-how -can-we-protect-most-vulnerable-households-against-new
Bedi, Tara, Aline Coudouel, and Kenneth Simler, eds. 2007. More than a Pretty Picture: Using Poverty Maps to Design Better Policies and Interventions. Washington, DC: World Bank. http://hdl.handle.net/10986/6800
Bloemendaal, Nadia, Ivan D. Haigh, Hans de Moel, Sanne Muis, Reindert J. Haarsma, and Jeroen C. J. H. Aerts. 2020. “Generation of a Global Synthetic Tropical Cyclone Hazard Dataset Using STORM.” Scientific Data 7 (1): 40.
Brunckhorst, Ben, Ruth Hill, Ghazala Mansuri, Trang Nguyen, and Miki Doan. 2023. Climate and Equity: A Framework to Guide Policy Action. Poverty and Equity Global Practice Brief. Washington, DC: World Bank. https://openknowledge.worldbank.org / handle/10986/39952
Brunckhorst, Ben James, Miki Khanh Doan, Alejandro de la Fuente, Samuel FreijeRodriguez, Catalina García, and Minh Cong Nguyen. 2026. “Are the Poor More Exposed to Climate Hazards in Latin America?” Policy Research Working Paper, World Bank Group, Washington, DC. http://documents.worldbank.org/curated /en/099352505202617344
CAF (Development Bank of Latin America and the Caribbean). 2023. “Key Latin American Natural Ecosystems Facing Climate Change.” https://www.caf.com/en /currently/news/key-latin-american-natural-ecosystems-facing-climate-change /#:~:text=The%20Chaco%2C%20a%20large%20carbon,as%20deforestation%20 and%20agricultural%20expansion
Cavallo, Eduardo, Santiago Gomez, Ilan Noy, and Eric Strobl. 2025. “Climate Change, Hurricanes, and Sovereign Debt in the Caribbean Basin.” Climate and Development 17 (10): 882–91.
Cavallo, Eduardo, Bridget Hoffmann, and Ilan Noy. 2023. “Disasters and Climate Change in Latin America and the Caribbean: An Introduction to the Special Issue.” Economics of Disasters and Climate Change 7: 135–45.
Clement, Viviane, Kanta Kumari Rigaud, Alex de Sherbinin, Bryan Jones, Susana Adamo, Jacob Schewe, Nian Sadiq, and Elham Shabahat. 2021. Groundswell Part 2: Acting on Internal Climate Migration. Washington, DC: World Bank. http://hdl.handle.net /10986/36248.
Corral, Paul, Heath Henderson, and Sandra Segovia. 2025. “Poverty Mapping in the Age of Machine Learning.” Journal of Development Economics 172: 103377. https://doi.org /10.1016/j.jdeveco.2024.103377.
D’Aoust, Olivia, Alejandro de la Fuente, and Nancy Lozano Gracia. 2025. “Strengthening the Resilience of the Urban Poor against Urban Floods.” Background paper, Adapting to Adversity: Povery and Climate Risks in Latin America and the Caribbean. World Bank, Washington, DC.
Doan, Miki Khanh, Ruth Hill, Stéphane Hallegatte, Paul Andres Corral Rodas, Ben James Brunckhorst, Minh Nguyen, Samuel Freije-Rodriguez, and Esther Naikal. 2023. “Counting People Exposed to, Vulnerable to, or at High Risk from Climate Shocks—A Methodology.” Policy Research Working Paper 10619, World Bank, Washington, DC. http://documents.worldbank.org/curated/en/099602511292336760
ECLAC (Economic Commission for Latin America). 2023. Social Panorama of Latin America and the Caribbean 2023: Labour Inclusion as a Key Axis of Inclusive Social Development. Santiago, Chile: ECLAC. https://www.cepal.org/en/publications /68703-social-panorama-latin-america-and-caribbean-2023-labour-inclusion-key -axis
Elbers, Chris, Jean O. Lanjouw, and Peter Lanjouw. 2003. “Micro-Level Estimation of Poverty and Inequality.” Econometrica 71 (1): 355–64.
FAO (Food and Agriculture Organization of the United Nations). 2023. “Agricultural Stress Index System (ASIS): Historic Agricultural Drought Frequency (Global-1Km).” http://www.fao.org/giews/earthobservation/
Fox, S. 2012. “Urbanization as a Global Historical Process: Theory and Evidence from SubSaharan Africa.” Population and development Review 38 (2): 285–310.
Fox, Sean. 2012. “Urbanization as a Global Historical Process: Theory and Evidence from Sub-Saharan Africa.” Population and Development Review 38 (2): 285–310. https://doi.org/10.1111/j.1728-4457.2012.00493.x.
Gáfaro, Margarita, Ana Maria Ibáñez, Daniel Sánchez Ordoñez, and María Camila Ortiz. 2023. “Farm Size and Income Distibution of Latin American Agriculture: New Perspectives on an Old Issue.” Working Paper 01510, Inter-American Development Bank, Washington, DC. https://doi.org/10.18235/0005088
Grauman, John V. 1976. “Orders of Magnitude of the World’s Urban Population in History.” Population Bulletin of the United Nations (8): 16–33.
Hallegatte, Stéphane, Mook Bangalore, Laura Bonzanigo, Marianne Fay, Tamaro Kane, Ulf Narloch, Julie Rozenberg, David Treguer, and Adrien Vogt-Schilb. 2016. Shock Waves: Managing the Impacts of Climate Change on Poverty. Washington, DC: World Bank. http://hdl.handle.net/10986/22787
Hallegatte, Stéphane, and Julie Rozenberg. 2017. “Climate Change through a Poverty Lens.” Nature Climate Change 7 (4): 250–6.
Hallegatte, Stéphane, Adrien Vogt-Schilb, Mook Bangalore, and Julie Rozenberg. 2017. Unbreakable: Building the Resilience of the Poor in the Face of Natural Disasters. Washington, DC: World Bank. http://hdl.handle.net/10986/25335
Hallegatte, Stéphane, Adrien Vogt-Schilb, Julie Rozenberg, Mook Bangalore, and Chloé Beaudet. 2020. “From Poverty to Disaster and Back: A Review of the Literature.” Economics of Disasters and Climate Change 4: 223–47. https://doi.org/10.1007/s41885 -020-00060-5
Hill, Ruth, Nisan Gorgulu, Ben Brunckhorst, Minh Nguyen, Stéphane Hallegatte, and Esher Naikal. 2025. “One-Fifth of the World’s Population at High Risk from Climate-Related Hazards.” Preprint, version 2, submitted January 30, 2025. https://doi.org/10.21203/rs.3.rs-5302969/v2.
IPCC (Intergovernmental Panel on Climate Change). 2012. Managing the Risks of Extreme Events and Disasters to Advance Climate Change Adaptation. A Special Report of Working Groups I and II of the Intergovernmental Panel on Climate Change, edited by C. B. Field, V. Barros, T. F. Stocker, D. Qin, D. J. Dokken, K. L. Ebi, M. D. Mastrandrea, K. J. Mach, G.-K. Plattner, S. K. Allen, M. Tignor, and P. M. Midgley. Cambridge and New York: Cambridge University Press.
IPCC (Intergovernmental Panel on Climate Change). 2022. Climate Change 2022—Impacts, Adaptation, and Vulnerability: Working Group II Contribution to the Sixth Assessment Report of the Intergovernmental Panel on Climate Change Cambridge and New York: Cambridge University Press. https://doi.org /10.1017/9781009325844
Kemper, Robert V. 2002. “Urbanization in Latin America.” In Encyclopedia of Urban Cultures: Cities and Cultures around the World, edited by Melvin Ember and Carol R. Ember, 88–100. Danbury, CT: Grolier Publishing.
Landsea, Christopher W., and James L. Franklin. 2013. “Atlantic Hurricane Database Uncertainty and Presentation of a New Database Format.” Monthly Weather Review 141 (10): 3576–92.
McSweeney, Robert, and Ayesha Tandon. 2024. “Mapped: How Climate Change Affects Extreme Weather around the World.” CarbonBrief, November 18, 20204. https:// interactive.carbonbrief.org/attribution-studies/index.html
Molina, Isabel, and J. N. K Rao. 2010. “Small Area Estimation of Poverty Indicators.” Canadian Journal of Statistics 38 (3): 369–85.
Mukim, Megha, and Mark Roberts, eds. 2022. “Thriving: Making Cities Green, Resilient, and Inclusive in a Changing Climate.” Overview booklet. World Bank, Washington, DC.
Nagy, Gustavo J., Walter Leal Filho, Ulisses M. Azeiteiro, Johanna Heimfarth, José E. Verocai, and Chunlan Li. 2018. “An Assessment of the Relationships between Extreme Weather Events, Vulnerability, and the Impacts on Human Wellbeing in Latin America.” International Journal of Environmental Research and Public Health 15 (9): 1802.
Otto, Friederike E. L. 2017. “Attribution of Weather and Climate Events.” Annual Review of Environment and Resources 42: 627–46.
Otto, Friederike E. L. 2023. “Attribution of Extreme Events to Climate Change.” Annual Review of Environment and Resources 48: 813–28.
Rivera, Juan Antonio, Paola A. Arias, Anna A. Sörensson et al. 2022. “Climate Change Made Record Breaking Early Season Heat in Argentina and Paraguay about 60 Times More Likely.” World Weather Attribution. https://www.worldweatherattribution.org /climate-change-made-record-breaking-early-season-heat-in-argentina-and -paraguay-about-60-times-more-likely/.
Rodriguez-Oreggia, Eduardo, Alejandro De La Fuente, Rodolfo De La Torre, and Hector A. Moreno. 2013. “Natural Disasters, Human Development and Poverty at the Municipal Level in Mexico.” Journal of Development Studies 49 (3): 442–55.
Schiavina, Marcello, Michele Melchiorri, and Martino Pesaresi. 2023. “GHS-SMOD R20-3A-GHS Settlement Layers, Application of the Degree of Urbanisation Methodology (stage I) to GHS-POP R2023A and GHSBUILT-S R2023A, multitemporal (1975-2030).” https://doi.org/10.2905/A0DF7A6F-49DE-46EA -9BDE-563437A6E2BA .
Turner, Monica G., W. John Calder, Graeme S. Cumming, Terry P. Hughes, Anke Jentsch, Shannon L. LaDeau, Timothy M. Lenton, et al. 2020. “Climate Change, Ecosystems and Abrupt Change: Science Priorities.” Philosophical Transactions of the Royal Society B 375 (1794): 20190105. https://doi.org/10.1098/rstb.2019.0105
Turner, Sara, Nancy Lozano Gracia, and Peter Hawthorne. 2025. “Distributional Implications of Enhancing Resilience and Ecosystem Services through Improved Land Use in Latin America.” Background paper, Adapting to Adversity: Poverty and Climate Risks in Latin America and the Caribbean.
World Bank. 2020. The Global Landslide Hazard Map: Final Project Report. Washington, DC: World Bank. https://datacatalogfiles.worldbank.org/ddh-published/0037584 /DR0045411/global-landslide-hazard-map-report.pdf.
World Bank. 2024a. Unleashing Adaptive Potential for Social Protection: Good Adaptive Social Protection Practices in Latin America and the Caribbean. Washington, DC: World Bank. http://documents.worldbank.org/curated/en/099032624235534457.
World Bank. 2024b. Regional Poverty and Inequality Update: Latin America and the Caribbean. Washington, DC: World Bank. https://hdl.handle.net/10986/42570
Climate hazards affect households, businesses, and entire countries in many ways. This report focuses on the impact on individuals and households, looking at flows such as income and consumption poverty. It also considers nonmonetary assets, such as health, nutrition, and education, because they have long-term effects on well-being.
As mentioned in chapter 1, climate hazard risk comes from a mix of hazards, exposure, and vulnerability. That chapter highlighted the main climate hazards in the region and who is exposed to them. This chapter looks at how vulnerable people in Latin America and the Caribbean (LAC) are to these hazards, especially in terms of poverty. We measure vulnerability by estimating how many people could fall into poverty (or become poorer) because of climate hazards. We also report vulnerability as those people being highly exposed to climate hazards and without coping mechanisms such as financial products or social protection. Last, we explore the real impacts on well-being of climate risk once it materializes, using historical data to explore both immediate costs (on flows) and long-term effects (on stocks).
Several approaches are used to identify and quantify vulnerability to climate hazards. The main approach used in this report is a method that consists of estimating the probability and size of a loss in income because of materialized climate hazards. Those with a loss larger than a given threshold are defined as vulnerable.
Climate hazards may push near-poor people into poverty and poor people into deeper poverty, but to what extent and how deep? A background paper for this report (de la Fuente and Serio 2025), using household survey data and climate
hazard data collected for the past 20 years, offers the first comprehensive estimates of LAC populations who are vulnerable to poverty (that is, their estimated expected per capita income is lower than the poverty line of -$6.85 per day in 2017 purchasing power parity) or deeper impoverishment resulting from climate hazards.
This background paper (de la Fuente and Serio 2025) states that a household’s vulnerability to poverty depends not only on its expected (mean) income but also on the volatility (variance) of its income stream. Households that are not poor today can slip into poverty if they are hit by major shocks, and families already living in poverty may end up even worse off. These shocks—such as job loss, economic crises, or climate shocks—create income ups and downs that can push nonpoor households below the poverty line or trap poor households deeper in hardship. It is thus not enough to look only at a household’s average income; the stability of that income also needs to be considered. de la Fuente and Serio (2025) look at two types of vulnerability: (1) poverty-induced (PI) vulnerability refers to households that are already poor because their expected income falls below the poverty line and (2) risk-induced (RI) vulnerability refers to households with income above the poverty line but still at risk of falling into poverty because of income volatility.
Expected income is estimated from household factors such as demographics and socioeconomics, but measuring income volatility is trickier. One way to measure it is through Chaudhuri’s (2003) method, which treats disturbances or residuals that cannot be predicted in the income process as shocks to income. The variability of the disturbance can serve as an estimate of income variance. This estimate is not random; it depends on household traits and community factors, such as exposure to climate hazards or other community characteristics not related to climate. Consequently, de la Fuente and Serio’s (2025) study breaks down RI vulnerability into three groups: (1) climate risk induced (CRI), (2) nonclimate risk induced (NCRI), and (3) idiosyncratic risk induced (IRI). Most people are at risk of falling into poverty because of structural issues such as the activity they perform, their level of education, or personal setbacks rather than because they are affected by climate hazards. In total, about 14.5 million people in the region are vulnerable to climate-induced poverty.
Looking only at income disturbances misses bigger structural issues. It assumes household characteristics stay stable during shocks, which is not always true— large aggregate shocks can change income dynamics entirely. A broader way to capture risk is to look at the spread of total income, not just its residuals when predicted. By estimating overall income variance—across personal, nonclimate, and climate factors—one gets a fuller picture of vulnerability. With this approach, the share of people in LAC vulnerable to climate-induced poverty jumps from 14.5 million (when looking only at disturbances) to nearly 59.8 million under this fuller method (refer to figure 2.1).1 Among the countries studied, Brazil, Colombia, Mexico, and Peru have the largest numbers of people vulnerable to climate-driven poverty, and Chile and Uruguay have the lesser.
Source: de la Fuente and Serio 2025.
Note: The indicators correspond to the latest available household survey year for each country. Estimations are derived from the model that considers the variability of the disturbances and structural issues in the income process. A single person may simultaneously face multiple types of risks and thus may be classified concurrently experiencing IRI, CRI, or NCRI vulnerability. CRI = climate risk induced; IRI = idiosyncratic risk induced; NCRI = nonclimate risk induced; PI = poverty induced.
Like poor households, households with CRI vulnerability tend to be younger, with many heads of households in their prime working years. Unlike poor households, however, households with CRI vulnerability show higher employment rates, have fewer unemployed members, and are more likely to hold salaried jobs. Economically, they cluster in income deciles three and four, whereas poor households are mostly in deciles one and two. They are also more urban based and less likely to live in low-quality housing than poor households (refer to figure 2.2).
The number of people vulnerable to poverty because of climate risk might not seem large in a region of 667 million (as of 2025). As we show later, though, many more are affected in other ways, especially through nonmonetary impacts such as health and long-term well-being. And yet, climate hazards can actually hit harder than many other risks. Figure 2.3 shows that it takes many more resources per person to recover from climate hazards that materialize and reach the poverty line than from individual-level risks, underscoring how hard these events hit household welfare.
Climate hazards may push many nonpoor people into poverty but also affect many who are already poor. This is problematic because it creates a poverty trap. But are poor and rich people equally affected? By definition, poor people have lower endowments and are therefore more vulnerable to climate hazards. This is true in at least three ways.
FIGURE 2.2
Percentage of poor individuals and individuals with CRI vulnerability
a. Salaried worker in main occupation
b. Residence in urban area
Mean among poor individuals Mean among individuals with CRI vulnerability
Source: de la Fuente and Serio 2025.
Note: The indicators correspond to the latest available household survey year for each country. Estimations are derived from the model that considers solely the variability of the disturbances in the income process. CRI = climate risk induced.
FIGURE 2.3
Average income
per person to overcome gap between postshock income and the poverty line, by risk source
Source: de la Fuente and Serio 2025.
Note: Gross domestic product adjusted by PPP constant 2017 international currency (most recent year’s survey). Monthly average per capita income adjusted by PPP constant 2017 international currency. Estimations derived from the model that considers solely the variability of the disturbances in the income process. CRI = climate risk induced; IRI = idiosyncratic risk induced; PPP = purchasing power parity.
First, poor people have lower physical and human capital endowments to protect themselves. Climate hazards often affect entire communities, making coinsurance less effective, which, combined with lower physical and human capital endowments characteristic of poor households, make them badly situated to handle risk-related losses.
Second, poor people tend to settle in hazard-prone areas, where they can afford to live as a result of the narrow prospects they face. Poor rural and urban households are typically pushed to steep land or squatter settlements where land ownership is easier and rent is cheaper.
Third, poverty can lead to practices that magnify exposure to climate hazards— for instance, the use of cheap but poor-quality housing materials and engaging in production activities that are typically unsafe or less resilient to climate change, such as rain-fed agriculture.
Vulnerability is not just about income volatility and susceptibility to losses because of a climate hazard—it is also about how hard it is to bounce back afterward. Even though households try different ways to cope with climate shocks, these are often not enough to keep their consumption steady. Skoufias and Vinha (2013) found that rural households in Mexico could not fully deal with the impact of rainfall and temperature changes—food and nonfood spending both took a hit. After Tropical Storm Agatha hit Guatemala in 2010, Baez et al. (2017) showed that families cut food spending by 10 percent, which meant more than 100 fewer calories per person per day. To cope, adult men worked extra hours a week, and child labor jumped by 11 percent.
Another approach understands the vulnerability of by identifying people who are both highly exposed to climate hazards and vulnerable because they lack key assets or services to cope with them (Doan et al. 2023). Following such an approach, the study gauges these dimensions of vulnerability by population percentages of access to safe water, electricity, or an all-season road to markets (as measures of physical vulnerability) and by rates of poverty, social security coverage, basic education, or financial inclusion (for measures of vulnerability as inability to cope). As of circa 2021, about 15.6 percent of the population in LAC was exposed and vulnerable to climate risks. Among those exposed, 2.2 percent were vulnerable because of low income, 3.7 percent were vulnerable because of low education, 6.3 percent lacked financial access, and 7.1 percent had weak social protection. Fewer faced infrastructure gaps—such as the 1.7 percent without electricity, 1.2 percent without safe water, and only 0.3 percent with no access to all-season road markets. Overall, 4.7 percent faced two vulnerability factors, and 1.4 percent faced three or more. In LAC, vulnerability is mostly driven by limited financial access and inadequate social protection coverage, more so than basic infrastructure gaps. Rates are lower than in South Asia and Sub-Saharan Africa, similar to the Middle East and North Africa but higher than in East Asia and Pacific and Eastern Europe and Central Asia.2
Those who are vulnerable—especially poor individuals and women—should always be a priority when tackling climate risks. By some definitions, they make up a sizable group of the population in some areas, or they face sharp declines in welfare, which can trap them in poverty. They are often more exposed to risks on the basis of where they live or the work they do, and they usually have fewer resources to protect themselves or recover after a climate hazard materializes. As shown in the next section, climate hazards hit these groups hardest, affecting everything from income and consumption to health, nutrition, and education—affecting not just money but long-term well-being.
The direst and most immediate consequence of many climate hazards, once materialized, is death or severe health or asset losses. These effects are discussed in the following subsection and can be considered permanent or long-term impacts. Temporary malnourishment leaves lasting effects on children through stunted growth and lower mental abilities. Hurricanes and floods also can have persistent effects on poorly endowed households: For them, assets used for coping or lost can lead to persistent poverty.
However, for many survivors, climate hazards pose challenges that—given adequate measures—can be solved over time but represent important short-term losses in their living standards. These challenges manifest through disruptions to socioeconomic activities and damage to public infrastructure, natural resources, and productive assets. Urban areas experience harm to housing, often a vital source of livelihood. Infrastructure (water, sanitation, electricity) and social facilities (schools, health centers) can also get damaged. In rural areas, climate hazards result in crops and livestock losses, as well as housing and infrastructure destruction, mirroring the challenges faced in urban settings.
When the focus is shifted from individual victims to larger groups, the overall impact depends on how the shock affects nonvictims, too. Nonaffected areas might step in to produce more, benefiting from higher prices, or damage might not be permanent (such as roads reopening after flooding), allowing for recovery. However, if the affected area produces unique inputs or consumes goods with no substitutes, output could drop in both the affected and the unaffected areas. These are the indirect effects of climate hazards that can still ripple out and affect people. Some effects (such as lives or buildings lost) are on stocks, whereas others affect flows (such as income, consumption, gross domestic product [GDP], and investment) as a result of disruption, even if assets were not directly damaged.
The inability to generate income because agricultural production drops or jobs are lost or to smooth consumption after climate hazards can push people
into poverty. Assets play a crucial role in generating income, enabling households to access goods and services. The loss of or disrupted access to incomegenerating assets because of climate hazards can significantly reduce income.
Box 2.1 highlights the different ways in which people, especially those in vulnerable jobs or sectors, can see their income drop when hit by climate hazards. Whether it is the kind of work they do or the activities they rely on, these factors make them more exposed to the short-term impacts of climate hazards once materialized.
The asset-based framework proposed by LópezCalva and Rodríguez-Castelán (2016) explains the main elements that contribute to household income generation and offers a way to identify the channels through which climate hazards can influence household living standards. As shown in figure B2.1.1, household market income is derived from the accumulation of productive assets, their intensity of use, and the returns they generate, along with net transfers (that is, transfers received minus taxes paid). Each of these components is vulnerable to external shocks, with climate hazards playing a particularly significant role.
Agriculture is one of the sectors most affected by climate hazards because it depends so much on
FIGURE B2.1.1
weather and natural resources. Climate shocks affect the return to assets by damaging crops and reducing earnings. Smallholder farmers are especially vulnerable—losing crops or livestock can wipe out their income. After Hurricane Mitch, for instance, a third of households saw crop-related income losses, with total crop value dropping 25–40 percent (Morris et al. 2002). In Costa Rica, Guatemala, and Honduras, 87 percent of maize farmers and 66 percent of coffee farmers said climate change was hurting their yields (Harvey et al. 2018). And it is only getting worse: Seo and Mendelsohn (2007) project that farm earnings in Latin America could fall by as much as 62 percent by 2100 under severe climate scenarios.
An asset-based framework to explain household income generation
Source: López-Calva and Rodríguez-Castelán 2016.
Box 2.1 Channels through which climate hazards can affect incomes in the short term (continued)
Climate hazards affect the intensity of land asset use in agriculture. Because the climate is so unpredictable and the risks are high, many farming households play it safe—often choosing low-risk, low-return options. Eakin (2000) found that smallholder maize farmers in Mexico knew about better seed varieties for drought or frost, but many stuck with familiar, lower-yield crops to ensure food for their families and livestock. Similarly, Tucker, Eakin, and Castellanos (2010) saw that coffee farmers in Guatemala, Honduras, and Mexico recognized the climate risks but were hesitant to adapt, often viewing extreme weather as just part of normal climate ups and downs.
Climate hazards also affect the use of human resources. Acevedo (2016) found that floods in Colombia’s Caribbean region (2001–10) resulted in work hours and income being cut, with women facing higher unemployment than men. Households eventually recovered after about 13 months, but often by sending kids to work. Similar effects were seen with storms and landslides in Mexico (Acevedo et al. 2023) and excessive rain in Colombia (Bohórquez-Penuela and Otero-Cortes 2020). In Jamaica, Pecha Garzón (2017) found that hurricanes raised the chances of staying in informal work by 8.5 percent and pushed
14.5 percent of formal workers into informal work, largely because of impacts on the tourism sector.
Climate hazards also take a toll on health and labor productivity, which involves a deterioration in the accumulation of productive assets such as human capital. In El Salvador, agricultural workers on lowland sugarcane and cotton plantations suffer from heat stress, which is linked to declining kidney function (Peraza et al. 2012). In 78 big cities across Latin America, long dry spells lead to lower employment, wages, work hours, and incomes— especially among informal workers (Desbureaux and Rodella 2019). Desbureaux and Rodella (2019) suggest that the potential pathways come from a decrease in productivity likely tied to more power outages during droughts and worsening health conditions.
Mueller and Osgood (2009) show that droughts in Brazil reduce rural wages, with agricultural dependence as a key factor determining the severity of the impact. Arceo-Gómez et al. (2020) further investigated the welfare impacts caused by droughts in Mexico. Rural households that experienced a drought saw their earnings reduced by almost 6 percent, translating into a 5 percentage point increase in the probability of falling into poverty.
Tightened budgets may in turn lead to reduced consumption and push individuals into poverty.3 In Central America, Ishizawa and Miranda (2019) document that more intense hurricanes increase moderate and extreme poverty by 1–2 percentage points, with rural areas affected twice as much as urban areas. In Guatemala, Baez et al. (2017) find that urban areas bore the brunt of the burden from 2010’s Tropical Storm Agatha, with consumption per capita dropping by 12.6 percent and poverty increasing by 5.5 percentage points.
Evidence from Mexico reinforces the effects of climate hazards on poverty. Rodriguez-Oreggia et al. (2013) reveal that municipalities in Mexico affected by climate hazards between 2000 and 2005 experienced a loss of two years of human development and an increase in food poverty by 3.7 percent, capacities
poverty by 3.0 percent, and assets poverty by 1.5 percent. A comparative study on mobility in 15 countries in Africa, Latin America, and South and East Asia found that climate shocks and lack of social protection were the second most important reason why people became poor, only after health shocks and death (Narayan, Pritchett, and Kapoor 2009).
It is not just that climate hazards push people into poverty—poorer households get hit hardest. In Argentina, Gonzalez, Santos, and London (2022) found that frequent, widespread climate shocks from 1970 to 2010 made poverty worse, especially in areas that were already struggling. Floods and landslides were major culprits. The same is true in Brazil: After a 2008 flash flood in Santa Catarina, Wink et al. (2023) saw a spike in extreme poverty, hitting non-White, rural, and less-educated groups the hardest. In Mexico, Rodriguez-Oreggia et al. (2013) showed that climate hazards hit municipalities with lower human development the most between 2000 and 2005.
When Hurricane Mitch hit Honduras in 1998, it laid bare some harsh inequalities. The poorest farming families lost 18 percent of their assets, whereas the richest lost just 3 percent (Morris et al. 2002). Although wealthier households bounced back within three years, poorer households faced long-lasting setbacks (Carter et al. 2007). Similar patterns showed up in Nicaragua, too; Premand and Vakis (2010) found that weather shocks and the coffee price crash kept the poorest people stuck at the bottom, making it even harder to move up.
Cruz, de la Fuente, and Escobedo (2018) constructed flood risk scores (the probability of monetary losses from floods or hurricanes in low-income housing) for all municipalities in Mexico. These were then spatially correlated with the poverty incidence corresponding to each municipality in 2005. They found that poor families in Mexico are likely to bear higher losses in housing from flood hazards. The study also found that the poorest municipalities have fewer federal hospitals, bridges, and roads (in value and number), which are critical facilities to attend the population after floods or other similar events strike. Fortunately, the risk to housing floods has decreased substantially in recent years, not just in Mexico, but also in other countries in the region, mainly because of improvements in the construction materials used for housing (Soriano et al. 2024).
Some studies help explain why climate hazards hit poor individuals so differently. After Hurricane Mitch, Van den Berg and Burger (2008) found that poor households in Nicaragua did not seek outside help; they just cut back on consumption, whereas wealthier households managed to maintain their spending. In El Salvador, it was the opposite: Poor households kept up consumption but had to sell off assets to do it (Rodríguez-Meza and GonzálezVega 2004). And it gets worse over time. Van den Berg and Burger (2008) found that Nicaraguan coffee farmers who sold assets early on after Hurricane Mitch
or a drought were more likely to resort to even harsher coping strategies later, such as selling land or future harvests.
Additionally, a study in Jamaica (Henry, Spencer, and Strobl 2020) further suggests that poorer households tend to reside in more hurricane-prone areas, and only those living in buildings with less wind-resistant walls are significantly affected. The poor-quality housing materials forced affected households to reallocate budgets away from other essential spending, likely to afford the increased expenditure on building repairs.
More recently, a study using new household survey data from five Caribbean countries (Belize, Dominica, Haiti, St. Lucia, and Suriname) has offered further insight into household-level preparedness and capacity to cope with climate shocks (Anglade et al. 2024). The analysis shows a clear income gradient in disaster preparedness, with wealthier households more likely to have access to emergency supplies and poorer ones remaining significantly less prepared. Education also plays a role: Households with more educated heads are more likely to discuss risk mitigation strategies and better cope with shocks. Conversely, those in rural areas or with children are generally less able to handle shocks.
Furthermore, experiencing credit constraints had impacts similar to having few assets because these households could not easily smooth consumption. Along the same line, Carter et al. (2007) suggest that access to robust labor and capital markets could have offset the entire loss for lower-wealth households. As argued by Alpízar (2007), access to financial services increased the efficiency of households’ production and reduced the negative impacts of droughts and earthquakes for farmers in El Salvador. Indeed, households with outstanding debts to informal sources experienced a sharp decline in efficiency, indicating that past shocks may have lasting negative effects on efficiency.
Climate shocks do not hit just those who are poor—they hit other groups hard, too, especially women. Fruttero et al. (2023) review how weather shocks often have gendered impacts. For example, in Bolivia, female-headed households were hit hardest by climate hazards, with spikes in poverty and food insecurity. Women’s employment dropped by 2.59 percent, compared with just 0.66 percent for men (Escalante and Maisonnave 2022). In Chile, Pérez-Silva, Castillo, and Cazzuffi (2023) found that droughts from 1990 to 2017 hit Indigenous women the hardest, pushing them out of agriculture and into unpaid family work—or out of the workforce entirely.
Gender norms and disparities in access to capital profoundly affect women’s resilience against shocks. In Nicaragua, Segnestam (2017) found that women facing drought relied more on short-term coping, contrasting with men’s preference for long-term adaptation. Bradshaw (2010) notes women’s dependence on male approval before evacuating homes during floods because of their limited decision-making power. Additionally, shocks heighten women’s vulnerability to intimate partner violence. Díaz and Saldarriaga (2023) show
that in the Peruvian Andes, droughts increase women’s risk of physical intimate partner violence by 65 percent. This stems from economic insecurity affecting men’s emotional well-being and reduced female empowerment hampering negotiation ability.
In sum, climate hazards bring short-term setbacks for many, even if they can recover over time with the right support. These events disrupt everyday life and damage crucial resources such as public infrastructure, natural assets, and livelihoods. In urban areas, homes—which are often tied to income—can be seriously damaged, along with basic services such as water, electricity, and schools. Rural communities face similar issues, plus the added blow of losing crops, livestock, and income from farming. When people cannot earn income—because jobs vanish or crops fail—or cannot smooth out their consumption after a shock, they risk falling into poverty. For those who are already poor, income drops fast when climate events wipe out or cut off access to these assets, pushing vulnerable households further behind.
Of course, both poor and vulnerable people, even if they recover, are obviously worse off for having experienced the climate shock. Although many indeed recover, others pushed over the edge may suffer permanently.
Climate hazards, when they occur, leave a trail of death and destruction. As the immediate destruction subsides, both the landscape and the people undergo a recovery process. However, hazards sometimes impose lasting disadvantages with long-term consequences. Although the enduring effects of climate hazards may be less apparent, this section explores whether there is evidence of such long-term impacts in the context of LAC.
Short-term drops in consumption can last a few weeks or months. If immediate remedial action is taken by governments, households and communities (selfinsurance and activation of risk-pooling mechanisms), or both, consumption drops, or income losses can be smoothed and overturned. Public health interventions can stabilize morbidity surges. Likewise, poor nutritional status may be reversed if the specifically affected groups receive feeding support. Welfare impacts from climate hazards and climate variability can persist, however. If households have few assets to buffer the impact of a climate hazard and public protective measures come too late or do not come at all, the transitory impacts of a shock can turn permanent, particularly for highly vulnerable groups, such as children.
In short, damage and loss estimates measure material things, but all losses, not just physical, should be considered, and the literature particularly refers to losses in human (health, nutrition, and education) and natural capital (biodiversity and the like). For some people, especially those near subsistence consumption, the inability to smooth consumption requires cutting back on
health care, nutrition, and education, and this can lead to persistent negative effects on human capital.
LAC is the second-most-disaster-prone region in the world, behind only Asia and the Pacific, with more than 900 climate hazards killing more than 30,000 people and affecting more than 188 million people since 2000.
The 2019 Global Climate Risk Index ranked the region the world’s second most affected by climate hazards over 1998–2017,4 with hurricanes and tropical storms recurrently causing high human and economic losses. Its average Global Climate Risk Index score of 71.8 reflects high vulnerability, worse than all regions except South Asia (with a score of 66.6).5 Floods together with storms alone affected 115 million people between 2000 and 2024. There is a clear need to study the most effective ways to reduce the costs of tropical storms, floods, droughts, and other climate hazards, which especially affect poorest households.
While a more visible and direct impact of climate change is more and stronger storms and floods, which can cause death, fewer people die from climate hazards. According to the Center for Research on the Epidemiology of Disasters Emergency Events Database, known as EM-DAT, climate disasters claimed the lives of more than 120,037 people in LAC between 1970 and 2024. However, figure 2.4a shows a clear drop in deaths over the past 20 years, although the trend has leveled off lately. Of course, some hazards can cause early deaths over time through indirect effects that EM-DAT does not capture—for example, droughts worsening air pollution and health (refer to box 2.2).
The absolute number of affected populations (those injured, homeless, and in need of immediate assistance) has been increasing historically, mainly because of the impact of floods and storms, although this trend may have changed in the past decade (refer to figure 2.4b). The historical rise could be attributed to improved database coverage or increased reporting of climate hazards, but it may also indicate a real increase in exposure and vulnerability to these hazards. The surge in damage is likely influenced by the expanded exposure resulting from urbanization. Notably, middle-income countries are especially susceptible to these trends.
Analysis conducted for this report on the impacts of major floods in LAC at the city level between 2000 and 2023 also confirms that cities across the income spectrum have made progress in reducing mortality from floods (refer to figure 3.5 in chapter 3). However, this optimism is moderated by challenges in low-income countries, where flood impacts remain substantially higher (although they are gradually decreasing). Exploiting variations in city-level income, urban areas with a higher per capita GDP in 2015 were less likely to experience more deaths when a flood occurred (D’Aoust, de la Fuente, and Lozano Gracia 2025).
FIGURE 2.4
Number of casualties and affected people by climate disasters, 1970–2024
a. Number of casualties
Number of deaths reported by EM-DAT
1,000 2,000 3,000 4,000
b. Number of people affected
Number of affected (in millions) reported by EM-DAT
Source: Original figure for this publication, based on data from the Center for Research on the Epidemiology of Disasters, Université Catholique de Louvain.
Note: EM-DAT = Emergency Events Database.
2.2
A background paper for this report by Eriksson, del Valle, and de la Fuente (2025) shows that droughts in LAC do not just dry up rivers, they also dirty the air. Why? Because when hydropower (which supplies about half the region’s electricity) runs low during droughts, countries fall back on dirtier energy sources, such as fossil fuels and biomass. That shift boosts harmful air pollution, specifically fine particulate matter (PM2.5), around power plants. On average, PM2.5 levels rise by 0.83 micrograms per cubic meter near combustion plants during droughts. That is a lot when 443 million people live close enough to breathe that air. The result is up to 10,000 premature deaths per year and a staggering -$150 billion in welfare losses between 2000 and 2020. Unsurprisingly,
low-income communities living near these plants are hit the hardest.
Looking ahead, even if countries stick to climate targets such as those in the Paris Agreement, the combination of drought-related pollution could keep harming people through mid-century unless action is taken. What is needed? An integrated approach to climate adaptation, energy security, and public health with investments in energy storage, betterconnected power grids, stricter emissions rules, phasing out of polluting plants near cities, and making sure to incorporate environmental justice considerations as part of the energy transition. As droughts worsen with climate change, tackling this issue is more urgent than ever.
Both wealthy and impoverished nations in LAC face climate hazards, yet the majority of deaths over the past five decades have occurred in low-income countries (refer to figure 2.5). Regional benchmarks indicate that LAC only performs worse than the Middle East and North Africa, Afghanistan, and Pakistan. Yet, countries such as Haiti and Honduras have higher death and exposure rates than even the regional averages for South Asia and Sub-Saharan Africa. The impacts of climate hazards seems to be concentrated in poorer countries in LAC. Table 2.1 classifies countries on the basis of climate risk impact captured by the Global Climate Risk Index for 2000–2019 and vulnerability to poverty (refer to the “Climate hazards increase consumption variability and poverty” section of this chapter) using mean thresholds. Richer countries such as Chile, Panama, and Uruguay have lower rates of vulnerability to climate-induced poverty and climate impacts. Lower-middle-income countries such as El Salvador and Honduras fall in the opposite spectrum (refer to table 2.1). Clearly, getting richer favors adaptation. Disparities among countries highlight varying levels of adaptation capabilities against climate hazards.
Deaths from and population affected by climate hazards, per 100,000 population, by country income level, 1970–2024
High-income countries
Lower-middle-income countries
Upper-middle-income countries
Regional benchmarks
Source: Original figure for this publication. Note: EAP = East Asia and Pacific; ECA = Eastern Europe and Central Asia; LAC = Latin America and the Caribbean; MENAAP = Middle East, North Africa, Afghanistan, and Pakistan; SAR = South Asia; SSA = Sub-Saharan Africa. For a list of country codes, go to https://www.iso.org/obp/ui/#search
TABLE 2.1 Typology of countries, by climate-risk-induced vulnerability to poverty and Global Climate Risk Index
High risk-induced poverty Colombia, El Salvador, Guatemala, Honduras, Peru Brazil, Ecuador, Paraguay
Low risk-induced poverty Bolivia, Dominican Republic, Mexico Argentina, Chile, Panama, Uruguay
Source: Original table for this publication.
Note: Green indicates high-income countries, blue indicates upper-middle-income countries, and red indicates lower-middle-income countries. High vulnerability to poverty is assigned to countries where climate-risk-induced vulnerability to poverty exceeds the mean of 11.6 percent, and low vulnerability to poverty is assigned to those at or below this threshold. High disaster impact is identified in countries with a GCRI below the mean at 67, whereas low disaster impact applies to those with a GCRI of 67 or higher. GCRI = Global Climate Risk Index.
Geography or history do not determine fate. Although poorer countries fare worse on average, being economically disadvantaged does not always condemn a country to inevitable consequences. Despite facing similar paths and intensities from hurricanes, some poor and lower-middle-income countries in the region have successfully decreased mortality rates and enhanced resilience. Notably, Hurricane Mitch in 1998 (which caused at least 11,000 deaths) and Hurricanes Eta and Iota in 2020 (which caused between 200 and 300 deaths) affected Central America similarly, yet the death toll from the latter was significantly reduced. The stark contrast in the death toll between Hurricanes Janet (1955) and Gilbert (2005) in the Caribbean and the Gulf of Mexico—both category five storms following similar paths—emphasizes that even economically challenged nations can reduce fatalities. The implementation of early warning systems plays a crucial role in mitigating deaths caused by storms and floods. More generally, many countries in harm’s way have managed to adapt and protect their population over time, and chapter 3 of this report examines how this has happened.
Despite the recent decline in the number of affected people, the continued risk should not be lightly dismissed. Complacency might arise from keeping mortality under control while ignoring climate hazards. Even if they recover, victims are worse off for having experienced the hazard. And although many survivors recover, a disaster pushes some over the edge, and they suffer permanently. Children might not return to school. Even temporary malnourishment can have lasting effects on children because of stunted growth and lower mental abilities. A review of the effect of natural hazards on human capital conducted for this report finds long-lasting effects of climate hazards, as discussed next.
The effects on human capital are particularly worrying because human capital accumulates across the life cycle. Any interruption in cognitive abilities and nutrition at early stages may cascade into lasting effects on various aspects of well-being later in life, such as schooling and productivity. Climate hazards therefore represent a great threat to development because of the magnitude and
irreversibility of some of their impacts and their intergenerational dimension. Here, we present selected impacts of climate hazards on human capital outcomes identified through a literature review conducted by the team.
Climate change affects human capital development across the life cycle unevenly: During critical stages, such as early childhood, its effects on health and productivity can be severe, hindering future returns on early investments (Carneiro and Heckman 2003). School-age children face disrupted education because of rising temperatures and extreme weather events, leading to longterm social and individual repercussions. Youth and adults experience job disruptions, reduced earnings, and climate-related health issues, altering labor decisions and affecting human capital accumulation. Older adults facing physical, psychological, and socioeconomic challenges are among the most vulnerable, with limited mobility, higher disease prevalence, and financial dependence exacerbating their susceptibility to climate impacts.
Climate hazards directly affect welfare by increasing morbidity and mortality, as well as damaging health, sanitation, and educational facilities. Furthermore, resource-constrained households may be compelled to make suboptimal investment decisions regarding health and education to cope with the aftermath of a shock, resulting in severe and long-lasting consequences for their children.
Adverse impacts of climate shocks on children’s health and nutrition emerge in various country contexts. In the semiarid region of northeastern Brazil, negative rainfall shocks are correlated with higher infant mortality, lower birth weight, and shorter gestation periods (Rocha and Soares 2015). However, mortality effects are reduced for municipalities with higher access to piped water and sanitation coverage. Skoufias and Vinha (2013) find that rainfall shocks also have a negative impact on the average height for age; however, the effects vary spatially and temporally in rural Mexico. Furthermore, there is suggestive evidence that, on average, weather-related illnesses are more prevalent with increases in precipitation. Examining rural households in Central Mexico from 1998 to 2000, de la Fuente and Fuentes-Nieva (2010) observe substantial negative impacts of weather-related shocks (droughts, floods, frosts, and hurricanes) on self-reported child morbidity. Children in households affected by extensive droughts faced an 11 percent higher chance of becoming ill than those in unaffected households. This figure rose to 20 percent for children in households affected by floods and frosts. Analyzing the impact of Hurricane Mitch in Nicaragua, Baez and Santos (2007) discover that affected regions saw an 8.7 percent increase in the probability of child undernourishment and a 30 percent decrease in the probability of receiving medical consultation when sick. In particular, Hurricane Mitch had a large and negative effect on children’s nutritional status, especially among those from poorer, larger households with less-educated parents.
A study examining the intergenerational impact of climate hazards spanning a century across 16 Latin American countries reveals significant consequences,
particularly during gestation and early childhood (Caruso 2017). Although the impacts vary depending on each country’s degree of development, the general finding is that these events lead to persistent adverse effects on health, human capital formation, and asset accumulation. Specifically, an individual exposed to flooding while in utero attains 0.47 fewer years of education (or 0.1 standard deviation) compared with those not exposed. Moreover, there is notable intergenerational transmission of these impacts, as children born to mothers who were exposed to natural disasters experienced lower education levels and higher rates of child labor.
A study in Ecuador (Rosales-Rueda 2018) finds that exposure to the 1997–98 El Niño floods in utero reduced children’s height, weight, and cognitive ability and increased their probability of having anemia five and seven years after the shock. The author argues that a potential mechanism behind these persistent effects is the reduction in the duration of exclusive breastfeeding because mothers substituted alternatives such as formula and other food for breast milk.
Research has also documented the long-term impacts of weather shocks on children’s school attendance, enrollment, and performance. Looking at birth cohorts spanning more than 40 years in Colombia, Carrillo (2020) finds that long-term in utero exposure to adverse rainfall shocks reduces years of schooling, literacy rates, and likelihood of working while also increasing mental disability rates. The effects are larger for those born in areas with a higher risk of malaria. This result also holds at the municipality level. Palacios and RojasVelásquez (2023) show that excess rainfall shocks in Colombia increase school dropout and decrease enrollment rates and academic performance in exposed municipalities. The result can be explained by the impacts on income, as well as the spread of weather-related diseases and the damage caused by rainfall to roads and educational centers. Analyzing the impacts on high school standardized exams in 13 Caribbean countries, Spencer, Polachek, and Strobl (2016) also reveal negative and significant effects of hurricanes on performance when school was in session. Furthermore, there is evidence of dire long-term consequences into adulthood. For example, in Argentina, exposure to climate shocks during gestation and the first year of life reduces the number of years of schooling (with floods being particularly detrimental), and increases the chances of being unemployed (with storms, heat waves, fog, frost, and rain having stronger effects), and increases the likelihood of living in multidimensionally poor households in adulthood (González, Santos, and London 2022).
Many households lack sufficient coping mechanisms in the aftermath of climate hazards, opting to put children to work or substitute for parents in household chores. Evidence from rural Central Mexico shows that drought reduces schooling and increases children’s labor force participation if other risk-coping instruments are insufficient (de Janvry et al. 2006). In Nicaragua, although school enrollment remained unaffected after Hurricane Mitch, labor
force participation among children in affected areas surged by 58 percent, and the proportion of children simultaneously enrolled in school and working more than doubled (Baez and Santos 2007). For a comprehensive review of climate change impacts across the life cycle, refer to Caruso, de Marcos, and Noy (2024). Overall, climate hazards tend to produce long lasting effects on human capital, especially among children.
This chapter looked at how climate shocks hit LAC households in terms of welfare and poverty. Although plenty of research focuses on big-picture effects—such as GDP levels and growth—we zoom in on the micro side, using household data to see how people’s living standards and vulnerability change after climate hazards materialize. That said, climate shocks also ripple through the wider economy, affecting growth, public finances, and trade—a topic of great interest and active research that is summarized in box 2.3.
The macroeconomic consequences of materialized climate hazards
Economic theory offers competing hypotheses about the impact of materialized climate hazards on economic growth. Neo-classical models of economic growth á la Solow (1956) would predict faster economic growth in the aftermath of a disaster because the destruction of capital assets would increase the marginal productivity of the remaining assets, propelling investment and growth. Similarly, the idea of creative destruction á la Schumpeter (1991) would suggest that after a disaster old firms would be replaced with more productive, better organized firms. But learningby-doing models á la Barro (Romer 1986) would indicate that the destruction of human and physical capital would have negative effects on productivity and growth.
Initial research offers conflicting results. Raddatz (2009) and Hochreiner (2009) find negative impacts of disasters on gross domestic product (GDP) growth, whereas Fomby, Ikeda, and Loayza (2013) find a positive effect for some countries and some types of disasters (floods). More recent studies, however, seem to converge to a consensus. According to Cavallo, Becerra, and Acevedo (2022), using a sample of disasters
worldwide for the period 1970–2019, there was an average decline of between 2.1 and 3.7 percentage points of GDP growth the year of the shock. This impact becomes larger with the severity of the shock and smaller with the level of development of the economy. However, these researchers find little or no effect of disasters on GDP growth in the medium term. This implies that GDP resumes its pre-event rates of growth—but does not grow faster—and hence output lost during the disaster is not recovered.
National averages in after-shock GDP growth may hide important differences across events, regions, and activities (refer to Cavallo, Hoffmann, and Noy 2023; Noy and duPont 2018). Some disasters (for example, hurricanes) can be very serious and deadly, but because their impact is circumscribed to a region or locality, it is dimmed when subsumed into average national statistics. But the relative size of the country also plays a role: Small islands tend to be more affected than any other type of country because a disaster has a large relative size in the economy. Some events have specific impacts on certain activities and not others (for example, droughts on agriculture), which
again may be absorbed into general economic growth, particularly if the sector affected is relatively small. Moreover, some disasters destroy capital assets such as infrastructure, buildings, and machinery (for example, earthquakes), whereas others mainly affect durable goods (for example, floods). Some authors such as Strulik and Trimborn (2019) and Hallegatte, Hooste, and McIsaac (2024) argue that this difference is key to better understanding the medium-term impact of disasters: The former would lead to lower growth, but the latter could lead to higher growth, and a combination may lead to no effect.
Public finance is also affected by climate disasters. The net impact is again ambiguous and depends on multiple channels that may tilt the effect of disasters on fiscal balance one way or another. The budgetary constraint of any government, general or local, is defined by the sum of expenditures and interest payments on debt, balancing the sum of tax collections, international aid, intergovernmental transfers, insurance payments, withdrawals from public funds, and new debt issuance. Changes on one side of the equation have to be equal to changes on the other, but specific changes have different transmission channels and diverse consequences on a country’s fiscal stance. Changes in general expenditures by spending more on disaster relief can be balanced by less spending on other items, such as investment (which may affect long-term growth) or withdrawals from a public fund (which are designed to smooth out economic growth over the cycle). Similarly, disasters may affect the tax base (because people or firms migrate out of the disaster zone) and the availability to tap international aid (which is somewhat unpredictable because it is outside the discretion of the affected country) or trigger payments from a previously contracted insurance scheme. In the end, the institutional
setting and the characteristics of the event define whether the country has to incur fiscal deficits and issue new debt.
A recent review of empirical studies finds a negative fiscal balance after climate shocks. With some exceptions, postdisaster expenditures increase and tax collections decline, which leads to increased debt levels (Deryugina 2022). This finding underlines the importance of active policy design by fiscal and monetary authorities with respect to these events. Climate hazards may affect the fiscal stance of a country and its levels of public debt. They may also have an influence on the financial sector, interest rates, and inflation as a consequence not only of the direct impact of these hazards, but of the uncertainty they may cast on economic activity and the value of productive assets (Eickmeier, Quast, and Schüler 2024).
Finally, climate hazards can also influence the trade balance. As in the cases of economic growth and public finance, the theoretical assessment is somewhat ambiguous. Natural disasters that damage transport infrastructure affect trade in general; if the disaster has a large impact on production of certain products, exports may decline; if the impact is on general incomes, then imports may decline. A review by Osberghaus (2019) of more than 20 multicountry studies finds that natural disasters are generally associated with declines in exports, but there is no consistent impact on imports. The impact is usually larger in less-developed and small economies. However, disasters are also correlated with an increase in remittances and foreign aid, as a response by families and governments to help those affected by a disaster.
Trade in services shows a similar pattern. Disruptions in economic activity may lead to fewer exports of services but also more demand for Box 2.3 The macroeconomic consequences of
imports. A study for the period 1995–2012 using data for 190 countries and territories summarizes empirical evidence showing a consistent negative impact of disasters on exports but not on imports of services (Xu and Kouwoaye 2019). The average impact involves a decline of 2.0 to 2.9 percent in exports of services after a large natural disaster. This impact is more intense in some sectors than others, particularly communication, transportation, and travel services.
The research agenda on the impact of natural disasters on macroeconomic variables such as economic growth, public finance, and trade balance is still ongoing. Questions about the impacts of disasters on specific regions, on the optimal fiscal policy to cope with climate hazards, or on which trade policy would inhibit the negative effects of climate are still open. Good policy options on these macroeconomic factors will provide better outcomes for the population’s standards.
1. This complementary approach that estimates total income variance is not included in de la Fuente and Serio’s (2025) version. However, their results are available in an appendix upon request to the authors.
2. This method was initially developed by Doan et al. (2023) and recently extended by Hill, Gorgulu, and Brunckhorst (2025). Data in the paragraph comes from the latter, which also includes global data for comparison across regions. The rate of LAC population exposed and vulnerable, 15.6 percent, is lower than in South Asia and Sub-Saharan Africa (31.9 and 36.1 percent, respectively) but higher than in East Asia and Pacific (10.6 percent) and similar to the Middle East and North Africa (19.7 percent). The lowest exposure-cum-vulnerability rates occur in Europe and Central Asia (4 percent) and North America (0.2 percent). These global indicators are also the measure used for one of the eight vision indicators of the World Bank corporate scorecard, “Improving resilience to climate hazards.” See https://scorecard.worldbank.org/en/home.
3. Most studies focus on analyzing the impacts on poverty of extreme weather events such as storms and floods, but a few look at how climate change itself fuels poverty. López-Feldman and Mora Rivera (2018) predict that rural Mexico’s poverty headcount could jump five to 13 points by 2046–55 (up from 45 percent in 2002). Even bigger hits show up in the poverty gap and severity—meaning the poorest individuals will suffer most. It is not even across the board: The south and southeast could see poverty rates as high as 74 percent by mid-century.
4. The Global Climate Risk Index, calculated by Germanwatch, analyzes to what extent countries and regions have been affected by weather-related loss events (tropical storms, winter storms, severe weather, hail, tornados, and local storms; hydrological events such as storm surges, river floods, flash floods, and landslides; and climatological events such as snow and ice, wildfires, and droughts) in terms of fatalities and economic losses, based on data from Munich Re’s NatCatSERVICE (https://www.munichre.com/en/solutions/for-industry-clients/natcatservice.html).
5. Mean Global Climate Risk Index scores by region, from most to least affected, are as follows: South Asia, 66.6; Latin America and the Caribbean, 71.8; East Asia and Pacific, 77.95; North America, 87.33; Europe and Central Asia, 92.73; Sub-Saharan Africa, 102.97; and Middle East, North Africa, Afghanistan, and Pakistan, 111.83. Lower scores indicate greater historical impacts from climate-related hazards.
Acevedo, Ivonne, Francesca Castellani, Carlos Lopez de la Cerda, Giulia Lotti, and Miguel Székely. 2023. “Natural Disasters and Labor Market Outcomes in Mexico.” Preprint, posted February 13, 2024. https://papers.ssrn.com/sol3/papers .cfm?abstract_id=4724173
Acevedo, Maria Cecilia. 2016. “The Effect of Extreme Hydro-Meteorological Events on Labor Market Outcomes: Evidence from the Colombian Caribbean.” Unpublished paper, World Bank, Washington, DC.
Alpízar, Carlos Andrés. 2007. “Risk Coping Strategies and Rural Household Production Efficiency: Quasi-Experimental Evidence from El Salvador.” PhD diss., Ohio State University, 2007.
Anglade, Boaz, Emilia Cucagna, Jacobus de Hoop, and Anna Luisa Paffhausen. 2024. “Disaster Risk Preparedness of Households in the Caribbean.” International Journal of Disaster Risk Reduction 115: 104956.
Arceo-Gómez, Eva O., Danae Hernández Cortés, and Alejandro López-Feldman. 2020. “Droughts and Rural Households’ Wellbeing: Evidence from Mexico.” Climatic Change 162 (3): 1197–212.
Baez, Javier, German Caruso, Valerie Mueller, and Chiyu Niu. 2017. “Droughts Augment Youth Migration in Northern Latin America and the Caribbean.” Climatic Change 140: 423–35.
Baez, Javier, and I. Santos. 2007. “Children’s Vulnerability to Weather Shocks: A Natural Disaster as a Natural Experiment.” Unpublished manuscript, last modified April 2007. PDF file. https://conference.iza.org/conference_files/chldc2007/baez j3321.pdf
Alonso Beltrán, Sofía, Denisse Cruz Rubí, Alejandrina Montes León, and Juan Soriano Escobedo. 2025. “Housing Vulnerability to Flood Risk: Cases of Chile, Colombia, and Mexico.” Background paper, Adapting to Adversity: Poverty and Climate Risks in Latin America and the Caribbean, World Bank, Washington, DC.
Bohórquez-Penuela, Camilo, and Andrea Otero-Cortes. 2020. “Blame It on the Rain: The Effects of Weather Shocks on Formal Rural Employment in Colombia.” Docuemnto de trabajo sobre Economia Regional y Urbana 292, Banco de la República de Colombia, Bogotá, Colombia. https://repositorio.banrep.gov.co/server/api/core / bitstreams/19a59cee-f17a-4fe0-ac20-b904362c9e33/content
Bradshaw, Sarah. 2010. “Women, Poverty and Disasters: Exploring the Links through Hurricane Mitch in Nicaragua.” In The International Handbook of Gender and Poverty: Concepts, Research, Policy, edited by Sylvia Chant Cheltenham, UK: Edward Elgar Publishing.
Carneiro, Pedro, and James J. Heckman. 2003. “Human Capital Policy.” Discussion Paper No. 821, Institute of Labor Economics, Bonn, Germany.
Carrillo, Bladimir. 2020. “Early Rainfall Shocks and Later-Life Outcomes: Evidence from Colombia.” World Bank Economics Review 34(1): 179–209. https://doi.org/10.1093 /wber/lhy014
Carter, Michael R., Peter D. Little, Tewodaj Mogues, and Workneh Negatu. 2007. “Poverty Traps and Natural Disasters in Ethiopia and Honduras.” World Development 35 (5): 835–56.
Caruso, Germán Daniel. 2017. “The Legacy of Natural Disasters: The Intergenerational Impact of 100 Years of Disasters in Latin America.” Journal of Development Economics 127: 209–33.
Caruso, Germán, Inés de Marcos, and Ilan Noy. 2024. “Climate Changes Affect Human Capital.” Economics of Disasters and Climate Change 8: 157–96.
Cavallo, Eduardo A., Oscar Becerra, and Laura Acevedo. 2022. “The Impact of Natural Disasters on Economic Growth.” In Handbook on the Economics of Disasters, edited by Mark Skidmore, 150–92. Cheltenham, UK: Edward Elgar.
Cavallo, Eduardo, Bridget Hoffmann, and Ilan Noy. 2023. “Disasters and Climate Change in Latin America and the Caribbean: An Introduction to the Special Issue.” Economics of Disasters and Climate Change 7: 135–45.
Chaudhuri, Shubham. 2003. “Assessing Vulnerability to Poverty: Concepts, Empirical Methods, and Illustrative Examples.” Unpublished manuscript, last modified June 2003. PDF file. http://www.econdse.org/wp-content/uploads/2012/02/vulnerability -assessment.pdf
Cruz, Denisse Rubí, Alejandro de la Fuente, and Juan Soriano Escobedo. 2018. “Riesgo de desastres a nivel municipal en Mexico.” In Impactos Socioeconomicos del Cambio Climatico en Mexico, coordinated by Alejandro de la Fuente and Sazcha Marcelo Olivera Villarroel. Ciudad de México, Mexico: Universidad Autónoma Metropolitana, Unidad Cuajimalpa, División de Ciencias de la Comunicación y Diseño.
D’Aoust, Olivia, Alejandro de la Fuente, and Nancy Lozano Gracia. 2025. “Strengthening the Resilience of the Urban Poor against Urban Floods.” Background paper, Adapting to Adversity: Poverty and Climate Risks in Latin America and the Caribbean, World Bank, Washington, DC.
de Janvry, Alain, Frederico Finan, Elisabeth Sadoulet, and Renos Vakis. 2006. “Can Conditional Cash Transfer Programs Serve as Safety Nets in Keeping Children at School and from Working When Exposed to Shocks?” Journal of Development Economics 79 (2): 349–73.
de la Fuente, Alejandro, and Ricardo Fuentes-Nieva. 2010. “The Impact of Natural Shocks on Children Mobidity in Rural Mexico.” In Risk, Shocks and Human Development: On the Brink, edited by Ricardo Fuentes-Nieva and Papa A. Seck, 103–27 London: Palgrave MacMillan.
de la Fuente, Alejandro, and Monserrat Serio. 2025. “Vulnerability to Climate Risk–Induced Poverty in Latin America and the Caribbean.” Background paper, Adapting to Adversity: Poverty and Climate Risks in Latin America and the Caribbean, World Bank, Washington, DC.
Deryugina, Tatyana. 2022. “The Fiscal Consequences of Natural Disasters.” In Handbook on the Economics of Disasters, edited by Mark Skidmore, 209–29. Cheltenham, UK: Edward Elgar.
Desbureaux, Sébastien, and Aude-Sophie Rodella. 2019. “Drought in the City: The Economic Impact of Water Scarcity in Latin American Metropolitan Areas.” World Development 114: 13–27.
Díaz, Juan-José, and Victor Saldarriaga. 2023. “A Drop of Love? Rainfall Shocks and Spousal Abuse: Evidence from Rural Peru.” Journal of Health Economics 89: 102739.
Doan, Miki Khanh, Ruth Hill, Stéphane Hallegatte, Paul Andres Corral Rodas, Ben James Brunckhorst, Minh Nguyen, Samuel Freije-Rodriguez, and Esther Naikal. 2023. “Counting People Exposed to, Vulnerable to, or at High Risk from Climate
Shocks—A Methodology.” Policy Research Working Paper 10619, World Bank, Washington, DC. http://documents.worldbank.org/curated/en/099602511292336760.
Eakin, Hallie. 2000. “Smallholder Maize Production and Climatic Risk: A Case Study from Mexico.” Climatic Change 45 (1): 19–36.
Eickmeier, Sandra, Josefine Quast, and Yves Schüler. 2024. “Macroeconomic and Financial Effects of Natural Disasters.” Discussion Paper 45/2024, Deutsche Bundesbank, Frankfurt, Germany.
Eriksson, Mathilda, Alejandro del Valle, and Alejandro de la Fuente. 2025. “Droughts Worsen Air Quality by Shifting Power Generation in Latin America and the Caribbean.” Policy Research Working Paper 10760, World Bank, Washington, DC. http://hdl.handle.net/10986/41500.
Escalante, Luis Enrique, and Helene Maisonnave. 2022. “Impacts of Climate Disasters on Women and Food Security in Bolivia.” Economic Modelling 116: 106041
Fomby, Thomas, Yuki Ikeda, and Norman V. Loayza. 2013. “The Growth Aftermath of Natural Disasters.” Journal of Applied Econometrics 28: 412–34.
Fruttero, Anna, Daniel Halim, Chiara Broccolini, Bernardo Coelho, Horace Gninafon, and Noël Muller. 2023. “Gendered Impacts of Climate Change: Evidence from Weather Shocks.” Policy Research Working Paper 10442, World Bank, Washington, DC. http://documents.worldbank.org/curated/en/099342305102324997
Gonzalez, Fernando Antonio Ignacio, Maria Emma Santos, and Silvia London. 2022. “Multidimensional Poverty and Natural Disasters in Argentina (1970-2010).” Journal of Human Development and Capabilities 23 (2): 206–27.
Hallegatte, Stéphane, Charl Hooste, and Florent McIsaac. 2024. “Modeling the Macroeconomic Consequences of Natural Disasters: Capital Stock, Recovery Dynamics and Monetary Policy.” Economic Modelling 139: 106787.
Harvey, Celia A., Milagro Saborio-Rodríguez, M. Ruth Martinez-Rodríguez, Barbara Viguera, Adina Chain-Guadarrama, Raffaele Vignola, and Francisco Alpizar. 2018. “Climate Change Impacts and Adaptation among Smallholder Farmers in Central America.” Agriculture and Food Security 7: 57.
Henry, Michael, Nekeisha Spencer, and Eric Strobl. 2020. “The Impact of Tropical Storms on Households: Evidence from Panel Data on Consumption.” Oxford Bulletin of Economics and Statistics 82 (1): 1–22.
Hill, Ruth, Nisan Gorgulu, and Ben Brunckhorst. 2025. “One-Fifth of the World’s Population at High Risk from Climate-Related Hazards.” Preprint, posted January 30, 2025. https://doi.org/10.21203/rs.3.rs-5302969/v2
Hochreiner, Stefan. 2009. “Assessing the Macroeconomic Impacts of Natural Disasters: Are There Any?” Policy Research Working Paper 4968, World Bank, Washington, DC. http://hdl.handle.net/10986/4162
Ishizawa, Oscar A., and Juan Jose Miranda. 2019. “Weathering Storms: Understanding the Impact of Natural Disasters in Central America.” Environmental and Resource Economics 73: 181–211.
López-Calva, Luis-Felipe, and Carlos Rodríguez-Castelán. 2016. “Pro-Growth Equity: A Policy Framework for the Twin Goals.” Policy Research Working Paper 7897, World Bank, Washington, DC. http://documents.worldbank.org/curated/en /911711479931074058.
López-Feldman, Alejandro, and José Jorge Mora Rivera. 2018. “The Effects of Climate Change on Poverty and Income Distribution: A Case Study for Rural
Mexico.” In Economic Tools for the Analysis of Global Change Impacts on Agriculture and Food Security, edited by Sonia Quiroga, 25–42. Cham, Switzerland: Springer Nature.
Morris, Saul S., Oscar Neidecker-Gonzales, Calogero Carletto, Marcial Munguia, Juan Manuel Medina, and Quentin Wodon. 2002. “Hurricane Mitch and the Livelihoods of the Poor in Honduras.” World Development 30 (1): 49–60.
Mueller, Valerie A., and Daniel E. Osgood. 2009. “Long Term Consequences of Short-Term Precipitation Shocks: Evidence from Brazilian Migrant Households.” Agricultural Economics 40 (5): 573–86.
Narayan, Deepa, Lant Pritchett, and Soumya Kapoor. 2009. Moving Out of Poverty: Vol. 2. Success from the Bottom Up. Washington, DC: World Bank.
Noy, Ilan, and William duPont IV. 2018. “The Long-Term Consequences of Disasters: What Do We Know and What We Still Don’t.” International Review of Environmental and Resource Economics 12 (4): 325–54.
Osberghaus, Daniel. 2019. “The Effects of Natural Disasters and Weather Variations on International Trade and Financial Flows: A Review of the Empirical Literature.” Economics of Disasters and Climate Change 3: 305–25.
Palacios, Paola, and Libardo Rojas-Velásquez. 2023. “Impact of Weather Shocks on Educational Outcome in the Municipalities of Colombia.” International Journal of Educational Development 101: 102816.
Pecha Garzón, Camilo José. 2017. “The Effects of Natural Disasters on the Labour Market: Do Hurricanes Increase Informality?” Working Paper Series 854, InterAmerican Development Bank, Washington, DC.
Peraza, Sandra, Catharina Wesseling, Aurora Aragon, Ricardo Leiva, Ramón Antonio García-Trabarino, Cecilia Torres, Kristina Jakobsson, et al. 2012. “Decreased Kidney Function among Agricultural Workers in El Salvador.” Journal of Kidney Diseases 59 (4): 531–40.
Pérez-Silva, Rodrigo, Mayarí Castillo, and Chiara Cazzuffi. 2023. “Droughts and Local Labor Markets: Studying Heterogenous Effects on Women and Indigenous People in Chile.” Economics of Disasters and Climate Change 7 (2): 281–302.
Premand, Patrick, and Renos Vakis. 2010. “Do Shocks Affect Poverty Persistence? Evidence Using Welfare Trajectories from Nicaragua.” Well-being and Social Policy 6 (1): 95–129.
Raddatz, Claudio. 2009. “The Wrath of God: Macroeconomic Costs of Natural Disasters.” Policy Research Working Paper 5039, World Bank, Washington, DC. http://hdl .handle.net/10986/4307
Rocha, Rudi, and Rodrigo R. Soares. 2015. “Water Scarcity and Birth Outcomes in the Brazilian Semiarid.” Journal of Development Economics 112: 72–91.
Rodríguez-Meza, Jorge, and Claudio González-Vega. 2004. “Household Income Dynamics and Poverty Traps in El Salvador.” Presented at the American Agricultural Economics Association annual meeting, Denver, CO, August 1–4, 2004.
Rodriguez-Oreggia, Eduardo, Alejandro de la Fuente, Rodolfo De La Torre, and Hector A. Moreno. 2013. “Natural Disasters, Human Development and Poverty at the Municipal Level in Mexico.” Journal of Development Studies 49 (3): 442–55.
Romer, Paul M. 1986. “Increasing Returns and Long-run Growth.” Journal of Political Economy 94 (5): 1002–37.
Rosales-Rueda, Maria. 2018. “The Impact of Early Life Shocks on Human Capital Formation: Evidence from El Niño Floods in Ecuador.” Journal of Health Economics 62: 13–44.
Schumpeter, Joseph A. 1991. Capitalism, Socialism and Democracy. London and New York: Routledge.
Segnestam, Lisa. 2017. “Gendered Experiences of Adaptation to Drought: Patterns of Change in El Sauce, Nicaragua.” Latin American Research Review 52 (5): 807–23.
Seo, Niggol, and Robert Mendelsohn. 2007. “A Ricardian Analysis of the Impact of Climate Change on Latin American Farms.” Policy Research Working Paper 4163, World Bank, Washington, DC.
Skoufias, Emmanel, and Katja Vinha. 2013. “The Impacts of Climate Variability on Household Welfare in Rural Mexico.” Population and Environment 34: 370–99.
Solow, Robert M. 1956. “A Contribution to the Theory of Economic Growth,” The Quarterly Journal of Economics 70 (1): 65–94.
Spencer, Nekeisa, Solomon Polachek, and Eric Strobl. 2016. “How Do Hurricanes Impact Scholastic Achievement? A Caribbean Perspective.” Natural Hazards 84: 1437–62.
Strulik, Holger, and Timo Trimborn. 2019. “Natural Disasters and Macroeconomic Performance.” Environment and Resource Economics 72: 1069–98.
Tucker, Catherine M., Hallie Eakin, and Edwin J. Castellanos. 2010. “Perceptions of Risk and Adaptation: Coffee Produers, Market Shocks and Extreme Weather in Central America and Mexico.” Global Environmental Change 20 (1): 23–32.
Van den Berg, Marrit, and Burger, Kees. 2008. “Household Consumption and Natural Disasters: The Case of Hurricane Mitch in Nicaragua.” Presented at the European Association of Agricultural Economists 2008 International Congress, Ghent, Belgium, August 26–29, 2008.
Wink, Jr., Marcos Vinício, Lucas G. dos Santos, Felipe Garcia Ribeiro, and Carolina S. da Trindade. 2023. “Natural Disasters and Poverty: Evidence from a Flash Flood in Brazil.” Environment, Development and Sustainability 26: 23795–816.
Xu, Ankai, and Amèvi Rocard Kouwoaye. 2019. “How Do Natural Disasters Affect Services Trade?” WTO Staff Working Paper ERSD-2019-12, World Trade Organization, Economic Research and Statistics Division, Geneva, Switzerland.
As noted in chapter 1, climate change is expected to make climate hazards more frequent and intense, with wide-ranging short- and long-term impacts on welfare poised to stay. Although meeting the Paris Agreement target of keeping the increase in the average global temperature below 2°C could lessen some effects, the planet will keep heating up as emissions remain high. Currently, efforts are off track; existing pledges are not enough to halve emissions in the next decade. At this pace, global temperatures will surpass 1.5°C of warming before mid-century and could exceed 3°C by 2100. 2024 was the first full calendar year in which global temperatures were 1.5°C above 1850–1900 preindustrial average levels, and the 2015–24 decade has been the hottest on record (WMO 2025).
Much of the focus in the region (and elsewhere) to counter the effects of hurricanes, droughts, and, more broadly, climate change has been on mitigation, that is, curbing global warming by encouraging countries to burn less coal, oil, and gas to reduce the emission of carbon dioxide and other greenhouse gases and prevent temperatures from rising, which could in turn lead to more extreme climate events.
Cutting emissions is essential and still the best long-term fix, but, as indicated in chapter 2, welfare impacts from climate hazards that materialize—such as heat and drought—will persist unless adaptation takes place. Adaptation involves acknowledging the reality of climate change and taking measures to safeguard people from its consequences. That means risk reduction and loss prevention policies to support adaptation are crucial in the short term. This section reviews some key adaptation responses.
Ehrlich and Becker (1972) laid out a useful way to think about how people and governments adapt to risk that aligns closely with the two-pronged framework of prevention and preparedness used in World Bank reports on risk layering and resilience.1 It starts with the choices individuals or institutions have. First is prevention—such as moving away from flood zones— to reduce the probability of losses. Second, when prevention is too costly or risk cannot be fully avoided, people then turn to insurance as a preparedness mechanism to manage residual risk. This mechanism could be self-insurance, when the individual believes that they have enough personal resources to finance the recovery, such as using savings or building up assets, or marketbased insurance, such as buying coverage for crops or property from an insurer. Last is coping, which refers to strategies mainly undertaken after a climate hazard has occurred and includes reducing consumption, selling goods, borrowing or leaning on family or friends through remittances, or government aid. More important, however, coping also needs ex ante resources and preparation to be efficient. In other words, the capacity to cope and adapt (sometimes called resilience) is sometimes built ex ante, by helping to stabilize incomes, so that households and communities have a greater capacity to cope effectively once climate hazards occur.
In practice, these three tools—prevention, insurance, and coping—are often intertwined. For instance, an insurance program that is heavily subsidized acts more as a social protection system than as insurance, and in some places, the resources for social protection are insured on markets (refer to figure 3.1). Furthermore, in this context, the risk layering approach becomes essential: It ensures that cheaper sources of financing, such as contingency budgets and reserves, are used first for frequent, lower-impact events, whereas more expensive tools, such as insurance or market-based risk transfer instruments, are reserved for rare, high-impact events. This structured, layered strategy helps ensure that resources are available when most needed and that limited budgets are used efficiently to protect those who are most vulnerable.
Ehrlich and Becker’s (1972) framework assumes people weigh their options carefully to get the most out of their resources and maximize their welfare. Thus, their choices are not arbitrary but strategic. On the one hand, for rare or extreme hazards such as a category 5 hurricane, prevention alone may be impractical because of high upfront costs and delayed benefits. In those cases, market insurance makes more sense. On the other hand, frequent, smaller risks are often best managed through self-insurance. As for the income and costs faced, only the wearer knows where the shoe pinches, and so families ultimately choose what fits their preference and budget best. As prevention gets cheaper or risks shrink, self-protection becomes more attractive. Full prevention, such as moving away from hurricane areas, might be out of reach if it means losing job opportunities. In those cases, people may just choose to live with the risk and deal with it if and when it materializes.
FIGURE 3.1
Conceptual framework to understand adaptation
Ex ante adaptation (insurance or prevention)
Early warning systems; land and ecosystem protection
Ex post adaptation (coping)
Adaptive social protection
urban infrastructure
Source: Original figure for this publication.
A family is better off using all three risk management tools—prevention, insurance, and coping—rather than just one. They might avoid floods by living on high ground but still farm in low-lying, fertile areas. They could insure some risks, such as crops, while managing others themselves. These tools work together, creating trade-offs. For example, if storm insurance is too expensive because of low risk, they might choose self-insurance. Another trade-off involves survival priorities: Prevention can seem like a luxury when immediate needs are more pressing. So far, this framework assumes individuals can only influence their own climate risks.
Adaptation is often seen as a private choice, but public adaptation is also warranted. In reality, many preventive actions cannot be taken individually, such as retrofitting a school or health facility to make it hurricane resistant or constructing a levee to avoid flooding. They require a plan that coordinates collective action rather than individual effort. This is where adaptation policy steps in.
Adaptation policies are also crucial when barriers such as poor information, weak property rights, and limited access to credit or insurance prevent households from managing climate risks effectively (Carleton et al. 2024). Some may not even realize they are in harm’s way, whereas others might be aware but unable to afford risk reduction measures—such as relocating— because of insecure property rights or high costs. So government policies to create early warning systems (EWSs) using radio broadcasts, enforcing land tenure security and sea walls, and protecting mangroves can likely have large welfare gains.
Even without market failures, equity-driven concerns warrant public adaptation, especially for poorer communities. Climate change deepens inequality because of uneven exposure (refer to chapter 1, “When climate hazards meet poverty” section) and adaptation spending (see chapter 4, “Institutions” section). A dry planting season can push vulnerable households without proper risk management tools toward safer but lower-return activities, trapping them in poverty. Droughts or floods can cause lasting damage, forcing desperate actions such as selling assets or pulling kids from school. Acknowledging the limits of self-insurance, governments provide safety nets—cash transfers, emergency aid, and shelters (such as schools on high ground or stilts)—and insurance to protect those most at risk.
Just like households, governments’ approach to risk can be understood through the lens of prevention, insurance, or coping. Government’s approach depends on the type of hazard, costs, and budget but also on perceptions and equity concerns. It might fully prevent certain risks (for example, by relocating people from flood zones, even if those areas are more fertile), insure against others (such as buying weather insurance), and handle the remaining risks (such as handing out cash during floods). Table 3.1 shows an abbreviated overview of the adaptation strategies available to individuals, communities, and governments.
Effective adaptation needs both individual and government decisions to work together: weather forecasts and moving to shelters or zoning and road access for commuting. Other actions are substitutes, such as using fire extinguishers at home versus funding fire departments. Similarly, local, state, and federal services may complement or substitute for each other. Ultimately, the effectiveness of one depends on the other. Although collaboration is essential, it also poses challenges. More evidence is needed on how public systems compare with informal ones in terms of efficiency and fairness, as well as the risk of crowding out private efforts. For example, how do government risk reduction efforts affect personal mitigation actions? How can governments show their commitment to risk reduction? Although finding the optimal balance is outside the scope of this report (for a recent discussion on this, see Shilpi, Kahn, and Berg 2025), chapter 4 touches on incentives, information gaps, and constraints affecting household and government choices.
MEASURE
INDIVIDUAL OR HOUSEHOLD LEVEL
Prevention Adjustment of asset portfolio and income-generating activities
Investment to protect, maintain, and enhance assets (for example, retrofitting)
Permanent migration
Self-insurance
Holding financial or nonfinancial assets (for example, livestock, stored grain, durables) for precautionary purposes
Market insurance Property catastrophe insurance
Agricultural insurance
Coping
Temporal migration
Intensification or expansion of household labor
Drawing on stocks of social capital (credit, food, charity, or begging)
Running down stocks of human and physical capital
Reducing or minimizing household expenditures
Source: Adapted from UN and World Bank 2010.
Note: EWSs = early warning systems.
COMMUNITY LEVEL
Relocation
Community training programs
Public goods and services (for example, community-based information systems, smallscale irrigation, and infrastructure projects)
Local borrowing schemes
Rotating access to common property resources
Microfinance (semiformal)
Savings and credit associations
Rotating savings and credit associations
Interhousehold transfers and private remittances
NATIONAL AND SUPRANATIONAL LEVELS
Good analytical frameworks and risk information systems (disaster risk profiles, awareness, EWSs)
Guaranteed rights (land) and security (building codes)
Stable macroeconomy, policy regime, and political system
Markets for household assets
Market information
Investments in physical and social infrastructure
Sovereign budget insurance and catastrophe bonds
Targeted safety nets (transfers and public works)
Calamity funds or food
Donor assistance (contingent loans)
By now, it should be clear that although reducing some risks is smart, full prevention can sometimes be excessively costly. In those cases, some losses could be insured against, and the risk that is left is borne. This is why adopting a mix of adaptive strategies simultaneously—not just one after another—is key. Still, this does not always happen. Households or governments might not be able to afford or choose not to invest in upfront actions, sometimes because of trade-offs, constraints, or moral hazard. The answer is to design interventions that tackle multiple goals at once.
Multilateral financial institutions, international donors, and governments have increasingly been advocating for adaptation actions that bring multiple benefits. The first dividend comes from the ability of the investment to reduce future losses. A second dividend could come from positive economic benefits through reducing risk, increasing productivity, and driving innovation through
the need for adaptation. There could even be social and environmental benefits that cut emissions, which in turn lower the probability of more and stronger climate hazards (Global Commission on Adaptation 2019).
Take insurance, for example. Payouts help families quickly replace lost assets, protecting their livelihoods and preventing further losses after a disaster. Insurance can also improve creditworthiness for low-income households or governments, encouraging investment in riskier but more rewarding activities, leading to higher incomes. That extra income boosts resilience and provides quicker access to resources when climate hazards materialize. Plus, when insurance providers offer lower premiums for risk reduction, it motivates people or governments to invest in prevention. In short, insurance can be transformative by promoting higher-income opportunities, protecting assets and livelihoods, and providing incentives to reduce risk—especially for poor individuals.
This report examines five adaptation measures that can reportedly deliver multiple benefits:
1. Better forecasting and widespread warning systems,
2. More critical infrastructure and climate-smart urban planning,
3. Protection of natural defenses against climate hazards such as forests and other key ecosystems,
4. Improved financial tools and contingent financing to respond to climaterelated hazards, and
5. Reinforced adaptative social protection systems and income support for poor and vulnerable groups during realized climate hazards.
People and assets concentrate in areas exposed to climate hazards through population growth, migration, urbanization, and economic development. However, when households, communities, and governments have adequate preparations to counter the potential damage from such hazards, these exposures can be prevented from translating into losses. For instance, effective EWSs—for example, hurricane forecasts and evacuations—together with safe housing and strong infrastructure, can significantly reduce vulnerability. This section reviews key adaptation policies and mechanisms that help prevent losses and increases in poverty and examines their current status in the region.
Severe weather can hit any time—Atlantic storms from June to November and wildfires and heat waves in the dry months. When danger looms, governments
can send loud phone alerts or flash warnings on TV, giving people time to reach designated shelters and stay safe. This system of timely alerts and preparedness is known as an EWS.
Timely warnings give people a chance to evacuate and protect their lives—and sometimes their property. Robust EWSs linked to existing social protection systems enable timely, risk-informed responses when climate hazards materialize. (World Bank 2023). EWSs have been saving lives for centuries, even showing up in ancient stories. An example is Noah’s Ark in the Old Testament: Noah got a warning of an approaching flood, and he and his family prepared for the impending disaster by constructing an ark that saved their lives. Have early warning systems saved lives in Latin America and the Caribbean (LAC) in recent decades?
An exercise conducted for this report looked at the number of casualties caused by hurricanes of similar magnitude over the past 40 years in the region. The scatterplot in figure 3.2 suggests that countries with advanced warning capacities have fewer fatalities during storms of comparable intensity than those with limited capabilities. Of course, this correlation likely reflects broader governance and institutional factors. Countries with strong EWSs often exhibit reinforcing advantages—such as robust infrastructure and greater administrative capacity—that also contribute to lower mortality, making it difficult to isolate the specific effect of any one factor.
Deaths by hurricane category and country-level capacity to provide climate services
Deaths per 100,000
Source: World Meteorological Organization Early Warnings for All dashboard (https:// earlywarningsforall.org/site/early-warnings-all/dashboards/early-warnings-all-dashboard) as of January 2025; casualties and hurricane intensity data from the Centre for Research on the Epidemiology of Disasters Emergency Events Database (https://www.emdat.be/).
Even though EWSs are a low-cost, low-tech way to save lives from climate hazards, many countries in LAC still face challenges. Not all of them have strong systems in place. According to the World Meteorological Organization (WMO), a good multihazard EWS has four key parts: knowing the risks, monitoring and sending alerts, clearly communicating warnings, and having a solid response plan. The more of these that are in place, the more advanced and effective the system is.
Based on the available data from 32 WMO members from LAC, almost half are currently providing climate services at advanced, essential, and full capacities. However, six operate at a basic level for climate services, and 11 members do not report information on climate services (refer to figure 3.3) (WMO 2022). As a result, for instance, only 60 percent of people in South America are covered by a multihazard EWS according to 2020 data available from nine countries WMO 2022).
Number of LAC countries by capacity to provide climate services and early warning systems
Source: World Meteorological Organization Checklist for Climate Services Implementation data.
Note: Advanced = Jamaica; full = Costa Rica, Guyana, and Honduras; essential = Argentina, Barbados, Belize, Bolivia, Brazil, Chile, Colombia, Haiti, Paraguay, and Uruguay; basic = the Bahamas, Curaçao, Dominican Republic, Ecuador, Mexico, St. Lucia, and St. Maarten; less than basic = British Caribbean Territories (Anguilla, British Virgin Islands, Cayman Islands, Montserrat, and Turks and Caicos Islands). Countries with no data are Antigua and Barbuda, Cuba, Dominica, El Salvador, Guatemala, Nicaragua, Panama, Peru, Suriname, Trinidad and Tobago, and Venezuela, RB.
The inadequate capacity for end-to-end forecasting and warning services affects mainly those living in lower-income countries and small island states. Within countries, poor households seem to struggle the most: In the Dominican Republic, for example, poorer households tend to search less for weather information or receive flood warnings (refer to figure 3.4). The main channel used to search for weather information also varies across wealth levels: Poorest households rely more on TV, whereas wealthier households tend to scan social media or check web pages. However, only two-thirds of poor households have a TV, and only 9 percent have a computer or tablet with which to access web pages. As such, improving access to weather information could increase the level of awareness during floods and bring huge dividends to poor households.
Better-educated households are also more active in searching for weather information and attending flooding information seminars. Households headed by someone with tertiary education are better informed on weather conditions: Of them, 74 percent actively look for weather information, relative to 55 percent of those with secondary education and 45 percent of those with primary education or less.
3.4
Poorer households search or receive less warning information against floods
a. Access to weather forecasts and alerts by wealth quintile
b. Share of households that search for weather information by education level of household head (2021)
Source: World Bank 2023.
Note: A wealth index is constructed using a principal-components analysis from a range of goods that the household has along with certain characteristics of the households. The first principal component is then used to predict the values to create five quintiles of the wealth index.
Ensuring information reaches those in need is not sufficient—better weather forecasting is also key. In Brazil, meteorologists missed the mark in February 2023, failing to predict heavy rains that led to deadly mudslides in Petrópolis and more than 200 deaths. In places such as Bahia and Minas Gerais, however, more accurate forecasts helped keep casualties down (Sengupta 2022). In Mexico, Hurricane Otis caught everyone off guard, rapidly intensifying before landfall. If forecasters had picked up on its strength earlier—when it was still a tropical storm—they could have issued stronger warnings and given people more time to get out of harm’s way.
According to the UN (2022), every country should put end-to-end EWSs in place in the next four years to reduce the impacts of weather- and climaterelated hazards. With the exposure of populations and economies to climate events on the rise, the consequences of failing to ensure that every person in LAC is protected by EWSs could be onerous. Chapter 4 proposes some ways to produce better forecasts, make them more widely available, and make people heed warnings.
Cities can lift people out of poverty. People live where it is convenient to work. Urban areas attract people from the hinterland because manufacturing and services provide better employment than farming. The 2009 World Development Report (World Bank 2009) shows how the benefits of scale, agglomeration economies, and specialization increase productivity and prosperity. These benefits draw people to migrate to urban centers from rural settings. The density of cities promotes productivity and offers opportunities to improve people’s livelihoods and quality of life, eventually helping lift many out of poverty. For firms and workers in urban areas, proximity makes skills matching and job searching more efficient. For governments, basic public services and infrastructure can be provided at a lower cost thanks to economies of scale. For the urban poor, economic diversity and clustering create pathways out of poverty.
By contrast, recurrent floods—common in LAC cities—can undermine urban agglomeration’s role in reducing poverty and integrating labor markets by causing power failures, service disruptions, property damage, and business closures. In Guayaquil, a key economic center in Ecuador, flooding repeatedly paralyzed transportation systems over 2018–19, preventing low-income workers from reaching their jobs and resulting in lost wages. A one-week disruption of critical road segments in this region could result in losses of approximately -$35 million for households (Quichimbo-Miguitama et al. 2022). In Chile and Colombia, high flood risks limit upward mobility (Nakamura et al. 2023). And with climate change increasing extreme precipitation, floods—already the most common climate hazard in LAC—are expected to become more frequent and intense (IPCC 2022).
When development outpaces a local government’s ability to provide adequate services (electric, water, and sewerage connections; land titles; and so forth), shanty towns emerge, making housing particularly vulnerable to flood damage.2 It is therefore not surprising that housing accounts for much of the damage. In contrast, commercial buildings, with secure land titles and better construction, often remain intact, leaving the government to decide whether to permit rebuilding in the same location. When shoddy homes are destroyed but industries survive, rebuilding is simpler—public infrastructure can be relocated to safer areas or rebuilt to better standards, and residents can choose to stay or move. In Tegucigalpa, Honduras, repeated flooding has pushed some low-income neighborhoods to safer but more remote areas, reducing flood risk but increasing economic vulnerability by distancing residents from jobs and social networks (Fay 2005, in Hallegatte and Rozenberg 2017). Yet, as chapter 2 highlights, many poor communities continue to reside in high-risk flood zones.
Cities need to continue adapting to floods and other risks, including those from urbanization and climate change. As urban areas and populations grow, the dynamic nature of urbanization alters the cost-benefit assessments of risk reduction strategies. The 2009 World Development Report emphasized that governments should support, not prevent, urbanization by providing necessary institutions, services, and jobs. There are no ready recipes to create better adaptation, but much can be done to foster it. Although exposure to climate hazards may rise, vulnerability may fall as incomes increase. Governments have various tools to address these challenges effectively.
As table 3.1 in this chapter shows, the adaptation toolbox offers a range of solutions, from migration and weather forecasts to less disruptive options such as sandbags and ditches for households and schools. Many flood impacts can be mitigated by improving institutions—such as creating inclusive urban plans, clarifying land rights, and raising awareness. Interventions should benefit all residents, with a focus on marginalized populations. To reduce climate vulnerability, adaptation strategies must address both the increased exposure of poor people and the institutional and socioeconomic factors. Leveraging affordable technologies, such as community-based EWSs and flood defenses (for example, public spaces and nature-based solutions), is crucial, as noted earlier. But other, more costly options can also prevent flood risks, such as gray infrastructure (of which dams are one example). Although existing literature on resilient cities often focuses on urban planning—for example, building codes and general adaptation (World Bank 2016)—this section highlights two less explored areas: dams and critical infrastructure for recovery.
On the basis of econometric analyses using a 23-year city-level panel data set covering 1,013 flood events in 582 LAC cities from 2000 to 2023 (Gandhi et al. 2024), we attempt to understand whether people and governments succeed in alleviating the negative impact of floods on population, mortality, and economic activity through migration and gray infrastructure. Do they move to locations
with lower risk? Do public investments in prevention through dams upstream (which can reduce flood risk by regulating water flow downstream) reduce mortality? Does critical infrastructure such as roads, water supply, and sewage disposal systems reduce negative economic impacts and help recovery?
Short-term migration does not seem to be a key response to floods, especially in poorer countries. In LAC countries, whether high or low income,3 past-year floods have no significant impact on population, indicating that residents remain despite the floods. However, cross-sectional analysis shows lower population growth in flood-prone cities in high-income LAC countries (refer to figure 3.5). The limited migration response in poorer nations raises climate justice concerns, because the cities in poor countries face greater risks with fewer adaptation options.
Consistent with the overall drop in deaths from climate hazards shown in figure 2.4 in chapter 2, flood-related deaths in LAC have been slowly declining over time—by about 2.2 percent per year, after accounting for factors such as population, urbanization, rainfall, and elevation. This figure is below the global average of 6.8 percent. The trend is not seen in high-income countries or coastal cities, but cities in low-income countries show a sharper drop (16 percent), as do inland cities (4 percent). This likely reflects progress in preparedness against climate hazards, EWSs, emergency response, and other risk reduction efforts in places that previously lacked them (refer to figure 3.6).
Upstream dams also appear to help reduce flood-related deaths, but mostly in cities in high-income countries. In low-income countries, dams do not show a clear effect on flood resilience. Inland cities, particularly capitals, seem to benefit most from upstream dam infrastructure (refer to figure 3.7).
FIGURE 3.5
Effects of floods on population
LAC countries
Low-income LAC countries
High-income LAC countries
Specification Coefficient estimate
Model: Change in population Population
Source: Original figure for this publication based on data from Gandhi et al. 2024.
Note: Data replicated for all, low-income, and high-income LAC countries, with 95 percent confidence intervals. LAC = Latin America and the Caribbean.
FIGURE 3.6
Source: Original figure for this publication based on data from Gandhi et al. 2024, replicated for all, low-income, and high-income LAC countries and for inland and coastal LAC cities.
Note: The green bars are not statistically significant. LAC = Latin America and the Caribbean.
FIGURE 3.7 Flood-related deaths in cities protected and not protected by a dam
(hundreds)
Source: Original figure for this publication, based on data from Gandhi et al. 2024, replicated for all, low-income, and high-income LAC countries and for inland and coastal LAC cities.
Note: LAC = Latin America and the Caribbean.
Protecting critical infrastructure such as roads and clinics is essential for recovery,4 reducing the impact of floods by nearly 80 percent. As figure 3.8 shows, postflood, LAC cities lost on average 9.4 percentage points (blue bars) in economic activity (proxied by nighttime lights), partially alleviated by the
FIGURE 3.8
City-level economic impact of floods and mitigation via critical infrastructure
Source: Original figure for this publication based on data from Gandhi et al. 2024, replicated for all LAC and high-income LAC countries.
Note: The results from low-income countries are not significant. A CISI is a dummy variable that takes a value of 1 in the regression if the CISI score value is above the LAC median. CISI = Critical Infrastructure Spatial Index; LAC = Latin America and the Caribbean.
presence of critical infrastructure (green bars), resulting in only 2.7 percentage points in losses overall. Analysis distinguishing between highand low-income countries shows these benefits mainly accrue to high-income countries, underscoring the protection gap between high- and low-income countries in the region.5
Disparities in flood adaptation in LAC are evident in various forms. Wealthier nations are better equipped to anticipate and respond to climate hazards. Lowincome cities experience high economic losses and death rates but show no significant out-migration, highlighting limited self-protection options. Also, in low-income countries, upstream dams are often ineffective, pointing to the need for increased investment and operational efficiency. Within poor countries, capital cities mitigate losses more effectively, suggesting that fiscal constraints limit broader geographical adaptation. Floods in capital cities, which are better funded, tend to have less impact on average. However, coastal cities in low-income countries, which are associated with a high concentration of population and economic activity (Balboni 2025), suffer the most. These cities generally have less critical infrastructure and fewer downstream dams than inland cities—and significantly less than cities in high-income countries. Some, however, are tourism hubs and may be better served in specific areas. Despite the high payoffs in saved lives and avoided damages through large-scale critical infrastructure that reduces urban flood risk, there is a clear protection gap between rich and poor countries in LAC, and between coastal and capital cities within poorer countries in LAC.
In short, LAC has experienced swift urbanization, becoming the most urbanized developing region globally while escalating exposure to climate hazards.
The urban landscape serves as a nexus for significant economies of scale and agglomeration. However, it is also where stark inequalities, poverty, informality, and environmental vulnerability are expressed. The dichotomy of these urban realities underscores the intricate challenges faced by the region in balancing growth and development with social equity and climate resilience (refer to box 3.1).
What can the public sector do to reduce the risk of urban floods, with a focus on disparities in particular? Ex ante, good institutions that allow land markets to function properly regulate development in hazardous locations and provide public infrastructure that reduces risk while ensuring growth are all necessary. But also, what is the appropriate role of the public sector in urban redevelopment efforts after climate hazards strike (assessment of need for large-scale redevelopment efforts; political economy aspects)? Chapter 4 looks at some of these issues more carefully.
Floods and storms are not the only threats hitting cities in LAC; heat waves are on the rise, too. Thanks to the urban heat island effect, city areas get much hotter than the countryside. Concrete and tightly packed buildings trap heat and stop it from escaping, turning cities into ovens and making them feel even hotter.
Densely built, low-income neighborhoods tend to be much hotter. Informal settlements often pile on poverty, heat risk, and weak infrastructure. Poorly built homes trap heat thanks to bad ventilation and heat-absorbing roofs. On top of that, these areas often lack clean water to refresh, parks and green space, and good transit. And because they are usually on the city’s edge, residents have a tough time reaching things such as health care or cooling centers.
A deep dive into Barranquilla, Colombia, and Mexico City, Mexico, shows a clear link between heat and multidimensional poverty (refer to map 3.1.1). In both places, the hottest areas (refer to maps 3.1.1a and 3.1.1d) often line up with the poorest neighborhoods (refer to maps 3.1.1b and 3.1.1e), creating major risk
hotspots (refer to maps 3.1.1c and 3.1.1f). In Barranquilla, these hotspots show up mainly in the west and south, whereas the wealthier northern areas stay cooler thanks to the coast.a In Mexico City, the heat hits hardest in the east, where many lower-income communities are located.
Unfortunately, research also shows big disparities in technological adaptation to rising heat. Noy and Strobl (2022) found that heat waves drive innovation in cooling technology, especially air conditioning (AC). As expected, hotter temperatures lead more people to adopt AC, but not equally across the board. Using detailed electricity data from Colombia, McRae (2023) found that wealthier households get AC faster and use it more when temperatures rise. Lowerincome households, however, adopt it more slowly and often do not use it as much, even when they have it—likely because of high running costs. More optimistically, lower-income households seem to be increasingly adopting AC technology, gradually converging toward the use rates that are observed for higher-income households.
Box 3.1 Heat waves and inequality (continued)
MAP B3.1.1
Land surface temperature and SUHI severity, multidimensional poverty, and their overlap for Barranquilla, Colombia, and Mexico City, Mexico
a. Land surface temperature and SUHI severity, Barranquilla
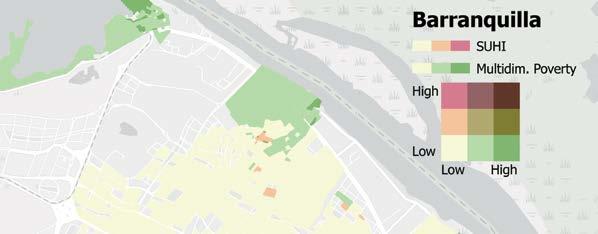
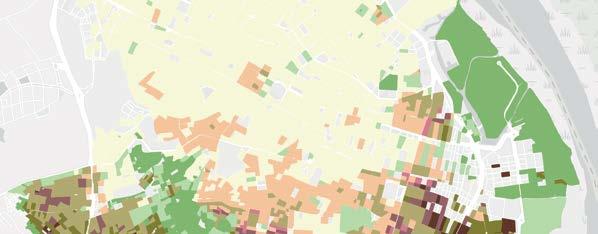
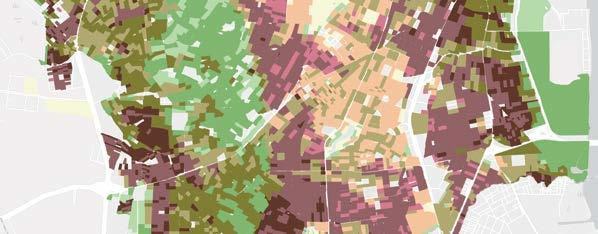
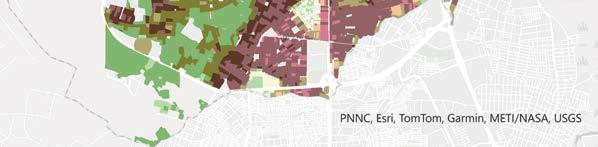
d. Land surface temperature and SUHI severity, Mexico City
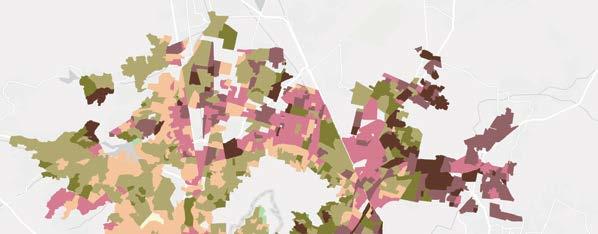
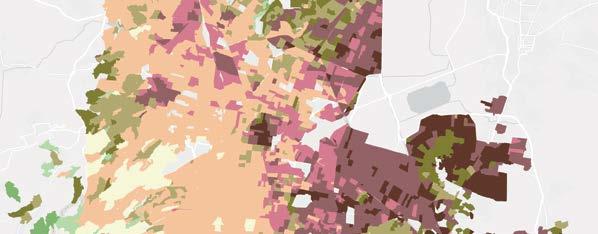
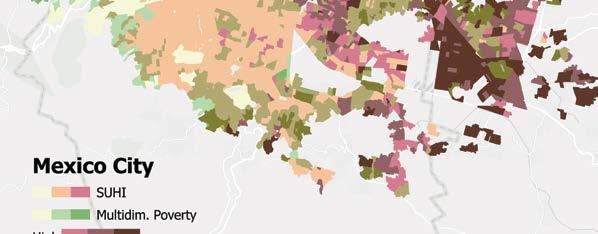
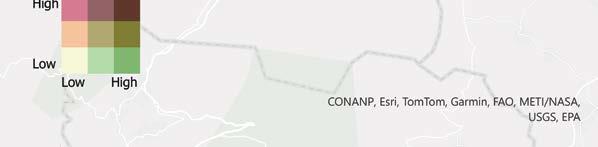
Source: World Bank 2025.
b. Socioeconomic vulnerability, Barranquilla
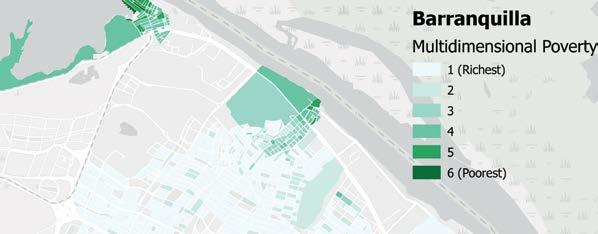
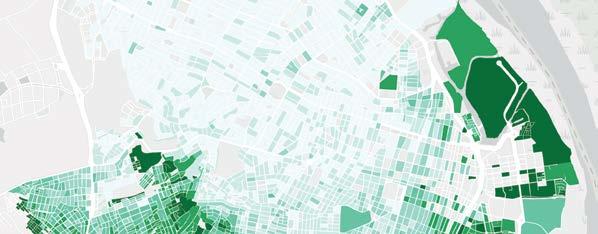
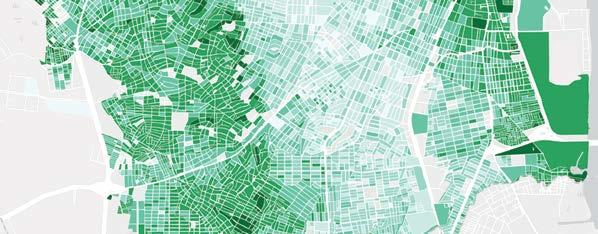
e. Socioeconomic vulnerability, Mexico City
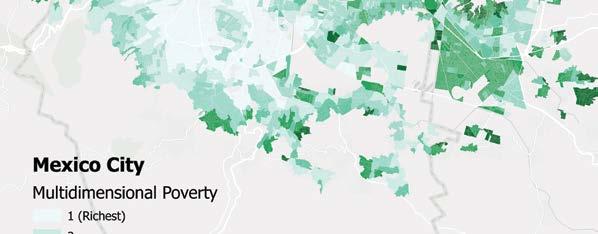
Note: SUHI = surface urban heat island effect.
c. Overlap, Barranquilla
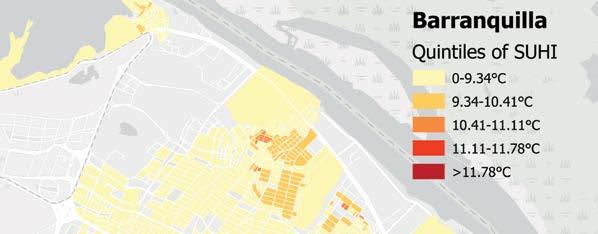
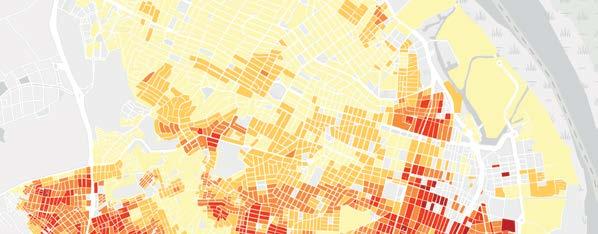
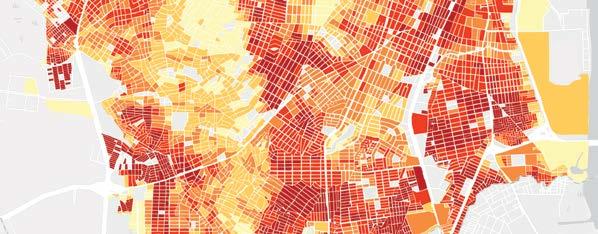
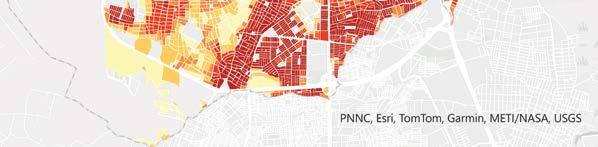
f. Overlap, Mexico City
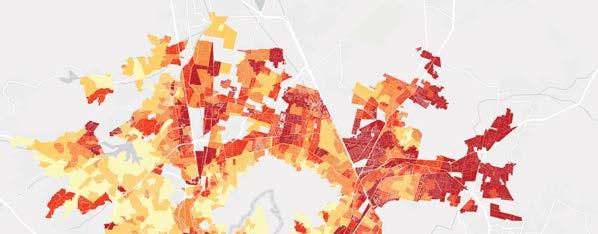
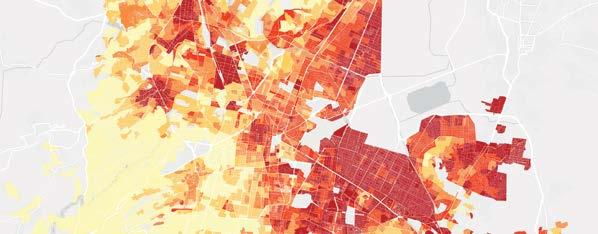
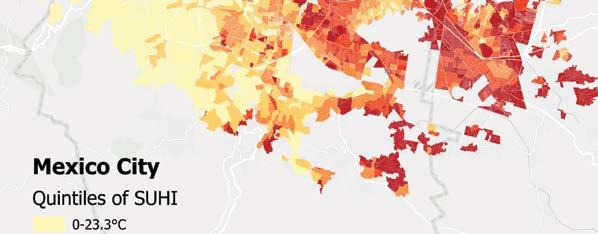
To tackle heat risks in poor neighborhoods, cities need solid action plans—early warnings, public awareness, behavior tips, and support services all play a role. Planting trees and adding green spaces
help cool things down, clean the air, and make outdoor life more livable. And although all that helps, AC is still one of the most effective ways to prevent deadly heat strokes.
a. Geography creates exceptions from city to city. In Bogotá, poorer areas have fewer trees but stay cooler thanks to higher elevation. Medellín flips the script—heat intensity is lower in poorer areas, likely because many informal settlements are tucked into the greener hills around the city. And although low-income communities often live in hot coastal zones, Barranquilla’s poorer residents are mostly inland, missing out on the sea breezes.
Climate-proofing the future: The role of land protection and ecosystems in adaptation
Although EWSs and gray infrastructure provide some protection against climate hazards, they cannot prevent these events or fully eliminate their impacts. Nature, however, can also be a powerful ally. Forests regulate temperatures and capture carbon, and coastal ecosystems—such as coral reefs, mangroves, salt marshes, and dunes—form a natural barrier against storms, flooding, and erosion. Grasslands help safeguard water sources during droughts. Beyond their environmental benefits, these ecosystems support social equity, because many marginalized communities depend on forests and fisheries for their livelihoods. By protecting lives, coastal properties, and biodiversity, these so-called nature-based defenses offer another solution for adaptation to climate challenges. The Global Commission on Adaptation (2019) says mangrove protection, for instance, pays off big—more than $5 in benefits for every $1 spent. Another global study finds that mangrove flood protection benefits exceed -$65 billion per year (Menéndez et al. 2020). In Central America, del Valle et al. (2019) found that wide mangrove belts can help cushion the economic hit from hurricanes.
Protecting ecosystems is not easy, however—people need food, and that puts pressure on nature. As economies grow, roads cut into protected areas, and people push further in. Greed for minerals and profits also fuels illegal logging and forest clearing. The biggest driver of deforestation is converting land for cattle and crops. In LAC, forests are being cleared for ranching, farming, land grabs, and mining. Between 1990 and 2020, forest cover dropped from 53 percent to 46 percent—a loss of 138 million hectares of forested land (CEPAL 2021). Brazil has historically been the leading country in the region in deforestation, especially in the Amazon. Whereas agriculture wipes out habitats on land, overfishing depletes life and ecosystems in the oceans.
Smaller countries such as Anguilla, The Bahamas, Belize, Guyana, and Suriname are especially vulnerable to mangrove loss, relying on those coastal ecosystems for major economic protection relative to their GDP.
On top of that, the world still depends on fossil fuels, making climate change worse and adding to the challenge. Staple crops such as wheat, corn, and rice are already experiencing reduced yields because of changing climate conditions (IPCC 2022). A study of 20 Latin American countries found negative impacts on yield across most crops (except for soybeans). Average percent yield losses between 2022 and 2049 were at least 10 percent for most crops, with some up to 60 percent loss in yield. Agricultural labor productivity losses were also significant, with Central America and the Caribbean most affected (Banerjee et al. 2021).
A review of policies to improve land use and sustainability in LAC shows mixed results in reducing deforestation and tackling poverty. Setting up and enforcing protected areas can help slow deforestation, but it can also affect nearby communities. Securing land rights has been around for a long time in the region, but its impact on both forests and poverty varies. Strengthening Indigenous land rights could lead to better results. Paying farmers for planting cover crops, no-till farming, rotational grazing, tree planting, wetlands restoration, and careful use of fertilizers can curb deforestation while reducing poverty. Finally, adjusting agricultural incentives is key to balancing land use in the region, with potential benefits for both the environment and household incomes (refer to table 3.2) (Turner, Lozano Gracia, and Hawthorne 2025).
TABLE 3.2 Policy levers for reducing deforestation and links to poverty reduction
POLICY LEVER USE IN REGION
Protected areas Significant. Latin America leads the world in area protected, but management and effectiveness could be improved. The surface area of 5,490 of the region’s administrative areas (44%) has at least some protected areas.
Land tenure security and management
Significant efforts, but lagging for IPs and other groups (women, youth).
ON LAND USE
Effective, but does not eliminate deforestation and is highly dependent on management effectiveness.
ON POVERTY
Generally positive but modest. Populations are no worse off and may be better off if tourism and other uses are allowed.
Impacts are most consistently positive in conjunction with IPs and in the context of better governance. Can be a precondition for other actions for example, PES).
Lack of high-quality evaluations. Can potentially increase the probability of investment in land and household consumption. continued
Agricultural incentive realignment
Sustainable agricultural innovation
Payments for ecosystem services
Emerging. Has been challenging, but efforts are increasing.
Emerging. Some firms are highly innovative, but extension and adoption among smaller farmers lags.
Long history of use in region for water; emerging interest for carbon. At least 186 active programs in the region between 2008 and 2017.a
Source: Turner, Lozano Gracia, and Hawthorne 2025.
Positive. Potentially positive with revenue recycling and support to ensure access to affordable diets for poor households. Evidence is limited, however.
Positive, although adoption and scaling of CSA and programs is an ongoing challenge.
Can be effective if well designed and targeted, but design issues can undermine impacts. Tendency for trade-offs between coverage (greater poverty reduction) and targeting of high deforestation risk.
Adoption of CSA can increase yields and market access, but evidence of direct effects on monetary poverty is limited.
Effective for poverty reduction, but scope for improvement. Separate mechanisms and ex ante assessment of potential needed to meet multiple policy goals.
Note: CSA = climate-smart agriculture; IPs = Indigenous peoples; PES = payment for ecosystem services. a. Value from Forest Trends’ Mapping Ecosystem Marketplace’s database, which contains 3,224 records of payments for global ecosystem services programs collected between 2008 and 2017, focused on four areas: forest land use and carbon projects, species and habitats projects, wetlands and streams projects, and watershed health projects. Because of the way in which data were collected, the resulting data should not be considered comprehensive, and the database may contain multiple entries representing projects that are linked but implemented in different administrative areas or that are implemented sequentially (for example, phase 1, phase 2). For more information about the map data and for detailed information on each project in the database, refer to https://www.forest-trends .org/project-list/#close and https://www.forest-trends.org/about-our-project-data/
Over the past century, Latin American countries have drawn boundaries to shield thousands of their most valuable ecosystems, from the Amazon forests to Argentina’s savannas. The region leads in conservation, with more than 24 percent of its land protected—well above the global average of 15.3 percent (as of 2021).6 LAC’s total protected area exceeds Brazil’s landmass, highlighting its leadership in terrestrial and marine conservation (Hatrick 2023).
Protecting land is a straightforward way to fight deforestation—it cuts rates by about 41 percent, although results vary (Wade et al. 2020; Wolf et al. 2021). A global review found that 55 percent of protected areas reduced deforestation both inside their borders and in nearby areas, and 12 percent saw it spiking just outside. In Latin America, deforestation is usually lower in protected areas, but spillover effects are mixed. Andam et al. (2008) point out that comparisons can be tricky if protection pushes deforestation elsewhere.
Protected areas support rural livelihoods by preserving soil, water, and biodiversity. They boost incomes through farming, fishing, and tourism, with environmental products making up 22–28 percent of rural incomes, benefiting poor individuals the most (Angelsen et al. 2014; Vedeld et al. 2007). In the region, many poor communities live in or near protected land: of poor individuals, 23 percent live in areas with at least 10 percent protected land, and 59 percent live near some protection (refer to map 3.1). In places such as Bolivia, Costa Rica, and the Peruvian Amazon, protected areas have reduced poverty—often through tourism—while preserving forests (Ferraro and Hanauer 2014).7
Despite their value, protected areas face major challenges. Poverty and human pressure often lead to overuse and environmental damage. In the Amazon, large-scale farming and ranching have driven deforestation since 1990 (Bagolle, Costella, and Goyeneche 2023). From 1990 to 2015, the region’s forests shrank
Overlays of monetary poverty and protected areas (as share of total land) in LAC
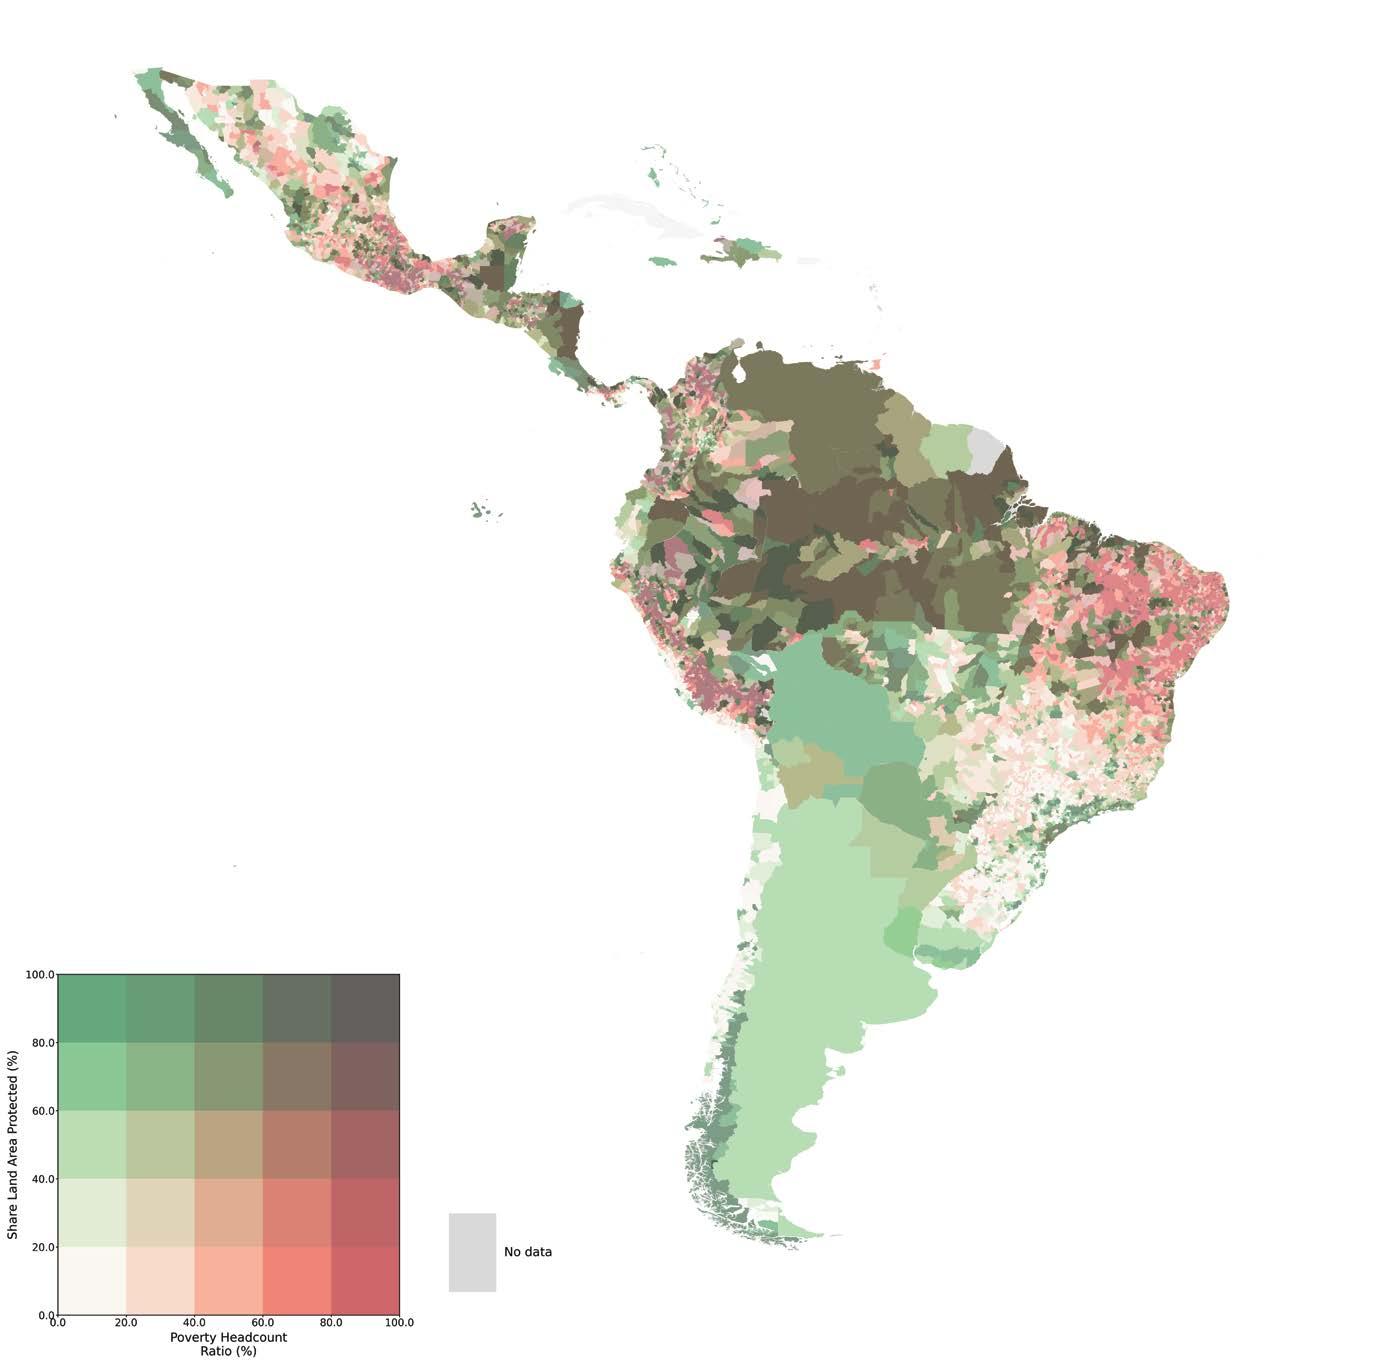
Note: LAC = Latin America and the Caribbean.
by 14 percentage points—seven times the global average. Latin America has suffered the highest biodiversity loss in 50 years (WWF 2022). In 2022 alone, 10.2 million acres of primary forest were lost, with Brazil accounting for more than 40 percent of the destruction. Limited funding is a major issue; current budgets cover just 54 percent of basic financial needs (Bovarnick, Alpizar, and Schnell 2010). Connectivity is another challenge—only 9 of 51 countries have their protected areas well linked, which further weakens ecosystem protection (IUCN 2021).
Indigenous land rights and forest management play a key role in reducing deforestation and promoting inclusion, although legal titling alone has mixed impacts. In Latin America, Indigenous-managed lands consistently show lower deforestation—often matching or outperforming other protected areas (Blackman et al. 2017; Blackman and Veit 2018; Busch and Ferretti-Gallon 2023; Holland et al. 2014; Schleicher et al. 2017; Vergara-Asenjo and Potvin 2014). Studies across Bolivia, Brazil, Colombia, Ecuador, Panama, and Peru back this up (Busch and Ferretti-Gallon 2023). Indigenous peoples occupy 35 percent of the region’s forests. In places like the Dry Chaco (Camino et al. 2023) and Ecuador (Tanner and Ratzke 2022), land titling with nongovernmental organization support has driven real forest gains. Studies on forest property rights across 24 countries report positive or mixed results, although much of the evidence is still observational (Miller et al. 2021).
Climate-smart agriculture (CSA) is gaining recognition for its role in reducing deforestation while boosting agricultural productivity and resilience. Practices such as agroforestry (growing trees alongside crops, a land management approach that improves soil health, boosts yields, and provides habitats for wildlife), conservation farming, and better crop varieties promote sustainable land use and carbon storage (Zheng, Ma, and He 2024). Agroforestry in particular helps increase production, build resilience, and fight climate change. CSA also supports soil health and water management, easing pressure on forests (Williams and Green 2023; Zheng, Ma, and He 2024).
CSA and land improvements show potential to cut deforestation and ease poverty, although the evidence on poverty impacts is still emerging. These methods can raise productivity and farmers’ incomes. A review of 19 CGIAR case studies, including examples in Colombia, Costa Rica, Mexico, and Nicaragua, found mixed to positive effects on malnutrition, productivity, and fertilizer use, lowering costs and boosting profits (Dinesh et al. 2015).
Argentina offers a striking example of large-scale adoption of regenerative agriculture. Faced with severe soil erosion, the country promoted no-till practices to reform its agricultural sector. Although initial experiments began in the early 1970s, widespread adoption only took off in the 1990s. By 2011, no-till farming covered more than 23 million hectares—around 79 percent of
Argentina’s grain-cropped land, up from just a few hundred thousand hectares in 1990. A key driver of this transformation was the active role of farmers associations, motivated by the promise of higher yields, increased profits, and effective erosion control (Peiretti and Dumanski 2014).
Sometimes local people chop down trees for charcoal and clear space for subsistence farming to make a living. A cheap and easy way to slow down the pace of deforestation is to pay landowners small sums not to cut down their trees or restore them or to finance the adoption of more efficient technologies. The idea of paying people in poorer countries to protect their forests has long attracted interest from those concerned about climate change, but mainly for reducing emissions from deforestation and forest degradation.
Payment for ecosystem services (PES) programs have a long history in Latin America and are key tools for enhancing ecosystem services. Globally, at least 550 PES programs handled $36–$42 billion in annual transactions as of 2018 (Salzman et al. 2018). Latin America had at least 57 PES programs focused on water, but the actual number is likely much higher. A previous study found 40 PES schemes evenly split between water and other sectors, suggesting broader coverage (Grima et al. 2016). Although carbon credits get most of the attention, other PES models can help promote sustainable land use and CSA by addressing gaps left by other measures.
PES programs can help reduce deforestation, especially when well targeted, but challenges such as additionality and permanence remain. A review of 19 studies across eight Latin American countries found PES impacts similar to protected areas (Börner et al. 2020; Wunder et al. 2020). In Brazil, Bolsa Verde cut deforestation by encouraging locals to report illegal clearing (Wong et al. 2022). In Mexico, payments reduced loss of tree cover and led to more patrolling, fire breaks, pest control, and soil conservation (Alix-Garcia, Sims, and Yañez-Pagans 2015). Recent evaluations of PES programs outside LAC also show promising results (Jayachandran et al. 2017). Still, issues like poor targeting—such as many deforestation PES systems not being targeted at high-deforestation-risk locations; weak enforcement; and self-selection, in which people take money to protect their own land but then cut down trees elsewhere (Badgley et al. 2022; Coffield et al. 2022; Jack and Jayachandran 2019)—limit effectiveness. Longterm impact on conservation, restoration, or afforestation also depends on sustained payments because landowners may game the system over longer periods of time.
PES programs can help reduce poverty, although the benefits are usually modest (Ola et al. 2019; Pagiola, Arcenas, and Platais 2005). Balancing environmental goals with poverty reduction is tricky—focusing too much on one can limit the other. Because most programs mix compensation payments for conservation with pure transfer to improve welfare, their impact depends
on costs, design, and who gets them. When tailored to local needs, well funded, and closely monitored, PES can deliver win-win results. They are especially effective when opportunity costs are low and environmental gains are high. In Uganda, PES showed modest pro-poor effects, and in Mexico, it did not worsen poverty and slightly improved assets, education, and local conditions (Gauvin et al. 2010; Jayachandran 2023).
So, what does all the discussion on preventive efforts against the impacts of climate hazards mean? Acting fast—within the first 24–48 hours—can save lives. Early warnings give people time to escape, and longer lead times help protect property. Today’s technology can provide that lead time, and despite the costs, forecasts bring even bigger benefits. Still, many countries underfund forecasting and have weak warning systems. Critical infrastructure that can withstand climate hazards also helps, but prevention efforts often fall short— not necessarily from lack of spending but from poor allocation. True prevention needs smart coordination across all levels of government and society. Even with tools such as warning systems, flood barriers, or natural assets like forests, the poorest people may still be left vulnerable; this is where insurance steps in as the next layer of protection. The next section dives deeper into this issue.
We noted before that people and governments (who cannot or may not choose to shoulder the costs of adopting risk reduction measures) should not rely only on preventive measures to eliminate climate risks—nor do they. Sometimes weather forecasts fail. Floodproofing sparsely populated areas may not be costeffective. People underinvest in protecting their housing when they lack formal land titles. Insufficient information on hazard exposure keeps households close to hazard-prone areas. Mayors underserve slums through poor-quality services.
Both individuals and governments can buy insurance to cover property or crop damage in exchange for regular premiums. By pooling risks, overall losses become more predictable, letting people protect themselves from financial shocks. Although insurance does not reduce total losses, it improves overall well-being by preventing catastrophic personal setbacks. Because premiums often exceed expected losses, those who do not make claims help cover the costs for those who do.
By offering a payout when an insured loss occurs, market insurance compensates losses and avoids other costly ways of coping. Furthermore, when support is guaranteed, people can take opportunities to escape poverty that would be too risky to undertake without additional protection. So insurance measures are designed for and executed after climate hazards strike but can also improve prevention.
Not all risks can be insured, and not everyone chooses commercial insurance. For frequent but low-cost events, people often rely on self-insurance because verifying claims can be expensive and thus formal insurance requires paying higher premiums. Commercial insurance works better for rare but severe hazards, although premiums are often high because of climate uncertainty and the risk of mass payouts. Insurers add a “catastrophic load” to stay solvent, and issues such as adverse selection and moral hazard drive costs up, especially in remote farming areas. As a result, many farmers in Latin America cannot afford traditional or multiperil insurance, limiting its use.
Index insurance is a form of insurance that cuts costs and speeds up payouts by linking claims to measurable events—such as rainfall or wind speed—rather than actual losses. This lowers fraud risk and monitoring costs, reducing premiums. It is commonly used for crops facing drought or excess rain, whereas other triggers, such as wind speed, are linked to payments to protect property and assets. Because these parameters are objective and highly correlated with losses, payouts are swift and automatic, are predictable, and can be based on a previously agreed-on and publicly available formula, with no formal claims needed.
Parametric insurance can cover farmers or small businesses directly, but the focus here is on governments. By pooling risks across populations, governments can use index insurance to protect budgets when revenues drop and welfare costs spike. Unlike emergency funds or appeals—which are prone to political disputes and often to delayed disbursements during crises—index insurance provides fast, predictable payouts after climate hazards hit, speeding up relief and recovery. Unlike microinsurance, macro-level coverage uses regional weather indices, making it more efficient, easier to manage, and less prone to basis risk (Kramer et al. 2022).
Governments in LAC have used index insurance in two main ways. First, they pool climate risks across the population and then buy catastrophe bonds (CAT bonds) or weather derivatives, shifting extreme risk to regional or international markets. These instruments can provide automatic triggered payouts to support relief efforts. Second, once a government secures macroinsurance, it can offer contracts to individuals, helping them manage risks in advance and rely less on climate hazard recovery assistance.
The jury is still out on the impact of parametric insurance on welfare because the evidence is by no means complete at this point. However, a handful of studies have analyzed the penetration and impacts of index insurance. Such evidence begs a review to highlight emerging lessons and consensus (if any) and to point to the gaps in knowledge. The next section summarizes and reviews existing literature on these aspects of parametric insurance in the region.
Has index insurance in LAC delivered or lived up to its promise?
Index insurance has expanded in LAC but still has low uptake among individuals.8 A global survey found that the region accounts for just 0.4 percent of all policyholders, although the value of its policies is relatively high. Most programs are index based, with about half using area yield indexes. Drought and flood are the most commonly insured risks. With a median program age of 11 years—the highest among developing regions—many initiatives are well established. Around 80 percent receive government or donor subsidies (Hazell, Jaeger, and Hausberger 2021).
Macro-level weather index insurance has gained more traction in LAC, helping countries boost climate resilience for poor individuals. Nations such as Colombia, Mexico, and Peru have used it to quickly inject cash into emergency funds. A standout example is Mexico’s Fondo de Desastres Naturales (FONDEN), launched in the late 1990s, which relies on parametric insurance, specifically through CAT bonds and parametric reinsurance schemes. These mechanisms provide financial protection for FONDEN against losses from earthquakes and hurricanes by triggering payouts based on predefined thresholds rather than actual damage. It allows for preapproved action plans, including making money available in advance of a hurricane and immediate funding for relief and reconstruction. By law, the fund receives 0.4 percent of the federal budget annually (with unspent funds rolling over). FONDEN was once seen as one of the world’s most advanced disaster financing tools, thanks to its clear rules and dedicated bureaucracy.
A background paper for this report by del Valle et al. (2025) analyzes how FONDEN affected household living standards in urban areas hit by excessive rainfall. Using spatially granular measures of household living standards and a natural discontinuity in FONDEN’s eligibility rules, they find that eligible municipalities (those to the right of the dotted line in figure 3.9), compared with those just below the threshold, saw improved living standards in the year in which the climate hazard occurs—because those municipalities could start relief and reconstruction immediately afterward (refer to figure 3.9). The gains were especially notable in poorer municipalities.
Although these effects faded after one to two years, del Valle et al. (2025) suggest that impacts on human capital might last longer. FONDEN was one of the few programs globally with proven accomplishments protecting poor individuals. However, the institutional landscape for disaster financing in Mexico has evolved, including changes to FONDEN and CADENA (the Mexican Catastrophe Climate Contingency Insurance Program), although other forms of index insurance funding remain in place.9
Another way in which indexed instruments have helped finance disaster assistance in the region is through sovereign risk pools. For example, the Caribbean Catastrophe Risk Insurance Facility (CCRIF), established in 2007, pools risk using parametric policies (refer to box 3.2).
FIGURE 3.9
Mean municipal change in household living standards (HLS) of FONDEN beneficiary municipalities a year after being affected by excessive rainfall
Change in HLS
Rainfall minus threshold (mm)
Source: del Valle et al. 2025.
Note: HLS is an urban index built from microdata samples from Mexico’s 2000, 2010, and 2020 censuses to measure living standards computed through the first principal component of the following asset variables: household infrastructure, building materials, and ownership of durable assets. Loadings (scoring factors) provide maximum discrimination between households, that is, assets that vary the most across households and, over time, receive the largest loadings. FONDEN = Fondo de Desastres Naturales; HLS = household living standard; MM = millimeters.
Since 2007, Caribbean and (increasingly) Central American countries have been able to purchase insurance from the Caribbean Catastrophe Risk Insurance Facility (CCRIF) to cover risks from hurricanes, earthquakes, and heavy rains (even droughts have been considered). CCRIF is a regional risk pool owned by Caribbean and Central American governments, funded by a multidonor trust fund and membership fees of its 19 Caribbean and four Central American partners. It is designed to mitigate financial impact by quickly providing short-term liquidity to governments when a policy is triggered after a climate hazard occurs. As the world’s first
regional fund using parametric insurance, CCRIF has revolutionized how governments handle climate risk, offering affordable coverage by pooling regional risks. Similar pools exist in the Pacific (the Pacific Catastrophe Risk Insurance Company) and in Africa (the African Risk Capacity) since 2014. Of the three country pools, CCRIF has the longest experience and has delivered more than $200 million in payouts.
In July 2024, CCRIF disbursed $6.4 million to Guatemala after heavy rains caused damage. Similarly, in October 2023, CCRIF provided $3.4 million to Antigua and Barbuda and the British Virgin Islands after Tropical Storm
Philippe. However, not all climate hazards trigger payouts; for example, Hurricane Dean (2007) caused damage in Jamaica, but the payout was not triggered because wind speed was the key parameter. Similarly, the cumulative effect of the 2008 hurricanes in Haiti was devastating, but the winds were not strong enough to trigger a payout.
In response to member concerns over such gaps or basis risk, CCRIF has adjusted its triggers and added a secondary payout if losses are significant but do not meet the full trigger threshold (Kramer et al. 2022; Martinez-Diaz, Sidner, and McClamrock 2019).
Ensuring resources flow quickly into state coffers after a hurricane is key, but it does not necessarily help victims directly. To truly protect poor individuals, there should be clear rules to direct the payouts to assist the affected communities, and strong safety nets should be in place before climate hazards hit with strong technical and administrative capacities on the ground. Without these, support can be delayed. The next section on coping explores whether social protection systems in the region are suited to this purpose and whether index insurance could strengthen them.
Poor people benefit when clear, previously agreed-on rules guide insurance payouts for relief following climate hazards. Mexico’s CADENA program lets states buy weather insurance to protect poor farmers. Instead of covering individuals, states pay premiums and get payouts based on triggers such as rainfall deficit, then distribute funds. According to program rules, states must preregister small farmers (those with less than 20 hectares or 60 livestock units) who are deemed eligible, and this has helped CADENA reduce poverty; an analysis from 2003 to 2010 found that it lifted 100,000 farmers out of moderate poverty each year.10 Other works on CADENA suggest that payouts encouraged more planting and higher spending, both plausible drivers of the poverty reduction observed (de Janvry, Ramirez Ritchie, and Sadoulet 2016; Fuchs and Wolff 2011; Fuchs Tarlovsky and Wolff 2016). However, beneficiary surveys also show that 38 percent of beneficiaries faced six- to nine-month delays in their payouts, and only a third of eligible farmers know about CADENA. Mobile banking to send payouts to beneficiaries upon index triggers and boosting awareness could further increase impact.11 Although not definitive, de Janvry, Ramirez Ritchie, and Sadoulet (2016) suggest that the income benefits of CADENA likely exceed its costs.
Another way to fund response to climate hazards is through donors buying indexed insurance directly. This was first tested in 2006 by the World Food Programme (WFP) and AXA (a global insurance and asset management group), using drought-triggered payouts to support Ethiopia’s safety net program. Equally promising is combining macro-level index insurance with letting
people purchase micro-level top-ups. Governments can buy broad coverage to handle fixed costs, which helps private firms offer individual microinsurance— sometimes backed by subsidies. This setup helps with targeting and lets people tailor support to their own needs. In other words, the government still guarantees basic protection, but households can boost their coverage based on what they own and need. In Nicaragua, the WFP is working on this kind of blended approach (refer to box 3.3).
Index insurance is not just for farming; it can also protect shared natural resources. A pilot project initiated by a Central American nongovernmental organization, the Mesoamerican Reef Fund, backed by German development bank KfW and the Nature Conservancy, partnered with Swiss Re to insure part of a coral reef in Mexico against hurricane damage. When a storm hit in 2020, the insurance paid out to Quintana Roo, funding quick coral reseeding and reef restoration (Einhorn and Flavelle 2020). It also created jobs for locals who rely on the reef for their income (Mesoamerican Reef Fund 2025).
Not enough is known about how index insurance affects people’s well-being after climate hazards hit; more research is needed. That said, early studies (including some work for this report) suggest that large-scale insurance can be both cost-effective and meaningful. Still, even in countries like Mexico, with a
Nicaragua’s experience with a hybrid insurance approach
Launched by the World Food Programme (WFP) in 2020, Nicaragua’s Climate Risk Insurance program combines national-level sovereign insurance with local microinsurance to protect against climate shocks such as droughts, floods, and hurricanes. This two-tier approach creates a safety net that covers both big shocks and smaller, everyday risks—helping people recover faster and build long-term resilience.
At the national level, the government works with the Caribbean Catastrophe Risk Insurance Facility to insure against major events like hurricanes and earthquakes. In 2022, WFP added $70,000 to Nicaragua’s policy, unlocking up to $2 million in potential payouts. That same year, WFP also piloted microinsurance for farmers,
covering more frequent, small-scale losses. The program insured 432 people that year and is shifting from traditional claims processes to quicker parametric payouts without waiting for government aid.
Both levels of insurance paid out in 2022. After Hurricane Julia, a $640,000 payout helped expand school meals for nearly 300,000 children, and direct household payouts protected livelihoods. Earlier, during Hurricane Iota in 2021, a pilot showed how fast microinsurance can support farmers. By layering these tools, Nicaragua is building a smarter safety net—and WFP is now backing similar efforts in Belize, Dominica, and St. Lucia, although these have yet to trigger.
long tradition of index insurance schemes, the institutional landscape for climate risk financing has evolved, including changes to long-standing successful programs such as FONDEN and CADENA. So why are these kinds of index insurance models not more common across the region? The next section and chapter 4 dive into that.
There are a few plausible reasons why index insurance is not widely used by governments in LAC. Politicians rarely get credit for ensuring the availability of funds for disasters that might never happen—voters prefer visible, shortterm wins. Index insurance is not cheap, either. It is complex to design and relies on data that reinsurers may not fully trust. It can even fail to pay out after real losses, eroding trust among both insurers and those affected. Better weather data and choosing parameters with care can help, but not all risks are insurable. In some cases, setting aside reserve funds or borrowing (via contingent loans) is more practical and quicker and better suited to deal with frequent, lower-cost climate hazards. Contingent credit, in particular, does not require preallocated funds and provides medium to large payouts as budget support after a crisis, making it a solid option to deal with risks of medium frequency and severity.
But borrowing is not always easy, especially for small or heavily indebted countries. So, in countries like many in the Caribbean, with few financing options but high exposure to and big budget impacts from climate risks, index insurance remains a good option. And contingent credit does not always directly reach affected communities. It is a good fit for moderate, midfrequency risks. Reserve funds are useful but hard to build and often get repurposed, for instance to partially free up cash during the COVID-19 pandemic.
Underpinning this discussion lies the concept of risk layering in climate risk financing, which is basically about splitting potential costs into layers, based on how big and how likely the losses are, then matching each layer with the most cost-effective way to cover it. This is a useful concept to understand how governments can approach their decisions when it comes to meeting financial needs when climate hazards materialize. The small, frequent losses sit at the bottom and are usually handled with cheaper tools such as reserve funds or budget reallocations. The middle layer covers less frequent but more expensive events, often using insurance or contingent credit. At the top are the rare, catastrophic losses, which are so huge that high-powered tools such as CAT bonds or international aid are needed. The point is to avoid overspending on insurance for everyday events while still having the financial firepower for the really big climate hazard events.
A review of 14 LAC countries looked at climate risk financing tools, splitting them into risk retention (such as budget shifts, credit lines, and disaster funds such as FONDEN) and risk transfer (such as traditional insurance, CCRIF, or
CAT bonds). Across the region, there are 44 retention tools and 21 transfer tools (refer to table 3.3). Most countries lean on disaster funds or contingent credit, and fewer use budget reallocations. Traditional insurance is the most common transfer option (used in 10 cases), but parametric insurance and CAT bonds are still rare. Only Jamaica, Mexico, and Panama use a balanced, layered approach. Altogether, the region manages $11.1 billion in risk-related resources—$4.3 billion from credit lines, $2.8 billion from disaster funds, $2 billion from CAT funds, and $1.9 billion each from budget allocations and parametric insurance (Cárdenas and Elizondo 2025).
Regardless of what disaster risk financing tools are in place, scaling up social protection to address climate shocks creates a financial burden for governments. As the next section shows, a World Bank (2023) assessment of the adaptiveness of social protection systems in the region found that disaster response financing is the weakest link in most countries’ capacity.
In sum, countries can purchase insurance to prepare for unexpected climate hazards. Mexico cannot predict exactly when a hurricane will hit, but it knows they will keep coming—and it can use public funds to insure against things such as heavy rainfall that damages infrastructure. Insurance helps people and governments trade for different “states of nature,” but no contract can cover everything, and insurance markets do not always develop, nor do governments always insure to protect themselves and their populations.
What cannot be prevented or insured against must be borne. When that happens, the burden falls on households. It is not enough to predict a drought; if there is no support, low-income families are left relying on friends and relatives. But when hazards hit entire communities, those networks break down, forcing families to sell assets or pull kids from school just to cope. The next section looks at how governments can step in with safety nets to manage these risks more effectively.
Public safety nets are vital for shielding the most vulnerable from climate hazards. Well-designed food and cash transfer programs can be a critical last line of defense. But if safety nets—or insurance—do not respond quickly, families risk losing hard-won gains on welfare. As chapter 2 showed, climate hazards that materialize can have deep, long-lasting, even generational impacts. The next sections look at how governments can use their social protection systems to help families cope better.
Source: Cárdenas and Elizondo 2025.
LAC has some of the strongest social protection systems in the developing world. More than 75 percent of the poorest people receive benefits—mostly through cash transfers—which can make up a third of their household spending. Conditional cash transfers (CCTs), in particular, were pioneered in the region—Mexico started the Programa de Educacion, Salud y Alimentacion (PROGRESA) back in 1997—and have helped reduce poverty and build human capital. From 1998 to 2014, social protection programs cut poverty by nearly 30 percent, and 18 countries still run active CCTs today (World Bank 2023), reaching around 105 million people in 2019 (Stampini et al. 2021).
The success of CCTs in reducing poverty—thanks to wide coverage and decent payouts—has pushed many countries to use their social protection systems as tools for handling climate hazard events. These programs do not just provide a safety net; they also help families stay stable, save, and even invest. With predictable cash, people can take more productive risks and build assets that cushion them if climate hazards hit, avoiding desperate moves such as pulling kids out of school.
Overall, the results are positive. In Mexico, the PROGRESA-Oportunidades program helped kids stay in school during tough times (de Janvry et al. 2006) and reduced the impact of bad weather on education and caloric intake (Adhvaryu et al. 2024; Hou 2010). In Nicaragua, when CCTs were paired with job training or investment support, families were better able to ride out weather-related hazards by diversifying their income (Macours, Premand, and Vakis 2022). Outside Latin America, studies in Ethiopia, Niger, and Zambia also saw that unconditional transfers improved food security and decreased harmful coping strategies during droughts (Asfaw et al. 2017; Knippenberg and Hoddinott 2019). Most solid studies show that higher household incomes from CCTs help cushion the blow of materialized climate hazards, although there are exceptions, such as Colombia (Arena, Guasti, and Hussein 2023), where CCTs did not make much of a dent in climate vulnerability.
Still, climate risks are a tough match for traditional CCTs. These programs were not designed with climate in mind—they are mainly aimed at poor households, not at vulnerable households who are not poor. Standard incomebased eligibility often misses people who are not poor now but could easily fall into poverty in the aftermath of a climate hazard. de la Fuente and Serio (2025) estimate that about 184 million people are vulnerable to poverty. Some are already poor, but many hover just above the line—earning more than $6.85/day (2017 purchasing power parity) but less than twice that (refer to figure 3.10). Even for poor households, using CCTs to invest in long-term resilience is not always realistic. The cash might be unpredictable or too small to make a real difference.
FIGURE 3.10
2.0e+04
1.5e+04
Predicted log per capita income Vulnerable poverty induced Vulnerable risk induced Nonvulnerable
Source: de la Fuente and Serio 2025.
Note: Estimations derived from the model, which considers only the variability of the disturbances in the income process. Red vertical line = poverty line; blue line = 1.5 times the poverty line. Frequency scale is used instead of probability density. The y-axis represents the observation count (frequency). The height of each bar indicates the number of observations at each log-income level (for example, the peak represents approximately 20,000 observations).
Even with expanded coverage, there are big gaps. De la Fuente and Serio (2025) found that in countries such as Honduras, and Panama—where climate-related poverty risk is high—fewer than 40 percent of vulnerable people are covered by cash transfer programs (refer to figure 3.11). On top of that, when climate hazards hit, quick and flexible responses are required, but many safety nets still lack digital payment systems and up-to-date social registries, making it hard to reach new people fast.
Countries have started to adapt cash transfer programs to cope with climate hazards. During recent climate events and COVID-19, many scaled up support by increasing payments or expanding coverage. Ecuador used cash vouchers after the 2016 quake, and El Salvador, Mexico, and Peru have adapted existing social protection programs to include climate-hazard-hit families. Dominica did the same in 2017 (Beazley, Solórzano, and Barca 2019).
In 2021–23, the World Bank reviewed how well social protection systems in 18 LAC countries adapt to realized climate hazards (Tisei and Ed 2024). The focus was on how these systems help poor victims and nonpoor vulnerable households prepare for, cope with, and adapt to shocks. The assessment looked at four key areas: (1) scalable programs and delivery systems to assist those in need, (2) clear roles between social protection and disaster risk agencies, (3) strong data and information systems (including early warnings and shockresponsive indicators), and (4) financing (which includes contingency or reserve funds, contingent credit, and market-based risk transfer solutions) backed by technical know-how and solid legal and institutional frameworks. Countries were rated as latent, nascent, emerging, established, or advanced in each area.
FIGURE 3.11
Percentage of vulnerable households with social assistance
Percent
CRI vulnerable with social assistance
Total vulnerable with social assistance
Source: de la Fuente and Serio 2025.
Note: Estimations derived from the model that considers only the variability of the disturbances in the income process. CRI = climate risk induced.
Overall, countries in the region whose systems were qualified as established are Argentina, Brazil, Chile, the Dominican Republic, and Uruguay. Countries that are lagging and whose efforts were deemed nascent are Belize, Honduras, and Paraguay (refer to table 3.4).
The review showed that although LAC countries are strongest in program design and delivery—thanks to well-established social protection systems— other areas still need work (refer to box 3.4). Digital payments have advanced but do not yet reach enough people for a fast response. Many LAC countries need to step up investments in EWSs, not just to improve monitoring and alerts but also to connect them with national social protection programs. Right now, coordination between climate risk and social protection agencies is weak, and data systems, although somewhat flexible, are not fully ready to handle materialized climate hazards. Only a few countries, such as Chile and the Dominican Republic (with the Ficha Básica de Emergencia), have tools specifically for emergency targeting, and Colombia’s Familias en Acción can
adjust its targeting protocols in response to manifested hazards (Beazley, Solórzano, and Barca 2019). Financing to respond to climate hazards is the major gap—only Argentina and Peru have in place emergency-linked funding for climate hazards. Mexico’s FONDEN and the CCRIF exist, but they are not directly tied to social programs. A few countries, such as the Dominican Republic and Peru, have started allocating dedicated budget lines for emergencies in their safety nets, but most still have a long way to go (refer to Box 3.4).
TABLE 3.4 Number of countries within each level of adaptiveness by building block
Source: Original table for this publication based on Tisei and Ed 2024.
Note: Countries included are Argentina, Belize, Brazil, Chile, Colombia, Costa Rica, Dominican Republic, Ecuador, Honduras, Mexico, Panama, Paraguay, Peru, and Uruguay.
3.4
There is broad agreement on the value of having prearranged funding—whether through insurance or credit—and that things such as rainfall or wind speed can trigger resources. But having money ready does not always mean there are rules and systems in place to quickly get it to those who need it most. Many disaster financing tools, such as Fondo de Desastres Naturales (FONDEN) or CADENA, lack clear rules or legal mandates to prioritize vulnerable groups. Some countries stand out: Colombia’s disaster fund uses poverty and inequality to guide spending, Peru’s Fondo Para Intervenciones ante la
Ocurrencia de Desastres Naturales gives higher priority to areas with high poverty rates, and FONDEN focuses on infrastructure and housing in areas of multidimensional poverty. A background study for this report (Cárdenas and Elizondo 2025) reviewed the legal frameworks of the climate risk financing instruments that exist in Latin America and the Caribbean and found that 12 explicitly direct resources to poor individuals, and seven more do so indirectly by allowing the tools to cover the needs of those groups or social sectors after the occurrence of climate hazards (refer to table 3.4.1).
Box 3.4 Few climate risk financing mechanisms are catered to poor individuals (continued)
TABLE 3.4.1 Protection of poor individuals mentioned in laws and regulations by type of climate risk financing instrument in LAC circa 2020–24
Source: Cárdenas and Elizondo 2025.
Note: The financial instruments used for disaster relief by the governments studied were analyzed to identify those that explicitly or implicitly support assistance to poor individuals. For instruments classified as explicit (E), specific references are detailed by country and instrument. Instruments classified as implicit (I) are based on interpretations of disaster relief laws and regulations that mention support for poor individuals, implying that budgets and resource reallocations should account for this purpose. LAC= Latin America and the Caribbean.
Established social protection systems build resilience and speed recovery from realized climate hazards
A background paper for this report (Sugastti and Carter 2025) uses the World Bank’s (2023) classification of social protection systems in LAC—classifying countries as having nascent, emerging, or established social protection—to see how well they handle climate hazards. Using data from the Emergency Events Database and World Development Indicators for 1981–2023, the study looks at how countries with different levels of social protection manage the impact of similar materialized climate hazards (whose intensity is proxied by the rate of people affected by them) on the poverty gap.12
Stronger social protection systems help countries resist better and bounce back faster from climate hazards once they occur. In countries with nascent social protection systems, poverty spikes sharply after they get hit by climate hazards, peaking four to five years after the event and staying high even a decade later. Countries with emerging systems do better: Poverty still rises, but the increase is smaller, peaking around year two, and recovery is steadier.
Countries with established systems—such as those in Argentina, Brazil, Chile, the Dominican Republic, and Uruguay—handle climate hazards best. Thanks to strong post-climate-hazard support, they prevent poverty from rising at all, even 10 years out. In short, the stronger the system, the better the country weathers the storm—in terms of both impacts on the poverty gap and recovery speed (refer to figure 3.12).
Source: Sugastti and Carter 2025.
Note: Impulse response functions are calculated using 1981–2023 data from the Emergency Events Database and the World Bank’s World Development Indicators.
Countries with nascent social protection systems include Belize, Honduras, and Paraguay. Countries with emerging social protection systems include Colombia, Costa Rica, Ecuador, Mexico, Panama, and Peru. Countries with established social protection systems include Argentina, Brazil, Chile, Dominican Republic, and Uruguay.
Many countries still struggle to move from reactive, ad hoc support after climate hazards occur to a more proactive, risk-informed approach (Tisei and Ed 2024). A good social protection system does not just prevent increases in poverty, it also helps people recover faster. This is because when families do not have to sell off their assets just to get by, they can bounce back more quickly after a climate hazard takes place. So, making social protection more responsive to climate shocks can boost its impact and reduce long-term damage. The next section dives into one way to do this.
Food aid and emergency cash help meet immediate needs, but they should also reduce future climate risk. Cash transfers are key, but long-term solutions matter, too. Social protection should not just stabilize incomes—it should help people escape poverty. Programs that support investment, such as insurance or asset building, lower vulnerability and promote growth (Janzen, Carter, and Ikegami 2021). Beyond protection, social programs should encourage investment; when people feel secure, they take calculated risks that improve their long-term prospects. So instead of just offering a temporary fix, smart social protection can break the poverty cycle and build real resilience.
Asset-building programs are gaining ground in Latin America’s social protection scene, offering better long-term benefits than traditional CCTs, which mostly pay off later in life. Although CCTs such as Mexico’s Prospera and Brazil’s Bolsa Família still lead the way, they mainly nudge investments in education and health. Newer options—like livelihood grants and lumpsum transfers—boost income stability and help people build assets to support upward mobility.
Paraguay pairs its CCT program, Tekoporã, with Tenonderã, which helps people build sustainable livelihoods after the cash support ends (refer to box 3.5). Peru does something similar: Haku Wiñay and Noa Jayatai complement the Juntos CCT program to boost self-sufficiency, although Peru leans more toward rural development, whereas Tenonderã focuses on broader economic inclusion. Honduras also links its CCT program, Bono Vida Mejor, with asset-building support. According to the World Bank’s Atlas of Social Protection Indicators of Resilience and Equity, these are some of the few government-led programs in the region using a structured graduation model. Others are less formal—Colombia’s Familias en Acción connects to Red Unidos, which offers limited economic inclusion support but lacks an asset-building component. Brazil’s Progredir is only loosely tied to Bolsa Família and does not include asset-building transfers. Bolivia and Ecuador also run CCTs without strong graduation pathways.
Box 3.5
Paraguay’s conditional cash transfer program, Tekoporã, and its asset-building graduation program, Tenonderã
Tekoporã is Paraguay’s main conditional cash transfer program, which had supported more than 186,000 poor and near-poor households by 2024. Launched in 2005, it provides financial aid to families with school-age kids, pregnant women, people with disabilities, and Indigenous peoples on the condition that they keep up with school and health checkups. The goal is to boost education and health care access while reducing poverty, with support lasting up to six years.
To build on that, Tenonderã was rolled out in 2014 as an asset-building program to complement
Source: Sugastti and Carter 2025.
Tekoporã. Based on BRAC’s graduation model—a sequenced approach that combines consumption support, asset transfers, and skills training to help ultra-poor households achieve sustainable livelihoods—it offers seed capital and business training to Tekoporã beneficiaries who have been in the program for at least three years to become financially independent through farming, microbusinesses, or small-scale trade. By 2024, it is expected to serve 16,500 households. Together, the two programs form a bridge from short-term support to lasting self-sufficiency.
This chapter has thus far described and analyzed key instruments and policies to manage climate risks, stressing the need for both prevention and response— because although risk can be reduced, most times it cannot be fully eliminated. These strategies should happen together, not one after the other. Preventing risk before it materializes is usually cheaper and doable, even for poorer nations. Governments can help by offering forecasts and early warnings so people can evacuate in time and stay safe. Protecting ecosystems and forests— often home to poor communities—can also boost both adaptation and climate mitigation. In LAC, many countries have incubated innovative index insurance and climate risk financing mechanisms. Strong social protection systems can soften the impact of climate hazards.
Governments and households respond to climate hazards with a mix of prevention and reaction, but the level of investment and readiness varies widely across countries. Table 3.5 gives a diagnostic snapshot, combining each country’s climate risk profile with the strength of its adaptation systems. On the risk side, the table captures three dimensions: exposure (the share of poor people exposed to climate hazards). vulnerability (the likelihood of falling into poverty after climate hazards occur), and overall climate risk impact (based on the Global Climate Risk Index, where a lower index score indicates greater historical losses). On the systems side, five adaptation policy instruments are assessed: EWSs, protected areas, financial tools for climate risk retention and risk transfer, critical infrastructure, and adaptive safety nets.
TABLE 3.5 LAC regional overview of climate exposure, vulnerability, climate risk impact, and adaptation: A traffic light system assessment
SYSTEMS
COUNTRY
Argentina
Bahamas
Barbados
Belize
Bolivia
Brazil
Chile
Colombia
Costa Rica
Dominican
Republic
Ecuador
El Salvador
Guatemala
Guyana
Haiti
Honduras
Jamaica
Mexico
Nicaragua
Panama
Paraguay
Peru
Puerto Rico
St. Lucia
Suriname
Trinidad and Tobago
Uruguay
Venezuela, RB
EXPOSURE (% EXPOSED AND POOR)
VULNERABILITY
(% AT RISK OF POVERTY DUE TO CLIMATE)
ADAPTIVE SAFETY NET
Source: Original calculations based on each dimension discussed in the chapter.
Note: Each cell in the table reflects a three-tier ordinal score (1 = low, 2 = medium, 3 = high). For the risk indicators—exposure, vulnerability, and climate risk impact—green indicates low risk, yellow indicates moderate risk, and red indicates high risk. For the adaptation systems, green signals strong performance or system readiness, yellow indicates moderate development, and red reflects weak or underdeveloped systems. Scores are assigned using a consistent methodology. For example, EWSs are scored from 1 to 3 on the basis of global classifications, from less than basic to advanced; adaptive safety nets are rated from nascent to established; and risk retention and transfer are based on the number of financial instruments in place. Other indicators, such as protected areas, critical infrastructure systems, exposure, vulnerability, and climate risk impact, are grouped into terciles based on their distribution across countries in the sample. Gray cells represent missing or unavailable data. EWS = early warning systems; LAC = Latin America and the Caribbean.
Instead of assigning countries into rigid typologies, this framework enables country-specific assessments of risk and system readiness, showing where populations are most exposed and where systems fall short. Each row in the table reflects a layered analysis of exposure, vulnerability, and system strength. This visual tool is not intended to rank countries but rather to provide a snapshot to guide tailored strategies, helping countries determine the right combination of prevention, insurance, and postdisaster support on the basis of their risk profile. For instance, Costa Rica scores low on exposure and climate risk impact while maintaining strong systems—particularly in early warning and financial tools—pointing to a balanced approach. Honduras, by contrast, faces high exposure and vulnerability alongside weak safety nets, critical infrastructure, and financial instruments, underscoring the need to strengthen several fronts simultaneously.
Ultimately, countries benefit the most from layered, well-coordinated adaptation systems that can flexibly respond to different climate hazards while protecting those who are most vulnerable. The traffic light scoring system is a practical tool to guide national planning, set investment priorities, and build resilience in ways tailored to each country’s specific challenges and capacities.
We do not always know how much countries invest in risk reduction, but we do observe that some efforts—such as EWSs—fall short. Strong social protection systems can soften the impact of climate hazards as they occur, but they are not generalized in these countries; many lack climate risk financing and clear plans for directing support to social sectors. An ounce of prevention is worth a pound of cure; preventive measures save lives and cost less than cleaning up after climate hazards strike, but many governments still underinvest, and people often ignore warnings. Safe housing, land titles, public services, and critical infrastructure help communities prepare, but people stay in risky areas for jobs or basic services. At the same time, human actions—such as clearing hillsides, blocking drains, and encroaching on wetlands—make things worse. In rural areas, overgrazing, deforestation, and groundwater overuse increase climate risks, especially for poor, overcrowded communities. Too often, governments and global organizations step in only after climate hazards hit, offering relief, insurance, or social support. These efforts can help, but only if they are sustained, which is not always the case. Waiting for a crisis is risky: Safety nets and insurance do not always kick in fast enough to protect the poorest individuals. Ethically and economically, the case for prevention is clear— reducing risk is the smartest way to protect both lives and livelihoods.
Why then have most countries not combined protective and reactive measures to minimize future losses caused by climate hazards? Chapter 4 argues that this bias comes from a mix of informational, political, and financial factors, with political economy likely being the biggest hurdle. It then explores potential solutions to overcome these challenges and underlines policies to enhance these instruments.
1. The proposed framework is consistent with other existing frameworks used for similar purposes, such as in the 2013 World Development Report; the Adaptation Principles; the World Bank’s Global Practice Finance, Competitiveness, and Investment’s layering approach; and the Triple Dividend of Resilience.
2. In LAC countries, urban settlements have grown by 65 percent, from 50,000 square kilometers in 1985 to 84,000 square kilometers in 2015. In 2015, 5 percent of all settlement areas—or 4,000 square kilometers—were in zones with high or very high flood risk (Rentschler et al. 2023).
3. High income refers to high and upper-middle income; low income refers to low and lower-middle income.
4. Based on data from Nirandjan et al. (2022).
5. Note that these estimates may suffer from endogeneity issues, such as, for example, geography, historical settlement patterns, and land use regulations that affect both infrastructure placement and flood vulnerability by city. Placement can also be decided as a function of risk awareness (such as hospitals, schools, and roads), which also depends on whether the city is affected by recurrent flooding.
6. Refer to https://data.worldbank.org/indicator/ER.LND.PTLD.ZS?locations=ZJ-1W
7. An analysis of 34 countries found no negative effects on poverty, with potential positive impacts tied to proximity to protected areas with tourism. Households within 10 kilometers of such areas would have 17 percent higher wealth and 16 percent lower poverty compared with a similar household more than 10 kilometers from a protected area. Positive effects were also seen in children’s health, particularly in less-restrictive protected areas. Studies evaluating the effectiveness of parks or systems of parks also provide evidence for a neutral or positive effect, at least in Latin America. In Costa Rica, the establishment of protected areas reduced poverty, mainly through tourism rather than increased forest cover or impacts on infrastructure. A study in Bolivia showed positive poverty impacts (asset-based poverty and measures of unmet basic needs), and a study in the Peruvian Amazon found reductions in deforestation but no clear poverty effects.
8. Despite subsidies, individualized index insurance still sees low uptake in the region. Credit constraints, low awareness, and lack of trust in providers all play a role. A key issue is basis risk: when payouts (such as those based on rainfall) do not match actual losses (such as crop failure), leaving farmers exposed and insurers at reputational risk. High startup costs also deter insurers, especially without clear paths to scale. This limited adoption slows market growth and prevents broader cost-sharing across a larger risk pool.
9. In 2006, despite having FONDEN, Mexico became the first government to purchase CAT bonds, transferring part of its climate risk to international capital markets. This allowed the country to shift the risk of infrequent but severe floods or droughts to regional or global reinsurance markets, boosting its financial resilience. CAT bonds work as follows: A special-purpose vehicle issues the bond, and the proceeds are held in an escrow account. Bond holders are promised an interest rate higher than that earned by the escrow account, but only if the event is not triggered. If a qualifying climate hazard occurs, the funds are released to the government, but investors get nothing. Although effective, issuing such bonds involves high fixed costs, making them too expensive for smaller countries. These governments may prefer reinsurance through regional pools or private companies. This strategy requires sophisticated government analysis and negotiation to implement effectively.
10. Using propensity score matching and a difference-in-differences approach, de la Fuente and Giné (2025) find that Weather Index Insurance reduces moderate poverty, with no significant preprogram trends from 1990 to 2000. Refer to de la Fuente and Giné 2025.
11. Households could also receive advance notice of their coverage under the disaster response fund, which may encourage investment in riskier, higher-yield crops.
12. The study uses a panel vector autoregressive model with country fixed effects. This model captures the dynamic relationship between climate shocks (whose intensity is proxied by the rate of people affected by them) and the poverty gap over time. Country fixed effects account for time-invariant differences across countries, such as geography, baseline economic structures, or long-standing institutional factors, improving the accuracy of estimates. However, although the classification of social protection systems is central to the analysis, differences in the impact of climate shocks may also reflect other time-varying country characteristics not directly controlled for in the model.
Adhvaryu, Achyuta, Teresa Molina, Anant Nyshadham, and Jorge Tamayo. 2024. “Helping Children Catch Up: Early Life Shocks and the PROGRESA Experiment.” Economic Journal 134 (657): 1–22.
Alix-Garcia, Jennifer M., Katharine R. E. Sims, and Patricia Yañez-Pagans. 2015. “Only One Tree from Each Seed? Environmental Effectiveness and Poverty Alleviation in Mexico’s Payments for Ecosystem Services Program.” American Economic Journal: Economic Policy 7 (4): 1–40.
Andam, Kwaw S., Paul J. Ferraro, Alexander Pfaff, G. Arturo Sanchez-Azofeifa, and Juan A. Robalino. 2008. “Measuring the Effectiveness of Protected Area Networks in Reducing Deforestation.” Proceedings of the National Academy of Sciences 105 (42): 16089–94.
Angelsen, Arild, Pamela Jagger, Ronnie Babigumira, Brian Belcher, Nicholas J. Hogarth, Simone Bauch, Jan Börner, Carsten Smith-Hall, and Sven Wunder. 2014. “Environmental Income and Rural Livelihoods: A Global-Comparative Analysis.” World Development 64 (2014): S12–S28.
Arena, Marco, Alessandro Guasti, and Hussam Hussein. 2023. “Can Conditional Cash Transfers Reduce Vulnerability to Climate Change?” Climate Policy 23 (4): 462–76.
Asfaw, Solomon, Alessandro Carraro, Benjamin Davis, Sudhansu Handa, and David Seidenfeld. 2017. “Cash Transfer Programmes, Water Shocks and Household Welfare: Evidence from a Randomised Experiment in Zambia.” Journal of Development Effectiveness 9 (4): 419–42.
Badgley, Grayson, Jeremy Freeman, Joseph J. Hamman, Barbara Haya, Anna T. Trugman, William R. Anderegg, and Danny Cullenward. 2022. “Systematic OverCrediting in California’s Forest Carbon Offsets Program.” Global Change Biology 28 (4): 1433–45.
Bagolle, Alexandre, Cecilia Costella, and Laura Goyeneche. 2023. “Social Protection and Climate Change: How Can We Protect the Most Vulnerable Households against New Climate Threats?” Policy Brief 375, Inter-American Development Bank, Washington, DC.
Balboni, Clare. 2025. “In Harm’s Way? Infrastructure Investments and the Persistence of Coastal Cities.” American Economic Review 115 (1): 77–116.
Banerjee, Onil, Martin Cicowiez, Ana R. Rios, and Cicero Z. De Lima. 2021. “Climate Change Impacts on Agriculture in Latin America and the Caribbean: An Application
of the Integrated Economic-Environmental Modeling (IEEM) Platform.” Working Paper IDB-WB-01289, Inter-American Development Bank, Washington, DC. https://doi.org/10.18235/0003794
Beazley, Rodolfo, Ana Solórzano, and Valentina Barca. 2019. Study on Shock-Responsive Social Protection in Latin America and the Caribbean: Summary of Key Findings and Recommendations. Oxford: Oxford Policy Management and Programme.
Blackman, Allen, Leonardo Corral, Eirivelthon Santos Lima, and Gregory P. Asner. 2017. “Titling Indigenous Communities Protects Forests in the Peruvian Amazon.” Proceedings of the National Academy of Sciences 114 (16): 4123–8.
Blackman, Allen, and Peter Veit. 2018. “Amazon Indigenous Communities Cut Forest Carbon Emissions.” Ecological Economics 153: 56–67.
Börner, Jan, Dario Schulz, Sven Wunder, and Alexander Pfaff. 2020. “The Effectiveness of Forest Conservation Policies and Programs.” Annual Review of Resource Economics 12: 19.1–19.20.
Bovarnick, Andrew, Francisco Alpizar, and Charles Schnell. 2010. Importance of Biodiversity and Ecosystems in Economic Growth and Equity in Latin America and the Caribbean: An Economic Valuation of Ecosystems. New York: United Nations Development Programme.
Busch, Jonah, and Kalifi Ferretti-Gallon. 2023. “What Drives and Stops Deforestation, Reforestation, and Forest Degradation? An Updated Meta-Analysis.” Review of Environmental Economics and Policy 17 (2): 217–50.
Camino, Micaela, Pablo Arriaga Velasco Aceves, Ana Alvarez, Pablo Chianetta, Luis Maria de la Cruz, Karina Alonzo, Maria Vallejos, et al. 2023. “Indigenous Lands with Secure Land-Tenure Can Reduce Forest-Loss in Deforestation Hotspots.” Global Environmental Change 81: 102678.
Cárdenas, Victor, and Salvator Perez Elizondo. 2025. “Disaster Risk Financing Instruments: A Preliminary Review on the Link with Poverty in Latin America.” Background paper, Adapting to Adversity: Climate Risks and Poverty in Latin America and the Caribbean, World Bank, Washington, DC.
Carleton, Tamma, Esther Duflo, B. Kelsey Jack, and Guglielmo Zappalà. 2024. “Adaptation to Climate Change.” In Handbook of the Economics of Climate Change, edited by Lint Barrage and Solomon Hsiang, 143–248. Amsterdam: Elsevier North Holland.
CEPAL (Comisión Económica para América Latina el Caribe). 2021. “Forest Loss in Latin America and the Caribbean from 1990 to 2020: The Statistical Evidence.” ECLAC Statistical Briefing 2, ECLAC (Economic Commission for Latin America and the Caribbean), Santiago, Chile. https://hdl.handle.net/11362/47152
Coffield, Shane R., Cassandra D. Vo, Jonathan A. Wang, Grayson Badgley, Michael L. Goulden, Danny Cullenward, William R. L. Anderegg, and James T. Randerson. 2022. “Using Remote Sensing to Quantify the Additional Climate Benefits of California Forest Carbon Offset Projects.” Global Change Biology 28 (2): 6789–806. de Janvry, Alain, Frederico Finan, Elisabeth Sadoulet, and Renos Vakis. 2006. “Can Conditional Cash Transfer Programs Serve as Safety Nets in Keeping Children at School and from Working When Exposed to Shocks?” Journal of Development Economics 79 (2): 349–73. de Janvry, Alain, Elizabeth Ramirez Ritchie, and Elisabeth Sadoulet. 2016. “Weather Index Insurance and Shock Coping Evidence from Mexico’s CADENA Program.” Policy Research Working Paper 7715, World Bank, Washington, DC.
de la Fuente, Alejandro, and Xavier Giné. 2025. “Rainfall Insurance as a Safety Net: The Case of Mexico.” Unpublished manuscript, 2025. Mimeo. World Bank, Washington, DC.
de la Fuente, Alejandro, and Monserrat Serio. 2025. “Vulnerability to Climate Risk–Induced Poverty in Latin America and the Caribbean.” Policy Research Working Paper 11002, World Bank, Washington, DC. http://documents.worldbank .org/curated/en/099824012162413308.
del Valle, Alejandro, Mathilda Eriksson, Oscar A. Ishizawa, and Juan Jose Miranda. 2019. “Mangroves Protect Coastal Economic Activity from Hurricanes.” Proceedings of the National Academy of Sciences 117 (1): 265–70.
del Valle, Alejandro, Mathilda Eriksson, Prerna Mishra, and Alejandro de la Fuente. 2025. “Index Disaster Funds Sustain Household Living Standards in Mexico.” Background paper, Adapting to Adversity: Poverty and Climate Risks in Latin America and the Caribbean, World Bank, Washington, DC.
Dinesh, Dhanush, Snorre Frid-Nielsen, James Norman, Manyewu Mutamba, Ana Maria Loboguerrero Rodriguez, and Bruce Campbell. 2015. “Is Climate-Smart Agriculture Effective? A Review of Selected Cases. Working Paper 129, CGIAR Research Program on Climate Change, Agriculture and Food Security, Copenhagen, Denmark. https://cgspace.cgiar.org/server/api/core/bitstreams/7a8f71ef-dfa0-4842-8a17 -6f9fa9d31642/content
Ehrlich, Isaac, and Gary S. Becker. 1972. “Market Insurance, Self-Insurance, and Self-Protection.” Journal of Political Economy 80 (4): 623–48.
Einhorn, Catrin, and Christopher Flavelle. 2020. “A Race Against Time to Rescue a Reef from Climate Change.” The New York Times, October 12, 2020. https://www.nytimes .com/2020/12/05/climate/Mexico-reef-climate-change.html
Fay, Marianne. 2005. The Urban Poor in Latin America. Directions in Development. Washington, DC: World Bank.
Ferraro, Paul J., and Merlin M. Hanauer. 2014. “Quantifying Causal Mechanisms to Determine How Protected Areas Affect Poverty through Changes in Ecosystem Services and Infrastructure.” Proceedings of the National Academy of Sciences 111 (11): 4332–7.
Fuchs, Alan, and Hendrik Wolff. 2011. “Concept and Unintended Consequences of Weather Index Insurance: The Case of Mexico.” American Journal of Agricultural Economics 93 (2): 505–11.
Fuchs Tarlovsky, Alan, and Hendrik Wolff. 2016. “Drought and Retribution: Evidence from a Large-Scale Rainfall-Indexed Insurance Program in Mexico.” Policy Research Working Paper Series 7565, World Bank, Washington, DC.
Gandhi, Sahil, Matthew E. Kahn, Rajat Kochhar, Somik Lall, and Vaidehi Tandel. 2024. “Adapting to Flood Risk: Evidence from a Panel of Global Cities.” Working Paper 30137, National Bureau of Economic Research, Cambridge, MA.
Gauvin, Crystal, Emi Uchida, Scott Rozelle, Jintao Xu, and Jinayn Zhan. 2010. “CostEffectiveness of Payments for Ecosystem Services with Dual Goals of Environment and Poverty Alleviation.” Environmental Management 45 (3): 488–501.
Global Commission on Adaptation. 2019. Adapt Now: A Global Call for Leadership on Climate Resilience. Washington, DC: World Bank. https://hdl.handle.net/10986/32362.
Grima, Nelson, Simron J. Singh, Barbara Smetschka, and Lisa Ringhofer. 2016. “Payment for Ecosystem Services (PES) in Latin America: Analysing the Performance of 40 Case Studies.” Ecosystem Services 17: 24–32.
Hallegatte, Stéphane, and Julie Rozenberg. 2017. “Climate Change through a Poverty Lens.” Nature Climate Change 7 (4): 250–6.
Hatrick, Augustina. 2023. Protected Natural Areas for Sustainable and Inclusive Conservation. Caracas, Venezuela: ImpactoCAF.
Hazell, Peter, Alexander Jaeger, and Rebecca Hausberger. 2021. Innovations and Emerging Trends in Agricultural Insurance for Smallholder Farmers—An Update. Bonn, Germany: Deutsche Gesellschaft für Internationale Zusammenarbeit.
Holland, Margaret B., Free de Koning, Manuel Morales, Lisa Naughton-Treves, Brian E. Robinson, and Luis Suárez. 2014. “Complex Tenure and Deforestation: Implications for Conservation Incentives in the Ecuadorian Amazon.” World Development 55: 21–36.
Hou, Xiaohui. 2010. “Can Drought Increase Total Calorie Availability? The Impact of Drought on Food Consumption and the Mitigating Effects of a Conditional Cash Transfer Program.” Economic Development and Cultural Change 58 (4): 713–37.
IPCC (Intergovernmental Panel on Climate Change). 2022. Climate Change 2022: Impacts, Adaptation, and Vulnerability. Contribution of Working Group II to the Sixth Assessment Report of the Intergovernmental Panel on Climate Change, edited by Hans-Otto Pörtner, Debra C. Roberts, Melinda M. B. Tignor, Elvira Poloczanska, Katja Mintenbeck, Andrés Alegría, Marlies Craig, et al. Cambridge and New York: Cambridge University Press. https://doi.org//10.1017/9781009325844
IUCN (International Union for Conservation of Nature). 2021. The Latin America and Caribbean Protected Planet Report 2020. Gland, Switzerland: IUCN.
Jack, B. Kelsey, and Seema Jayachandran. 2019. “Self-Selection into Payments for Ecosystem Services Programs.” Proceedings of the National Academy of Sciences 116 (12): 5326–33.
Janzen, Sarah A., Michael R. Carter, and Munenobu Ikegami. 2021. “Can Insurance Alter Poverty Dynamics and Reduce the Cost of Social Protection in Developing Countries?” Journal of Risk and Insurance 88 (2): 293–324.
Jayachandran, Seema. 2023. “The Inherent Trade-Off between the Environmental and Anti-Poverty Goals of Payments for Ecosystem Services.” Environmental Research Letters 18 (2): 025003.
Jayachandran, Seema, Joost De Laat, Eric F. Lambin, Charlotte Y. Stanton, Robin Audy, and Nancy E. Thomas. 2017. “Cash for Carbon: A Randomized Trial of Payments for Ecosystem Services to Reduce Deforestation.” Science 357 (6348): 267–73.
Knippenberg, Edwin, and John Hoddinott. 2019. “Shocks, Social Protection and Resilience: Evidence from Ethiopia.” Preprint, published March 5, 2019. https://gatesopenresearch.org/documents/3-702.
Kramer, Berber, Peter Hazell, Harold Alderman, Francisco Ceballos, Neha Kumar, and Anne G. Timu. 2022. “Is Agricultural Insurance Fulfilling Its Promise for the Developing World? A Review of Recent Evidence.” Annual Review of Resource Economics 14: 291–311. https://doi.org/10.1146/annurev-resource-111220-014147
Macours, Karen, Patrick Premand, and Renos Vakis. 2022. “Transfers, Diversification, and Household Risk Strategies: Can Productive Safety Nets Help Households Manage Climatic Variability?” The Economic Journal 132 (647): 2438–70.
Martinez-Diaz, Leonardo, Lauren Sidner, and Jack McClamrock. 2019. “The Future of Disaster Risk Pooling for Developing Countries: Where Do We Go from Here?” Working Paper, World Resources Institute, Washington, DC. https://www.wri .org/research/future-disaster-risk-pooling-developing-countries-where-do-we -go-here
McRae, Shaun. 2023. “Residential Electricity Consumption and Adaptation to Climate Change by Colombian Households.” Economics of Disasters and Climate Change 7 (2): 253–79.
Menéndez, Pelayo, Iñigo J. Losada, Saul Torres-Ortega, Siddharth Narayan, and Michael W. Beck. 2020. “The Global Flood Protection Benefits of Mangroves.” Scientific Reports 10: 4404. https://doi.org/10.1038/s41598-020-61136-6
Mesoamerican Reef Fund. 2025. “Mesoamerican Reef Rescue Initiative.” https:// marfund.org/en/mar-rescue-initiative/.
Miller, Daniel C., Pushpendra Rana, Katia Nakamura, Samantha Irwin, Samantha H. Cheng, Sofia Ahlroth, and Emilie Perge. 2021. “A Global Review of the Impact of Forest Property Rights Interventions on Poverty.” Global Environmental Change 66: 102218.
Nakamura, Shohei, Kseniya Abanokova, Hai-Anh H. Dang, Shinya Takamatsu, Chunchen Pei, and Dilou Prospere. 2023. “Is Climate Change Slowing the Urban Escalator Out of Poverty? Evidence from Chile, Colombia, and Indonesia.” International Journal of Environmental Research and Public Health 20 (6): 4865.
Nirandjan, Sadhana, Elco E. Koks, Philip J. Ward, and Jeroen C. J. H. Aerts. 2022. “A Spatially Explicit Harmonized Global Dataset of Critical Infrastructure.” Scientific Data 9 (1): 150.
Noy, Ilan, and Eric Strobl. 2022. “Heat Waves and Innovation in Air Conditioning in the United States.” Weather, Climate, and Society 14 (1): 143–54. https://doi.org /10.1175/WCAS-D-21-0095
Ola, Oreoluwa, Luisa Menapace, Emmanuel Benjamin, and Hannes Lang. 2019. “Determinants of the Environmental Conservation and Poverty Alleviation Objectives of Payments for Ecosystem Services (PES) Programs.” Ecosystem Services 35: 52–66.
Pagiola, Stefano, Agustin Arcenas, and Gunars Platais. 2005. “Can Payments for Environmental Services Help Reduce Poverty? An Exploration of the Issues and the Evidence to Date from Latin America.” World Development 33 (2): 237–53.
Peiretti, R., and Julian Dumanski. 2014. “The Transformation of Agriculture in Argentina through Soil Conservation.” International Soil and Water Conservation Research 2 (1): 14–20.
Quichimbo-Miguitama, Fabian, David Matamoros, Leticia Jiménez, and Pablo Quichimbo-Miguitama. 2022. “Influence of Low-Impact Development in Flood Control: A Case Study of the Febres Cordero Stormwater System of Guayaquil (Ecuador).” Sustainability 14 (12): 7109.
Rentschler, Jun, Paolo Avner, Mattia Marconcini, Rui Su, Emanuele Strano, Michalis Vousdoukas, and Stéphane Hallegatte. 2023. “Global Evidence of Rapid Urban Growth in Flood Zones Since 1985.” Nature 622: 87–92.
Salzman, James, Genevieve Bennett, Nathaniel Carroll, Allie Goldstein, and Michael Jenkins. 2018. “The Global Status and Trends of Payments for Ecosystem Services.” Nature Sustainability 1 (3): 136–44.
Schleicher, Judith, Carlos A. Peres, Tatsuya Amano, William Llactayo, and Nigel LeaderWilliams. 2017. “Conservation Performance of Different Conservation Governance Regimes in the Peruvian Amazon.” Scientific Reports 7 (1): 11318.
Sengupta, Somini. 2022. “A Low-Cost, Low-Tech Climate Solution That Saves Lives.” New York Times, April 8, 2022; updated May 22, 2023. https://www.nytimes.com /2022/04/08/climate/weather-warnings-climate-change.html
Shilpi, Forhad, Matthew E. Kahn, and Claudia Berg. 2025. “Rethinking Resilience: Adapting to a Changing Climate. Policy Research Report.” Washington, DC: World Bank.
Stampini, Marco, Pablo Ibarrarán, Carolina Rivas and Marcos Robles, 2021. “Adaptive, but Not by Design: Cash Transfers in Latin America and the Caribbean Before, During and After the COVID-19 Pandemic.” IADB Technical Note No. 2346. Washington, DC: Inter-American Development Bank. https://doi.org/10.18235 /0003795 https://doi.org/10.1596/978-1-4648-2158-5
Sugastti, Marcos M., and Michael R. 2025. “Asset Protection and Disaster Risk Financing to Improve Shock-Responsive Social Protection in Latin America and the Caribbean.” Background paper, Adapting to Adversity: Climate Risks and Poverty in Latin America, World Bank, Washington, DC.
Tanner, Michael, and Leonie Ratzke. 2022. “Deforestation, Institutions, and Property Rights: Evidence from Land Titling to Indigenous Peoples and Local Communities in Ecuador.” Working Paper 2022/22, Banco de Desarrollo de América Latina, Caracas, Venezuela.
Tisei, Francisco, and Malin Ed. 2024. Unleashing Adaptive Potential for Social Protection: Good Adaptive Social Protection Practices in the Latin America and Caribbean Region Washington, DC: World Bank. https://documents1.worldbank.org/curated /en/099032624235534457/pdf/P179137151c0b302018b201e171ee1a7b5a.pdf
Turner, Sara, Nancy Lozano Gracia, and Peter Hawthorne. 2025. “Distributional Implications of Enhancing Resilience and Ecosystem Services through Improved Land Use in Latin America.” Background paper, Adapting to Adversity: Poverty and Climate Risks in Latin America and the Caribbean, World Bank, Washington, DC.
UN (United Nations). 2022. “UN Weather Agency to Spearhead 5 Year Early Warning Plan, Boosting Climate Action.” UN News, March 23, 2022. https://news.un.org/en /story/2022/03/1114462.
UN (United Nations) and World Bank. 2010. Natural Hazards, UnNatural Disasters: The Economics of Effective Prevention. Washington, D.C.
Vedeld, Paul, Arild Angelsen, Jan Bojö, Espen Sjaastad, and Gertrude Kobugabe Berg. 2007. “Forest Environmental Incomes and the Rural Poor.” Forest Policy and Economics 9 (7): 869–79.
Vergara-Asenjo, Gerardo, and Catherine Jeanne Potvin. 2014. “Forest Protection and Tenure Status: The Key Role of Indigenous Peoples and Protected Areas in Panama.” Global Environmental Change: Human and Policy Dimensions 28: 205–15.
Wade, Christopher M., Kemen G. Austin, James Cajka, Daniel Lapidus, Kibri H. Everett, Diana Galperin, Rachel Maynard, and Aaron Sobel. 2020. “What Is Threatening Forests in Protected Areas? A Global Assessment of Deforestation in Protected Areas, 2001–2018.” Forests 11 (5): 539.
Williams, David, and Laura Green. 2023. “Climate-Smart Forestry: Promise and Risks for Forests, Society, and Climate.” PLOS Climate 2(1): e0000212.
WMO (World Meteorological Organization). 2022. State of the Climate in Latin America and the Caribbean 2023. WMO-No. 1351. Geneva: World Meteorological Organization.
WMO (World Meteorological Organization). 2025. “WMO Confirms 2024 as Warmest Year on Record at about 1.55°C above Pre-Industrial Level.” Press release, January 10, 2025. https://wmo.int/news/media-centre/wmo-confirms-2024-warmest-year -record-about-155degc-above-pre-industrial-level
Wolf, Christopher, Taal Levi, Wiliam J. Ripple, Diego Zárrate-Charry, and Matthew G. Betts. 2021. “A Forest Loss Report Card for the World’s Protected Areas.” Nature Ecology and Evolution 5: 520–9. https://doi.org/10.1038/s41559-021-01389-0
Wong, Po Yin, Karlygash Kuralbayeva, Liana O. Anderson, Ana M. Pessoa, and Torfinn Harding. 2022. “Individual Pay for Collective Performance and Deforestation: Evidence from Brazil.” Research Paper, Queen Mary University of London, Centre for Globalisation Research. https://cgr.sbm.qmul.ac.uk/CGRWP110.pdf.
World Bank. 2009. World Development Report 2009: Reshaping Economic Geography. Washington, DC: World Bank. https://doi.org/10.1596/978-0-8213-7640-9
World Bank. 2013. World Development Report 2013: Jobs. Washington, DC: World Bank. https://doi.org/10.1596/978-0-8213-9575-2.
World Bank. 2016. Investing in Urban Resilience: Protecting and Promoting Development in a Changing World. Washington, DC: World Bank. http://hdl.handle.net/10986 /25219.
World Bank. 2023. Fast Tracking Poverty Reduction and Prosperity for All: Dominican Republic Poverty Assessment 2023—Background Note on Poverty and Climate Change. Washington, DC: World Bank. http://documents.worldbank.org/curated/en /099102723131516670
World Bank. 2025. Unlivable: Confronting Extreme Urban Heat in Latin America and the Caribbean. Washington, DC: World Bank.
Wunder, Sven, Jan Börner, Driss Ezzine-de-Blas, Sarah Feder, and Stefano Pagiola. 2020. “Payments for Environmental Services: Past Performance and Pending Potentials.” Annual Review of Resource Economics 12 (1): 209–34.
WWF. 2022. Living Planet Report 2022: Building a Nature-Positive Society. Edited by Rosamunde Almond, Monique Grooten, Diego Juffe Bignoli, and Tanya Petersen. Gland, Switzerland: WWF. https://www.wwf.org.uk/sites/default/files/2023-05 / WWF-Living-Planet-Report-2022.pdf
Zheng, Hongyun, Wanglin Ma, and Quan He. 2024. “Climate-Smart Agricultural Practices for Enhanced Farm Productivity, Income, Resilience, and Greenhouse Gas Mitigation: A Comprehensive Review.” Mitigation and Adaptation Strategies for Global Change 29: 28. https://link.springer.com/article/10.1007/s11027-024-10124-6.
Chapter 3 looked at five key adaptation instruments—early warning systems, critical urban infrastructure, land and ecosystem protection, insurance, and safety nets—and how they help vulnerable communities deal with climate hazards. Some countries have made strides, but none have fully rolled out all five, and no single measure has been widely adopted across Latin America and the Caribbean (LAC). This chapter dives into what it takes to get people to act on warnings and build safer homes and what measures can enhance the adoption of these instruments across governments to better protect their citizens.
Greenstone and Jack (2015) identify four key factors that hinder the effectiveness of climate response in developing countries: low-income levels, high adaptation costs, political economy constraints, and market failures. We believe these factors can be overcome by what we call the 4 Is (refer to figure 4.1):
1. Incentives: Individuals can be encouraged to adopt better protective measures against climate risks.
2. Information and technology: Data and innovations from governments, multilateral organizations such as the World Bank, and the private sector can influence decisions, allowing governments to build on existing knowledge.
3. Investments: Securing funding can make adaptation efforts both sustainable and cost-effective.
4. Institutions: A mix of media (to inform), political parties (to compete for votes), and technocrats (to evaluate the merits of alternative policies) ensures effective adaptation and accountability at all levels.
Each factor is examined in turn.
FIGURE 4.1
Key factors to improve adaptation responses
Incentives
Key factors enabling better adaptation
Investments
Source: Original figure for this publication.
Chapter 1 revealed that in numerous countries and cities in the region, poor individuals face disproportionate exposure to climate hazards. Chapter 2 further highlighted that more lives are lost in poor countries in the region, with poor individuals suffering more in both poor and better-off countries. Why do those who are poor take greater risks? Confidence in understanding behavior, whether through psychology or economics, increases if one can explain these differences.
Evidence of taking greater risks, for instance, is consistent with multiple explanations, one being flawed perception of risk, especially of rare events. So, although people in the Dominican Republic or St. Lucia know they live in a hurricane-prone area, they may underestimate the likelihood of a major storm and so take inadequate precautions. But poor and rich people alike are exposed to a one-in-1,000-year storm (in terms of probability, the 1,000-year storm has a
0.001 percent chance of happening in any given year), so they may both think they are safe for 999 years. Lack of wealth does not seem to hardwire poor individuals to risk misperceptions more so than any other group.
Another common view is that poor individuals often favor immediate rewards over future gains. This might mean skipping education to avoid its perceived burden or entering into early marriage and frequent divorce, sacrificing stable relationships. Such choices may reflect short-sightedness or a conscious preference for instant gratification—what economists call a high discount rate. Some argue that poor people inherently possess a higher discount rate, so this mindset explains why they would prefer present consumption over potential future benefits.1
By extension, poor individuals might ignore warnings or skip precautions against climate hazards, such as moving away from flood-prone areas, because these actions come with immediate costs. For example, evacuating could mean losing an immediate source of income for a threat that might never happen. Similarly, investing in floodproofing homes might seem pointless and incur a high opportunity cost if the benefits are long term or uncertain. But is this really the whole story?
Living in a shanty town may often not be about poor long-term planning; it is a practical choice to stay close to work, even if that work means scavenging as a ragpicker. When people have little now and expect little later, sacrificing the present for the future may not make sense. Some economists argue that blaming high discount rates or differences in tastes to explain poor people’s decisions just masks a lack of understanding (Stigler and Becker 1977)—why those preferences exist is the real question. In fact, many poor individuals make enormous long-term sacrifices: leaving rural homes for harsh urban conditions so they have money to send home and give their children more food and better education. Often, people settling in slums in Latin American cities reflects deeper systemic issues, such as the lack of public transport or regulations that block affordable housing alternatives.
Galiani et al. (2017) compare poor slum dwellers living near their workplace with other poor households in El Salvador, Mexico, and Uruguay who live farther away but have better access to public services. They find that slum residents earn significantly more, despite having a comparable level of education and labor-market participation rates. As chapter 3 highlighted, though, many of these slums—especially those on riverbanks or hilltops—are highly vulnerable to floods because of poor infrastructure.
This raises a policy dilemma: Should slum dwellers be relocated to safer areas that are farther from jobs? Chapter 3 already explored this trade-off. The key point here is that overexposure to climate hazards or limited preventive action often stems from rational choices, not just misjudged risks or high discount rates. People may simply be responding to incentives as they are.
Another explanation uses conventional economic reasoning, pointing to information gaps and market failures. For instance, storm-resistant homes may
cost only a bit more, but buyers or renters often cannot tell how resilient a home really is—potentially creating an Akerlof-type market-for-lemons problem.2 Even when retrofitting makes sense, the lack of visibility in resale or rental markets can discourage investment. Reputation systems or builder guarantees could help, but in practice they often fall short, leading to fewer precautions than warranted.
Poor individuals may not invest in climate prevention because of insecure property rights. If they might get evicted at any time, why spend money fixing up a place they do not own? The constant threat of eviction does not just stop home upgrades, it weakens community bonds and discourages collective actions, such as building shared flood defenses. By contrast, when people have secure property or tenancy rights, everything changes. They are more likely to improve their homes (or leave, in the case of a warning) and neighborhoods without the fear of losing it all. The link to climate resilience may be indirect, because, for instance, better housing materials tend to hold up better during storms. In Ecuador, stronger property rights sparked more community projects (Lanjouw and Levy 2022). In Peru, giving slum dwellers legal ownership led to more self-funded home upgrades and even boosted work participation (Field 2007). A study in Peru found a 68 percent increase in housing investments after land titling, although floodplain areas were left out, so the impact on those most vulnerable to floods is not fully clear (Field 2005). Similarly, in Argentina, land titling in shantytowns encouraged families to invest in housing (Galiani and Schargrodsky 2010).
There is less research on how property rights tie into climate risk reduction, but the signs are promising—especially studies at the community level. In Rio de Janeiro’s favelas, people with secure tenure were more likely to put in things such as retaining walls to prevent landslides (Perlman 2010). In the Dominican Republic, homeowners were more proactive than renters, building walls or digging ditches around their homes to steer water away (World Bank 2023a). Similar patterns showed up in Medellín, where tenure security helped drive communityled efforts on landslide prevention (Aristizabál Giraldo et al. 2020). And in Lima’s informal settlements, titled households were more likely to participate in community preparedness efforts against climate hazards (Chambers 2005).
When families build shanties in risky locations, it is usually a revealed preference—because they run out of options. Between 2008 and 2022, about 30 million people in LAC were displaced by storms and floods, according to the Internal Displacement Monitoring Centre (https://www.internal-displacement .org/database/displacement-data/), although, surprisingly, not much movement happens in cities in poorer countries in LAC, even after repeated flooding (refer to chapter 3, “Resilient cities” section).3 Some may end up in floodprone areas. Giving them safer land and secure tenure would help, but it is not just about location. People also need roads and buses to get to work. If the
government handles that, people can build their own homes—even if they are simple ones—on land that is less likely to be wiped out.
Connectivity is key to helping informal settlements adapt and thrive. Linking slums to the formal city opens up access to jobs and boosts emergency response. In Buenos Aires, where nearby areas face deeper poverty, governments—backed by national and international support—have launched major slum upgrades. Since 2017, places like Barrio 31 have seen big investments in resilience: better infrastructure, easier access, and greener buildings (Bosi and Puig 2017). This also lifts local economies and builds skills. In Medellín, the Metrocable system is a good example of a transport system that has managed to slash travel time from hillside slums to the city center to just seven minutes, making it easier for people to get around and get ahead (Davila 2021).
Alternatively, removing public incentives for settling in hazard-prone areas, such as infrastructure investments, can deter development in risky zones. In the United States, the Coastal Barrier Resources Act of 1982 removed federal support for flood protection, disaster assistance, and subsidized flood insurance in risk-designated areas along the Atlantic and Gulf coasts, called the Coastal Barrier Resources System. This led to an 85 percent drop in development density in these areas, but a 20 percent increase in development in nearby regions (Druckenmiller et al. 2023).
Another way to steer people away from high-risk areas is to repurpose the land. In Medellín, the Jardín Circunvalar turned more than 65 hectares of damaged hillside into a green space with native trees (C40 Cities 2016). It helps prevent floods and landslides in the neighborhoods below and naturally limits further building uphill. The park includes trails, bike lanes, and spots for growing native orchids. Nearby, the government has built affordable housing and involved locals in designing and maintaining the park—creating jobs, learning opportunities, and a safer, greener space for everyone. Incidentally, this project forms part of a broader initiative on green corridors across the city, which have reduced temperatures (de Andrade 2023).
In sum, governments can encourage residents to relocate to safer locations (or signal their commitment to preventive adaptation) by building roads, restoring parks, and cutting back on services in hazardous locations.
Still, even with all the nudges, some people may still decide to stay where they live out of necessity or conviction. Some argue that people assume the government will step in with flood protection if they build in risky areas (Kocormik-Mina et al. 2020). So, construction on floodplains continues. Without clear rules, people build, and the government responds with levees and dams—shifting the cost onto those living in safer areas. That is one reason why these flood-prone areas end up being overcrowded (Rentschler et al. 2023), especially with people who cannot afford to move. There is a real need for solid evidence in the region to see whether public investments in resilient
infrastructure unintentionally encourage riskier behavior—a crowding-out effect from climate proofing. If this is the case, governments should think of new policies to keep that from happening, as discussed next.
Building codes can boost a community’s resilience to severe weather. Sometimes international experts push for stricter codes as part of aid, but supporters of tough codes often overlook two things: (1) property owners have their own incentive to protect their assets and (2) they assume that people will always follow government rules. To really improve, countries need better overall building practices—including skilled designers, material testing, proper equipment, and trained workers—and codes are just the start.
It is also easier to justify safety measures when they protect others, not just the individual (for example, speed limits are easier to enforce than seat belt or helmet laws). Some rules, like the smoking ban, can encourage better behavior, and seat belt use has increased over time, partly because of their ubiquity. But mandatory measures can also lead to corruption. For instance, the uneven enforcement of land use rules resulting from corruption, often under the guise of adaptation, has allowed wealthier neighborhoods to stay safe (because they can protect themselves) while poorer informal communities are displaced or relocated (D’Aoust, de la Fuente, and Lozano Gracia 2025).
Therefore, it is probably better to mandate things everyone can observe, such as zoning and exclusion zones, rather than relying on inspections. Exclusion zones stay the same regardless of the building technology, and allowing exceptions for builders who claim their designs are safe could open the door to corruption because of lack of transparency. It is likely more effective to regulate (1) things that are easy to observe and (2) areas where technology is not changing quickly.
A key issue is that informal settlements often emerge in areas outside zoning regulations, where residents de facto do not follow the rules. To ensure compliance with land use or zoning, the first step is that people need legal ownership of the land they have settled on.
Ultimately, transparent housing decisions and urban planning through zoning and land use restrictions depend on titling and accurate, timely data. Governments, businesses, and households need the right resources and incentives to evaluate the costs and benefits of climate-smart adaptation decisions such as zoning. These incentives only work if markets provide reliable data on an investment’s future value and governments have reliable information on climate risks and assets. Without this information, governments avoid investing in infrastructure or land rights in flood-prone areas. But with better information, they can better justify their zoning decisions, leading to smarter urban planning in low-risk areas, such as more green spaces, better drainage, and stricter zoning enforcement.
In Porto Alegre, Brazil, for instance, the World Bank helped the municipal government launch the Green, Resilient, and Inclusive Regeneration Project to sustainably revitalize the city’s center with climate-smart solutions (World Bank 2023a). A major focus was reducing flood risks, especially in high-risk areas, by upgrading drainage infrastructure. The project included hydrological studies, which then informed ways to boost water permeability, along with expanding drainage, improving microdrainage, and replacing outdated water systems.
In El Progreso, Honduras, repeated flooding and unmanaged growth had long increased the city’s exposure to climate risks. With World Bank support, the municipality conducted land use assessments and began integrating climate risk data into urban planning. These efforts have helped local authorities justify zoning restrictions and strengthen planning systems, paving the way for more resilient and sustainable urban development (Bloch et al. 2014).
Up to this point, we have shown that market failures have held back some adaptation efforts in the region, but that removing these barriers can help people make smarter choices with respect to climate risks. Policies that address information gaps, negative externalities, and principal-agent issues help people make informed decisions. Because private providers do not necessarily have the incentive to share hazard data, government action is essential. Clear property rights strengthen resilience in poor urban areas. Public transport boosts mobility, reduces congestion, and cuts pollution, benefiting everyone. Building roads, restoring parks, and cutting back on services in hazardous locations altogether can nudge people to reconsider their location, especially if their lives are at risk. People can protect their homes with timely warnings. We now turn to another key enabler of effective adaptation.
Easy access to information is key to better adaptation. Chapter 3 highlights how accurate weather and hazard forecasts and their timely dissemination can save lives. When people know the risks of living in flood- or storm-prone areas, they take more precautions. Governments can also negotiate better insurance rates by having full data on hazard exposure and asset values.
Climate hazards arise from a variety of causes and unfold at different speeds. Forecasting ability is increasing, although unevenly across hazards; the basic physics of climate hazards is not new, but the technology to measure, monitor, and predict is increasing by leaps and bounds. Weather systems can be predicted far better now than 30 years ago, but the timing of some risks remains unpredictable.
Accurate forecasts are key. Thanks to better science and technology—such as sharper satellite observations, cheaper instruments that send data instantly, and stronger computing power—predictions have come a long way. In 2015,
a seven-day forecast was already about as reliable as a three-day one was in 1985 (Duggan 2015). Right now, most hazards can be predicted with enough lead time.
Still, not all hazards are equally easy to predict, and climate change is making things even trickier with more unpredictable weather. Take hurricanes: Forecasts have gotten much better at tracking intensity, but surprises still happen. Figure 4.2b shows the difficulty in predicting where hurricanes will hit. In early July 2024, as Hurricane Beryl tore through the Caribbean, European and US models (refer to blue lines in figure 4.2) pointed to landfall in Mexico. Instead, four days later, Beryl slammed into Texas, flooding roads, killing at least 36, and knocking out power for millions.
Better forecasts need solid data and powerful models, and both take resources. The more accurate the data, the better the forecast. Data come from ground sensors (thermometers, barometers) and satellites, both of which are costly to launch and maintain. Models are expensive to develop, although cheaper to operate once set up. Extra information helps too—such as combining rainfall forecasts with watershed maps to predict floods or layering heat alerts with data on housing and age (for example, how many old people live in homes without air conditioners?) and commuting (how much more smog is likely?) to pinpoint who is most at risk. Artificial intelligence (AI) weather forecasting is another promising feature, in which a growing number of smart machines are anticipating future global weather patterns with new speed and accuracy. A research team at Google DeepMind used its AI tool GraphCast on a relatively modest computer to predict Hurricane Beryl’s path—and it accurately forecast the Texas landfall. In figure 4.2, the blue line shows GraphCast’s forecast closely tracking the orange line of Beryl’s observed path. Notably, the model relied solely on its prior knowledge of Earth’s atmosphere.
FIGURE 4.2
Model forecasts of Hurricane Beryl’s trajectory
Comparing forecasts made on July 1 with the actual path of Hurricane Beryl
Source: From The New York Times, October 23 © 2005 The New York Times. All rights reserved. Used by permission and protected by the Copyright Laws of the United States. The printing, copying, redistribution, or retransmission of this Content without express written permission is prohibited.
Note: AI = artificial intelligence.
Private sector involvement in climate forecasting could lower costs, but competing data, rival forecasts, and diverse ownership create challenges. Some underfunded agencies sell forecasts, with mixed results, whereas private companies use weather data for airplane routes, timing of farming, and commodities trading. Firms such as SpaceX launch satellites, startups use drones to gather innovative data, and AI is reshaping weather prediction algorithms. However, profit motives can lead to monopolies and restricted access. Weather and hazard forecasts are nonrival, but hazard warnings must remain freely available for public safety. If private firms control key data, national weather agencies—even in wealthy countries— could lose access, causing major public welfare losses. Each country must ensure inclusive, accessible forecasting. Although private firms may provide forecasts because they are generally good corporate citizens, the issue must be carefully thought through in each country to ensure inclusiveness.
The problem could worsen if raw forecast data are not shared, particularly across countries facing common climate risks. The National Oceanic and Atmospheric Administration shares weather forecasts and data with governments outside the United States through international collaborations. But what about private companies? Should international treaties require private companies to share data, too? The World Meteorological Organization sets guidelines, but it has no enforcement power or penalties for noncompliance.
What can governments do to ensure full early warning system coverage in LAC? Governments can enhance data quality and access by fostering public-private partnerships. With free, open-source tools like PostGIS, Geoserver, and the GeoNode.org project, collecting and sharing data are easier than ever. Public-private partnerships highlight this potential; for example, CrisisReady (https://www .crisisready.io/) collaborates with Harvard, Direct Relief, tech firms, and governments to integrate data-driven decisions into climate risk planning.
Another option is to pool resources and expertise across countries, as has been done in the Caribbean. With shared regional risks, the Caribbean Disaster Emergency Management Agency created the Regional Early Warning Systems Consortium to improve data sharing and system interoperability. This both strengthens national capacities and highlights best practices. The system brings together institutions focused on specific risks—climate research centers, health agencies, meteorological services, and coastal hazard groups—along with disaster risk management and telecom agencies. Its goals are to standardize alerts, align key messages, and promote new technologies to make early warnings more effective across the region (World Bank 2023b). Overreliance on the systems and expertise of one country should, however, be avoided.
The World Bank could spearhead a regional push for granular data collection, building on past efforts such as the open-source initiative called Central American Probabilistic Risk Assessment (CAPRA). Expanding and replicating CAPRA could enhance risk assessment across the region.4
No forecast is perfect—hurricane paths, speed, and impact always carry uncertainty. So repeated false alarms can lead to complacency. Accurate forecasts help officials plan evacuations and save lives—if there is enough lead time. But trust is just as crucial; people are more likely to evacuate when they believe in their leaders.
Research consistently shows that trust drives compliance. Dunn and Laterzo (2021) found that trust in leaders and institutions shaped COVID-19 compliance in Brazil and Mexico. Likewise, Levitt et al. (2019) link political trust and corruption perceptions to adherence to disaster-related building codes. Although rigorous empirical evidence on trust and evacuation is limited, insights from these studies suggest that political trust may be crucial for effective evacuations.
However, not everyone trusts their leaders, and that makes it hard to get people to follow warnings. In LAC, trust in government is generally low. Many countries struggle to deliver basic services such as health care, education, or pensions, and high crime—especially in places such as Honduras and República Bolivariana de Venezuela—adds to public frustration. Corruption and inequality only make things worse (Bargsted, Somma, and Castillo 2017). Latinobarómetro’s 2023 survey backs this up: Most people across the region do not trust Congress or political parties ( https://www .latinobarometro.org/latinobarometro-2023). Uruguay stands out with relatively higher trust levels, but in most countries, more than 80 percent have little or no faith in political parties (Arias, Kennard, and Verley 2024). Furthermore, trust is not just low but can be fragile, and what works today may not hold tomorrow if political dynamics shift, which makes it more complicated.
If people overcome their mistrust and choose to evacuate, there still needs to be a solid information system for response to climate impacts—one that coordinates shelters, aid, police to manage traffic control, and security. As simple as it may sound, many countries do not have such systems, so when climate hazards hit, people flee in confusion. Hurricane Otis is a case in point: It caught forecasters off guard, looting followed, and many people might now ignore future evacuation orders. The solution is a clear system to declare (1) the emergency, (2) what areas have been affected, and (3) what predesignated shelters to go to—something many countries are still missing. Although such systems cannot eliminate all risks, such as looting, they are critical for reducing confusion and improving public trust during emergencies. So when good forecasts meet effective government outreach to vulnerable groups, the impacts of climate risk can be mitigated (refer to box 4.1).
In India, the Ahmedabad Heat Action Plan was launched after a deadly heat wave in 2010, and it has since become a model for other cities facing rising temperatures. The plan combines early warning systems, public awareness campaigns, and health system preparedness and features a color-coded alert system (yellow, orange, red) linked to increasingly proactive measures, such as targeted outreach, cooling strategies, and emergency response. A study by Hess et al. (2018) found that implementation of the Heat
Action Plan was associated with a significant reduction in all-cause summertime mortality, with the largest declines occurring on the hottest days. The plan’s success is attributed to its integration of climate forecasts with local government action, as well as its emphasis on reaching vulnerable groups. Ahmedabad’s experience suggests that well-designed heat action plans can meaningfully protect poor and vulnerable populations in tropical urban centers as climate risks intensify.
Raising awareness in low-income communities—and giving them the right tools—also helps them take warnings seriously and reduce risks. But getting that information to them is not always easy. Just knowing about flood risks or getting timely alerts can make people more prepared. Community programs such as Jamaica’s Community Disaster Preparedness Program have helped locals understand risks and act on them. Campaigns such as Prepárate Perú teach people about the implications of climate change and encourage them to take steps to stay safe.
Timely, accurate price information on insurance premiums helps individuals and governments make better adaptation decisions. When premiums reflect true risk and damage costs, they guide people on whether to buy coverage. But balance is key: If premiums are set too low, they can encourage overdevelopment in risky areas and weaken prevention efforts. If they are set too high, they may discourage people from getting insured altogether.
Setting the right insurance premiums is no easy task; one has to estimate both how likely a loss is and how big it could be. The damage also needs to be easy to prove (death, not pain) and not be made worse by having insurance (that is, moral hazard). If premiums match the true individual risk, things work fine. But when insurers rely on broad risk factors rather than true individual risk indicators, high-risk individuals are more likely to purchase coverage, and lower-risk individuals opt out, which then drives up premiums overall. As markets grow and competition kicks in, premiums can get more accurate,
nudging people to take more precautions. However, as premiums rise, poorer households, regardless of their actual risk level, may be priced out of the market entirely, raising important distributional concerns alongside efficiency losses. In the extreme cases, high costs for monitoring and administration can make some risks too expensive to insure for everyone—especially rare ones or those tied to hard-to-track behavior, such as fires: They are natural, but farmers can worsen their impact by overgrazing, which degrades soil and reduces its ability to retain moisture, thus making crop insurance more difficult to price.
Even pricing index insurance is challenging, mainly because of basis risk— the mismatch between actual losses and payouts. Sure, it avoids costly inspections and pays out fast, but its Achilles heel is that it can miss real losses or pay when there is no damage. False negatives (no payouts despite losses) and false positives (payouts without losses) weaken the value of insurance, with false positives straining public trust and resources. Parametric insurance depends on clear, reliable triggers—such as rainfall or temperature—that closely match actual damage. The key is keeping basis risk low so payouts line up with reality. There are two types of basis risk: design-based (when the index poorly predicts average losses in an area) and zonal (when individual losses differ from the area’s average). Improving remote sensing, crop models, and real-time data collection can enhance index accuracy and reduce basis risk.
Advancements in remote sensing have made loss prediction more accurate, helping to reduce design-based basis risk (Benami et al. 2021). Yet, insurance zones remain underdeveloped, limiting their potential (Benami and Carter 2021). Combining satellite data with crop models can improve yield and loss predictions, making insurance more effective for farmers. Ground truthing with local data, auditing mechanisms, and historical weather records further refines accuracy, and digital tools such as mobile platforms enhance real-time data collection, ensuring index triggers better match actual losses.
Of course, with enough subsidies, almost any insurance program can stay afloat—even when basis risk is high. A 2020 survey found that about 80 percent of insurance programs surveyed were subsidized (Kramer et al. 2022). Subsidies make insurance more affordable, especially when poor data drives premiums up. Subsidies can jump-start private markets and boost demand, but they also have drawbacks. If mistargeted, they may favor wealthier farmers or encourage risky practices, such as planting high-risk crops on fragile land. In the long run, careful cost-benefit analysis (CBA) and stronger evidence on how subsidized programs actually perform are essential to better guide future policy choices (Kramer et al. 2022).
A solid data system is crucial to overcome basis risk—especially for governments backing insurance programs. Limited or patchy data from rain
gauges or yield records make it tough to price premiums right. When insurers are not sure about the real risks, they play it safe and hike premiums to cover the unknowns. That is a big problem in places that need agriculture insurance the most because high costs push farmers away, slowing down the growth of sustainable insurance markets.
Another way to tackle basis risk is through public-private reinsurance partnerships, where a public reinsurance facility helps absorb some of the uncertainty that private insurers hesitate to take on (Carter 2013). This could lead to fairer premium pricing, making insurance more accessible in underserved areas. By reducing reliance on worst-case pricing, such a partnership could lower premiums without subsidies, fostering sustainable insurance markets. Over time, as better data become available, the public sector could gradually step back, allowing the market to function independently.
Finally, support from institutions such as the World Bank in developing platforms such as CAPRA can help governments better understand their risk portfolios, allowing them to negotiate fairer premiums and policy terms (refer to box 4.2).
Box 4.2
Some countries in LAC have over the years developed data systems to help governments make better-informed decisions to retain or transfer their climate risk. Mexico has set a regional benchmark in managing climate risk. Using its own geospatial databases of public asset exposure and its own probabilistic loss estimation catastrophe risk model tool called R-FONDEN., it defines risk levels and decides how much to transfer through two main tools: all-risk catastrophe insurance (contracted since 2011) and catastrophe bonds for earthquakes and hurricanes (contracted since 2009). The risk levels obtained from R-FONDEN have also helped to set the retention amounts managed through the Fondo de Desastres Naturales. Colombia, while making progress in mapping public assets and climate hazards, still lacks a national risk model and instead relies on commercial models or risk profile estimates
derived from World Bank models. This information has mostly guided the calibration of its disaster fund and catastrophe-deferred drawdown options, not active risk transfer, apart from a one-time earthquake catastrophe bond acquired under the Pacific Alliance Framework around 2018, which was not renewed. Several Central American countries—Guatemala, Honduras, Nicaragua, and Panama—regularly transfer risk through the Caribbean Catastrophe Risk Insurance Facility (CCRIF) for hurricanes, earthquakes, and heavy rain. Most rely on CCRIF data and World Bank models, but Nicaragua uniquely uses its own information generated by Instituto Nicaragüense de Estudios Territoriales. This information is mainly about asset exposure, but it also includes threat analysis, which has helped the Ministry of Finance in the calibration of the triggers proposed by CCRIF.
A well-informed electorate can prompt a more responsive government during climate emergencies. Enhanced access to information among victims, coupled with an active mass media disseminating and coordinating information, can enhance government accountability in relief spending. Although the precise methods for disseminating information to influence politicians’ actions may vary, certain commonalities exist. For instance, the public can be informed about the performance of services in their community compared with that in others, identification of responsibility, and whether policy changes have enhanced services.
Transparency and citizen feedback can significantly improve responses to crises, including those caused by climate hazards. After Chile’s 2010 earthquake, open reporting on disaster aid let people track government spending and boosted accountability. In Colombia, mobile platforms helped citizens share feedback on climate efforts, strengthening trust and dialogue. Honduras used a transparent tracking system called Sistema de Información sobre Donaciones (Information System on Donations) after Tropical Storm Agatha to show how donations were spent, keeping the process accountable and minimizing corruption.
Audits and improved records are another promising route for reducing corrupt practices. Avis, Ferraz, and Finan (2018) study official corruption audits released by the Brazilian government and find that public audits meaningfully reduced subsequent corruption in the same municipality. Also, public information about corruption significantly strengthened electoral accountability, with politicians exposed as corrupt less likely to achieve reelection.
Another way to improve responses to climate hazards through better information is making relief payments contingent on prespecified and public thresholds to facilitate monitoring. Boudreau (2015) provides evidence that Mexican leaders are more likely to declare a drought during election years but that the use of prespecified parametric thresholds may discipline politicians and mitigate election-year bias in declaring climate-led emergencies.
Unfortunately, many LAC countries still lack strong grievance and redress mechanisms (GRMs), which are critical tools for keeping public officers accountable to vulnerable groups in times of crisis. Some countries have no formal GRMs at all or still rely on outdated systems such as appointment books and Excel spreadsheets. Honduras briefly piloted GRMs, including a complaint website for real-time reports during the 2020 Eta and Iota hurricanes under the Bono Vida Mejor conditional cash transfer program. Going forward, investing in modern GRMs backed by case management tools is key to boost accountability and responsiveness to vulnerable populations.
Ultimately, even if the right incentives are identified and information is available, change can be slow—or stalled—without the funding to back it up. The next section looks at how governments can secure the resources they need for adaptation.
Adaptation finance in LAC comes from many sources: governments, the private sector, nongovernmental organizations, philanthropies, and community groups. The biggest chunk is international public finance, delivered via grants, loans, and equity. Funding in the region is heavily concentrated in Brazil, Colombia, Costa Rica, and Mexico. From 2003 to 2023, multilateral climate funds approved $5.7 billion for 614 projects in the region, with three major funds—the Green Climate Fund, Clean Technology Fund, and Amazon Fund—making up 67 percent of that total (refer to box 4.3) (Climate Funds Update 2024).
According to the United Nations Framework Convention on Climate Change, LAC, for the period 2015–16, obtained 22 percent of climate financing from multilateral climate funds.
The Green Climate Fund (GCF) is the biggest player in climate finance in the region, backing 37 projects in 13 countries with $2.42 billion between 2003 and 2023. In 2023 alone, it invested $43 million in Colombia and $33 million in Bolivia. Other major sources include the Clean Technology Fund ($718 million via the World Bank) and Brazil’s Amazon Fund ($684 million in grants) (Climate Funds Update 2024). Bilateral donors such as Germany and the United Kingdom also play a role. Since 2015, GCF has mobilized more than $40 billion (including cofinancing) for climate projects in more than 100 countries.
The Global Environment Facility (GEF), active since 1991, offers grants and low-interest funds to help developing countries tackle big environmental issues. For Latin American countries, GEF approved $623.8 million across 144 projects between 2003 and 2023 (Climate Funds Update 2024). These projects cover climate action, biodiversity, forests, land use, and water protection. GEF also teams up with governments,
nongovernmental organizations, and the private sector to make sure efforts are sustainable. Its support has enabled countries to adopt solutions they could not afford alone while building local skills and long-term impact.
At the 2023 United Nations Climate Change Conference, held in the United Arab Emirates, countries reached a landmark agreement to create a loss and damage fund—the first of its kind—to support developing nations most vulnerable to the impacts of climate hazards. For the first time, there will also be a concrete timeline to develop metrics for tracking and measuring adaptation progress. The Adaptation Fund, established under the United Nations Framework Convention on Climate Change, has also played a significant role in supporting climate adaptation in LAC. As of 2024, it has approved 42 projects in the region, totaling approximately $315 million in grants, focusing on areas such as agriculture, water management, and disaster risk reduction (Adaptation Fund 2024).
The last major financing tool for adaptation in LAC is global green bonds, which rely heavily on private sector involvement. In 2022, green bond issuances from the region hit $5.3 billion—a 48 percent drop from the year before, reflecting a broader global slowdown. Still, by year-end, total green bond issuance in LAC reached $42.4 billion, making up 4 percent of the region’s bond market. Brazil led with $15.2 billion, mostly from nonfinancial corporations, followed by Chile ($12.7 billion) and Mexico ($3.3 billion). Since 2020, countries such as
Bermuda, the British Virgin Islands, the Dominican Republic, and Guatemala have also joined the green bond market. Nonfinancial corporations dominate this market (53 percent), whereas sovereign issuers make up 19 percent. Financial corporations more than doubled their volume—from $2.1 billion to $4.5 billion— boosting their share to 10 percent. Meanwhile, development banks and local governments saw their shares shrink to 11 percent and 1.5 percent, respectively, over the same period (Climate Bonds Initiative 2022).
Climate financing for adaptation in LAC: Too little, too slow
LAC needs around $34 billion (2023 prices) a year for climate adaptation (UNEP 2025), but current funding is not even close. Wealthy countries promised $100 billion a year by 2020 to help poorer nations tackle climate change, but they have fallen short. Climate change, however—and the lack of resources to adapt to its consequences—is not just a LAC problem. If countries in the region cannot adapt to climate change, the ripple effects—such as crop failures, hurricanes, and other climate hazards—can drive migration into wealthier nations, too.5 Meanwhile, reports keep sounding the alarm that the funding gap is growing, just as climate impacts worsen and rich countries are pulling back on their aid for climate adaptation efforts (UNEP 2025).
A large fraction of adaptation finance to date has been handed out as loans, which countries may struggle to repay given the conditions faced in relation to their debt. It is notably unclear whether they can assume further commitments as borrowers, given the magnitude of the resources required.
Critics also say that even the money that is delivered often misses the mark, lacking focus and impact where it is most needed (Carty, Kowalzig, and Zagema 2020). Some studies reveal that countries facing the highest climate vulnerability tend to receive a smaller proportion of climate-specific overseas development assistance in relation to their total overseas development assistance, with Latin America being a notable case (Development Initiatives 2023).
On top of this, adaptation still gets only a small slice of climate finance, with just $0.8 billion going to it, compared with $3.6 billion for mitigation such as forest projects (Climate Funds Update 2024). Institutions such as the World Bank have taken note of this situation and the urgent need to shift priorities.
According to the World Bank’s (2025) LAC Adaptation Action Plan, the region’s adaptation share of climate cobenefits over the past five fiscal years is 34 percent, which remains below the 50 percent target.
The bottom line is that climate finance is falling way short. There is more focus on mitigation and not enough grants, and the money is often not going where it is most needed. To truly boost climate resilience—especially on the ground— smarter financing, more private sector engagement, and funding that actually matches real adaptation needs are needed.
Multilateral development banks (MDBs) such as the World Bank have long been central to development finance. Looking ahead, they could play a big role in funding the adaptation efforts to tackle climate hazards. Boosting their capital, using innovative financial tools, and partnering with the private sector can help them scale up lending and impact.
Starting with more capital, some argue it is time to simplify climate finance because, in the current setup, funding is spread across many institutions and hard to navigate. Streamlining it into fewer funds with shared rules would make it easier for countries to access support. Pouring more money into MDBs could also boost impact: By some estimates, every $1 in capital can unlock $4–$5 in loans. That is much more bang for the buck than one-to-one funding models such as the Green Climate Fund (refer to Ocampo 2025).
MDBs can also help scale up adaptation efforts in LAC by pulling in more funding and attracting private investment through smart policies and innovative finance tools. Blended finance, which mixes development bank funds with private capital, helps lower risk and unlock investment in areas such as climate-smart farming, water systems, and insurance. Resilience bonds, which link financial returns to achieving climate goals, support projects such as green infrastructure and flood defenses. Chapter 3 showed how, for instance, protecting green areas and index insurance can help communities that need it most. Unlocking more capital to finance those policies through clear rules and solid partnerships between governments, MDBs, and investors would go a long way.
A great example of a resilience bond in Latin America is the one issued in 2023 by Fideicomisos Instituidos en Relación con la Agricultura (FIRA) (a trust fund managed by the Central Bank of Mexico). It was the region’s first green resilience bond and raised about $165 million in local currency. The money is going toward climate-smart investments in Mexico’s agriculture sector— helping farmers and rural supply chains better handle the impacts of climate hazards. Working with partners such as the French Development Agency, the Global Green Growth Institute, and UKPact Mexico, FIRA (2023) identified 88 eligible investment types across food and rural sectors.
Another creative way to fund adaptation is through debt-for-nature swaps or Blue Bonds, which can be thought of as refinancing a mortgage, but for a country’s debt. Basically, lenders cut countries some slack on their debt in exchange for environmental commitments, such as cutting emissions or protecting ecosystems. Banks still profit by reselling the debt. These swaps have been around for a while (the World Bank wrote about them in Ochiolini 1990) but only recently gained traction.
Take the case of Ecuador: In May 2023, it pulled off the biggest deal on Blue Bonds yet, turning $1.6 billion of debt into a commitment to protect the Galapagos. With help from Credit Suisse, Ecuador bought back its debt for $644 million, saving around $1 billion over 17 years. In return, it pledged to invest $18 million a year in conservation. The new Galapagos Bond, worth $656 million, is backed by the United States’ Development Finance Corporation (Whiting 2024).
Beyond private investment, regional cooperation is key to scaling up adaptation. By pooling resources and tapping into global funds, countries can boost their resilience. The Caribbean Catastrophe Risk Insurance Facility (CCRIF), highlighted in box 3.2 in chapter 3, shows how nations can team up to manage climate risks and access quick postdisaster payouts. MDBs could continue expanding this model—by subsidizing premiums for insurance, like CCRIF—to give more Latin American and Caribbean countries better financial protection and soften the blow of climate hazards that materialize. MDBs can also continue strengthening the climate resilience of countries through tools such as catastrophe-deferred drawdown options (see note 8 in chapter 3), giving countries quick access to funding during crises. But it is important to strike a balance; more lending should not come at the cost of long-term debt sustainability.
At the national level, governments can help to attract private money into financing climate adaptation through stronger legal frameworks and adequate regulations and facilitating better access to climate risk data. Other public instruments such as guarantees, concessional loans, tax breaks, and blended finance can also lower risk and make adaptation projects more attractive. Governments can also offer technical support and help build a pipeline of projects, making it easier for the private sector to step in and invest. For instance, experiences outside the region offer insights for LAC countries to involve the private sector in climate insurance (refer to box 4.4).
A good example of public-private collaboration is the Disaster Risk Insurance and Finance in Central America Consortium, launched in 2022 by the World Bank, the World Food Programme, and the Partnership for Central America. The consortium shows how teaming up with local insurers and financial institutions can boost financial climate resilience. It focuses on creating largescale climate-related agriculture insurance for smallholder farmers in El Salvador, Guatemala, and Honduras. The initiative expands access to credit and increases lending capacity by reducing the perceived risk of climate-induced agricultural losses (World Bank 2024b).
This report focuses on LAC, but there is a lot to learn from other regions. A recent World Bank study highlights how different players are boosting resilience in ways LAC could adapt (World Bank 2024a).
In Zambia, NWK Agri-Services runs a weather index insurance scheme that now covers 52,000 farmers—without subsidies. It fronts the insurance premiums and inputs, and farmers pay back with their crops. When drought hit in 2015–16, payouts helped 23,000 farmers bounce back while also strengthening business ties.
The Philippines demonstrates how a comprehensive, layered approach to disaster risk financing can scale resilience across sectors while expanding private sector involvement. Over the past decade, the government has developed one of the most sophisticated disaster risk finance and insurance strategies among emerging economies. It combines national-level contingent credit lines, catastrophe bonds,
parametric insurance, and subsidies for agricultural insurance to protect households, farmers, and critical public infrastructure. A key element of this strategy was the expansion of agricultural insurance for smallholder farmers through the Philippine Crop Insurance Corporation (PCIC), a public entity now overseen by the Department of Finance. The government injected more than $500 million in premium subsidies to increase insurance uptake among vulnerable farmers, with coverage reaching more than 3 million farmers and fisherfolk by 2021. Recognizing the need to improve efficiency and sustainability, the government has since begun reforming the PCIC to adopt more market-based principles and bring in private insurers. Under this evolving public-private partnership, the government is leveraging the PCIC’s institutional capacity and the operational strengths of private insurers to co-deliver insurance products.
In Brazil, the International Finance Corporation (IFC) and Inter-American Development Bank partnered with Itaú Unibanco on a $250 million bond issuance to fund biodiversity restoration and inclusive finance. As the anchor investor, IFC contributed up to $200 million to support projects such as the REVERTE Program, which aims to restore 1 million hectares of degraded land by 2030 and to scale up credit access for micro-, small, and medium enterprises (IFC 2025).
A final point worth making is that national governments can build trust with donors and attract more private investment in adaptation by boosting transparency and accountability in climate funding. Aligning adaptation goals with national plans and budgets helps countries tap into more funding—both local and global—while ensuring long-term resilience. Strengthening national adaptation plans and embedding these measures into development plans, poverty reduction strategies, and sector budgets are critical for making the most of available resources. The latest UNEP Global Climate Adaptation Gap Report (UNEP 2025) shows that although some 172 countries have national adaptation policies, strategies, or plans in place, many still lack reliable data, timelines, and
cost estimates, limiting their impact. In Latin America, closing these gaps and linking policies to broader climate and development strategies will better direct resources where they are needed most. Although more funding for adaptation is necessary, the next section examines how to do more with the resources governments already have.
CBA has proved a particularly valuable tool to evaluate the efficacy of competing adaptation policies and investments. An investment is deemed worthwhile when its benefits outweigh costs, and governments should pick the option with the highest benefit-cost ratio (UNFCCC 2009; World Bank and UN 2010).6 The Global Commission on Adaptation (2019), for instance, shows big payoffs—from 2:1 to up to 10:1 benefit-cost ratios—for things such as early warning systems, critical infrastructure, dryland farming, and mangrove protection.
In a region such as LAC facing increasing climate risks and constrained financial resources, CBA provides a framework for allocating resources effectively. However, there is a need to move beyond conventional CBAs to account for trade-offs as well as broader welfare impacts that often arise with these projects to ensure that adaptation investments are both effective and equitable. Recent efforts and proposals move in this direction (refer to box 4.5).
Traditional CBAs miss out on bigger benefits related to human welfare and ecosystem services. If one looks at physical capital only, the true value of adaptation measures could be underestimated—CBAs should consider beyond the conventional costs and benefits, adding lives saved and welfare improvements. For instance, research in Nicaragua shows that bridges do not just stop flash floods, they keep people working, improve market access, spur farm investments, and bump up savings (Brooks and Donovan 2020). Cartwright et al. (2013) illustrate this approach by proposing an expanded framework where CBAs go beyond gross domestic product— tracking how many people benefit and how often and who is getting the most out of it.
Putting a dollar value on things such as ecosystems or human life is difficult. Markets only show value in exchange, not true worth, and ethical factors are just as important as the numbers. Good economists know their tools have limits. Valuing life is tricky and controversial, but ignoring it would mean valuing it at zero. So, economists estimate by using the Value of Statistical Life (VSL), the value a person attaches to their own life, which is based on how much extra pay someone demands for a riskier job. VSL comes from revealed preferences (not from surveys, which is an alternative but highly flawed technique) but results in a wide range of values, in part because of data and technique limitations. Even with these limits, VSL is still useful for CBA, as long as its assumptions and ethical trade-offs are clearly understood and explicitly stated.
Governments and development agencies have launched a variety of policies intended to stabilize livelihoods in the face of climate hazards and promote economic resilience. However, absent a reliable measure of resilience, it is hard to gauge the efficacy of these policies and whether the pursuit of resilience is in fact wise public policy. Only at the latest United Nations Climate Change Conference in 2023 was a roadmap to arrive at an agreed-on set of metrics and tools to measure resilience established.
One proposal for measuring resilience at the household level draws on insights from the economics literature on the responsiveness of household consumption and income to shocks. The idea is to measure resilience using standard impact evaluation and matching techniques by comparing a household’s actual income or consumption after a shock with a counterfactual showing what it would have been without the shock (Alloush and Carter 2024). This approach, however, requires panel data.
Some adaptation strategies shift risks over time, making it hard to weigh costs and benefits. For example, seawalls might hold off rising seas for now, but if sea levels rise faster than expected, seawalls could backfire. Levees are another case—they prevent small floods but can cause major damage if they fail, or they might protect some areas while redirecting floodwater to poorer communities downstream. Research supports this. Bro, Moran, and Calvi (2018) examined the impacts of the Belo Monte hydropower dam in Northern Brazil and found that it slightly boosted cocoa farming but hurt rural jobs and food production over a decade. Similarly, Duflo and Pande (2007) found that big dams in India helped farms downstream but worsened poverty near the dams. Even shortterm solutions like dams or reservoirs can make long-term problems worse. For example, in Chile, a megadrought since 2010 has led the government to overuse groundwater, helping temporarily but draining reserves and threatening future water security (Jódar et al. 2024; Taucare et al. 2024).
It is also important to think about trade-offs between generations: What helps people today might hurt people in the future. Discount rates are often used to weigh these trade-offs, but they come with built-in assumptions that can oversimplify the complexities of climate adaptation. If not used carefully, they can lead to bad decisions, especially in contexts in which socioeconomic disparities are pronounced. Take again the example of embankments: They might protect one area now but push flood risks onto others—or future generations. These tools can be useful, but only if one is honest about their limits and applies them thoughtfully, especially when equity is on the line (refer to box 4.6).
Compounding these challenges is the uncertainty regarding future climate change. Despite significant advancements in climate science, it remains impossible to accurately forecast the likelihood or magnitude of specific climate events in particular locations within defined timeframes. This uncertainty complicates efforts to calculate the benefits of adaptation investments in a given sector or place, further underscoring the importance of flexible, longterm strategies that can accommodate a wide range of potential futures.
In a region with some of the worst income inequality in the world, making sure the financing of climate adaptation is equitable should be a top priority. The most vulnerable people are often hit hardest by climate hazards, but these inequalities are often overlooked when assessing climate risks and designing adaptation interventions. Although economists have pointed out these issues in theory, there is still not much hard data—and even less of it actually gets used in real planning (Josephson et al. 2024).
Adaptation projects can unintentionally deepen inequality. Big infrastructure investments often favor wealthier urban areas, and poorer or informal communities get left behind or face even greater risk. Traditional cost-benefit analyses (CBAs) usually do not factor in these imbalances, which end up benefiting high-value assets and wealthier populations. This means some communities benefit while others lose out, and for marginalized groups, the upfront costs of adaptation can outweigh the (discounted future) long-term gains.
One way to make CBAs fairer is by using distributional weights—basically, adjusting the
value of benefits depending on who gets them. The idea is simple: A dollar means a lot more to someone with a low income than it does to someone who is already well off. In theory, this could shift focus toward projects that help the poorest people; in practice, however, distributional weights are rarely used because people worry that they are arbitrary, not transparent, and might distort incentives (Watkiss and Cimato 2016). That said, there are ways to bring fairness into CBAs. The International Institute for Environment and Development, for example, piloted a stakeholder-driven approach to CBA in five countries, including Bolivia (Lunduka, Bezabih, and Chaudury 2012). They looked at urban water supply projects, measuring not just economic efficiency but also who wins and who loses across different social groups. This approach made trade-offs clearer, facilitated dialogue, and helped in picking strategies that better served those who are most vulnerable. It showed that factoring in distributional impacts can make adaptation efforts both fairer and more effective.
Governments can maximize the impact of adaptation finance by clearly showing the economic and social benefits of competing priorities, backed by solid data and CBAs. Yet, effective adaptation for poor households can be stifled by political failures. Protective infrastructure and zoning often benefit wealthier households, creating an uneven distribution of resources. Policies meant to address market failures can go unimplemented, progress too slowly, or fail altogether. The reasons for this gap are not fully clear, and understanding of them remains limited. Political institutions can also play a significant role in hindering adaptation, and the next and final section dives into these challenges.
In a seminal paper, Kahn (2005) finds that economic development and higherquality institutions—measured by democracy, inequality, ethnic fragmentation,
and the World Bank’s good governance index—reduce deaths from natural hazards across 73 countries. Good institutions allow land markets to function properly, regulate development in hazardous locations, and provide infrastructure that lowers climate risk while promoting growth and better adaptation. But this prescription seems almost tautological: If a government is poorly run, it cannot do a good job anyway. By contrast, countries with good institutions would face low costs for developing effective institutions for adaptation. The real question is this: How can a country make its political institutions work to improve the climate adaptation of its poorest households and communities?
Why poor people make certain choices about where they live or work is not always fully understood. When it comes to adapting to climate risks, it might be more effective to give them better information and suitable incentives. This section argues that to be effective, a government’s own incentives also need to align with supporting the adaptation efforts of poor individuals. In simple terms, these incentives are shaped by political institutions, or the rules of the game that influence behavior across political, social, and economic spheres (North 1990).
A background paper for this report presents a political economy framework to assess whether politicians’ incentives align with promoting climate adaptation for poor individuals (Arias, Kennard, and Verley 2024). The core idea is that politicians prioritize staying in power, shaping policies and budgets to secure support. To do so, they must maintain a winning coalition—that is, the minimum number of backers needed to stay in office. Leaders secure loyalty by distributing public goods (for example, early warning systems, dams, clean water) and private goods (benefits exclusive to their supporters). Ultimately, their policy decisions create winners and losers.
The background paper by Arias, Kennard, and Verley (2024) highlights three ways political institutions can shape the way politicians provide climate adaptation policies—and how to fix them when needed.
1. Elections and accountability matter. Competitive elections are essential for ensuring that governments respond to public needs, including climate adaptation. However, although elections promote responsiveness, very frequent election cycles can also create short time horizons, incentivizing visible, short-term actions over longer-term, less-tangible investments such as adaptation. The goal is to balance electoral accountability with space for long-term planning.
2. Clientelism undermines adaptation. When politicians trade favors (exchange of goods or services) for votes, long-term climate adaptation suffers because politicians often favor short-term handouts over long-term adaptation. In clientelistic democracies, power lies with local brokers who mobilize votes through handouts. As a result, the poorest individuals, those with the least influence and more needs, lose out. Giving them real electoral influence helps, but this does not automatically imply that local communities always know best.
3. Access to information empowers citizens. Educated, informed voters and communities can hold leaders accountable and demand better climate action. Because political incentives sharpen in election years, weak adaptation for poor individuals is ultimately a political failure, not just a technical or financial one.
The next sections test these ideas across different policy areas and how to overcome them.
Clientelistic practices are common across Latin American countries. Surveys show vote buying is widespread. González-Ocantos and Oliveros (2019) analyzed the 2014 round of the Latin American Public Opinion Project’s AmericasBarometer data and found self-reported clientelism in every country, although rates varied. About half reported 0–10 percent direct experience; most of the rest reported 10–20 percent; and the Dominican Republic was highest at 24.4 percent. Observed clientelism rates were even higher, topping 30 percent in the Dominican Republic and more than 20 percent in Brazil, Haiti, Honduras, and Paraguay. Only nine countries had observed rates below 10 percent. True clientelism likely falls between direct and observed rates.
In cities, clientelist parties target poor individuals with selective benefits in exchange for votes. This focus is not random but by design—immediate handouts are more valuable to poorer voters who face job insecurity, short time horizons, and limited access to resources. In Latin America, clientelism is especially common in urban slums. Studies show high rates of vote buying in Argentina (Murillo, Oliveros, and Zarazaga 2021); Brusco, Nazareno, and Stokes (2004) find that almost half (44 percent) of respondents to a survey after the 2001 national legislative elections reported receiving food, clothing, medicine, and construction materials in exchange for political support. This can weaken essential services, including those needed for climate resilience.
Clientelism hinders adaptation: Many Latin American cities have widespread unregulated housing, with settlements vulnerable to floods and landslides (Auerbach et al. 2018). When residents do not officially own their homes, they rely on politicians for basic services and eviction protection, making them easy targets for political favors (Larreguy, Marshall, and Trucco 2015). In other words, their informality makes service provision highly discretionary and attractive for clientelism, further complicating resilience efforts. For instance, Auerbach (2016) shows that in Indian slums, areas with stronger political party networks get better infrastructure and services. These areas are not necessarily those most exposed to climate hazards.
Another way through which clientelism affects urban adaptation is by shaping how building codes are enforced—or ignored. When social programs fall short as political tools, leaders often turn to forbearance—strategic nonenforcement of laws affecting poor people (Holland 2017). This is again especially common in informal settlements, where residents lack property rights and face the threat of
eviction, making them vulnerable to political pressure. Holland (2017) documents widespread forbearance-as-clientelism in Latin America’s urban slums. In the context of climate adaptation, this is especially risky, because weak enforcement of building and safety codes undermines climate risk prevention (Levitt et al. 2019).
Corruption can also hurt urban adaptation by making people less willing to follow costly building codes. Levitt et al. (2019) analyzed the 2014 AmericasBarometer data and found that when people perceive high corruption, they are less likely to invest in safe construction. Interestingly and consistent with the following discussion regarding voter myopia, living in climate hazard prone areas did not make much difference—people were still not more willing to comply.
A promising way to fight clientelism (and improve adaptation) in poor urban areas is by giving people secure property rights. A 30-year study in Mexico found that land titling cuts the electoral vote share of incumbent municipal leaders, those best placed to engage in clientelistic extortion, limiting their ability to exploit voters. In Chile, Collado and Wang (2020) found that better land rights led to more investment in energy efficiency, home upgrades, and access to banking, showing just how powerful secure ownership can be to build resilience without engaging in clientelism.
Involving community members directly in budget decisions, a practice known as participatory budgeting (PB), promotes transparency and also reduces opportunities for clientelism and social exclusion. This approach has been successful in various contexts, with the most extensively studied case being Porto Alegre, Brazil. A review paper indicates that PB was used to allocate approximately 20 percent of the municipal budget through citizen deliberation, leading to significant improvements in public service delivery, particularly in low-income neighborhoods (Islam 2025). However, the effectiveness of this model can vary on the basis of factors such as political commitment, resource availability, and the strength of civil society. In some cases, PB has become a routine, technocratic exercise or has been undermined by partisan interests. Despite these challenges, the broader experience with PB demonstrates that when embedded in a supportive institutional context, it can function as both a redistributive and a democratizing tool that enhances the equity and efficiency of public budgeting.
In addition, two broad sets of measures may help (1) defining what public policy seeks to accomplish and having other (independent) bodies evaluate whether the goals were accomplished ensures both learning and accountability and (2) disclosing everything to the public by default generally promotes the growth of institutions of public oversight.
As noted in chapter 3, paying communities to preserve their forests can prevent logging or land conversion for farming. Another policy route is regulation— limiting deforestation directly rather than through pricing. Governments could
expand protected areas, restrict land use, or better enforce existing deforestation limits.
Ultimately, national policies to protect forests, whether through pricing mechanisms or regulations, need local government support to work. Even if detailed data on illegal deforestation exist (from sources such as the Hansen et al. 2013 Global Forest Change Dataset, or MapBiomas), political will is essential for action (Burgess, Costa, and Olken, forthcoming). In Brazil, deforestation was sky high from 2001 to 2005 but dropped sharply from 2006 to 2013 after tougher fines, enforcement, and satellite monitoring (Balboni et al. 2023). Yet, political interests can hinder progress, as seen when deforestation surged again in 2014 amid the dismantling of environmental regulation and agencies. Most research on the politics of deforestation in Latin America focuses on Brazil because of the prominence of the Amazon, the world’s largest tropical rainforest—larger than the entire European Union.
Designating protected areas can be used as a political tool. Because conservation can hurt local economies, national leaders sometimes declare protected zones to punish opponents or reward allies. In Brazil, the president can create protected areas by executive order. Magonnet, Kopas, and Urpelainen (2022) found that municipalities in this country led by opposition mayors between 1997 and 2012 were 26–32 percent more likely to be designated as protected areas, likely to preserve economic benefits for politically aligned regions.
Local officials may also turn a blind eye to illegal deforestation before elections if it helps their chances of winning, especially through campaign contributions. Logging brings profits, benefiting both loggers and politicians. Pailler (2018) found that in Brazil, deforestation was 8–10 percent higher in election years when incumbents sought reelection, likely to fund campaigns. Similarly, Harding et al. (2023) showed that in Colombia, mayors relying on private funding enforced forestry laws less strictly than those using public funds.
These examples show how political cycles fuel deforestation, with clientelism driving permit handouts and weakening enforcement, especially in the Amazon. The big question is how to incentivize politicians and civil servants to shift from forest destruction to conservation.
Although rigorous studies on shifting politicians’ incentives for forest conservation are limited, some research suggests that information campaigns, empowered voters, monitoring, transparency, and voter pressure can change bureaucratic behavior and influence political incentives, helping to hold politicians accountable even for their environmental decisions. For example, a study of natural resource management in Ecuador between 1997 and 2008 found that local governments were incentivized to pursue costly reforms, such as reforestation projects, because of the presence of organic political parties and participatory decision-making institutions (Kauffman and Terry 2016). Organic parties are electoral vehicles created by social movements to advance their interests from within the political system. The study found that these
parties provided formal ties between local politicians and social movements, making elected officials more accountable to a mobilized civil society and promoting innovative policy reforms. In this way, institutions that link politicians with a mobilized civil society can incentivize elected officials to pursue reforms that improve government performance.
A study in Brazil found that random audits of municipal governments, which publicly disclosed how incumbent mayors used federal funds, led to a significant reduction in corruption levels over a 10-year period. This finding highlights the effectiveness of transparency and monitoring mechanisms in promoting accountability in local governance (Avis, Ferraz, and Finan 2018).
Stronger local monitoring can help curb tree cover loss by empowering Indigenous and local communities, who often manage forests better than outsiders. In the Peruvian Amazon, a study tested a program that transferred early deforestation alerts from the Global Forest Watch network to Indigenous communities. Trained and incentivized community members then patrolled their forests in response. The program, randomly assigned to 39 of 76 communities, found that those with local patrols actually saw less tree cover loss than those without them (Slough, Kopas, and Urpelainen 2021).
Reforms that enhance the representation of Indigenous groups may also create powerful incentives for local leaders to advocate for sustainable forestry and— more important—put in power the very people with the local expertise and precise information to be able to tackle deforestation. Some evidence in favor of this proposal comes from a wholly different geographic context yet may hold important lessons for the LAC region: Gulzar, Lal, and Pasquale (2024) find that increasing representation of scheduled tribes in local government in India led to significant increases in tree cover and reductions in deforestation.
Countries can cut rates of tropical forest loss if they garner the political will to do so, and the countries that have accomplished this can provide lessons for others.
There is plenty of evidence that prevention beats disaster relief, yet politicians and voters keep choosing the latter. Investing in dams and other protective infrastructure (including in natural assets such as forests and mangroves), as well as early warning systems, could save lives and cut costs, as chapter 3 shows, but, instead, people wait for climate hazards to occur. Countries, and particularly poor countries, may prefer the immediate economic gains from exploitation to the uncertain future returns from conservation and prevention. Moreover, and strangely enough, there is a wide range of evidence showing that climate hazards can actually help incumbents stay in power. As it turns out, bad climate policy can be good politics.
Early studies from India and the United States show that although voters blame politicians for climate hazards turned into disasters, they reward them for
handing out postdisaster aid (Cole, Healy, and Werker 2012; Healy and Malhotra 2009). Healy and Malhotra’s (2009) groundbreaking research on the United States reveals that voters applaud disaster relief spending but ignore preparedness investments. They argue that politicians cater to the voters’ shortterm desire for instant gratification, but the reality is more complex.
Studies across Latin America show the same pattern: Voters reward politicians who provide disaster relief. Aid becomes a political tool, boosting reelections. In Colombia, flood-hit areas (2010–11) saw a 23 percent rise in incumbent support because of food aid, not infrastructure (Gallego 2018). In Mexico, politicians declare emergencies more often during election years to sway voters (Boudreau 2015). In Brazil, drought relief follows the same pattern (Bedran-Martins and Lemos 2017). Experimental evidence shows drought-stricken residents are more likely to seek personal favors from politicians, reinforcing clientelist ties (Bobonis et al. 2022). How can politicians be incentivized to prioritize preventive spending over relief spending—and prevent misuse of relief funds for clientelism while ensuring they reach those who are most vulnerable?
Anticipatory cash transfers are given before shocks hit and are based on a forecast. They can be a starting point for preemptive measures that are more politically attractive rather than waiting for a crisis to occur. Instead of replacing relief, they actually strengthen it by showing the clear benefits of early action to help people avoid losses and bounce back faster, making it more appealing for politicians to act before a crisis (refer to box 4.7).
One idea that has been gaining increasing traction under adaptive social protection is to focus on anticipatory transfers and early response systems. Countries such as Bangladesh, Nepal, Niger, and Nigeria have used safety nets to deliver support before climate hazards hit. Politicians still get credit for helping victims, but earlier action leaves households better off. For instance, anticipatory cash transfers in Bangladesh reduced food insecurity by 36 percent in flood-prone households while protecting assets and improving children’s nutrition (Pople et al. 2021). This approach relies on predictive analytics and early warning systems to forecast extreme weather events with sufficient confidence, triggering the prearranged release of emergency cash several
days before flooding peaks. In the 2020 Jamuna River pilot, vulnerable households received mobile money transfers ahead of the flood, allowing them to prepare and avoid more damaging coping strategies. This contrasts with traditional humanitarian responses that often take weeks or months to mobilize after a climate hazard has occurred.
Similarly, in Niger, the government piloted an anticipatory cash transfer program in 2021 that used satellite-based drought triggers to deliver early support before the lean season. The early transfers improved food security by 8 percent, raised monthly food consumption by 17.6 percent, and boosted life satisfaction and mental health (Pople et al. 2024). More important, these benefits persisted even after
Box 4.7 Anticipatory transfers and funding to adapt safety nets against climate shocks (continued)
the transfers ended, with households that received early transfers maintaining better food security and well-being during the lean season than those who received traditional or smaller, spread-out transfers. The study highlights how well-timed support, based on early warning systems, can significantly improve outcomes for vulnerable households facing realized climate hazards.
Politicians still need to get the money to fund relief efforts. Mali offers one model: After years of investing in scalable safety nets, it now combines contingency funds and sovereign insurance to fund responses. During the 2023–24 drought, this approach delivered emergency cash to 140,000 households—the first time that insurance directly supported a national safety net in Africa (World Bank 2024b).
Anticorruption audits and town hall meetings have shown success in curbing clientelism in climate-hazard-prone contexts. Bobonis et al. (2022) analyze randomized audits in Brazil, demonstrating their efficacy in reducing campaign handouts, citizen demands for private goods, and politicians’ fulfillment of requests. Similarly, the provision of goods susceptible to political capture drastically reduces such practices (refer to box 4.8). In contexts in which town hall meetings are prevalent, debates can be instrumental in combating clientelism. An experimental study in Benin (Fujiwara and Wantchekon 2011) examined the impact of town hall meetings based on programmatic, nonclientelist platforms. The study found that such meetings reduced the prevalence of clientelism and did not affect voter turnout. This suggests that informed public deliberation can diminish clientelist practices.
Like an onion, possible improvements to reduce clientelism have several layers: better voter education at the individual level, mechanisms of community and possibly local government oversight (the role of the press), and competitive democracies at the political level. But arrangements that work well in one country need not be mimicked in another; indeed, many diverse arrangements may serve the purpose well.
It should be noted that high-level political will should not come at the expense of sound technical cadres and systems in place across multiple agencies. From environmental science to climate risk finance, governments need to build knowledge and skill sets in ministries of planning, social development, central banks, and insurance regulators. This includes strengthening the ability to interpret climate data, design risk-informed policies, and deploy financial tools such as insurance or contingency financing. Countries that have been able to move up the capabilities ladder have done so by investing in their civil services, retaining technical staff, and enabling coordination across levels of government.
Bobonis et al. (2022) examine a randomized controlled trial based on a water cistern construction program in partnership with a nongovernmental organization in the Brazilian northeast in which households were randomly assigned to receive water cisterns for free or were assigned to the control group. The cisterns were built during 2012, before October’s 2012 municipal election. The rain-fed water cisterns were a strategy for low-income rural households to cope with droughts, thus reducing vulnerability and their need to depend on politicians for water supplies (a common clientelistic feature of the region).
The water cistern intervention yielded promising outcomes: It lessened economic vulnerability, diminished clientelism, and hindered the reelection prospects of incumbent mayors. Citizens who received cisterns significantly reduced their requests for private goods from politicians by 17 percent, with a 3 percentage point decrease. This decline persisted not only during the election year, but also afterward. Notably, the impact was most pronounced among citizens engaged in clientelist relationships, with their requests dropping by 38 percent, compared with no effect for those without such ties.
Beyond communities and governments, multilateral agencies such as the World Bank may also have a role to play in helping to better align political institutions with pro-poor climate adaptation. It is easy—and all too common—to consider country and government synonymous, but although climate hazards hit private households and businesses the hardest, loans and aid flow to governments. This can make governments more accountable to donors than to their own people, hence the saying “he who pays the piper calls the tune.” To fix this, climate hazard relief should be independent of political discretion. Understanding that a country’s decision-making system matters more, a setup akin to a Project Implementation Unit under a World Bank project could reduce inefficiencies and political interference. Leveraging existing institutional incentives could also ensure that donor funds prioritize prevention. Strong commitments— through local laws or international agreements—could tie aid more directly to preventive spending. This approach aligns with the International Bank for Reconstruction and Development’s Development Policy Loan with catastrophedeferred drawdown options, which pushes to have strong macroeconomic policies and disaster risk management frameworks in place. There is still room for a more assertive approach, linking support to clear prevention benchmarks.
In sum, insufficient or ineffective climate adaptation policies for poor individuals are rooted in politics, not just technical, financial, or resources challenges. Government responses to climate hazard that materialize can also be driven by political economy concerns that operate during climate crises.
Governments respond to various pressures because politicians and other decision-makers respond to incentives, as noted earlier (for example, election contributions and votes). Donors should continue providing technical assistance but also be alert to bad decisions that could result from misaligned
incentives, not just the lack of knowledge. This final section has acknowledged some of those incentives and explored ways to leverage existing resources and make the most out of them.
Overall, understanding how individuals—rich and poor alike—make decisions is important to improve concern for their welfare. Why people choose what they do and where they live is not always understandable. Following Greenstone and Jack (2015), the report identified four key factors influencing the effectiveness of climate response: low income levels, high adaptation costs, political economy considerations, and market failures. To overcome these factors and attain successful adaptation, the report proposes four elements:
1. Providing incentives for individuals and politicians to adopt climate-resilient measures;
2. Leveraging information and technology generated by governments, multilateral organizations such as the World Bank, and the private sector;
3. Securing investments to adequately fund adaptation endeavors; and
4. Establishing multiple institutions (for example, media to inform the public, political parties to compete for votes, and technocrats to discuss the technical merits of alternatives) to facilitate adaptation at various government levels and ensure checks and balances.
All efforts should have be focused on the poorest households and regions, given their high vulnerability to climate hazards.
1. Some research from development economics (Oster 2005) argues that because of the multitude of risks often faced by individuals in poor countries, discount rates are likely to be higher than in the developed world.
2. The Akerlof-type market for lemons is a situation in which information asymmetry between buyers and sellers leads to market failure. Buyers cannot distinguish between high-quality (peaches) and low-quality (lemons) products, so they offer a lower price, driving good-quality products (peaches) out of the market and leaving only low-quality goods (lemons) (Akerlof 1970).
3. Globally, it is the same story—no evidence of a decline in population growth for cities in low-income countries that have faced repeated flooding in the past. See Gandhi et al. (2024).
4. CAPRA kicked off in 2008 as a joint effort by several big players—including the UN, World Bank, Inter-American Development Bank, and regional disaster prevention groups—to strengthen institutional capacities in Central America to better understand and manage disaster risks. It provided a Geographic Information System–based platform to assess hazards such as earthquakes, floods, hurricanes, landslides, and volcanoes, giving decision-makers tools to plan at local, national, and regional levels. Supported by international donors such as Australia, Spain, and the Global Facility for Disaster Reduction and Recovery, CAPRA has been run by Universidad de los Andes (Uniandes) since 2017, after it was selected through a competitive World Bank–led process.
5. Climate hazards in LAC—particularly heat and drought—are associated with increased rural-to-urban and international migration. In Mexico, high temperatures reduce local employment and contribute to internal migration as well as migration to the United States, especially among unskilled workers and youth (Baez et al. 2017; Jessoe, Manning, and Taylor (2018).
6. Although this section discusses the challenges with the CBA approach, they are applicable to other, less common approaches such as the cost-effectiveness analysis (World Bank and UN 2010).
Adaptation Fund. 2024. Annual Performance Report for the Fiscal Year 2024. Washington, DC: Adaptation Fund. https://www.adaptation-fund.org/wp-content /uploads/2024/09/AFB.EFC_.34.8_Annual-Performance-Report-for-FY24.pdf
Akerlof, George A. 1970. “The Market for Lemons: Quality Uncertainty and the Market Mechanism.” Quarterly Journal of Economics 84 (3): 488–500.
Alloush, Mo, and Michael Carter. 2024. “On the Definition and Estimation of Economic Resilience Using Counterfactuals.” Working Paper 33290, National Bureau of Economic Research, Cambridge, MA.
Arias, Eric, Amanda Kennard, and Dawson Verley. 2024. “The Political Economy of ProPoor Climate Adaptation in Latin America and the Caribbean.” Background paper, Adapting to Adversity: Poverty and Climate Risks in Latin America and the Caribbean, World Bank, Washington, DC.
Aristizábal Giraldo, Edier Vicente, Edwin García Aristizábal, Roberto Marín Sánchez, Federico Gómez Cardona, and Juan Carlos Guzmán Martínez. 2020. “Rainfall-Intensity Effect on Landslide Hazard Assessment Due to Climate Change in North-Western Colombian Andes.” Revista Facultad de Ingeniería Universidad De Antioquia (103): 51–66. https://doi.org/10.17533/udea.redin.20201215.
Auerbach, Adam M. 2016. “Clients and Communities: The Political Economy of Party Network Organization and Development in India’s Urban Slums.”
World Politics 1: 111–48.
Auerbach, Adam M., Adrienne LeBas, Alison E. Post, and Rebecca Weitz-Shapiro. 2018. “State, Society and Informality in Cities of the Global South.” Studies in Comparative International Development 53: 261–80.
Avis, Eric, Claudio Ferraz, and Frederico Finan. 2018. “Do Government Audits Reduce Corruption? Estimating the Impacts of Exposing Corrupt Politicians.” Journal of Political Economy 126 (5): 1912–64.
Baez, Javier, German Caruso, Valerie Mueller, and Chiyu Niu. 2017. “Heat Exposure and Youth Migration in Central America and the Caribbean.” American Economic Review 107 (5): 446–50.
Balboni, Clare, Aaron Berman, Robin Burgess, and Benjamin A. Olken. 2023. “The Economics of Tropical Deforestation.” Annual Review of Economics 15: 723–54.
Bargsted, Matías, Nicolás M. Somma, and Juan Carlos Castillo. 2017. “Political Trust in Latin America.” In Handbook on Political Trust, edited by Sonja Zmerli and Tom W. G. van der Meer, 395-417. Cheltenham, UK: Edward Elgar. Bedran-Martins, Ana Maria, and Maria Carmen Lemos. 2017. “Politics of Drought under Bolsa Família Program in Northeast Brazil.” World Development Perspectives 7–8: 15–21.
Benami, Elinor, and Michael R. Carter. 2021. “Can Digital Technologies Reshape Rural Microfinance? Implications for Savings, Credit, & Insurance.” Applied Economic Perspectives and Policy 43 (4): 1196–220.
Benami, Elinor, Zhenong Jin, Michael R. Carter, Aniruddha Ghosh, Robert J. Hijmans, Andrew Hobbs, Benson Kenduiywo, and David B. Lobell. 2021. “Uniting Remote Sensing, Crop Modelling and Economics for Agricultural Risk Management. Nature Reviews Earth and Environment 2 (2): 140–59.
Bloch, Robin, Nikolaos Papachristodoulou, Rawlings Miller, Jose Monroy, Tinguist Fisseha, Lorenas Trejos, Melanie S. Kappes, and Beatriz Pozueta. 2014. “Lessons from Urban Risk Assessments in Latin American and Caribbean Cities.” Development in Practice 24 (4): 502–13.
Bobonis, Gustavo J., Paul J. Gertler, Marco Gonzalez-Navarro, and Simeon Nichter. 2022. “Vulnerability and Clientelism.” American Economic Review 112 (11): 3627–59.
Bosi, Martina, and Beatriz Eraso Puig. 2017. “From Slums to Neighborhoods: How Energy Efficiency Can Transform the Lives of the Urban Poor.” World Bank Blogs, May 25, 2017. https://blogs.worldbank.org/en/energy/slums-neighborhoods -how-energy-efficiency-can-transform-lives-urban-poor
Boudreau, Laura. 2015. Discipline and Disasters: The Political Economy of Mexico’s Soverign Disaster Risk Financing Program. Policy Brief 128, Fondation pour les Études et Recherches sur le Développment International, Clermont-Ferrand, France. https://ferdi.fr/dl/df-xpNsUiGwTXFBebzSuXdiBhmW/ferdi-b128-discipline -anddisasters-the-political-economy-of-mexico-s.pdf
Bro, Aniseh S., Emilio Moran, and Miqéias Freitas Calvi, M. 2018. “Market Participation in the Age of Big Dams: The Belo Monte Hydroelectric Dam and Its Impact on Rural Agrarian Households.” Sustainability 10 (5): 1592.
Brooks, Wyatt, and Kevin Donovan. 2020. “Eliminating Uncertainty in Market Access: The Impact of New Bridges in Rural Nicaragua.” Econometrica 88 (5): 1965–97.
Brusco, Valeria, Marcelo Nazareno, and Susan C. Stokes. 2004. “Vote Buying in Argentina.” Latin American Research Review 39 (2): 66–88.
Burgess, Robin, Francisco Costa, and Benjamin A. Olken. Forthcoming. “National Borders and the Conservation of Nature.” Unpublished manuscript. Journal of the European Economic Association
Carter, Michael R. 2013. “Sharing the Risk and the Uncertainty: Public-Private Reinsurance Partnerships for Viable Agricultural Insurance Markets.” Policy Brief B78, Fondation pour les Études et Recherches sur le Développment International, Clermont-Ferrand, France. https://ferdi.fr/dl/df-xpNsUiGwTXFBebzSuXdiBhmW /ferdi-b128-discipline-anddisasters-the-political-economy-of-mexico-s.pdf
Cartwright, Anton, James Blignaut, Martin De Wit, Karen Goldberg, Myles Mander, Sean O’Donoghue, and Debra Roberts. 2013. “Economics of Climate Change Adaptation at the Local Scale under Conditions of Uncertainty and Resource Constraints: The Case of Durban, South Africa.” Environment and Urbanization 25 (1): 139–56.
Carty, Tracy, Jan Kowalzig, and Bertram Zagema. 2020. “Climate Finance Shadow Report 2020: Assessing Progress towards the $100 Billion Commitment.” Briefing Paper, Oxfam, Oxford, UK. https://oxfamilibrary.openrepository.com/bitstream /handle/10546/621066/bp-climate-finance-shadow-report-2020-201020-en .pdf;jsessionid=AF2E622851E428F376E1603E942A05CF?sequence=1
C40 Cities. 2016. “Cities100: Medellín—Restoring Ecosystems Provides Opportunities for Locals.” https://www.c40.org/case-studies/cities100-medellin-restoring-ecosystems -provides-opportunities-for-locals/
Chambers, Bill. 2005. “The Barriadas of Lima: Slums of Hope or Despair? Problems or Solutions?” Geography 90 (3): 200–24.
Climate Bonds Initiative. 2022. Latin America and the Caribbean: Sustainable Debt State of the Market 2022. London: Climate Bonds Initiative. https://www.climatebonds .net/files/documents/publications/cbi_lac_sotm_2022_en__0.pdf.
Climate Funds Update. 2024. “Climate Finance Regional Briefing: Latin America.” https://climatefundsupdate.org/publications/climate-finance-regional-briefing-latin -america-2024/.
Cole, Shawn, Andrew Healy, and Eric Werker. 2012. “Do Voters Demand Responsive Governments? Evidence from Indian Disaster Relief.” Journal of Development Economics 97 (2): 167–81.
Collado, José Rafael Núñez, and Han-Hsiang Wang. 2020. “Slum Upgrading and Climate Change Adaptation and Mitigation: Lessons from Latin America.” Cities 104: 102791.
Davila, Julio D. 2021. “Medellín’s Low-Carbon Metrocables Lifting Informal Barrios Out of Poverty.” ReVista, October 18, 2021. https://revista.drclas.harvard.edu/medellins -low-carbon-metrocables/ D’Aoust, Olivia, Alejandro de la Fuente, and Nancy Lozano Gracia. 2025. “Strengthening the Resilience of the Urban Poor against Urban Floods.” Background paper, Adapting to Adversity: Poverty and Climate Risks in Latin America and the Caribbean, World Bank, Washington, DC. de Andrade, Matheus Gouvea. 2023. “How Medellín Is Beating the Heat with Green Corridors.” BBC, September 22, 2023. https://www.bbc.com/future/article /20230922-how-medellin-is-beating-the-heat-with-green-corridors Development Initiatives. 2023. “Climate Vulnerability, Climate Finance (ODA) and Protracted Crisis.” Bristol, UK: Development Initiatives. https://devinit.org/resources /climate-finance-vulnerability-crisis/Working Druckenmiller, Hannah, Yanjun (Penny) Liao, Sophie Pesek, Margaret Walls, and Shan Zhang. 2023. “Can Removing Development Subsidies Promote Adaptation? The Coastal Barrier Resources System as a Natural Experiment.” Working Paper, Lincoln Institute of Land Policy, Cambridge, MA.
Duflo, Esther, and Rohini Pande. 2007. “Dams.” Quarterly Journal of Economics 122 (2): 601–46.
Duggan, Stuart. 2015. “The Forecast for Weather Technology.” Sky News, July 17, 2015. https://news.sky.com/story/the-forecast-for-weather-technology-10352228.
Dunn, Claire, and Isabel Laterzo. 2021. “State-Level Citizen Response to COVID-19 Containment Measures in Brazil and Mexico.” Journal of Politics in Latin America 13 (3): 328–57.
Field, Erica. 2005. “Property Rights and Investment in Urban Slums.” Journal of the European Economics Association 3 (2/3): 279–90.
Field, Erica. 2007. “Entitled to Work: Urban Property Rights and Labor Supply in Peru.” Quarterly Journal of Economics 122 (4): 1561–602.
FIRA (Fideicomisos Instituidos en Relación con la Agricultura). 2023. “FIRA-Banco de Mexico Places in the Stock Market, the First Green Resilience Bond in Latin America.” Press release, April 25, 2023. https://www.fira.gob.mx/SalaPrensaXml /Pdf?pdfNum=540
Fujiwara, Thomas, and Leonard Wantchekon. 2011. “Can Informed Public Deliberation Overcome Clientelism? Experimental Evidence from Benin.” American Economic Journal Applied Economics 5 (4): 241–55.
Galiani, Sebastián, Paul J. Gertler, Raimundo Undurraga, Ryan Cooper, Sebastián Martínez, and Adam Ross. 2017. “Shelter from the Storm: Upgrading Housing Infrastructure in Latin American Slums.” Journal of Urban Economics 98: 187–213.
Galiani, Sebastián, and Ernesto Schargrodsky. 2010. “Property Rights for the Poor: Effects of Land Titling.” Journal of Public Economics 94 (9–10): 700–29.
Gallego, Jorge. 2018. “Natural Disasters and Clientelism: The Case of Floods and Landslides in Colombia.” Electoral Studies 55: 73–88.
Gandhi, Sahil, Matthew E. Kahn, Rajat Kochhar, Somik Lall, and Vaidehi Tandel. 2024. “Adapting to Flood Risk: Evidence from a Panel of Global Cities.” Working Paper 30137, National Bureau of Economic Research, Cambridge, MA.
Global Commission on Adaptation. 2019. Adapt Now: A Global Call for Leadersip on Climate Resilience. Rotterdam, the Netherlands: Global Center on Adaptation.
González-Ocantos, Ezequiel, and Virginia Oliveros. 2019. “Clientelism in Latin American Politics.” In Oxford Research Encyclopedia of Politics. https://doi.org/10.1093/acrefore /9780190228637.013.1677
Greenstone, Michael, and B. Kelsey Jack. 2015. “Envirodevonomics: A Research Agenda for an Emerging Field.” Journal of Economic Literature 53 (1): 5-42.
Gulzar, Saad, Apoorva Lal, and Benjamin Pasquale. 2024. “Representation and Forest Conservation: Evidence from India’s Scheduled Areas.” American Political Science Review 118 (2): 764–83.
Hansen, M. C., P. V. Potapov, R. Moore, M. Hancher, S. A. Turubanova, A. Tyukavina, D. Thau, et al. 2013. “High-Resolution Global Maps of 21st-Century Forest Cover Change.” Science 342 (6160): 850–3. https://doi.org/10.1126/science.1244693.
Harding, Robin, Mounu Prem, Nelson A. Ruiz, and David L. Vargas. 2023. “Buying a Blind Eye: Campaign Donations, Regulatory Enforcement, and Deforestation.” American Political Science Review 118 (2): 635–53.
Healy, Andrew, and Neil Malhotra. 2009. “Myopic Voters and Natural Disaster Policy.” American Political Science Review 103 (3): 387–406.
Hess, Jeremy J., Sathish Lm, Kim Knowlton, Shubhay Saha, Priya Dutta, Parthasarathi Ganguly, Abhiyant Tiwari, et al. 2018. “Building Resilience to Climate Change: Pilot Evaluation of the Impact of India’s First Heat Action Plan on All-Cause Mortality.” Journal of Environmental and Public Health 2018: 7973519.
Holland, Alisha C. 2017. Forbearance as Redistribution: The Politics of Informal Welfare in Latin America. New York: Cambridge University Press.
IFC (International Finance Company). 2025. “IFC and IDB Invest Forge Partnership with Itaú Unibanco to Issue First Bond with a Focus in Biodiversity and Social Initiatives in Brazil.” Press release, March 20, 2025. https://www.ifc.org/en/pressroom/2025 /ifc-idb-invest-forge-partnership-with-itau-to-first-sustainability-and-social-bond.
Islam, Sazzad. 2025. “Public Finance and Policy Effectiveness A Review of Participatory Budgeting in Local Governance Systems.” Preprint, posted June 13, 2025. https://papers.ssrn.com/sol3/papers.cfm?abstract_id=5287147.
Jessoe, Katrina, Dale T. Manning, and J. Edward Taylor. 2018. “Climate Change and Labor Allocation in Rural Mexico: Evidence from Annual Fluctuations in Weather.” Economic Journal 128 (608): 203–61.
Jódar, Jorge, Javier Urrutia, Christian Herrera, Emilio Custodio Gimena, Sergio MartosRosillo, and L. J. Lambán. 2024. “The Catastrophic Effects of Groundwater Intensive Exploitation and Megadrought on Aquifiers in Central Chile: Global Change Impact
Projections in Water Resources Based on Groundwater Balance Modeling.” Science of the Total Environment 914: 169651.
Jones, Judson. 2023. “Why Hurricane Otis Caught Many by Surprise.” New York Times, October 25, 2023. https://www.nytimes.com/2023/10/25/world/americas/hurricane -otis-mexico-intensity-surprise.html
Josephson, Anna, Rodrigo Guerra Su, Greg Collins, and Katharine Jacobs. 2024. “The Economics of Climate Adaptation: An Assessment.” Preprint, submitted November 25, 2024. https://arxiv.org/abs/2411.16893
Kahn, Matthew E. 2005. “The Death Toll from Natural Disasters: The Role of Income, Geography, and Institution.” Review of Economics and Statistics 87 (2): 271–84.
Kauffman, Craig M., and Will Terry. 2016. “Pursuing Costly Reform: The Case of Ecuadorian Natural Resource Management.” Latin American Research Review 51 (4): 163–85.
Kocormik-Mina, Adriana, Thomas K. McDermott, Guy Michaels, and Ferdinand Rauch. 2020. “Flooded Cities.” American Economic Journal: Applied Economics 12 (2): 25–66.
Kramer, Berber, Peter Hazell, Harold Alderman, Francisco Ceballos, Neha Kumar, and Anne G. Timu. 2022. “Is Agricultural Insurance Fulfilling Its Promise for the Developing World? A Review of Recent Evidence.” Annual Review of Resource Economics 14: 291–311.
Lanjouw, Jean O., and Philip J. Levy. 2022. “Untitled: A Study of Formal and Informal Property Rights in Urban Ecuador.” Economic Journal 112 (482): 986–1019.
Larreguy, Horacio, John Marshall, and Laura Trucco. 2015. “Breaking Clientelism or Rewarding Incumbents? Evidence from an Urban Titling Program in Mexico.” Unpublished manuscript, November 2015, PDF file. https://www.aeaweb.org /conference/2017/preliminary/paper/GNkQ243s
Levitt, Barry S., Vincent T. Gawronski, Gabriela Hoberman, Richard S. Olson, and Vicente Sandoval. 2019. “Public Perceptions of Code Enforcement and Safer Buildings in Latin America and the Caribbean.” Natural Hazards Review 20 (4). https://doi.org/10.1061/(ASCE)NH.1527-6996.0000333
Lunduka, Rodney, Mintewab Bezabih, and Abrar Chaudury. 2012. Stakeholder-Focused Cost-Benefit Analysis in the Water Sector: Synthesis Report. London: International Institute for Environment and Development.
Magonnet, Jorge, Jacob Kopas, and Johannes Urpelainen. 2022. “Playing Politics with Environmental Protection: The Political Economy of Designating Protected Areas.” Journal of Politics 84 (3): 1453–68.
Murillo, M. Victoria, Virginia Oliveros, and Rodrigo Zarazaga. 2021. “The Most Vulnerable Poor: Clientelism among Slum Dwellers.” Studies in Compartive International Development 56: 343–63.
New York Times. 2005. “Artificial Intelligence Gives Weather Forecasters a New Edge.” New York Times, October 23.
North, Douglass. 1990. Institutions, Institutional Change and Economic Performance. Cambridge: Cambridge University Press.
Ocampo, José Antonio. 2025. Financing for Development: The Global Agenda. Cambridge: Cambridge University Press.
Ochiolini, Michael. 1990. “Debt for Nature Swaps.” Policy Research Working Paper 393, World Bank, Washington, DC.
Oster, Emily. 2005. “Sexually Transmitted Infections, Sexual Behavior, and the HIV/AIDS Epidemic.” Quarterly Journal of Economics 120 (2): 467–515.
Pailler, Sharon. 2018. “Re-Election Incentives and Deforestation Cycles in the Brazilian Amazon.” Journal of Environemental Economics and Management 88: 345–65.
Perlman, Janice E. 2010. Favela: Four Decades of Living on the Edge in Rio de Janeiro. Oxford: Oxford University Press.
Pople, Ashley, Ruth Hill, Stefan Dercon, and Ben Brunckhorst. 2021. “Anticipatory Cash Transfers in Climate Disaster Response.” Working Paper 6, Centre for Disaster Protection, London. https://static1.squarespace.com/static/61542ee0a87a394f7bc17b3a /t/616ad24fdbfca62188f8e614/1634390614711/FINAL%2BAnticipatory_Cash Transfers_in_Climate_Disaster_Response%2B%28for%2BWP%29%2BF3.pdf.
Pople, Ashley, Patrick Premand, Stefan Dercon, Margaux Vinez, and Stephanie Brunelin. 2024. “The Earlier the Better? Cash Transfers for Drought Response in Niger.” Policy Research Working Paper 11138, World Bank, Washington, DC. https://hdl.handle .net/10986/43301
Rentschler, Jun, Paolo Avner, Mattia Marconcini, Rui Su, Emanuele Strano, Michalis Vousdoukas, and Stéphane Hallegatte. 2023. “Global Evidence of Rapid Urban Growth in Flood Zones Since 1985.” Nature 622: 87–92.
Slough, Tara, Jacob Kopas, and Johannes Urpelainen. 2021. “Satellite-Based Deforestation Alerts with Training and Incentives for Patrolling Facilitate Community Monitoring in the Peruvian Amazon.” Proceedings of the National Academy of Sciences 118 (29): e2015171118.
Stigler, George J., and Gary S. Becker. 1977. “De Gustibus Non Est Disputandum.” American Economic Review 67 (2): 76–90.
Taucare, Matías, Benoît Viguier, Ronny Figueroa, and Linda Daniele. 2024. “The Alarming State of Central Chile’s Groundwater Resources: A Paradigmatic Case of a Lasting Overexploitation.” Science of Total Environment 906: 167723.
UNEP (United Nations Environment Programme). 2025. Adaptation Gap Report 2025: Running on Empty—The World Is Gearing Up for Climate Resilience—Without the Money to Get There. Nairobi: UNEP. https://wedocs.unep.org/20.500.11822/48798
UNFCCC (United Nations Framework Convention on Climate Change). 2009. “Potential Costs and Benefits of Adaptation Options: A Review of Existing Literature.” Technical Paper. Bonn: UNFCCC. https://unfccc.int/resource/docs/2009/tp/02.pdf
Watkiss, Paul, and Federica Cimato. 2016. “The Economics of Adaptation and ClimateResilient Development: Lessons from Projects for Key Adaptation Challenges.” Working Paper 265, Centre for Climate Change Economics and Policy, London; Working Paper 235, Grantham Research Institute on Climate Change and the Environment, London. https://www.lse.ac.uk/granthaminstitute/wp-content /uploads/2016/05/Working-Paper-235-Watkiss-and-Cimato.pdf.
Whiting, Kate. 2024. “Climate Finance: What Are Debt-for-Nature Swaps and How Can They Help Countries?” World Economic Forum, Forum in Focus, April 26, 2024. https://www.weforum.org/stories/2024/04/climate-finance-debt-nature-swap/.
World Bank. 2023a. Brazil—Green, Resilient, and Inclusive Regeneration of the Central Area of Porto Alegre Project. Washington, DC: World Bank. http://documents .worldbank.org/curated/en/099051823130515835.
World Bank. 2023b. A Strategic Roadmap for Advancing Multi-hazard Impact-based Early Warning Systems and Services in the Caribbean. Washington, DC: World Bank. http://hdl.handle.net/10986/40058.
World Bank. 2024a. Feasibility Study—Disaster Risk Finance and Insurance (DRFI) Solutions for Family Farmers in El Salvador, Guatemala, and Honduras. Washington, DC: World Bank.
World Bank. 2024b. Rising to the Challenge: Success Stories and Strategies for Achieving Climate Adaptation and Resilience: Executive Summary. Washington, DC: World Bank. World Bank. 2025. “LAC’s Adaptation Plan.” Unpublished internal document. World Bank and UN (United Nations). 2010. Natural Hazards, Unnatural Disasters: The Economics of Effective Prevention. Washington, DC: World Bank.
Are the Poor More Exposed to Climate Hazards in Latin America? by Ben J. Brunckhorst, Miki K. Doan, Alejandro de la Fuente, Samuel Freije-Rodríguez, Catalina García, and Minh C. Nguyen
Asset Protection and Disaster Risk Financing to Improve Shock-responsive Social Protection in Latin America and the Caribbean, by Marcos M. Sugastti and Michael R. Carter
Disaster Risk Financing Instruments: A Preliminary Review on the Link with Poverty in Latin America and the Caribbean, by Victor Cárdenas and Salvador Perez Elizondo
Distributional Implications of Enhancing Resilience and Ecosystem Services through Improved Land Use in Latin America, by Sara Turner, Nancy Lozano Gracia, and Peter Hawthorne
Droughts Worsen Air Quality by Shifting Power Generation in Latin America and the Caribbean, by Mathilda Eriksson, Alejandro del Valle, and Alejandro de la Fuente
Housing Vulnerability to Flood Risk: Cases of Chile, Colombia and Mexico, by Sofía Alonso Beltrán, Denisse Rubí Cruz, Alejandrina León Montes, and Juan Soriano Escobedo
Index Disaster Funds Sustain Household Living Standards in Mexico, by Alejandro del Valle, Mathilda Eriksson, Prerna Mishra, and Alejandro de la Fuente
The Political Economy of Pro-Poor Climate Adaptation in Latin America and the Caribbean, by Eric Arias, Amanda Kennard, and Dawson Verley
Strengthening the Resilience of the Urban Poor against Floods, by Olivia D’Aoust, Alejandro de la Fuente, and Nancy Lozano Gracia
Vulnerability to Climate Risk–Induced Poverty in Latin America and the Caribbean, by Alejandro de la Fuente and Monserrat Serio
The terms in this report are used differently across disciplines.
Adaptation is the process of adjustment to actual or expected climate and its effects to moderate harm or exploit beneficial opportunities.
Exposure is the people; livelihoods; species or ecosystems; environmental functions, services, and resources; infrastructure; or assets in places and settings that could be adversely affected by the hazard.
Hazard is the potential occurrence of a natural or human-induced physical event (flood, storm, drought) or trend that may cause loss of life, injury, or other health impacts, as well as damage and loss to property, infrastructure, livelihoods, service provision, ecosystems, and environmental resources. This report focuses on the following climate hazards: drought, floods, storms, landslides, and heat waves.
Poverty Two definitions of poverty are used in this report. A person or household is classified as monetarily poor if their household income (per person) is less than the poverty line. This report uses an international poverty line ($6.85 purchasing power parity 2017 per person per day) as the benchmark for international comparisons. Two poverty measures are used to aggregate poverty status across households: The poverty incidence is the percent of the population living in poor households. The poverty gap measures how far, on average, the poor population is from the total poverty line. A person or household is classified as nonmonetarily poor if they suffer from overlapping deprivations in education, quality of materials in housing, access to services, and lack of durable goods.
Risk is often calculated as a multiplicative function of hazard, exposure, and vulnerability. It is multiplicative because for risk to exist, all three—hazard, exposure, and vulnerability—have to be present.
Vulnerability is the propensity or predisposition to be adversely affected, including sensitivity or susceptibility to harm and lack of capacity to cope and adapt. Some communities absorb and recover more readily than others because of physical assets (building design and strength), social capital (community structure, trust, and family networks), and political access (ability to get government help and affect policies and decisions). Measures to reduce vulnerability include mitigation (which reduces the hazard’s likelihood, as in reforesting slopes to prevent rapid runoff and floods or reducing greenhouse gas emissions to reduce the frequency and intensity of extreme weather events), prevention (measures to reduce damage, as with higher plinths for floods), preparedness (evacuation plans), and relief (help after a disaster).
Source: World Bank staff.
Note: For formal definitions, https://www.ipcc.ch/report/ar6/wg2/downloads /report/IPCC_AR6_WGII_Annex-II.pdf.
How can Latin America and the Caribbean protect their hard-won progress against poverty in the face of mounting climate hazards and a changing climate? This book provides a powerful, evidence-based answer.
Drawing on new data, original research, and previous studies from across the region, Adapting to Adversity examines how climate hazards threaten the livelihoods of the poor and near-poor—and what can be done to strengthen their resilience. It reveals the stark reality that more than a third of the region’s people, including nearly half of all poor households, live in areas highly exposed to droughts, floods, hurricanes, heatwaves, and landslides. For millions living one shock away from falling back into poverty, climate risk is not a future concern but a daily struggle.
This book explores who is most at risk, how climate hazards intersect with poverty and inequality, and what policies are proving most effective. It highlights successful innovations such as early warning systems, catastrophe insurance facilities, and adaptive social protection programs, while exposing the persistent gaps that leave many communities dangerously unprotected. Beyond diagnosis, Adapting to Adversity offers a roadmap for action. It calls for layered, coordinated systems that combine prevention, financial protection, and social safety nets to make development gains durable. With adaptation needs projected to reach $55 billion annually by 2030, the book argues that financing, institutional reform, and political will are critical to turning resilience into reality.
Essential reading for policymakers, development practitioners, and scholars, this book makes a compelling case: in Latin America and the Caribbean, adaptation is not a luxury—it is development itself.
ISBN 978-1-4648-2314-5
SKU 212314