
19 minute read
CHAPTER 3 Literature Review of Approaches Used to Combine Satellite Observations with Ground-Level Monitoring in Urban Areas


3
Literature Review of Approaches Used to Combine Satellite Observations with Ground-Level Monitoring in Urban Areas
Advertisement
The review of the scientific literature focused on identifying approaches to using satellite aerosol-optical-depth (AOD) observations that could provide city-scale, daily average PM2.5 (particulate matter with an aerodynamic diameter less than or equal to 2.5 microns) monitoring in low- and middle-income countries (LMICs). This chapter discusses the approaches used in each of the three key steps in combining satellite observations with ground-level monitoring (GLM) of PM2.5 for estimating ground-level concentrations in a given city:
1. The retrieval of AOD from satellite observations of reflected solar radiation (figure 2.3)
2. The translation of the vertically integrated AOD observation into an estimate of the ground-level PM2.5 concentration, including any bias corrections (figure 2.4) and
3. Simultaneously interpolating these satellite-derived PM2.5 estimates and the available GLM data to high-resolution grids centered on selected cities (figure 3.1).
The major findings of the review are presented below (see also table 3.1). The full literature review is provided in appendix A.
FIGURE 3.1
Annual average ground-level PM10 concentrations, London, UK, and Rome, Italy
a. London b. Rome
42 km
0 57 km

0
Source: Reproduced from Vienneau and others 2013. Note: These images were created by combining ground-layer-monitoring data, satellite aerosol-optical-depth observations, and land-use data in a land-use regression model. km = kilometer; PM10 = particulate matter with an aerodynamic diameter less than or equal to 10 microns.
Although many satellites provide AOD measurements using different approaches (the different estimates are referred to as “AOD products”), only a small number provide global coverage for each day free of charge shortly after the observation is made (that is, in near real-time [nrT]) at a horizontal resolution of 10 kilometers or finer. Table 3.1 summarizes the strengths and limitations of each of these identified nrT satellite AOD products with daily global coverage. The section “Available aerosol-optical-depth products” in appendix A presents a more comprehensive list of satellite products, including those not available in nrT and those that require subscription fees. For polar-orbiting satellites (that is, satellites that observe the entire globe, but at most twice a day), this includes the Moderate-resolution Imaging Spectroradiometer (MODIS) Dark Target algorithm (10-kilometer and 3-kilometer resolution with daily global land and ocean coverage; Levy and others 2013; see figure 3.2); the MODIS Deep Blue algorithm (10-kilometer resolution with daily global land coverage; hsu and others 2013); and the national Oceanic and Atmospheric Administration’s Visible Infrared Imaging radiometer Suite (VIIrS) AOD product (6-kilometer and 750-meter resolution with daily global land and ocean coverage; Jackson and others 2013). Only the MODIS products have had a comprehensive review of their performance, but comparisons with MODIS suggest the VIIrS 750-meter product tends to be biased high in urban and
TABLE 3.1 Strengths and weaknesses of the different daily satellite aerosol-optical-depth products publicly available in near real-time
AOD PRODUCT (AGENCY) ORBIT STRENGTHS
MODIS Dark Target (NASA) Polar • Extensively validated • Global coverage • Easy to access • Includes AOD over both land and ocean
MODIS Deep Blue
(NASA) Polar • Extensively validated • Global coverage • Easy to access • Improved coverage over cities and deserts
WEAKNESSES
• Coarse horizontal resolution (10-kilometer—3-kilometer version much noisier) • Only two observations a day (10:30 and 13:30 local standard time) • No AOD over bright surfaces (deserts, cities)
• Coarse horizontal resolution (10-kilometer—3-kilometer version much noisier) • Only two observations a day (10:30 and 13:30 local standard time) • Only includes AOD over land
MODIS Combined
(NASA) Polar • Extensively validated • Global coverage • Easy to access • Improved coverage over cities and deserts
• Includes AOD over both land and ocean • Coarse horizontal resolution (10-kilometer—3-kilometer version much noisier) • Only two observations a day (10:30 and 13:30 local standard time)
VIIRS
(NOAA) Polar • Global coverage • Includes AOD over both land and ocean
• Finest horizontal resolution for polar orbiting products (6-kilometer and 0.75-kilometer) • Data difficult to access, download cannot be automated • 0.75-kilometer product very noisy and not yet extensively validated • Currently only one observation a day (13:30 local standard time) • No AOD over bright surfaces (deserts, cities)
MSG-SEVIRI SMAOL
(EUMETSAT)
GOES GASP
(NOAA) Geostationary • Extensively validated • High resolution (3-kilometer) • Multiple observations a day • Easy to access Geostationary • Extensively validated • High resolution (4-kilometer) • Multiple observations a day • Coverage only over Africa and Europe • AOD only over land; also excludes most coastal areas
• Coverage only over North and South America • AOD only over land; also excludes most coastal areas • Data difficult to access, download cannot be automated
GOES SMAOD
(NOAA) Geostationary • High resolution (2-kilometer) • Multiple observations a day • Coverage only over North and South America • AOD only over land; also excludes most coastal areas • Data difficult to access, download cannot be automated • New product (starting 2018), needs further evaluation
Source: World Bank. Note: In the context of a satellite measurement of AOD, noise refers to the random errors present in the measurement. Noise can generally be reduced by averaging over a larger area. AOD = aerosol optical depth; EUMETSAT = European Organisation for the Exploitation of Meteorological Satellites; GASP = GOES Aerosol/Smoke Product; GOES = Geostationary Operational Environmental Satellite; MODIS = Moderate-Resolution Imaging Spectroradiometer; MSG-SEVIRI = Meteosat Second Generation–Spinning Enhanced Visible and Infrared Imager; NASA = National Aeronautics and Space Administration; NOAA = National Oceanic and Atmospheric Administration; SMAOD = suspended matter, aerosol optical depth; SMAOL = SEVIRI-MSG Aerosol Over Land; VIIRS = Visible Infrared Imaging Radiometer Suite.
FIGURE 3.2
MODIS Dark Target 10-kilometer and 3-kilometer aerosol-optical-depth products retrieved for clear land and ocean fields of view and the local 5-kilometer average derived from the products, outer circle, compared to ground-based measurements, inner circle, over Baltimore, US
a. MODIS Dark Target 10-kilometer product b. MODIS Dark Target 3-kilometer product
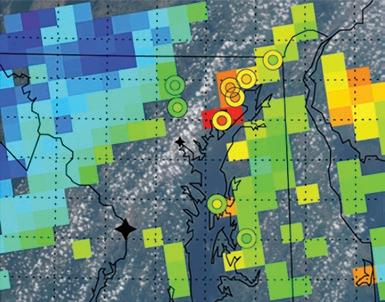
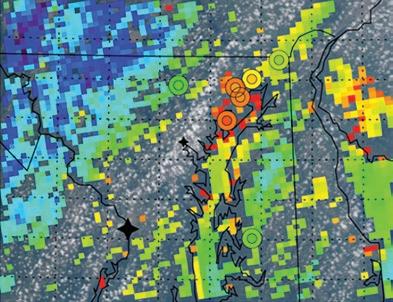
AOD at 0.55 µm
-0.05 0.05 0.15 0.25 0.35 0.45 0.55 0.65 0.75
Source: Munchak and others 2013. Note that these results used an older version of the MODIS surface reflectance scheme, and more recent versions (for example, Gupta and others 2016) show much better performance over urban areas. Note: AOD = aerosol optical depth; MODIS = Moderate-Resolution Imaging Spectroradiometer.
mountainous regions. however, since the MODIS instruments are aging and new VIIrS instruments continue to be launched, the VIIrS products are more likely to be available in the coming decade. There are also several research products, such as extensions of the MODIS Dark Target and Deep Blue algorithms to VIIrS and the MODIS MAIAC algorithm (one-kilometer resolution with daily global coverage; emili and others 2011; Lyapustin and others 2011) that may become operational in the near future. however, at the time this report was prepared, these products were available only for specific test time periods and locations.
For geostationary satellites (that is, satellites that continuously observe a fixed location; figure 3.3), the SMAOL (SeVIrI-MSG Aerosol Over Land) AOD product is available in nrT over europe and Africa (three-kilometer resolution every 15 minutes; Bernard and others 2011; Mei and others 2012), and the GOeS Aerosol/Smoke Product (GASP) AOD product is produced for the continental United States (four-kilometer resolution every hour; Knapp and others 2005). In 2018, the GASP product will be replaced with the GOeS-16 SMAOD (suspended matter, aerosol optical depth) product1,2 covering north and South America (two-kilometer resolution every 15 minutes). himawari provides AOD retrievals over east Asia using an instrument such as GOeS-16,3,4 but the himawari product is not freely available.5,6
Seasonal limitations in satellite coverage may result in biased estimates of annual average PM2.5 concentrations from satellites. The potential
FIGURE 3.3
Example of good-quality aerosol optical depth 550 nm observations from a geostationary satellite from the US GOES-R SMAOD product
AOD
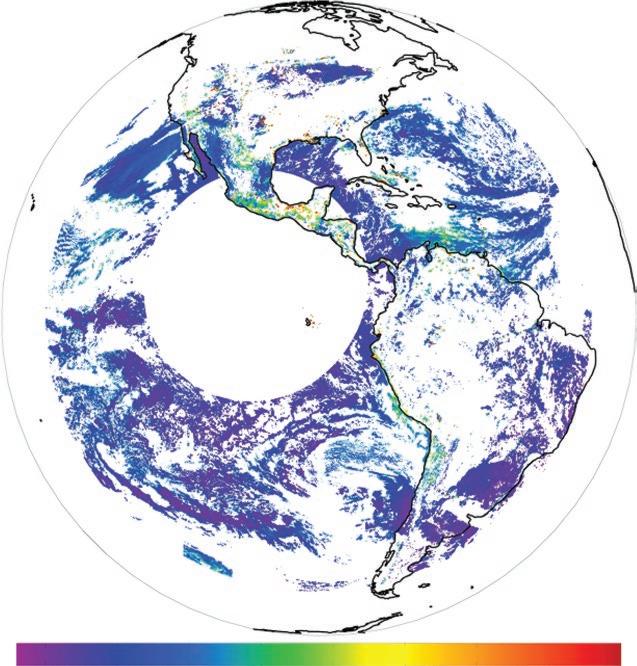
0.00 0.50 1.00 1.50 2.00
Source: World Bank. Note: AOD = aerosol optical depth; GOES-R SMAOD = Geostationary Operational Environmental Satellite-R series–suspended matter, aerosol optical depth; nm = nanometer.
application of the currently available AOD products to three example cities (Delhi, India; Ulaanbaatar, Mongolia; and Lima, Peru) was examined as part of the literature review. none of these cities is currently covered by geostationary satellites with freely available AOD products, but the upcoming geostationary SMAOD product should cover Lima. In general, the MODIS Dark Target algorithm does not provide complete coverage over these cities because of highly reflective surfaces in urban areas, but the MODIS Deep Blue algorithm is able to provide AOD across the city. however, even with the Deep Blue algorithm, frequent clouds in Lima between May and november prevent AOD retrieval during much of this period (figure 3.4), and winter snow cover in Ulaanbaatar between December and March prevents AOD retrievals during this highly polluted season.
FIGURE 3.4
Valid MODIS Terra aerosol-optical-depth retrievals and Lima, Peru, monitoring sites in the OpenAQ database, 2016–17
Lima

MOD satellite points OpenAQ monitor sites
Source: World Bank, produced using Esri ArcGIS. Note: The blue diamonds = valid satellite AOD data and the green triangles = OpenAQ monitoring sites. MOD = MODIS Terra; MODIS = Moderate-Resolution Imaging Spectroradiometer; OpenAQ = openaq.org.
Several studies have successfully converted satellite AOD to ground-level PM2.5 estimates using statistical techniques, chemical transport model (CTM)–based approaches, or hybrid approaches, generally for continental-to-global spatial scales and monthly-to-annual time scales. Statistical approaches train statistical models, such as nonlinear generalized additive models (GAMs; Sorek-hamer and others 2013; Strawa and others 2013), on historical GLM data to predict ground-level PM2.5 using satellite AOD measurements and other meteorological and geographic data. CTM-based approaches use computer models of air quality, called “chemical transport models,” to determine a time-varying relationship between ground-level PM2.5 concentrations and satellite AOD measurements. This relationship is then used to scale the CTM aerosol profile until the CTMcalculated AOD matches the satellite AOD measurement, providing a better estimate of the ground-level PM2.5 concentration than would be possible from the CTM alone. hybrid methods combine statistical and CTM-based approaches by training a statistical model to correct the errors in the initial CTM-based satellite estimates of the ground-level PM2.5 concentrations. For example, recent work
has used a hybrid approach in which CTM-based approaches are followed by a second step that uses geographically weighted regression to correct for errors in the first-step estimates (van Donkelaar, Martin, Spurr, and Burnett 2015). These corrections require long-term (multiple years), reliable GLM data over a large region, including both urban and rural sites (see table 3.2).
Table 3.2 lists the strengths and weaknesses of these approaches. The statistical approaches (for example, Hu and others 2014; Sorek-Hamer and others 2013, 2015; Strawa and others 2013) can be more accurate if sufficient GLM data are available for the training. However, CTM-based approaches (for example, Geng and others 2015; van Donkelaar and others 2006, 2010, 2011; van Donkelaar, Martin, Brauer, and Boys 2015) are required in areas without GLM data or where available GLM data are of unreliable quality. Several potential sources of data are available for planetary boundary layer height and other meteorological parameters for the statistical approaches, as well as sources of CTM AOD and aerosol-profile data for the CTM-based approaches provided free of charge from global CTM run by high-income countries (see the section “Converting AOD to ground-level PM2.5” in appendix A). LMICs, which often face competing needs for limited budgetary resources, may find that the use of freely available data is preferable to the expense of running their own CTMs or paying for data. In that case, the forecasts of ground-level concentrations and vertical profiles of PM2.5 from the National Centers for Environmental Prediction Global Forecast System (Lu, da Silva, and others 2016; Lu, Wei, and others 2016) can be used if NRT output is needed, and the optimized historical ground-level concentrations and vertical profiles of PM2.5 from the National Aeronautics and Space Administration MERRA-2 reanalysis (Provençal and others 2017) can be used for historical studies.
TABLE 3.2 Strengths and weaknesses of different approaches to converting satellite aerosol-opticaldepth data into estimates of ground-level PM2.5 concentrations
APPROACH STRENGTHS WEAKNESSES
CTM-based • Easy to implement globally • Does not require any GLM data • Can remove cases with high-altitude aerosol plumes or low PBL heights from the analysis
Statistical • Locally unbiased (since these methods fit to the average for a single city) • Estimates error in the fit automatically • Does not require an initial guess at the aerosol profile or optical properties
Hybrid • Easy to implement globally • Globally unbiased (since these methods fit to the average for all cities and monitors considered) • Can filter the CTM results for high-altitude aerosol plumes or low PBL heights • Can have significant biases due to errors in the CTM’s simulation of the vertical profile and optical properties of the aerosols • Errors are likely larger for LMICs , since estimates of
PM2.5 emissions are more out-of-date or uncertain for these countries
• Errors are larger if horizontal resolution of the CTM is too coarse and thus a single model PM2.5 value represents an average of PM2.5 in urban and rural air • Requires a long-term (multiple years), reliable GLM data record with concurrent satellite observations
• Cannot filter for high-altitude plumes • Determining appropriate statistical method for a given site can take many attempts • Requires a long-term (multiple years), reliable GLM data record with concurrent satellite observations
• Requires GLM data in many different land-use types (urban and rural sites) • Can still have significant biases at specific sites
Source: World Bank. Note: CTM = chemical transport model; GLM = ground-level monitoring; LMICs = low- and middle-income countries; PBL = planetary boundary layer; PM2.5 = particulate matter with an aerodynamic diameter less than or equal to 2.5 microns.
COMBINING SATELLITE PM2.5 ESTIMATES AND GLM DATA INTO HIGH-RESOLUTION GRIDS CENTERED ON SELECTED CITIES
Co-kriging or land-use regression (LUr) can be used to combine satellite PM2.5 estimates with GLM data to calculate estimates of PM2.5 concentrations at a neighborhood scale (100 to 500 meters) across urban areas. Ordinary kriging uses a weighted average of neighboring GLM measurements to predict PM2.5 concentrations across an urban area. Co-kriging is an extension of ordinary kriging that can take advantage of additional data sets or variables, using both the correlations between the monitors and the cross-correlations between the monitor data and the additional data sets (that is, the satellite-derived PM2.5 estimates) to make better predictions (for example, Millar and others 2010; Pearce and others 2009; wu, winer, and Delfino 2006). LUr spatially links GLM measurements of PM2.5 with other associated variables such as elevation, distance from roads, population density, and land-use type to develop fine-scale estimates of long-term PM2.5 concentrations within an urban area that better represent gradients near highways and other pollution sources than is possible with kriging (for example, Lee, Chatfield, and Strawa 2016; Millar and others 2010; Vienneau and others 2013). LUr can also be used to predict the bias in CTMbased estimates of ground-level PM2.5 concentrations as part of a hybrid approach to using satellites to estimate PM2.5 exposures.
Co-kriging and LUr tend to work better as the satellite horizontal resolution is increased and as the GLM network covers a wider variety of sites (for example, urban and rural). Many GLM networks in LMICs are almost entirely in cities, which makes LUr more difficult because of the lack of variation in land-use parameters (for example, urban land fraction, distance of coasts, and distance from highways) across the network. Co-kriging could be used with satellite PM2.5 estimates to reduce the number of GLM stations required to adequately cover an urban area (see discussion in chapter 5) and can be used to obtain either daily average or annual average estimates of PM2.5. however, this study did not find any example in the literature where co-kriging had previously been used to combine satellite AOD and GLM PM2.5 data. LUr has been successfully used by several groups to provide high horizontal resolution (100- to 500-meter), annual average estimates on PM2.5 across regions and within cities using both satellite and GLM data (for example, Lee, Chatfield, and Strawa 2016; Vienneau and others 2013). Daily average estimates of PM2.5 are also possible if meteorological data that vary daily and other data are used in the LUr. The needed data for LUr at 500-meter resolution is freely available for the entire globe, and most LUr studies have used the ArcGIS software package to perform the regression with geographical information system data sets.
NOTES
1. https://www.goes-r.gov/products/baseline-aerosol-opt-depth.html. 2. https://www.goes-r.gov/downloads/users/conferencesAndevents/2014/GOeS-r_Series _Program/04-Laszlo_abstract.pdf. 3. https://www.eorc.jaxa.jp/ptree/documents/himawari_Monitor_Aerosol_Product_v5.pdf. 4. http://www.data.jma.go.jp/mscweb/technotes/msctechrep61-6.pdf. 5. http://www.jmbsc.or.jp/en/meteo-data.html. 6. http://www.jmbsc.or.jp/en/Data/himawari-8-JMBSC-hP(2017.02.20).pdf.
REFERENCES
Bernard, e., C. Moulin, D. ramon, D. Jolivet, J. riedi, and J.-M. nicolas. 2011. “Description and
Validation of an AOT Product over Land at the 0.6 μm Channel of the SeVIrI Sensor
Onboard MSG.” Atmospheric Measurement Techniques 4: 2543–65. emili, e., A. Lyapustin, Y. wang, C. Popp, S. Korkin, M. Zebisch, S. wunderle, and M. Petitta. 2011. “high Spatial resolution Aerosol retrieval with MAIAC: Application to Mountain regions.” Journal of Geophysical Research 116: D23211. Geng, G., Q. Zhang, r. V. Martin, A. van Donkelaar, h. huo, h. Che, J. Lin, and K. he. 2015.
“estimating Long-Term PM2.5 Concentrations in China Using Satellite-Based Aerosol
Optical Depth and a Chemical Transport Model.” Remote Sensing of Environment 166: 262–70. Gupta, P., r. C. Levy, S. Mattoo, L. A. remer, and L. A. Munchak. 2016. “A Surface reflectance
Scheme for retrieving Aerosol Optical Depth over Urban Surfaces in MODIS Dark Target retrieval Algorithm. ” Atmospheric Measurement Techniques 9: 3293–308. hsu, n. C., M. J. Jeong, C. Bettenhausen, A. M. Sayer, r. hansell, C. S. Seftor, J. huang, and
S. C. Tsay. 2013. “enhanced Deep Blue Aerosol retrieval Algorithm: The Second Generation.”
Journal of Geophysical Research: Atmospheres 118 (16): 9296–315. hu, X., L. A. waller, A. Lyapustin, Y. wang, M. Z. Al-hamdan, w. L. Crosson, M. G. estes,
S. M. estes, D. A. Quattrochi, S. J. Puttaswamy, and Y. Liu. 2014. “estimating Ground-Level
PM2.5 Concentrations in the Southeastern United States Using MAIAC AOD retrievals and a Two-Stage Model.” Remote Sensing of Environment 140: 220–32. Jackson, J. M., h. Liu, I. Laszlo, S. Kondragunta, L. A. remer, J. huang, and h.-C. huang. 2013.
“Suomi-nPP VIIrS Aerosol Algorithms and Data Products.” Journal of Geophysical
Research: Atmospheres 118: 12673–89. Knapp, K. r., r. Frouin, S. Kondragunta, and A. Prados. 2005. “Toward Aerosol Optical Depth retrievals over Land from GOeS Visible radiances: Determining Surface reflectance.”
International Journal of Remote Sensing 26 (18): 4097–116. Lee, h. J., r. B. Chatfield, and A. w. Strawa. 2016. “enhancing the Applicability of Satellite remote Sensing for PM2.5 estimation Using MODIS Deep Blue AOD and Land Use regression in California, United States.” Environmental Science & Technology 50 (12): 6546–55.
Levy, r. C., S. Mattoo, L. A. Munchak, L. A. remer, A. M. Sayer, F. Patadia, and n. C. hsu. 2013.
“The Collection 6 MODIS Aerosol Products over Land and Ocean.” Atmospheric
Measurement Techniques 6: 2989–3034. Lu, C.-h., A. da Silva, J. wang, S. Moorthi, M. Chin, P. Colarco, Y. Tang, P. S. Bhattacharjee,
S.-P. Chen, h.-Y. Chuang, h.-M. h. Juang, J. McQueen, and M. Iredell. 2016. “The
Implementation of neMS GFS Aerosol Component (nGAC) Version 1.0 for Global Dust
Forecasting at nOAA/nCeP.” Geoscientific Model Development 9: 1905–19. Lu, C.-h., S.-w. wei, S. Kondragunta, Q. Zhao, J. McQueen, J. wang, and P. Bhattacharjee. 2016.
“nCeP Aerosol Data Assimilation Update: Improving nCeP Global Aerosol Forecasts Using
JPSS-nPP VIIrS Aerosol Products.” Paper presented at the “8th International Cooperative for
Aerosol Prediction.” http://icap.atmos.und.edu/ICAP8/Day3/Lu_nCeP_ThursdayAM.pdf. Lyapustin, A., Y. wang, I. Laszlo, r. Kahn, S. Korkin, L. remer, r. Levy, and J. S. reid. 2011.
“Multiangle Implementation of Atmospheric Correction (MAIAC): 2. Aerosol Algorithm.”
Journal of Geophysical Research 116: D03211. Mei, L., Y. Xue, G. de Leeuw, T. holzer-Popp, J. Guang, Y. Li, L. Yang, h. Xu, X. Xu, C. Li, Y. wang,
C. wu, T. hou, X. he, J. Liu, J. Dong, and Z. Chen. 2012. “retrieval of Aerosol Optical Depth over Land Based on a Time Series Technique Using MSG/SeVIrI Data.” Atmospheric
Chemistry and Physics 12: 9167–85. Millar, G., T. Abel, J. Allen, P. Barn, M. noullett, J. Spagnol, and P. L. Jackson. 2010. “evaluating human exposure to Fine Particulate Matter Part II: Modeling.” Geography Compass 4 (7): 731–49.
Munchak, L. A., r. C. Levy, S. Mattoo, L. A. remer, B. n. holben, J. S. Schafer, C. A. hostetler, and r. A. Ferrare. 2013. “MODIS 3 km Aerosol Product: Applications over Land in an Urban/
Suburban region.” Atmospheric Measurement Techniques 6: 1747–59.
Pearce, J. L., S. L. rathbun, M. Aguilar-Villalobos, and L. P. naeher. 2009. “Characterizing the
Spatiotemporal Variability of PM2.5 in Cusco, Peru Using Kriging with external Drift.
Atmospheric Environment 43 (12): 2060–69. Provençal, S., V. Buchard, A. M. da Silva, r. Leduc, n. Barrette, e. elhacham, and S. h. wang. 2017. “evaluation of PM2.5 Surface Concentrations Simulated by Version 1 of nASA’s MerrA
Aerosol reanalysis over Israel and Taiwan.” Aerosol and Air Quality Research 17: 253–61. Sorek-hamer, M., I. Kloog, P. Koutrakis, A. w. Strawa, r. Chatfield, A. Cohen, w. L. ridgway, and D. M. Broday. 2015. “Assessment of PM2.5 Concentrations over Bright Surfaces Using
MODIS Satellite Observations.” Remote Sensing of Environment 163: 180–85. Sorek-hamer, M., A. w. Strawa, r. B. Chatfield, r. esswein, A. Cohen, and D. M. Broday. 2013.
“Improved retrieval of PM2.5 from Satellite Data Products Using non-Linear Methods.”
Environmental Pollution 182: 417–23.
Strawa, A. w., r. B. Chatfield, M. Legg, B. Scarnato, and r. esswein. 2013. “Improving retrievals of regional Fine Particulate Matter Concentrations from Moderate resolution Imaging
Spectroradiometer (MODIS) and Ozone Monitoring Instrument (OMI) Multisatellite
Observations.” Journal of the Air & Waste Management Association 63 (12): 1434–46. van Donkelaar, A., r. V. Martin, M. Brauer, and B. L. Boys. 2015. “Use of Satellite Observations for Long-Term exposure Assessment of Global Concentrations of Fine Particulate Matter.”
Environmental Health Perspectives 123 (2): 135–43. van Donkelaar, A., r. V. Martin, M. Brauer, r. Kahn, r. Levy, C. Verduzco, and P. J. Villeneuve. 2010. Global estimates of Ambient Fine Particulate Matter Concentrations from Satellite-
Based Aerosol Optical Depth: Development and Application.” Environmental Health
Perspectives 118 (6): 847–55. van Donkelaar, A., r. V. Martin, r. C. Levy, A. M. da Silva, M. Krzyzanowski, n. e. Chubarova, e. Semutnikova, and A. J. Cohen. 2011. “Satellite-Based estimates of Ground-Level Fine
Particulate Matter during extreme events: A Case Study of the Moscow Fires in 2010.”
Atmospheric Environment 45 (34): 6225–32. van Donkelaar, A., r. V. Martin, and r. J. Park. 2006. “estimating Ground-Level PM2.5 Using
Aerosol Optical Depth Determined from Satellite remote Sensing.” Journal of Geophysical
Research: Atmospheres 111: D21201. van Donkelaar, A., r. V. Martin, r. J. Spurr, and r. T. Burnett. 2015. “high-resolution Satellite-
Derived PM2.5 from Optimal estimation and Geographically weighted regression over north America.” Environmental Science & Technology 49 (17): 10482–91. Vienneau, D., K. de hoogh, M. J. Bechle, r. Beelen, A. van Donkelaar, r. V. Martin, D. B. Millet,
G. hoek, and J. D. Marshall. 2013. “western european Land Use regression Incorporating
Satellite- and Ground-Based Measurements of nO2 and PM10.” Environmental Science &
Technology 47 (23): 13555–64. wu, J., A. M. winer, and r. J. Delfino. 2006. “exposure Assessment of Particulate Matter Air
Pollution before, during, and after the 2003 Southern California wildfires.” Atmospheric
Environment 40 (18): 3333–48.


