7 minute read
Economic Growth, Material Consumption, and Productivity


The rapidly expanding extraction and con‑ sumption of materials, which propelled global economic growth in the past cen tury, is increasing the pressure on, or transgression of, planetary boundaries. Over the past century, the twenty-three-fold growth in global GDP was accompanied by a near parallel increase in material extraction; for every one percent increase in global GDP, material consumption increased by 0.8 percent. Since the beginning of this century alone, the near tripling of GDP increased global material consumption per capita by 30 percent, from approximately 9.4 to 12.27 tons.45 Notwithstanding the contribution of GDP growth to poverty reduction and human development, the linear economic model (take-make-use-dispose) it relies upon, is depleting the Earth’s finite resources and is a major contributor to climate change: extraction and processing of natural resources is responsible for approximately 50 percent of global GHG emissions and over 90 percent of biodiversity loss (UNEP 2019).46 Even with intentional actions to reduce GHG emissions, the emissions-output elasticity stood at an average of 0.6 among the largest emitters (Cohen et al. 2018). In 2021, materials management in industry and agriculture alone accounted for 27 percent of the total 47 gigatons of GHG emissions (Figure 4.1). As such, materials extraction and consumption are said to cause the transgression of several planetary boundaries (Person et al. 2022; Wang-Erlandsson et al. 2022), including biogeochemical cycles, land use, chemical pollution (novel entities), and freshwater change (see Box 4.1 for a discussion of the common challenges EU countries face in controlling pollution).
During the last two decades, economic growth in the EU has been decoupled from material con sumption, mainly due to the decreased consump tion of fossil fuel materials. Between 2000 and 2020, the EU economy expanded by 22.5 percent while domestic material consumption (DMC) dropped from 6.5 to a little over 6 Gigatons, slightly over six percent of total global DMC. This reduction marks an absolute decoupling of economic growth from material consumption. During this period, the share of renewable energy of total energy consumption more than doubled, rising from nine to 22 percent in 2020. The decrease in consumption of fossil fuel materials by over 30 percent accounted for more than 90 percent of the total reduction in DMC. In contrast,
Advertisement
Box 4.1: Pollution Challenges across EU Countries
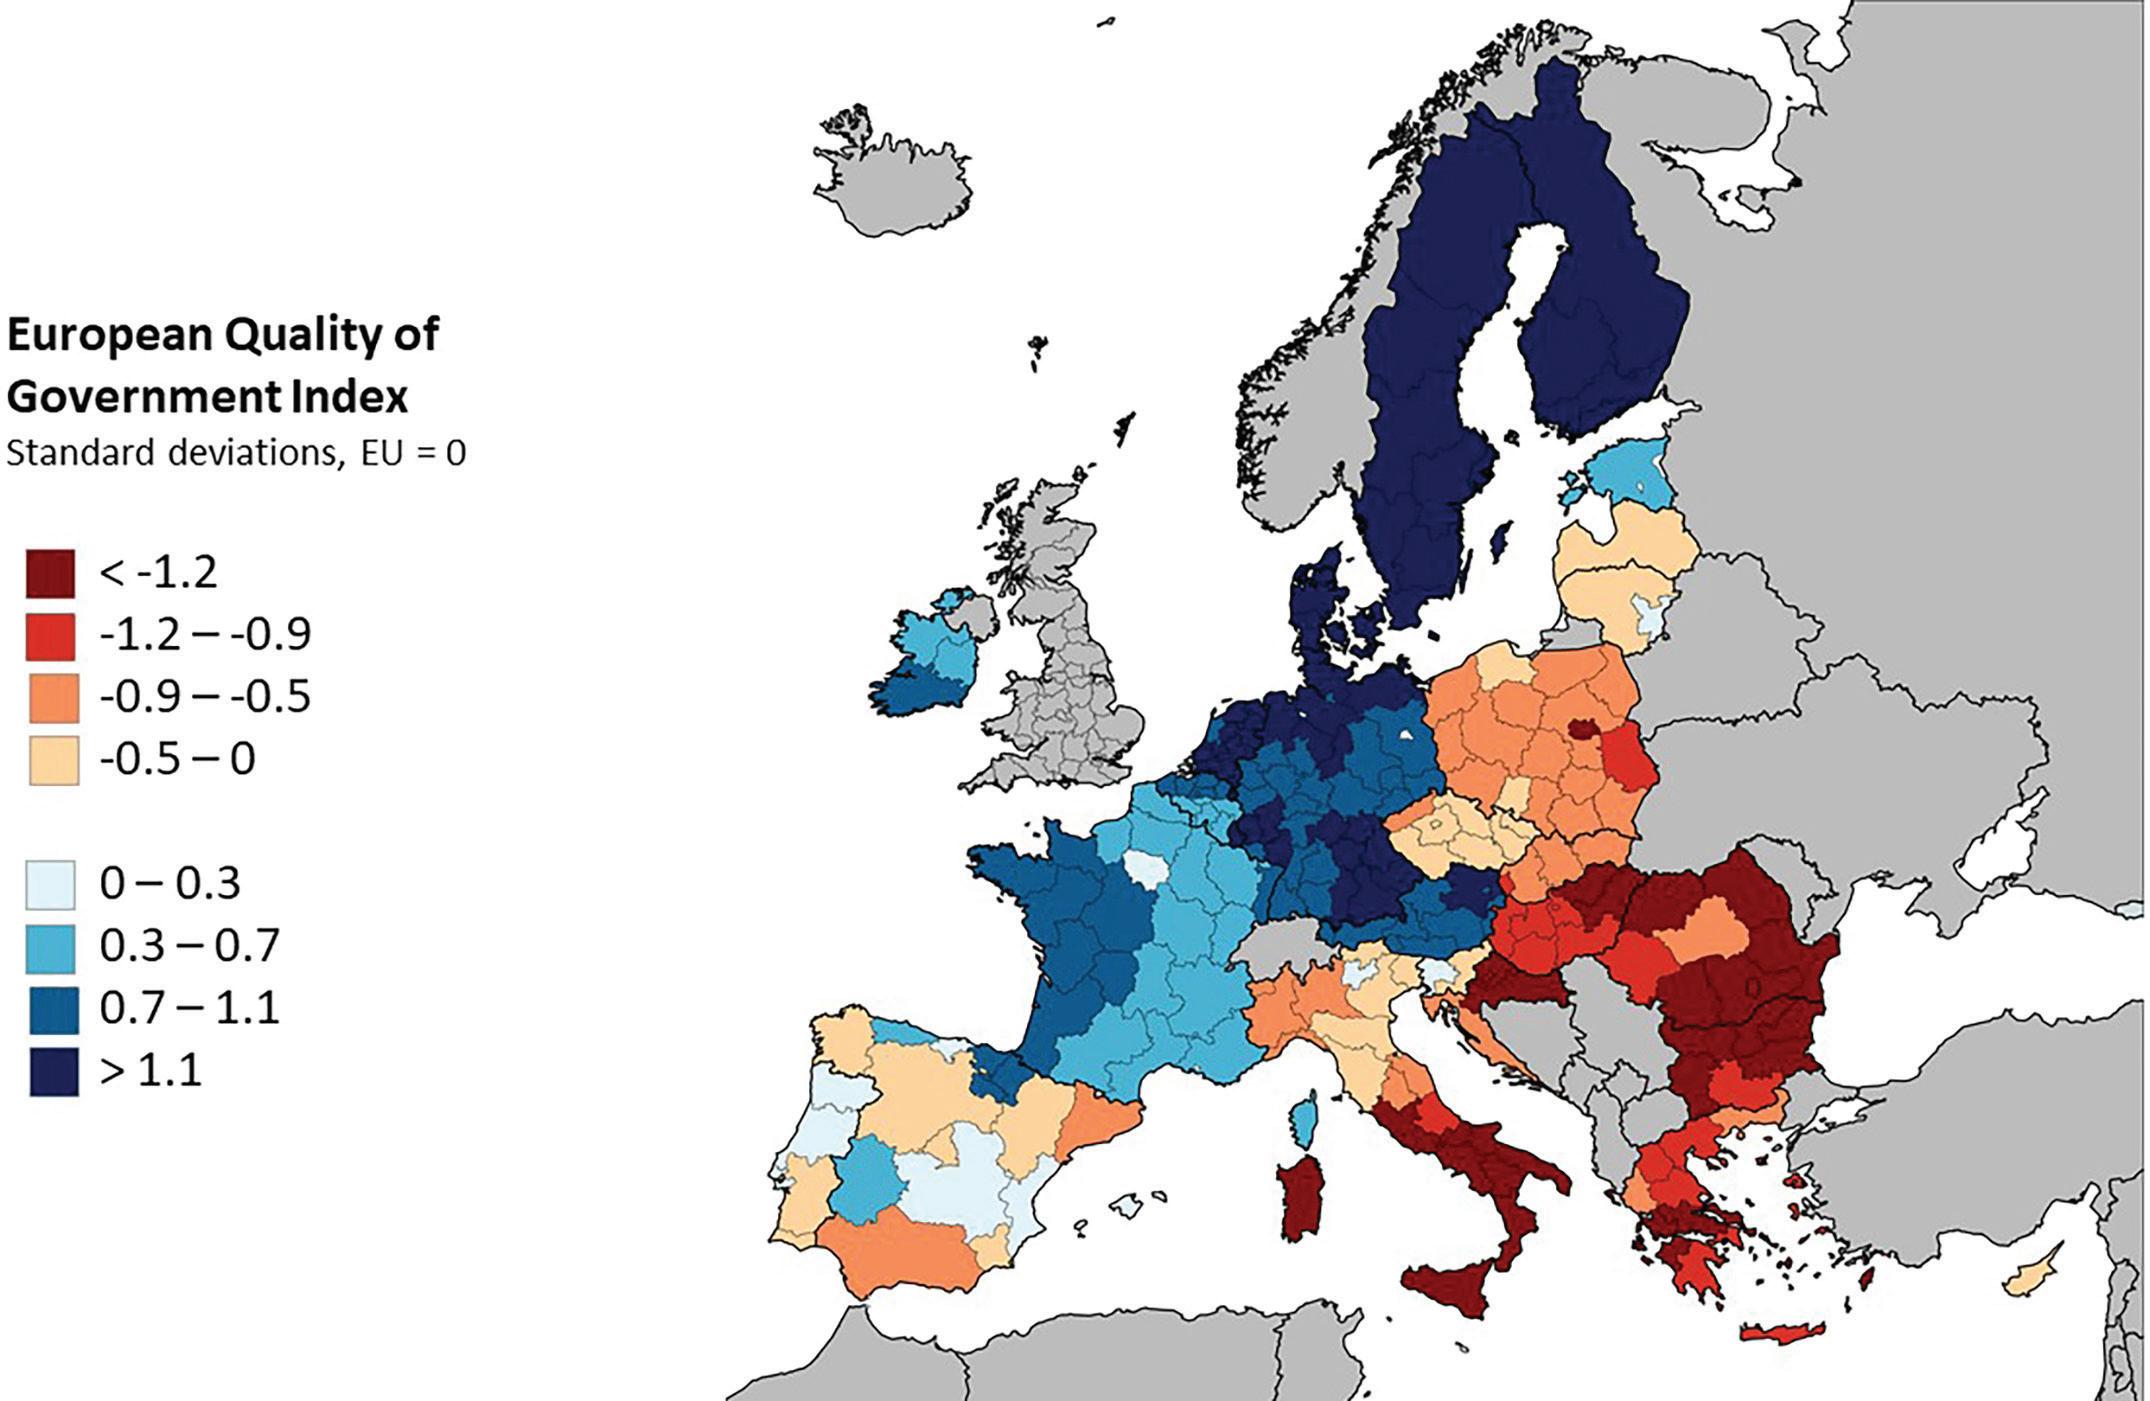
EU countries face a variety of challenges in reducing pollution of land, water and air. Principal components analysis can provide some insight into these issues by grouping countries according to common problems (see Annex F for the data and methodology used). In some cases, this analysis reveals policy priorities that apply to the countries in each cluster. Grouping countries according to the degree of pollution they face reveals two countries that have very atypical conditions (Iceland and Malta), and four clusters with reasonable sizes.
Cluster 1, which includes United Kingdom, Germany, Spain, France and Italy, has the highest values of sewage sludge production (1289 thousand tons in 2019) and disposal as well as the highest values of water and freshwater abstraction. It also has the lowest shares of population facing problems accessing quality water and the lowest average value for the water stress index. Overall, the evidence suggests that these countries do not present social problems linked to the use of water, but as they are the largest users of the resource, they should focus on making its use more efficient and develop recycling alternatives in cases that climate change events affect the current available water resources in the area.
(Continued next page)
Figure B4.1.1: A Net-Zero Pollution Ambition for a Toxic-Free Environment Wards clustering
Source: Author’s calculations.
Note: Iceland, Norway and the United Kingdom, which are non-EU members, were included for benchmarking purposes only.
Cluster 2, which includes Romania, Latvia, Bulgaria and Lithuania, display an opposite story. This cluster has the lowest values of sewage and sludge production (87 thousand tons) and disposal. Most of their water comes from surface sources, as they have the fewest underground sources. However, they have the highest levels of population facing water challenges (10.4 percent) with Romania having the highest percentage (21.2%) of population not having proper bath and toilet facilities. Moreover, the countries in this cluster are getting worse on this indicator, at a higher rate than in any other cluster. However, this cluster also has the highest rate of decline on nitrogen oxides and particles from transport. The countries in this group seem to have significant challenges on the social aspect of water usage and the implications this can have for health. The recommendation in this case is to focus resources in improving sustainable access.
Cluster 3, which includes Estonia, Greece, Portugal, Lithuania, Hungary, the Czech Republic, Austria, Belgium, Finland, Denmark, Sweden, Netherlands, and Norway, has average results compared with the other three clusters regarding water pollution. It has the smallest population shares connected to urban wastewater and collection systems, but has also seen rapid improvement in this area. In contrast this cluster is rapidly increasing greenhouse gas emissions by sector as well as their intensity. The cluster saw its water productivity decrease by 16.1 in purchasing power standard (PPS) per cubic meter, which is the highest among all clusters. Thus, while the focus on pollution is more linked to greenhouse gases and sectors such as energy and transport, water could become a major problem in the future.
Cluster 4, which includes Poland, Cyprus, Croatia, the Slovak Republic, Ireland and Slovenia, has a similar structure to cluster 2, but with major gaps with respect to cluster 1. It does have low values of sewage sludge production and the water abstraction is the lowest among the clusters. It also presents the highest shares of population not connected to any wastewater collection system and the highest values of the water exploitation index. Adding to the former challenges, this area has the highest increment in emission of nitrogen oxides and particles linked to transport, and while quality water is decreasing, water abstraction is increasing. Thus, there is an urgent need for policies to find alternative sustainable sources of water that would not degrade the availability and quality of the resource over the long run.
the consumption of metal ores increased by four percent, while consumption of biomass and non-metallic ores decreased only incrementally (Figure 4.2).
Though consumption of non fossil energy ma terials decreased across the EU, it increased in mul tiple EU member states. In per capita terms, EU DMC fell from 15.4 to 13.4 tons, while non-fossil energy materials only reduced by 0.6 tons, from 11.59 to 10.9 tons a year in 2020. Yet, the decrease in the latter has not been similar across all EU member states (MS). Consumption of non-fossil energy materials increased in 11 out of the 27 EU member states, with the highest increases observed in Romania and Estonia, rising by 22 and 15 tons per capita, respectively. In Croatia, Poland, and the Slovak Republic, non-energy DMC per capita increased by 3-4 tons per capita during the same period (Figure 4.3).
Only a few EU MS achieved absolute decou pling of economic growth from non fossil material consumption. Between 2000 and 2020, the annual rate of change of non-fossil material DMC surpassed the average annual economic growth rate in ten out of the 27 EU member states, including Croatia. Absolute decoupling, meaning negative growth or absolute decrease in non-energy DMC, occurred in only six member states (France, the Netherlands, Spain, Portugal, Italy, and Sweden). At the same time, the rest have shown relative decoupling—an annual economic growth rate higher than DMC growth (Figure 4.4).


Non fossil material productivity increased in the EU, with significant improvement in several member states. Material productivity, a measurement of economic output per amount of materials consumed, has increased across the EU, barring Romania, Hungary, Sweden, and Denmark. The lack of improvement in non-fossil material productivity in these four MS is related to the notion that DMC growth outpaced GDP growth. The more economically advanced EU member states (Belgium, the Netherlands, Germany, France, Luxemburg, Italy, Ireland) have seen the most considerable improvements in material productivity during the past two decades (Figure 4.5).
Figure 4.3: DMC and Non-energy DMC Per Capita in the EU and Selected Member States, 2000–2020
Source: Authors’ elaboration using Eurostat data.
Figure 4.4: Annual Change Rate of GDP and DMC in EU Member States, 2000–2020 (%)
Only a few MSs achieved absolute decoupling of GDP growth and non-energy DMC in the past two decades, implying that the latter are increasing in the majority of the EU
Source: Authors’ elaboration using Eurostat data.
Non-energy Materials Productivity (GDP/Non-energy DMC), 2000, 2010, 2020
Human Development and Pressure on Planetary Boundaries
Countries that achieved high and very high human development also exert greater pressure on plane‑ tary boundaries. The United Nations Development Program (UNDP) Human Development Index (HDI) is a relative measurement of health, education, and income outcomes in a given country. Though a high ranking on the HDI implies greater welfare to citizens, its impact on planetary pressures has only recently been presented. Countries that have ranked high and very high (above 0.7) on the HDI also have relatively high CO2 emissions and material footprint per capita (Figure 4.6).
Countries with a high ranking in human devel opment and human capital indices see their rank ing decline significantly if planetary pressures are taken into account. In a recent effort to demonstrate how human development outcomes relate to these two factors, the UNDP created an experimental index using the HDI and an adjustment factor that accounts for the materials footprint and CO2 emissions. Comparing countries’ planetary pressure-adjusted human development index (PHDI) to the HDI ranking reveals that countries previously ranked at the top now receive a significantly lower ranking due to the impact on the environment. Drawing on the UNDP’s adjustment factor, and the World Bank’s Human Capital Index—a measurement of the potential human capital a child born today will attain by the age of 18—we calculated the planetary pressure adjusted HCI (PHCI). Most EU member states that rank higher on the HCI, also drop significantly lower due to their relative higher pressure on planetary boundaries (Figure 4.7). Noticeably, the Slovak Republic also drops 0.1 points on the PHCI.
Alternative economic models that focus on hu‑ man welfare and environmental impact may pro vide policymakers with valuable insights . Recently, there has been a growing awareness that GDP, and thus GDP growth, may not be a suitable metric for assessing human well-being, particularly when considering the efforts required to tackle climate change (IPCC 2022b). Furthermore, there is growing evidence that combating poverty and providing adequate living standards can be attained without significant global emissions growth (IPCC 2022b). In contrast, newly developed economic models that aim to shift the focus away from economic growth while taking account of the need to mitigate and adapt to climate change are gaining greater recognition of their potential to inform policymaking (EEA 2021). The doughnut economics framework, which measures countries’ attainment of the UN’s Sustainable Development Goals and transgressions of planetary boundaries, demonstrates how no country has managed to bring its citizens to live inside the ‘safe and just space’ (Fanning et al. 2021). Examining the performance of Croatia, the Slovak Republic, and Poland using the Doughnut Economics framework further highlights how some countries have transgressed several planetary boundaries during the past two decades while not attaining all social objectives specified by the Sustainable Development Goals (SDGs). Specifically, all three countries mentioned above did not meet their life satisfaction and employment targets (Figure 4.8).