34 minute read
MANAGEMENT DISCUSSION & ANALYSIS


The Management Discussion and Analysis (MD&A) is an integral part of the annual performance report and provides management’s perspective on the operations and financial position of the Workplace Health, Safety and Compensation Commission (theCommission). This MD&A should be read in conjunction with the audited financial statements and accompanying notes for the year ended December 31, 2014. The MD&A was prepared based on information available as of March 6, 2015. The Board of Directors has undertaken its own review of the MD&A following the recommendation of the Financial Services Committee.
FORWARD LOOKING STATEMENTS
Advertisement
This report contains forward-looking statements about certain matters that are by their nature subject to many risks and uncertainties, which may cause actual results to differ materially from the statements made herein. Forward-looking statements include, but are not limited to, the Commission’s objectives, strategies, targeted and expected financial results; and the outlook for the provincial, national and global economies. Risks and uncertainties include, but are not limited to, changing market, industry and general economic factors or conditions; changes in legislation affecting the Commission’s policies and practices; changes in accounting standards; and other risks, known or unknown. The reader is cautioned not to place undue reliance on these forward-looking statements.
OPERATIONS OF THE COMMISSION
The Commission operates under the authority of the Workplace Health, Safety and Compensation Act (the Act). In accordance with the Act, the Commission promotes health and safety in workplaces with an objective of preventing the occurrence of workplace injuries and known occupational diseases. When injuries occur, the Commission provides support and benefits to injured workers, in accordance with the entitlement provisions under the Act, and in conjunction with workplace parties and health care providers, facilitates a safe and timely return to work. The Commission is also responsible to levy and collect assessments from employers in amounts sufficient to fund the current and future costs of existing claims including their administration. Additionally, the Commission funds the Occupational Health and Safety Branch of Service NL, Government of Newfoundland and Labrador, and the Workplace Health, Safety and Compensation Review Division. The Commission also reimburses the provincial government for a portion of the operating costs of the Labour Relations Agency in respect of administering the Act.
The Commission’s revenues are derived from: assessment-based employers, who are insured through collective liability; self-insured employers, through the reimbursement of claims costs and administration fees; and investment income. In certain circumstances, under Section 45 of the Act, the Commission is deemed to be an assignee of a cause of action in respect of a claimant disability. Accordingly, revenues also include recoveries from third parties in respect of such actions. The Commission provides workplace insurance coverage to approximately 98% of workers employed in the province of Newfoundland and Labrador.
COMMISSION VISION AND MISSION
Key elements of the Strategic Plan for 2014-16 are the Commission’s vision and mission statements. These define the guiding principles that direct the future operations of the Commission.The Commission’s vision is for safe and healthy workplaces within a viable and sustainable insurance system which reduces the impact of workplace injuries by providing the highest level of service to workers and employers. The Commission’s mission is to improve client service to support the prevention and management of workplace injuries, illnesses and knownoccupational disease.
EMERGING ISSUES
As part of its strategic planning process, the Commission conducts an environmental scan and identifies emerging issues within its business and regulatory environment which can potentially impact the achievement of the organization’s mission. These issues include, but are not limited to, rising health care costs, high long-term disability claims costs, and emerging occupational disease. The Board of Directors is informed of the emerging issues, establishes goals and objectives and monitors performance against those goals and objectives. The Board of Directors also
MANAGEMENT DISCUSSION & ANALYSIS
reviews the operational initiatives which are planned in response to the emerging issues. Due to the nature of the workers’ compensation system, there are many factors beyond the Commission’s ability to control; however, actions can be taken to mitigate their ultimate impact. These actions are incorporated into existing and proposed strategic plans. In addition to focusing externally, the Commission began a process in 2014 to formalize its enterprise risk management activities. The emphasis is to consider risk management more specifically in operational and strategic initiatives to help ensure it is integrated at the appropriate level in decision-making, governance, planning, general management, and overall organizational culture.
The 2014-2016 Strategic Plan for the Commission also describes strategies and supporting initiatives which are intended to mitigate the impact of the identified emerging issues. In addition to the performance of capital markets, important issues include injury prevention, claims duration, and rising health care costs.
KEY BUSINESS DRIVERS
Investment returns
The Commission takes a long-term view in managing and evaluating the performance of the Injury Fund given the long-term nature of the benefits provided to injured workers. The Commission’s stated goal had been to earn a rate of return of 6.6% (3.5% real return after inflation). In 2014, the Commission revised its long-term return expectation to 6.1%, which still reflects a 3.5% real rate of return, but a lower inflation expectation.
The financial risks to which the Commission is exposed are described in Note 8, Financial Risk Management, to the Financial Statements and include credit, currency, interest rate, and equity price risks. Credit risk on fixed income securities arises from the possibility that issuers of debt will fail to meet their obligations to pay interest and principal. This risk is managed by limiting the investments held with any one issuer and ensuring commercial debt is rated R1 or higher. Currency risk is the risk that the value of securities denominated in foreign currencies will change with their respective exchange rates compared to the Canadian dollar. This risk is managed through forward foreign exchange and futures contracts. Interest rate risk is the risk that the value of a security will fluctuate due to changes in market interest rates. This risk is managed through diversification among sectors and durations. Equity price risk is the risk that the fair value of marketable securities or long-term investments will change due to perceived or real changes in the economic condition of the issuer, the relative price of alternative investmentsand general economic conditions. This risk is managed through adherence to an investment policy that prescribes an asset mix that provides for the diversification of risk across a broad group of securities that collectively meet the long-term return objectives of the investment portfolio.
Benefit Costs
Benefit costs are influenced by many factors including the number and severity of injuries, claims duration, health care cost trends and the rate of wage growth in the province. Over time, expansion of coverage can occur as a result of court decisions, statutory review processes, legislative change, and external appeal decisions. The factors that influence the direction of benefit costs are considered as part of the Commission’s strategic planning process which translates into specific initiatives at the operational level to bring about cost reduction or containment.
Since 2005, the Maximum Compensable and Assessable Earnings (MCAE) upon which assessments are charged and benefits are based, has been increased annually by the CPI for Canada. In 2014, the MCAE was increased by $6,000, plus a CPI adjustment of 1.0%, making Newfoundland and Labrador’s MCAE the highest in Atlantic Canada. It is not known at this time whether the one-time adjustment to the MCAE will impact claiming patterns in the province.
The total number of new short-term disability and health care-only injury claims continues to trend downwards. Since 2010, the number of new injuries has declined by 12.3%.
MANAGEMENT DISCUSSION & ANALYSIS
New Injury Claims
Recognizing the impact that extended claims duration can have on claim costs and return to work outcomes, in 2014 the Commission developed a quality assurance framework to provide additional oversight of key performance indicators and business processes that facilitate a worker’s recovery at work as soon as it is safe and suitable to do so. The additional level of oversight provided by the quality assurance team builds on the Commission’s existing efforts to manage duration factors in its control and to ensure that programs and services are delivered in an effective and efficient manner.
In 2014, the Commission also implemented a revised early and safe return to work (ESRTW) planning and reporting form which, among other benefits, ensures worker participation in the development of the ESRTW plan. Worker participation is a critical factor in the success of the ESRTW plan and ultimately achieving a suitable return to work outcome. In the fourth quarter the Commission procured and implemented an injury profile toolset to support staff in the proactive management of claims and to introduce return to work expectations among workplace parties and primary health care providers.
Also in 2014, the Commission improved the ESRTW online service available to employers creating a more streamlined ESRTW process for employers which will reduce potential delays in implementing the ESRTW plan and providing the Commission with the required plan information. In addition, the creation of more comprehensive and timely ESRTW plan data provides the Commission with greater capability to monitor and manage factors that impede the ESRTW process at the claim or program level.
These initiatives combined will further improve the efficiency and effectiveness of the ESRTW program for workers and employers, and will assist the Commission in managing duration factors that are in its control, and help mitigate the risk of extended claims duration. The drivers of claim duration that may be beyond the Commission’s control include access to interventions and availability of suitable employment following an injury. Despite the best efforts of workplace parties to facilitate the return-to-work process, some employers may not be able to accommodate injured workers. Additionally, factors unrelated to the work injury that interrupts or delays medical recovery can affect return to work outcomes.
During the year the Commission also implemented a new online invoicing service for chiropractors and enhanced the physiotherapy online reporting form. These improvements will contribute to better quality data being received by the Commission.
Given the impact that delays in medical treatment and quality of service can have on claim duration, the Commission continued its practice of negotiating agreements with external health care service providers in 2014, including labour market re-entry specialists, audiologists and other consultants. Through negotiated agreements the Commission ensures that health care providers support the principles of ESRTW and meet expectations regarding the timelinessof treatments and quality of service provided to injured workers, which contributes to shorter claim duration.
The collaboration between the MUN School of Medicine and the Commission’s Health Care Services department continued in 2014. The first in-class session was held in 2014, followed by an interactive session utilizing standardized patients for cases involving work-related injuries. This session focused primarily on the importance of taking a thorough and accurate occupational history. The Commission will repeat this teaching in 2015, and will also provide the second teaching component which focuses on identifying and managing risk factors that may pose as barriers to return to work. Transferring knowledge to future physicians about identifying and managing return to work barriers, which
MANAGEMENT DISCUSSION & ANALYSIS
they can apply in practice, is significant given the critical role physicians play in an injured worker’s recovery and return to work.
The Commission takes a variety of approaches to address the upward trend in health care costs. The increased emphasis on early intervention and more proactive case management, through implementation of key components of the Claims Management Model (CMM), contribute to mitigating the rate of growth in health care costs. In 2014, a review of personal care expenditures was initiated, with the objective of documenting existing arrangements and streamlining the procurement and payments functions. Future enhancements will include consistency of personal care rates.
The Commission continues to consolidate its procurement of medical and health care items through the public tendering process in an effort to improve the cost-effectiveness of service delivery. Further, through adherence to the provincial generic drug pricing policy, and close monitoring to ensure utilization of the most cost-effective medications appropriate to the condition being treated, the Commission helps to contain costs in an area where there has been a global increase.
Lost-time Incidence Rate
The Commission continues to monitor and assess safety performance through a series of key performance indicators that provide insight into the state of safety practices in workplaces in Newfoundland and Labrador. One of the lagging indicators of safety performance is the lost-time incidence rate. Over the past 15 years, the Commission has observed a 52% decline in the lost-time incidence rate primarily due to more effective health and safety education, enforcement, and engineered safety programs in workplaces. However, over the past three years, the lost-time incidence rate has plateaued at 1.6 lost-time injuries per 100 workers employed in the province. While the decline in lost-time injuries to record lows is a positive indicator of safety performance, the Commission is concerned that future reductions in this rate are becoming increasingly harder to achieve. The Commission continues to monitor the rate and direct its educational programming in health and safety to the areas of greatest risk and need. The Commission also works with its health and safety partners –Occupational Health and Safety Branch of Service NL, safety associations, employers, and workers - to improve safety performance within industry and on a provincial scale.
Inflation rate
The annual change in inflation can have a material impact on the Commission’s benefit liabilities. The long-term disability benefits provided under the Act are indexed to the full rate of inflation with no upper limit. The Commission calculates the annual inflation adjustment based on the year-over-year change in the Consumer Price Index at July each year and applies the adjustment January 1 of the following year. The inflation adjustment calculated in 2014 was 1.4% and the inflation adjustment has averaged 1.6% over the past five years. The long-term inflation assumption used to value the Commission’s benefit liabilities has ranged from 3.5% down to 2.5% over that period.
2014 FINANCIAL HIGHLIGHTS
The Commission recorded a 5.6% increase in the overall assessable payroll base, with increased payrolls across most industry sectors, except for business services, mining, government services and oil & gas. The increase in the assessable payroll base is due in part to the significant increase in the MCAE, as overall employment in the province declined during 2014.
There were decreases in assessment revenue of $21.0 million and in investment returns of $22.1 million. The Commission’s total comprehensive income was $62.7 million, as compared to a comprehensive income of $148.9 million in 2013. The Commission’s funded position improved to 112.0% from 106.5% at the end of 2013. This represents the Commission’s best financial position since 1981.
STATEMENT OF FINANCIAL POSITION
Cash position
The Commission ended 2014 with a cash balance of $46.3 million, as compared to $38.2 million at the end of 2013. The Commission was able to improve its relative cash position primarily due to
MANAGEMENT DISCUSSION & ANALYSIS
assessment revenue collected exceeding cash payments to or on behalf of injured workers during 2014.
Investments
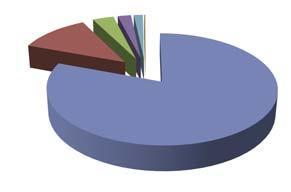
The Commission’s investments are held in an Injury Fund to meet future benefit payments to injured workers. These investments are diversified primarily between domestic fixed income and domestic and foreign equities, as well as an allocation to real estate. The fair value of the Injury Fund increased $117.2 million to $1,126.1 million at December 31, 2014 from $1,008.9 million at the end of 2013.
Injury Fund
Real Estate Global Equity Canadian Equity Canadian Bonds
The major theme characterizing the financial markets in 2014 was the divergence of the United States (US) from the rest of the world, in respect of monetary policy and the decoupling and divergence of GDP growth on a global scale. For the majority of the year, volatility was muted until the rapid and pronounced fall in the price of oil. In addition to falling energy prices, the markets were also affected by low inflation and the strength of the US dollar. In October, the US Federal Reserve ended quantitative easing. Conversely, the decline in the price of oil coupled with deflationary pressures lead the central banks in Japan, China and Europe to expand their respective stimulus measures. The Bank of Canada did not change its overnight rate in the year. The story attracting the most attention in 2014 was the second largest annual decline ever recorded in the price of oil. The spot price for a barrel of WTI reached a 5 1/2 year low, having fallen 50% from a peak of US$ 107 in June to US$ 53 at year-end. The collapse in oil prices was driven by a combination of expanding US output, declining demand growth in China and a decision by the Organization of the Petroleum Exporting Countries to maintain the same level of output in an effort to gain market share.
The US economic growth rate was the strongest since 2004, with consumer and business confidence reaching post-recession highs. Job growth in the US achieved the best annual gain since 1999. While Canada benefited from the growth of the US economy, falling energy prices and a general weakening of demand for commodities, resulted in the slowest job growth in this country since 2009. The Canadian dollar, coming off a 6.6% decline in 2013, declined a further 8.5% in relation the US dollar, from US$ 0.94 to US$ 0.86 by the end of the year.
For the most part equity and bond markets moved in lock-step in 2014. However, the speed and depth of the decline in the price of oil caused a spike in volatility in the last quarter and increased the gap in returns between these markets.
In the U.S., the S&P 500 Index rose by 23.9% in 2014 in Canadian dollar terms (14.1% on a hedged basis) compared with 41.3% in 2013. Nine of ten sectors produced positive returns in the US, with the only negative being energy at a negative 7.8%, that sector’s first negative result since 2008. The S&P TSX Composite Index, in Canada, lagged other markets with a 10.6% return compared with 13.0% in 2013. Market returns in Canada were dampened by the energy and materials sectors which were down 4.8% and 2.6%, respectively, the only sectors producing negative returns. These two sectors represented about one third of the total market weight of the composite index. All other sectors produced double digit returns. The injury fund was generally underweight energy and materials.
The MSCI ACWI (global equities) increased by 14.1% (in Canadian dollar terms) less than half the return in 2013 of 31.7%. From a global perspective, the injury fund was underweight energy but overweight Europe. Emerging Markets, impacted by geopolitical concerns and weaker growth in China, underperformed developed markets.
The increased demand for bonds pushed yields lower and bond market volatility remained elevated as investors’ concerns included slowing inflation, lower economic growth prospects and diverging central bank policy. This decline was unexpected
MANAGEMENT DISCUSSION & ANALYSIS
given the end of quantitative easing in the US and central banks signaling potential rate increases. Interest rates on 10-year government bonds trended down with 10 year US treasuries yielding 2.17% at December 31, 2014 compared to 3% a year earlier and 10 year Government of Canada’s yielding 1.79% December 31 compared to 2.77% January 1, 2014. The FTSE TMX Canada Bond Universe Index increased 8.8% in 2014, a significant turnaround from the 1.2% loss in the prior year. The injury fund was below its policy weight for bonds throughout 2014. Despite the elevated bond market volatility, capitalization rates for real estate remained stable and the IPD all property index produced an annual return of 5.8% in 2014 (7.7% in 2013).
In 2014, the Injury Fund had a rate of return of 11.6% compared with a 16.3% return in the previous year, and target of 6.6%. The fund has generated an average return of 9.1% over the most recent four years and 7.0% over the most recent ten years.
Investment Strategy
The Commission’s Board of Directors is responsible to ensure that the assets of the Injury Fund, along with future investment income, are sufficient to pay benefit liabilities. The Board of Directors takes a long-term approach to the management of the Injury Fund given that payment of the majority of benefits promised to injured workers extend many years into the future.
The Commission’s investment strategy is guided by the Statement of Investment Principles and Beliefs (SIPB) and the Long-Term Investment Policy. The SIPB outlines the governance structure for the Injury Fund, the importance of asset allocation in achieving the long-term return objectives of the fund, the importance of diversification and the process for manager selection and performance evaluation. The Investment Committee reviews and amends the SIPB and policy periodically to ensure prudent management and oversight of the Injury Fund assets.
The Long-term Investment Policy documents the long-term asset mix target, the return objectives, acceptable investments and limits on risk concentration. The Injury Fund assets are managed by independent, professional investment managers. The Commission monitors the managers’ compliance with policy on a regular basis. The Injury Fund assets are diversified across asset classes, industry sectors, geographic locations and individual securities to minimize the volatility of returns. Further diversification is achieved by selecting investment managers with varying investment mandates and styles.
The Commission’s asset mix policy as at December 31, 2014 was as follows:
Asset Class Asset Mix Tolerance Range
Bonds, Canadian 30% ±5% Equities, Canadian 30% ±5% Equities, Global 30% ±5% Real Estate 10% ±5%
The asset mix will vary from the targets due to differences in the relative performance of the various financial market segments. However, as depicted in the chart below, all asset classes were within tolerance range at December 31, 014:
Asset Mix Versus Policy, Dec 31, 2014
Benefit Liabilities
Benefit liabilities reflect the present value of all future payments expected to be made on behalf of injured workers whose claims were accepted as of December 31, 2014, and the future cost of administering those claims. The Commission has also included a provision for future claims related to latent occupational disease. The benefit liabilities are increased each year for the estimated cost of current and prior year injuries and are reduced by actual payments in the year and revisions to actuarial estimates for prior years’ claims. These experience adjustments are a normal and expected part of the actuarial valuation process.
MANAGEMENT DISCUSSION & ANALYSIS
Benefit Liabilities
Rehabilitation
Short-term Disability Survivor Benefits
Future Admin
Health Care
Long-term Disability
The Commission has a financial strategy policy aimed at maintaining the funded position within a reasonable range over the long term. The economic and actuarial assumptions used in the valuation of liabilities are reasonable estimates of future expectations for these variables over the long term. The assumptions described in Note 14 - Benefit Liabilities and Claims Costs, to the financial statements, have been updated resulting in an increase in the benefit liabilities of $44.7 million. A lower long-term inflation expectation of 2.5% (2013 – 3.0%), and therefore a lower expected gross rate of return of 6.1% per annum (2013 – 6.6%) resulted in an increase in the liability of $17.8 million. As well, the provision for latent occupational disease was increased from 7% to 8% of the benefit liabilities before future administration, based on an updated study completed by the Commission’s actuary during 2014. The impact of this change was an increase in the benefit liability of $9.6 million. Finally the Commission updated its mortality assumptions to reflect the most current Newfoundland Life Tables, which resulted in a further increase in the benefit liability of $17.3 million.
The Commission’s benefit liabilities include amounts set aside to pay the future cost of short and long-term disability, survivor benefits, health care, rehabilitation, occupational disease and future administration costs. Benefit liabilities increased $52.4 million, or 5.3% from $983.3 million at the end of 2013, to $1,035.7 million at the end of 2014. Excluding the increases associated with the changes in actuarial assumptions for the discount rate, latent occupational disease and mortality, the increase in the benefit liabilities is $7.7 million (0.8%). The liability for long-term disability benefits represents the single largest component of the overall benefit obligations. At December 31, 2014, the long-term disability liability was 53.4% of the total benefits liability and amounted to $552.9 million, a 0.3% increase from the prior year. The change in inflation assumption and mortality assumption added $4.0 M and $10.9, respectively, to the long-term disability benefit liability. The growth of this liabilityis less than expected mainly due to offsetting gains from: extended earnings loss (EEL) claim terminations being greater than expected ($2.6 million); PFI award experience better than expected ($1.2 million), and the actual inflation rate being lower than the assumed rate ($8.7 million).
In addition to the liability for long-term disability claims accepted during the year, the liabilities include a provision for outstanding claims that might become long-term disability claims in future years. The observed (actual) average capitalization decreased slightly from about $132,000 in 2013 to $126,000 in 2014. The average new capitalization award for the past 5 years, when adjusted for inflation, is $130,000, which the actuaries have maintained for the current valuation. The Commission’s actuaries have also noted that the percentage of short-term claims expected to become long-term has remained stable at 6.2%. In addition, the absolute number of expected long-term claims has remained stable at roughly 220 per year for the years 2012 to 2014.
The next largest benefit liability category is health care, which is 28.1% of the benefit liability at $290.6 million, an 8.9 % increase from 2013. The growth in the liability is mainly attributable to changes in assumptions, offset slightly by a gain associated with payments being lower than expected ($1.6 million). The change in inflation assumption and mortality assumption added $11.6 M and $3.1 M, respectively, to the health care benefit liability.
In 2014, the liability for survivor benefits increased by $0.5 million. The Commission accepted 29 fatality claims in 2014 compared with 30 in 2013. Of these, 9 were as a result of accidents and 20 arose from occupational disease (2013: 5 accidents, 25 occupational disease). The liability for survivor benefits was slightly lower than expected due to gains from the actual inflation rate being lower than the assumed rate.
MANAGEMENT DISCUSSION & ANALYSIS
Funding Policy
The Commission’s Funding Policy, which was agreed to by stakeholders, is designed to maintain a funded position that will provide for the security of injured worker benefits within employers’ reasonable ability to pay assessments. The Funding Policy provides guidance to ensure the Commission responds to external factors, such as volatile investment markets, in a controlled and responsible manner.
The Commission’s funded position is defined by the relationship of total assets to total liabilities and the Injury Fund is fully funded when the total assets equal or exceed total liabilities. However, due to the potential volatility of investment market returns, the Board of Directors has established a funding target of total assets equal to 110% of total liabilities. The Funding Policy specifies a funding target operating range from 100% to 120%. If the funded status moves outside the targeted range, the Commission will adjust assessment rates paid by employers over a fifteen-year period to achieve the funding target. The Commission’s assessment rates for 2013 and 2014 includedan upward adjustment of $0.25 per $100 of payroll.
At funding levels above 140% the Commission will consider one-time expenditures. One-time expenditures include, but are not limited to, benefit improvements, assessment rebates and funding for prevention programs. The introduction of benefit improvements is subject to the approval of the Government of the Province of Newfoundland and Labrador. In order to ensure the long-term sustainability of the workers’ compensation system, the Commission will take into account the current and all future costs associated with any one-time expenditures.
FUND SURPLUS
At December 31, 2014, the Commission’s assets totaled $1,206.7 million compared with total liabilities of $1,076.9 million. The net fund surplus of $129.8 million consists of $130.2 million in accumulated operating surpluses, other comprehensive loss of $0.9 million, and an occupational health and safety research reserve of $0.6 million. The ratio of total assets to total liabilities is one measure of the financial strength of the Commission. The funded ratio is an indicator of the percentage of projected benefits on existing claims that can be paid from existing assets. At December 31, 2014, the Commission’s funded ratio had increased to $112.0%. The improvement of the funded ratio was primarily due to the higher than expected investment returns, and favourable experience on prior years claims which offset the impact of changes in actuarial and economic assumptions.
Funded Ratio
The Commission’s long-term funding target is to achieve a level of total assets equal to 110% of total liabilities which is equivalent to requiring a stabilization fund of 10%. At December 31, 2014, this required stabilization fund amounted to $107.7 million, bringing the total funding strategy surplus to $22.1 million. This compares with a funding strategy deficiency of $34.3 million at the end of 2013. As the funding target has been achieved, it is anticipated that the $0.25 surcharge per $100 of payroll will be removed during the rate-setting process for 2016, assuming investment markets and claims experience remain stable.
MANAGEMENT DISCUSSION & ANALYSIS
STATEMENT OF OPERATIONS
Revenues
The Commission’s revenue sources are assessments paid by employers, investment income and third party recoveries. In 2014, revenues totaled $298.7 million, a 12.8% decrease from 2013 revenues of $342.4 million, primarily driven by a reduction in the average assessment rate, and lower investment income.
Revenue
Third Party Investments Assessments
Assessments Revenue
Revenue from assessments consists of base assessments, and practice and experience incentives, refunds and charges disbursed and collected through the PRIME program. Revenue also includes payments made on behalf of self-insured employers.
In 2014 the average base assessment rate was reduced from $2.75 to $2.45, a decrease of 10.9%. This contributed to a 11.0% decrease in revenue from assessment based employers to $170.2 million in 2014 from $191.3 million in 2013. In 2014, employer assessable payrolls increased by 5.6% to $8.0 billion due to growth across most industry sectors and because of the annual increase in the maximum assessable and compensable earnings limit. The growth in assessments revenue was muted, however, due to reductions in the average rates in certain sectors. The reductionin average rates is a reflection of improving claimscost experience in these sectors and the reduction in the averagebase assessment rate used in rate setting.
Under the Commission’s PRIME program, employers can impact the assessments they pay by meeting their practice requirements under the practice incentive component and managing their claim costs under the experience incentive component. The practice component recognizes employers for good occupational health and safety and return-to-work practices through a five percent refund on their average calculated base assessments. Since this program came into effect in 2005, employers have earned $41.6 million in PRIME practice refunds.
The experience incentive component of PRIME was introduced to large employers in 2008 and expanded to all other eligible employers in 2009. Employers are assigned an experience incentive range based on payroll, industry classification and assessments. If claim costs fall below the bottom of their range, employers are eligible to receive a refund while those with claim costs above the top of their range may receive an experience charge. When claim costs falls within the range neither a refund nor a charge is applied. Employers must meet the practice incentive requirements before being eligible for experience refunds. Although experience refunds and charges are intended to offset each other in the long term, since this program came into effect, employers have earned a net of $25.7 million in PRIME experience incentives. The net refund position is indicative of the decline in the lost-time incidence rate.
The ultimate amount of practice and experience incentives for the 2014 PRIME program year will not be known until the processing and subsequent audits of employer statement data is completed later in 2015. The Commission estimates that employers will qualify for practice incentive refunds of $6.8 million in 2015 based on their 2014 performance and their qualifying experience incentive, net of experience charges, will be $9.7 million.
MANAGEMENT DISCUSSION & ANALYSIS
Revenues from self-insured employers were flat at $9.9 million in 2014 (2013 - $9.9 million).
Investment Income
Investment income includes dividends and interest from the Injury Fund portfolio and short-term investments, as well as gains and losses arising from changes in the market value of the investment fund. In accordance with International Financial Reporting Standards (IFRS), both realized and unrealized gains and losses are included in investment income. The application of this standard has produced significant volatility in the operating results and funded status of the Commission in recent years.
The target rate of return for the investment portfolio had been 7.12% or 3.5% after inflation over the long-term. In 2012, the Commission revised its long-term return target to 6.6%, which still reflects a 3.5% real rate of return, but a lower inflation expectation. In 2014, the Commission further revised its long-term return target to 6.1%, maintaining a 3.5% real rate of return, but with a further reduction in the inflation expectation. In 2014, the Injury Fund had a rate of return of 11.6% compared with a 16.3% return in the previous year. The fund has generated an average return of 9.1% over the most recent four years and 7.0% over the most recent ten years.
Four-year Annualized Return
Actual Policy Target
Another objective of the Injury Fund is to exceed the return of the benchmark portfolio (i.e. the policy return) on a four-year moving average basis. The policy return is the return the Injury Fund would have earned had each asset class achieved the return of its respective passive index and was at its target weight according to the Long-term Investment policy. For the four-year period ending December 31, 2014, the Injury Fund earned an annualized return of 9.1% compared to the policy return of 8.1%.
In 2014, the Commission realized investment income of $118.0 million, compared to $140.1 million in 2013. There was a 4.5% increase in interest and dividends from $28.0 million in 2013 to $29.3 million in 2014. The remainder of the income is due to net gains realized on the sale of investments during the year, as well as the change in market value from the previous year-end.
Expenses
The Commission’s total expenses include benefit costs, administrative expenses, legislated obligations, fees and interest, amortization and other expenses. Benefits for injured workers are the most significant component of the Commission’s expenses, which comprises over 81% (2013 – 80%) of expenses, while administration expenses are approximately 12% (2013 – 12%) of the total.
In 2014, total expenses were $235.6 million, an increase of $41.6 million. The increase is primarily due to the higher claims costs in 2014 associated with changes in actuarial assumptions related to discount rate, latent occupational disease and mortality rates.
Total Expenses 2014
Claims Administration Legislative Obligations Fees and Interest Amortization Other
Claims costs incurred
Claims costs incurred (expense), as reported in the Statement of Operations, are actuarially determined and include the full cost of providing for all injuries that occurred in the current and prior years. Claims costs incurred increased $41.1 million (26.6%) from $154.4 million in 2013 to $195.5 million in 2014.
MANAGEMENT DISCUSSION & ANALYSIS
This was mainly due to changes in actuarial assumptions, specifically increasing the provision for latent occupational disease from 7% to 8% ($9.6 million), reducing the discount rate from 6.6% to 6.1% ($17.8 million), and updating the mortality assumptions ($17.3 million).
Claims Expense
Long-term
Occupational Disease Health Care Short-term Future Admin Rehabilitation Survivor
Claims costs paid
Claims costs paid, as reported in the Statement of Cash Flows, represent actual cash payments to injured workers for wage loss and other benefits, payments to health care providers for services rendered to injured workers and payments to suppliers for health care goods and devices. These amounts include paymentsmade on behalf of self-insured employers. In total, these payments increased 2.3% to $134.0 million in 2014, from $131.0 million in 2013. The average rate of increase from 2010 to 2014 has been 1.1%.
The increase in long-term disability payments accounts for $2.7 million of the $3.0 million increase. While there was a slight decline in the number of claims receiving extended earningsloss benefits, the average payment increased by 6%.
Claims Payouts
Long-term Health Care Short-term Survivor Rehabilitation
Administrative and other expenses
In 2014, the Commission’s administration, amortization and other operational expenses increased by 1.2% to $28.1 million compared to $27.8 million in the previous year.
While overall administration expense was stable, there were savings in the salaries and benefits category due vacancies ($0.3 million), offset by a small increase in professional fees ($0.3 million).
Legislated and other obligations
The Commission is required by legislation to fund the operating costs of the Occupational, Health and Safety Branch of the Service NL in delivering their occupational health and safety mandate. The Commission also reimburses the provincial government for a portion of the operating costs of the Labour Relations Agency in respect of administering the Act. Legislation also requires that the Commission fund all of the costs of operating the Workplace Health, Safety and Compensation Review Division and the Statutory Review. The Commission also provides funding to employer and worker advisor positions. Total legislated obligations and other commitments decreased by $0.5 million in 2014 to $7.3 million, primarily due to the winding down of activity related to Statutory Review.
OUTLOOK
The financial sustainability of the workers’ compensation system in Newfoundland and Labrador continued to improve in 2014 as the Commission achieved a funded status of 112.0% (2013 –106.5%). The Commission has achieved a significant milestone having attained its best financial position since 1981 and exceeded its funding target for the first time since the funding policy was formally adopted in 2009. This was due primarily to solid investment performance. Other positive factors include lower than expected inflation, favourable experience on prior years’ claims and a slight reduction in new injury claims.
For 2015, the Board maintained the average base assessment rate per $100 of assessable payroll at $2.45. The rate is composed of $2.20 to cover the cost of current year injuries, plus a $0.25 surcharge which was required to amortize the funding deficiency.
MANAGEMENT DISCUSSION & ANALYSIS
As the 110% funding target has been achieved, it is anticipated that the $0.25 surcharge will be removed during the rate-setting process for 2016; assuming investment returns and claims experience remain stable.
The Provincial government is forecasting reduced economic growth over the next several years. Nevertheless, Government is expecting an increase in capital investment, wages, household incomes and a modest increase in employment. The Conference Board of Canada is predicting a slight decline in economic growth after a forecasted decline of 2.3% in 2014. Other public forecasters differ on their expectations for the Province with real GDP growth ranging from negative 1.3% to a positive 2.0%. The significant reduction in oil prices in 2014 have had a material impact on the financial position of Government resulting in an estimated budget shortfall in excess of $900 million in the current fiscal year.
On a global level the divergence of economic growth and monetary policy is expected to persist contributing to an increase in volatility in financial markets in 2015. In the U.S. the Federal Reserve is expected to increase its policy rate due to continued strong economic growth in that country. Economic growth in the United States is forecast at 3.6%, compared with 2.4% in 2014. In its annual report on Canada, the International Monetary Fund forecastsgrowth to decline slightly to 2.3% in 2015 due to the drop in oil prices. While Canada is expected to benefit from stronger U.S. growth and a weaker dollar, markets expect a further reduction in the overnight rate following the surprise reduction earlier this year. While certain experts believe the global economy is better off with lower energy prices, particularly in oil consuming regions, the World Bank predicts that lower oil prices will dampen growth for oil-exporting countries with significant regional repercussions. The Commission expects its diversified investment approach will counter some of the market uncertainty for the balance of 2015.
The Report of the 2013 Statutory Review Committee on Workplace Health, Safety and Compensation is under consideration by Government. The Committee’s recommendations included the development of a long-term plan that would balance the interests of employers and workers, resulting in further reductions in assessmentrates and increases in the benefits provided to injured workers, while maintaining the financial sustainability of the workers’ compensation system. The Commission supports the development of a balanced plan that requires the achievement of certain claims and financial targets before benefits are enhanced. The timing of Government’s response to the report is unknown at this time.
Financial Statements
2014 Annual Performance Report