Digital Water Monitoring: Protecting a Critical Resource in a Changing Industry
Navigating Capital Upgrades from an Operational Perspective
Investigating the Impact of Recycled Water Use on Soil, Groundwater and Vegetation at Isaac Region, QLD
Building Resilience into Sewage Treatment: Adaptive Operational Strategies at Port Fairy
Sludgy Solutions: Dealing With Excessive Sludge at Barossa WTP
Ice Pigging of Large Water Mains: A Risk-based Maintenance Case Study
The Biggest Bang: Fixing Water Hammer in a DAF
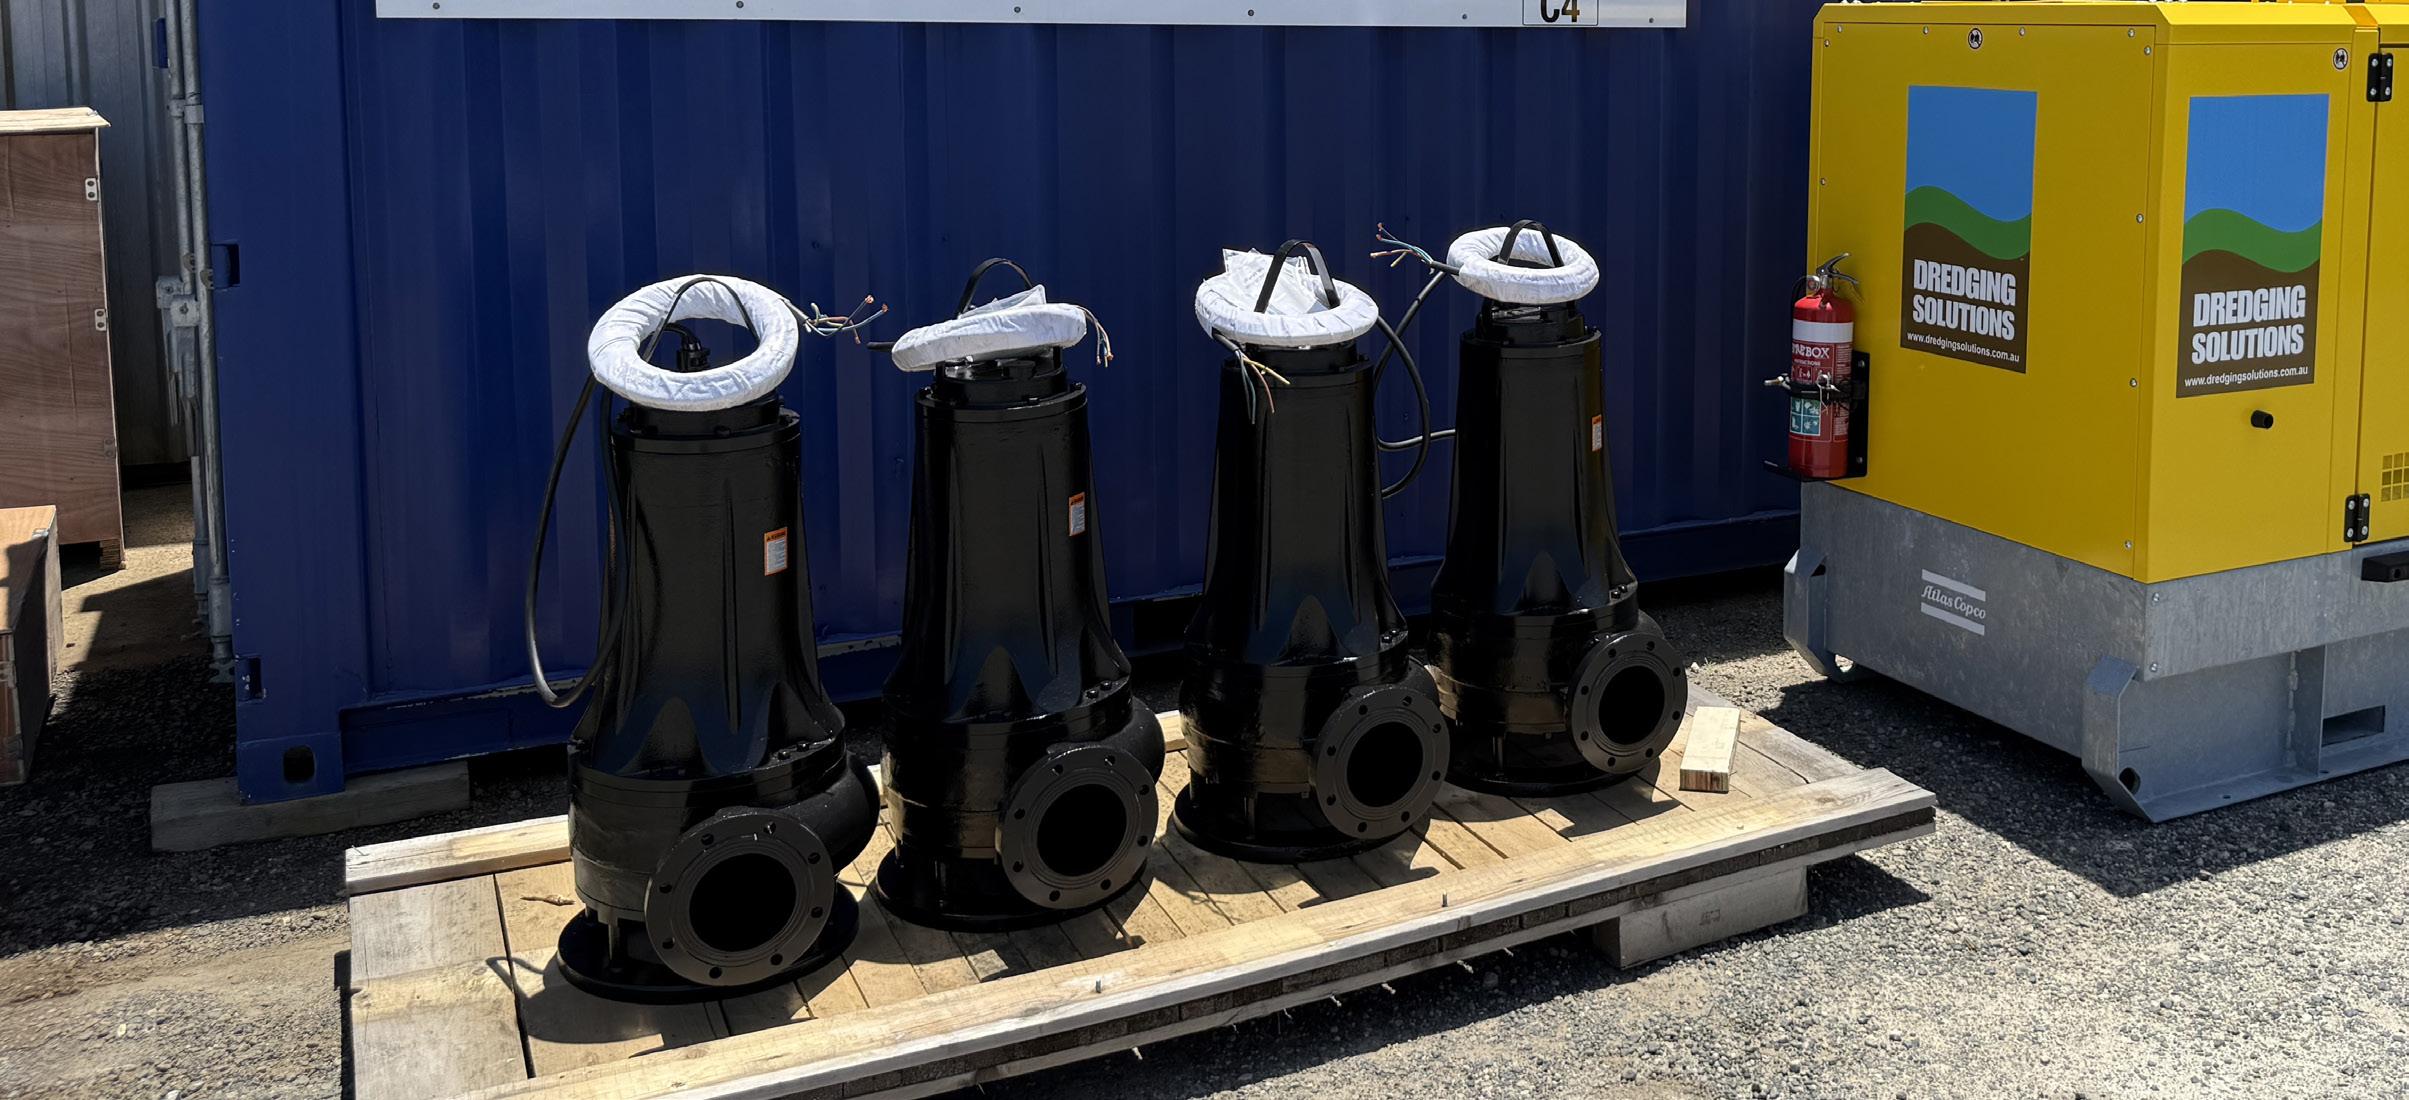
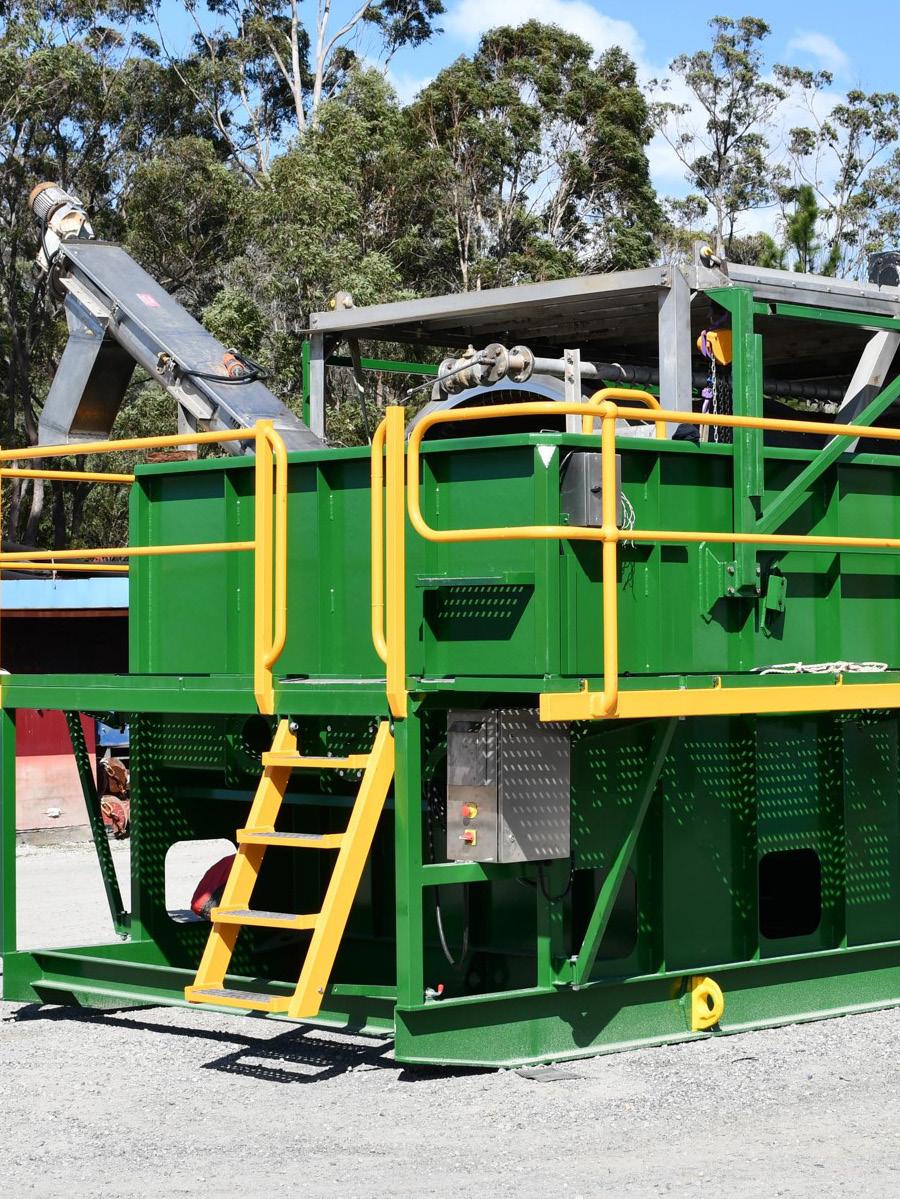
Wastewater Plant Hire
Australia’s Trusted Provider of Screens, Pumps and Clarifiers
Dredging Solutions has over 35 years’ experience providing wastewater solutions across industrial and municipal applications, supplying dependable pumps, screens, and clarifiers when you need them most.
If you require high-performance equipment, to ensure efficient and reliable wastewater processing, contact us to hire:
WaterWorks includes operationally focused articles and technical information and enjoys a wide distribution across the water industry.
Included in this edition is an editorial by Purvi Midwinter, who is client & partnerships manager with Adasa and a member of the WIOA Qld State Advisory Committee. In her editorial, Purvi provides her insights into the importance of digital water monitoring to protect our water supplies as a critical resource.
A highlight of the June 2026 edition is the article by Liam Tothill (SA Water) and Andrew Sawilski (Suez) on 'Sludgy solutions: dealing with excessive sludge at Barossa WTP'. This article was originally presented as a platform paper at the 2026 WIOA Victorian conference in Bendigo. Liam and Andrew discuss the outcomes of their innovative work to find solutions to deal with the high sludge loads generated at the Barossa WTP.
Additional operationally focused articles in this edition: Ice pigging of large water mains: a risk-based maintenance case study, navigating capital upgrades from an operational perspective, building resilience into sewage treatment operations, fixing water hammer in a DAF plant, and investigating the impact of recycled water use on soil, groundwater and vegetation.
We encourage our fellow members to get involved in upcoming WIOA conferences by sharing their experiences. By presenting a paper or poster, you help others in the industry learn, grow, and innovate. In addition, you may be recognised through one of our state awards, have your work published on the WIOA website, and be featured in a future edition of WaterWorks
If you enjoy reading this journal, we’d love your feedback. Please visit wioa.org.au/wwfeedback to complete our short survey.
CONTENTS
Editorial Panel
Kathy Northcott, Veolia ANZ
David Sheehan
Kerin Szemes, Fitzroy River Water
Zach Powell, WaterRA
Simon Wilson
Dean Barnett, CEO, WIOA
About this publication
WaterWorks is the technical publication of the Water Industry Operations Association of Australia (WIOA). It is published twice yearly. WIOA does not assume responsibility for opinions or statements of facts expressed by contributors or advertisers.
Advertising & Production
Address: WIOA, PO Box 1080 Mountain Gate VIC 3156
Email: info@wioa.org.au
Website: wioa.org.au
Contributions Wanted
WaterWorks welcomes the submission of articles relating to any operations area associated with the water industry. Submissions may be emailed to: info@wioa.org.au for Editorial Panel review and approval.
DIGITAL WATER MONITORING: PROTECTING A CRITICAL RESOURCE IN A CHANGING INDUSTRY
Water utilities have always operated at the intersection of public health, science, engineering, and human judgement. For decades, the industry has heavily relied on experienced operators who intimately understand their systems. These are people who can read subtle signals, anticipate change, and make sound decisions under pressure. That experience-driven model has served communities well. But the environment around water management is changing faster than ever and, as such, the systems supporting it must evolve too.
Digital water monitoring can sound complex, even intimidating, particularly in an industry that has traditionally favoured stable, proven methods. However, digital water monitoring is simply the modern extension of what water professionals already do. They observe, interpret, and act to protect public health and ensure supply reliability. The key difference between people and digital water monitoring is speed, scale, and visibility.
Over the past two decades, sensing technology, communications networks, and data platforms have matured significantly. Today, water quality can be monitored continuously from catchments and surface waters, through treatment plants, to distribution and discharge points. Sensors measure parameters such as turbidity, chlorine, nutrients, and microbiological indicators in near real time. Gateways transmit this information securely, while integrated platforms transform raw data into clear visual insights that operators can interpret quickly.
Why does this matter now? The pressures facing the water sector are intensifying. Many utilities are managing ageing infrastructure. This is all while the industry is dealing with climate-driven variability from sudden high-turbidity events to
extreme weather that stresses water supply systems. At the same time, the industry faces a generational transition, with highly experienced operators approaching retirement and fewer skilled replacements entering the workforce. Institutional knowledge remains invaluable, but it needs to be supported by systems that enhance consistency, speed, and resilience.
Digital water monitoring does not replace operator expertise, it amplifies it. Instead of reacting to isolated data points or delayed laboratory results, teams gain continuous situational awareness. Early warning signals enable proactive intervention before problems escalate. Integrated data reduces guesswork and improves collaboration across departments. Ultimately, decisions become faster, more transparent, and we are better-informed of the critical factors when safeguarding community water supplies.
The benefits extend beyond operational efficiency. Digital systems help utilities optimise treatment processes, reduce waste, prioritise maintenance, and document compliance with greater confidence.
Perhaps most importantly, they create a shared, visual understanding of system performance, making complex information accessible to both technical teams and leadership.
Adopting digital water monitoring represents more than a technological upgrade, it is a cultural shift. It requires openness to new tools, new workflows, and continuous learning. Change can feel uncomfortable, especially in a sector built on certainty and high-level reliability. Yet failing to change and innovate carries its own risks. As demands grow and systems age, utilities need to equip their teams with a range of tools that support faster, smarter decisions.
Digital water monitoring is not about replacing tradition; it is about strengthening it. By combining decades of operational wisdom with modern sensing and data integration, the water industry can continue to protect its most valuable resource safely, efficiently, and with confidence in an increasingly complex world.
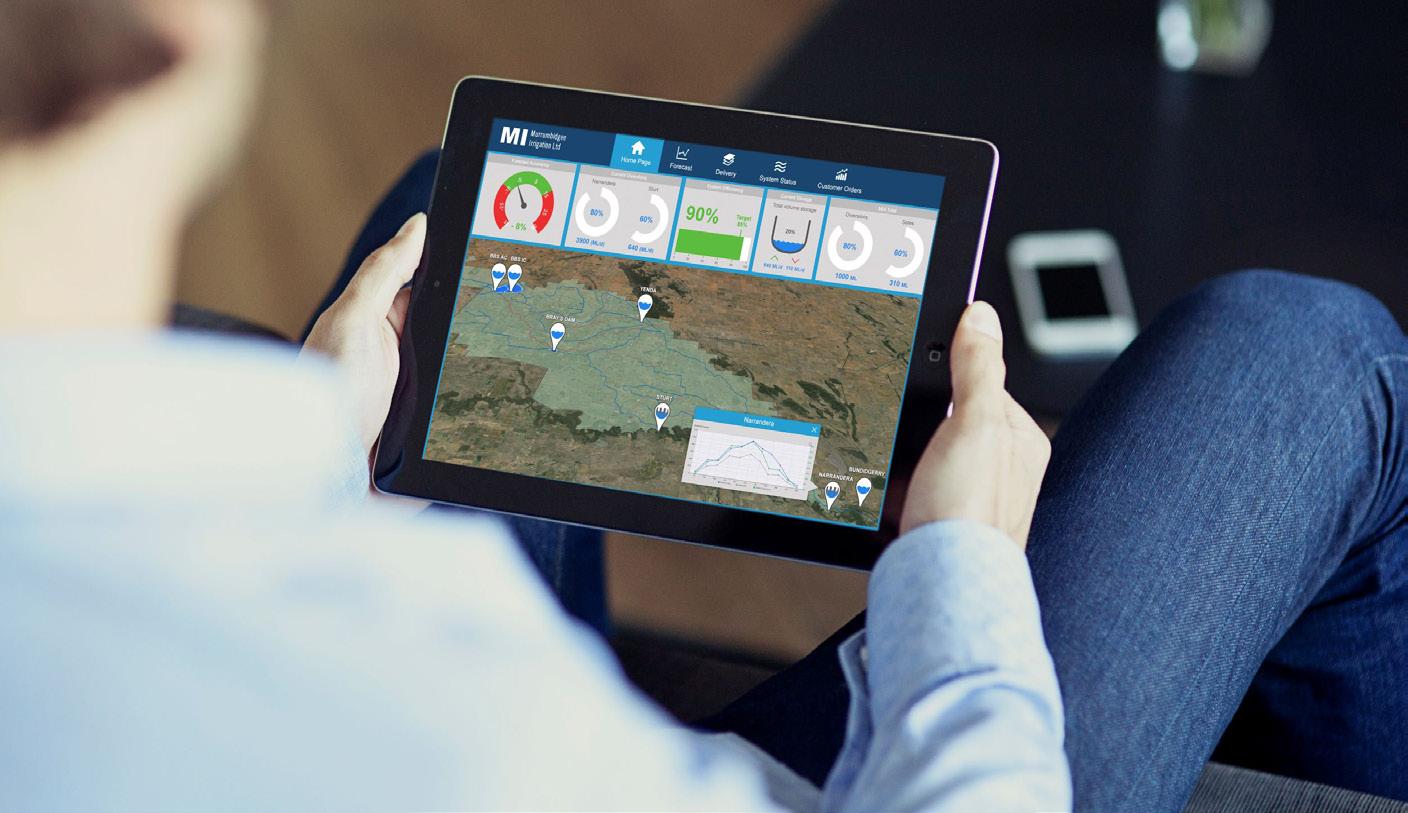
Figure 1: Real-time resource management and data visualization on a mobile tablet.
NAVIGATING CAPITAL UPGRADES FROM AN OPERATIONAL PERSPECTIVE
Scott Collis,WastewaterSupervisoratHunterWater,VeoliaANZ Winner - BestOperator Paper atthe 2025 WIOA NSW Conference.
Introduction
Delivering capital upgrades at wastewater treatment plants, whilst maintaining production and regulatory compliance, poses many operational challenges. In response to these challenges an 'operator-centric' approach is required. One which emphasises the critical role of operations personnel in Construction Hazard Assessment Implication Review (CHAIR) and Hazard and Operability (HAZOP) workshops.
Effective participation from operators in detailed design reviews, bridges the gap between engineering concepts and practical operational implementation. Thus, enabling a focus on balancing construction site activity, while ensuring uninterrupted operation, to meet production and compliance requirements.
Operational staff play a critical role in water and wastewater treatment facility design processes. Their practical expertise can identify potential issues that engineers might overlook.
There are key areas where operators should participate in planning and delivery of capital upgrades:
• Document reviews and concept design
• Detailed design workshops (CHAIR 1, 2, and 3) and HAZOP assessments.
Using examples taken from projects at Cessnock and Farley wastewater treatment plants (WWTWs) in the Hunter region of NSW, the following provides some insights and practical strategies for operators to effectively contribute to capital upgrades through:
• design reviews,
• advocating for operational improvements, and
• identifying potential safety hazards and ensuring maintainability of plant.
The role of the operator in capital upgrades and design reviews
Process and Instrumentation Diagrams
Process and Instrumentation
Diagrams (P&IDs) are essential to the capital upgrade design review process. Operators tasked with reviewing drawings should check there are adequate isolation points, flushing points and appropriate instrumentation like flow meters and level indicators.
For operators new to reviewing P&IDs, it's recommended to study the symbols carefully and practice by ‘walking the line’ in the plant and comparing existing plant P&IDs with actual equipment onsite. By tracing flow paths this develops the ability to mentally visualise these 2D drawings in three dimensions. Building these skills is critical for later design review processes.
Concept Design
CHAIR 1 is performed at the conceptual stage of a design. The concept design phase represents the first opportunity for operational input through the CHAIR 1 review process.
As the plant experts, operators must identify potential operability risks, examples being:
• minimising working at heights by ensuring equipment is at a safe level, or has proper elevated work platform (EWP) access;
• evaluating equipment positioning to ensure operators can safely access equipment without having to twist, bend or kneel to reach it;
• considering safe startup/shutdown requirements by verifying sufficient valves, penstocks, flowmeters and process equipment are included.
CHAIR 1 reviews also address construction aspects where operators' site knowledge proves invaluable
regarding environmental conditions (heat/noise) and safety concerns (traffic/ public access).
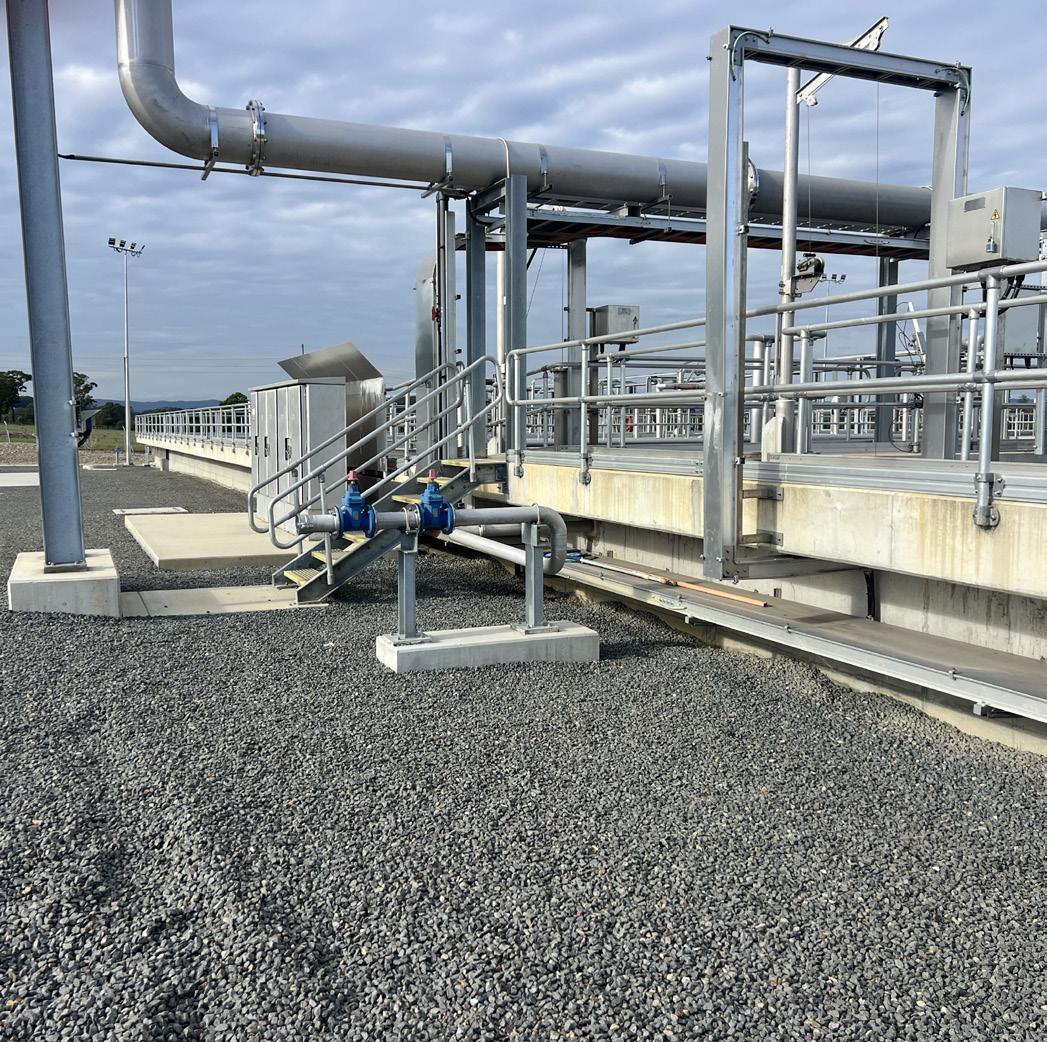
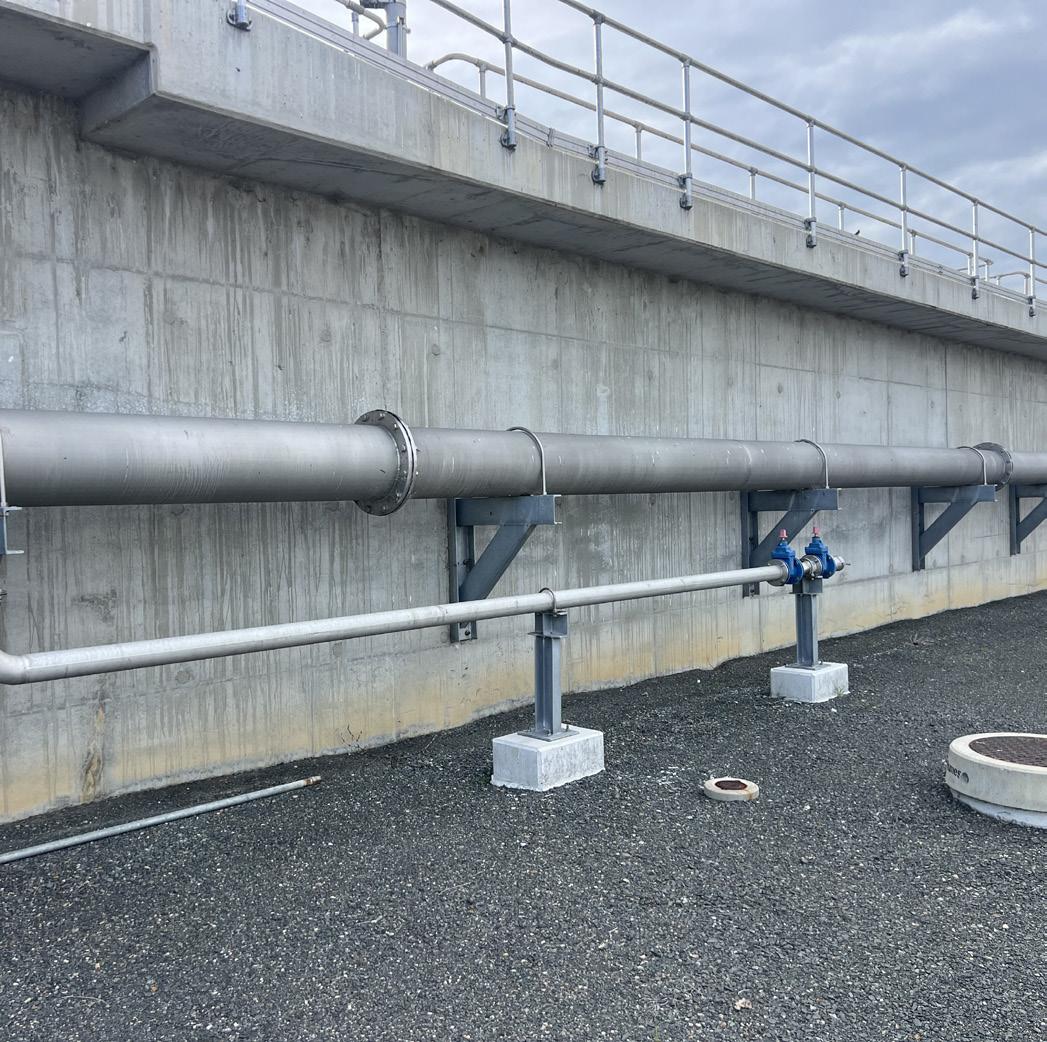
The Cessnock WWTW is an example of good design (Figures 1 and 2). It features built-in pump connection points for tanks and rodding points for influent distribution pipework, significantly reducing manual handling risks during maintenance operations.
Detailed Design
In design-construct contracts, operators often face resistance when requesting operability improvements. Requested changes to design to improve operability can be perceived as eating into construction profit margins. To overcome this, operators should aim to:
• Quantify operational cost savings.
• Focus their influencing efforts on project managers rather than constructors
• Identify cost-saving opportunities that could fund operability improvements.
These strategies help bridge the natural tension between construction cost and efficiency and long-term operability considerations. This was demonstrated at Farley WWTW where the operational benefits of better and more maintainable drum screens justified a $200,000 additional investment.
HAZOP Workshops
The Hazard and Operability Study (HAZOP) is a key part of ensuring the safety of operators. It’s important to ensure the plant has sufficient safety systems or detection mechanisms to prevent a safety or process incident. Also, querying why something has been put into the design, looking for duplication of instruments or excessive needs for that process or equipment.
HAZOPs are generally completed utilising the P&IDs. As discussed
earlier, having some proficiency in understanding the drawings and what symbols relate to, is important to ensuring operator time and input is valuable during the workshop.
Some key lessons taken from participation in these workshops are:
• Be prepared - Review P&IDs beforehand, identify potential problems and have questions prepared.
• Be a critical thinker – Challenge the design using operational know-how. Consider what could go wrong.
• Don’t be a silent participant – Even if you don’t feel you can contribute, provide supportive opinions for or against, based on experience.
CHAIR 2 and 3 Workshops
CHAIR 2 focuses on construction and demolition issues and is performed just prior to construction. Whilst CHAIR 2 workshops focus exclusively on construction aspects, operators' site-specific knowledge can also prove invaluable. Operators understand critical site details like underground pipe locations and historical burial sites for screenings and biosolids, that constructors may miss. Sharing this information helps prevent expensive construction variations.
During CHAIR 2 workshops, operators must remain vigilant when
construction safety measures might compromise operational efficiency. A notable example occurred during the Kurri Kurri plant HAZCHEM upgrade where above-ground pipework was proposed to avoid excavation risks. The constructors were unaware this pathway was essential for operations to move submersible mixers via trolley to and from the bioreactor. Had the original design gone ahead, operators would have needed to use cranes instead, significantly increasing operational costs and creating housekeeping hazards, with mixers blocking walkways. Operators must actively defend long-term operational needs against short-term construction conveniences, to prevent future variations or rework.
CHAIR 3 – Operability and Maintainability
A common issue to watch for is design teams attempting to combine CHAIR 2 and CHAIR 3 workshops. Despite involving similar participants, these are distinct reviews with different purposes. When the two workshops are combined, construction safety typically dominates the discussion while operability considerations get rushed through. This is despite operations lasting decades longer than the construction phase.
Operators should advocate for separate CHAIR 3 workshops on different days, ensuring operability
and maintainability receive proper attention rather than being treated as an afterthought. The CHAIR 3 process should focus on preventing problems through design rather than creating workarounds later. However, operators must be pragmatic about their requests, prioritising what truly matters for efficient operations.
An example was at Cessnock, where a mass flow meter was installed 5+ metres above the ground due to site constraints. Since it only requires annual maintenance, providing a stable EWP access point was deemed sufficient. Conversely, when the sequencing batch reactor (SBR) design lacked perimeter walkways, it was successfully advocated for their addition, despite constructor resistance. This relatively inexpensive modification significantly improved plant operability, illustrating when to compromise and when to stand firm on design requirements.
3D Models are a Must
Many issues are not identified until they are constructed, after which it’s too late. Either it costs a significant amount to modify, or workarounds are needed. 3D models can identify and resolve this before the first hammer is swung:
• Working at Heights – Design out any hazards related to working at heights.
A good example of this was in the
Figure 1 and 2: An example of good access in design for suction pipework on Anoxic Zones 1 and 2 at Cessnock WWTW.
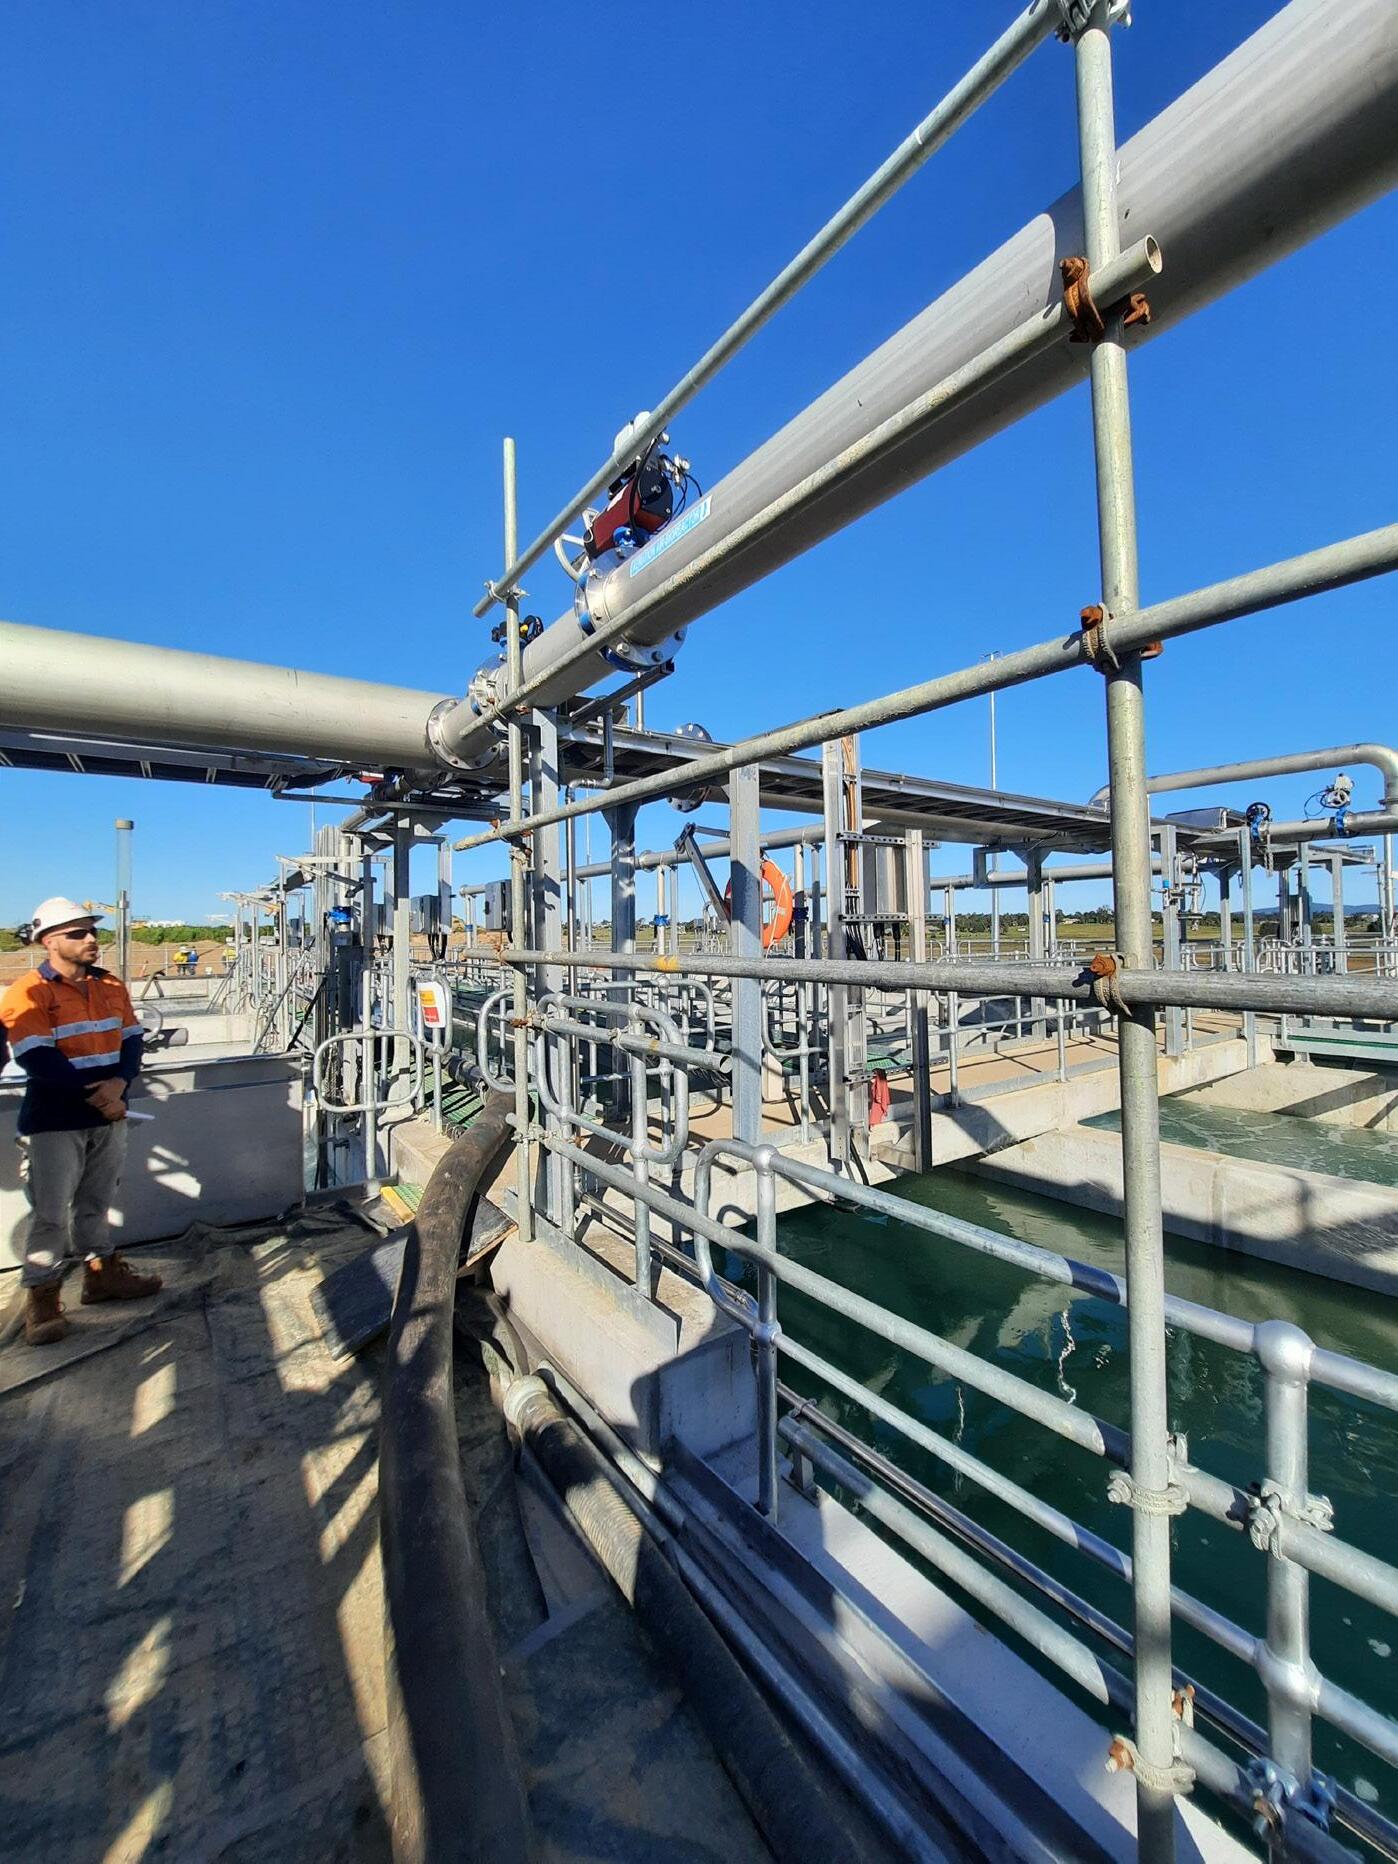
aeration pipework design at Farley WWTW, where the control valves were installed at a height above the walkways, also next to the operating plant, leading to operators having to work over water. You can see in Figure 3 the added temporary handrail to prevent falling into the bioreactor.
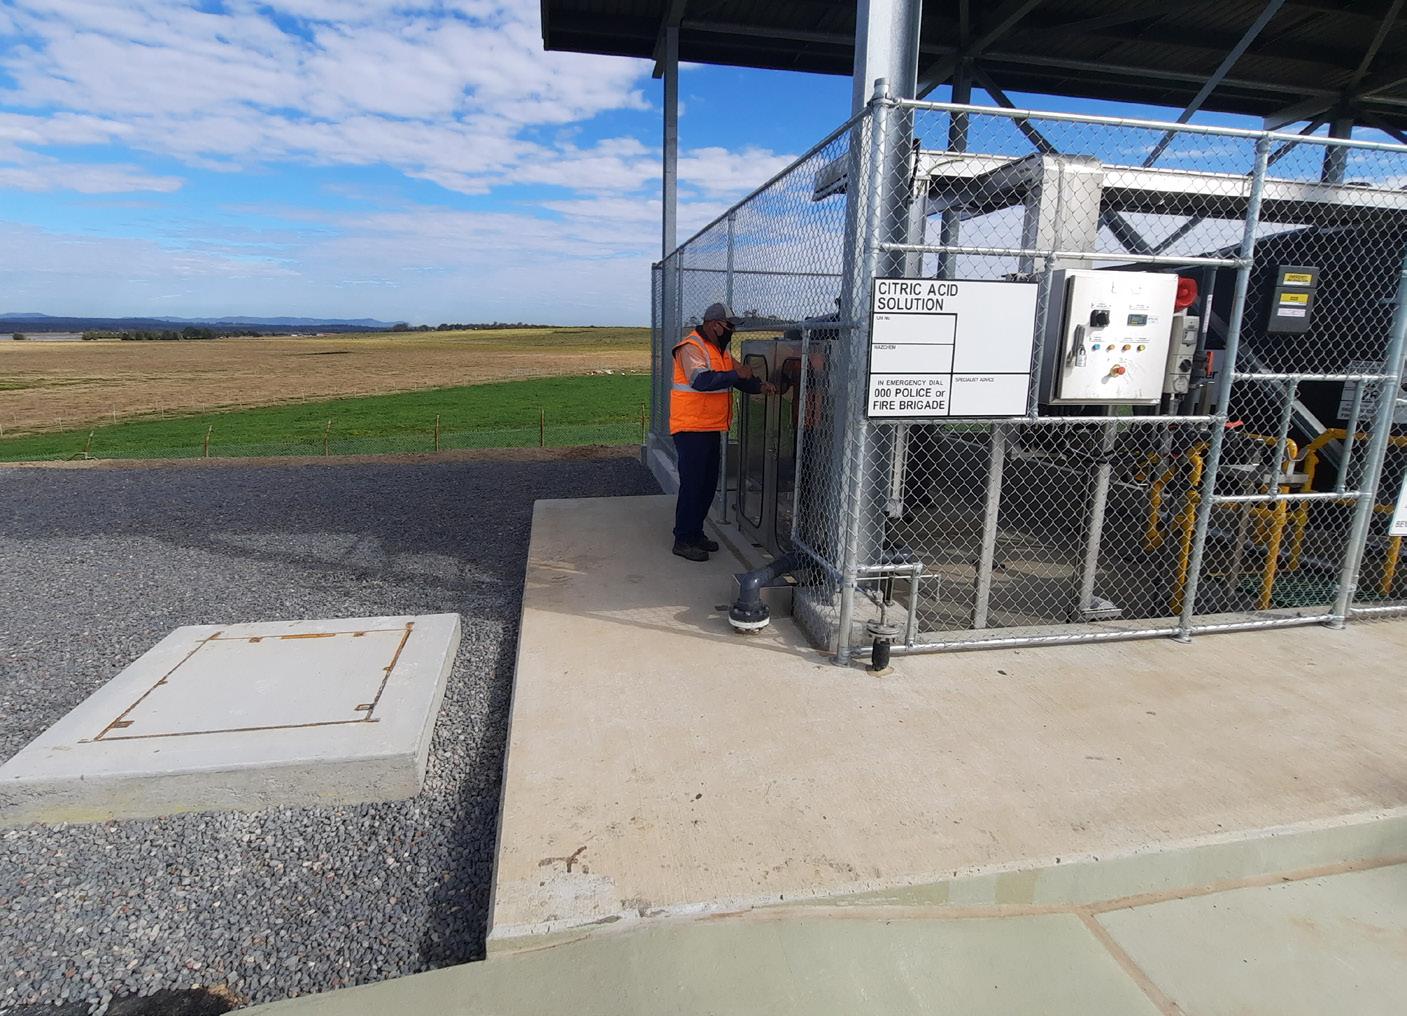
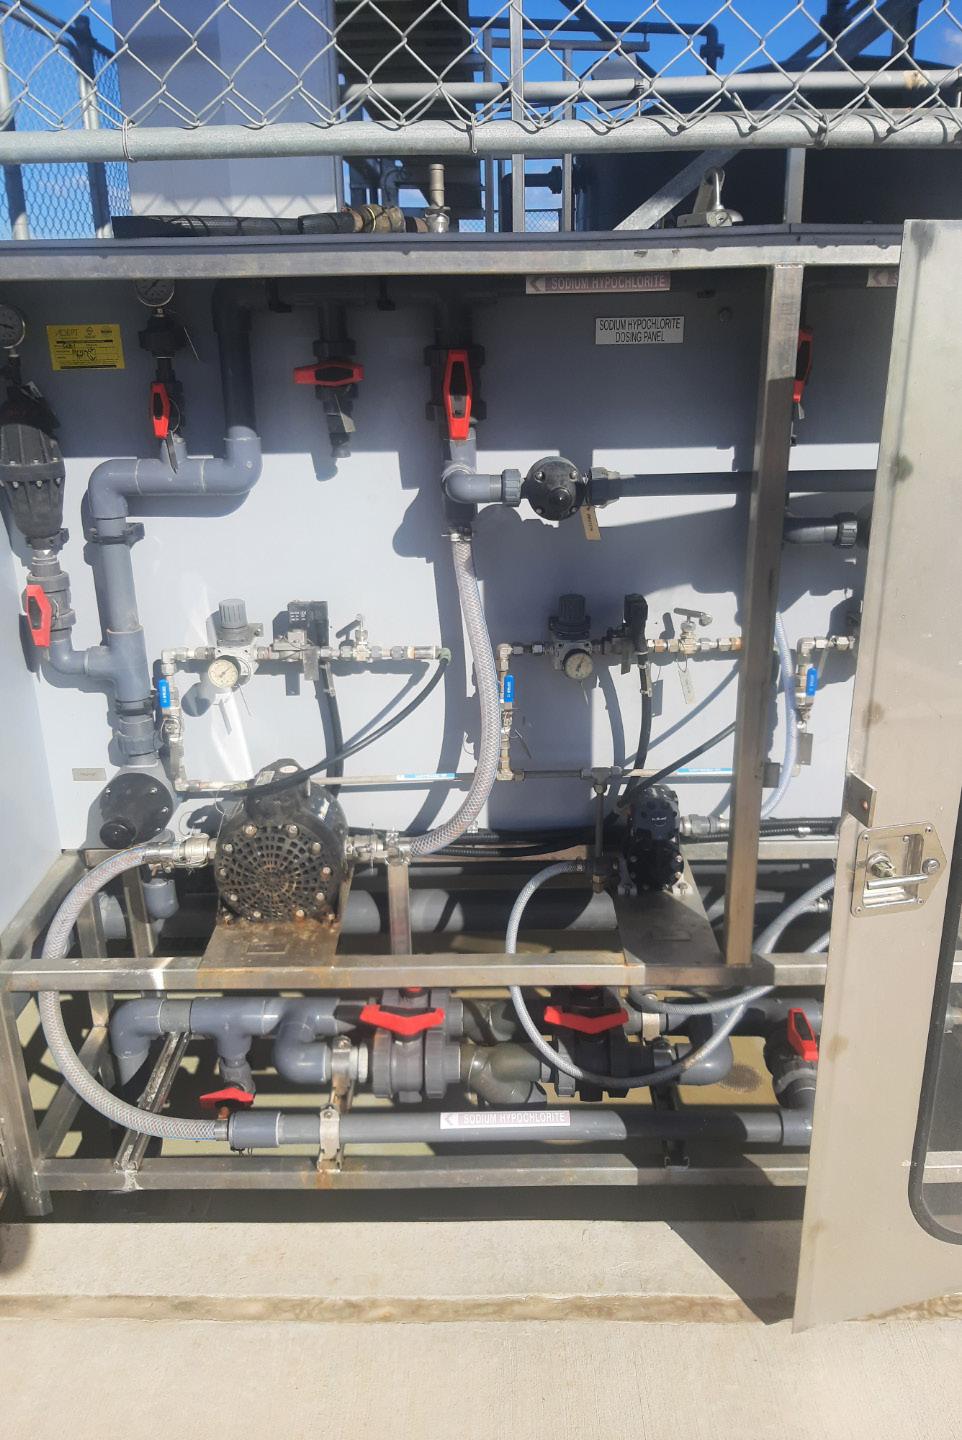
• Poor Ergonomics – The layout of equipment should be built so that it’s possible to operate and maintain the equipment without having the reach around pipework or lay down or squat for long periods. The example in Figures 4 and 5 was identified after installation of the chemical skids at Farley WWTW in a way which did not offer good ergonomic positioning for operators. This was missed during
the CHAIR 3 workshop as there were different 2D drawings, which were from three different design teams that had mismatched levels, leading to the poor operational outcome.
• Lay of the Land – It’s hard to imagine in your mind how the overall plant will look once constructed and how it will work on a significant sloping site. This was the situation at Cessnock WWTW whereby the 3D model allowed operators to review the various tasks performed and at what height or depth. We were able to ensure that valves were not too high or low, roads and laydown areas were level and appropriate to operational needs.
Operations and Maintenance (O&M) Manuals
Operations and Maintenance (O&M) manuals are vital reference documents used throughout a treatment plant's lifecycle. To review these documents efficiently, operators should focus on four critical areas:
• Operational Procedures (ensuring all necessary SOPs for startup, shutdown and operation are included);
• Troubleshooting guides (verifying fault codes and descriptions are comprehensive to prevent repair delays);
• Critical Spares listings (confirming all essential parts are identified); and
• Maintenance Schedules (evaluating whether manufacturer recommendations are appropriate for site-specific conditions like coastal environments).
Operators should avoid getting bogged down in design information, defects liability, or work as constructed drawings that are handled through other processes. For large capital upgrades with multiple O&M manuals to review, operators should negotiate with project teams to space reviews over time, allowing for thorough evaluation of each document. This targeted approach ensures the most operationally relevant information receives proper scrutiny while making efficient use of the reviewer's time
Training
Training is important to successful equipment handover to operations. The most effective approach combines classroom theory with hands-on participation during commissioning activities. Having operators actively involved in dry and wet commissioning alongside commissioning engineers provides invaluable practical experience with day-to-day operations and equipment start-up procedures. This hands-on involvement helps operators discover efficiency techniques that classroom training might miss.
Standard Operating Procedures must be tested to ensure tasks can be performed safely and effectively, with demonstrations by suppliers to operations and maintenance teams before handover.
Figure 3: The aeration pipework design, where the control valves are at height above the walkways.
Early in the project, it's essential to secure agreement on training requirements and associated costs, recognising that complex equipment demands more comprehensive training and operator time away from regular duties.
At Cessnock WWTW, dedicating an operator to work with constructors for several months during commissioning and process proving yielded exceptional results. The operations team achieved advanced proficiency with new processes much faster than would otherwise have been possible.
Conclusion
The integration of operational expertise throughout the water and wastewater treatment facility design process represents a critical investment that yields substantial long-term benefits. By actively involving operators from document reviews through to commissioning, organisations can avoid costly post-construction modifications, enhance plant performance, and significantly improve safety outcomes.
The experiences at Cessnock and Farley WWTWs demonstrate that when operator practical knowledge is valued and incorporated— particularly through effective use of 3D modelling, dedicated CHAIR workshops, and comprehensive training programs— the result is infrastructure that serves both operational staff and the broader community.
Acknowledgements
Hunter Water Wastewater Operations Team – Ongoing commitment to achieving quality outcomes for our site operators to ensure they are safe and effective every day.
Hunter Water Asset Solutions Project Managers and Engineers– Invaluable support for operational needs during capital upgrades.
Advertise in the next edition of WaterWorks
This publication is produced bi-annually and includes operationally focused articles and technical information and enjoys a wide distribution across the water industry.
Advertising is limited to the equivalent of 5 full pages for each edition. There are 7 ads per publication
Scan the QR code to see our 2026 Media Kit and enquire today.
For more information email info@wioa.org.au
Figure 4 and 5: Citric Acid Dosing Cabinet with multiple equipment at ground level.
INVESTIGATING THE IMPACT OF RECYCLED WATER USE ON SOIL, GROUNDWATER AND VEGETATION AT ISAAC REGION, QLD
This study examines the impact of recycled water use on soil, groundwater, and vegetation around the Moranbah wastewater treatment plant (WWTP) - Isaac Regional Council (IRC), Queensland. The use of recycled water (treated wastewater) is a common practice in Queensland; though the scale of this use is often limited by regulatory permits that allow discharge of treated wastewater to receiving waters, which can often be more cost effective. Within IRC, recycled water from WWTPs is used for irrigation, serving both beneficial reuse (supporting vegetation and landscapes) and disposal (managing effluent volumes).
IRC operates recycled water systems across six communities: Nebo, Clermont, Glenden, Middlemount, Dysart, and Moranbah. These treatment plants provide up to tertiary-level treatment, including solids removal, nutrient reduction, disinfection, and lagoon storage.
The Moranbah WWTP located approximately 2 km northeast of the township, services sewered areas with a peak design capacity ranging from 10,000 to 50,000 equivalent persons (EP). The 1.6-hectare site is surrounded by recreational areas, including playing fields and a golf course, as well as residential zones and adjacent mining lease land. Surface runoff from the site flows westward toward the Isaac River
(approximately 1.3 km away), while a designated outfall discharges into Grosvenor Creek (approximately 2.5 km away).
Methodology
Monitoring was conducted in accordance with the Receiving Environment Monitoring Plan (REMP) and included:
• Monthly site inspections, supported by photographic records
• Annual soil profile sampling and laboratory analysis
• Six-monthly groundwater monitoring (with monitoring bores currently being established).
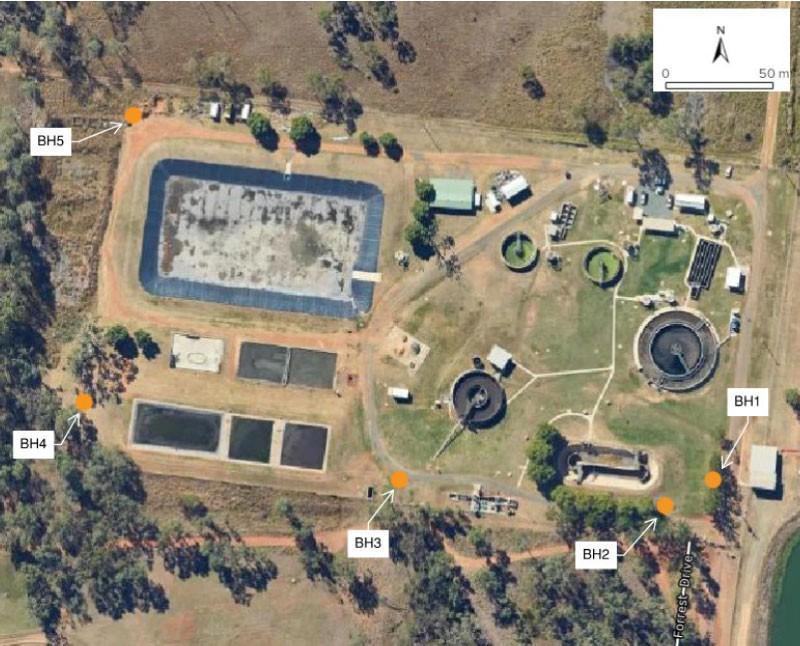
Under Environmental Authority (EA) conditions, irrigation is permitted at a Fig 1 Soil Sampling Points around Moranbah WWTP (Bligh Tanner REMP, 2022)
maximum rate of 97 kL/day. Six designated sampling locations were monitored through routine visual inspections of vegetation and periodic soil sampling.
Results
Results for recycled water quality, soil analysis and visual monitoring are presented below.
Quality of Treated Effluent (Recycled water)
Effluent monitoring was conducted in accordance with EA sampling frequencies. All recorded parameters complied with regulatory limits – the key results are summarised below in Table 1.
Visual Monitoring of Vegetation
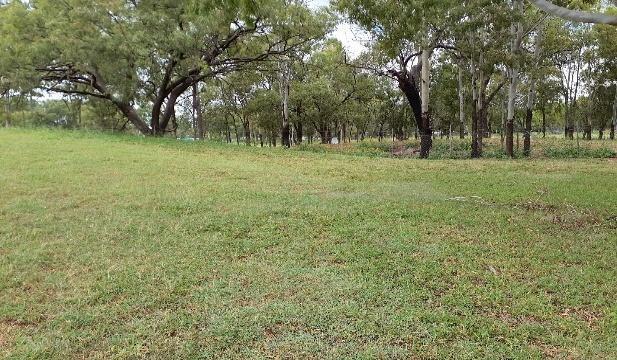
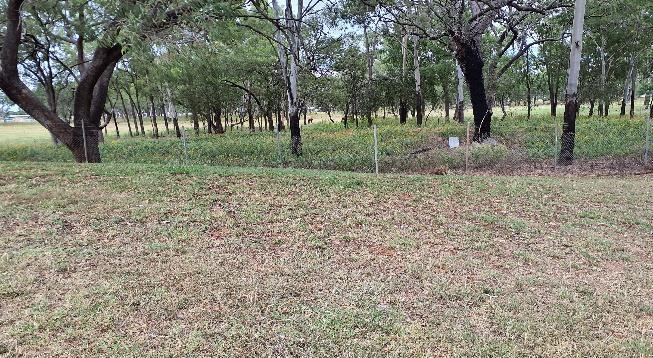
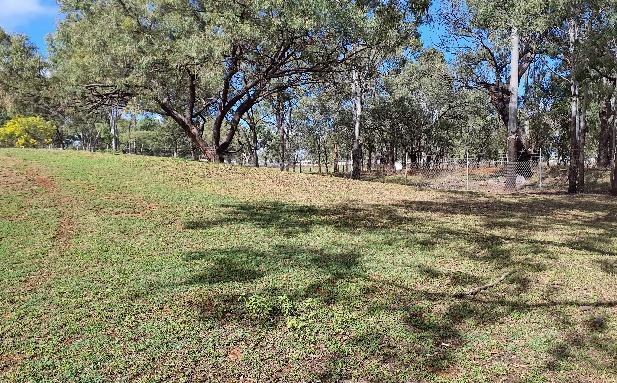
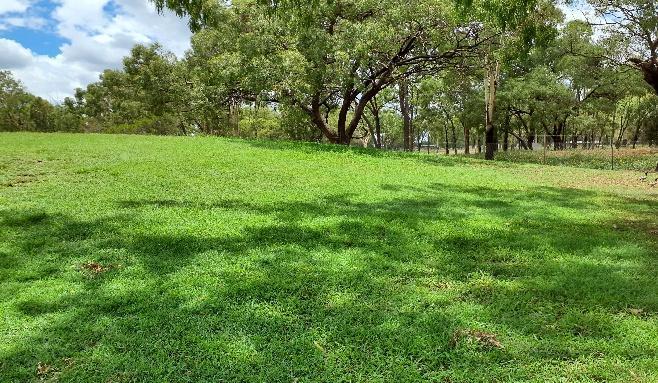
Ongoing visual inspections indicated that vegetation responded positively to recycled water irrigation. Grass coverage remained dense and healthy during irrigation periods, demonstrating effective nutrient uptake.
Conversely, when irrigation ceased, vegetation exhibited signs of stress, including wilting and reduced vigour. Importantly, no evidence of salt accumulation or surface degradation was observed across the monitoring sites (Figure 2).
Soil Analysis
Soil samples were collected per EA requirements. Results are summarised in Table 2.
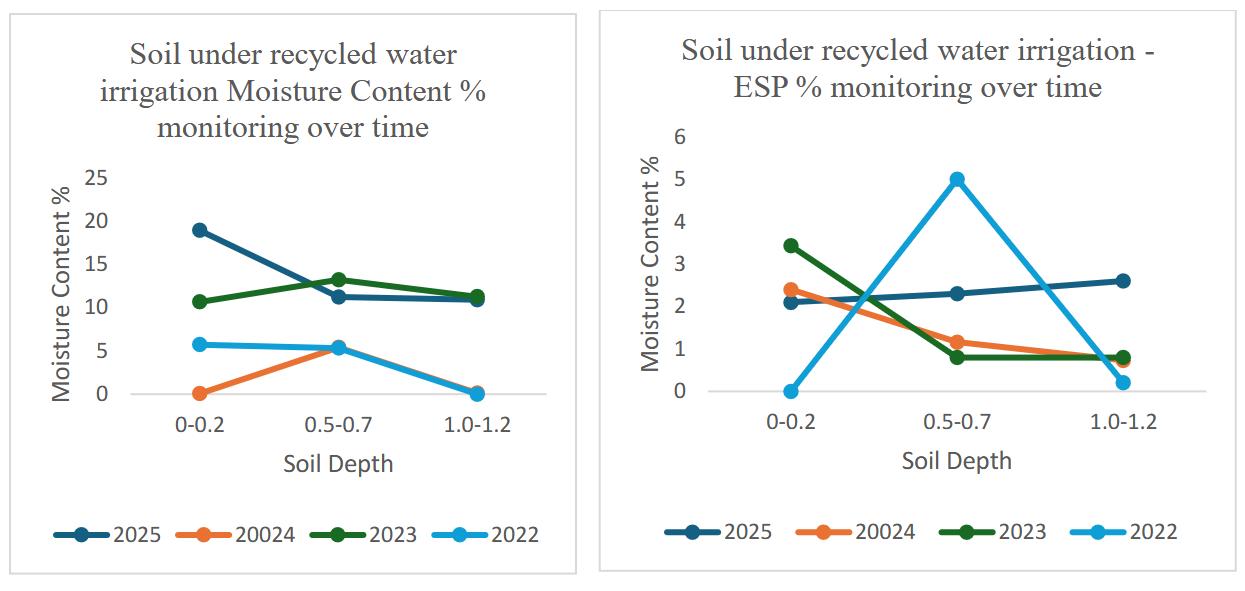
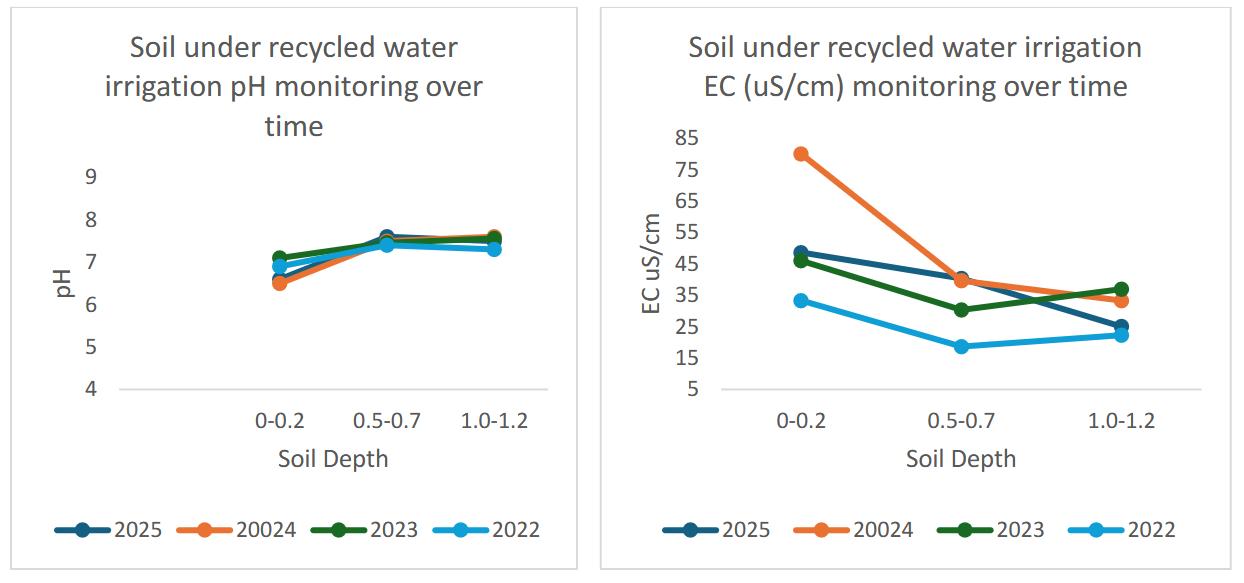
Results from April 2025 soil sampling indicated a moist topsoil layer (7.2 to 25.7%), with neutral or slightly acidic pH, increasing with depth. The Exchangeable Sodium Percentage (ESP) values were generally below detection limits or below the sodic threshold of 6%, indicating non-sodic conditions at most locations (Northcote and Skene 1972). However, MBH3 showed 6.5% ESP at 0.5 – 0.7
Table 2: Monitoring results for soil samples from areas irrigated with recycled water from the Moranbah WWTp
(pH, EC, Moisture, Exchangeable Cations, Total Nitrogen)
Table 1 Monitoring results for recycled water
n ed that vegetation responded positively to recycled water dense and healthy during irrigation periods, demonstrating
sample confirmed 0.72 mg/L. that vegetation responded positively to recycled water dense and healthy during irrigation periods, demonstrating
irrigation. Grass coverage remained dense and healthy during irrigation periods, demonstrating effective nutrient uptake.
reduced vigour. Importantly, no evidence of salt accumulation or surface degradation was observed across the monitoring sites.
Conversely, when irrigation ceased, vegetation exhibited signs of stress, including wilting and reduced vigour. Importantly, no evidence of salt accumulation or surface degradation was observed across the monitoring sites.
Fig 2 Visual inspection of any impact of Recycle water use on vegetation and soil over time, at sampling site #2.
Feb 2024
vegetation exhibited signs of stress, including wilting and vidence of salt accumulation or surface degradation was es.
July 2024
Fig 2 Visual inspection of any impact of Recycle sampling site #2.
Feb 2024
egetation exhibited signs of stress, including wilting and vidence of salt accumulation or surface degradation was
July 2024
impact of Recycle water use on vegetation and soil over time,
of Recycle water use on vegetation and soil over time,
July 2024
July 2024
December 2024
m depth and 7.6% at 1.0 – 1.2 m depth. These results are higher than in previous monitoring rounds; for example, in April 2024 ESP ranged from 1.8 to 4.0% at MB3. However, it is considered that these elevated results are more likely due to the natural heterogeneity of soil than from the irrigation.
EC in both the surface soils and the subsurface soils was quite low ranging between 23 µS/cm and 65 µS/cm. The nitrogen concentrations are of typical value for duplex soils. The nitrogen concentrations decrease as depth increases across the site. The total nitrogen concentrations of the subsoil have not approached the topsoil concentrations, suggesting that at all sites the grass is assimilating the majority of the nitrogen. Topsoil values are expected to be significantly higher than subsoils owing to the higher quantities of organic matter in topsoil, and the values are expected to
3: soil pH, EC,
Content and Esp comparison over time at Moranbah
vary widely owing to the uneven nature of organic matter, as well as animal droppings. No heavy metal guideline exceedances were observed, indicating no accumulation of contaminants associated with recycled water application (Figure 3).
Conclusion
Effluent quality consistently met EA requirements, confirming the reliability of the treatment process. Vegetation monitoring demonstrated positive growth responses under irrigation, with no evidence of long-term degradation.
Soil properties have remained stable over multiple years of monitoring, with no indication of salinity, sodicity, or contaminant build-up attributable to recycled water use. While groundwater data collection is ongoing, preliminary findings show no evidence of adverse impacts.
Based on the available data, the use of recycled water at Moranbah WWTP can
be considered environmentally sustainable, with no significant risks to soil, vegetation, or groundwater systems.
References
• Bligh Tanner (2022a). Irrigation Management Plan, Report for IRC, 7 Dec 2022.
• Bligh Tanner (2023). Moranbah WWTP REMP, Report for IRC, 26 Jun 2023.
• Bligh Tanner (2022b). Moranbah WWTP REMP Annual Report 2021–22, Report for IRC, 15 Dec 2022.
• ASC NEPM (2013). National Environmental Protection (Assessment of Site Contamination) Measure 1999 (Amended 2013)
BUILDING RESILIENCE INTO SEWAGE TREATMENT: ADAPTIVE OPERATIONAL STRATEGIES AT PORT FAIRY
EbonyPerrinandTina(Fatemeh)Golkhou, Wannon Water and SMEC
Introduction
A study at the Port Fairy Sewage Treatment Plant (STP) near Warrnambool (Victoria), examined the effectiveness of an adaptable operational strategy intended to sustain plant performance across a range of projected flow conditions. The strategy aims to mitigate operational risks and improve the overall efficiency of wastewater treatment processes, particularly during low flow periods.
Wannon Water identified potential variations in trade waste influent loads expected between April 2024 and March 2025 due to changes in trade waste customer demand. To address this, Wannon Water engaged SMEC to undertake a process and risk investigation and to develop an adaptable operational strategy to identify and mitigate potential risks and impacts on the Port Fairy STP.
port Fairy sTp process Description
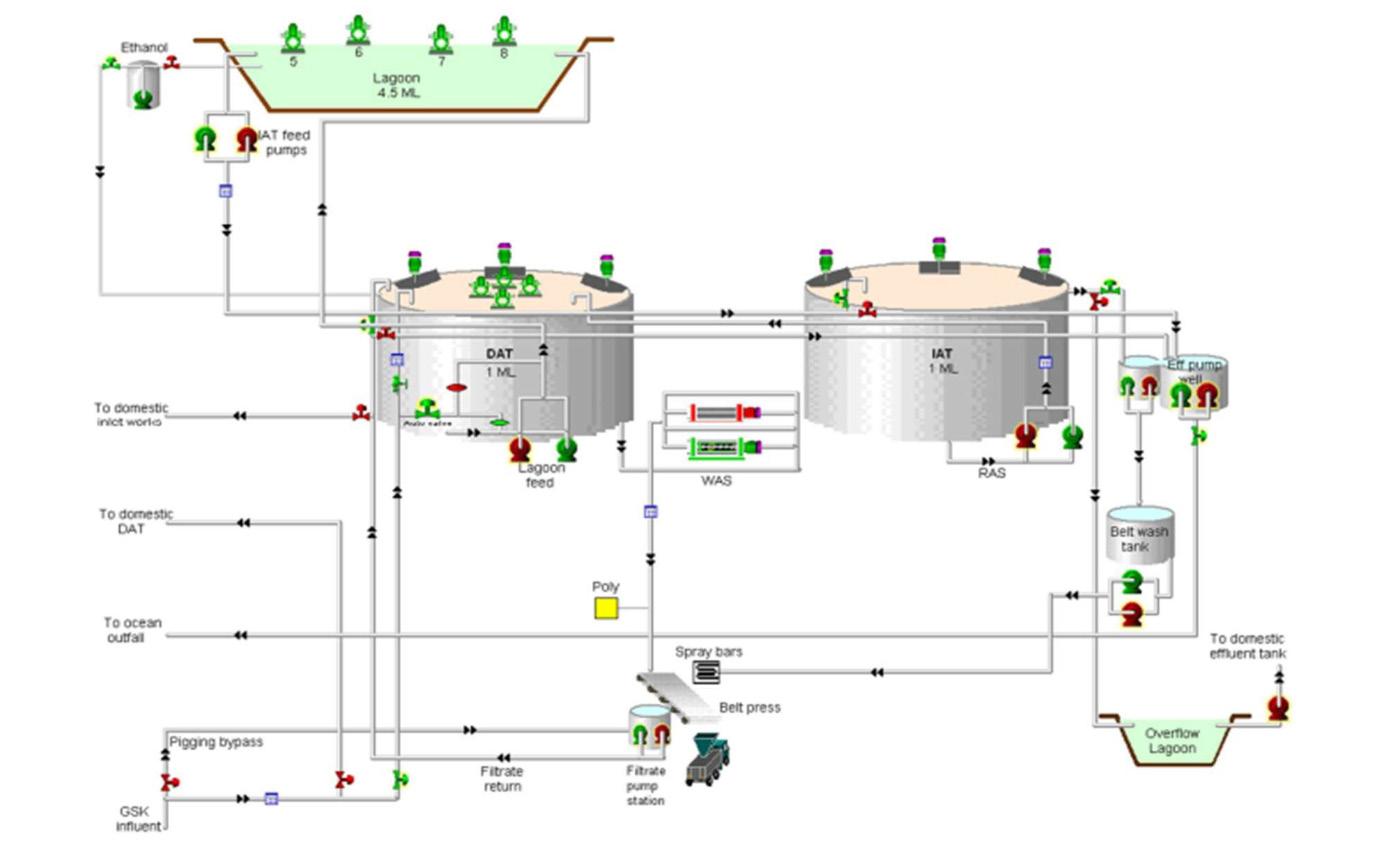
The Port Fairy STP consists of three process reactors: the Aerated Lagoon, the Demand Aeration Tank (DAT), and the Intermittent Aeration Tank (IAT), which can be operated in various configurations depending on the influent loads to achieve optimal treatment performance (Figure 1).
The influent can be directed entirely to the Aerated Lagoon, to the DAT, or split between the two. The IAT receives its feed either from the DAT or the lagoon, depending on the operational configuration. The operator manually adjusts these settings based on the dissolved oxygen levels within the tanks. The IAT operates in a cyclic mode comprising aeration, settling, and decanting phases, with return activated sludge (RAS) directed back to the DAT.
Waste activated sludge (WAS) extracted from the DAT is pumped to a belt filter press for dewatering. The dewatered sludge is transferred to a collection bin, which is periodically removed by truck and transported to Wannon Water’s biosolids facility. The filtrate from the belt filter press is collected in a sump and returned to the DAT for further treatment.
During periods of low oxygen demand, the Aerated Lagoon can be bypassed entirely. Under high influent loading conditions, the plant is configured to receive influent with an approximately 50/50 split between the Aerated Lagoon and the DAT. Industrial influent is blended with about 5% domestic sewage to enhance biological activity and accelerate the activated sludge process.
Table 1: port Fairy sTp influent data during the trial period ( January 1 – February 26, 2024).
The treated effluent from the Port Fairy STP is discharged through an EPA-licensed ocean outfall located south of Griffiths Island.
process investigations
A trial was conducted between January and February 2024, where the plant experienced four operating modes indicative of what Wannon Water could expect after the impending trade waste demand changes in 2024-2025. However, the timing and duration were expected to be more extensive compared to the trial period, which needed to be considered.
The influent data from the trial period and the treated effluent quality compared to EPA discharge requirements at Port Fairy are provided in Tables 1 and 2.
An analysis of historical influent and effluent quality data demonstrated that the Port Fairy Sewage Treatment Plant (STP) successfully maintained compliance with licence conditions during periods of short-term low flow, provided that the entire treatment process was in operation. Nonetheless, SMEC identified several key risks associated with the projected longterm low-flow conditions. These included the minimum hydraulic loading required for each process unit, the maximum treatment capacity of the Aerated Lagoon and Demand Aeration Tank (DAT), the potential need for carbon dosing in response to influent characteristics, and the risk of non-compliance with licence conditions due to variations in influent composition. These aspects required further detailed assessment.
Results
The Port Fairy Sewage Treatment Plant (STP) process schematic is presented as a simplified flow diagram in Figure 1. To optimise energy consumption and minimise the plant’s carbon footprint, the feasibility of operating only essential equipment during low-flow periods was investigated. The ultimate treatment capacity of the main process tanks (Aerated Lagoon, DAT, and IAT) was assessed to ensure that sufficient process units remained operational to sustain microorganism health under low organic loading conditions, thereby preventing cell death and biological activity decay.
Using site trial data collected between January and February 2024, the anticipated daily flow and chemical oxygen demand (COD) were projected for the expected low trade waste demand period between
2: port Fairy sTp treated effluent quality vs. EpA License limits during the trial period ( January 1 – February 26, 2024).
April 2024 and March 2025, as summarised in Table 3. Deviations from expected load values indicated a highly variable and unpredictable inflow pattern, with significant fluctuations in wastewater strength. This variability was identified as a major risk when considering the temporary shutdown of treatment process units.
Additionally, the plant's operational constraints associated with the lagoon and DAT, as outlined in Table 4, had to be considered during low-flow modes. The key operational constraints are outlined in the following sections:
Hydraulic Levels
Based on Table 4, the plant was expected to struggle with maintaining the required water levels when operating with a 50/50 split between the lagoon and DAT during low-flow conditions (Mode 4). To keep the DAT and lagoon within the required operational level margins, domestic wastewater was recommended to be added
the industrial influent as a top-up. The domestic influent specification, optimum top-up volume and its availability, as well as the required upgrades—considering the potential of the existing infrastructure and the minimum necessary adjustments— were investigated in this regard, given the temporary nature of the low-flow period.
Treatment Capacity
Although the individual treatment capacities of the lagoon and DAT are sufficient to handle the incoming loads, bypassing either unit during low-flow conditions was not recommended due to challenges associated with future start-up. This is also due to the unstable nature of the influent, significant fluctuations, and the unpredictable duration of low-flow operating modes.
Additionally, in some operating modes, the available treatment capacity including both aeration and buffer capacity may exceed demand. To prevent over-aeration and sludge settling in the tank, operators
would need to adjust the aeration system accordingly.
Carbon Supplement
In biological reactors, the availability of organic carbon can be a limiting factor for effective denitrification. If naturally occurring organic matter is insufficient, adding an external carbon source can help facilitate the process.
During the trial at the Port Fairy STP, D.Nitro™, a non-toxic and non-hazardous nutritive carbohydrate, was used as a carbon supplement. However, due to the high COD levels in the influent during normal operation (Mode 1), carbon supplementation was not required. It is only recommended when the incoming influent has low COD levels, particularly during Mode 4. The maximum required dosage of the D.Nitro™ carbon source is shown in Table 5.
Treatment Process/Type
Differences in the biological reactors (Lagoon and DAT/IAT) and their unique
of plants operating modes, anticipated and measured influent loads- Jan 2024 to Feb 2024
3rd Mode
Table
Table 3: summary
operations impose limitations on efficiency and ease of operation.
The DAT bioreactor operates as a Completely Mixed Activated Sludge (CMAS) system, where the tank contents are thoroughly mixed to ensure uniform distribution of organic load, oxygen demand, and substrate concentration throughout the aeration tank. Proper mixing is essential to prevent short-circuiting of untreated or partially treated wastewater. To maintain optimal conditions, aerators/ aspirators would be carefully adjusted based on their location and supplied power. This is particularly critical under different operating modes to ensure sufficient air supply to the DAT reactor according to influent loads. Maintaining a fully mixed condition is necessary while avoiding over-aeration (DO > 2 mg/L), which can contribute to poor sludge settling and foaming in the IAT sedimentation process. Therefore, several parameters, including Return Activated Sludge (RAS) and Waste Activated Sludge (WAS) was to be carefully adjusted in the DAT system, whereas lagoon operation remained relatively simple.
Conclusions
The outcome of this investigation was innovative operational strategy for managing low flow periods at the Port Fairy STP. Table 6 summarises the strategy adopted during low/no flow influent flow periods at Port Fairy STP.
As a result of this study, Wannon Water staff operating the Port Fairy STP are now able to confidently adapt the treatment process using a procedure for extended industrial customer shutdowns lasting more than two weeks. Any risks to the biological treatment process, and therefore potential breaches of EPA-licensed effluent quality at the ocean outfall mixing zone are mitigated by relatively easy adjustments to the treatment process.
Wannon Water was able to apply the same approach to varying industrial trade waste inflows at other treatment plants including Warrnambool and Portland, both of which handle industrial trade waste components and are subject to licensed ocean outfalls.
~ 26 weeks Mode 1 & short periods (2-3 days) of Modes 2&3
~ 5 weeks Mode 4
~ 8 weeks Mode 1
~ 3 weeks Mode 4
~ 11 weeks Mode 1 & 2
Same as normal operation
Same as normal operation with minor modifications as: Carbon supplement ~400 L/d
Domestic influent top-up (minimum 1.7 l/s to the lagoon, up to 7 l/s to the DAT)
Same as normal operation
Same as normal operation with minor modifications as: Carbon supplement ~400 L/d
Domestic influent top-up (minimum 1.7 l/s to the lagoon, up to 7 l/s to the DAT)
Same as normal operation, During mode 2, the operator should adjust the required carbon supplement and domestic top-up based on the incoming loads
Table 4: Operational constraints (Lagoon and DAT)
Table 5: general properties of D. Nitro™ and required dosage during Modes 1 and 4.
Table 6: Adapted operational strategy summary for changing flow periods in 2024/2025
SLUDGY SOLUTIONS: DEALING WITH EXCESSIVE SLUDGE AT BAROSSA WTP
Liam Tothill,WaterProductionEngineer,SAWater
Andrew Sawilski,Wastewater&ReuseTreatmentManagerSouth,SUEZ
Introduction
Barossa Water Treatment Plant (WTP) was commissioned in 1982 to serve metropolitan and regional areas to the north of Adelaide. It has a design capacity of 160 ML/d and supplies a population of approximately 85,000. It is operated by SA Water, in partnership with SUEZ. The cost of sludge management at Barossa WTP represents a significant operational cost for the site, and the operational team aims to optimise sludge management to reduce this cost.
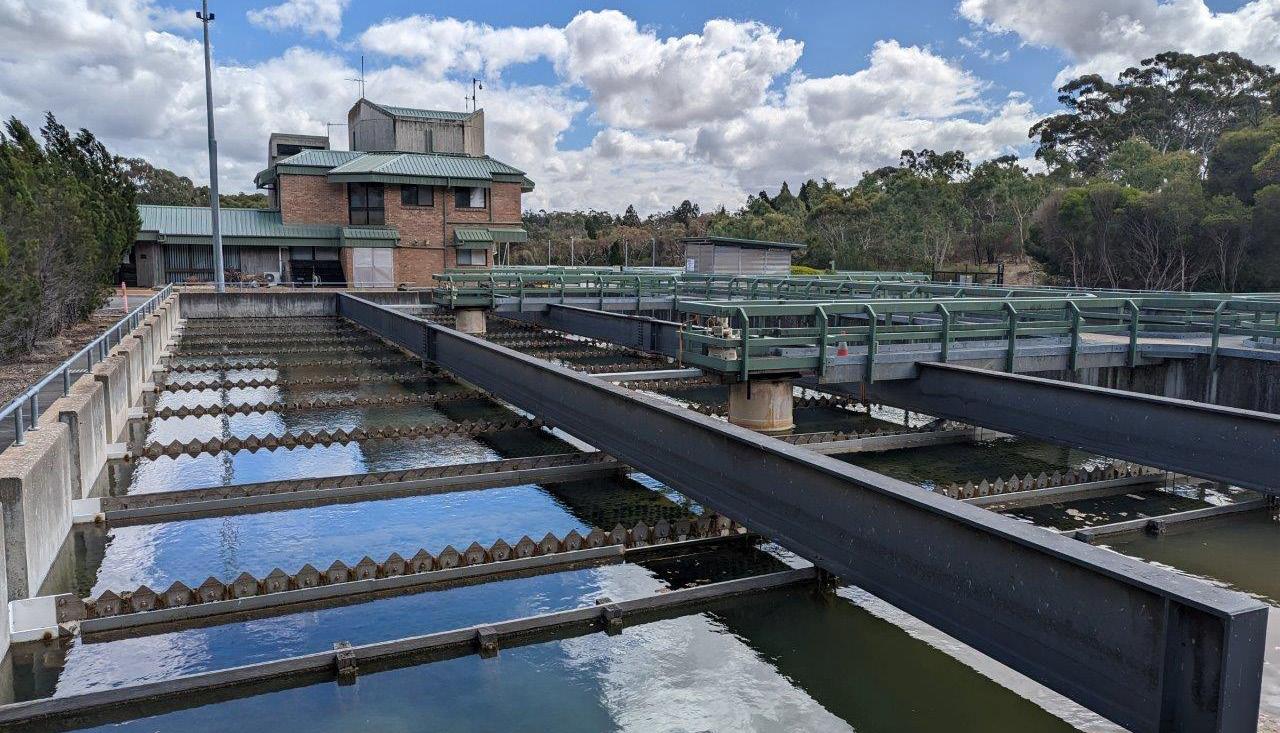
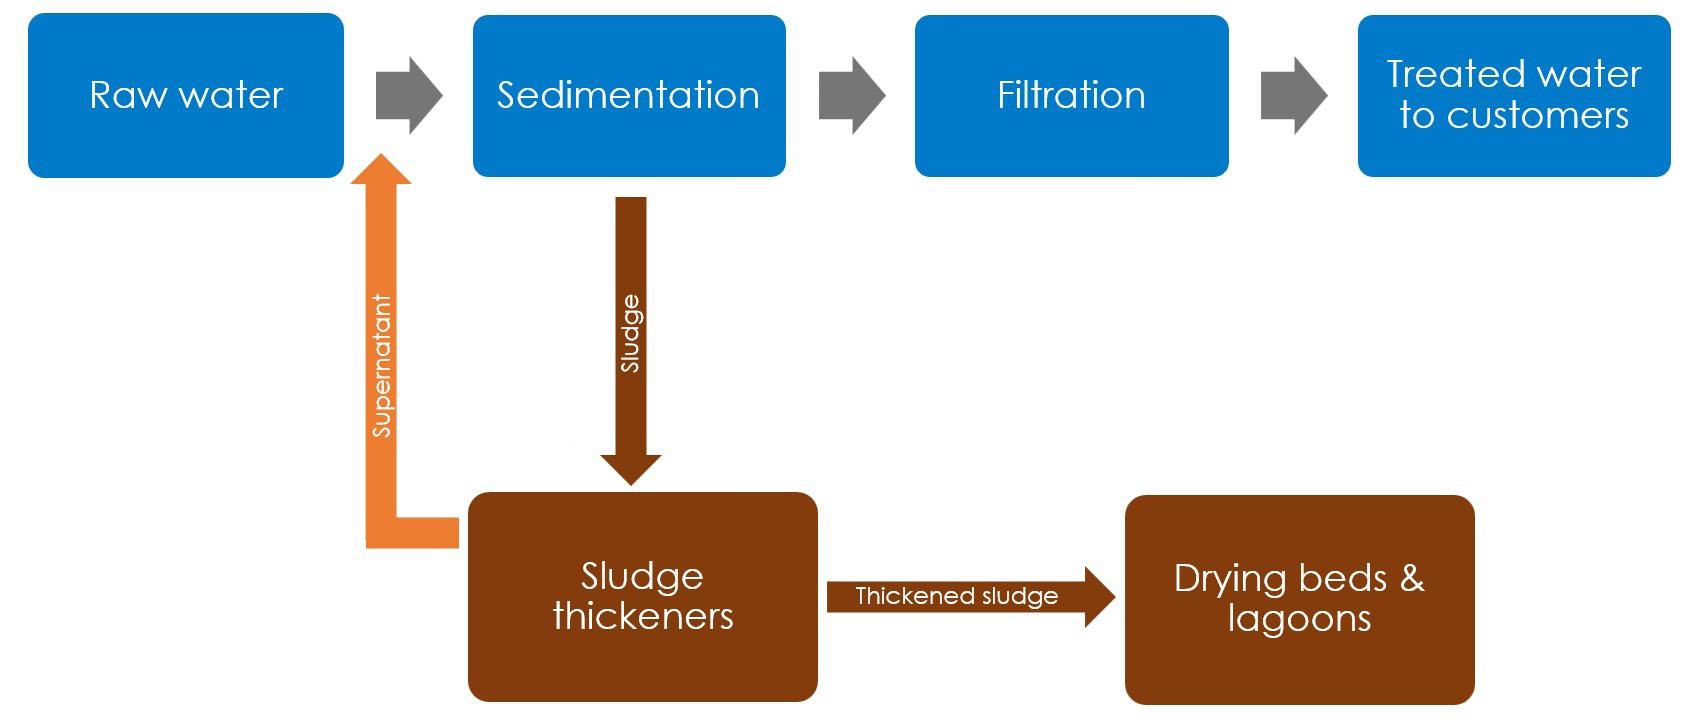
The treatment process at Barossa WTP is conventional. The raw water from Barossa Reservoir is coagulated with either aluminium sulphate or aluminium chlorohydrate, before passing through the flocculation stage into the sedimentation tanks (Figure 1). The clarified water is then filtered, disinfected with chlorine and fluoridated.
Sludge is generated in the sedimentation process (Figure 2). This sludge is removed from the sedimentation tanks and directed to
two sludge thickeners. The sludge thickening process removes some of the water from the liquid sludge stream. The thickened sludge is then directed to a series of drying beds and lagoons, where the sludge is dried via evaporation.
The final dried sludge product is used to rehabilitate an abandoned quarry, located within the SA Water reserve. During 2022/23 and 2023/24, compounding factors were experienced that impacted on the ability of the sludge lagoons to dry the sludge sufficiently for disposal to the quarry.
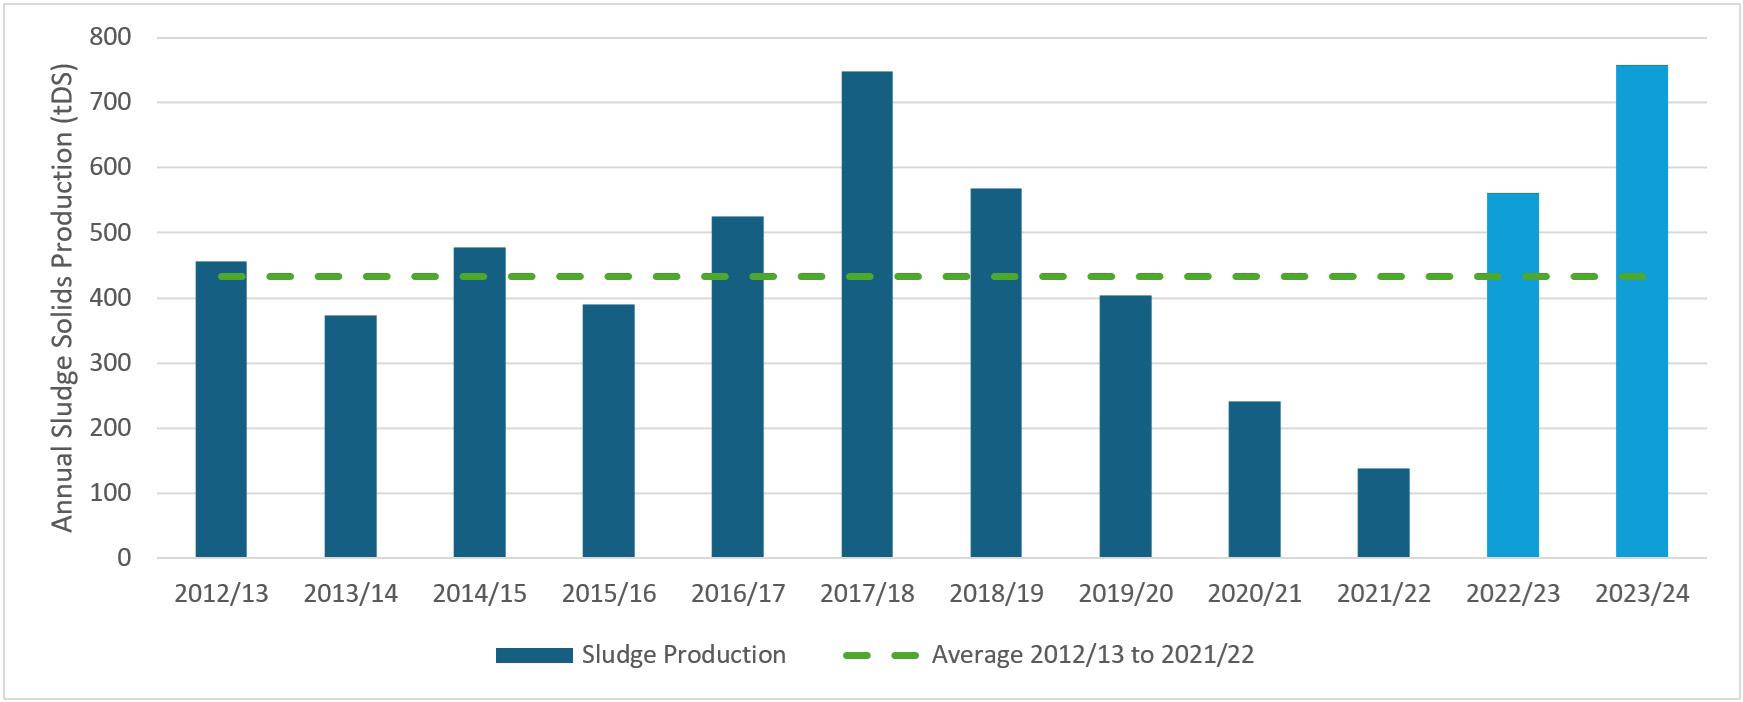
Firstly, the total amount of sludge generated at Barossa WTP was significantly above average (Figure 3). This was due to:
• High water demand being placed on Barossa WTP. Higher water production was prioritised at Barossa WTP during this period due to improved water availability within the Barossa catchment.
• Poor raw water quality at Barossa WTP. With significant volumes of fresh inflows into the Barossa catchment, there was a reduction in the
raw water quality. With higher loading of organic material and higher chemical dosing requirements, this meant that more sludge was being generated.
• Increased algal activity in Barossa Reservoir. With higher levels of nutrients in the raw water, this promoted more algal activity in the reservoir. This resulted in more frequent occasions when Powdered Activated Carbon (PAC) was required to be dosed to improve the taste and odour of the treated water, resulting in higher volumes of sludge.
Secondly, the weather conditions during the drying season (November-February) were cooler than normal during these two years.
The final factor was that the drying season was also wetter than normal during these two years.
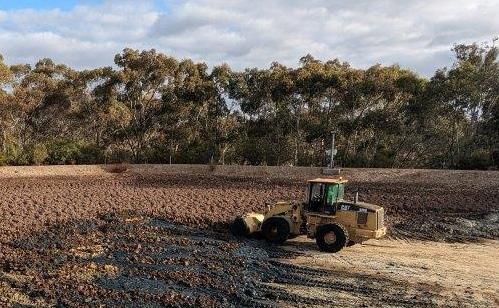
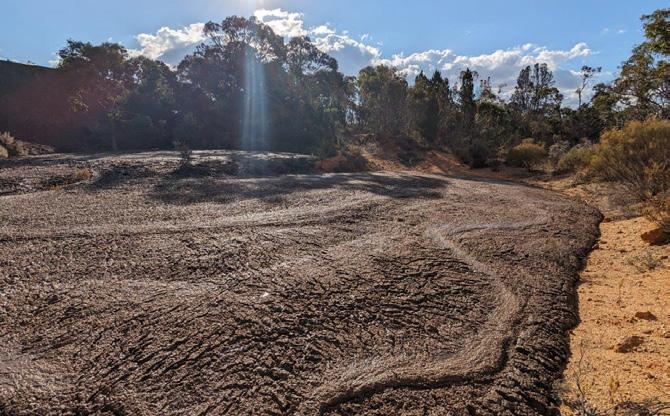
The combination of these three factors meant that it was significantly more challenging to effectively dry the sludge. This culminated in the sludge in Lagoon 1 still being too wet to be able to remove effectively at the end of the drying season in 2024 (Figure 4).
This wet sludge was unable to be safely disposed at the abandoned quarry (Figure 5). When the sludge was attempted to be disposed, it began to flow as a liquid slurry. If this was left un-checked, it may have resulted in a loss of sludge containment. Because of this, all further sludge movement was stopped, ensuring that no environmental incident would occur.
Because the sludge in Lagoon 1 was unable to be removed, it was apparent that there would be insufficient capacity in the remaining sludge drying assets for the following year. There was a need for the team to innovate to adapt to this challenging situation.
Figure 1: sedimentation Tanks at Barossa WTp
Discussion
There were a number of actions that were implemented by the team to reduce sludge production and to increase the sludge handling capacity of the site.
Sludge Lagoon 1 embankments
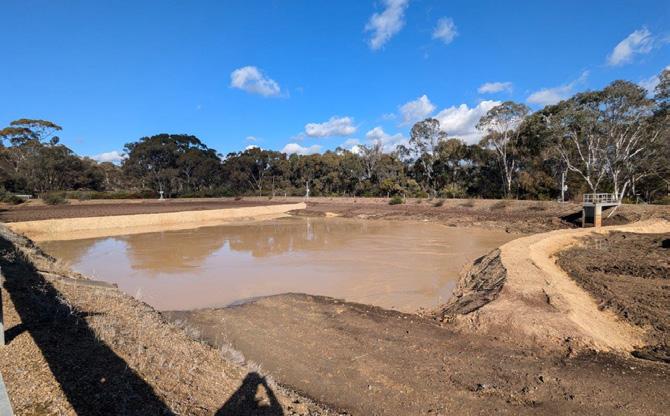
In order to allow the partially cleared area of Lagoon 1 to be used for sludge drying without impacting on the partially dried sludge that was remaining in the lagoon, two earthen embankments were installed into the lagoon (Figure 6). Clean fill with a high clay content was sourced from a local quarry to form the embankments.
These embankments ensured that Lagoon 1 would be partially available for the upcoming months of sludge production. In a typical year, this lagoon would be expected to be utilised for 6 months of sludge production. However, because only one third of the sludge lagoon capacity would be available, further actions were required.
Sludge Thickening
Barossa WTP was originally designed with two sludge thickeners. However, for at least the previous 15 years, the thickening process had not been used. Work was undertaken to restore the sludge thickening process to reduce the sludge volume.
The critical part of the sludge thickening process was the polyacrylamide dosing system. Barossa WTP already had an existing polyacrylamide batching and dosing system, with Magnafloc DW22S (cationic) being used as a flocculation aid. However, onsite testing showed that this particular grade of polyacrylamide was ineffective for sludge thickening.
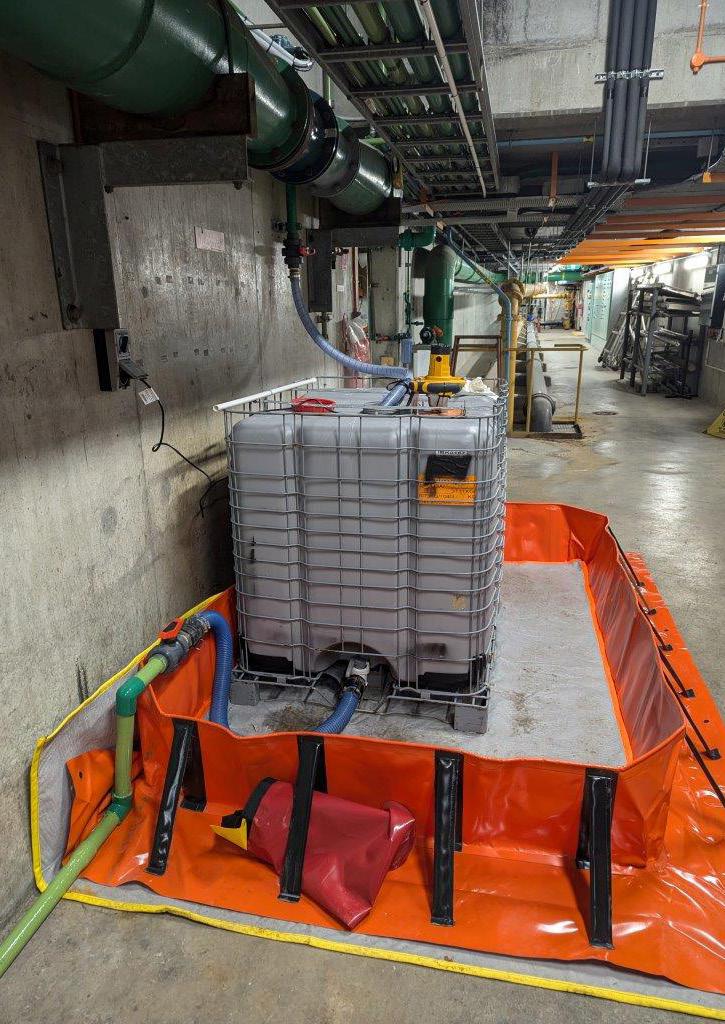
The team undertook further testing which found that Magnafloc DW20 (nonionic) was effective for sludge thickening. A temporary poly batching system was fabricated by the Maintenance team using a disused 1000 L container and an electric mixer (Figure 7). This was then plumbed into an existing dosing pump.
Figure 2: Barossa WTp Flow Diagram
Figure 3: Modelled Annual sludge solids production at Barossa WTp
Figure 6: Earthen embankments installed to Lagoon 1.
Figure 7: Temporary poly batching system.
Figure 5: Inability of sludge to be disposed to abandoned quarry at Barossa WTp.
Figure 4: Modelled Annual sludge solids production at Barossa WTp.
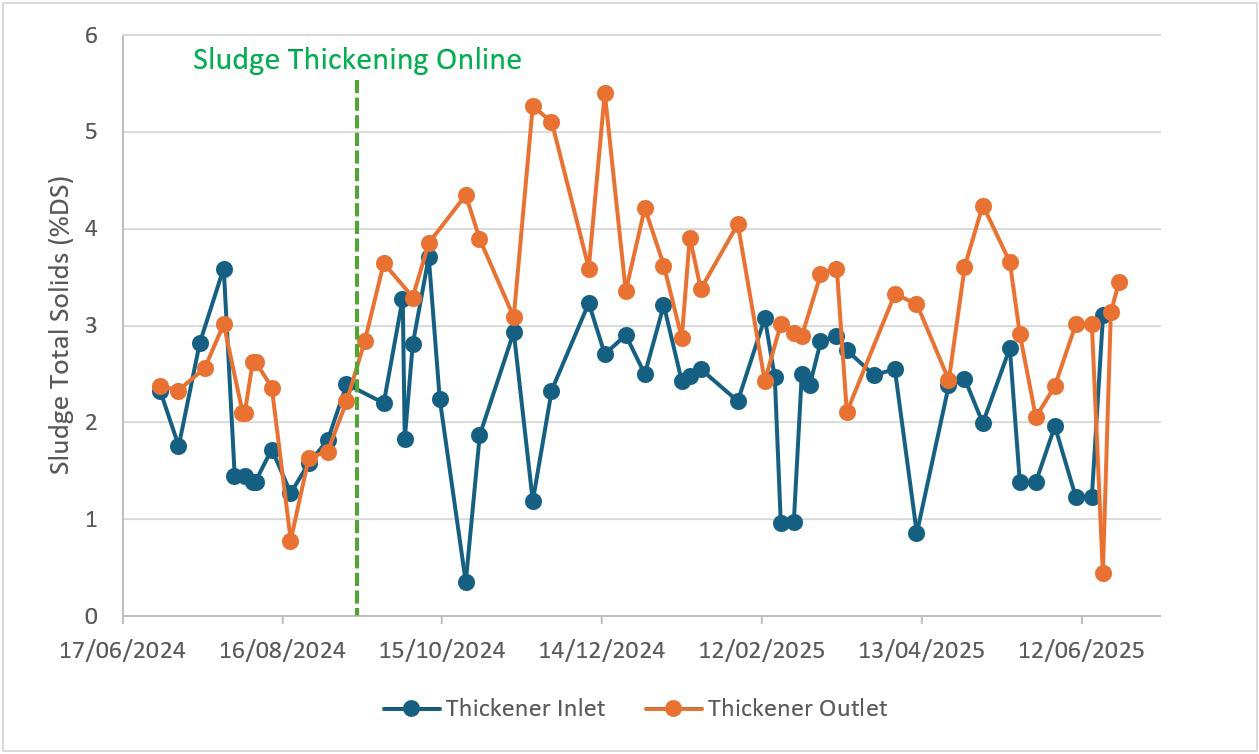
Once the sludge thickening process has been restored to service, a significant improvement in sludge thickness was observed (Figure 8). This resulted in a reduction in volume being pumped to the sludge drying assets.
Sludge Drying Bed & Lagoon Management
The operational schedule of the sludge drying assets was reviewed to maximise the overall capacity. The drying beds are a different design compared to the sludge lagoons. The drying beds are configured with underdrains whilst the sludge lagoons have no drainage. This means that the drying beds have a higher capacity to dewater the sludge.
In previous years, the sludge drying beds would be filled from empty to full, and then taken offline and allowed to dry. It was decided to apply multiple additional fills to each drying bed, after each bed had a few weeks to partially dry. These successive topups were done throughout winter and early spring. Even with the additional refills, there were no issues with drying the beds over summer. This confirmed that the additional top-ups were able to maximise the utilisation of the drying beds with no impact to their drying ability.
Because the sludge lagoons were not designed with underdrains they take longer to dry out. The deeper sludge tends to remain wet, even when the upper layer
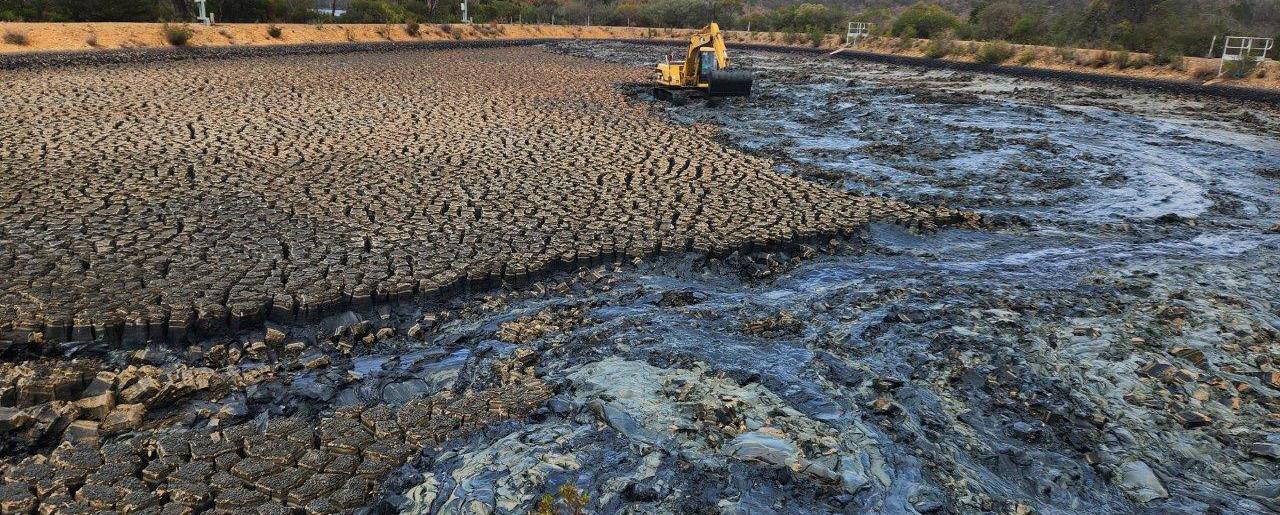
of sludge is relatively dry. In order to encourage the deeper sludge to dry out, a mid-season turnover of the sludge lagoon was implemented (Figure 9). This process brought the wet sludge to the surface and accelerated the drying process.
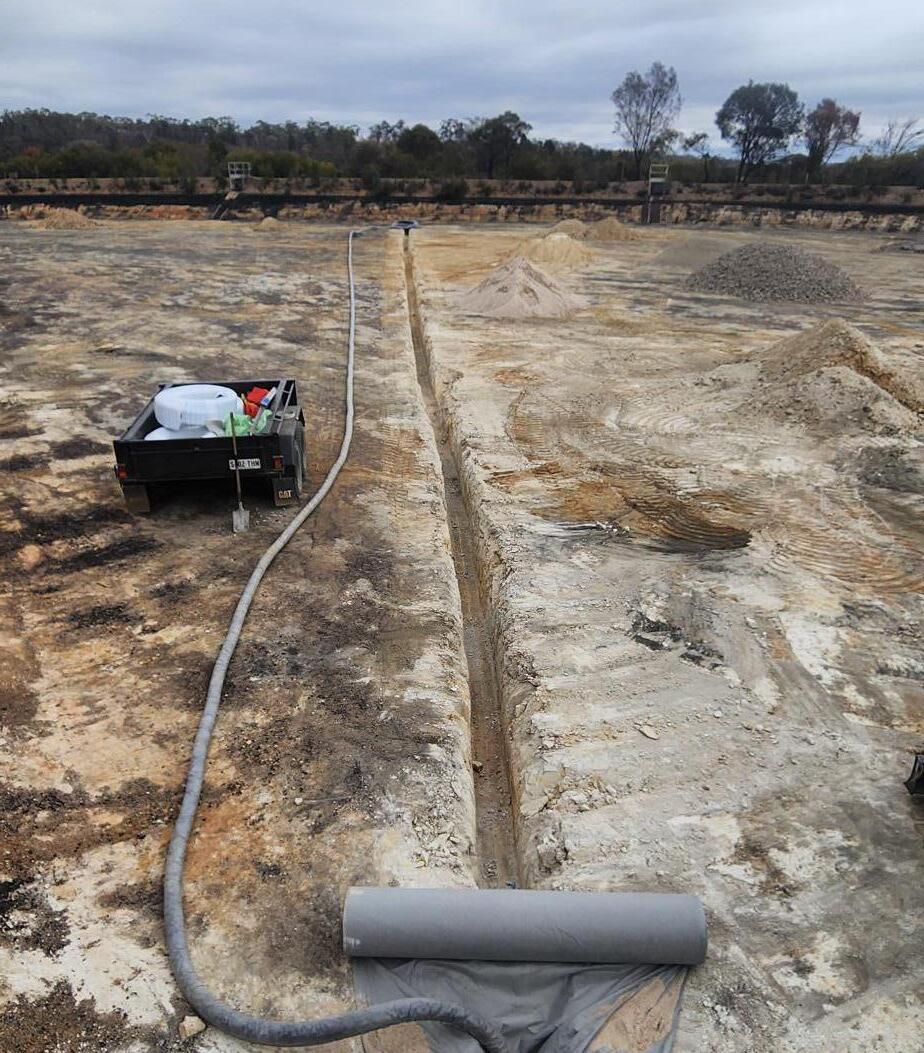
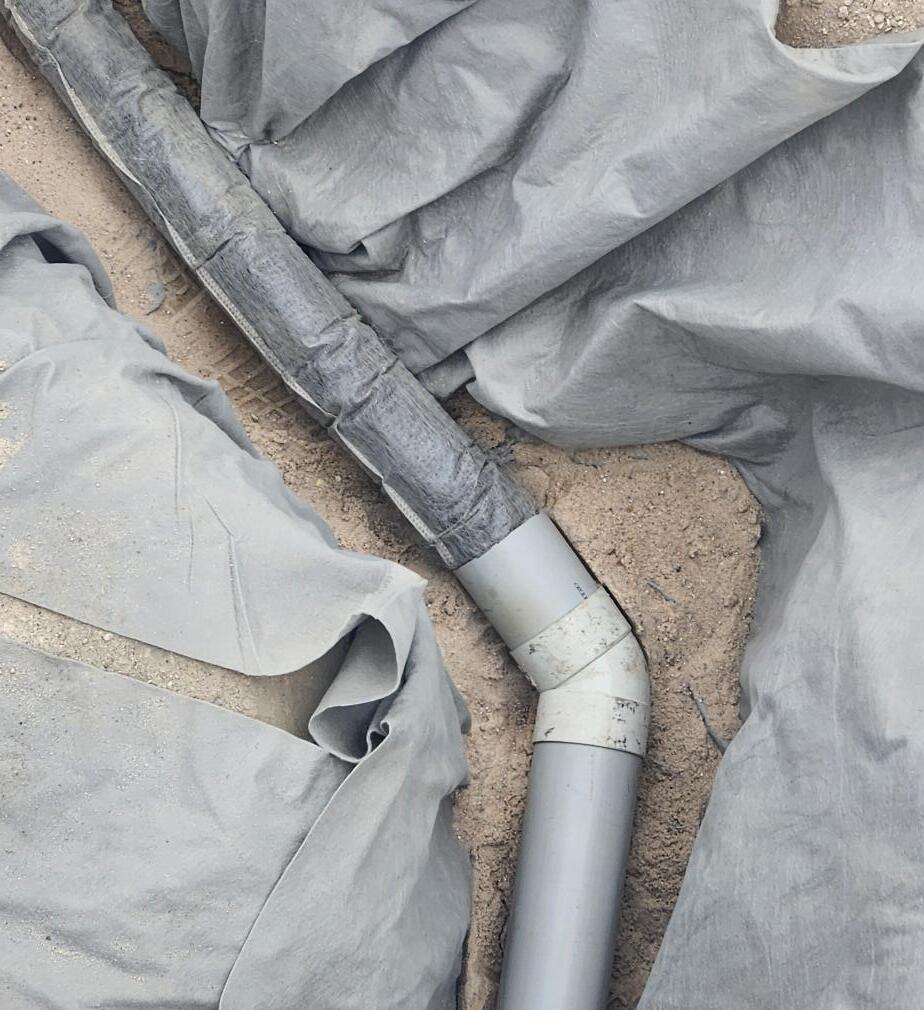
To further enhance the sludge dewatering capacity of the lagoons, it was decided to install a basic underdrain into the lagoons. These lagoons do not have any liner, with the local geology being impermeable. This allowed for an underdrain pipe to be installed directly into the base of the lagoon (Figure 10). The installation of this basic underdrain pipe has allowed for improved dewatering of the sludge lagoons, increasing their capacity.
Liquid Sludge Carting
Despite all of the actions implemented to minimise the sludge production, the sludge drying assets were approaching full level in November 2024. Alternative methods of dewatering the sludge or disposing of the sludge were explored. These included:
• rental equipment (eg. centrifuge)
• relocation & recommissioning of redundant sludge dewatering equipment from other sites
• vacuum trucks to transport the sludge offsite
The preferred option was determined to be the use of vacuum trucks. This option had the flexibility to increase/decrease in capacity as required. It was also lower cost
Figure 8: sludge thickness improvement after sludge thickening process recommissioned.
Figure 9: Lagoon 2 being turned over.
and easier to implement than the alternative options.
The preferred location to receive the excess sludge was Little Para WTP, which is the next-closest water treatment plant to Barossa WTP. The water treatment sludge from Little Para WTP is disposed directly to the wastewater network and had sufficient capacity to receive the excess sludge from Barossa WTP.
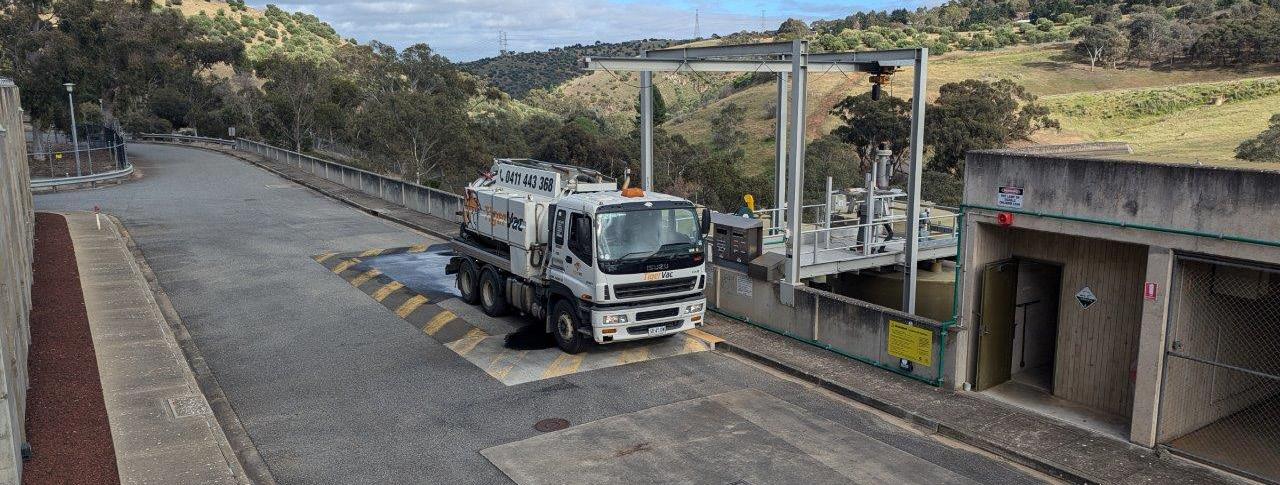
The Maintenance Team installed a 100mm camlock connection to the thickened sludge pipe at Barossa WTP for the vacuum trucks to load. A 100mm camlock connection was also installed at Little Para WTP to the sludge tank to for the vacuum trucks to unload (Figure 11). The unloading connection point at Little Para WTP was located within the chemical delivery bund, to ensure that any sludge spills would be
captured and avoid an environmental incident.
From November 2024 to January 2025, the level of sludge in Lagoon 1 was assessed each week, and a schedule was put in-place for the vacuum trucks. This ensured that the capacity of the onsite sludge treatment was maximised, and only the excess sludge was carted to Little Para WTP, minimising the cost of this process.
Conclusion
The combination of all the innovations and adaptations that were undertaken by the team at Barossa WTP enabled the team to successfully manage a challenging situation. Despite the limited sludge handling capacity that was available in Lagoon 1, the team was able to adapt. A series of corrective actions were delivered to ensure that the sludge was
able to be managed without any adverse environmental or safety impacts. This work also ensured that the water production capacity of Barossa WTP was not restricted, ensuring that our customers continued to receive a reliable supply of drinking water.
The learnings from this period have been documented and any improvements have been applied as part of the standard operation of sludge assets. This will ensure that Barossa WTP is best placed to adapt to increasing water demands in the future, along with a changing climate.
ACKNOWLEDgEMENTs
Thank you to the Water Production Operations & Maintenance team at Barossa WTP, who rose to meet the challenging circumstances and delivered a great outcome for our customers.
Figure 10: Underdrain pipe installed to base of Lagoon 2.
Figure 11: Vacuum truck unloading sludge at Little para WTp.
ICE PIGGING OF LARGE WATER MAINS: A RISK-BASED MAINTENANCE CASE STUDY
SalmanTariq,CharlesSwain,DatPham,ChristineGiang,EhsanFarno, South East Water, Melbourne, VIC
Andrew Nyholm,CMPConsulting,Melbourne,VIC
Ed Petts, SUEZ Australia & New Zealand, Melbourne, VIC, Australia
INTRODUCTION
South East Water (SEW) supplies drinking water to about 1.8 million customers through 14,639 km of water mains across 176 water distribution zones across Metropolitan Melbourne. The majority of SEW’s water is sourced from protected catchments in the Yarra Ranges, in Victoria, and is supplied to customers without filtration. While this reflects the high quality of the source water, the absence of filtration can result in the gradual accumulation of sediment and biofilm within water mains over time. Although this process is natural, it can still adversely impact water quality and chlorine residuals if not actively managed.
Historically, SEW relied on conventional techniques, such as flushing and air scouring, to remove accumulated sediments from water mains. While effective in smaller diameter pipes, these methods become increasingly limited in larger mains. Flushing is typically effective only up to 150 mm diameter pipes, and air scouring up to 250 mm diameter pipes [1] [2]. These limitations presented a challenge for managing water quality in large-diameter mains, as maintaining a minimum free chlorine residual of 0.2 mg/L throughout the network is recommended [3].
In response to these challenges, SEW adopted ice pigging as a suitable cleaning method for large-diameter water mains, where conventional techniques are less effective [4]. Ice Pigging provides a noninvasive and environmentally sustainable technology that utilises a saline ice slurry injected into a pipeline and propelled using system pressure to remove sediment and biofilm [5] [6]. The ice slurry forms into the pipe geometry and freely deforms as it flows around bends and valves, lifting any
sediment in the pipe rather than pushing it downstream. This reduces the risk of blockages, pipe damage and operational failures commonly associated with rigid pigging methods such as foam swabbing.
This article presents the outcomes from two consecutive annual Ice Pigging campaigns conducted by SEW in 2024 and 2025. The article describes the risk-based approach used for zone selection, the Ice Pigging methodology applied, and the operational outcomes achieved across both campaigns. The findings demonstrate the effectiveness of ice pigging as a scalable and repeatable maintenance technique for largediameter water mains, and provide practical insights for other water utilities who may be considering its adoption.
METHOD
Prioritisation of Mains: South East Water developed a risk-based prioritisation tool to identify and prioritise zones for mains cleaning, based on water quality and operational risk. Key inputs to the tool included customer complaints for dirty water (e.g. black and brown water) and for taste and odour, microbial water quality parameters, these being coliform counts
and heterotrophic plate counts, and general water quality parameters, including free and combined chlorine residuals. Zones with higher customer complaints, higher microbial water quality parameters, and lower chlorine residuals were assigned a higher priority for cleaning. Since its inception in 2024, this tool has been updated and improved further by adding average combined chlorine levels for each zone.
This prioritisation tool was applied across both annual Ice Pigging campaigns. Higher-risk zones were addressed during the initial campaign, with subsequent cleaning extended to additional zones with differing operational histories; however, they were still high on the prioritisation list. This risk-based prioritisation ensured that available resources were directed first to higher-risk areas of the network, where the potential for water quality improvement was greatest, before being extended to lower-risk zones, as part of a staged program.
Ice Production and Delivery: The Ie Pigging process commenced with the production of an ice slurry at the Ice Pigging Production Plant in Melbourne, run by SUEZ. The facility is capable of producing up to 10 tonnes of ice slurry per day by
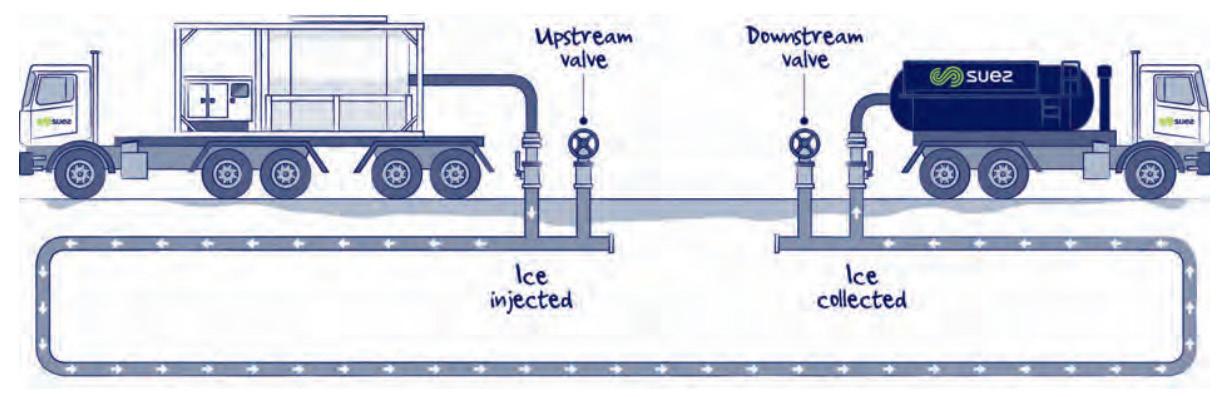
Figure 1: Ice pigging process schematic.
crushing freshwater flake ice and combining it with a controlled brine solution, which acts as a freezing point depressant and provides conductivity tracing during operations.
The ice slurry was stored and transported in insulated vehicles, maintaining its viability for up to 24 hours prior to use. This approach ensured consistent ice quality across operations and enabled flexibility in scheduling without compromising slurry performance. Ice production and delivery procedures remained consistent across both implementation years.
Ice Pigging Implementation: With the target main isolated, the required quantity of ice slurry was pumped into the pipeline via an insertion hydrant (Figure 1). As the ice slurry was inserted, water displaced by the ice exited the main through a designated discharge hydrant. To control ice pig formation during insertion, the discharge flow rate was maintained at or below the rate of insertion, causing the ice slurry to consolidate and form a cohesive plug within the main.
During insertion, pressure at both the insertion and discharge locations was continuously monitored to ensure that the normal operating pressures of the main were not exceeded. Once insertion was complete, both the insertion and discharge fittings were closed, and the upstream valve was fully opened. This additional pressure further compressed the ice pig and provided the driving force required to propel it through the main.
The discharge fitting was then reopened to achieve a flow rate corresponding to the optimal ice pig velocity within the main, typically in the range of 0.3 to 0.5 m/s, less than half the typical velocity of flushing. The optimal velocity was determined for each operation based on
main characteristics, system constraints and operational considerations, and could be adjusted, if required, to manage potential network impacts such as drawing water from upstream uncleaned mains.
As the ice pig progressed through the main, it behaved as a cohesive solid plug. However, its two-phase material properties allowed it to flow around obstacles, such as partially closed valve gates, bends, localised constrictions and tuberculation in cast iron mains. Rather than bulldozing material ahead of it, the ice pig lifted sediment and biofilm from the pipe wall and carried it in suspension between its ice particles, reducing the risk of blockages and limiting stress on the pipe wall.
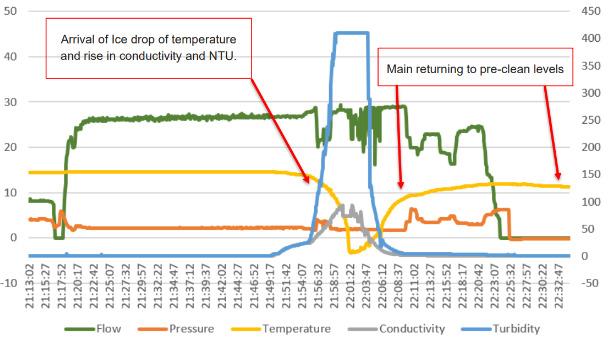
At the discharge location, pressure, flow rate, conductivity, temperature and turbidity were monitored in real time. Increasing conductivity provided early confirmation of the arrival of saline ice, while a drop in temperature below freezing indicated full ice pig arrival at the discharge point. Once this occurred, flow was diverted into waste tankers to ensure that all salt and sediment entrained within the ice pig were fully captured (Fig 2). Following completion of the operation, the main was flushed for a short period to remove traces of residual salt and sediment prior to being returned to service. Water displaced during the process was dechlorinated and safely discharged in accordance with environmental requirements, while the discharged ice slurry and entrained sediment were transported to an approved waste facility for disposal.
Operational consistency and refinement: While the overall methodology remained consistent across both implementation years, operational planning and execution benefited from experience gained during the initial campaign.
Refinements included improved shutdown planning, enhanced coordination with operational stakeholders, and increased confidence in estimating customer disruption durations for varying network configurations. These refinements supported the expansion of ice pigging to a broader range of zones during the second campaign, including areas with more complex constraints and even those that required night works.
REsULTs
The first campaign involved the completion of 24 operations over 22 km of main (predominantly large mains DN300–450, with some DN100-225), while the second campaign extended the program to a further 17 km of main (predominantly large mains DN300-375 with some DN150-280) across additional zones (Table 1). All works were completed without pipe excavations.
Sediment removal outcomes varied between the two campaigns. During the first year, ice pigging removed an average of 52.96 kg of sediment per kilometre of main cleaned. In the second year, average sediment removal was 26.48 kg per kilometre. This reduction verifies that the risk-based sequencing tool targeted mains in the higher-priority zones with greater historical water quality risk and higher baseline level of sediments during the initial campaign. And, therefore, during the subsequent year, mains in the zones with lower historical water quality risk and lower baseline levels of sediment were targeted.
Customer disruption was minimised across both campaigns. Average supply interruptions were kept below 1.5 hours per operation during the first year and below 2.5 hours per operation during the second year (Table 2). The increase in customer interruption duration during the second
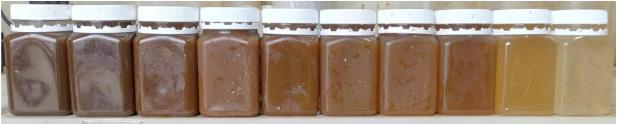
Figure 2: An example of Ice pigging samples taken at different intervals.
year was associated with longer ice pig runs and increased system complexity within the zones selected for cleaning, while remaining within acceptable operational limits.
Water usage during Ice Pigging operations was significantly lower than volumes typically required for conventional flushing and air scouring. Across both campaigns, cleaning was achieved using approximately 1.5 times the internal pipe volume, contributing to reduced environmental impact and improved operational efficiency (Table 3).
Overall, results from the two campaigns demonstrate that Ice Pigging technology can be consistently applied across large-diameter water mains, delivering effective sediment removal with controlled customer disruption and reduced water usage when implemented using risk-based prioritization.
Critical Success Factors
The successful implementation of the Ice Pigging solution for mains cleaning across two annual campaigns highlighted several critical success factors that contributed to effective cleaning outcomes, controlled customer impacts, and repeatability of operations at scale.
1. Risk-based zone selection: The use of a structured risk-based prioritisation tool was fundamental to maximising the benefits of the Ice Pigging method. Targeting zones with higher water quality risk and customer complaints ensuring an immediate water quality improvement.
2. Detailed planning and system understanding: Early and detailed planning was essential to manage system constraints and minimise operational risk. This included confirming valve operability, identifying appropriate/missing injection and discharge points, and assessing system redundancies. Shutdown trials and hydraulic assessments undertaken prior to ice pigging operations improved confidence in ice pig travel times and customer disruption estimates.
3. Operational monitoring and pressure control: Continuous monitoring of pressure, flow, conductivity, temperature, and turbidity during operations was critical to maintaining safe operating
conditions and confirming successful ice pig passage. The use of defined control measures, including pressure relief valves on insertion pumps, ensured normal operating pressures were not exceeded and reduced the risk of adverse network impacts.
4. Stakeholder and customer communication: Clear and consistent communication with operational teams, contractors, and internal stakeholders contributed to the smooth execution of the works. Timely customer notifications, and the recommendation for customers to temporarily close internal stop taps during operations, helped minimise water quality complaints, and managed expectations regarding short-duration supply interruptions.
5. Progressive operational refinement: Experience gained during the initial campaign allowed refinements to shutdown sequencing and execution strategies in the second year. These refinements supported improved operational efficiency and enabled Ice Pigging technology to be confidently applied across a broader range of zones.
CONCLUsIONs
Ice Pigging service has been successfully implemented by South East Water as a scalable and repeatable maintenance technique for cleaning large-diameter water mains. Across two consecutive annual campaigns, a total of 39 km of predominantly DN300–450 water mains were cleaned using a risk-based prioritisation tool, demonstrating the technology’s ability to be applied at scale under varying network conditions.
Given the complexity of this technology, the costs associated with the delivery of an ice pigging program is significantly more than traditional techniques such as air scouring. However, our assessment so far shows that the effectiveness of this technology is significantly greater than other technologies, particularly in larger pipes. Further investigations are being undertaken to understand effectiveness in consideration of the re-sedimentation rates in different
Table 1: summary of results.
Table 2: sediments removed and customer disruption.
Table 3: Water usage during ice pigging operations.
parts of SEW’s network to hopefully get a better understanding of which assets are more suitable for ice pigging vs air scouring and flushing.
Results from both campaigns confirmed that the Ice Pigging method consistently removed accumulated sediment, while using significantly less water than conventional flushing and air scouring methods. Higher sediment removal rates observed during the initial campaign reflect the targeted cleaning of higher-priority zones, while outcomes from the subsequent campaign demonstrate the effectiveness of the Ice Pigging method when applied to mains with differing operational histories. Customer disruption remained limited across both years, with no pipe excavations.
The findings show that Ice Pigging technology can be integrated into routine maintenance planning as a proactive approach to managing water quality risk in large-diameter mains. When supported by robust risk-based zone selection, detailed planning, and real-time operational monitoring, the Ice Pigging method provides a low-risk, water-efficient
solution for maintaining distribution system performance. The outcomes presented in this case study provide practical insights for other water utilities considering ice pigging as part of a long-term water quality improvement strategy.
REFERENCEs
[1] Huang, Y., Dong, F., He, G., Lin, Q., Wang, D., Shao, Y., Song, S., & Zhang, T. (2022). Review of ice slurry pigging techniques for the water supply industry: engineering design and application. ACS ES&T Engineering, 2(7), 1144-1159.
[2] Pourcel, F., & Duchesne, S. (2020). Comparative analysis of air scouring and unidirectional flushing of water distribution systems. Journal of Water Supply: Research and Technology—AQUA, 69(6), 578-590.
[3] National Health and Medical Research Council. (2011). Australian drinking water guidelines (Version 4.1). https://www. nhmrc.gov.au/about-us/publications/ australian-drinking-water-guidelines
[4] Dang, P., Jayaratne, A., & Wilson, G. (2014). Ice pigging–a better way to clean water mains. Yarra Valley Water, Australia.
[5] Berriman, G. (2011). Ice pigging-the way ahead for water main cleaning. In 5th Annual WIOA NSW Water Industry Engineers & Operators Conference, Newcastle.
[6] Huang, Y., Chen, Z., He, G., Shao, Y., Song, S., Dong, F., & Zhang, T. (2024). Application of ice pigging in a drinking water distribution system: impacts on pipes and bulk water quality. Engineering, 40, 122130.
Your opinion matters!
Help us improve this journal by completing our short survey scan the QR code below or visit our website wioa.org.au/waterworksfeedback.
Figure 3: parameters from discharge point during ice pigging operation 2025 (operation 10).
THE BIGGEST BANG: FIXING WATER HAMMER IN A DAF
Shane Dyson, Sam Bracken, Steven Buck Icon Water, Canberra, Australia
Introduction
Stromlo Water Treatment Plant (WTP) is the main drinking water treatment plant for Canberra and Queanbeyan. Commissioned in 2003–04, it employs dual media filtration and can treat up to 250 ML/d.
Its filtration process can be supplemented with dissolved air flotation (DAF). DAF is necessary when raw water turbidity is elevated, coagulation is ineffective, or water comes from the Murrumbidgee River.
These challenging conditions have been rare since the Millennium Drought. As a result, the plant has mostly used direct filtration, with DAF consigned to occasional testing and operator training.
The DAF bubble production system has experienced ongoing water hammer since commissioning. Over time, this was regarded as a characteristic of the system rather than a fault.
In February 2018, this assumption was very forcefully challenged.
The original DAF system
The DAF bubble production system consisted of six (6) fixed speed recycle pumps feeding five pressurised saturation vessels, with each vessel serving two filters.
The pipeline delivering DAF recycle water was roughly 450 metres long and maintained a static head of about 13 metres. The recycle water entered each saturation vessel above the operating liquid level. Vessels were pressurised to between 550 and 580 kPa and could only be depressurised through outlet valves.
The liquid level in each vessel was controlled by throttling its recycle water inlet valve. Startups and shutdowns were manual, depending on operators correctly sequencing valve operations.
Water hammer was common, especially when bringing vessels online or opening outlet valves. Various reactive, poorly documented modifications strengthened each previous failure point but did not stop the “bangs”.
Because the system operated infrequently, many operators had limited hands-on experience. This inexperience helped set the stage for the critical event to come.
The February 2018 “Big Bang”
In February 2018, during an “operateto-maintain” campaign, a communication breakdown during a shift change led to valves being opened in the wrong sequence by an operator who had never operated the system before.
This error led to water column separation—meaning the recycle water pipeline held pockets of air instead of a continuous water column—causing what
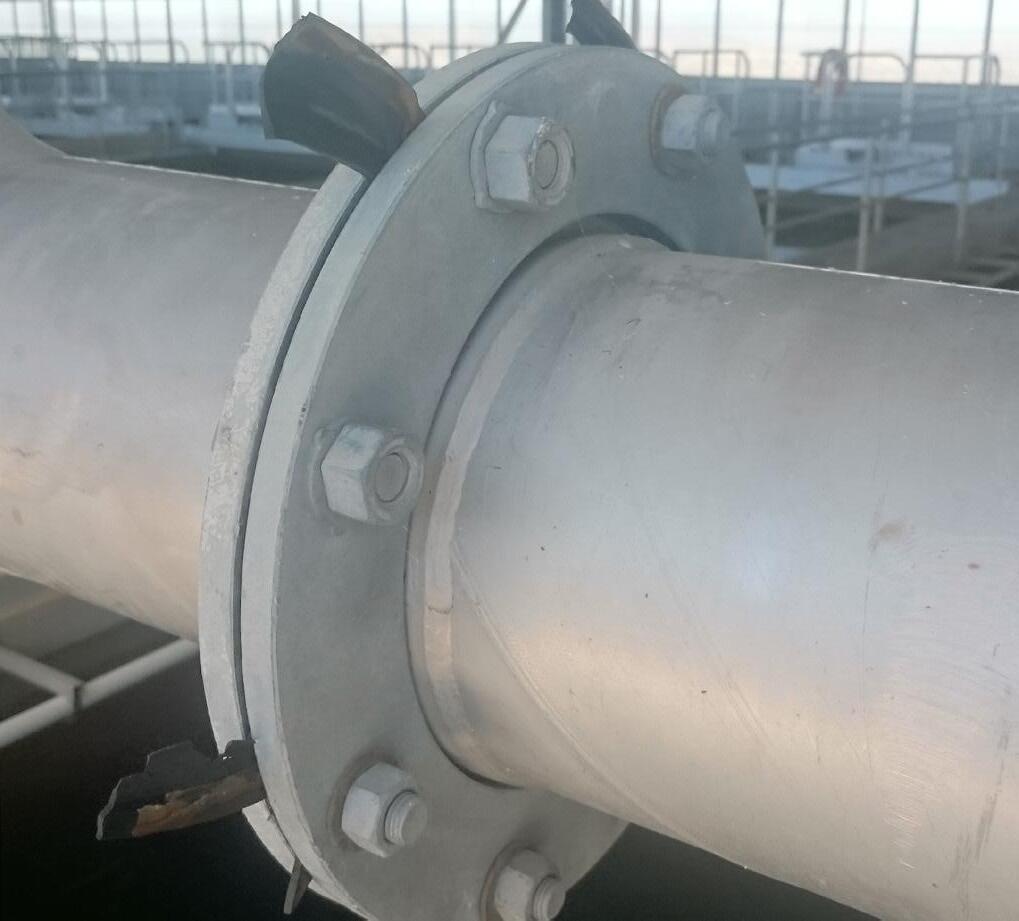
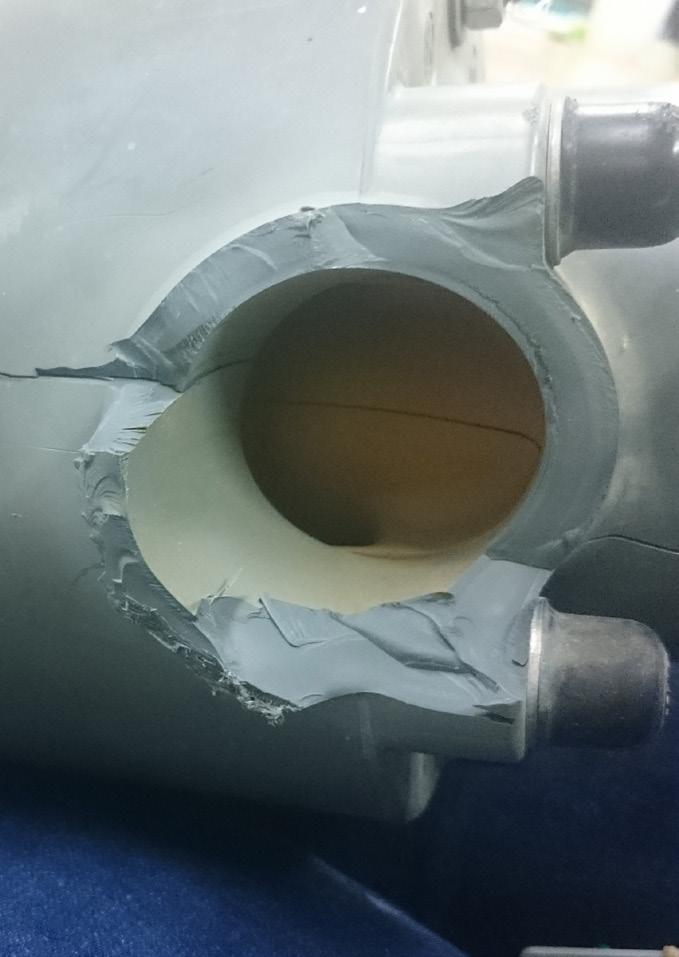
Figure 1: Rubber gasket that was blown out between flanges in the DAF recycle water pipeline approximately 350 m from the DAF recycle water pumps.
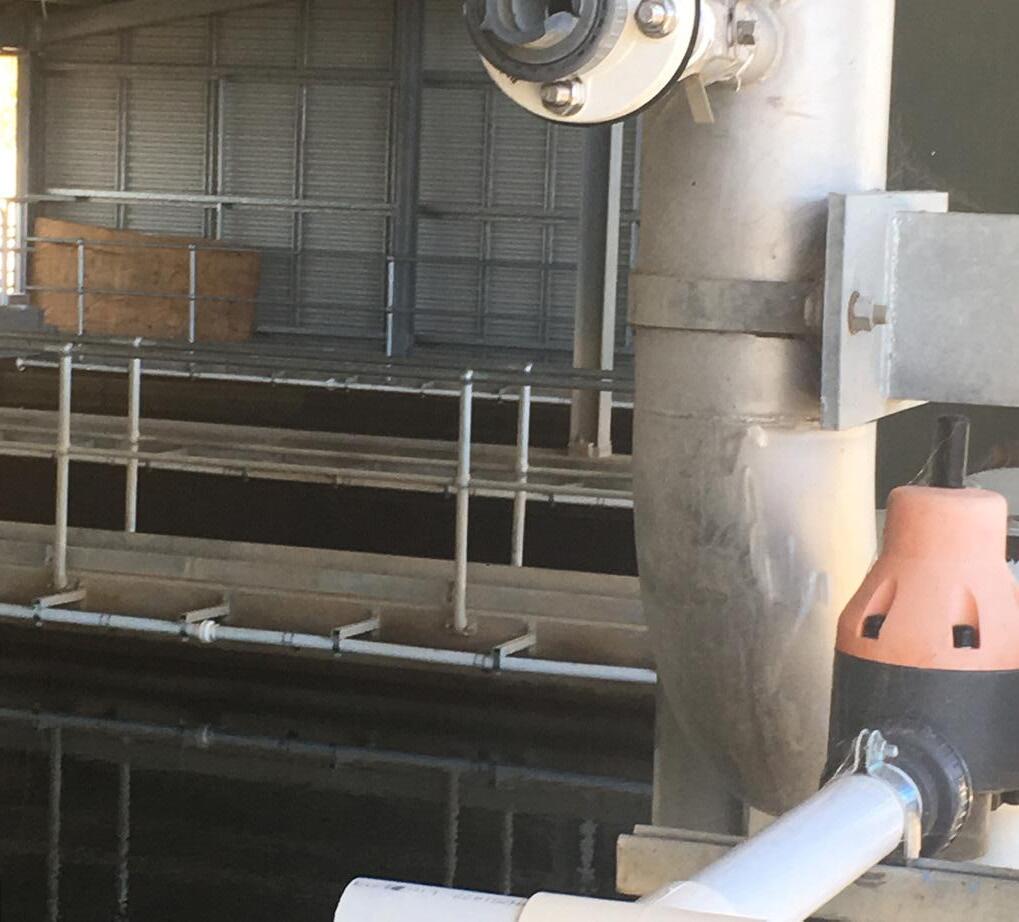
Figure 2: Damage to pressure regulating valves and pN16-rated pipework for DAFF water spray lines–valve has yet to be recovered or located.
appeared to be a severe and damaging water hammer event, more akin to an explosion.
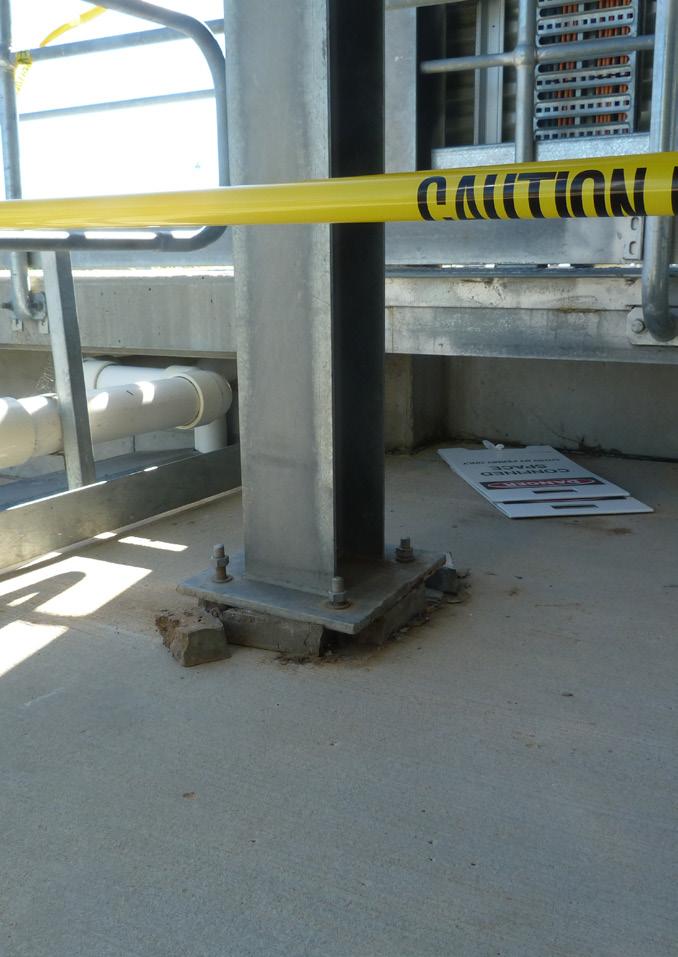
The resulting forces caused extensive damage to the system. Pipework shifted, supports were lifted, anchor bolts failed, and thrust blocks cracked. One 80 mm PVC pressure-regulating valve was blown off a section of pipework, ultimately landing 250 metres away in a car park. Other valves, or their remains, have yet to be recovered.
As a result of this incident, the DAF system was rendered inoperable.
No injuries occurred; however, the potential for serious harm was high, and critical drinking water infrastructure was placed at risk.
Why water hammer modelling didn’t have the answer
Icon Water engaged an external consultant to identify the failure mechanism and propose a solution. Conventional water hammer modelling showed that pressure transients could approach or surpass the pipe’s pressure rating. However, this alone could not explain the extent of the damage.
Their solution focused on strengthening the system through pipe, pipe support and valve upgrades and the installation of variable speed drives on each recycle water pumps. Startup and shutdown would remain
largely manual. With the root cause still unknown, their approach aimed to design a system to withstand a similar event in the future.
This raised several uncomfortable questions that remained unanswered:
• Why had operators reported worsening in-service water hammer around the saturator outlet valve for years, yet nothing was proposed to fix it?
• Why was this system different from others?
• Why did this occur during startup and not during steady-state operation?
• And most importantly, was the real hazard even being addressed?
Designing for intermittent operation
By 2020, Icon Water determined that a different approach was necessary, one that placed the operator at the centre of the design and recognised that intermittently operated systems behave differently from continuously operated ones.
Three guiding principles were adopted:
1. Reduce human error, particularly for infrequent tasks.
2. Choose equipment appropriate for intermittent operation, not just for continuous duty.
3. Simplify system operation so that startup and shutdown are intuitive, repeatable, and, where possible, automated.
After repairs restored basic functionality, the system was observed during an operateto-maintain campaign in early 2021. These observations were critical.
Operators had long described the saturation vessel outlet valves as “sticky.” Investigation showed they often opened suddenly, taking 20–30 seconds of compressed air application to their pneumatic actuators—which caused the valves and surrounding pipework to shake and “bang”. The rubber valve seats had swollen after drying out during extended idle periods and attempts to control actuator speeds had been abandoned years earlier. Combined with large pressure differentials across closed saturator valves, this created ideal conditions for water hammer once the valve opened.
This confirmed what operators already knew: equipment that functions adequately in continuous service can behave unpredictably when restarted after being left idle for extended periods.
Figure 3: pressure regulating valve recovered from saturation Vessel 4, cracks also extend to the base of the valve.
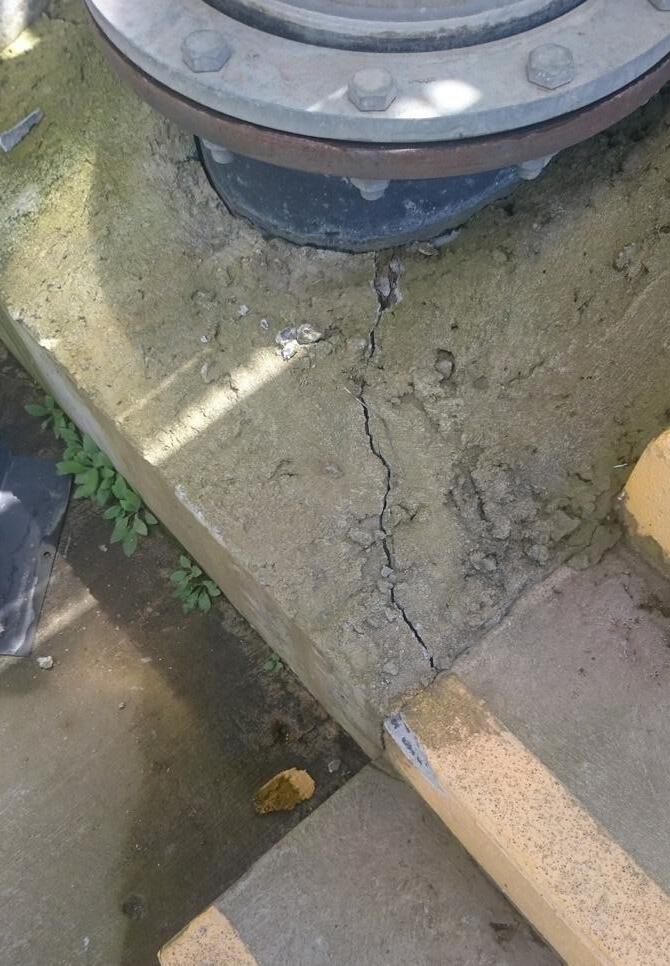
Figure 4: Cracking in the concrete plinth adjacent to a rising section of the DAF recycle water pipeline caused by its movement during the event.
Figure 5: Vertical movement of DN450 mm spiral stainless steel DAF recycle water pipeline support during the event, being temporarily supported with bricks.
With these principles in mind, several significant changes were implemented
The final upgrade scope delivered a mixture of physical, control and operational improvements.
• The startup and shutdown of the DAF system are now fully automated, removing the risk of incorrect valve operation. Dedicated pipework has also been installed to safely and automatically depressurise saturation vessels when they are taken offline or during power failures.
• The recycle pumping system has been upgraded with soft starters and variablespeed drives; now, VSD-equipped pumps actively maintain pressure in the recycle water system. The non-return valve on the delivery manifold of the recycle water pumps was replaced, and a new pressure relief valve was installed.
• All pneumatically actuated rubberseated butterfly valves on saturation vessels were replaced with electrically actuated, metal-seated double eccentric butterfly valves. Actuator opening speeds are controlled to avoid sudden transients. These valves have low opening torques and are ideal for applications with a large pressure differential across the valve.
• A new approach to liquid level control was implemented: instead of throttling the recycle water flow, compressed air is now intermittently applied to keep the vessel level within a defined operating band. This method improves bubble generation consistency, reduces unnecessary hydraulic losses, and opens the door to future energy savings.
• Non-return valves were installed on each DAF recycle water line entering the saturation vessel, ostensibly to reduce water hammer.
Construction and commissioning were completed in 2022, with full handover in 2023.
Immediate benefits were observed
Following commissioning:
• All observable water hammer has been eliminated, including during simulated total power failure events.
• Startups and shutdowns are now simple, automated, and repeatable.
• Operator confidence in the system has improved markedly.
• Automation has decreased the need for manual intervention and reduced the risk of operator error.
• There are now opportunities to optimise energy use.
Most importantly, the conditions that led to the 2018 incident have been eliminated.
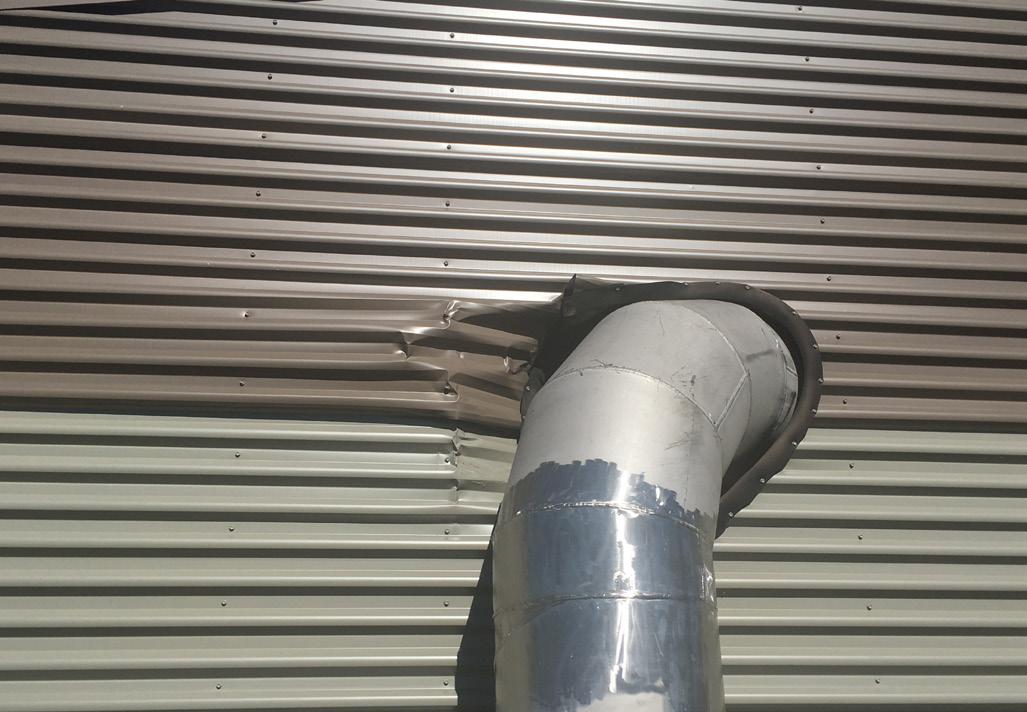
Figure 6: Damage caused to the filter building cladding by movement of the DN450 mm DAF recycle water pipeline during the water hammer event.
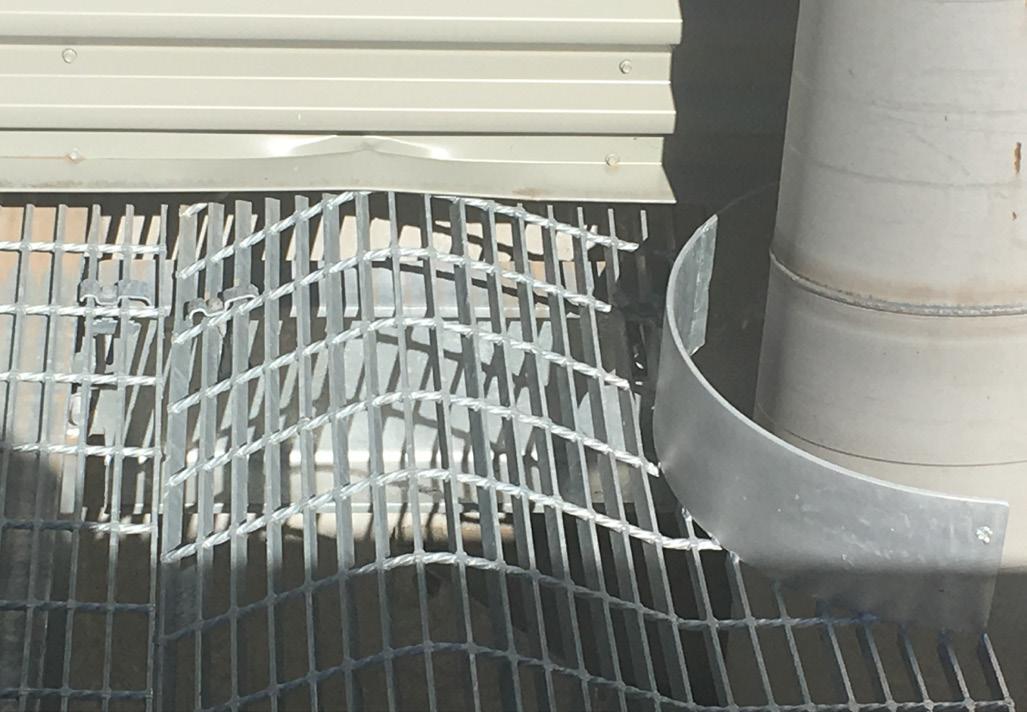
Figure 7: Buckling of a grating caused by lateral movement in the DAF recycle water pipeline during the event.
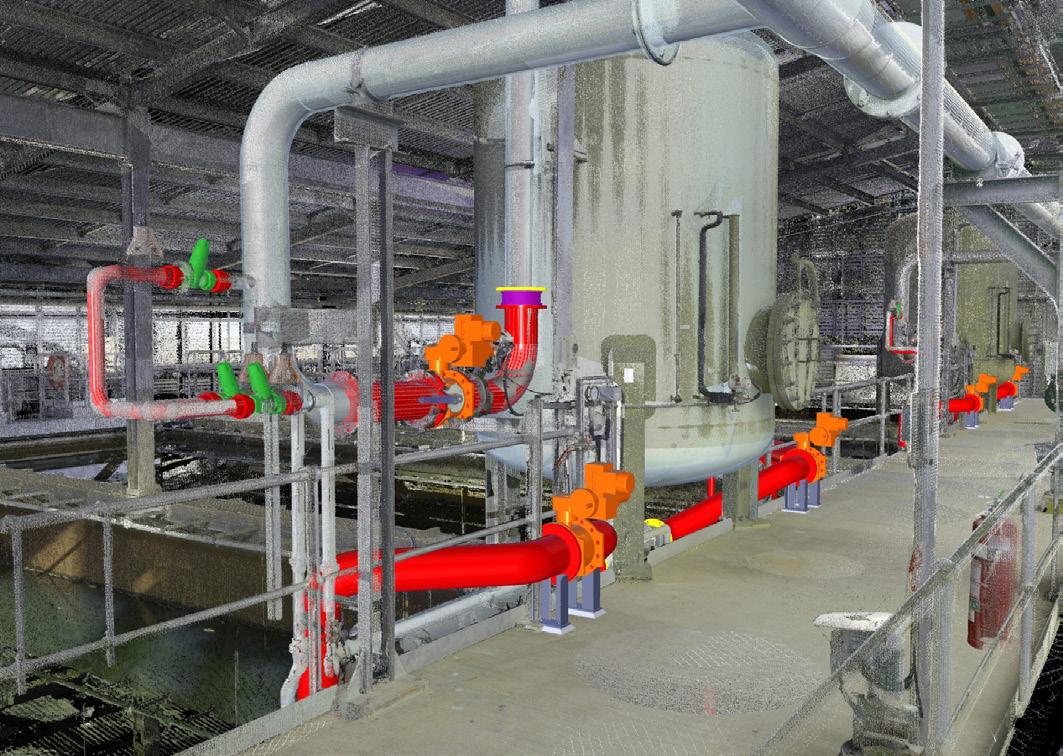
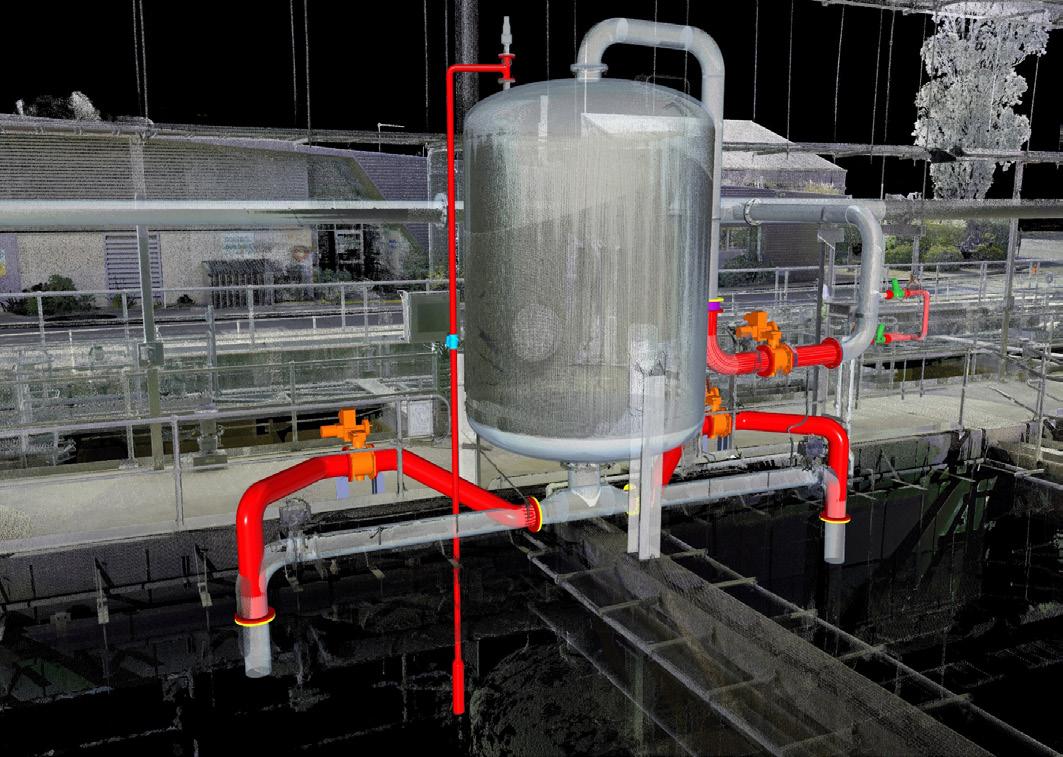
Figure 8: Visual summaries of the system changes to the saturation Vessels (left) to the saturation Vessels, looking southwest; (right) to the saturation Vessels, looking northeast.
The hidden hazard we didn’t see
While testing the upgraded system, simulated “crash stops” of the recycle pumps revealed an unexpected result.
The newly installed non-return valves on the saturation vessel inlets closed rapidly, as intended. However, it was not considered that they also prevented compressed air from flowing back into the recycle water pipeline.
This observation identified the missing factor in the 2018 failure.
In its original configuration, when water column separation occurred, compressed air stored in the saturation vessels could backflow into partially empty recycle pipelines. If this trapped air escaped into the atmosphere—for example, through a faulty glued fitting, a pressure-regulating valve, or a non-airtight flange—it would expand rapidly as it reduces to atmospheric pressure.
Isentropic expansion calculations showed that the compressed air stored in the vessels
at the time of the incident contained the energy equivalent to approximately 1 kilogram of gunpowder.
When this stored energy was rapidly released alongside the modelled water hammer transients, the scale of the damage became clear. So did the limitations of conventional single-phase water hammer modelling.
Critically, this failure mode can exist in any saturation-vessel-based DAF system where recycle water enters above the operating liquid level.
Lessons for our industry
Several key lessons emerged from this incident:
• Intermittently operated systems require bespoke design approaches.
• Abnormal behaviour must never become normalised.
• Operators often experience failure modes that models cannot see.
• Saturation vessels can store significant amounts of energy; redirection of this energy can be highly hazardous.
• Traditional water hammer transient analysis does not capture multiphase energy release (when energy is released by both water and air or other gases).
By sharing this experience, Icon Water encourages other utilities to review their own DAF systems and assess whether similar vulnerabilities exist.
Acknowledgements
The authors thank:
• Chris Conway, Steve Blanshard and the team at BecaHunterH2O
• Simon Bradshaw and the team at Waternish
• Icon Water’s Project Delivery and Major Plants Operations teams for their insight, commitment and willingness to test established assumptions