1 minute read
Key Findings

Employer demand grows to 25,771 jobs posted during 2019, with one high-demand occupation accounting for just over one quarter of total postings.
During 2019, there were 55,341 job postings, 242 more than the 55,099 postings made during 2018 in the Thumb region. There were over 4,000 more postings in 2019 than in 2018. The number of postings increased through most of 2019, from 9,542 postings in Q1 to 10,044 postings in Q3, an increase of 5.0 percent, but did decrease 22 percent, or 2,167 postings, by Q4. Top job Heavy and Tractor-Trailer Truck Drivers for over 6,400 of the new postings, or 26.1 percent. For more information about quarterly job postings, see page 9.
Top 5 Posting Occupation Groups
2019
Job postings made by employers in the Thumb region indicate a high school diploma or GED was the most indemand minimum education level during 2019.
While only 37 percent of job postings identified a minimum education level, 21.0 percent of the 25,771 postings in the Thumb region requiring specific education indicated the need for candidates with a high school diploma or GED. Another 9.4 percent of these postings were seeking applicants with a bachelor’s degree. The Skilled Trades, Customer Service, Agriculture, and Health Care occupation groups most often required a high school diploma or GED. For more information about in-demand minimum education levels, see each occupation group section.

Education Levels In-Demand
2019
Annual Labor Market Data

Data: Bureau of Labor Statistics
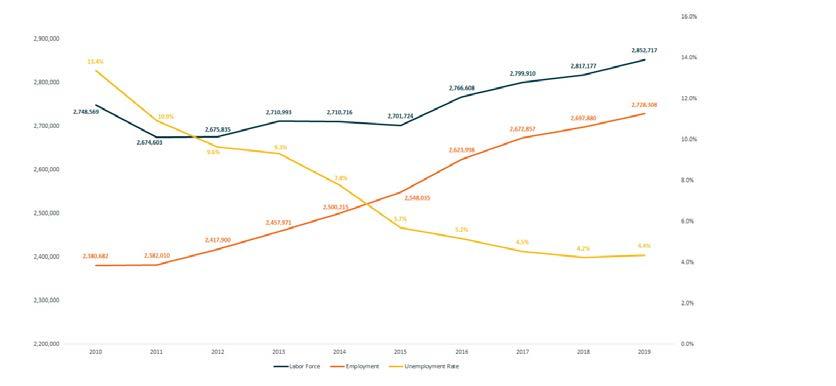
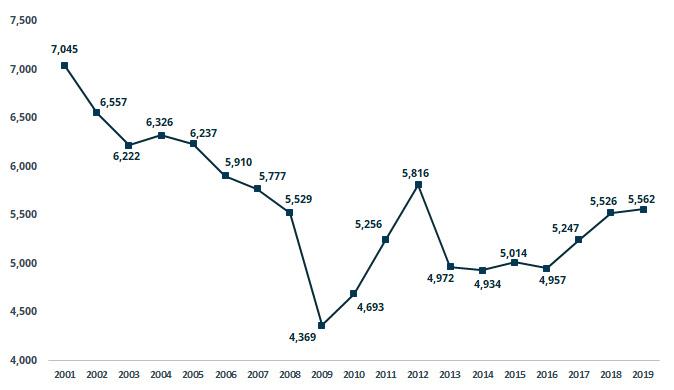
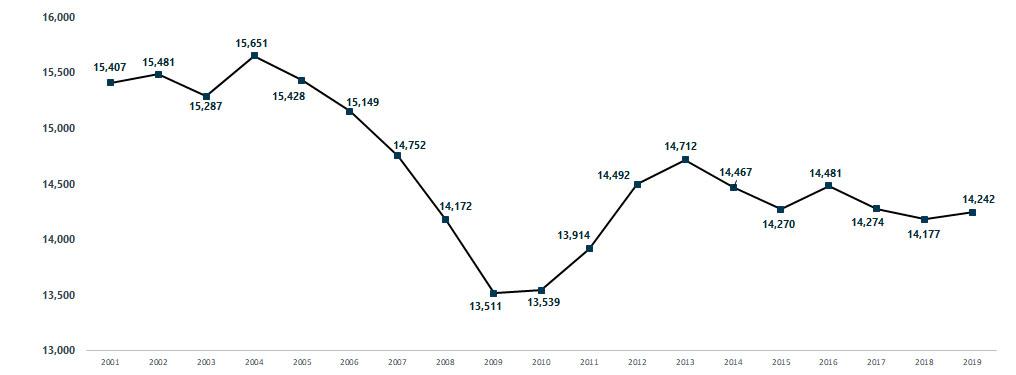
During 2019, employment in the Thumb region grew by 1,664 workers.
The labor force has remained relatively steady since 2010, showing slight growth since 2018. During 2019, labor force figures were 1.4 percent greater (1,446 individuals) than in 2018. The growth in labor force participants was joined by a further 1,664- worker growth in employment compared to 2018. The faster growth in employment than the labor force caused the unemployment rate to decrease from 5.1 percent in 2018 to 4.8 percent in 2019. For more information about this year’s unemployment rate and other labor market indicators, see page 4.