1 minute read
State of the Labor Market


State of the Labor Market in Oakland County
Over the course of 2019, the labor force and employment figures increased in Oakland County. Even as the unemployment rate fluctuated over the course of the year, the unemployment rate for 2019 was 3.3 percent - unchanged from the 2018 unemployment rate. Employer demand for nearly all occupation groups analyzed by WIN grew from Q1 to Q3 2019, with demand declining throughout the remainder of the year. Transportation, distribution, and logistics (TDL) and healthcare occupation groups showed the highest demand in the region.
Annual Labor Market Information
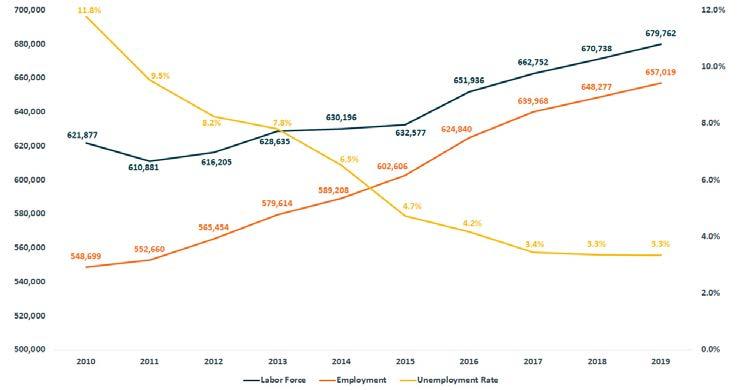
M oving into a ten-year high, employment in Oakland County increased by 8,742 individuals between 2018 and 2019, or 1.3 percent. Since 2010, employment has grown by over 108,000 individuals, or nearly 16.5 percent. Unemployment rose by 281 individuals, or 1.3 percent, between 2018 and 2019. The unemployment rate in 2019 was 3.3 percent, remaining unchanged from the 2018 rate. The labor force increased by 9,023, or 1.3 percent between 2018 and 2019 as well, continuing its steady increase since 2010.
Quarterly Employer Demand Overview
In 2019, employers in Oakland County posted 287,175 jobs. With 46,791 jobs posted in January, employer demand increased throughout Q1 and, after a slight decrease in April, continued to increase throughout the remainder of Q2. Demand peaked in early Q3, with 57,619 postings in July, and then declined throughout the rest of Q3 and Q4. Demand in December, at 40,153 postings was lower than at the start of the year. In the occupation groups studied, transportation, distribution and logistics (TDL) occupations showed the most demand, followed by health care and business and finance occupations.
Annual Labor Force, Employment, Unemployment Rate
2010–2019
Data: BLS | Analysis: Workforce Intelligence Network
Monthly Posting Analysis, Oakland County
2019


