
1 minute read
State of the Labor Market


State of the Labor Market in Macomb County
Labor force and employment figures in Macomb county finished 2019 stronger than they began. Year-over-year, the labor force grew by 1.1 percent (4,732 individuals) between Q4 2018 and Q4 2019. A slightly greater change in employment than in labor force caused the number of unemployed individuals to decrease in the region, bringing the quarterly unemployment rate down to 3.5 percent in Q4 2019 compared to 3.9 percent in Q4 2018. In Macomb county and across southeast Michigan, employer demand grew to unprecedented high levels through August 2019, then declined through the end of the year.
Annual Labor Market Information
The labor force in M acomb county continues t o grow, increasing by 6,481 individuals between 2018 and 2019 a nnual figures. Employment increased by 5,788 workers between 2018 and 2019 as well. As t he increase in employment a ccounted for most, but not all, of the sustained increase in labor force, the unemployment rate rose slightly. From an annual unemployment rate of 4.0 percent in 2018, the annual rate rose by 0.1 percentage points to the 2019 rate of 4.1 percent in 2019.
Quarterly Employer Demand Overview
About 60,000 job postings were made each quarter of 2019 in Macomb county. Q3 2019, with 66,222 postings, represented the year’s peak demand. Online job postings declined somewhat into Q4 2019, with employers posting 53,704 job advertisements. This pattern was consistent across southeast Michigan during 2019 and was also observed among top-posted occupations Heavy and Tractor-Trailer Truck Drivers and Registered Nurses.
Annual Labor Force, Employment, Unemployment Rate
2010–2019
Data: BLS | Analysis: Workforce Intelligence Network
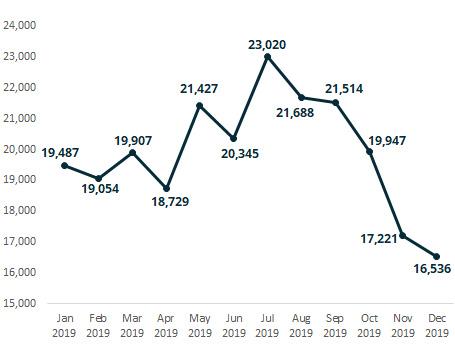
Monthly Posting Analysis, Macomb County
2019


