A
APPENDICES
• Appendix A: Acronyms & Glossary of Terms
• Appendix B. Implementation Action Matrix
• Appendix C. Engagement Summary
• Appendix D. Existing Conditions Report
• Appendix E. Conceptual Designs for Five Focus Areas
• Appendix F. Economics of Community Development
A-1
AAPPENDIX A: ACRONYMS & GLOSSARY OF TERMS
ACRONYMS
ADU: Accessory Dwelling Unit
ADA: Americans with Disabilities Act
BMP: Best Management Practices
CDOT: Colorado Department of Transportation
CIP: Capital Improvement Program
DU/AC: Dwelling Units per Acre
EMS: Emergency Medical Service
FEMA: Federal Emergency Management Agency
GMA: Growth Management Area
HUD: United States Department of Housing and Urban Development
IGA: Intergovernmental Agreement
PUD: Planned Unit Development
A-2 WINDSOR COMPREHENSIVE PLAN |
A. GLOSSARY OF TERMS
Where not defined here, please consult Windsor Municipal Code for a definition.
Accessory Dwelling Units (ADU): A smaller, independent residential dwelling unit located on the same lot as a stand-alone (i.e., detached) single-family home. ADUs go by many different names throughout the U.S., including accessory apartments, secondary suites, and granny flats. ADUs can be converted portions of existing homes (i.e., internal ADUs), additions to new or existing homes (i.e., attached ADUs), or new stand-alone accessory structures or converted portions of existing standalone accessory structures (i.e., detached ADUs).
Affordable Housing: Generally uses a HUD definition of residential development consisting of any combination of single-family attached, singlefamily detached, and multifamily dwelling units, regardless of the age of occupants, provided that 50% or more of the units serve households earning from zero to 80% of the regional Area Median Income (AMI). The Town of Windsor is currently in the process of updating or replacing any definition of “affordable” or “attainable” housing.
Amendment: A formal change or revision to the Comprehensive Plan, including either the Plan’s text or its maps.
Annexation: The process by which land is added to the Town Municipal Boundary in accordance with the provisions of the Colorado Revised Statutes and Windsor Code.
Best Management Practices (BMPs): Practices that are determined to be effective and practicable means of achieving a specific goal.
Bicycle Facilities: Improvements and provisions to accommodate or encourage bicycling including bike parking infrastructure and bike lanes.
Buildable Area: The remaining area of land after the area for roads, detention ponds, parking lots, easements, dedications (i.e., schools, open space) is deducted.
Capital Improvement Programs (CIP): A mechanism within government for identifying,
financing, scheduling, and constructing significant public improvements.
Community: Within this document, “community” or “Windsor community” refers to all people, businesses, organizations, etc. within the Town of Windsor limits or those who are directly affected by the affairs of the Town of Windsor.
Complete Streets: Streets that are designed to allow for convenient and comfortable travel by users of all transportation modes.
Comprehensive Plan: A town-wide longrange plan intended to guide the growth and development of a community that includes analysis, recommendations, and proposals for such topics as the community’s population, economy, land use, housing, transportation, and community facilities.
Density: The ratio of residential units on an acre of land. Thus, a permitted density of eight (8) dwelling units per acre for a property that has an area of two (2) acres would allow up to 16 dwelling units.
Design Guidelines: Written statements, explanatory material, graphic renderings and/or photographs intended to inform property owners and the public of specific examples of techniques and materials appropriate to achieve identified design goals and objectives.
Design Standards: Written requirements adopted by the Town that set forth criteria, the design of particular areas, buildings or elements related to the physical development of the Town.
Development: Any man-made change in improved and unimproved real estate outside of public rights-of-way, including but not limited to buildings or other structures, mining, dredging, filling, grading, paving, excavation, drilling operations or storage of equipment or materials.
Dwelling Unit: A single residential unit providing complete independent living facilities for one or
A-3
more persons, including permanent provisions for sleeping, eating, cooking, and sanitation.
Dwelling Units per Acre (DU/AC): A unit of measurement commonly used to determine the density of a residential development.
Flex Space: Short for flexible space, is space that is typically leased in a commercial or industrial building that offers a multi-purpose workspace, typically with separate manufacturing, warehouse, and office areas. Flex space provides the opportunity for a tenant to customize the space to meet their particular business needs.
Floodplain: The land area that has been or may be inundated by water during times of flood. A Regulatory Floodplain is delineated by FEMA and the Town is a floodplain administer.
Front Range: Refers to the populated region of Colorado and Wyoming just east of the Rocky Mountains and extending from Cheyenne, Wyoming south to Pueblo, Colorado.
Gateway: A point along a roadway at which a traveler gains a sense of having entered the town or a particular part of the town. This impression can be imparted through such things as signs, monuments, landscaping, a change in development character, or a natural feature such as the Poudre River.
Goal: A statement about an end toward which efforts are directed, and that provides the community with direction. A goal is a desired ideal and a value to be sought.
Growth Management Area (GMA): An area where urban-level services are planned to ultimately be provided and which a municipality intends to annex.
Infill Development: Development of vacant, bypassed parcels of land in otherwise built-up areas.
Infrastructure: Facilities and services need to sustain any type of development. Infrastructure includes but is not limited to streets, drainage, water, wastewater, transportation, power, telecommunications and fire and police facilities.
Intergovernmental Agreement (IGA): A cooperative agreement between two or more governmental jurisdictions or special districts.
Land Use: The manner in which land is used. Land Use may also refer to a future land use designation on the Comprehensive Plan Land Use Map.
Micromobility: Small lightweight vehicles traveling at slower speeds including electric and nonelectric bikes and other appropriate modes.
Mixed-Use: A development type in which various uses, such as office, retail, and residential, are combined to encourage efficiency of development and synergies between uses.
Multifamily: A classification of housing where three or more separate housing units for residential inhabitants are contained within one building. Units can be arranged side-by-side units or stacked on top of each other. A common form is an apartment, condominium building, or townhome.
Multimodal Transportation: A multimodal transportation network includes all the ways people move around their community: walking, biking, using a wheelchair, riding the bus or train, driving, or carpooling. It also includes new transportation modes like ride-hailing as well as future technologies. It is important that modes of transportation within the network are wellconnected, accessible, and interact safely. The network not only includes infrastructure and vehicles, but is also supported by education, safety, and maintenance programs.
Neighborhoods: Geographic sub-areas within the town that contain and derive at least some of their identity from residential land uses, but which also encompass and incorporate a variety of other land uses and facilities. The extent of a neighborhood is variable and may be defined by tradition, period of building and development, subdivision patterns, or formally adopted boundaries.
Open Space: Lands that include agriculture lands, scenic viewsheds, and trails. Open space exists in a natural state and contain few or no structures;
A-4 WINDSOR COMPREHENSIVE PLAN |
they may also contain significant natural, aesthetic, and recreational features that warrant protection.
Pedestrian-Oriented: Form of development that makes the street environment inviting for pedestrians; for commercial areas may be characterized by special sidewalk pavement, zero front and side yard setbacks, buildings of varied architectural styles, street-facing window displays, an absence of front yard parking, benches, and other amenities; for residential areas may be characterized by sidewalks, parkways, front porches, low fences, lighting, and other amenities.
Planned Unit Development (PUD): A zoning district overlay classification to accommodate master planned development that typically includes a mix of uses and/or building types or unconventional uses or designs.
Planning Commission: An advisory board created to conduct public hearings, public meetings, and provide recommendations to the Town Board on land use applications and related matters. This includes statutory approval of Comprehensive Plan amendments.
Policy: A specific statement of principle that articulates a course of action that guides decision making to meet a goal.
Quality of Life: The personal perception of the physical, economic, and emotional well-being that exists in the community.
Redevelop: To improve and re-use existing buildings; to demolish existing buildings (often in poor condition) and create new ones; or to increase the overall floor area existing on a property, irrespective of whether a change occurs in land use.
Resiliency: The capacity of the Town, and its residents and businesses to prepare for disruptions, to recover from shocks and stresses, and to adapt and grow from a disruptive experience.
Riparian: Refers to living or located on the bank of a natural watercourse such as a river or lake.
Setback: An area on a lot establishing a yard between the property lines and the structures on the lot.
Single-Family: A development consisting of a lot or lots containing only one primary dwelling unit
per lot and which may take the form of detached or attached or manufactured home.
Stormwater: Surface runoff and drainage, induced by precipitation events, and conveyed, treated, and managed in pipes, channels, creeks, ponds, and other public and private facilities.
Streetscape: Pedestrian and landscape improvements in the right-of-way, generally occurring between the curb and the right-of-way line. Streetscape generally includes sidewalks, street trees, pedestrian lighting, furnishings, and landscaped areas, including medians and irrigation.
Sustainability and Sustainable Development: Strategic initiatives and policies that provide both short and long-term solutions to benefit the people, environment, and economic welfare of our community.
Townhome: A building that has three or more dwelling units erected in a row as a single building (either as a single building on its own lot, or with each dwelling separated by a lot line), and with each unit separated from the adjoining unit(s) by a fire wall along the dividing lot line. All dwelling units in a townhome are attached.
Vision: A shared dream of the future characterized by long-term idealistic thinking, that provides the foundation for the development of the goals, policies, and programs. A vision is not binding and may not be achievable in the lifetime of this Comprehensive Plan.
Workforce Housing: As established in Windsor’s Workforce Housing policy (Resolution 2004-39), workforce housing refers to either single-family or multifamily housing developments or projects within which at least 20% of the proposed units are affordable to households earning up to 80% of the average household income in the Town of Windsor.
Zoning: Regulations pertaining to lot sizes and dimensions, building setbacks and height, density, and the way land is used.
Zoning Map: Map that depicts the division of the town into districts or “zones” in which different uses are allowed and different building and lot size restrictions apply. The zoning map is regulatory in nature and applies to currently permitted uses; it should not be confused with the Future Land Use Map, which guides formation of future zoning.
A-5
This page is intentionally left blank.
A-6 WINDSOR COMPREHENSIVE PLAN |
APPENDIX B. IMPLEMENTATION ACTION MATRIX
Consider amending the zoning ordinance to provide density bonuses where appropriate (e.g., decrease minimum lot sizes) for the use of conservation design and traditional neighborhood design.
Consider formalizing growth management strategies, such as codifying requirements for open space dedication in return for increased density where appropriate.
Review existing Adequate Public Facilities Ordinance No. 20041163 for revision, repeal and/or replacement.
Consider acquisition or management of key sites that are threatened by future development and prioritize areas where municipally-owned land may be the most effective strategy.
Consider revising land use regulations to promote a minimum level of development compactness and density within mixed-use developments such as reducing the amount of required parking (via shared parking) to provide public gathering space.
A-7
# TOPIC ACTION ACTION TYPE RESPONSIBILITY RELEVANT GOALS/POLICIES GROWTH & REGIONAL COLLABORATION 1 Density Bonus
Regulation Planning Growth & Regional Coordination Housing & Neighborhoods 2 Growth Management
Regulation Planning Growth & Regional Coordination 3 Growth Management
Regulation Planning Engineering Growth & Regional Coordination Economic Development 4 Land Acquisition
Capital Project Planning Economic Development Growth & Regional Coordination Housing & Neighborhoods 5 Mixed Use
Regulation Planning Parks,
Growth & Regional Coordination Housing & Neighborhoods Parks, Recreation, Open Space,
Trails Community Facilities & Infrastructure
Recreation & Culture
&
Consider a program to encourage maintenance and rehabilitation of aging residential and commercial areas.
Consider adopting setbacks to further protect both ecologically sensitive areas and the community enjoyment of the regional amenity, the Cache la Poudre River National Heritage Area. Regulation Planning Parks, Recreation & Culture
Consider adopting and implementing a Transfer of Development Rights (TDRs) ordinance.
Consider revisions to land use regulations to include water efficient best practices in water conserving landscaping and irrigation principles, buffering, and drainage.
& Regional Coordination
& Regional Coordination
A-8 WINDSOR COMPREHENSIVE PLAN | # TOPIC ACTION ACTION TYPE RESPONSIBILITY RELEVANT GOALS/POLICIES 6
Rehabilitate Aging Sites
Program Planning Economic Development Growth
Housing & Neighborhoods 7
& Regional Coordination
Sensitive Natural Areas Zoning Overlay
Growth
Community Character
Design Growth
Water & Natural Resources Stewardship
& Regional Coordination
&
& Regional Coordination
8 Transfer of Development Rights
Regulation
Growth
9
Planning
Water Efficiency
Regulation Planning Engineering Public
Growth
Housing
Works
& Neighborhoods
Develop an Affordable and
Encourage community gardens and local food production in new housing developments and provide education or resources for existing neighborhoods to implement community gardens.
Consider revisions to the Downtown zoning regulations to further enhance the Downtown’s distinct sense of place.
Consider expanding EVcharging building codes for new construction during retrofit projects for residential and commercial.
Consider amending the zoning ordinance to include a housing type
Consider expanding impact fees proportional to housing unit size for specific unit types such as ADUs.
Partner with local businesses and neighborhood
Consider revisions to land use regulations to balance residential with commercial and supporting uses in mixed-use areas.
A-9 # TOPIC ACTION ACTION TYPE RESPONSIBILITY RELEVANT GOALS/POLICIES
10 Affordable and Workforce Housing Strategic Plan
HOUSING & NEIGHBORHOODS
Workforce Housing Strategic
Plan Planning Windsor Housing Authority Housing & Neighborhoods 11 Community Gardens
Plan.
Program Planning Parks, Recreation & Culture Housing & Neighborhoods Parks, Recreation, Open Space, & Trails 12 Downtown Zoning
Regulation Planning Windsor Downtown Alliance Housing & Neighborhoods Economic Development Community Character & Design 13 Electric Vehicles
Regulation Planning Engineering Housing & Neighborhoods Transportation & Mobility 14 Housing Diversity
Regulation Planning Housing & Neighborhoods 15 Impact Fees
diversity requirement.
Funding Planning Engineering Housing & Neighborhoods 16 Local Events
groups to establish
parties in residential areas
Town. Program Communications Parks, Recreation & Culture Housing & Neighborhoods Community Character & Design 17 Mixed Use
block
of
Regulation Planning Housing & Neighborhoods Economic Development
Consider revisions to the RMU zoning district to encourage small-scale and pedestrianfriendly commercial uses like restaurants, retail, and entertainment.
Encourage street connections to new subdivisions to maintain the street grid where possible and improve overall connectivity between established neighborhoods.
Promote walkability through streetscape improvements that include high-visibility pedestrian crossings, curb bump-outs, and/ or landscaped medians on wide residential roadways.
Investigate water efficiency programs that include education and regulations to encourage efficient water use among customers.
ECONOMIC DEVELOPMENT
Revise the Economic Incentives Resolution 2004-39 by decreasing the set-aside requirement from 20% to 10% to be better aligned with available incentives and promote more construction.
Strengthen the revised Economic Incentives Resolution 2004-39 by codifying it within the Town’s zoning code.
A-10 WINDSOR COMPREHENSIVE PLAN | # TOPIC ACTION ACTION TYPE RESPONSIBILITY RELEVANT GOALS/POLICIES 18 Mixed Use
Regulation Planning Housing & Neighborhoods Economic Development Community Character & Design 19 Street Connections
Regulation Planning Engineering Public Works Housing & Neighborhoods Transportation & Mobility 20 Streetscape Improvements
Capital Project Planning Engineering Public Works Housing & Neighborhoods Transportation & Mobility 21 Water Efficiency
Program; Regulation Planning Engineering Public Works Housing & Neighborhoods Water & Natural Resources Stewardship
22 Economic Incentives
Regulation Economic Development Planning Economic Development 23 Economic Incentives
Regulation Economic Development Planning Economic Development
Consider establishing an annual reporting function to communicate what investments were made locally in Windsor that were funded by different revenue sources, including the Countymanaged sales tax.
Consider establishing a program that bridges students with local business partners to explore career educational opportunities for students through shadow programs, job site visitation, and internships.
Consider establishing a partnership with K-12 schools and technical/community colleges and local businesses to support workforce opportunities for local job placement.
Consider public-private partnerships to develop catalyst mixed-use projects with special community benefits.
Investigate a program to attract industries that focus on renewable energy, water efficiency, clean technology, waste reduction and recycling, or firms that otherwise demonstrate a commitment to sustainability.
Consider development of a long-range tourism plan, which highlights Downtown, the I-25 Corridor Activity Center, emerging Entertainment District, and recreational attractions such as the Poudre River Corridor, Lake Windsor and the Town's golf courses.
A-11 # TOPIC ACTION ACTION TYPE RESPONSIBILITY RELEVANT GOALS/POLICIES 24 Investment Reporting
Program Economic Development Communications Economic Development 25 Job Placement
Program Economic Development Communications Economic Development Community Facilities & Infrastructure 26 Job Placement
Partnership Economic Development Communications Economic Development Community Facilities & Infrastructure 27 Public-Private Partnerships
Capital Project Economic Development Communications Economic Development 28 Sustainability in Businesses
Program Economic Development Economic Development Water & Natural Resources Stewardship 29 Tourism Plan
Plan Economic Development Windsor Downtown Alliance Parks, Recreation & Culture Communications Economic Development Parks, Recreation, Open Space, & Trails
Research potential updates to the WDA Facade Improvement Program or other opportunities for WDA facade programs.
Look into a funding option to support the arts program.
Consider strategic capital projects like plazas, trails, and other types of public spaces that encourage pedestrian use. Use existing networks of arts and cultural organizations and the Arts Commission to integrate art and storytelling into new public spaces and development.
Consider using community facilities as an opportunity to showcase sustainability best practices, including water conserving landscaping and irrigation principles, EV charging stations, and green infrastructure.
Conduct a follow-up highway rail crossing safety study with before and after data collection after current improvements have been completed to identify the efficacy of past efforts as well as identify remaining or emerging deficiencies at the crossings throughout the Town.
A-12 WINDSOR COMPREHENSIVE PLAN | # TOPIC ACTION ACTION TYPE RESPONSIBILITY RELEVANT GOALS/POLICIES
30 Façade Improvements
COMMUNITY CHARACTER & DESIGN
Program Windsor Downtown Alliance Planning Community Character & Design 31 Public Art
Program Parks, Recreation, and Culture Arts Commission Community Character &
Community Facilities & Infrastructure 32 Public Spaces
Design
Capital Project Planning Parks, Recreation, and Culture Community Character & Design Parks, Recreation, Open Space,
Trails Community Facilities & Infrastructure 33 Sustainability Best Practices
&
Project Planning Public Works Parks, Recreation,
Communications Community Character
Recreation, Open Space,
Trails Water & Natural Resources Stewardship Community Facilities and Infrastructure
MOBILITY 34 Highway Rail Crossing Safety
Capital
and Culture
& Design Parks,
&
TRANSPORTATION &
Plan Engineering Public Works Transportation & Mobility
Consider minimum setbacks adjacent to Natural Areas.
Encourage monitoring of quality and maintenance of pocket parks maintained by HOAs and metro districts.
Continue to work with Greeley, Fort Collins, and Larimer County to finish the portion of the Poudre River Trail that is primarily offstreet, and work to connect neighborhoods to the Trail.
Continue to partner with the Arts Commission, local arts, and historic organizations to promote history and the arts in parks programming, and beautification of utility infrastructure and spaces.
Invest in necessary infrastructure to meet current and future water demands to support the Town’s growth strategy.
A-13 # TOPIC ACTION ACTION TYPE RESPONSIBILITY RELEVANT GOALS/POLICIES 35 SH 392 Traffic Study
SH 392 traffic study. Plan Engineering Public Works Transportation & Mobility PARKS RECREATION & OPEN SPACE 36 Natural Area Buffer
Regulation Parks, Recreation & Culture Parks, Recreation, Open Space, & Trails Water & Natural Resources Stewardship 37 Pocket Parks
Conduct a follow-up
Program Parks, Recreation & Culture Parks, Recreation, Open Space, & Trails 38 Poudre River Trail
Partnership; Capital Project Parks, Recreation & Culture Parks, Recreation,
Space,
Trails 39 Public Art
Open
&
Partnership Parks, Recreation & Culture Parks, Recreation, Open Space, & Trails 40 Water Efficiency
Program, Regulation Public Works Engineering Parks, Recreation, Open Space, & Trails Water & Natural Resources Stewardship Community Facilities & Infrastructure
Consider integration of best management practices (BMPs) to reduce water consumption and protect water resources and the natural environment.
Various approaches are available to facilitate public education and enforcement of policies that offer education, and regulations to encourage efficient water use among customers. The Town could provide requirements for monitoring and enforcing adherence to long-term water use allocations, such as a tiered water rate structure.
Consider updates to existing municipal buildings through higher efficiency building lighting, restoration of native vegetation, and installation of low-flow water fixtures.
Consider a policy that requires a baseline energy efficiency standard and incorporates guidance from the Energy Action Plan for all new construction and renovation of municipal buildings.
Consider offering educational seminars, materials, and/or rebates for reducing the volume of stormwater released from residential properties.
A-14 WINDSOR COMPREHENSIVE PLAN | # TOPIC ACTION ACTION TYPE RESPONSIBILITY RELEVANT GOALS/POLICIES 41 Water Efficiency
Program, Regulation Public Works Engineering Parks, Recreation, Open Space, & Trails Water & Natural Resources Stewardship Community Facilities & Infrastructure WATER
42 Tiered Water Rate Structure
& NATURAL RESOURCES STEWARDSHIP
Program Public Works Engineering Water & Natural Resources Stewardship 43 Energy Efficiency
Capital Project Public Works Engineering Water & Natural Resources Stewardship Community Facilities & Infrastructure 44 Energy Efficiency Standards
Regulation Public Works Engineering Water & Natural Resources Stewardship Community Facilities & Infrastructure 45 Stormwater Efficiency
Program Public Works Engineering Water & Natural Resources Stewardship
education programs to encourage the use of available technologies that can facilitate the efficient use and management of water supplies.
water pricing strategies that support longterm infrastructure needs and that encourage efficient use and management.
A-15 # TOPIC ACTION ACTION TYPE RESPONSIBILITY RELEVANT GOALS/POLICIES 46 Water Efficiency Educate HOAs about water efficiency programs. Program Public Works Engineering Water & Natural Resources Stewardship 47 Water Efficiency Promote
Program Public Works Engineering Water & Natural Resources Stewardship Community Facilities & Infrastructure 48 Water Efficiency Consider
Program, Regulation Public Works Engineering Water & Natural Resources Stewardship Community Facilities & Infrastructure 49 Water Efficiency Review and update if necessary water dedication policies. Regulation Public Works Engineering Water & Natural Resources Stewardship COMMUNITY
& INFRASTRUCTURE 50 Health Facilities Work with healthcare providers to identify appropriate sites for future facilities. Partnership Planning Economic Development Community Facilities & Infrastructure 51 Police and Fire Communication Maintain regular meetings
other means of communication between Windsor Police Department and WindsorSeverance Fire Rescue to ensure efficient improvements to equipment, facilities, and programming. Partnership Police Public Works Communications Community Facilities & Infrastructure 52 Senior Center Consider incorporating a senior center or amenities. Capital Project Parks, Recreation & Culture Planning Community Facilities & Infrastructure 53 Senior Programs Continue to work with the Weld County Area Agency on Aging to provide senior lunches and other senior health, wellness, and assistance programs. Partnership Parks, Recreation & Culture Communications Community Facilities & Infrastructure
FACILITIES
or
This page is intentionally left blank.
A-16 WINDSOR COMPREHENSIVE PLAN |
APPENDIX C. ENGAGEMENT SUMMARY
This summary includes findings from community events and engagement activities that have occurred throughout the Windsor Comprehensive Plan Update (the Plan) process. Findings from initial phases laid the foundation for future phases as town staff, advisory committees, elected officials, community members, and consultants worked collaboratively to create a forward-looking plan that reflects community needs, values, and opportunities.
Over the 18-month process, between August 2022 and February 2024, community members shared their perspectives on Windsor to help inform the Comprehensive Plan Update. Community members engaged in a variety of ways, including attending a speaker panel event, hands-on design workshops, responding to online questionnaires, and participating in one-on-one or small group interviews. Boards and Commissions also engaged in the process to share their key priorities for the Comprehensive Plan update.
PUBLIC PARTICIPATION BY THE NUMBERS
Focus Group Meetings
Board and Commission Meetings
Community Interviews
Responses to Online Values and Big Ideas Questionnaire
Responses to Vision and Guiding Principles Questionnaire
Comments on Draft Comprehensive Plan
Technical Advisory Committee Meetings
A-17
8 8 16 8 25 13 3 114 124 134 Online Activities Community Events Public Advisory Committee Meetings
1. VISIONARY KICKOFF EVENT
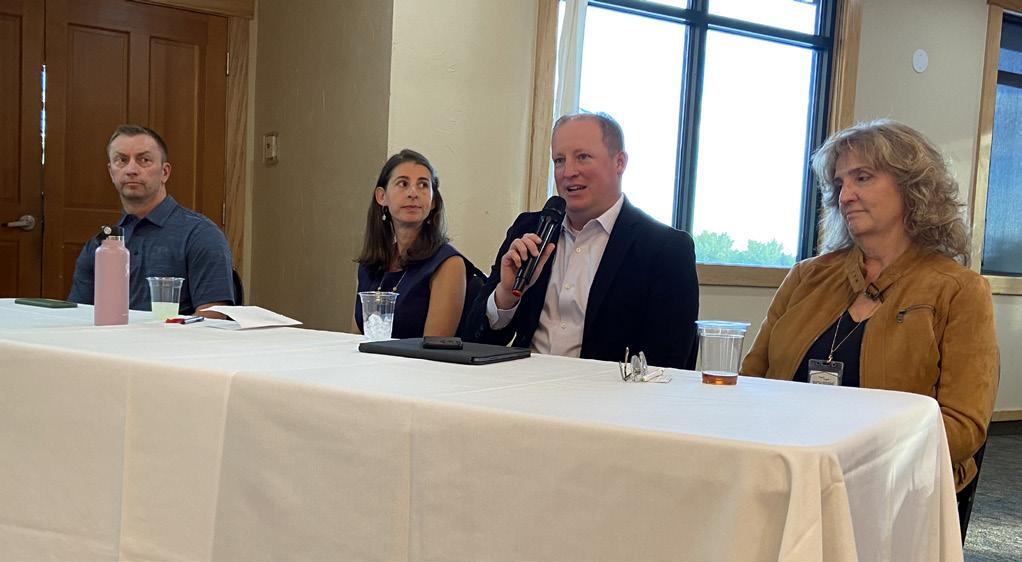
On October 6, 2022, Windsor Mayor Paul Rennemeyer moderated a panel discussion with local planning and development experts who spoke about regional trends, touching on key topics including growth, housing, transportation, and infrastructure. Over 90 community members attended the event to learn more about the Comprehensive Plan Update process, review development data, ask questions, and share their perspectives on the future of Windsor.
Speakers included Becky Safarik, Interim Community Development Director with City of Greeley; Steve Schroyer, founder of Schroyer Resources; Patrick McMeekin, Director of Land Development for Hartford Homes; and Carly Sieff Hart, Transportation Planner for Fehr & Peers. Safarik spoke to Greeley’s experiences updating their most recent comprehensive plan and shared wisdom from over four decades of experience planning for growth and development in Greeley. McMeekin highlighted housing development in Windsor, including opportunities related to building smaller, more affordable homes. Schroyer, who led the redevelopment of the Mill, spoke to the future of retail and the importance of partnerships and collaboration with the Town. Lastly, Sieff Hart shared how technology in the transportation sector is putting pressure on roadways in new ways that should be considered in the Plan update.
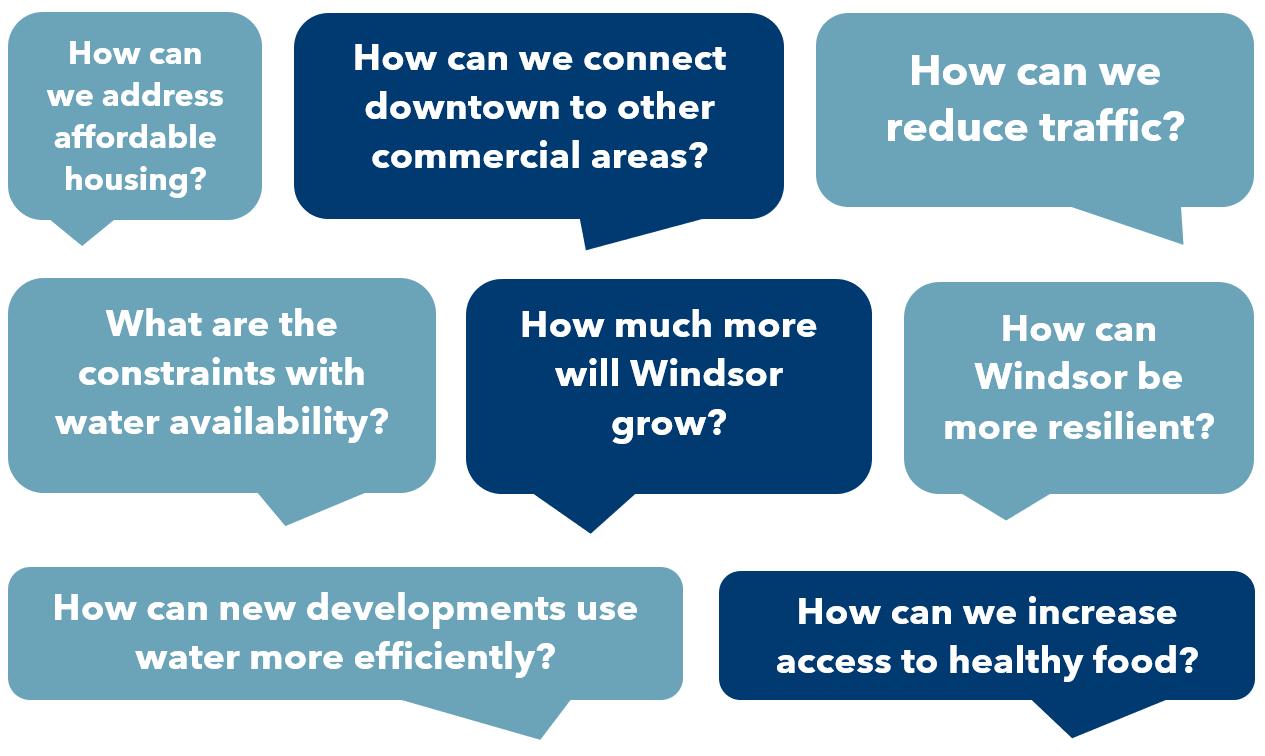
Following brief presentations by each speaker, residents submitted questions, addressing concerns related to growth and development, affordable housing, water, traffic and parking, and economic development. The recording of the event can be viewed here in Windsor TV
What do residents want to learn more about through the planning process?
Included is a summary of questions residents submitted during the event that highlight topics of interest and concern that will be considered and addressed during the planning process.
A-18 WINDSOR COMPREHENSIVE PLAN |
2. VALUES AND BIG IDEAS QUESTIONNAIRE
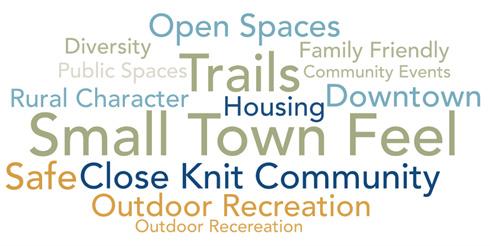
Below is a summary of responses to a questionnaire that was shared online between August and October 2022. There were 114 survey submissions and residents shared their perspective on what makes Windsor a great place to live and how it can be even better in the future.
What do you LOVE most about Windsor?
Note: Words appearing larger were found more frequently in responses.
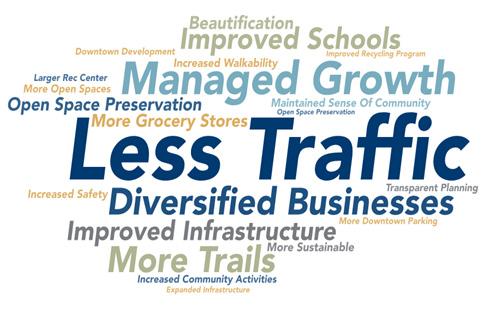
Describe the best version of Windsor. What positive changes can you envision for your community over the next 20 years?
Note: Words appearing larger were found more frequently in responses.
What questionnaire respondents see as a CHALLENGE/OPPORTUNITY regarding the TOP PRIORITIES…
The following is a summary of common opportunities and big ideas noted in questionnaire responses.
Parks, Recreation, and Open Space
• Preserve open spaces, including buffers between communities, and build trails that are accessible to everyone.
• Keep farmland and open natural areas to maintain small-town feel that people love about Windsor.
• Build more trails, connections to nature, and maybe even a natural playground.
Community Character
• Prepare for growth without losing the smalltown feel.
• Avoid big-box stores so Windsor doesn’t lose its charm.
Economic Development
• Support healthcare sector businesses.
• Focus on commercial development of Highway 392 and I-25 area.
• Encourage and support small businesses.
• Attract more commercial businesses, like restaurants and a grocery store.
Sustainability
• Prioritize sustainability with a focus on energy, water conservation, and recycling.
• Require more efficient water usage for commercial development and encourage solar panels and low-water usage landscaping for new residential development.
A-19
• Establish goal for government and large commercial buildings to plan for renewable energy sources.
• Prioritize town-wide recycling, a complete energy plan, a commitment to clean energy for town facilities, and water conservation plans.
Housing
• Address affordability challenges by requiring a certain percentage of affordable housing in all new development.
• Prioritize sustainable housing, especially related to water usage. Focus on conservation efforts.
3. COMMUNITY INTERVIEWS
Transportation/Other Infrastructure
• Traffic is a top concern for many residents, and Windsor should consider purchasing land for a bypass road.
• The current rate of growth is outpacing our infrastructure (schools, roads, etc.) and should be addressed in plan update.
• Prioritize transportation corridors that keep bicyclists and pedestrians safe.
• Make parking a higher priority.
• Make it easier to get around on foot or bike.
• Explore ways to reduce large truck traffic through downtown.
Community interviews revealed an array of key challenges, opportunities, and big ideas. Participants generally represented a variety of residents, developers and builders, realtors, community groups, and other community interests. Approximately half of the interviewees were longtime residents of Windsor while the remaining half either resided in Windsor for under ten years or worked in Windsor and lived elsewhere.
Community Interview Questions
Town staff and consultants used the following questions to guide one-on-one and small group conversations with community members. Not all questions were discussed at all interviews and additional information came out of discussions.
1. How long have you lived and/or worked in Windsor?
2. What is your association with the community?
3. What do you love most about Windsor? What are the Town’s biggest assets?
4. What are the top challenges or issues that need to be addressed?
5. What is the biggest opportunity for the Town? What are your big ideas?
6. Where do you anticipate growth to occur in the county over the next five to ten years?
7. How is new development perceived?
8. Do you have any recommendations for how we can engage with more community members through the Comprehensive Plan update process?
Key Opportunities and “Big Ideas”
Community
Character
• Be recognized as the best small town in Colorado and be a family-friendly community.
• Focus on long-term opportunities that will enhance quality of life for residents.
• Consider placemaking opportunities and look to 7th St. and New Liberty Rd. as examples.
• Explore opportunities for more public art in Windsor. Consider public/private partnerships or 1% for the arts. Look at Greeley and Grand Junction and their transformations.
• Enhance farmers markets and local events to promote sense of community.
• Create more cohesion between neighborhoods and across the Town to bolster community identity.
• Maximize the trail system as a strategy to knit neighborhoods together.
A-20 WINDSOR COMPREHENSIVE PLAN |
• Promote and celebrate diversity to set youth up for worldly success.
• Adopt a historic preservation plan to retain historic sites and buildings of significance.
• Honor agricultural heritage and natural amenities, such as lakes.
• Establish State Highway 257 as a gateway.
• Explore potential for a performing arts center.
• Make Windsor more of a “complete” community rather than a “bedroom” community by focusing on commercial and employment opportunities.
Development Patterns and Growth
• Identify and use key metrics to track development and growth.
• Attract more retail and restaurants across Town.
• Growth Management Area boundaries should go up by half sections, so Town controls land when annexed.
• Establish “corporate campus” zoning designation to promote large campus development.
• Balance growth with small town character that many longtime residents appreciate.
• Support development of resort communities.
• Stay open and nimble to creative opportunities, like business incubation spaces, creative trails and connectivity, youth sports, and local agriculture.
• Keep growing the medical facilities district in the Town’s west core.
• Explore potential for a junior college/ research institution in Windsor.
• Coordinate the Town’s expansion plan and land use growth management.
• Establish intergovernmental agreements that address annexations.
• Promote more mixed-use development.
• Focus mid- and big-box retailers into smaller areas.
Sustainability and Resilience
• Prioritize sustainability by incorporating it into the plan more holistically.
• Establish policies, plans, and programs to help the Town prepare for natural hazards, like fires.
• Ensure the Town’s power grid is ready for electric vehicle charging infrastructure (level 3).
• Work with Owens Illinois for glass recycling.
• Update building codes to co-locate roof vents to not conflict with solar panels.
• Complete a stormwater Master Plan first, and tie it in with Parks and Recreation, Transportation, and location of future schools.
• Consider lower water usage landscaping requirements.
• Require remediation and reclamation of former oil and gas extraction and mining sites.
• Develop more sustainable schools and public buildings through more efficient water, energy, recycling, and waste management practices.
Transportation
• Become an award-winning bicycle town.
• Build more protected bike lanes and bike infrastructure that is accessible and comfortable and closes missing links in the Town’s network of paths and trails.
• Enhance Safe Routes to Schools program.
• Explore how to integrate micromobility into the community.
• Increase parking downtown and address traffic on Main St. and 7th St.
• Consider minivan pools as a ride-sharing opportunity.
A-21
• Address traffic and safety concerns at Sports Complex and Windsor High School and Middle School. Sports Complex could be linked to transit.
• Designate mobility hubs at Hwy 34/I-25, and Hwy 56/I-25.
• Stay apprised of Front Range Passenger Rail Initiative and how this would link Windsor to the region.
Water/Sewer
• Prioritize water conservation and use nonpotable water for irrigation. Consider as a requirement for new subdivisions.
• Achieve 100% non-potable water use in parks and irrigation on private property.
• Identify water storage investment opportunities.
• Expand sanitary sewer capacity across the Town, especially up to Harmony Rd. to expand development opportunities.
• Promote greater autonomy for Town through improved water policies and local water treatment.
Housing
• Research strategies to promote affordable housing opportunities, so Windsor youth can afford to live in Town when they grow up.
• Balance high-end housing development with more affordable options.
Community Engagement Ideas
• Use charettes to get a pulse on the community.
• Create videos to share information on the comprehensive planning process.
• Host drop-in meetings for informal conversations in places like the Pelican Conference Room and Raindance.
• More education focused on the realities of the public process and limitations the Town faces.
• Enhance online tools, like See-Click-Fix, to make it easier for residents to communicate with town staff and elected officials.
4. PHASE 1 BOARD AND COMMISSION MEETINGS
The following board and commission meetings served as opportunities for appointed and elected officials to provide input during the first phase of the Comprehensive Plan Update.
Housing Authority Input - 11/15/2022
Current Challenges:
• Lack of senior housing
• Cost of building new housing
Key Opportunities:
• Making impact fees proportional to unit size
• Filling gaps in the housing type spectrum
Planning Commission Input - 11/16/2022
Current Challenges:
• Transportation and Traffic
Key Opportunities:
• Use concert series in the park, Farmers Market, Senior Lunch at the Rec Center and HOA distribution lists to amplify outreach
A-22 WINDSOR COMPREHENSIVE PLAN |
Downtown Development Authority Input11/16/2022
Current Challenges:
• Crime
• Traffic
• Lack of multifamily housing to support workforce
• Downtown Corridor Plan (1999) is outdated
• Water Availability
• Maintaining Local Character while also growing
Key Opportunities:
• Smart use of existing infrastructure and infill
• Partnerships with Chamber of Commerce and other Community Events
• Integrating neighborhood across Windsor
A-23
6. OPPORTUNITIES & CHOICES PUBLIC DESIGN CHARRETTE
What Was the Windsor Charrette Process?
150+ participants
Multiple feedback options
Behind the scenes work...
WHAT IS A CHARRETTE?
A French word, “Charrette” means “cart” and is often used to describe the final, intense work effort expended by art and architecture students to meet a project deadline. Today a “Charrette” combines creative working sessions with public workshops and open houses. A Charrette is a collaborative planning process that harnesses the talents and energies of all interested parties to create and support a master plan that represents transformative community change.
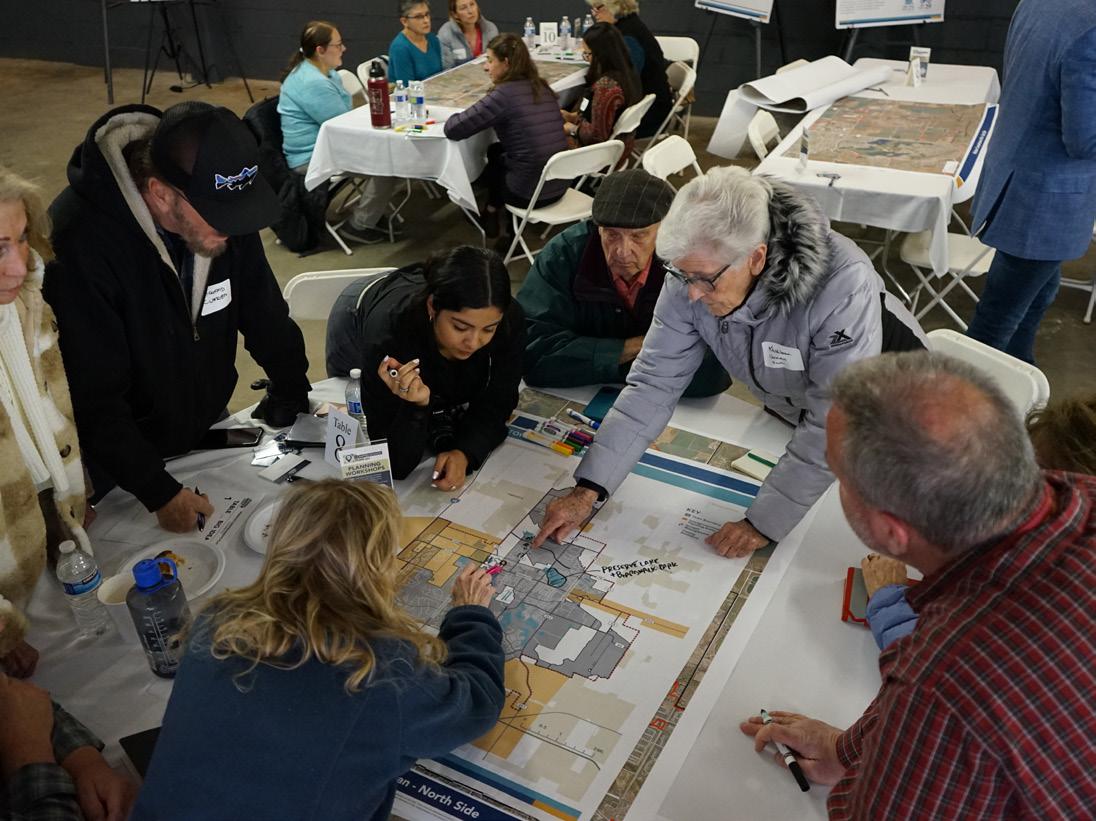
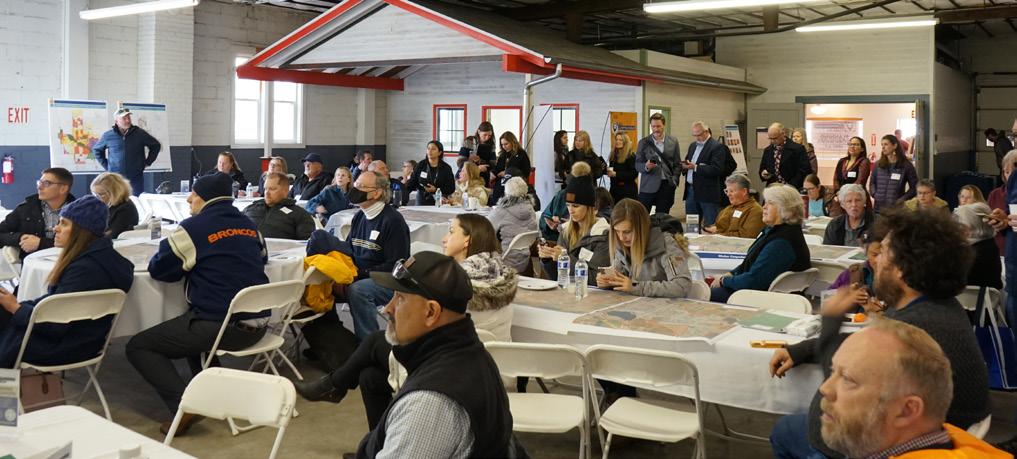
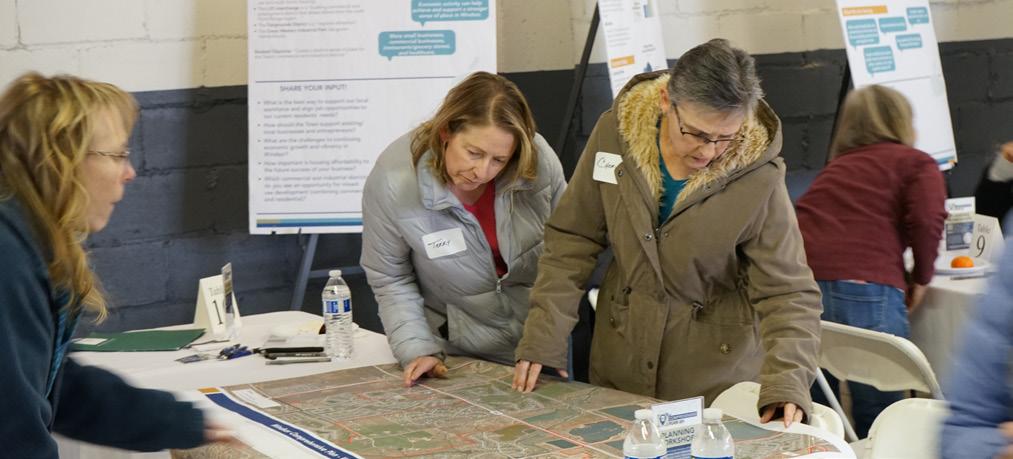
A four-day charrette was held during the first week of April 2023 to discuss and visualize options for future community growth. Public events involved:
• Public Design Workshop to kick off the event, share priorities and opportunities, and participate in interactive exercises.
• Two Open Studio Days for the public to drop in and see the integration of public feedback from the Public Design Workshop into planning scenarios.
• Final Presentation to hear about the top design scenarios and policy ideas that came out of the week’s multiple workshops.
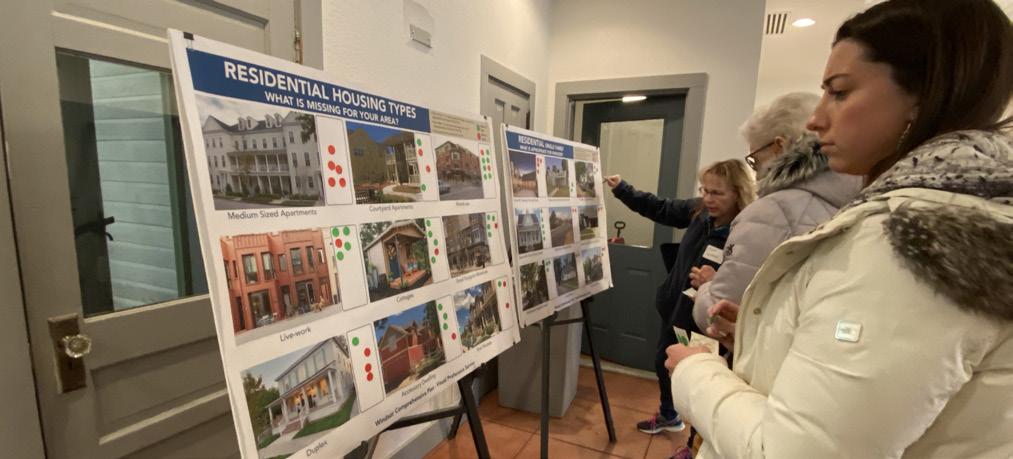
The venue was setup with information boards for the public to learn about current conditions and trends and to provide their perspective on a preferred direction on topics such as housing, community facilities, transportation, infrastructure, water efficiency, and economic development. Public input was gathered on the Community Values to be considered for Comprehensive Plan Vision and Guiding Principles. The public was also invited to take a Visual Preference Survey to indicate which building and development types are the best fit for Windsor. Lastly, the event included a kids’ corner, for children to share and draw their ideas.
Some of the behind-the-scenes work involved a driving tour with staff and consultants to visit key sites in town and discuss constraints and opportunities for future development. A series of technical meetings were also held to get the perspective of local experts on how the Comprehensive Plan can integrate the needs and opportunities for: water and utilities, schools and service providers, business community, housing and development, and transportation (meeting scheduled for May).
A-24 WINDSOR COMPREHENSIVE PLAN |
Technical Meetings
Community Values
Vision and Guiding Principles boards were displayed to show the ideas and keywords that could be used to refine the current Plan Vision Statement and to create new Guiding Principles. The information presented was based on guiding elements in the current 2016 Comprehensive Plan as well as on input received during Phase 1 outreach events.
Participants were asked to review the information which was presented in the form of a word cloud and to circle the words that they like the most and/or to add additional words. Below is a list of the community values shared by the public.
Community Values
• Balance
• Community Oriented
• Natural Areas
• Regional connectivity
• Cozy small lot houses
• Walkability
• Neighborhoods
• Mixed-use
• Downtown
• Fast casual restaurants
• Less sprawl
• Historic buildings
• Comfort
• Senior center
• Family-friendly
• Public library
• Quality of life
• Cultural centers
• Quality education
• Amenities
• Active recreation
• Windsor Lake
• Rural character
• Interaction with nature
• Health and wellness
• Trail network
• Focus on ecological health
• Community buffers
• Distinct sense of place
• Small town character
• Destinations
• Active recreation
• Preservation of environmental features
• Pedestrians
A-25
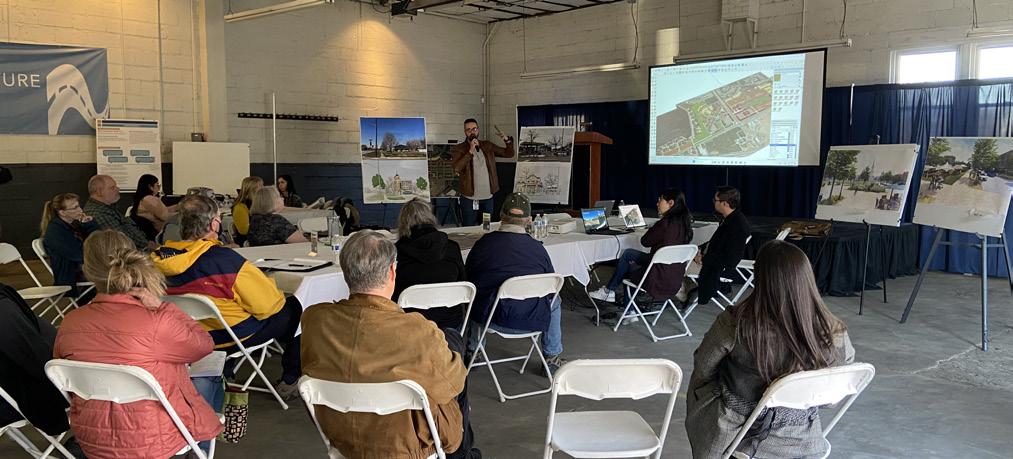
Public Design Workshop Kickoff
Public Design Workshop Facilitated Activity
Visual Preference Activity
Public Design Workshop Closing Presentation
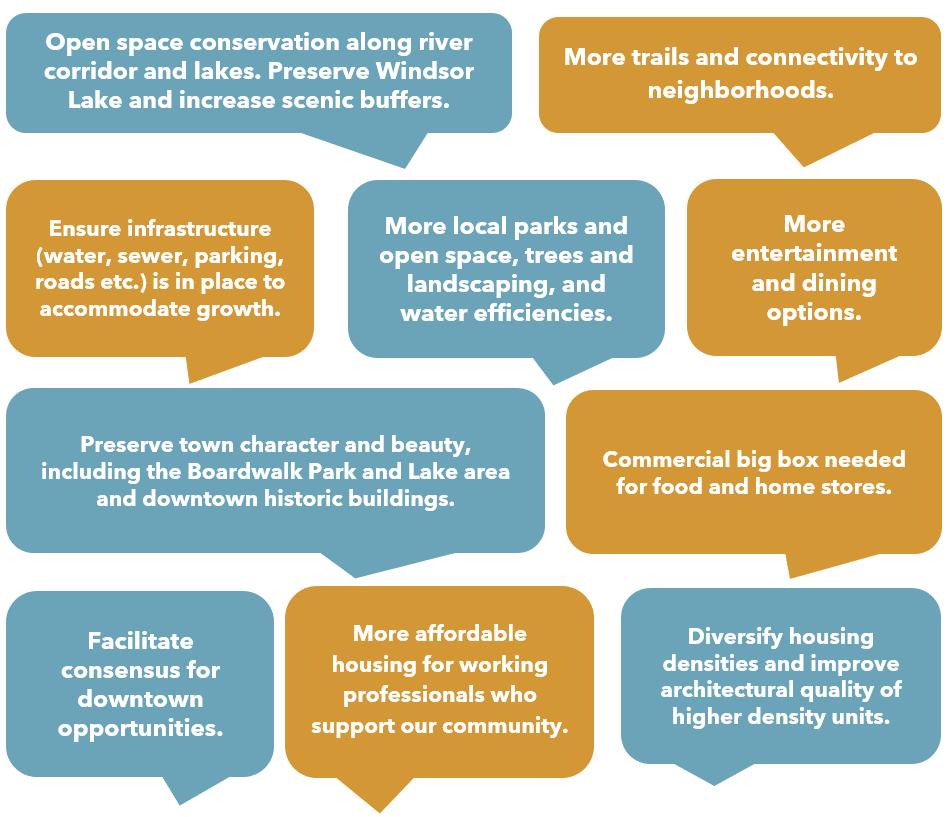
Public Design Workshop Big Ideas
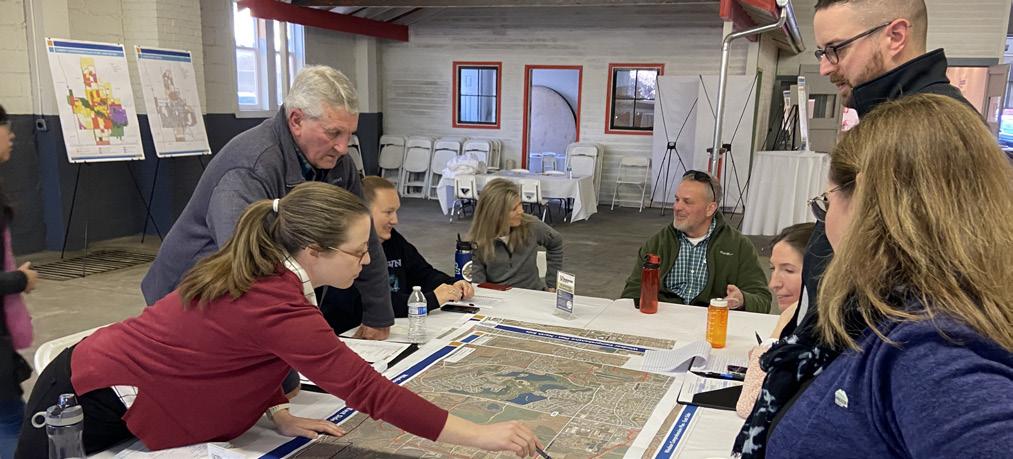
During the Public Design Workshop facilitated activity, participants were asked to think about the questions below, to discuss and draw on a map, and to identify Big Ideas for Windsor.
• What is most precious to you that you feel should be preserved in Windsor?
• Where are the right places to accommodate growth? What kind of growth should that be?
• How could we support our local businesses, entrepreneurs, and increase job opportunities?
• Are there opportunities for new plazas or green spaces? Where are they?
• Would you consider walking or biking in Windsor? What improvements are needed?
• How can we make Windsor more resilient? What are the strategies and tools the Town should consider?
Here is what participants had to say:
A-26 WINDSOR COMPREHENSIVE PLAN |
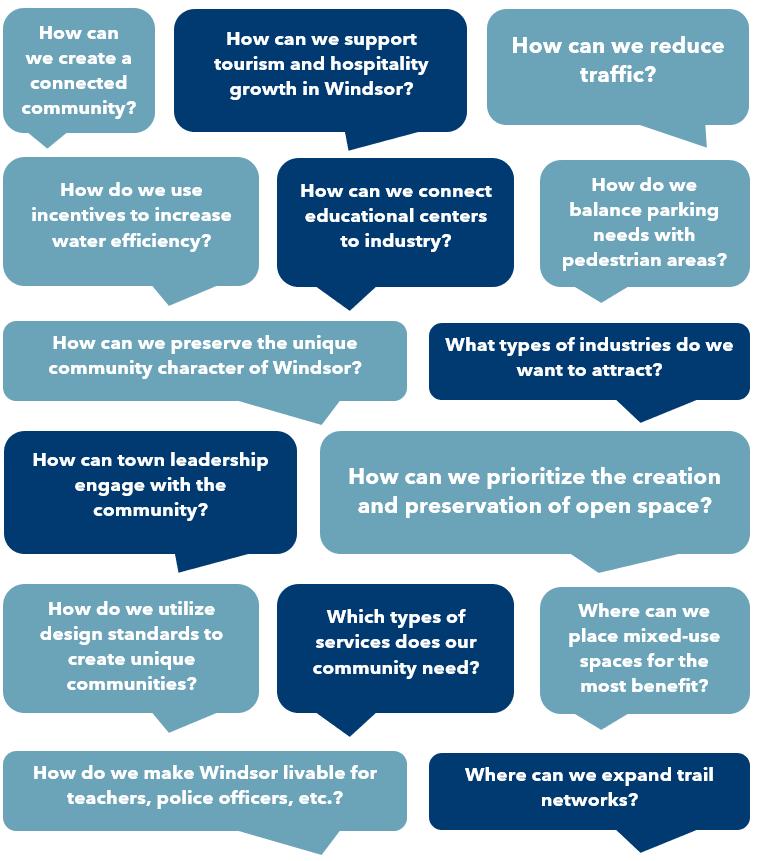
Opportunities Moving Forward
Through interactive boards and maps, comment cards, and facilitated conversations, participants shared key questions that they would like to see addressed during the planning process. These questions will inform the opportunities—the goals and objectives—that will guide the future of Windsor.
A-27
Visual Preferences
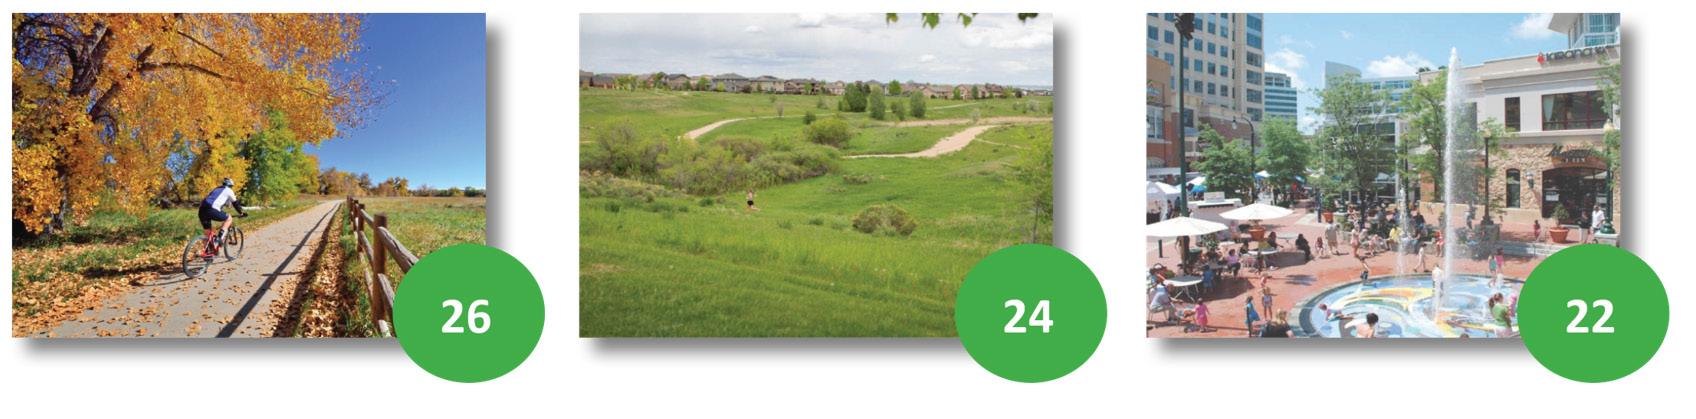
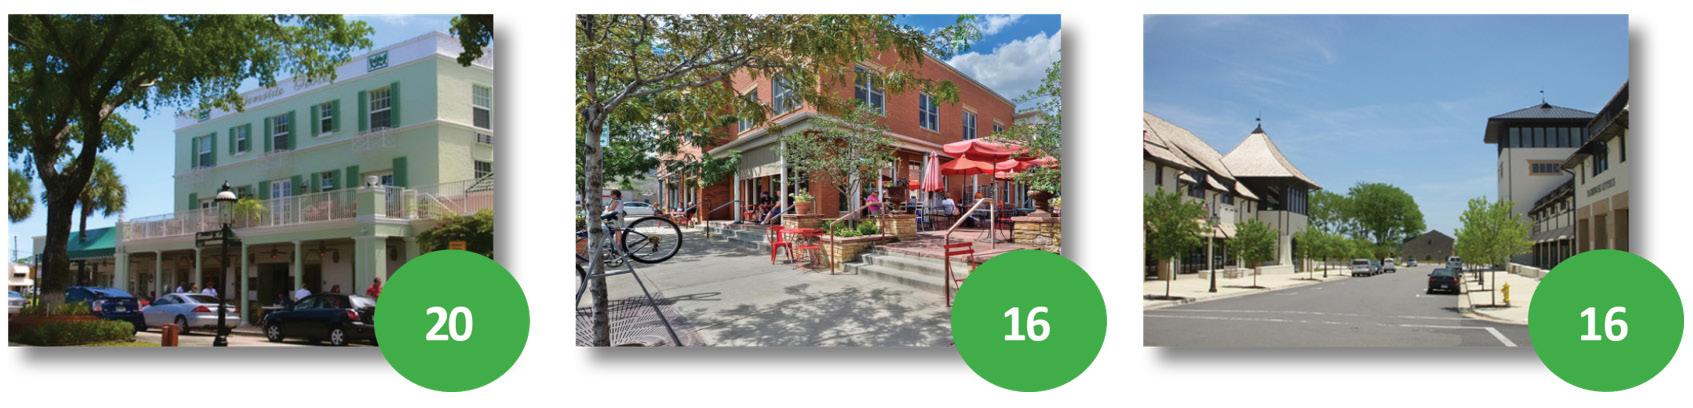
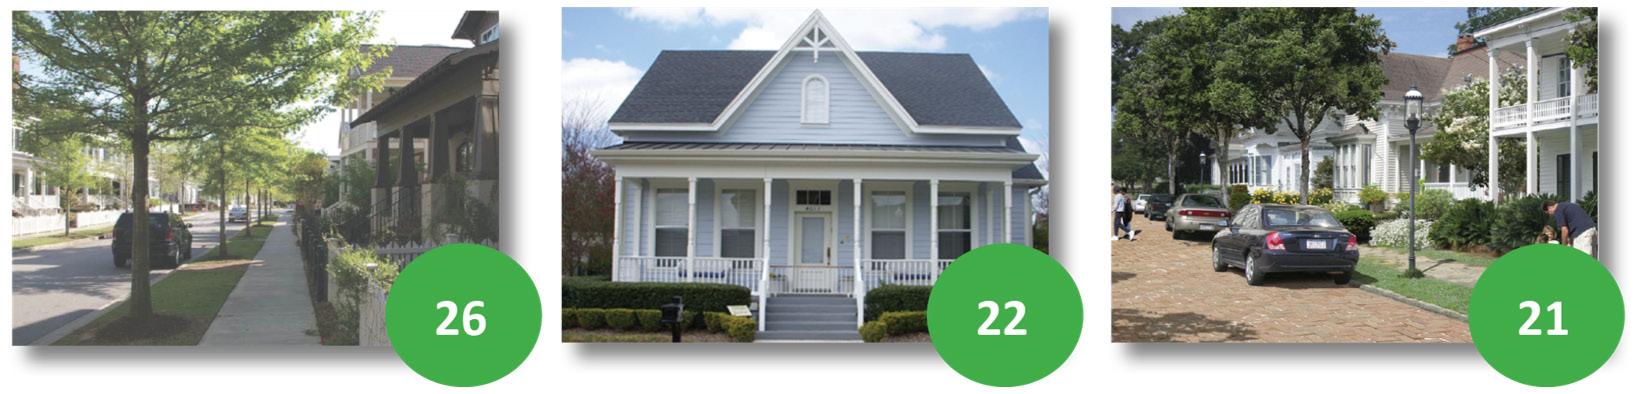
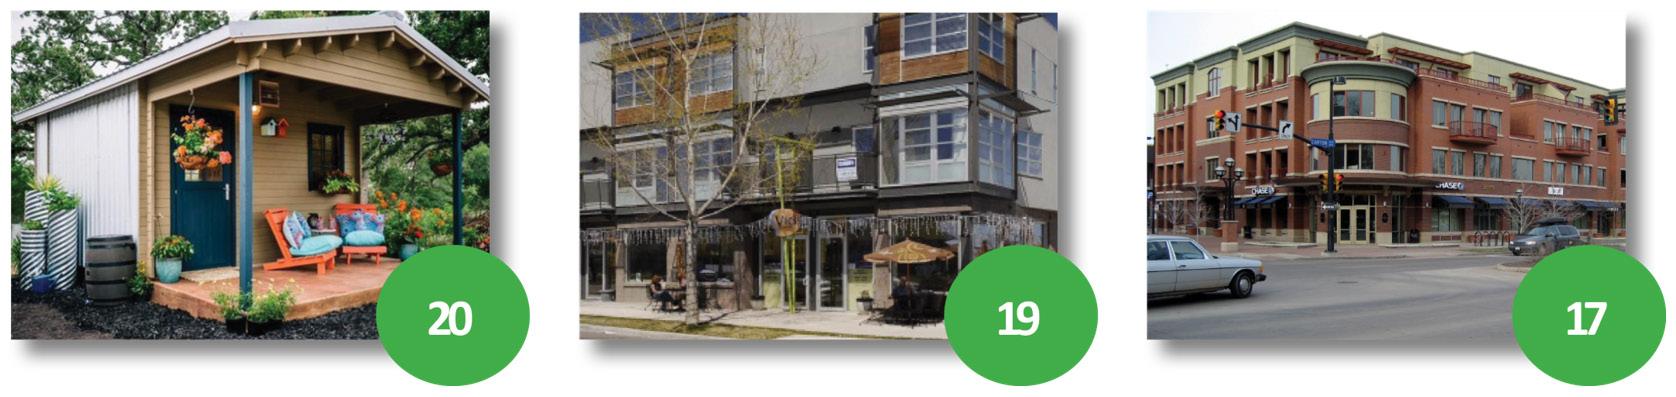
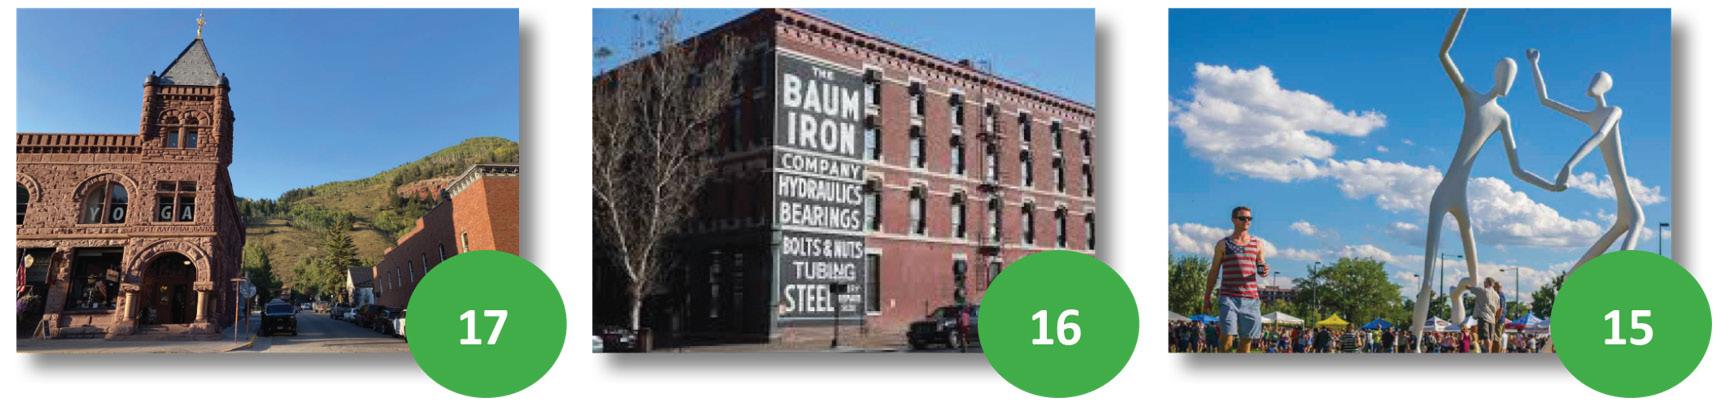
A visual preference survey was conducted to gauge what new development types may look like and to visualize the physical spaces that the community desires for Windsor. Five categories of visual preferences were discussed: Commercial, Open Spaces, Single-Family Residential, Missing Residential Housing Types, and Signage and Gateways. Participants were asked to indicate whether they wanted to see “More of this” with a green sticker or “Not so much” with a red sticker. Sticker totals indicate preferred spaces or not preferred spaces. The top three choices from each category are shown below along with their sticker totals.
Open Spaces
A-28 WINDSOR COMPREHENSIVE PLAN |
Commercial
Trails
Residential Single-Family
Hotel Mixed-Use Commercial Commercial Street
Open Fields Public Space with Splash Pad
Traditional Neighborhood
Porch Facing Street
Traditional Neighborhood
Missing Residential Housing Types
Signage and Gateways
Technical Meetings
Technical meetings involved about 30 representatives from housing, economic development, water and utility providers, schools and service providers, and the project’s Plan Advisory Committee (PAC). Conversations focused on how recommendations in the Plan update can support some of the ongoing efforts for these sectors. Groups discussed alignment between education and jobs, diversifying housing options, growing retail and industrial options, increasing childcare access, and raising awareness about water efficiency. Below are the major discussion points:
• Development types and land use patterns have water use implications.
• Pride in having a well-established nonpotable water system.
• Growth management tools may be needed until more water efficiencies are secured.
• Assess a transfer of development rights (TDR) program to direct growth to key, utility-ready sites.
• Improve communication on impact fees processes and purposes.
• Formalize relationships and collaboration (e.g., services integration, information sharing, IGA reviews, etc.) between school districts and the Town.
• More collaboration between educational institutions and local businesses to match student learning opportunities with job trends.
• Windsor is the cultural hub of the region— drawing people in for Town events, restaurants, and recreation.
• Windsor is in a regional workshed so commuting trends aren’t likely to change.
• Need housing for workforce.
• Protect and promote industrial land as it is crucial for key industries.
• Availability and affordability of childcare is a barrier to continued education and employment.
• Lack of diversity in food and entertainment options is a deterrent for some employees to choose to live here.
• Windsor is a lifestyle community, a safe community.
A-29
Cottages Small Footprint Mixed-Use Mixed-Use
Iconic Architecture
Wall Art
Public Art
Charrette Designs
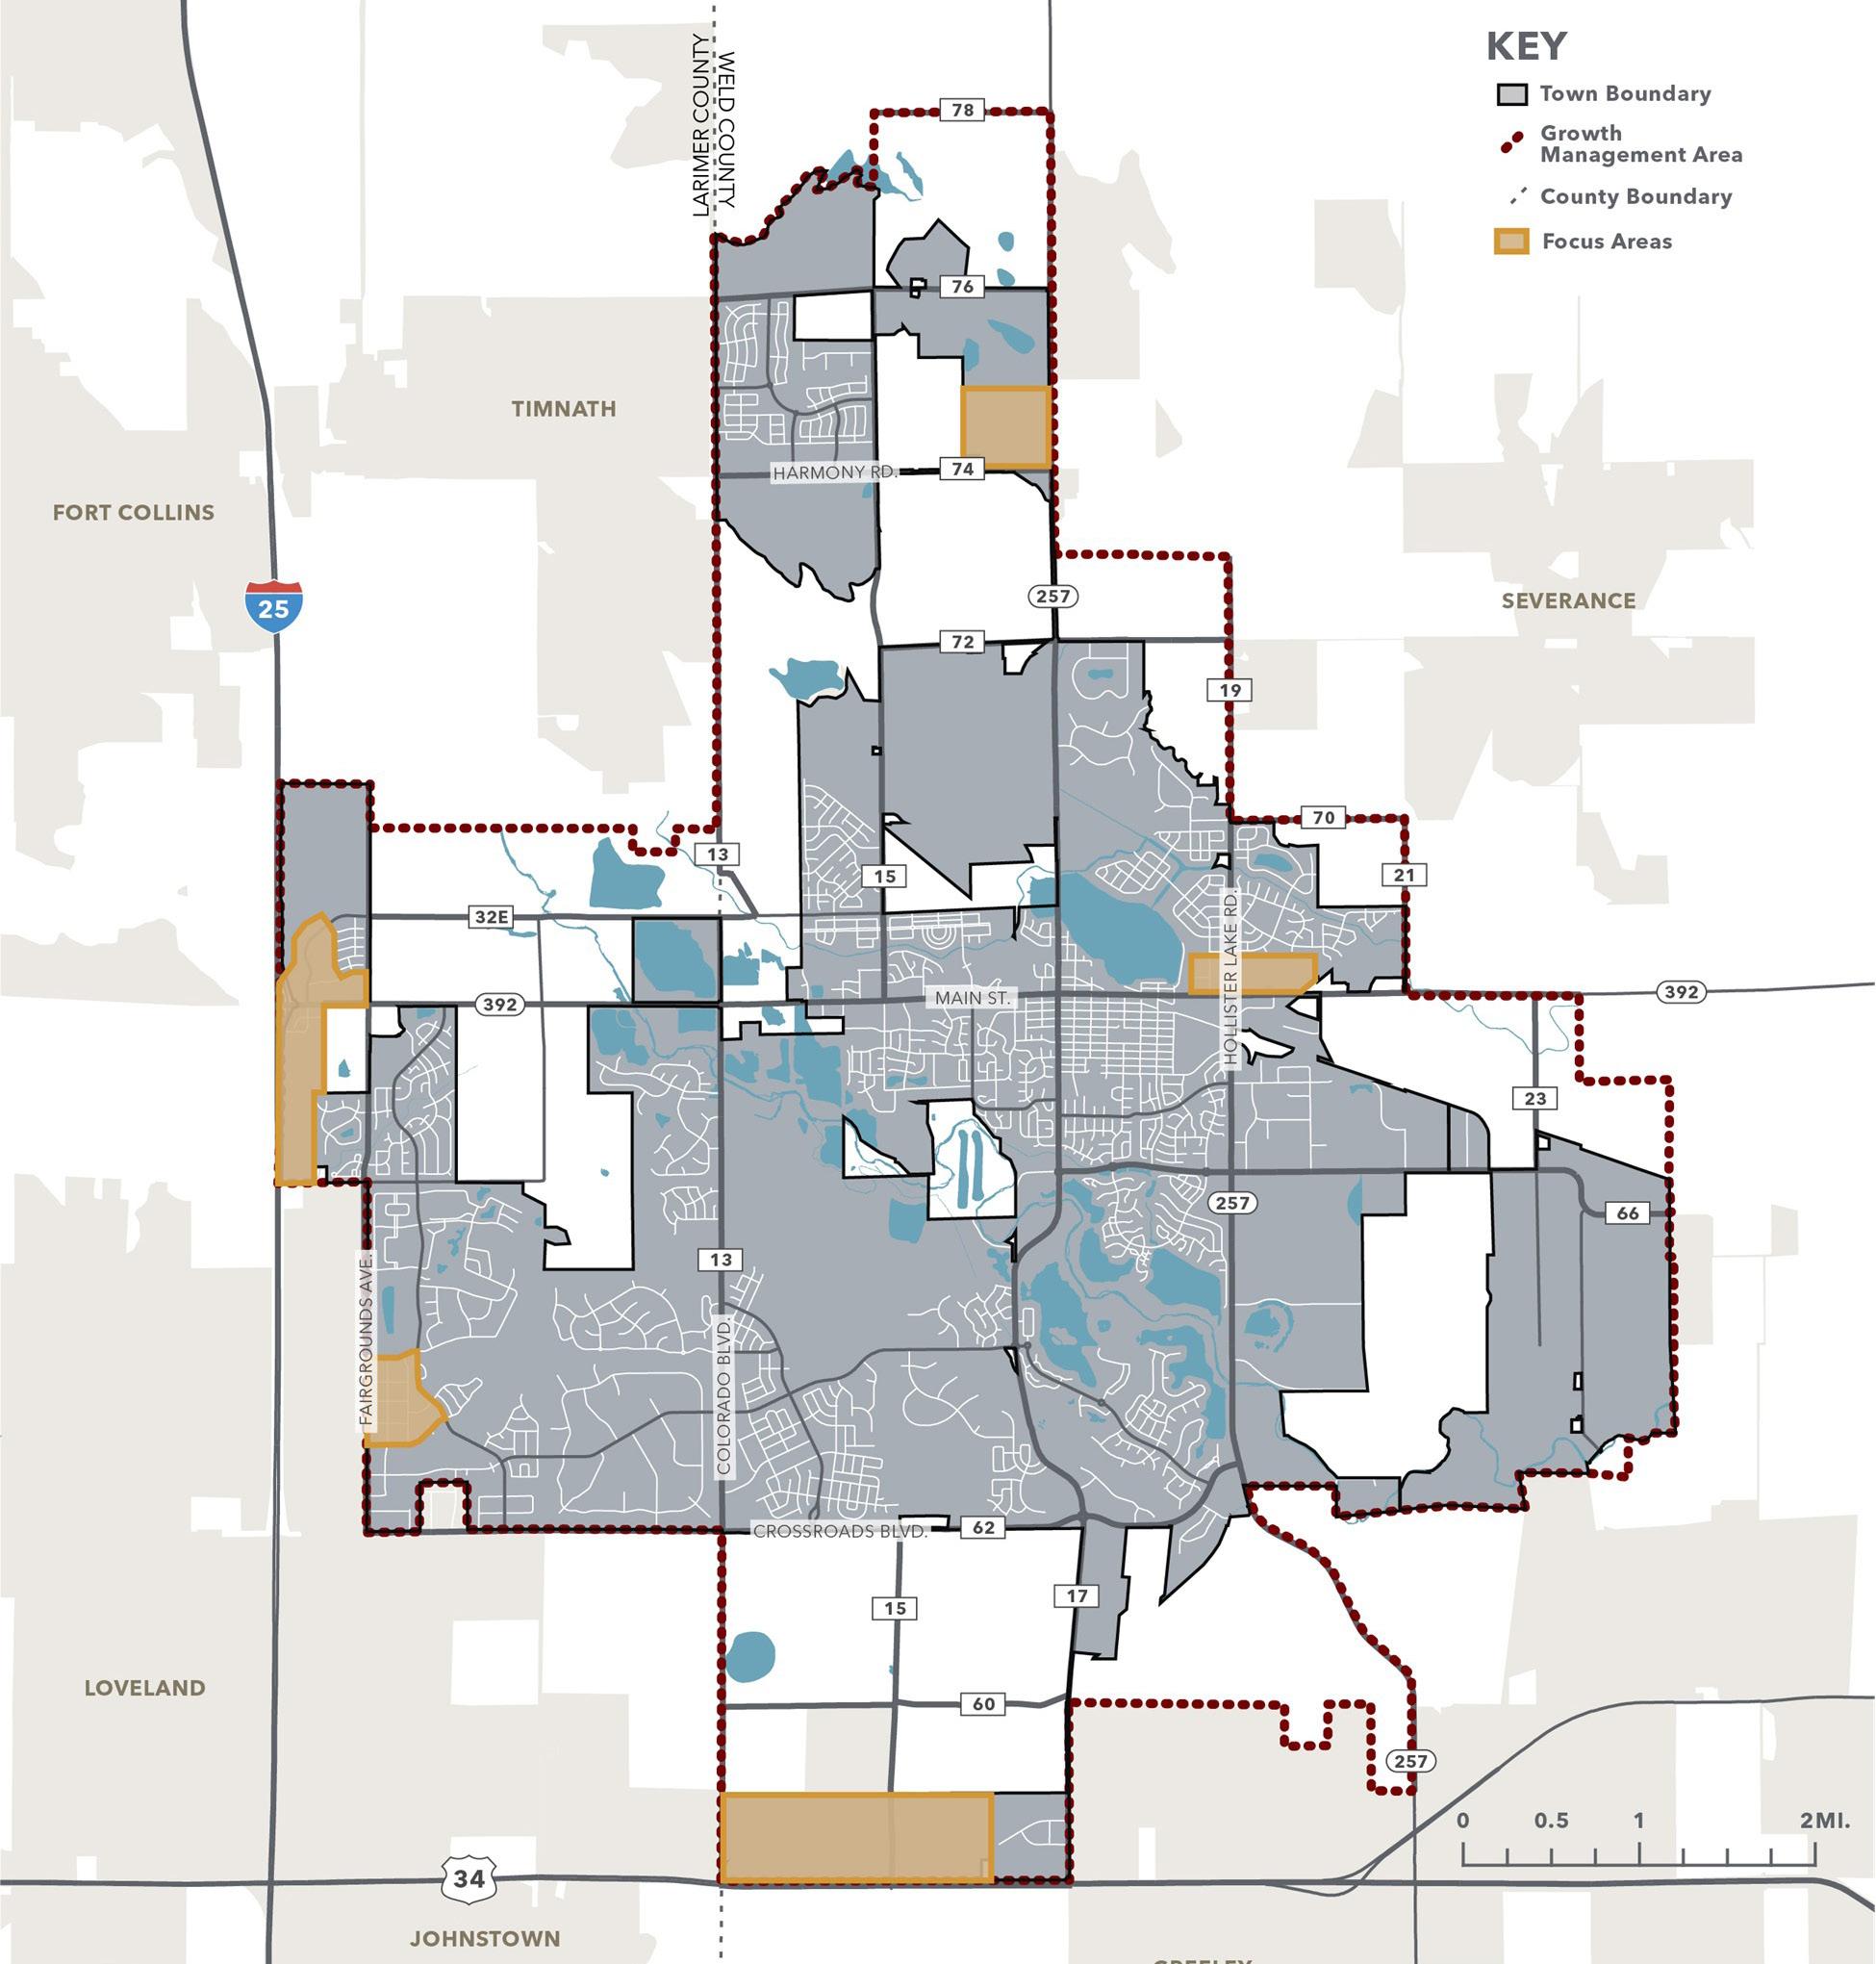
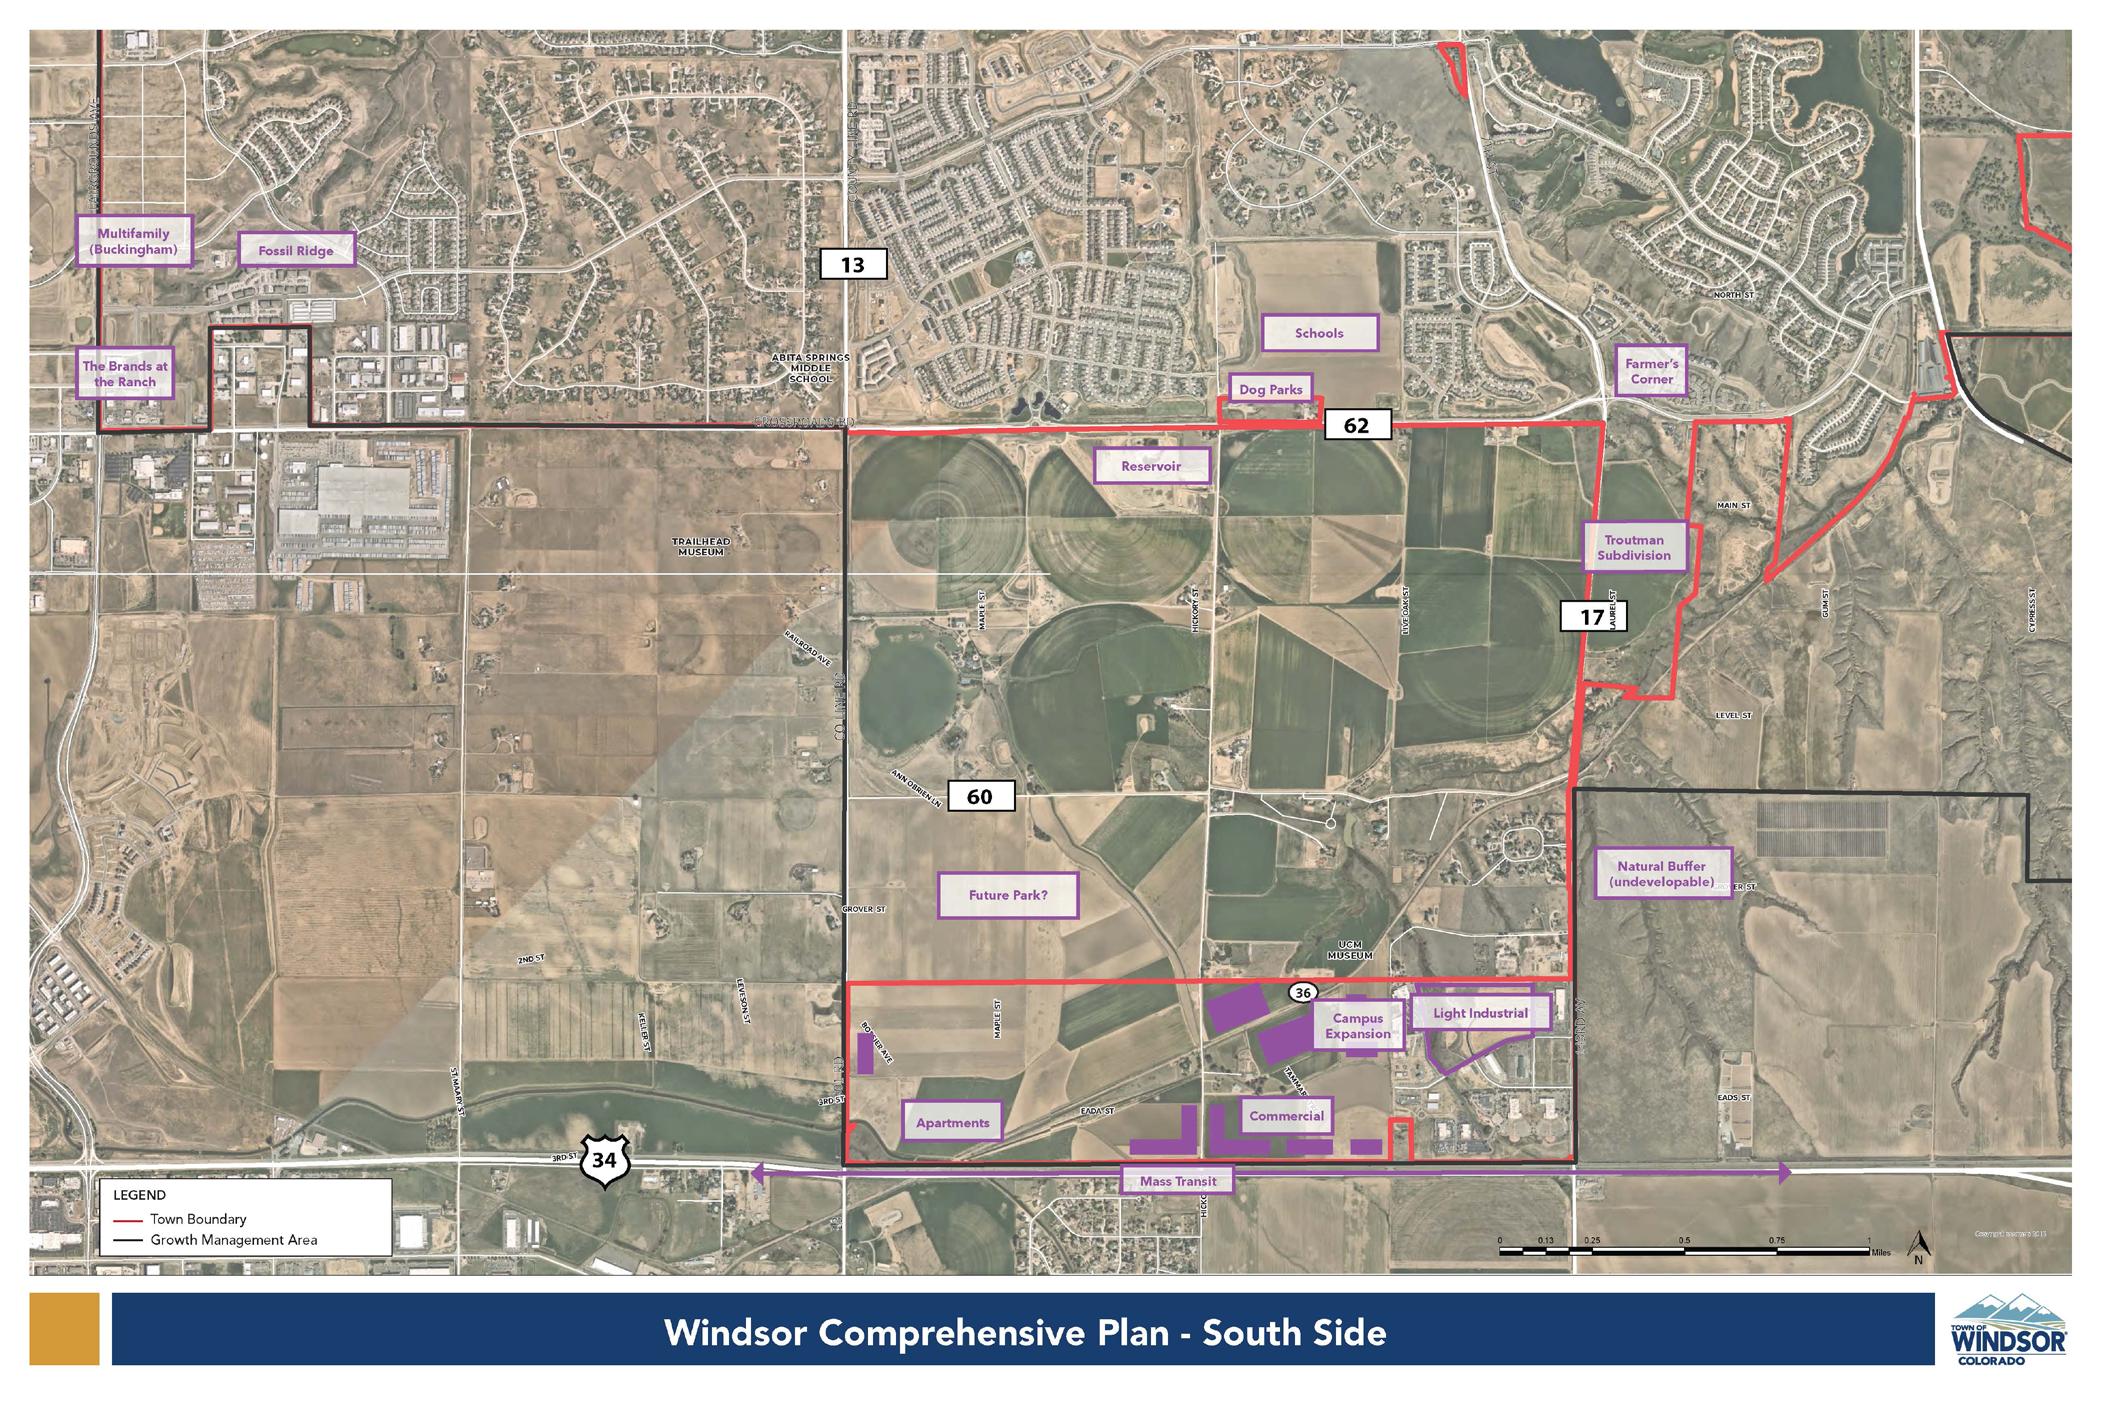
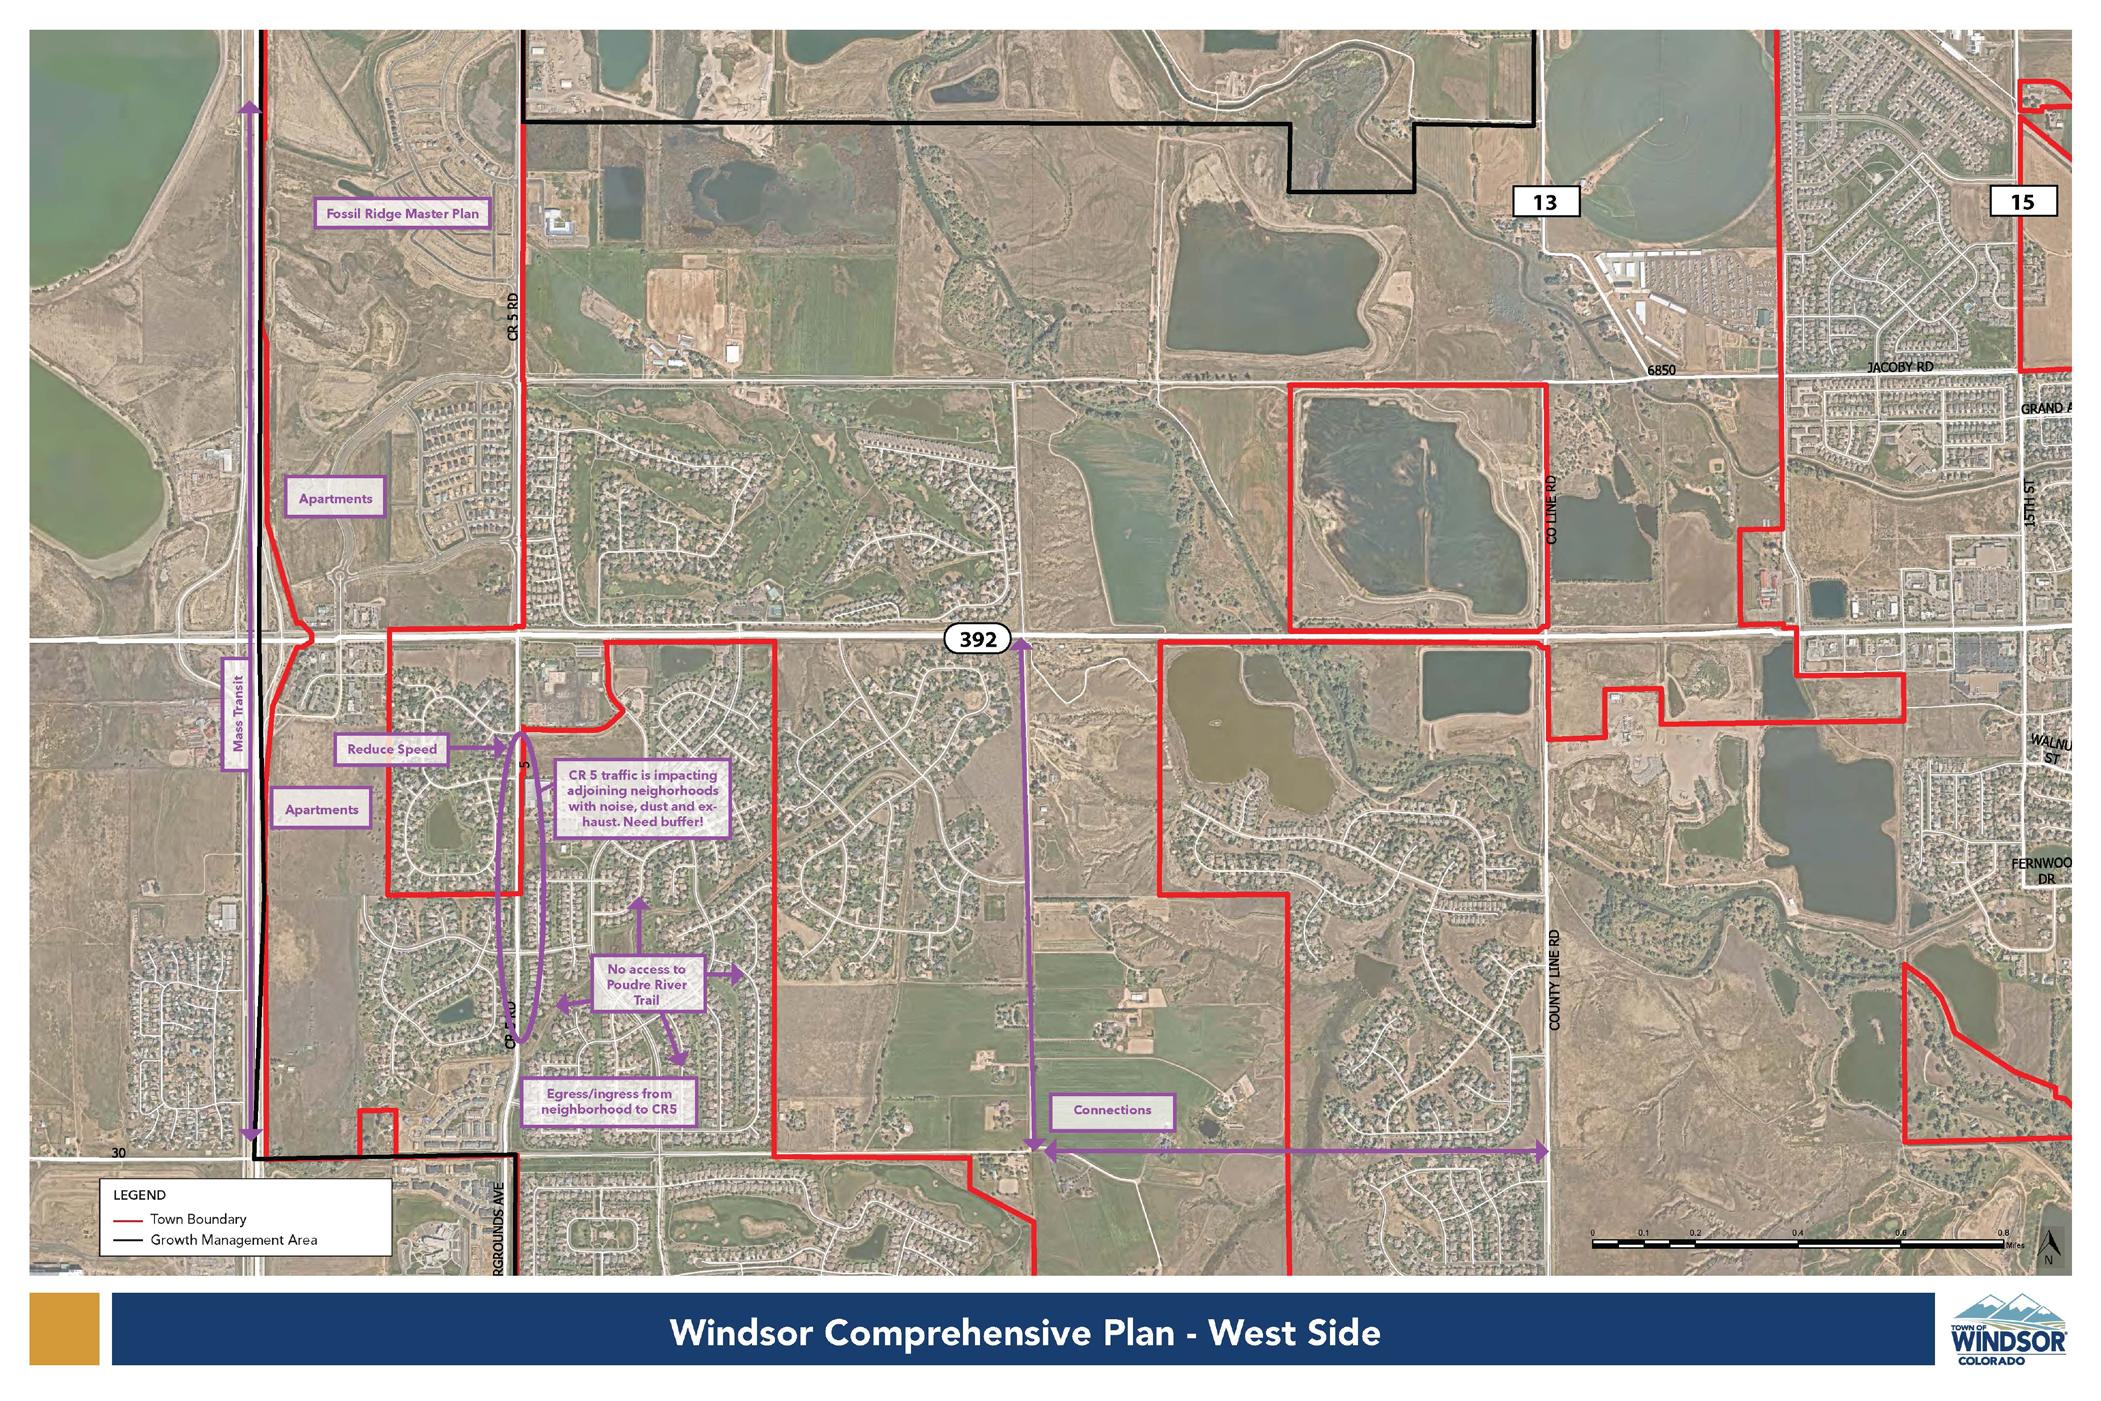
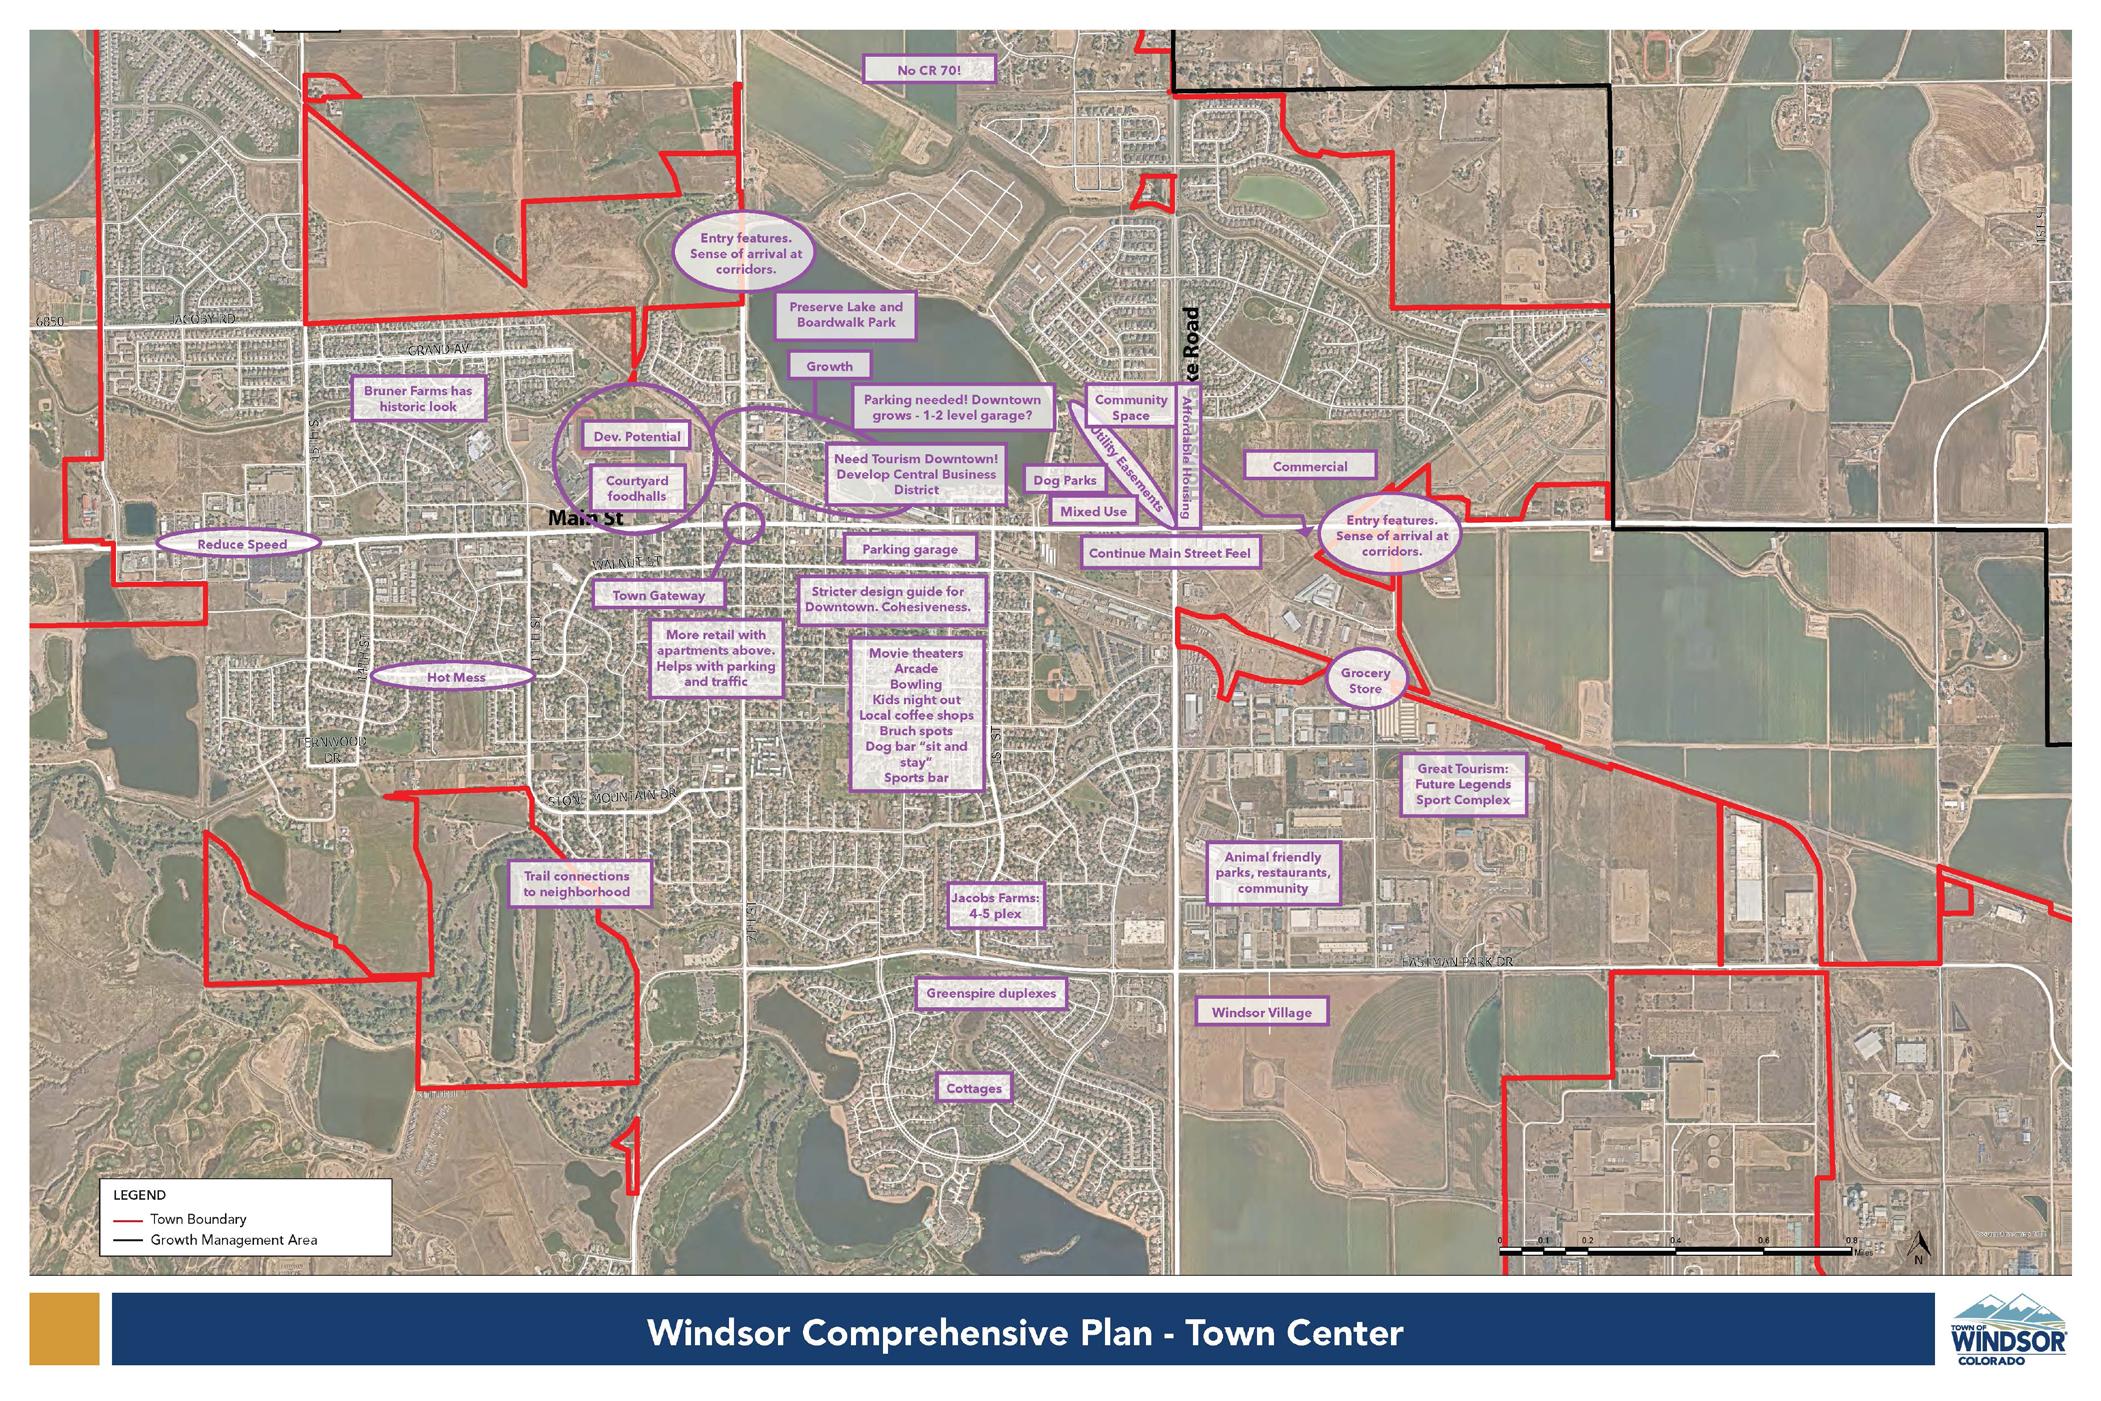
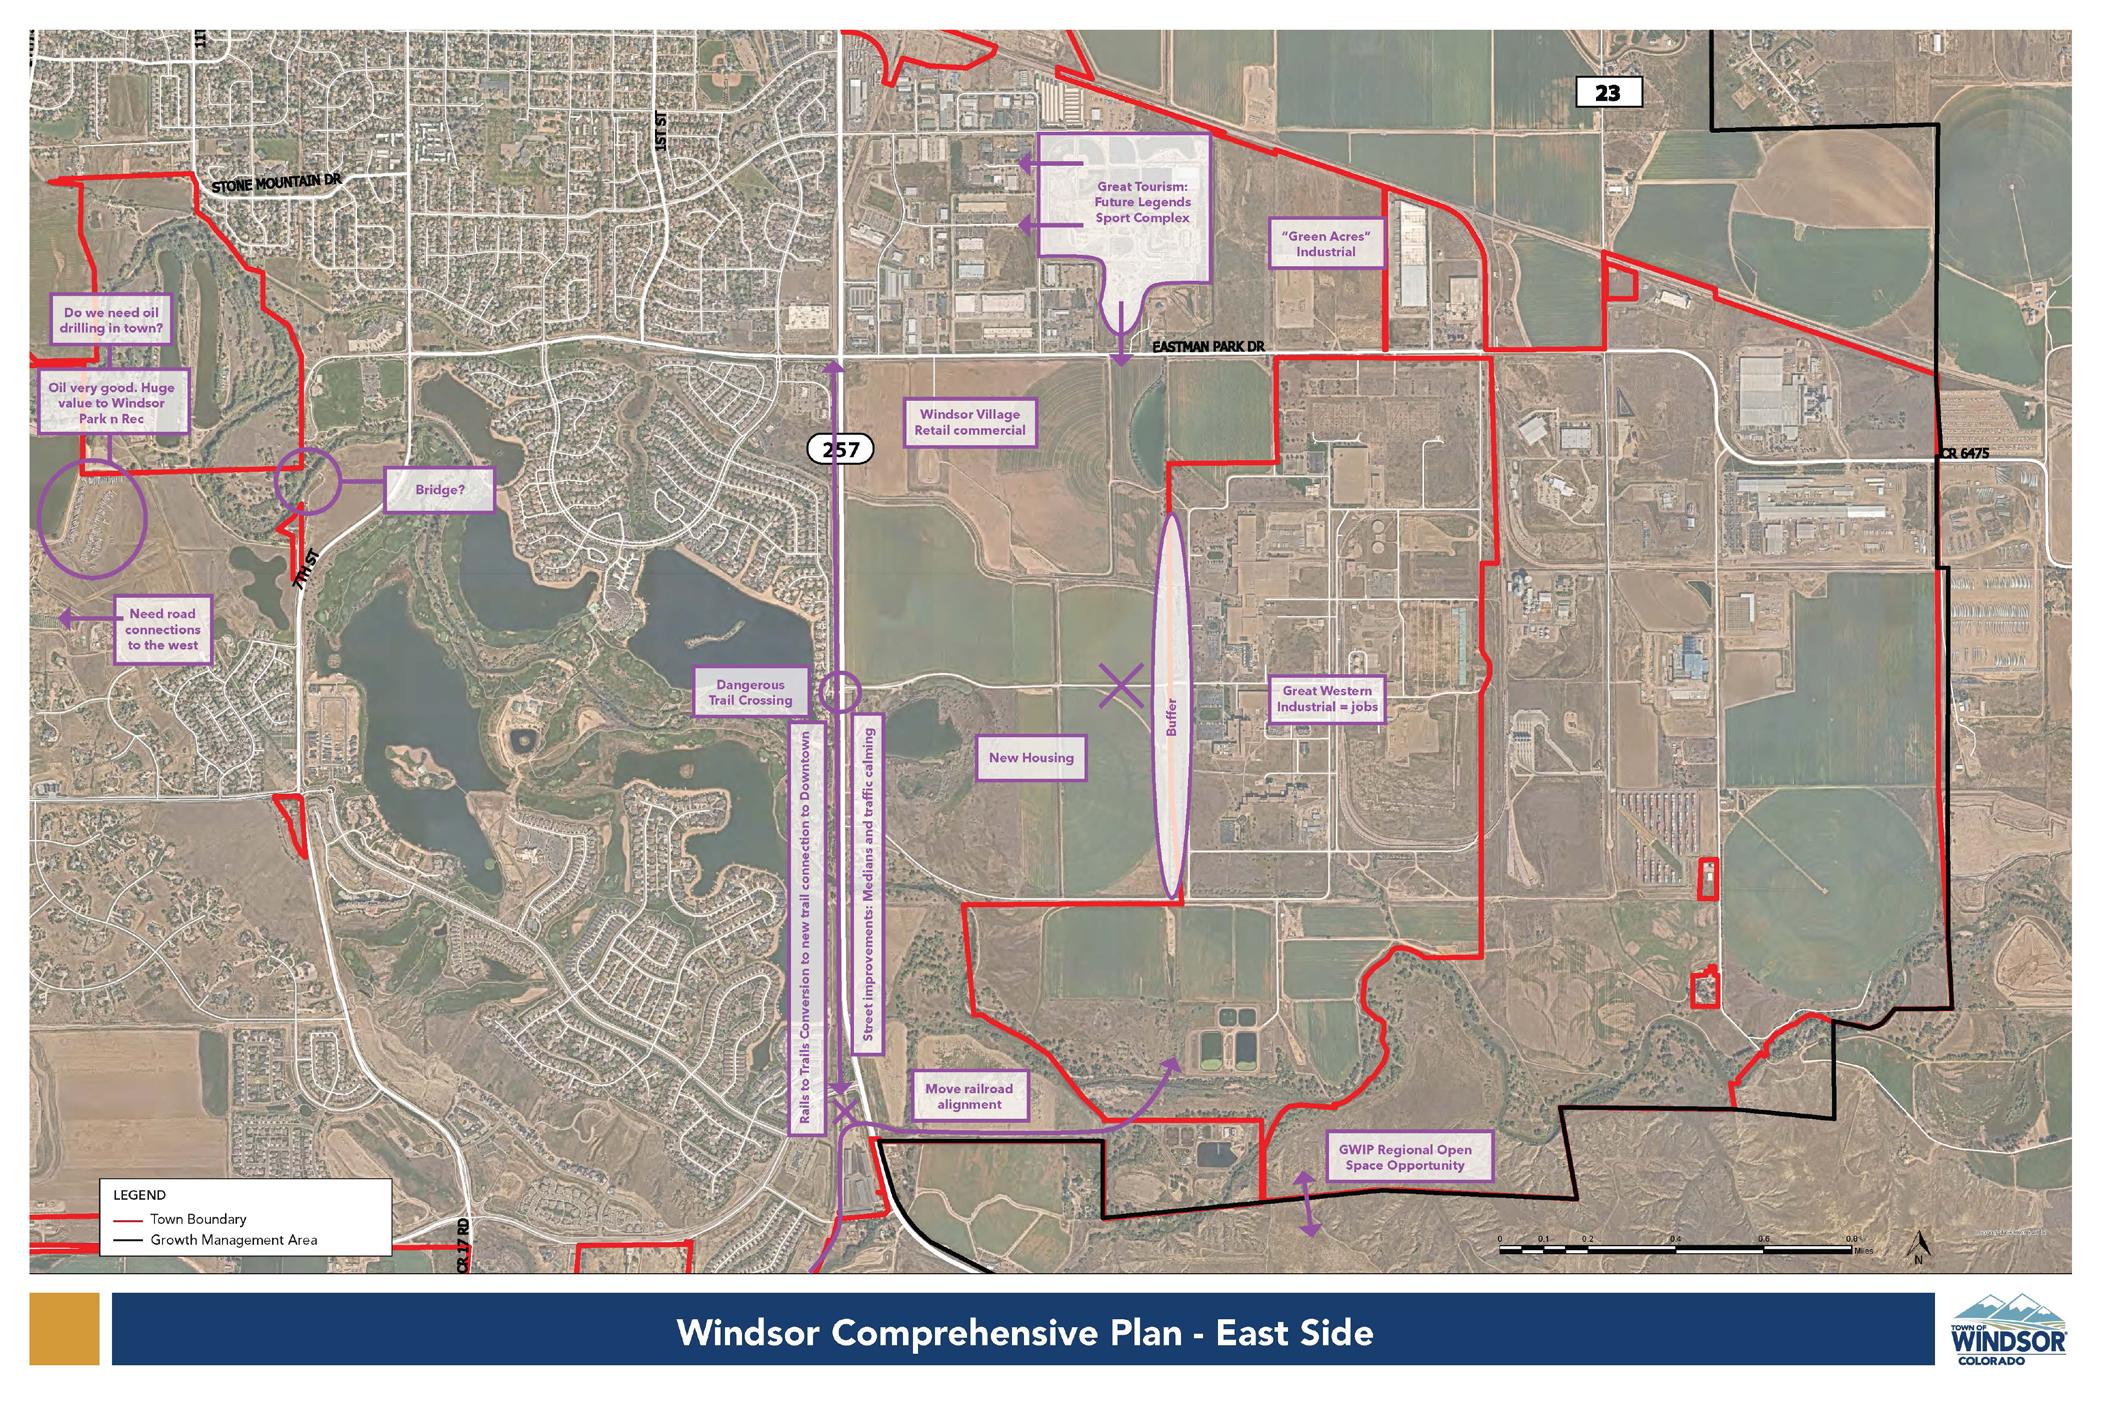
Early in the planning process, Town staff identified five areas within the Town as opportunity areas. These areas were workshopped during the Charrette with the public and staff to identify possible land use mix, character, circulation, and other development patterns that could be considered.
CORRIDOR ACTIVITY CENTER DOWNTOWN EXTENSION
A-30 WINDSOR COMPREHENSIVE PLAN |
FAIRGROUNDS AVE.
HIGHWAY 34
HARMONY AND HIGHWAY 257
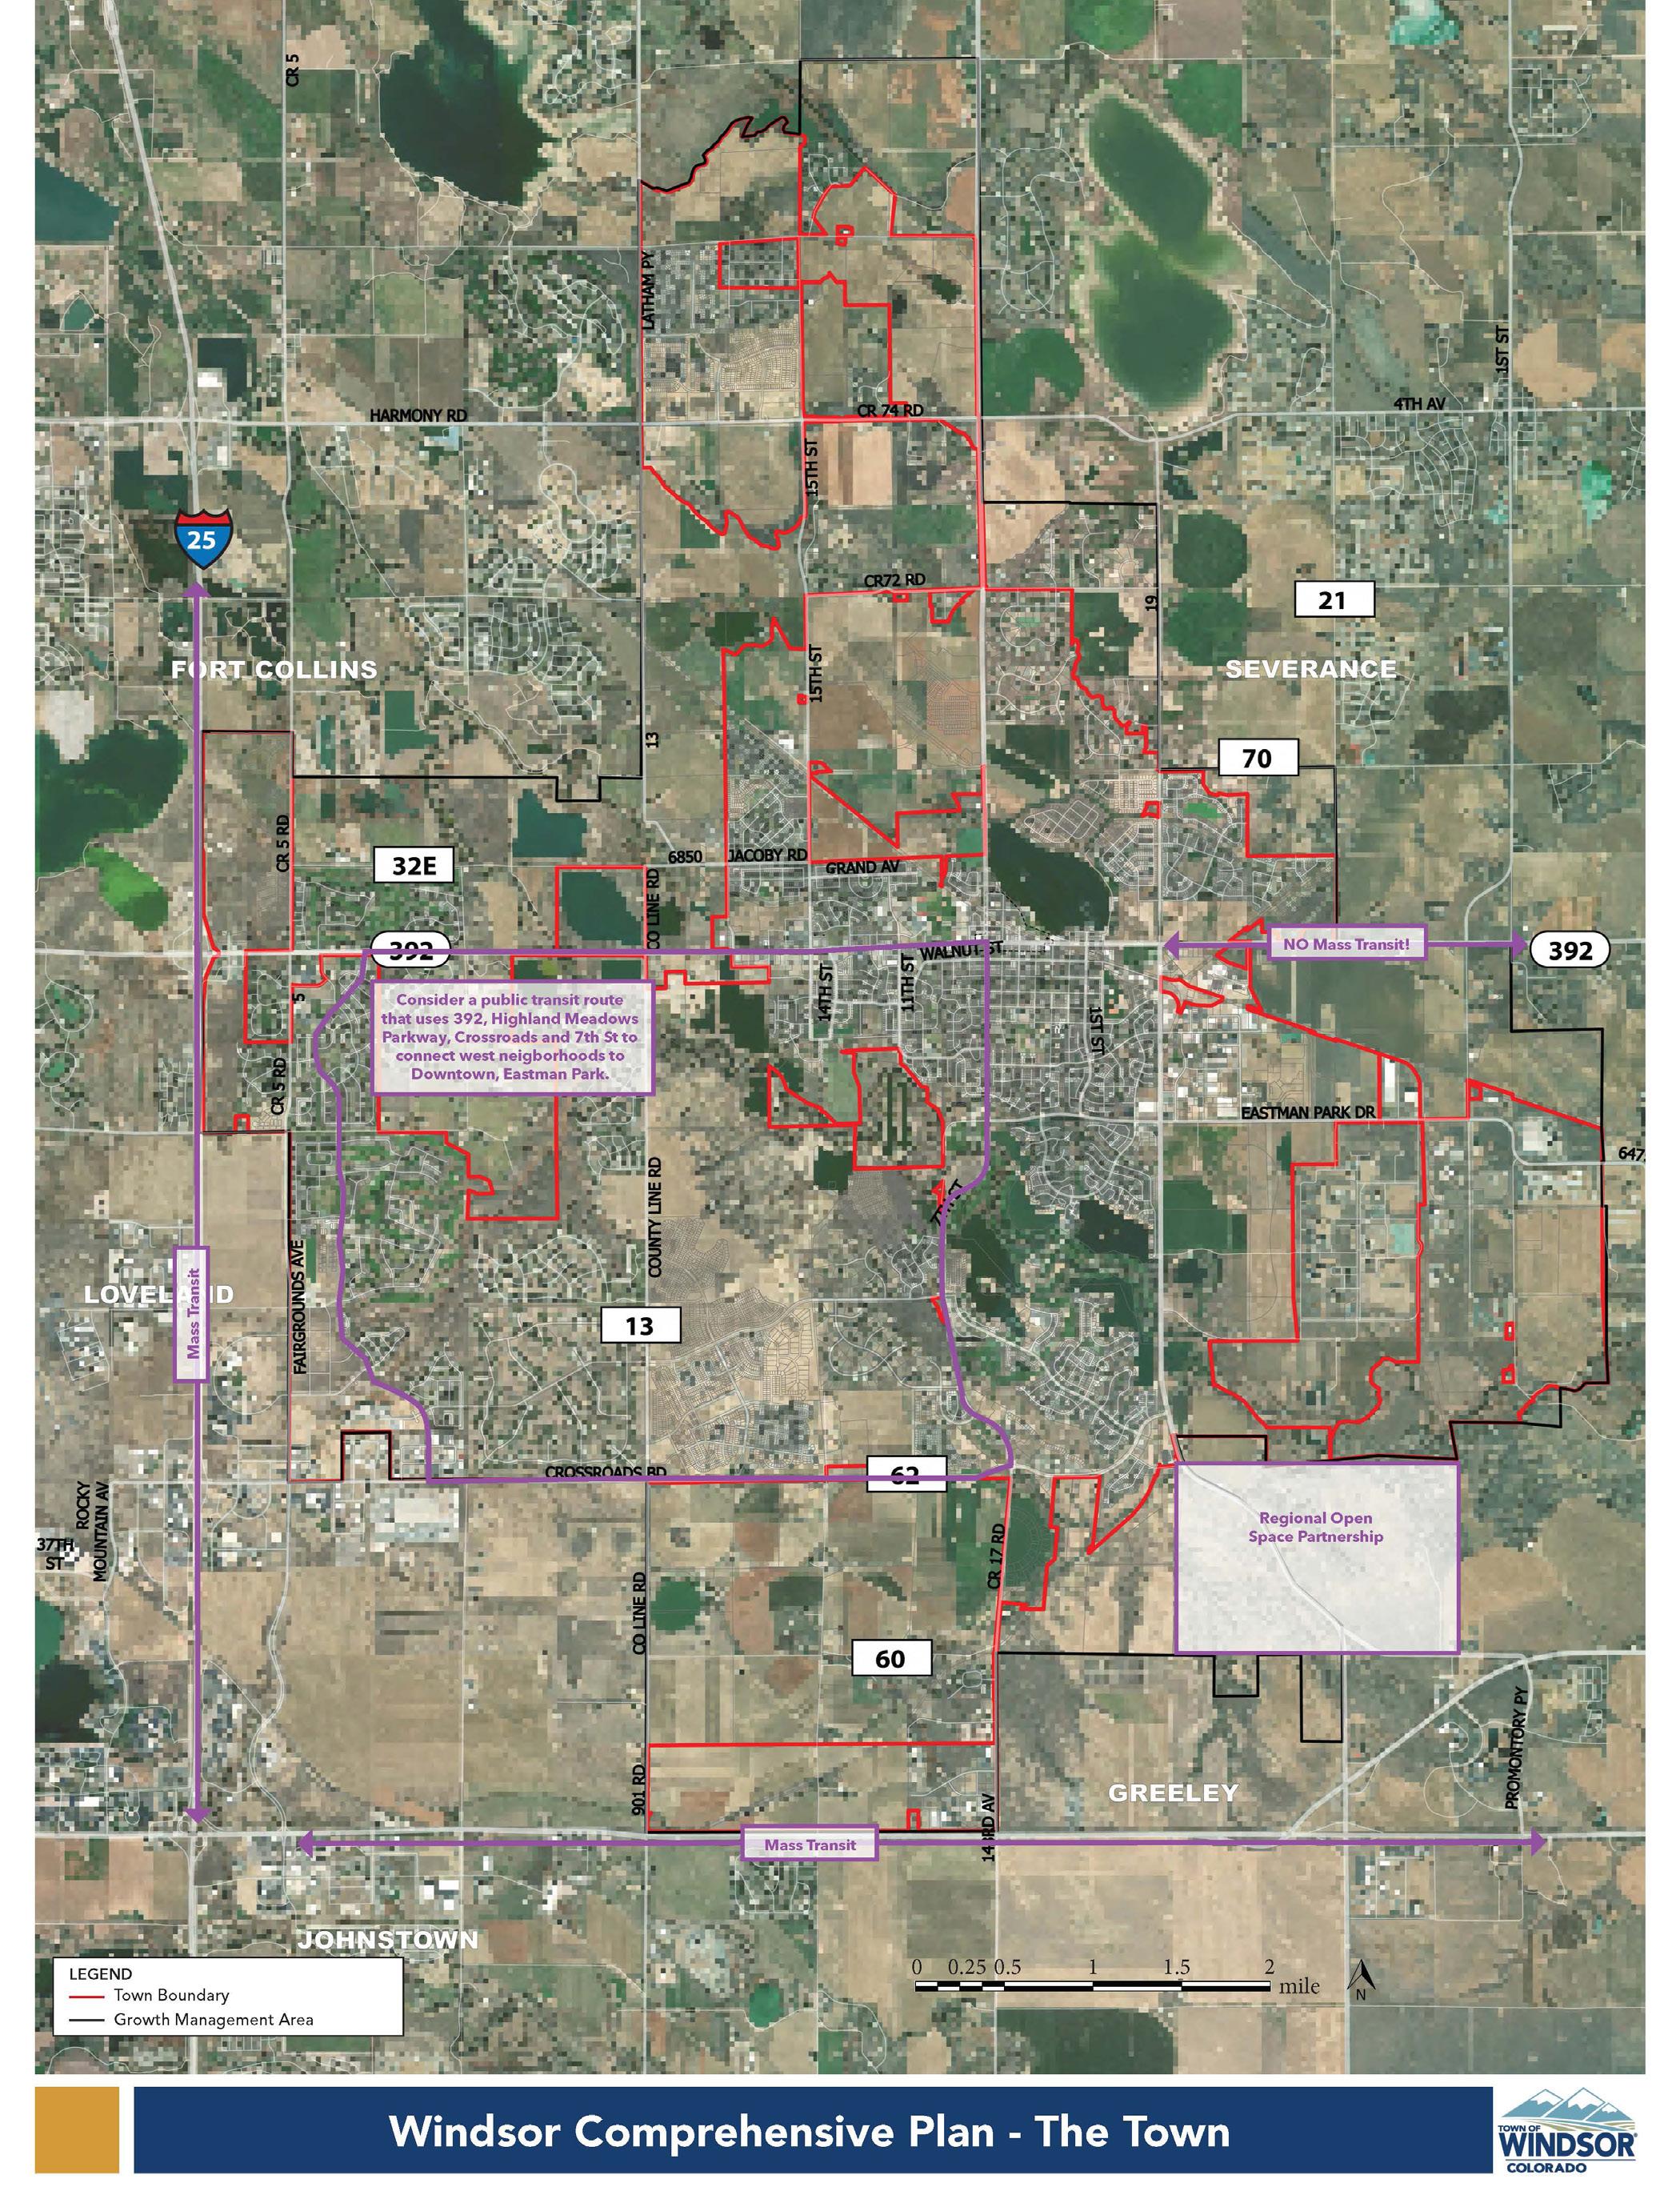
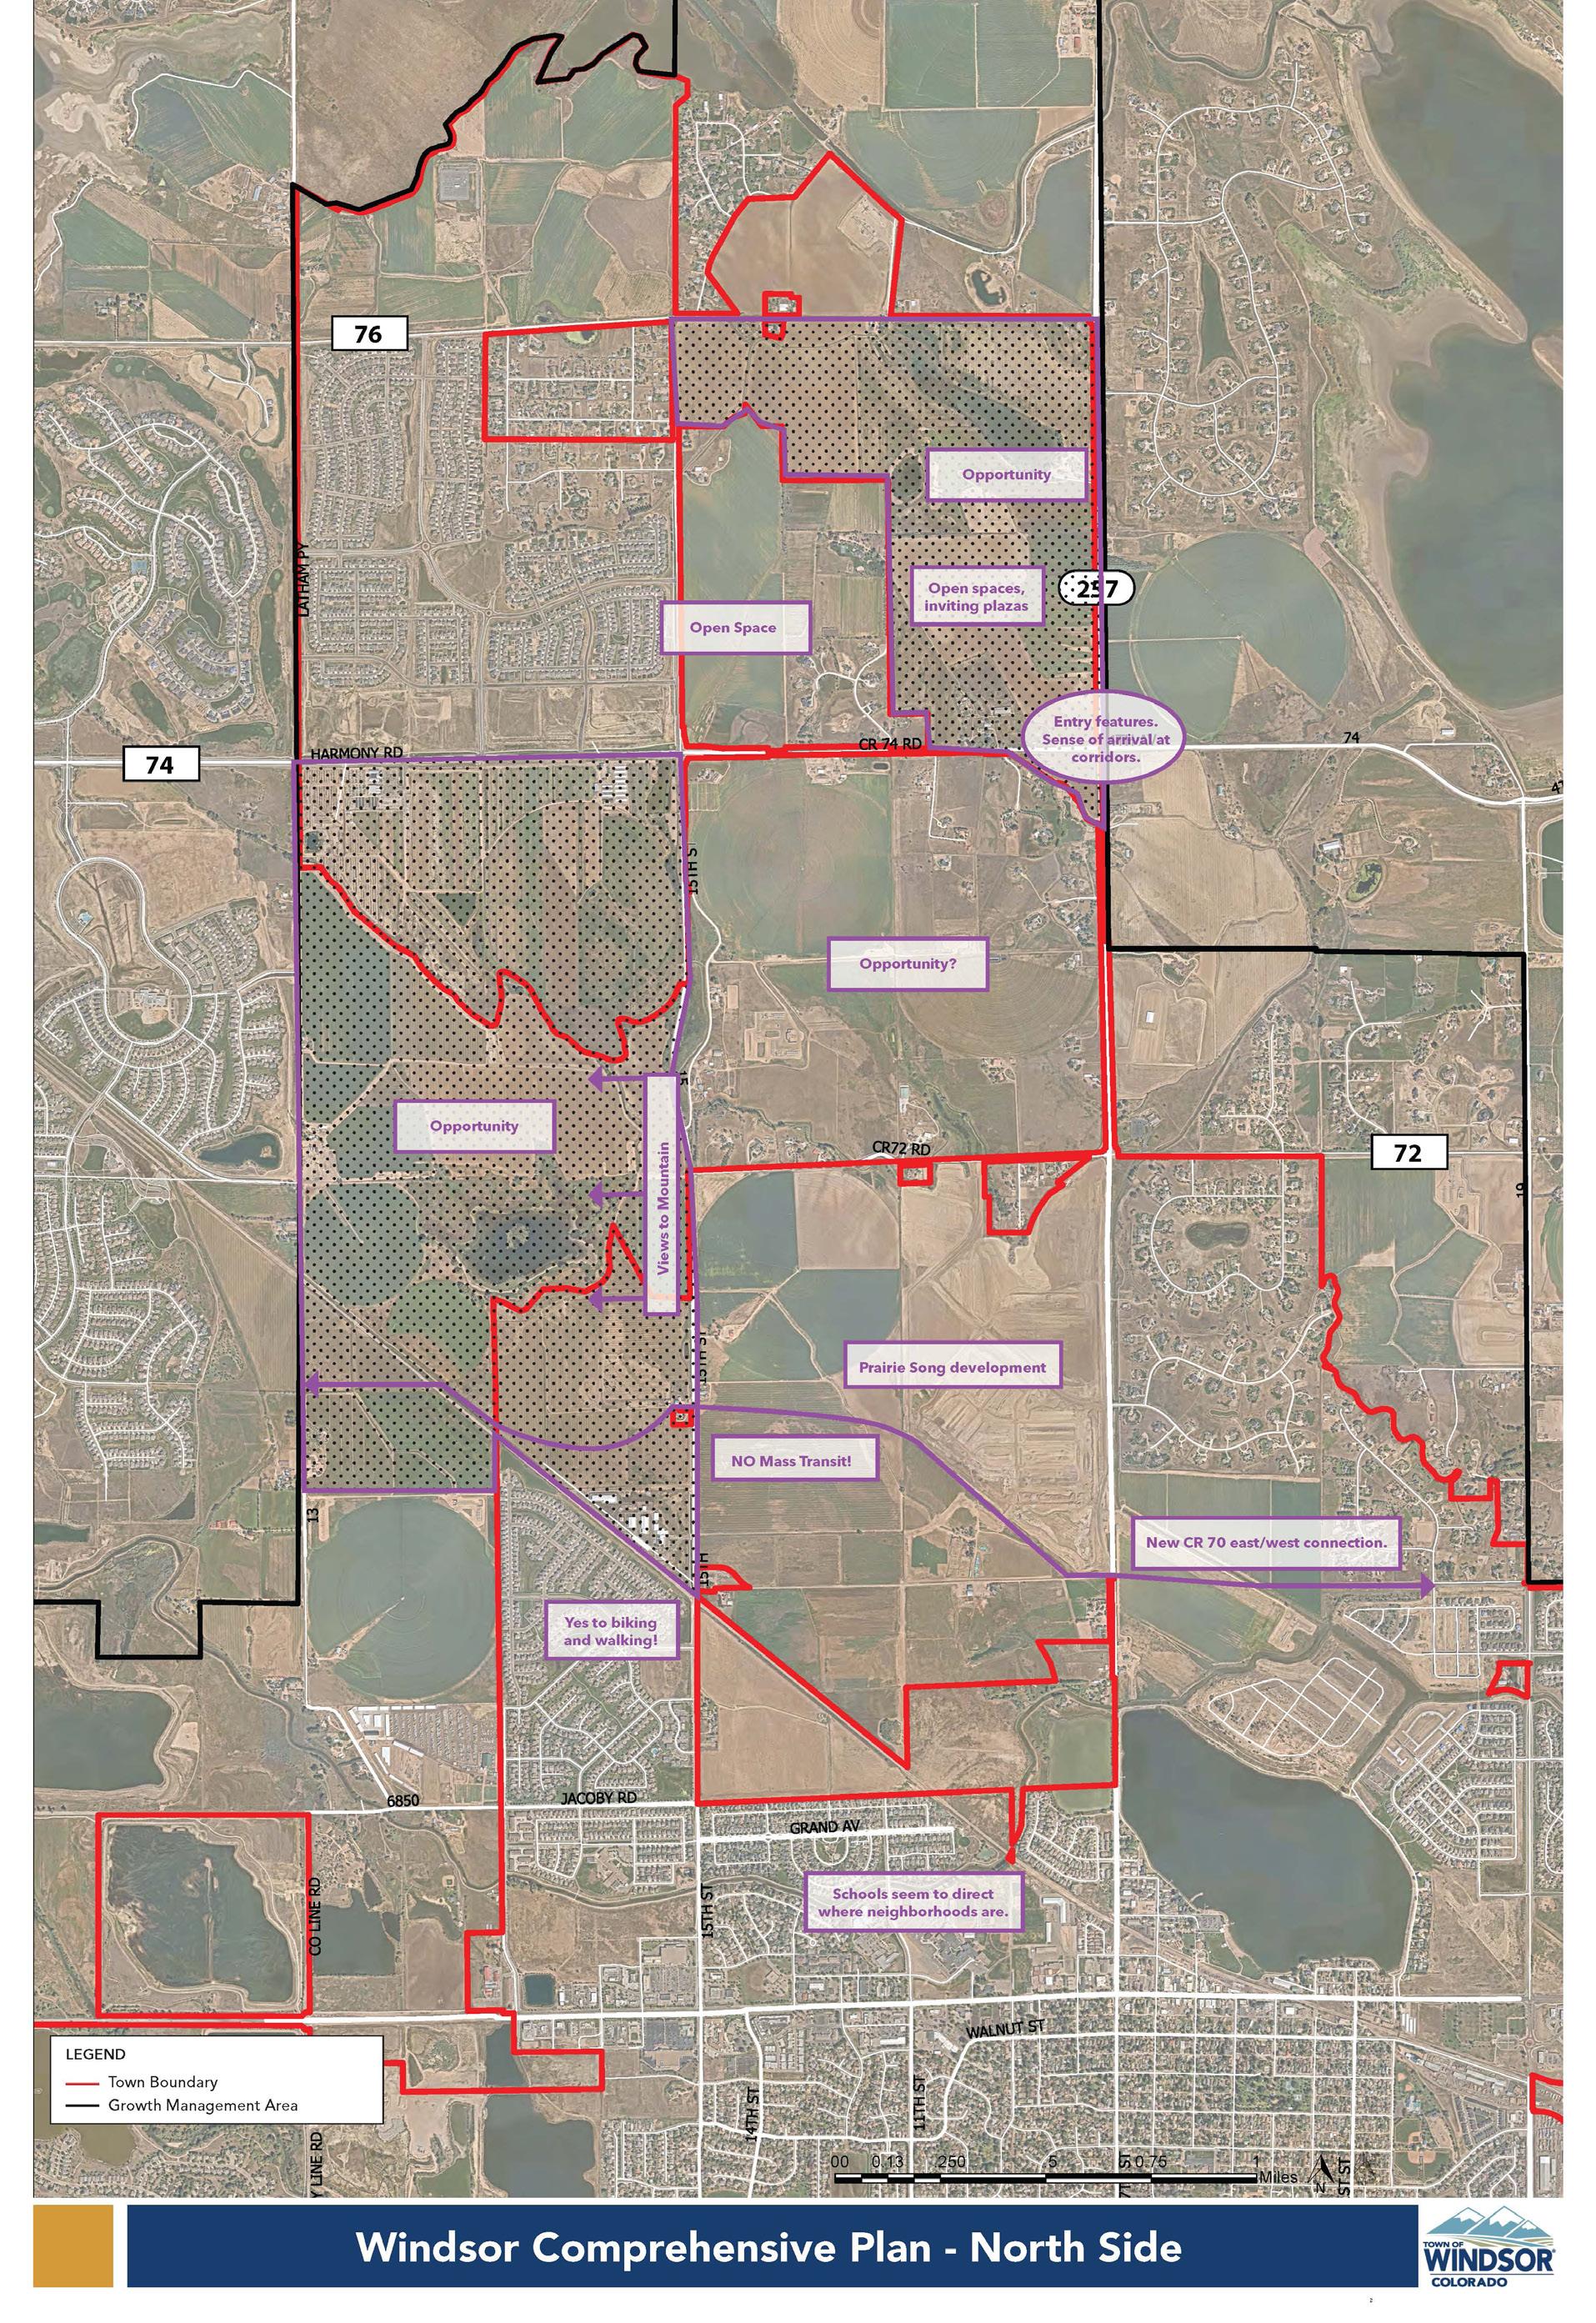
Consolidated Charrette Map Feedback
A-31
A-32 WINDSOR COMPREHENSIVE PLAN |
A-33
A-34 WINDSOR COMPREHENSIVE PLAN |
7. VISION AND GUIDING PRINCIPLES QUESTIONNAIRE
A draft Vision statement and set of Guiding Principles were developed based on feedback and input from the public, advisory committees, staff, and town leadership in previous phases of the plan. While initially based on the statements and direction from the 2016 Comprehensive Plan, the revised direction aimed at clarifying, simplifying, and updating the direction to better align with the values and priorities that were expressed during the process.
A second online questionnaire was released on the Windsor Project Connect website in May 2024 and collected public feedback on the draft Vision and Guiding Principle statements for 3 months. During this time, 124 community members weighed in and commented on the statements. Subsequently, the Town Board, Planning Commission, and Plan Advisory Committee reviewed the public comments and made additional recommendations to revise the statements. Below is a summary of the public comments and feedback received from this Questionnaire #2.
Draft Vision: As a community, we envision a sustainable, distinctive, and thriving Town that prioritizes a high quality of life through thoughtful growth and development, fostering a sense of place and community, and responsible stewardship of its natural resources.
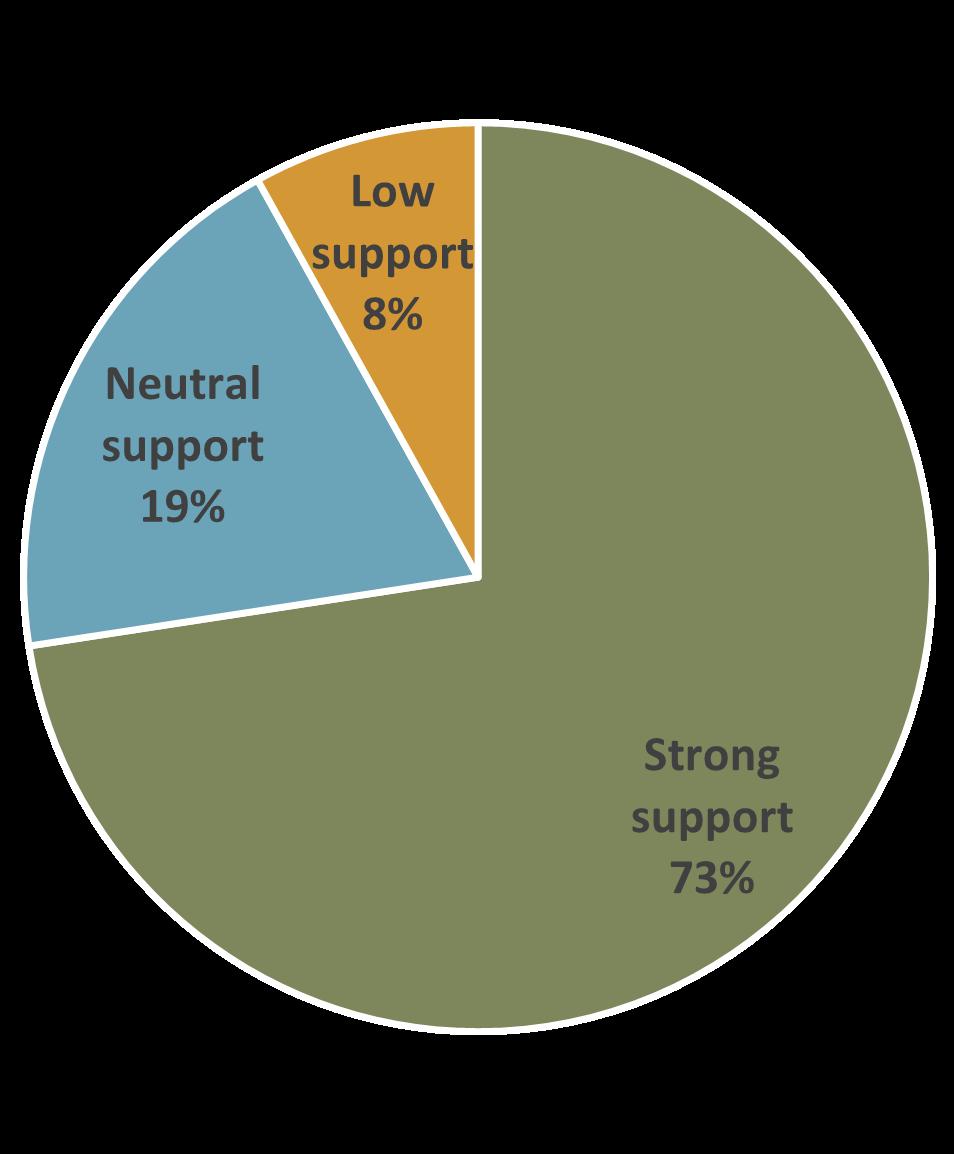
Generalized Comments for Improvement
• “Thoughtful growth and development” are not things I associate with Windsor.
• Don’t like the vague words: “sense of place”, “distinctive”
• No more growth/development
• Pretty words don’t matter if actions don’t match what you say.
• Small town feel, community minded.
• What do we mean by “sustainable”?
• Emphasize safety and low crime.
• Thoughtful growth is not meaningful or measurable.
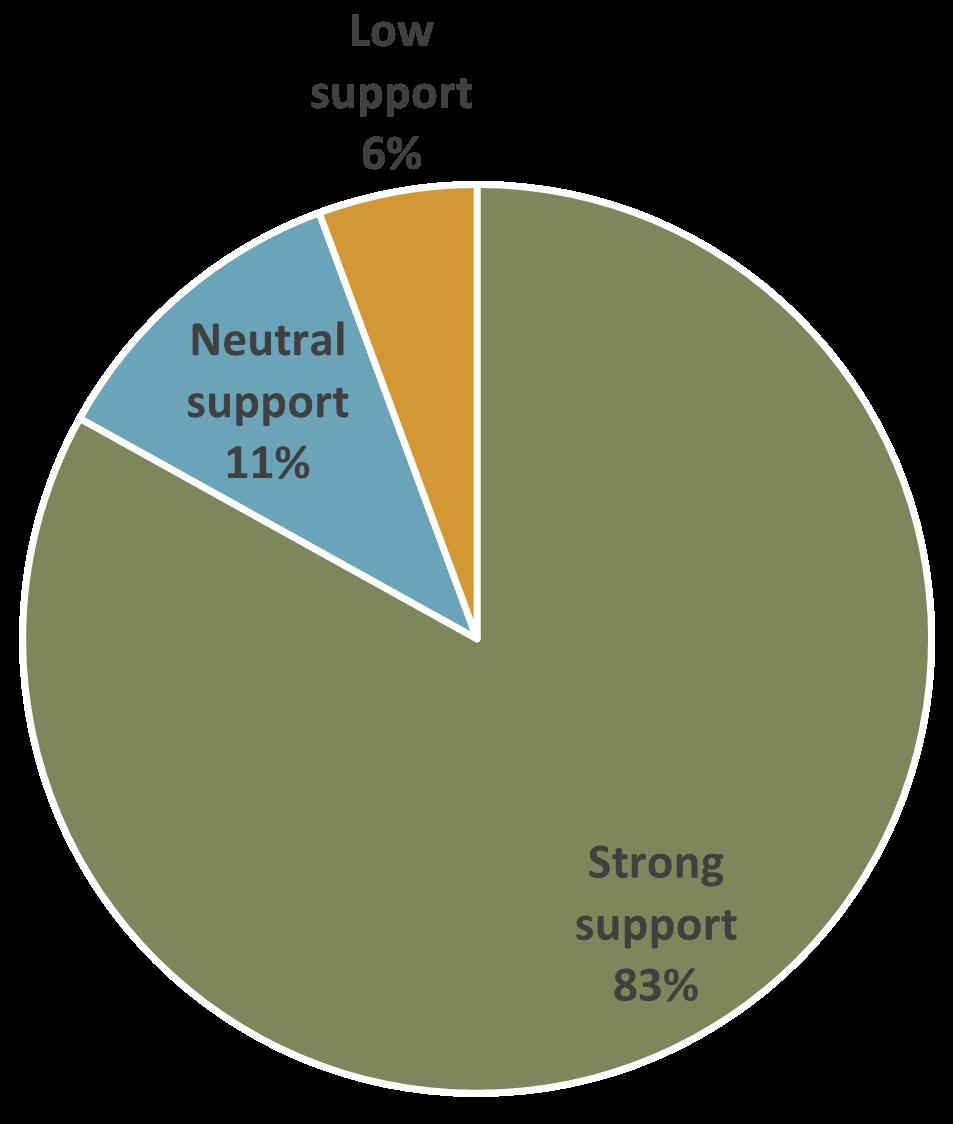
Draft Guiding Principle #1: Balanced and sustainable growth that contributes to Windsor’s character, enables quality of life amenities and services.
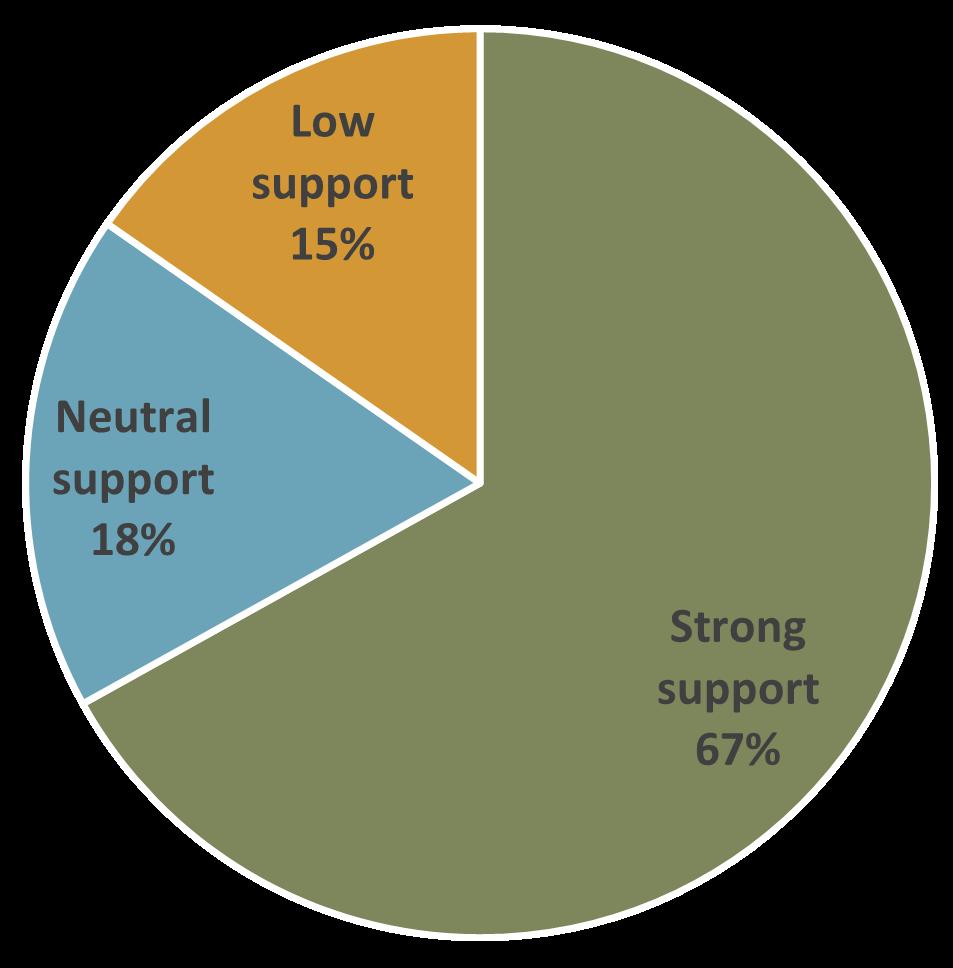
Generalized Comments for Improvement
• Already covered in vision statement
• Don’t support growth. We’ve lost our small town.
• There is no sustainable growth.
• Needs something about diversity; quality of life for “all incomes”. More DEI throughout.
• Can we quantify “quality of life”?
• No more growth. It’s already not sustainable.
• Managed growth. Controlled growth
A-35
What Does This Mean in Practice?
• The community emphasizes the importance of balanced and sustainable growth, avoiding rapid development that may compromise quality of life.
• There is a strong desire to preserve farmland, water, and natural areas, with an emphasis on responsible development in underutilized spaces.
• Focus on enhancing downtown areas with experiential retail and restaurants while maintaining the unique small-town character of Windsor.
• Community members stress the need for careful planning, ensuring infrastructure like roads and utilities keeps pace with housing and business growth. There’s also a call for amenities that can support the current population.
• Encouragement for local economic growth, mom-and-pop businesses, and amenities that complement the small-town feel. Additionally, there’s a focus on affordable housing, mixed communities, and ensuring growth is financially sustainable without burdening existing residents with tax increases.
Draft Guiding Principle #2: Neighborhoods that prioritize connectivity and livability for households of all sizes and incomes.
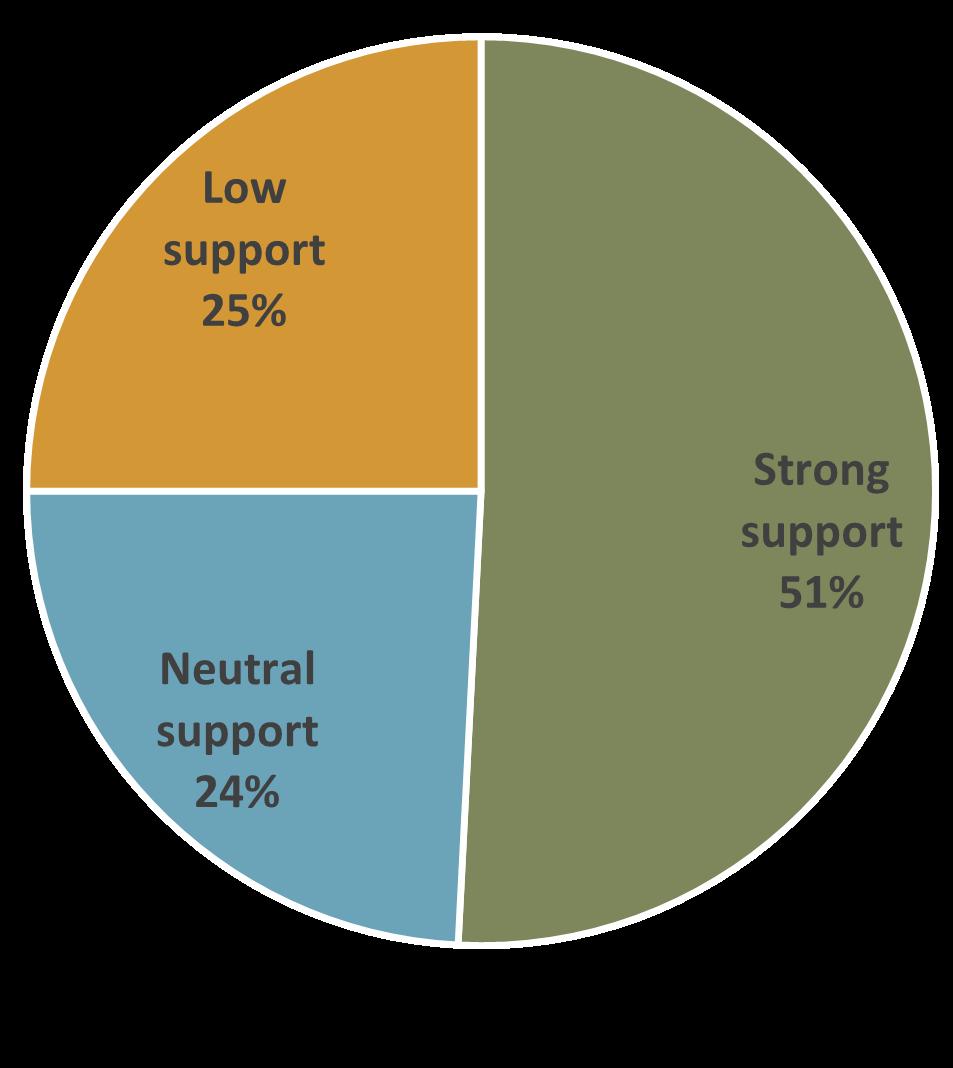
Generalized Comments for Improvement
• Terms “connectivity and livability” are confusing
• The Town shouldn’t be involved in the atmosphere that individual neighborhoods create.
• Already covered in vision statement
• Don’t want slums. Attracting low-income residents is a mistake.
• Not interested in our town having tons of low-income housing. Crime follows.
• Have strong, authentic neighborhoods that strengthen Windsor’s character.
• Connected for bikes and pedestrians.
What Does This Mean in Practice?
• Prioritize a mix of housing types, including affordable housing, while avoiding large apartment complexes to maintain the small-town feel.
• Encourage a variety of housing types and densities to accommodate different price points and renter/owner preferences.
• Emphasize neighborhood connectivity through safe street crossings, bike routes, and pedestrian-friendly features.
• Encourage mixed-income, age, and type neighborhoods that foster connections.
• Develop parks and open spaces as focal points for neighborhoods.
• Prioritize amenities like trails, bike paths, and municipal broadband for community well-being.
• Support a balanced approach to growth, avoiding excessive high-density housing.
• Advocate for strategic planning that connects neighborhoods, ensuring walkability, bikeability, and digital connectivity.
A-36 WINDSOR COMPREHENSIVE PLAN |
Draft Guiding Principle #3: A vibrant and resilient economy that leverages Windsor’s cultural hubs and activity centers, which build upon dynamic commercial, educational, and employment districts, and emphasizes innovation and adaptability.
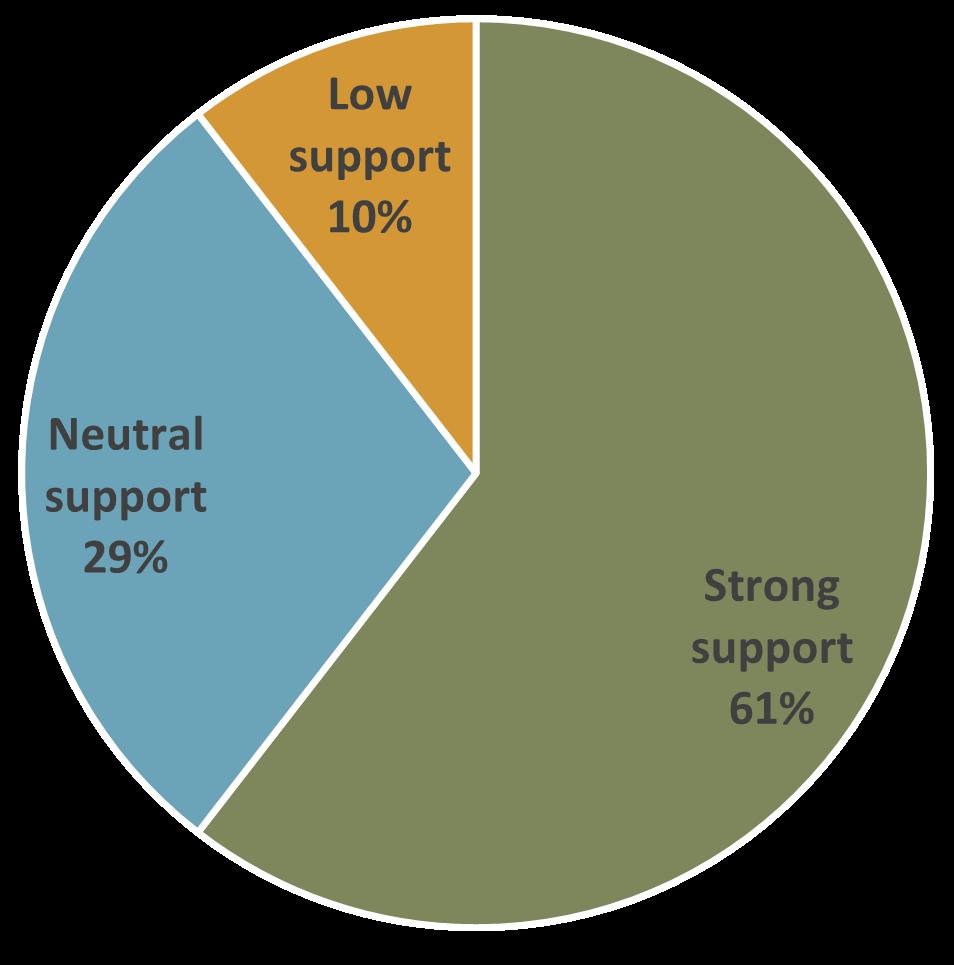
Generalized Comments for Improvement
• We aren’t and never will be downtown Fort Collins.
• Needs to be more clear and succinct.
• Already covered in vision statement.
• Don’t want to see Windsor become commercialized and corporations. Love small businesses.
• Too long/wordy
• What does “leverages” mean here?
What Does This Mean in Practice?
• Prioritize public spaces, especially around the lake and downtown, over commercial interests to maintain a unique, small-town feel.
• Emphasize mom-and-pop businesses that complement the small-town character.
• Encourage diverse businesses and diversification among places of business for a more walkable and thriving downtown area.
• Focus on accessibility for everyone.
• Fund recreation and schools to enhance the attractiveness of Windsor.
• Be pro-business, concentrating on building the commercial economy and leveraging cultural and recreational amenities.
• Emphasize innovation and adaptability in commercial development.
• Involve the community in economic development plans, considering historical elements like ranches and beet farms to build on the area’s history.
Draft Guiding Principle #4: A sense of place and small-town character that makes Windsor a desirable place to live, work, and recreate.
Generalized Comments for Improvement
• Get rid of “sense of place”
• If we want a small town, we need to focus on amenities, activities, and wildlife for the existing population.
• Small-town feel is not important to me.
• Windsor needs to get out of the “small town” mentality. We aren’t small anymore and it’s a waste of resources to try to recreate it.
• Not a small town anymore. Just make it walkable and give us great services.
A-37
What Does This Mean in Practice?
• Maintaining a unique atmosphere and avoiding the perception of becoming a larger town.
• Managing growth and development to prioritize amenities, safety, and a sense of community.
• Strategic planning to avoid sprawl and maintain the charm of neighborhoods like Old Town.
• Residents value community events, festivals, and activities that support local businesses.
• There is a desire for a diverse range of locally owned small and medium businesses to thrive and contribute to the community’s character.
• A small town is associated with low noise, low crime, low traffic, and low taxes. Residents express a desire for a safe environment for pedestrians and bikers, promoting walkability.
• Focus on enhancing amenities that contribute to the small-town feel, such as downtown facelifts, cultural events, and the development of community hubs.
• Leveraging existing cultural hubs and historical elements while promoting festivals and community-wide events.
Draft Guiding Principle #5: A connected, multimodal transportation network that is safe, efficient, comfortable, and intuitive, that serves all ages and abilities.
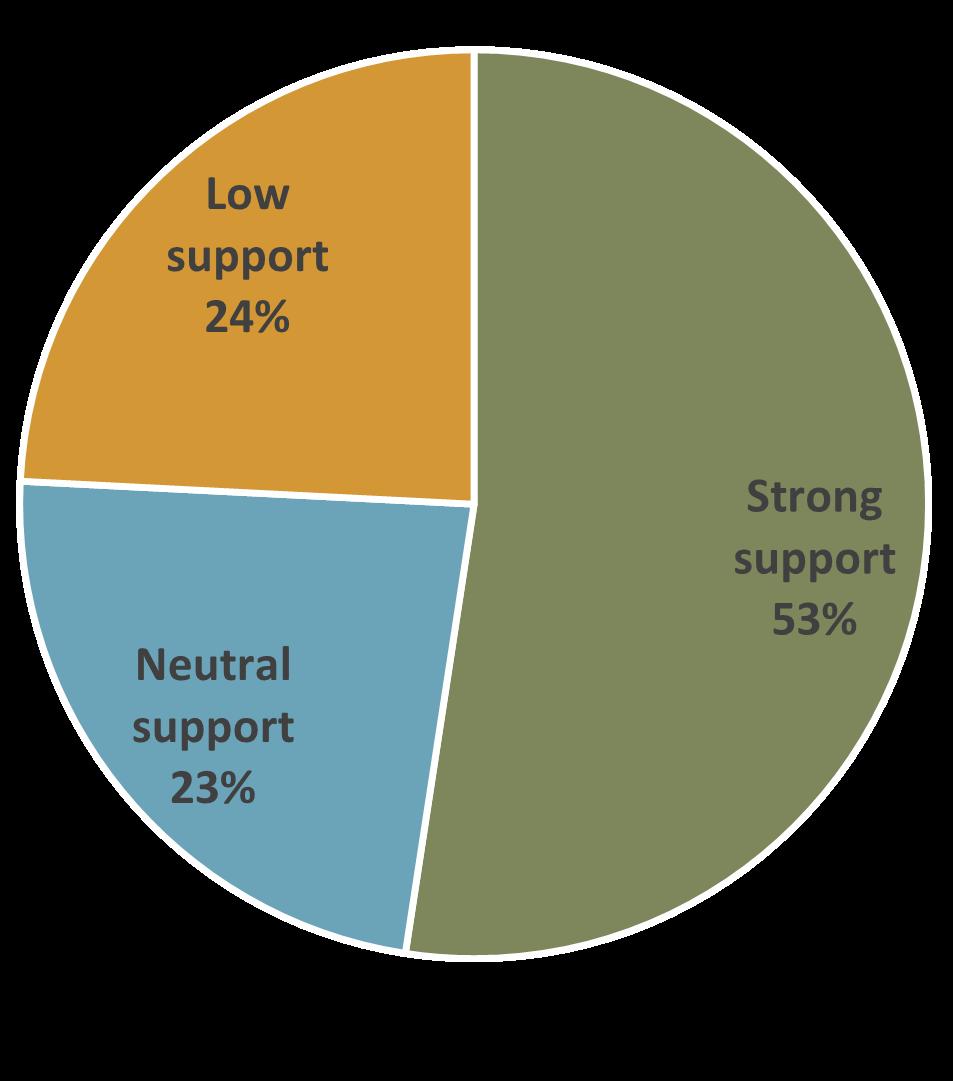
Generalized Comments for Improvement
• Public resources should be allocated to match utilization. Focus on roads, not transit.
• Multi-modal transportation isn’t a priority for our community outside of kids and safe routes to school.
• Bus system is underutilized but strong desire to provide access to those with limited mobility (i.e. seniors).
• Mass transit ruins nice communities.
• Strong desire for transit to and from retirement and assisted living facilities.
• Redirect truck traffic.
What Does This Mean in Practice?
• Suggestions for a bus system catering to the elderly population and car-sharing or shuttle services aimed at seniors and home-bound individuals.
• Emphasis on funding transportation initiatives that are actively utilized rather than investing in projects that might only look good on paper.
• A desire for Windsor to become an award-winning bicycle city, following the examples of nearby cities like Greeley, Fort Collins, Loveland, and Longmont.
• Calls for safe routes for various modes of transportation, especially for students walking or biking to schools, and the need for better connectivity between neighborhoods.
• Mixed sentiments regarding public transit, with some expressing support for public transportation options, while others oppose the idea of in-town bus services and suggest focusing on efficient out-of-town routes.
A-38 WINDSOR COMPREHENSIVE PLAN |
Draft Guiding Principle #6: Exceptional and memorable open space, park, recreation, and trail experiences that incorporate equitable access, wild landscapes, and a sense of discovery.
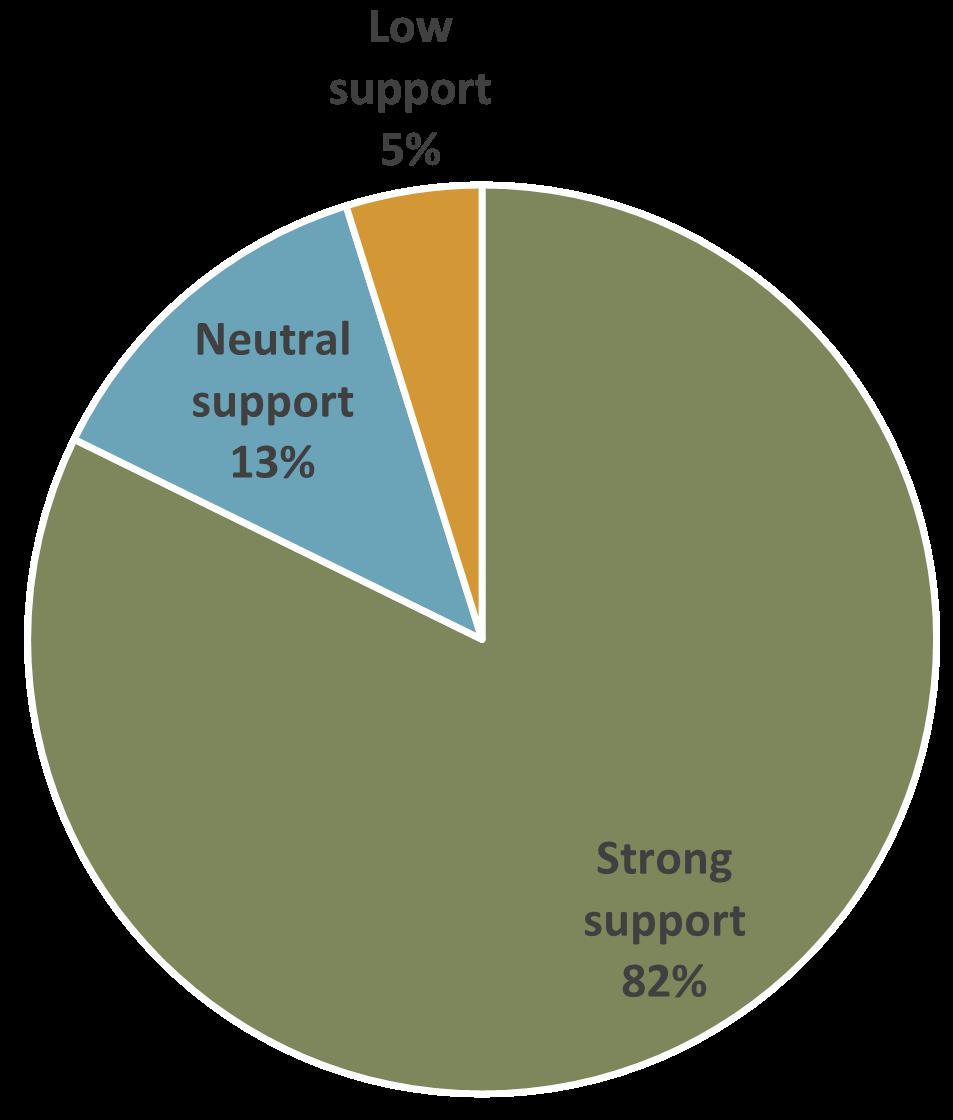
Generalized Comments for Improvement
• Not a fan of the word “equitable”
• Parks and open space are important but should not rank above affordable housing or a safe community.
• We should have distinct, unique parks that draw families to multiple areas of town.
• Surround the town with memorable open space areas.
What Does This Mean in Practice?
• Suggestions for improvements such as a downtown fountain, additional landscaping, and proximity adjustments for amenities like the dog park at Windsor Lake.
• Strong support for maintaining and expanding open spaces, with an emphasis on natural, lowimpact trails and wildlife protection.
• A call for increased walking and bike paths, connected trails, and considerations for improved accessibility between neighborhoods and neighboring towns.
• Concerns and suggestions regarding the balance between development and conservation, emphasizing the need for careful planning, maintenance, and the preservation of agricultural lands.
Draft Guiding Principle #7: Overcome water availability limitations through robust and proactive planning for water efficiency.
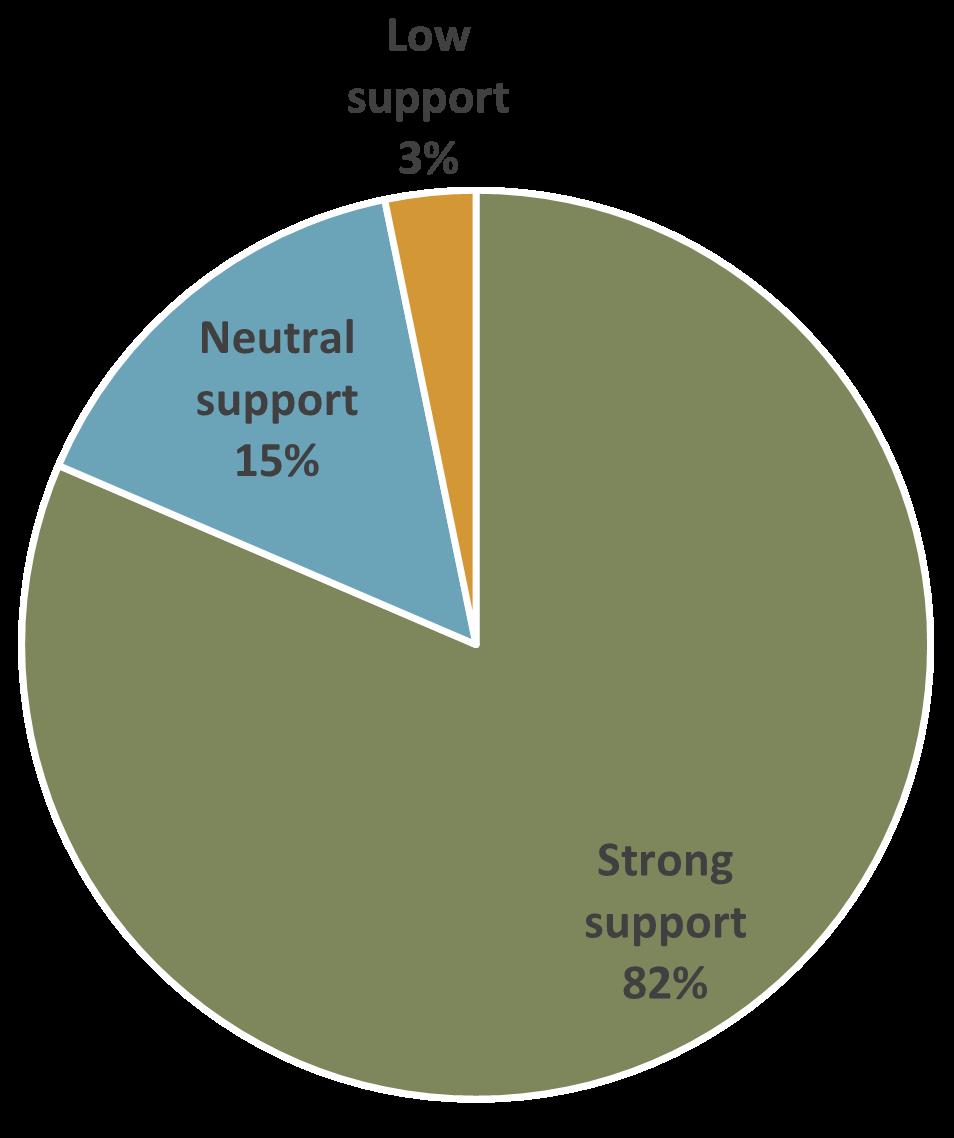
Generalized Comments for Improvement
• Water is tricky. Town’s role should be in managing water use on public land.
• Good principle, but can we quantify “robust planning”?
• Don’t know if water supply limitations can be overcome, but we can do so much more. All non-potable irrigation water would go a long way.
• Be smart and water-wise.
A-39
What Does This Mean in Practice?
• Strong emphasis on assuring a sufficient water supply for current and future growth, both residential and commercial.
• Calls for proactive and smart water management, including purchasing water rights, partnering with neighboring municipalities, and being water-wise in new developments.
• Encouragement for water conservation measures, such as xeriscaping, limiting grass areas, and incentivizing sustainable practices in landscaping.
• Concerns about managing population growth without overburdening water resources, including slowing down housing developments until infrastructure catches up.
• Suggestions for strategic planning, including the acquisition of water rights, construction of neighborhood reservoirs, and investment in water storage for the future.
Draft Guiding Principle #8: Stewardship of natural resources to ensure a healthy and thriving environment for present and future generations.
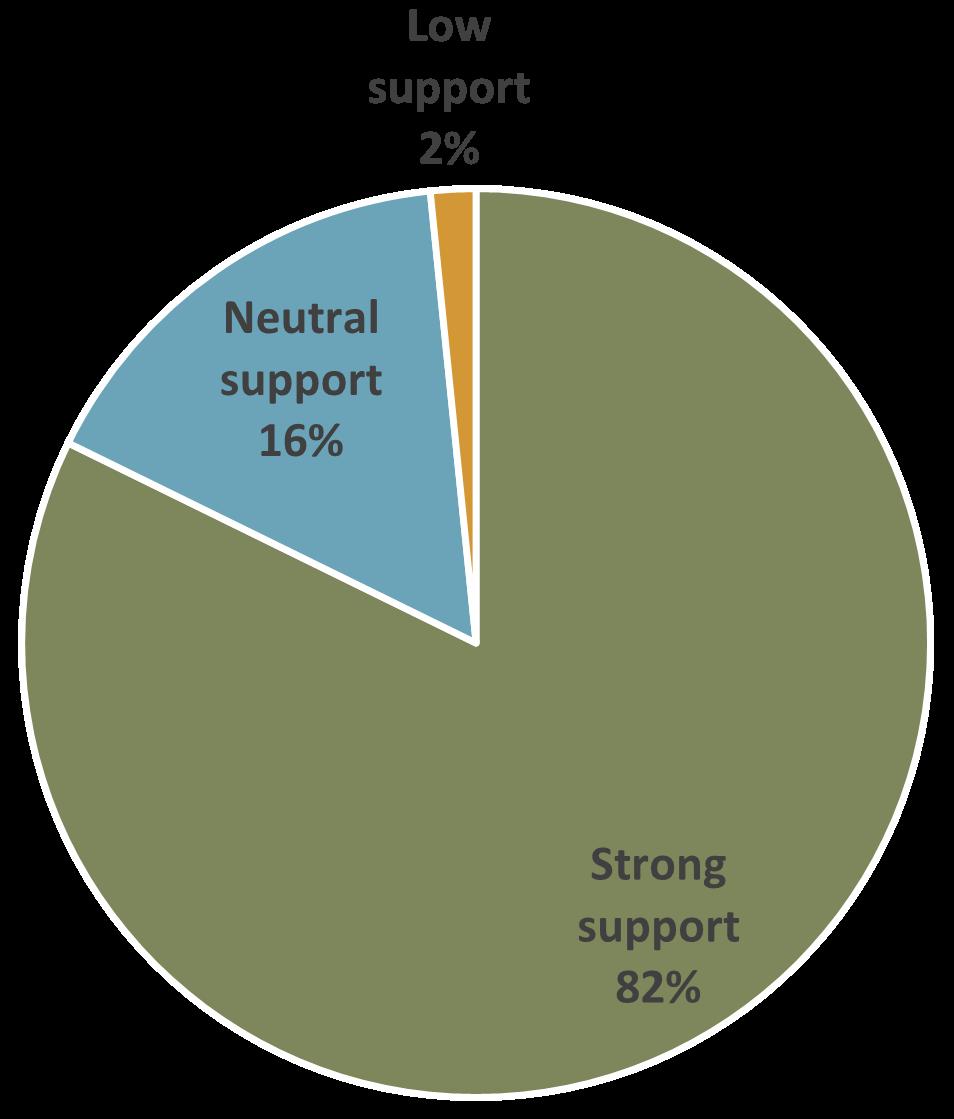
Generalized Comments for Improvement
• More environmental space is an excellent idea for people and wildlife, since so many animals get displaced due to housing development.
• Good principle, but can we quantify “healthy and thriving environment”?
• Use native species/natural habitat and best practices for weed control.
What Does This Mean in Practice?
• Strong emphasis on becoming an award-winning “Tree City” and acting wisely to preserve natural resources.
• Calls for limitations on excessive building, especially on valuable farm ground, while encouraging farming culture and job creation.
• Encouragement for community involvement in cleanup days and sponsorship by corporations. Emphasizes the importance of education regarding landscaping for the environment and pollinator gardens.
• Support for promoting clean and renewable energy, community gardens, recycling programs, and overall environmental protection.
• Emphasis on ensuring accessible areas for watchable wildlife, especially around water bodies like the Poudre River. Calls for protecting areas near natural features like floodplains and bluffs.
A-40 WINDSOR COMPREHENSIVE PLAN |
Draft Guiding Principle #9: A thriving community with access to high-quality public facilities and local services.
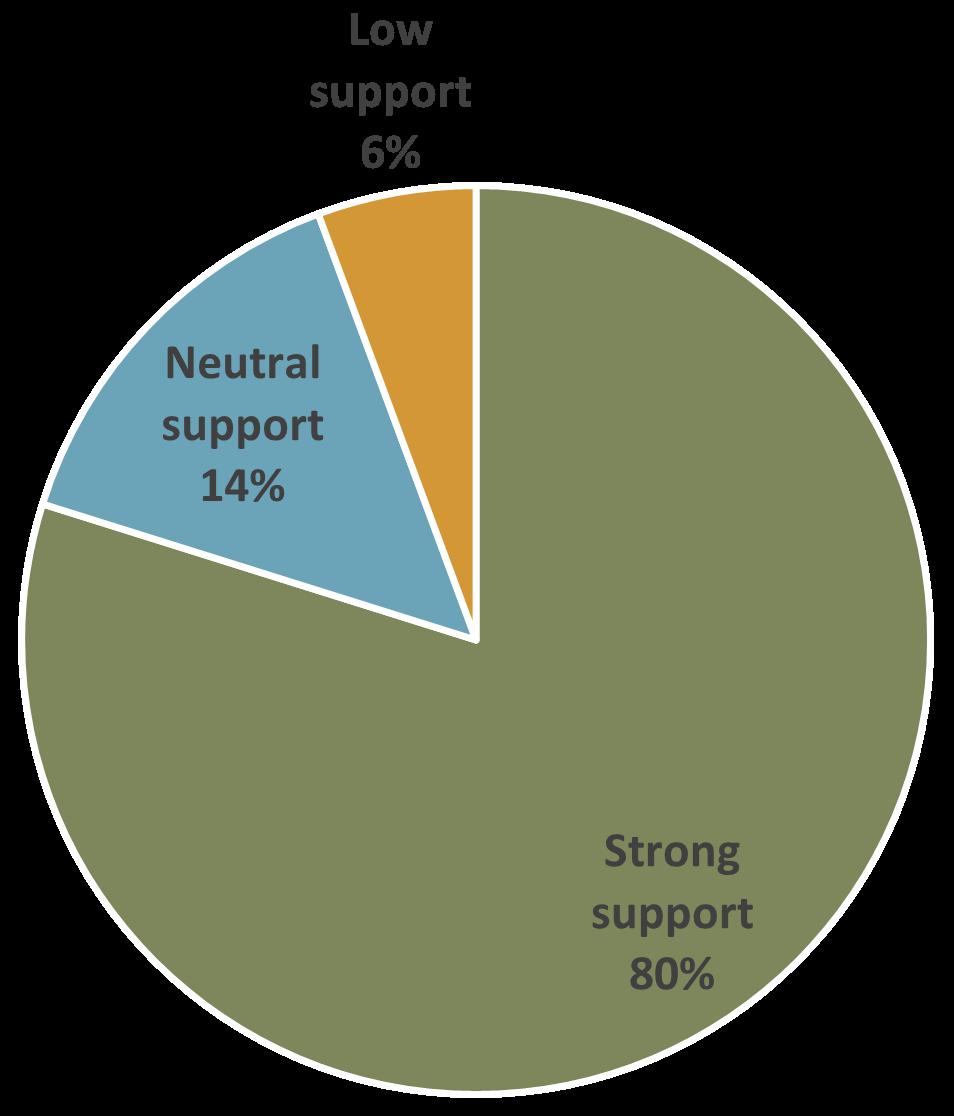
Generalized Comments for Improvement
• Don’t want low income or transient services. Maintain conservative values.
• Need to be a digitally connected community.
• Equitable access to high quality amenities and services.
• Infrastructure and services are the heart of the community.
What Does This Mean in Practice?
• Residents emphasize the need for a high-quality recreation center, library, and other facilities. Some express concerns about the crowdedness of existing facilities.
• There’s a sentiment that as Windsor grows, the Town needs to maintain and expand facilities and services to meet the needs of the increasing population. Some express the desire for a larger library and expanded recreational offerings.
• Calls for investment in emergency services (fire, police), health and wellness facilities, and town infrastructure.
• Residents stress the importance of regular updates and improvements to maintain the quality of these facilities.
• Recognition that community engagement, equitable access to amenities, and growth in public services are crucial. Some suggest specific additions like a splash pad, a second library location, and family-friendly places to reduce the need to visit neighboring cities.
Draft Guiding Principle #10: A fiscally responsible community, which focuses on prioritizing local services, amenities, and quality of life.
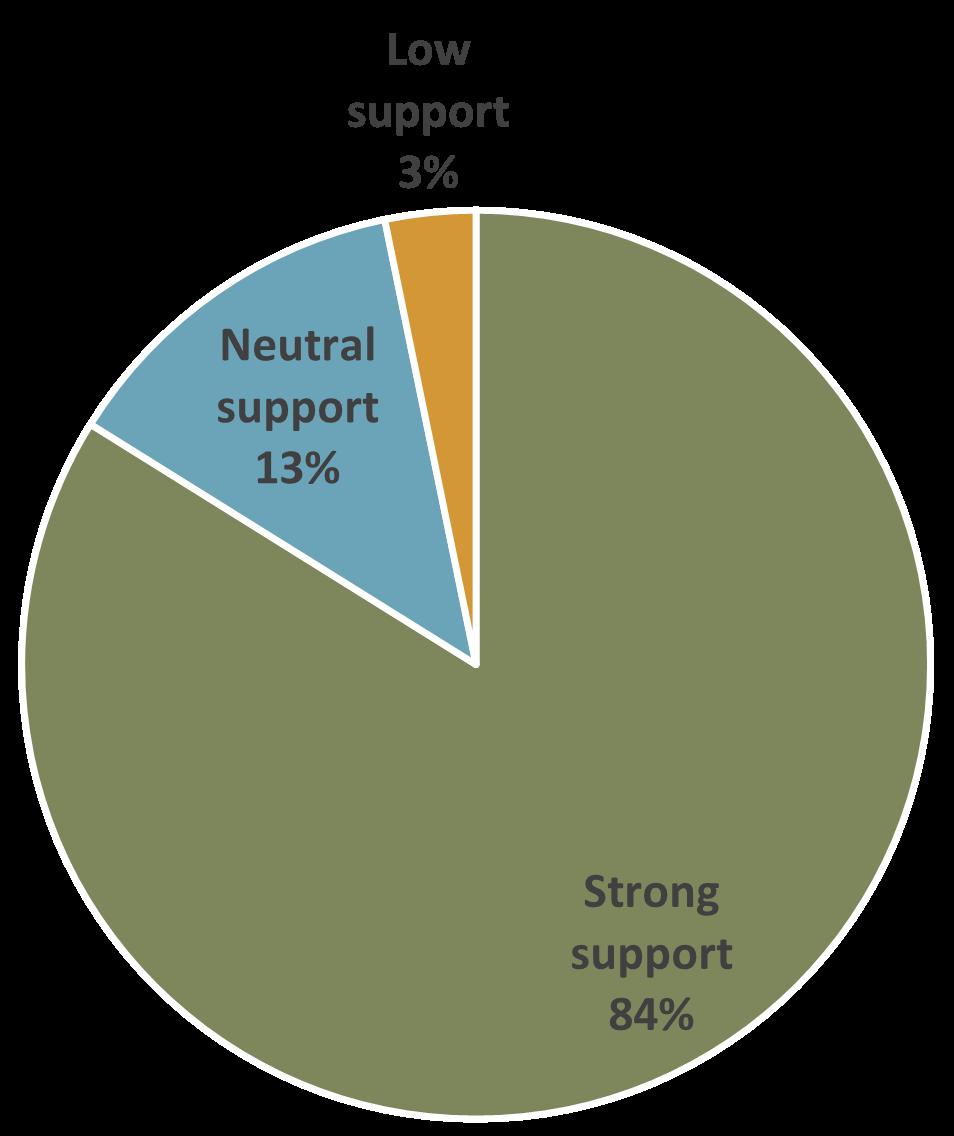
Generalized Comments for Improvement
• Eliminate growing tax burden on current residents
• Stop giving developers incentives
• Windsor is driven by developer dollars, not what benefits the town and community.
• Slow down growth and make it pay for itself.
• Be good stewards of tax dollars.
• Fiscal responsibility is an important part of the whole package.
A-41
What Does This Mean in Practice?
• Prioritize local services and promote a thriving local economy. Concerns are raised about wasteful spending and the impact on small-town values.
• Residents stress the importance of maintaining a balanced budget, good reserves, and proactive fiscal management, ensuring financial stability for the town.
• Suggestions to diversify revenue streams by promoting commercial and industrial development alongside single-family housing. Emphasis on avoiding over-reliance on residential development.
• Calls for improved transparency in spending, especially regarding the balance between public safety and recreational expenditures. Concerns raised about the allocation of resources and the need for informed decision-making.
• A desire for increased local shopping opportunities to retain dollars within Windsor. Suggestions to lower taxes by having incoming developments prepay for necessary infrastructure and services.
• Calls for prioritizing commercial development, creating strong commercial nodes, and avoiding excessive incentives to big businesses. Concerns raised about overspending and encouraging responsible development.
• Emphasis on using tax dollars to enhance the quality of life for existing residents rather than focusing solely on attracting new residents.
• Calls to prioritize current citizens, involve the community in decision-making, and avoid favoring developers over long-time residents.
• Strong opposition to bonds and mill levies, with residents expressing dissatisfaction over how tax dollars have been spent and a desire for responsible fiscal practices.
A-42 WINDSOR COMPREHENSIVE PLAN |
8. PUBLIC DRAFT EVENT
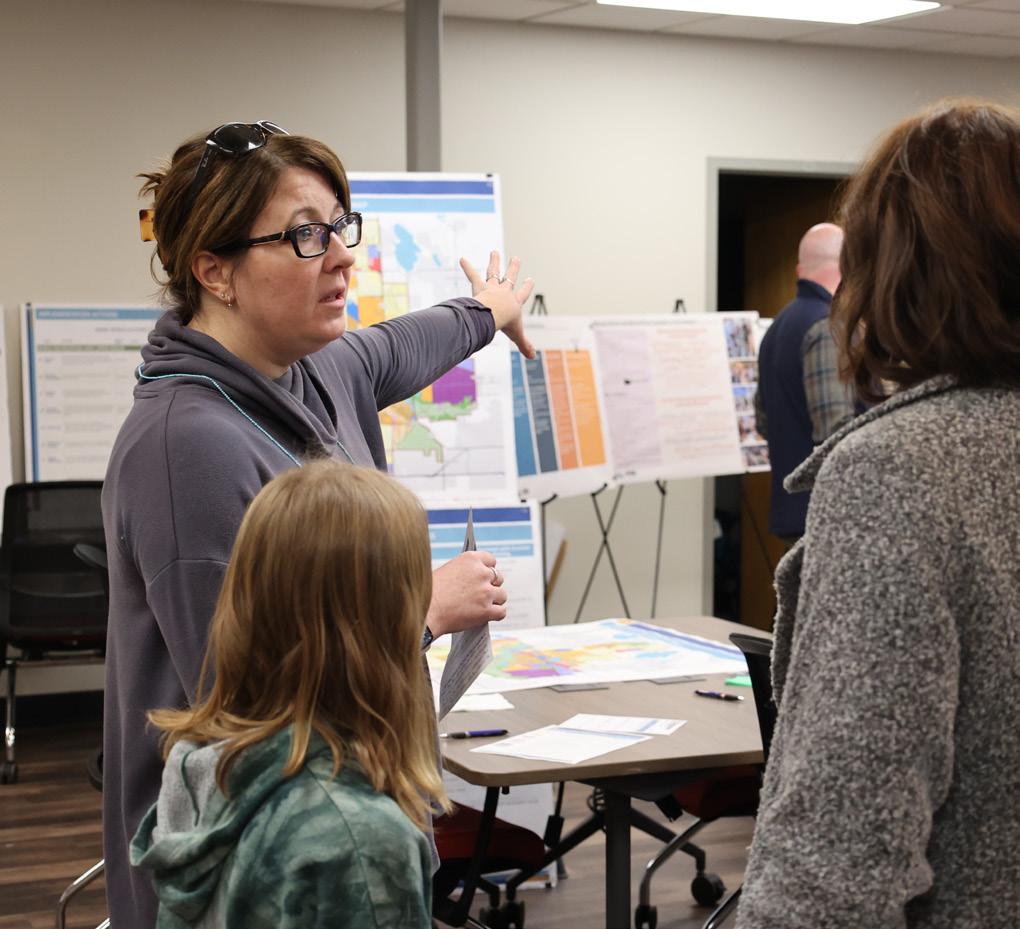
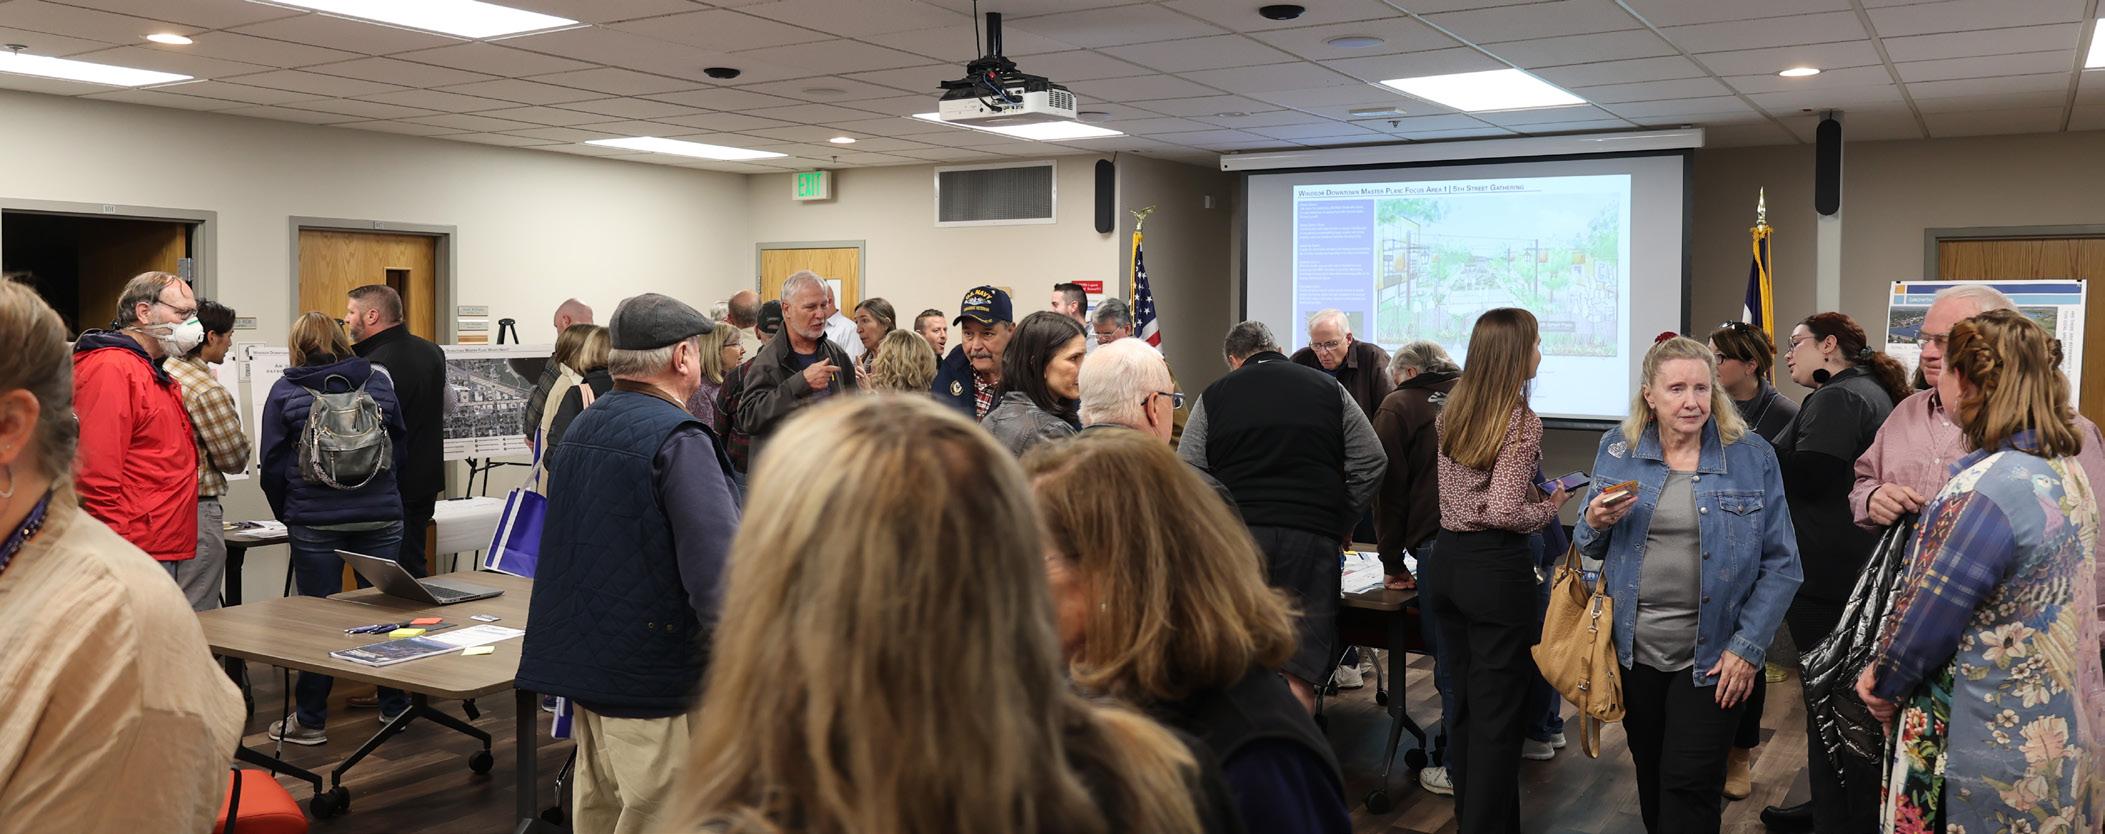
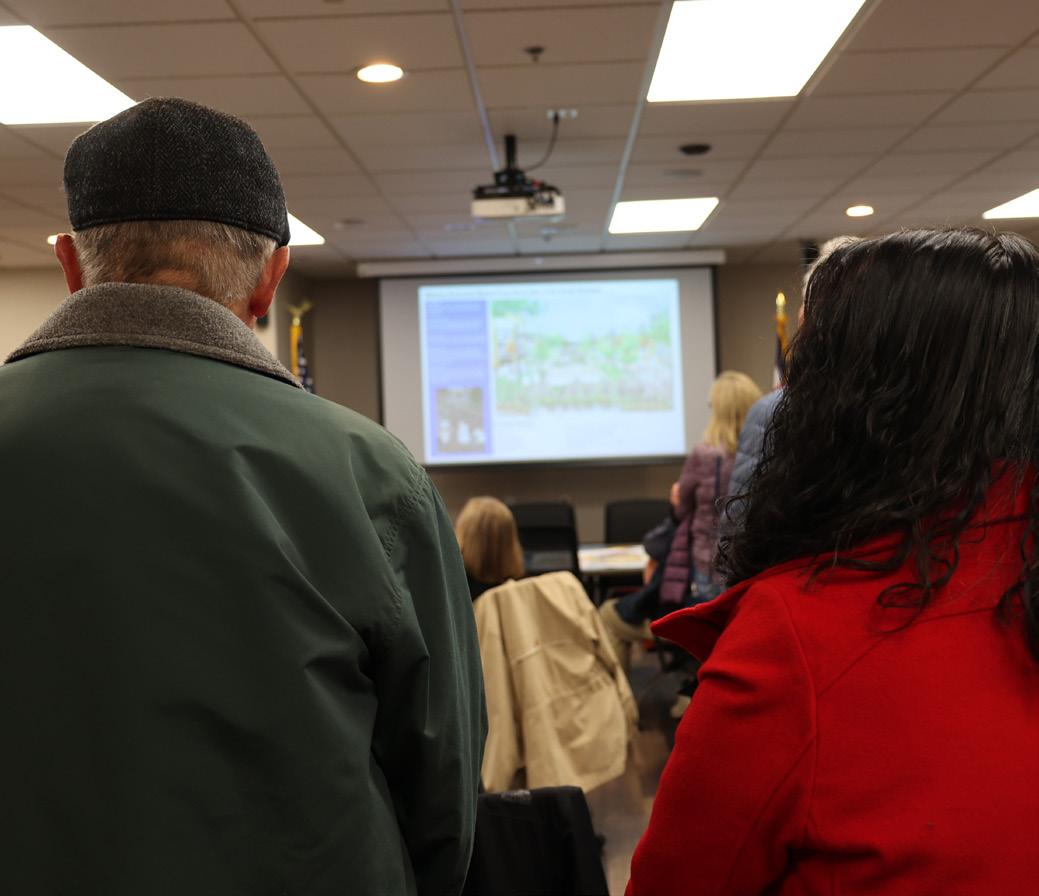
The Town of Windsor hosted a Public Open House on February 7 at Fire Station No. 1 (100 N. 7th St.) to present an overview of the Draft Windsor Comprehensive Plan and solicit community feedback. The Windsor Downtown Alliance was also in attendance to discuss their update efforts to the Downtown Master Plan. Over 100 community members attended the event and provided the following feedback on the draft.
Vision & Guiding Principles: Stewardship of natural resources was noted as an important guiding principle by several attendees.
Goals & Policies: Several community members commented on goals and policies related to housing. Several sticky note comments stated that infrastructure must be in place to accommodate more housing; Other comments expressed concern around housing in the Downtown and the Town’s capacity to accommodate more multifamily housing.
Priority Actions: Community members were asked to place stickers next to the plan actions they considered to be top priorities. The following actions were ranked highest among those who participated (received over four stickers):
#19 - Street Connections: Encourage street connections to new subdivisions to maintain the street grid where possible and improve overall connectivity between established neighborhoods.
#20 - Streetscape Improvements: Promote walkability through streetscape improvements that include high-visibility pedestrian crossings, curb bump-outs, and/ or landscaped medians on wide residential roadways.
#35 - Natural Area Buffer: Consider minimum setbacks adjacent to Natural Areas.
# of Attendees
#37 - Poudre River Trail: Continue to work with Greeley, Fort Collins, and Larimer County to finish the portion of the Poudre River Trail that is primarily off-street, and work to connect neighborhoods to the Trail.
#42 - Energy Efficiency: Consider updates to existing municipal buildings through higher efficiency building lighting, restoration of native vegetation, and installation of low-flow water fixtures.
A-43
100+
Need more sidewalks.
Zoning needs to be looked at.
Connect all neighborhoods to trail systems.
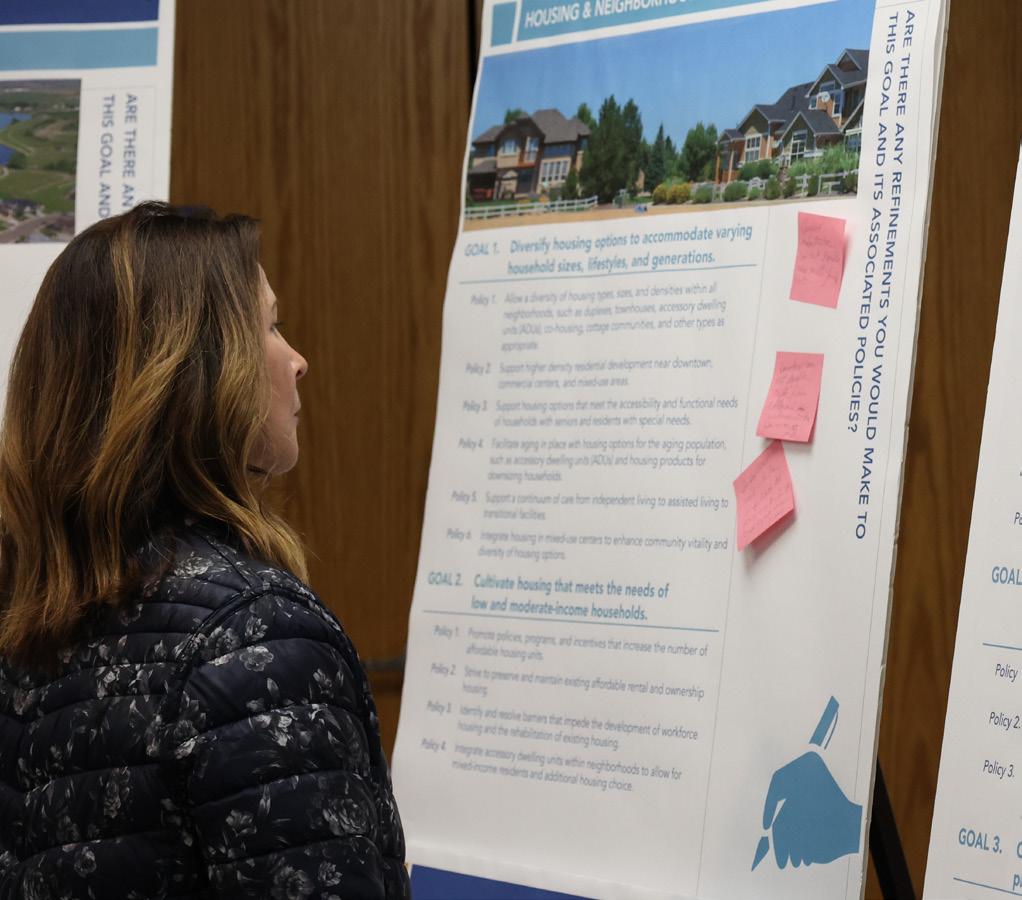
Infrastructure needs to be in place before more housing is built.
Increase percent parks and open space.
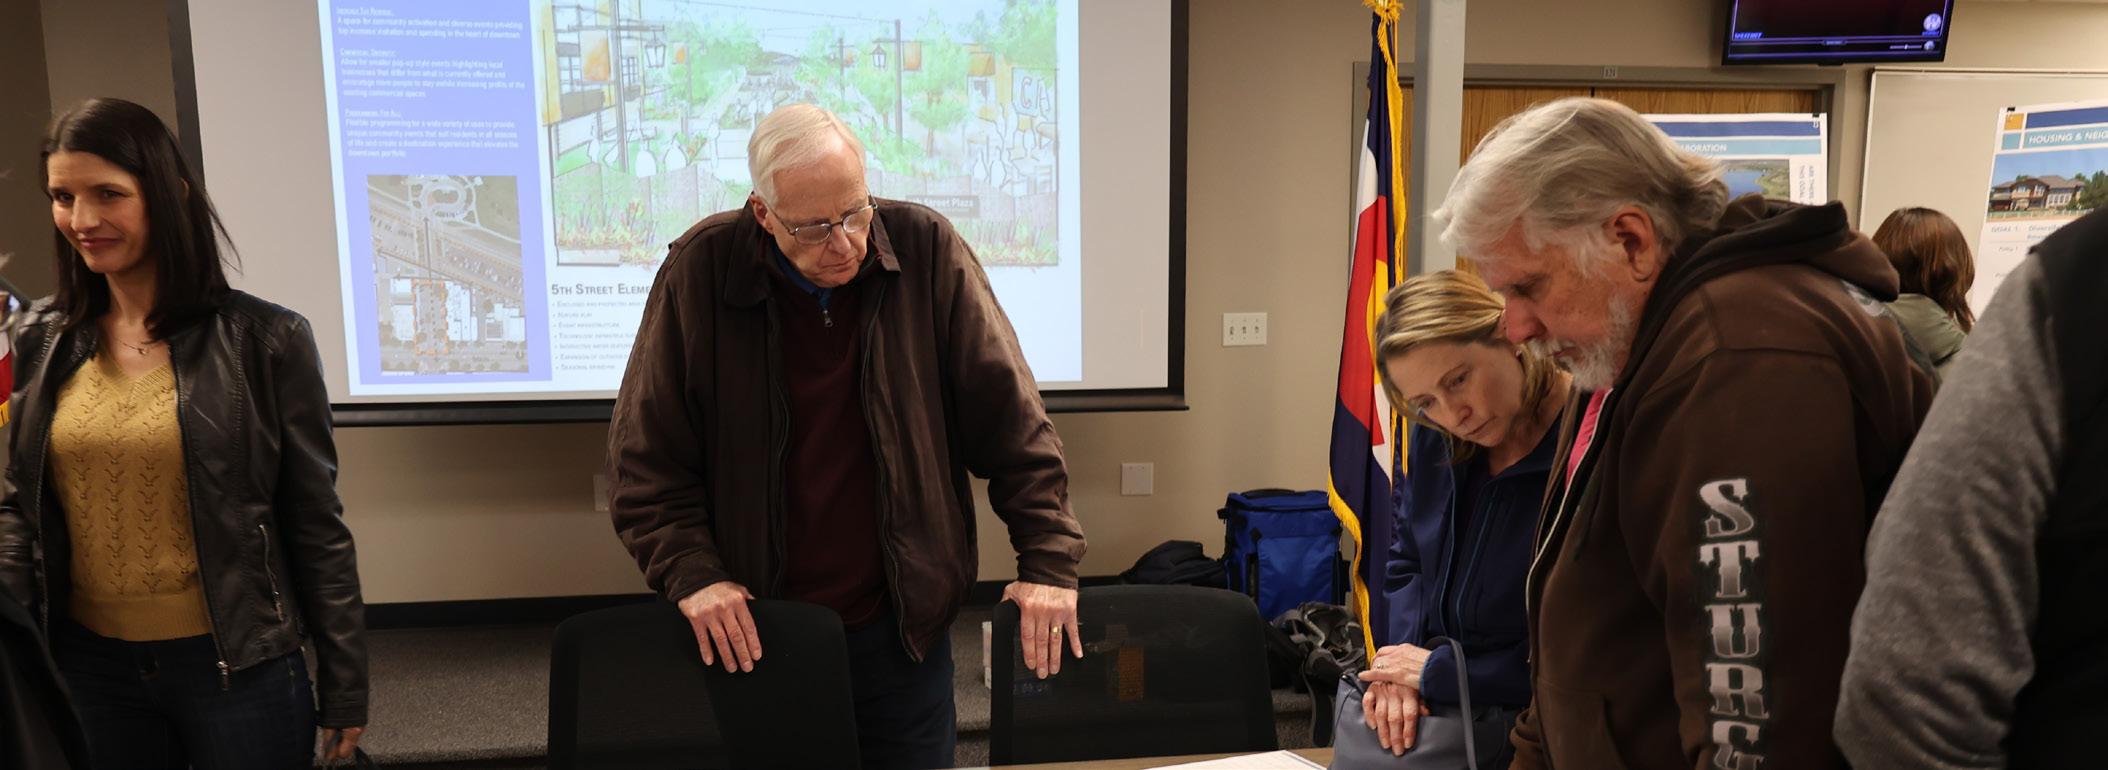
Sticky note comments made by attendees are highlighted above.
A-44 WINDSOR COMPREHENSIVE PLAN |
APPENDIX D.
September 2023
A-45
EXISTING CONDITIONS REPORT WINDSOR COMPREHENSIVE PLAN
CONDITIONS
EXISTING
REPORT
A-46 WINDSOR COMPREHENSIVE PLAN | Existing Conditions Report | Page 2 Contents Executive Summary ........................................................................................................... 4 Where is Windsor Today? 4 1. Community Context ...................................................................................................... 6 Overview 6 2. Housing ......................................................................................................................... 9 Overview ................................................................................................................................................... 9 Current Plans and Policies 9 Community Perception ........................................................................................................................... 10 Current Conditions and Trends 10 Advancing Opportunities through Windsor’s Comprehensive Plan ....................................................... 23 3. Economy ...................................................................................................................... 24 Overview 24 Current Plans and Policies ....................................................................................................................... 24 Community Perception 24 Current Conditions and Trends ............................................................................................................... 24 Future Outlook ........................................................................................................................................ 33 Advancing Opportunities through Windsor’s Comprehensive Plan 41 4. Land Use and Community Character ........................................................................... 42 Overview 42 Current Plans and Policies ....................................................................................................................... 42 Community Perception 42 Current Conditions and Trends ............................................................................................................... 42 Advancing Opportunities through Windsor’s Comprehensive Plan ....................................................... 49 5. Transportation ............................................................................................................. 50 Overview ................................................................................................................................................. 50 Current Plans and Policies 50 Community Perceptions .......................................................................................................................... 51 Current Conditions and Trends ............................................................................................................... 51 Advancing Opportunities through Windsor’s Comprehensive Plan 55 6. Water Efficiency .......................................................................................................... 58 Overview 58 Current Policies and Plans in Place .......................................................................................................... 58

A-47 Existing Conditions Report | Page 3 Community Perceptions .......................................................................................................................... 58 Current Conditions and Trends 59 Advancing Opportunities through Windsor’s Comprehensive Plan ....................................................... 63 7. Infrastructure Systems ................................................................................................. 65 Overview ................................................................................................................................................. 65 Current Plans and Policies ....................................................................................................................... 65 Community Perceptions 65 Current Conditions and Trends ............................................................................................................... 65 Advancing Opportunities through Windsor’s Comprehensive Plan 68
EXECUTIVE SUMMARY
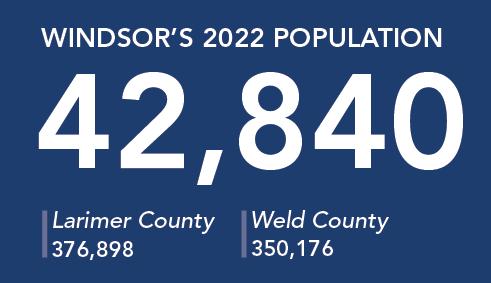
The Town of Windsor is updating its 2016 Comprehensive Plan to guide the day-to-day decisions of the Town more accurately and holistically into the future. Since adoption of the 2016 Comprehensive Plan, Windsor has seen its population increase dramatically from 25,687 to over 40,000 residents today. This extraordinary growth was more than triple that of the growth projected in the 2016 Plan. The Town is using this update to strategically plan for growth in a manner that reflects the desires of the community and coordinates future growth and a full range of urban services, while maintaining the cherished smalltown character.
A key part of this process is to have an accurate community profile that illustrates where the community is today as well as the opportunities that may exist moving forward. Using the most recent available data from the Town of Windsor, Larimer and Weld Counties, the US Census, and other reliable sources, a series of “community profile snapshots” was developed to present an overview of existing conditions.
Community Profile Snapshots:
1. Community Context
2. Housing
3. Economy
4. Land Use and Community Character
5. Transportation
6. Water Efficiency
7. Infrastructure Systems
Where is Windsor Today?
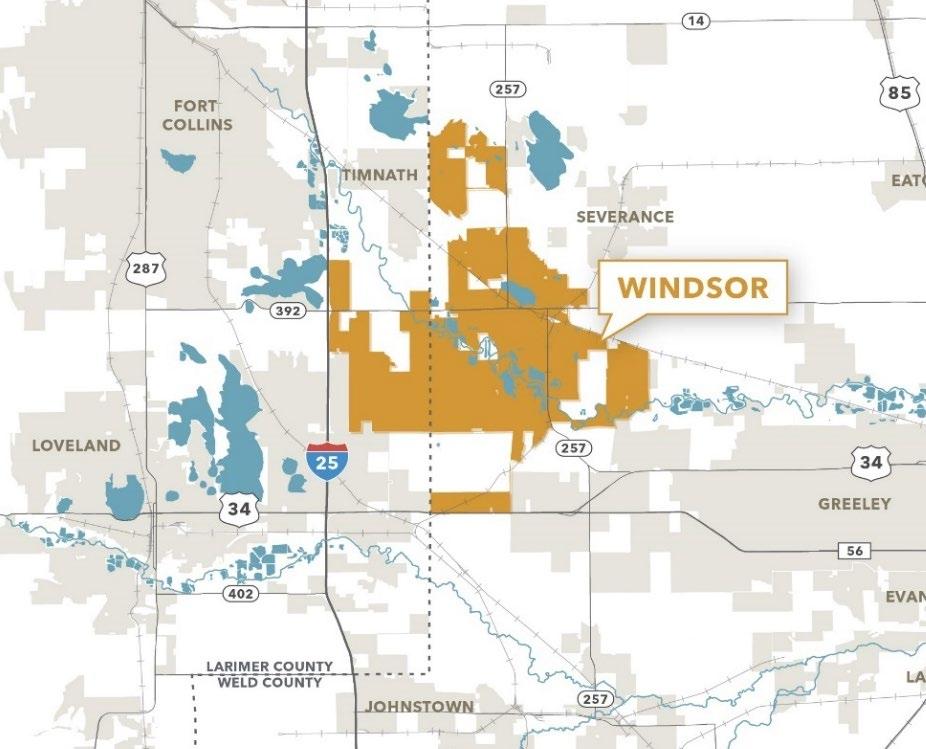
The Town of Windsor is located on the I-25 corridor in Northern Colorado’s Front Range. The Town extends across both Larimer and Weld counties and is surrounded by the communities of Timnath, Severance, Fort Collins, Loveland, and Greeley. Windsor’s population had steadily grown in the last decade, with significant growth occurring between 2015 and 2023
Windsor’s rapid growth has transformed the 19th century agricultural and railroad town into a largely suburban community, anchored by the historic downtown and industrial land uses.
Windsor is one of the newer housing markets in the region, with over 65% of homes built after 2000. The Town also has a larger share of single-family housing units than its neighbors but more multifamily units than the smaller towns in the region. As Windsor grows and demand for housing increases, market demand will drive
A-48 WINDSOR COMPREHENSIVE PLAN | Existing Conditions Report | Page 4
prices higher. Homeownership may become less attainable, and more types of housing will be needed to fill in housing gaps.
Land use in Windsor is primarily residential and industrial, with room for growth in both areas. Almost 2,000 acres of undeveloped industrial land remain in the Town, along with 4,400 acres of residential land. As Windsor considers its future growth patterns and land use designations, the Town should make decisions that support and celebrate community goals, centering future character areas around a unified and vibrant downtown.
Approximately 20% of the Town’s jobs are in manufacturing, however less than 10% of the population lives and works in Windsor. Most residents commute outside of Windsor for work, and a high percentage of local jobs are held by people commuting into Windsor. Significantly, a quarter of the population works from home, which strengthens the demand for service businesses during the day.
While Windsor has been experiencing rapid residential growth, industry and jobs have largely remained outside of the Town, resulting in high rates of out commuting. Future growth in Windsor is promising, diversifying and strengthening the Town’s economy, including retail, industrial, and office. This diversification will help community members live and work in the same place, reducing commuting rates and supporting Windsor’s identity.
Transportation in Windsor is closely tied to its economic growth and land use decisions. Windsor residents commute farther than surrounding communities for work, and most drive alone. While there are extensive trails and a few on-street bicycle lanes, Windsor’s walk and bike scores (walkscore.com) indicate that the Town is car-dependent and lacks infrastructure to support biking and walking. There is a dedicated commuter bus line between Fort Collins and Greeley, with stops in Windsor
Windsor has maintained a proactive stance toward water planning by securing additional water sources for future growth through the Northern Integrated Supply Project (NISP), implementing water efficient practices, and incentivizing the community to monitor their own water use. As growth on the Front Range challenges water resources, Windsor has demonstrated its ability to plan ahead and adapt to new conditions through partnerships and community-driven programs such as its Garden-in-a-Box program, aimed at increasing the use of low-water and native plants.
Windsor has a robust infrastructure system consisting of water, sewer, stormwater, and roads, all supported by either dedicated or general funds. Spatially, the Town’s infrastructure is spread out, resulting in higher infrastructure costs. Land use decisions will play an important part in future infrastructure challenges or solutions as future development requires more connections to public services. Windsor has the opportunity to concentrate development in appropriate areas, reducing overall construction and maintenance costs and increasing efficiency and sustainability of the system as a whole.
A-49 Existing Conditions Report | Page 5
1. COMMUNITY CONTEXT
Overview
The Town of Windsor is located in the Northern Colorado Front Range Region and Town boundaries extend across both Larimer and Weld counties. Surrounding communities include Timnath and Severance to the north, Fort Collins to the northwest, Loveland and Johnstown to the southwest, and Greeley to the southeast. Located on the I-25 corridor, Windsor sits approximately 56 miles north of Denver and approximately 15 miles southeast of Fort Collins.
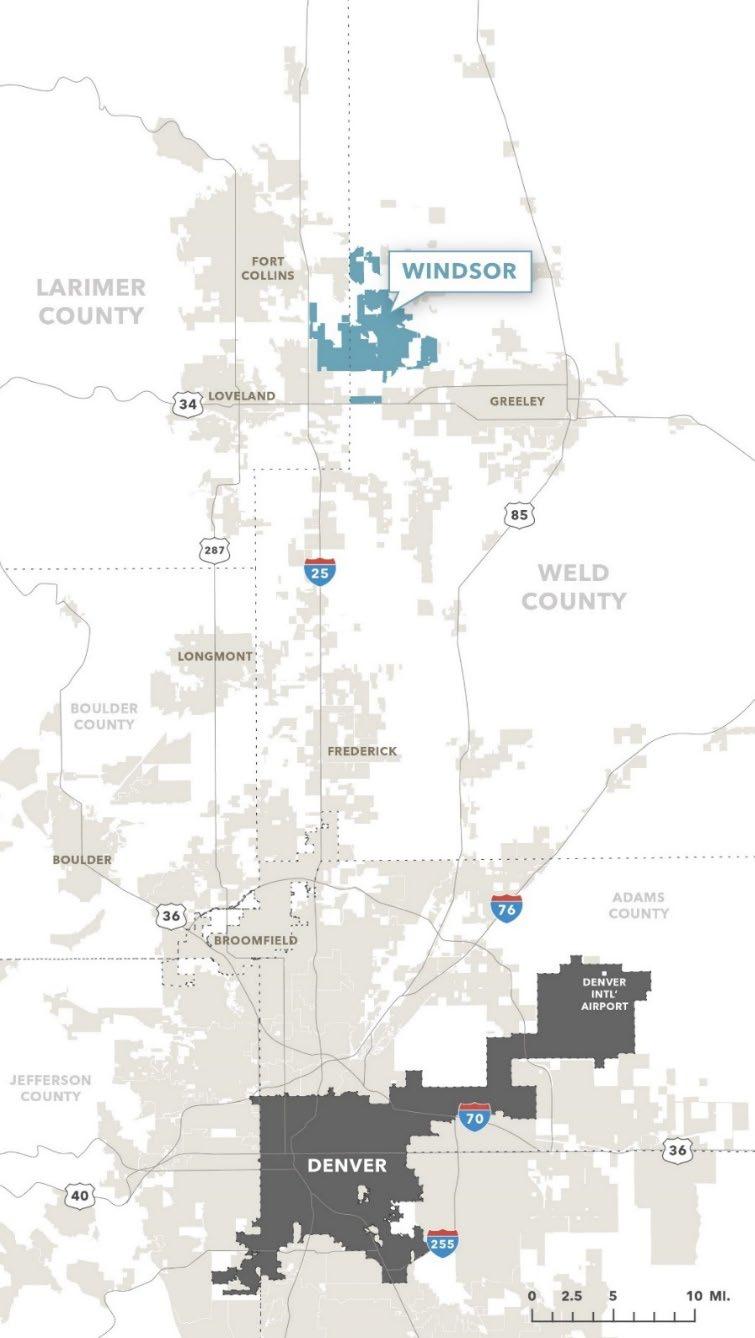
A-50 WINDSOR COMPREHENSIVE PLAN | Existing Conditions Report | Page 6
Population
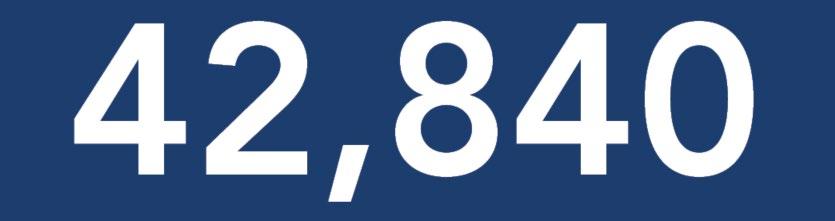
Windsor’s population has steadily grown in the last decade, with significant growth occurring between 2015 and 2022. Windsor’s 2022 population was 42,840. The 2016 Comprehensive Plan projected the Town to have a total population of 25,693 by 2020, as indicated by the dashed white line in the figure below. In reality, Windsor grew much faster at a growth rate more than triple that projected under the 2016 Plan.
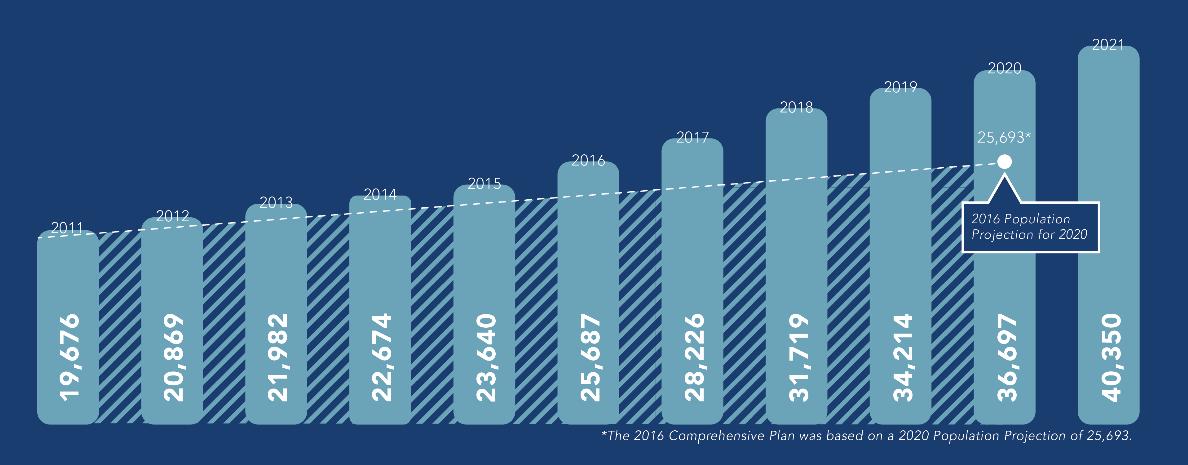
Population projections vary depending on the source but range from 61,206 reflecting low growth up to 89,389 as a high growth projection for year 2041. The 61,206 projection was produced by TischlerBise based on historic trends before the record high rate of building permits from the past five years. The 89,389 projection represents the Town’s high-end growth rate, derived from the Colorado State Demographer’s Office. Details on population projections can be found in the Economy section of this report.
Age
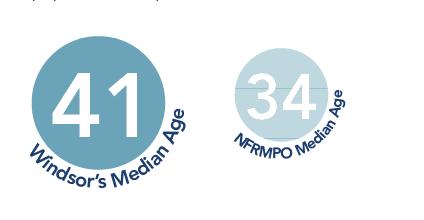
Windsor has a large population of families and an increasing number of retirees. The area within the NFRMPO has a lower median age than Windsor by nearly 5 years, which accounts for the region’s larger “Young Adult” population compared to Windsor’s. This younger population can be attributed to the university presence in both Greeley and Fort Collins.
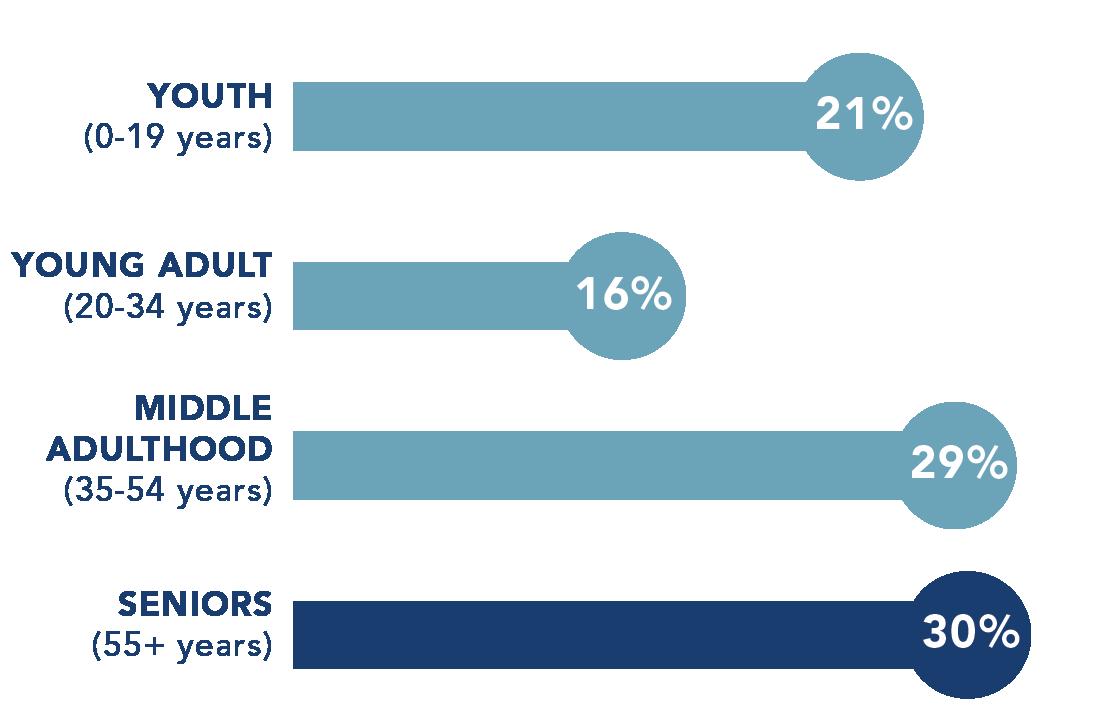
A-51 Existing Conditions Report | Page 7
Race and Ethnicity
Historically, Windsor has been a primarily white/Caucasian community. Recent trends from the U.S. Census show an increase in diversity, especially among multiracial residents. Compared to the rest of the North Front Range, Windsor has proportional race distributions but does measure nearly ten percentage points higher for white populations than the rest of the region. 9% of Windsor residents identify as Hispanic compared to 19% of residents across the North Front Range, according to 2020 Census data.
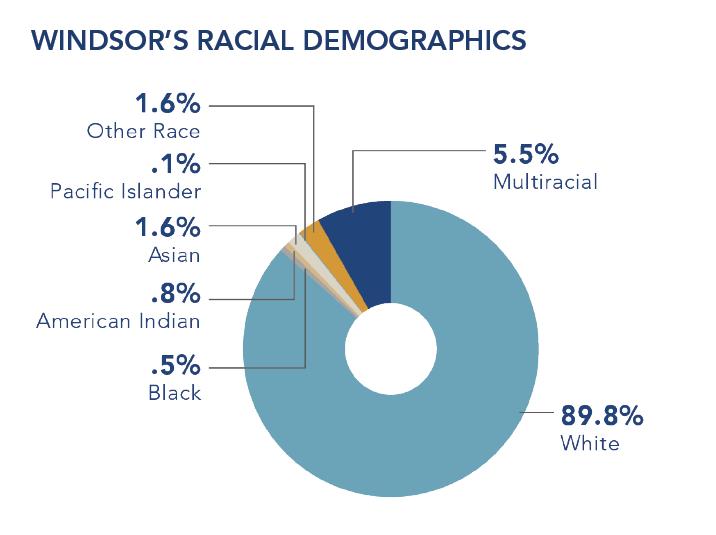
Source: ESRI Business Analyst and US Census Bureau, 2022
Educational Attainment
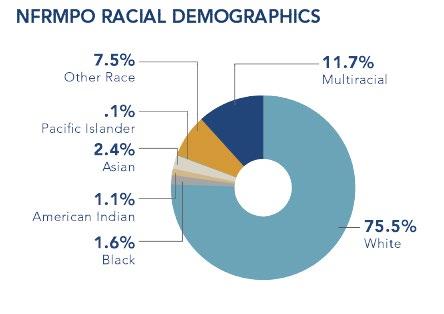
The population of Windsor is highly educated, with 97% having a high school diploma, and half having a bachelor’s degree. There are many educational opportunities in the region to support educational attainment, from smaller community colleges including Aims to larger universities like Colorado State University in Fort Collins.
Income
Incomes in Windsor are higher than the rest of the NFRMPO area. Windsor’s median household income was $111,477 in 2023, based on Town data, with the region’s median income approximately 40% lower. Windsor’s average household income was 132,933 in 2023.
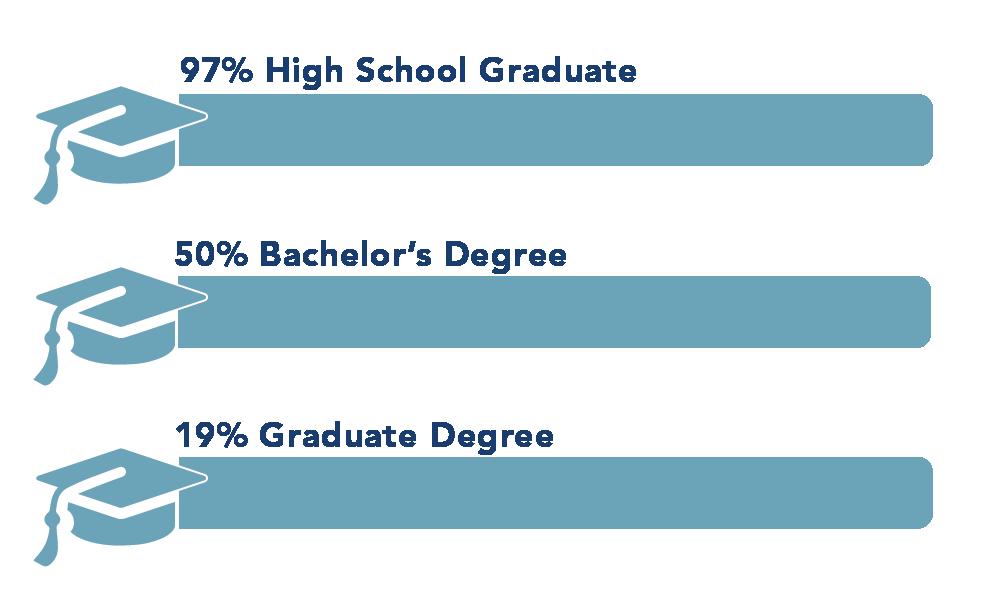
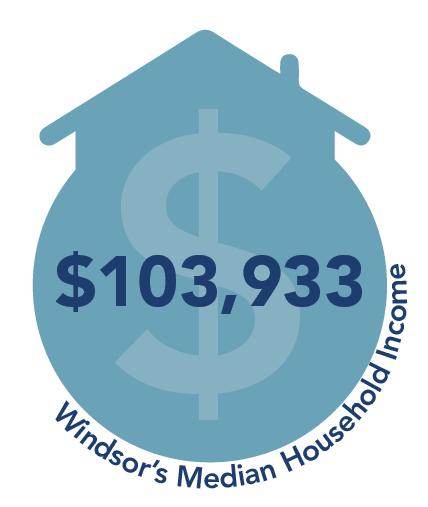
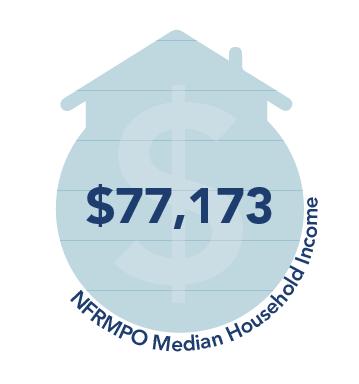
A-52 WINDSOR COMPREHENSIVE PLAN | Existing Conditions Report | Page 8
2. HOUSING Overview
This chapter provides an overview of housing and economic conditions and trends in the Town of Windsor. Where appropriate, comparisons to other jurisdictions in the region are included. Comparison communities are the two counties in which Windsor is located Larimer and Weld, as well as the cities of Fort Collins, Greeley, Loveland, and Evans and the towns of Severance and Timnath. A summary of population estimates and recent growth for comparison localities is shown in Figure 1.
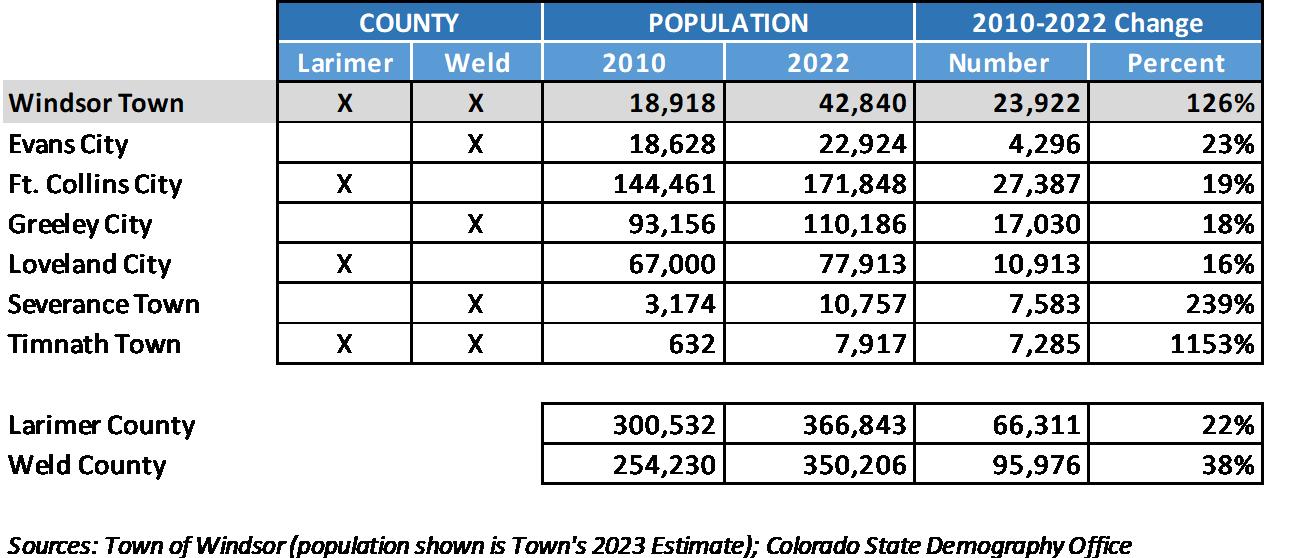
Current Plans and Policies
The 2016 Comprehensive Plan, specifically Chapter 5c: Residential Areas Framework Plan, sets a vision for a future Windsor that has a “diverse housing supply,” and includes a “range of housing types from spacious single-family homes, to cozy small lot houses, to apartments and condominiums that cater to a range of incomes and family sizes.” Since the adoption of the 2016 plan, Windsor has been increasing its multi-family housing stock. Other related housing objectives identified in the 2016 Comprehensive Plan are listed below:
1. Promote multi-modal connectivity to increase neighborhood access and resident mobility.
2. Utilize conservation design and traditional neighborhood design for new residential growth areas and promote overall community livability.
3. Increase the number of affordable housing units that provide opportunities for working families and seniors.
4. Foster a diversity of housing types and sizes through coordinated land use planning and zoning.
5. Support high density residential development near Downtown, commercial centers, and mixeduse nodes.
6. Utilize cluster housing development and conservation design to conserve natural resources, particularly in proximity to the Poudre River and bluffs.
A-53 Existing Conditions Report | Page 9
Figure 1. Population Trends by Jurisdiction
7. Maintain the character of existing residential neighborhoods and make investments that leverage their distinctiveness from newer parts of Town.
8. Discourage the use of dense residential developments as a buffer to industrial areas.
9. Foster a unified identity for Windsor’s residential areas.
In 2015, the Town commissioned a Demographic and Housing Opportunities Study to understand the community’s changing housing needs. The study identified that residents valued neighborhoods, safety, access, and amenities more than building characteristics. In addition, the study revealed that the current zoning and development incentives may not be supporting the community’s growing range of housing needs.
Community Perception
Housing has been an important discussion topic during the Comprehensive Plan update process. Community members hold varied perspectives related to Windsor’s growth and how the Town can meet the housing needs of a wide range of ages, incomes, and family sizes. In particular, the Housing Authority noted a lack of senior housing and the high cost of building new housing as two significant challenges in Windsor. Furthermore, the idea of balancing high-end housing development with more affordable options was expressed during multiple community interviews and echoed in questionnaire responses.
Many community members expressed concerns about Windsor growing too much and the associated risks of losing the Town’s charm and small-town feel. Others highlighted concerns that their children will not be able to afford homes in the community given the high cost of housing. According to questionnaire responses, many community members support the idea of inclusionary zoning, or requiring a certain percentage of affordable housing in all new development. Community members also believe housing in Windsor should be more sustainable, especially related to water usage
Current Conditions and Trends
Housing Unit Types
Housing stock in the Town of Windsor is predominantly single family detached units.
Windsor has a larger share of single-family units than its neighbors but more multifamily units than the smaller towns in the region. Windsor has a higher share of multifamily units than the smaller towns of Severance and Timnath but a lower share than each county and nearby cities in the region.
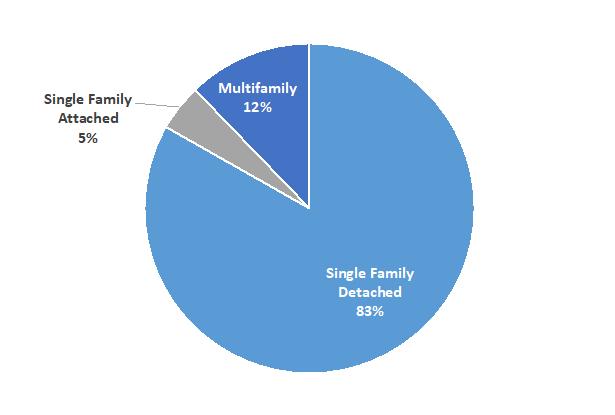
Source: U.S. Census, 2022 American Community Survey 5-Year Estimates

A-54 WINDSOR COMPREHENSIVE PLAN | Existing Conditions Report | Page 10
Figure 2. Town of Windsor Housing Units by Type (2022)
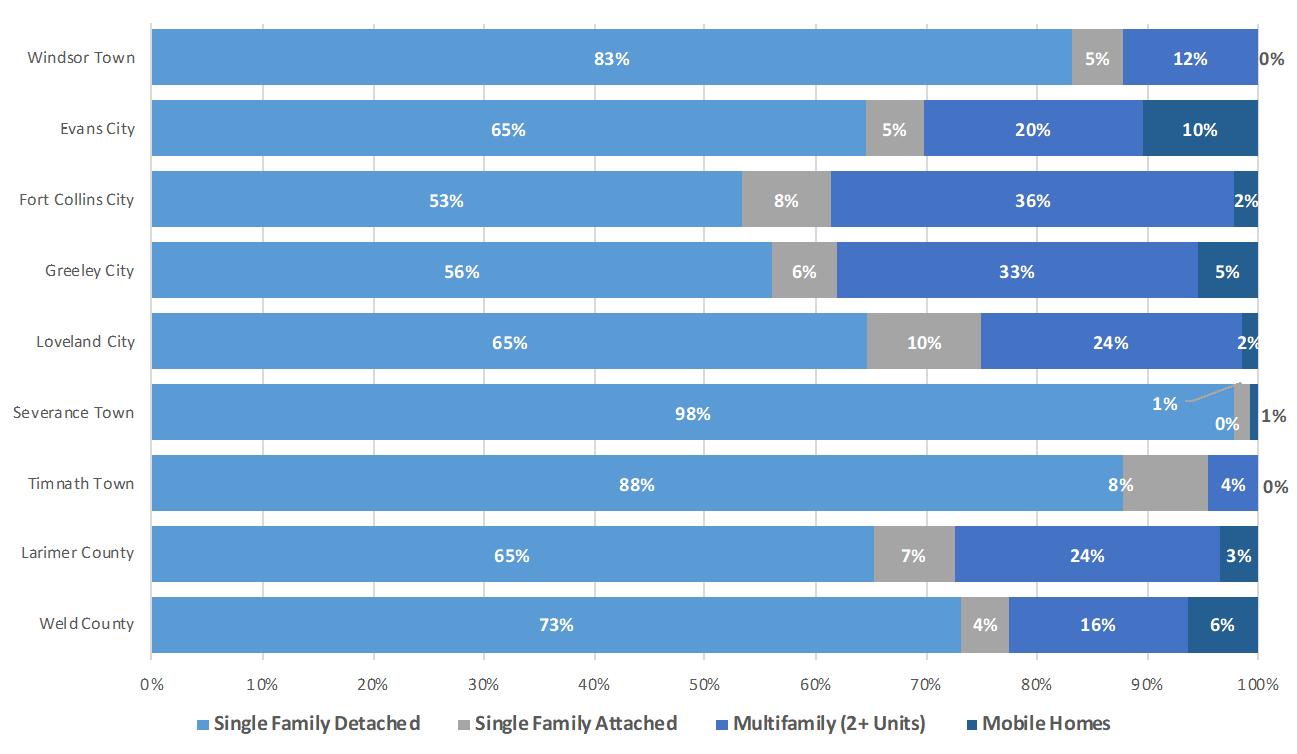
Source: U.S. Census, 2022 American Community Survey 5-Year Estimates
Recent development activity has increased the number of multifamily units in Windsor. It should be noted that the Town’s multifamily category includes townhouse/single-family attached units.
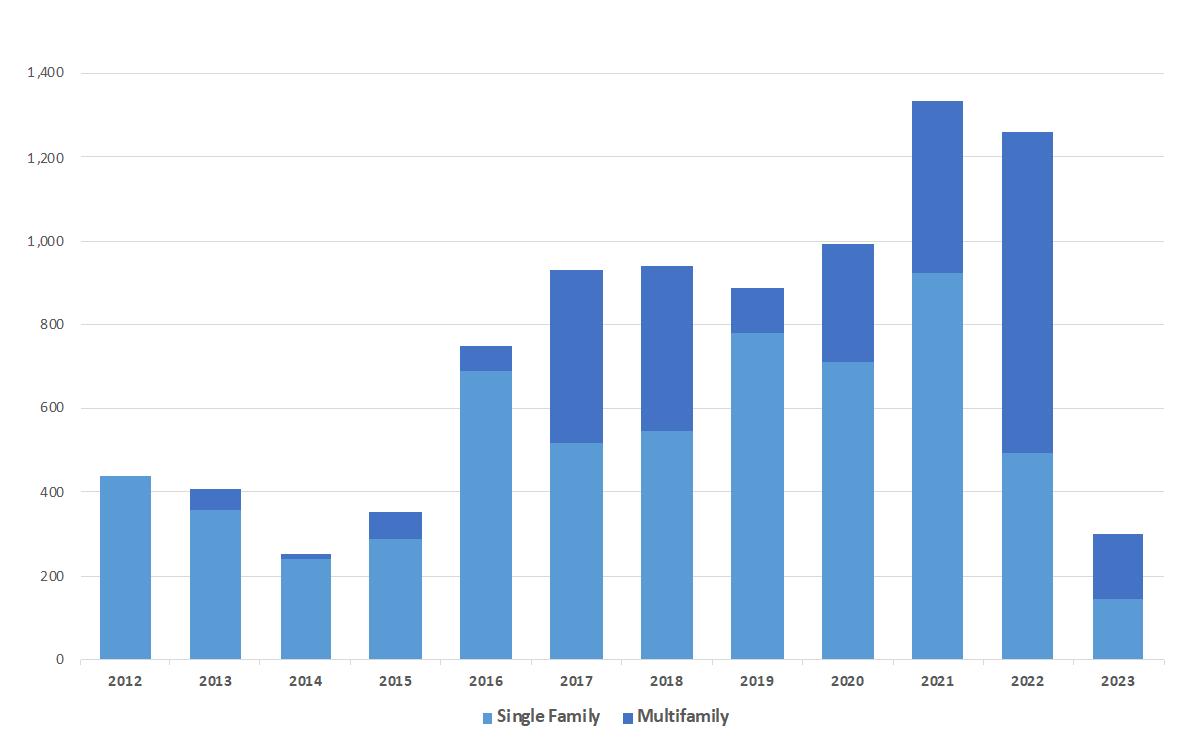
A-55 Existing Conditions Report | Page 11
Figure 3. Housing Units by Type by Jurisdiction, 2022
Figure 4. Town of Windsor New Housing Unit Permits by Type
Note per Town of Windsor Building Permit Report: Multifamily is defined as duplexes, triplexes, fourplexes, fiveplexes, sixplexes, apartments, and condominiums.
Source: Town of Windsor, Building Permit Reports.
Development activity appears to be slowing in the Town as shown in building permit figures for 2023 Recent projects that developed more quickly than anticipated are becoming built out and upcoming development is anticipated to be built at a slower pace than recent activity. Other external factors such as water availability, interest rates, and economic conditions will have a direct effect on development activity and growth in the Town.
Housing Characteristics
Approximately 80 percent of Windsor housing units have 3 or more bedrooms, which is less than the other towns in the region but higher than the cities and Weld and Larimer counties.
It is interesting to note that the share of 3- and 4-bedroom units are relatively similar among the comparison localities, but what differs is the share of units with 5 or more bedrooms (Timnath, Severance, Windsor) compared to those places with a higher share of units with 2 bedrooms or less (Weld and Larimer counties and the cities of Evans, Loveland, Greeley, and Fort Collins). 1
Figure 5. Housing Units by Bedroom Count by Jurisdiction, 2022
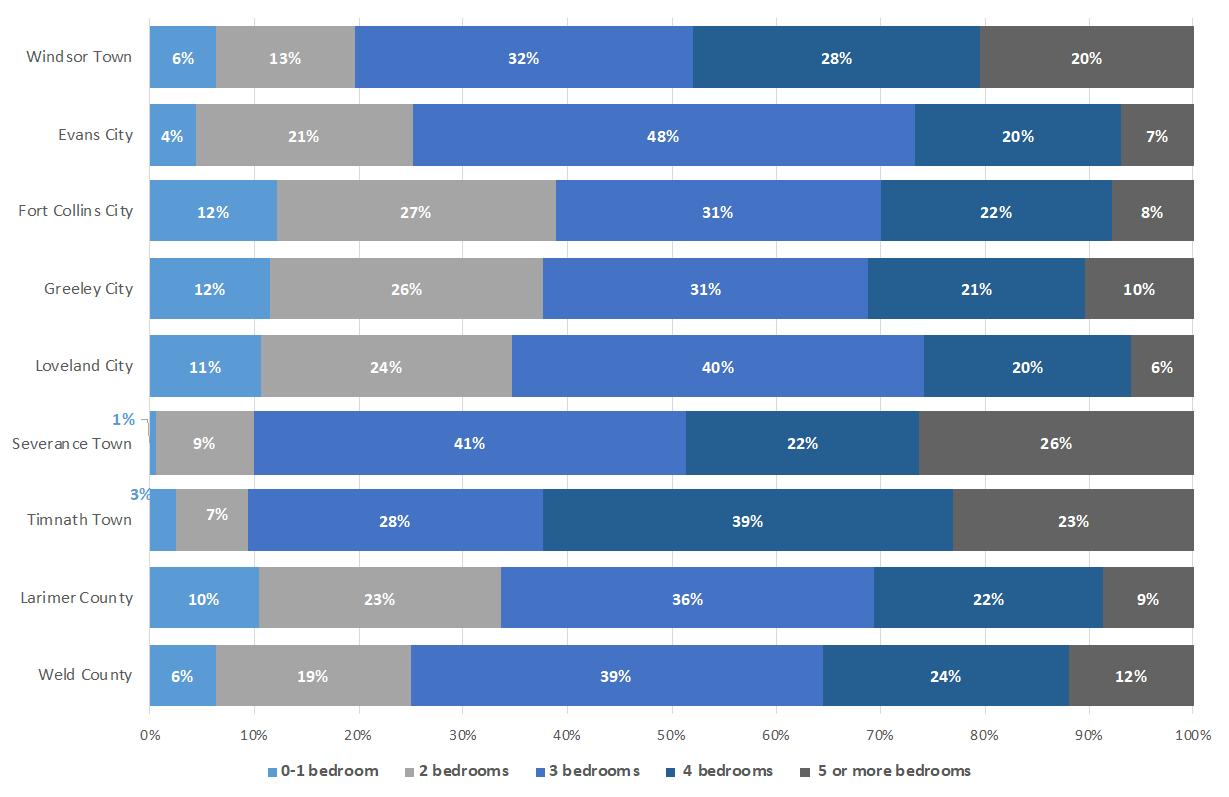
Source: U.S. Census, 2022 American Community Survey 5-Year Estimates
1 It is noted that the relatively small size of Timnath and Severance compared to other regional jurisdictions leads to a greater relative impact when comparing percentages among localities.
A-56 WINDSOR COMPREHENSIVE PLAN | Existing Conditions Report | Page 12
Windsor is one of the newer housing markets in the region. Approximately 65 percent of Windsor’s housing stock was built after 2000, which is less than the towns of Timnath and Severance, but greater than all other localities in the region.
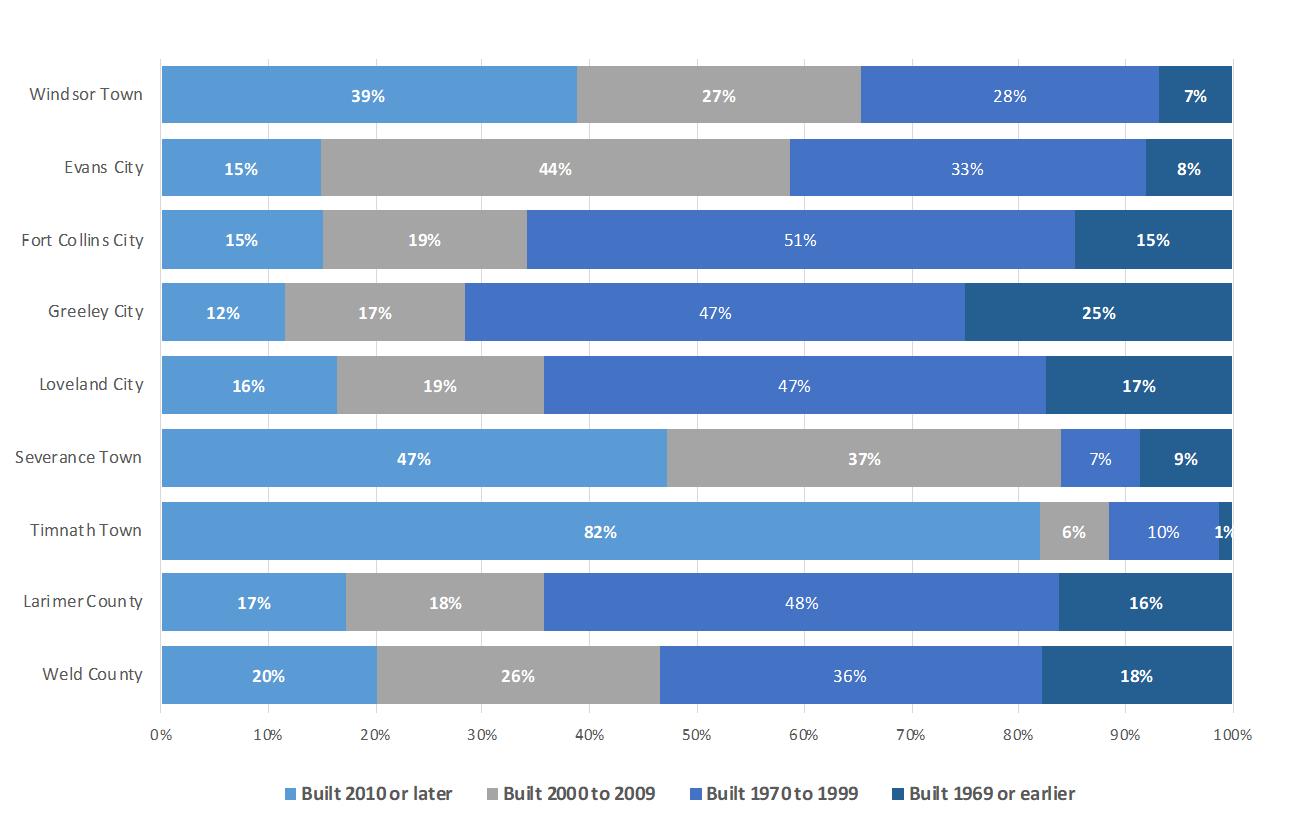
Source: U.S. Census, 2022 American Community Survey 5-Year Estimates
Home ownership trends are shown in Figure 7 Windsor has a higher rate of home ownership than either county and most of the neighboring jurisdictions except Timnath and Severance.
A-57 Existing Conditions Report | Page 13
Figure 6. Age of Housing Stock by Jurisdiction
Figure 7. Homeownership Rates by Jurisdiction, 2010 and 2022
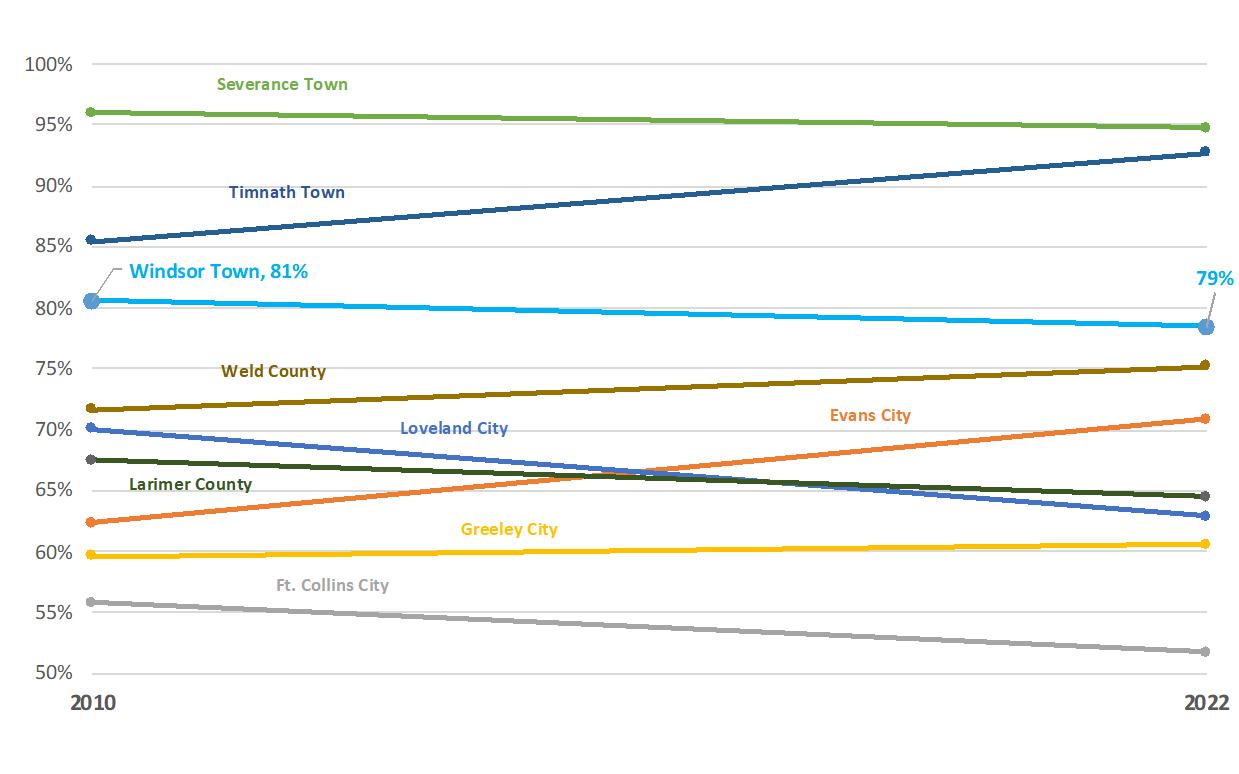
Source: U.S. Census, American Community Survey 5-Year Estimates, 2010 and 2022.
Housing Market Conditions
House values have increased in Windsor and other northern Front Range communities. Per the Colorado Association of Realtors, the median sales price of a single family house as of November 2023 was $500,000 (average $550,000) in Weld County and $583,000 (average of $675,000) in Larimer County, reflecting no change from November 2022 but an increase of 11 and 15 percent respectively from the end of 2021. 2
To compare Windsor to neighboring jurisdictions, U.S. Census data is used and shown in Error! Not a valid bookmark self-reference.. Windsor’s median house value is higher than both counties and ranks second among neighboring jurisdictions.
2 Colorado Association of Realtors, as of November 2023.
A-58 WINDSOR COMPREHENSIVE PLAN | Existing Conditions Report | Page 14
Figure 8. Median Owner-Occupied House Value by Jurisdiction, 2022
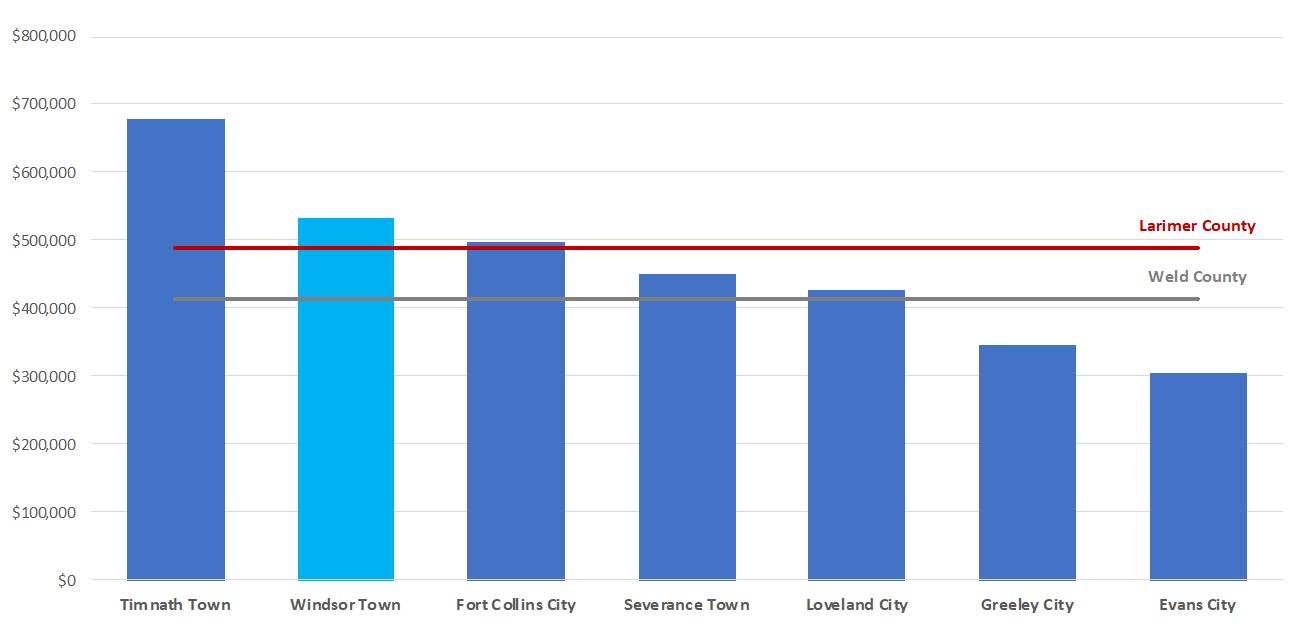
Source: U.S. Census, 2022 American Community Survey 5-Year Estimates; TischlerBise
Values of existing owner-occupied homes are shown in Figure 9 for Windsor and neighboring jurisdictions. Windsor’s housing stock is mostly at the $400,000 and above range while the neighboring cities of Evans, Fort Collins, Greeley, and Loveland have a wider range of values across their inventory
9. Owner-Occupied House Values, 2022
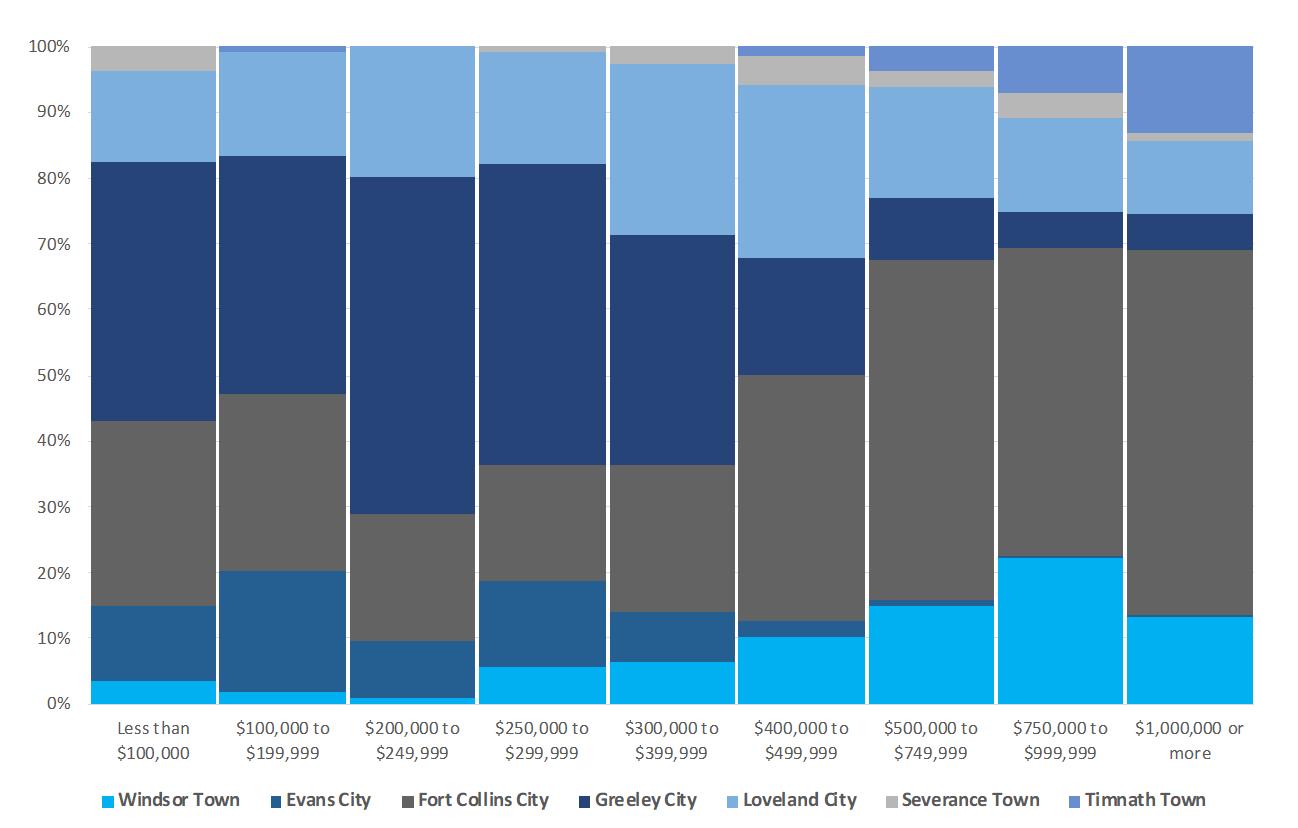
Source: U.S. Census, 2022 American Community Survey 5-Year Estimates
A comparison of median rents is shown in Error! Not a valid bookmark self-reference. Windsor’s median rent is slightly higher than Timnath and the Larimer County median.
A-59 Existing Conditions Report | Page 15
Figure
Figure 10. Median Rents by Jurisdiction, 2022
Source: U.S. Census, 2022 American Community Survey 5-Year Estimates
A comparison of median rents is shown in Error! Not a valid bookmark self-reference.. Windsor’s median rent is slightly higher than Timnath and the Larimer County median.
10. Median Rents by Jurisdiction, 2022
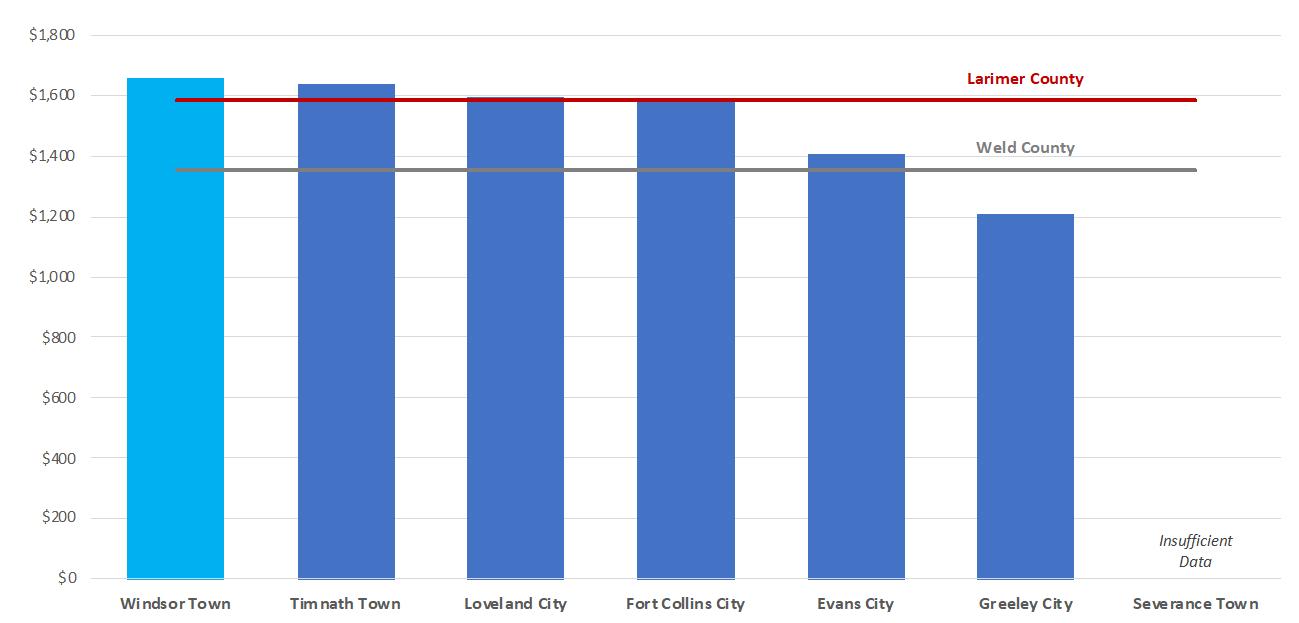
Source: U.S. Census, 2022 American Community Survey 5-Year Estimates; TischlerBise
Existing Conditions Report | Page 17
A-60 WINDSOR COMPREHENSIVE PLAN |
Figure
Household Incomes and Housing Affordability
Median Incomes
Median household incomes have increased in Windsor and neighboring jurisdictions since 2010 with Windsor and Evans increasing by the largest amount (60 and 64 percent respectively) of the comparison communities since 2010. 3 Windsor and Severance have the highest median household incomes in the area.
Figure 11. Median Household Income (Not Adjusted for Inflation) by Jurisdiction, 2010, 2015, and 2022
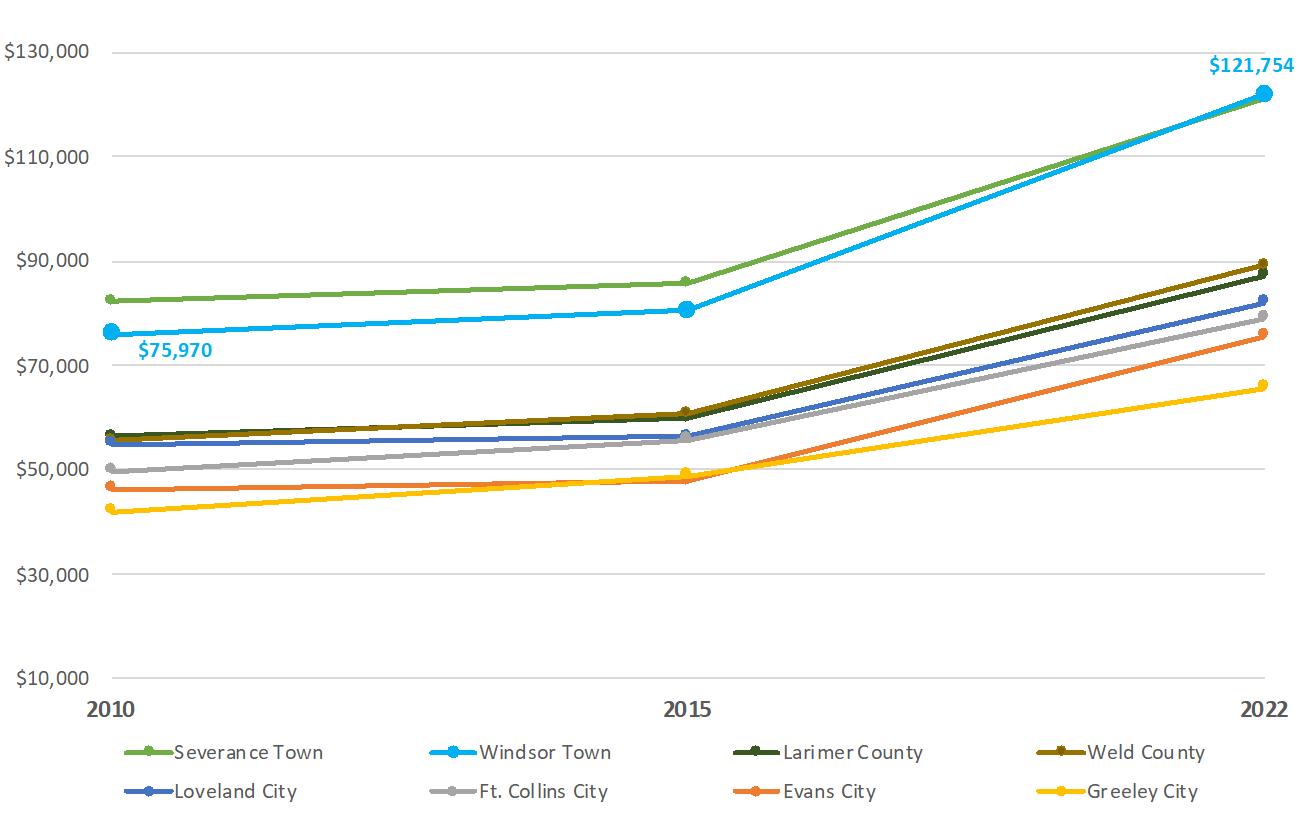
Note: Timnath is not included in the above chart due to inadequate data.
Source: U.S. Census, 2022 American Community Survey 5-Year Estimates
Housing Cost Burden
Spending more than 30 percent of household income on housing costs is considered “cost burdened.” A “severely burdened” household is one spending more than 50 percent of household income on housing costs. Approximately 13 percent of Windsor owner-occupied households are cost burdened, the same as Larimer County and less than Weld County. An additional 8 percent are considered severely burdened, less than both counties
For renters, 31 percent of Windsor households are estimated to be cost burdened, higher than neighboring jurisdictions and both counties. Adding in the additional households that are considered
3 Inflation accounts for 37 percent of the increase (Consumer Price Index for All Urban Consumers (CPI-U).
A-61 Existing Conditions Report | Page 18
severely burdened brings the share up to half of all renter households. This share is in line with most neighboring jurisdictions and counties.
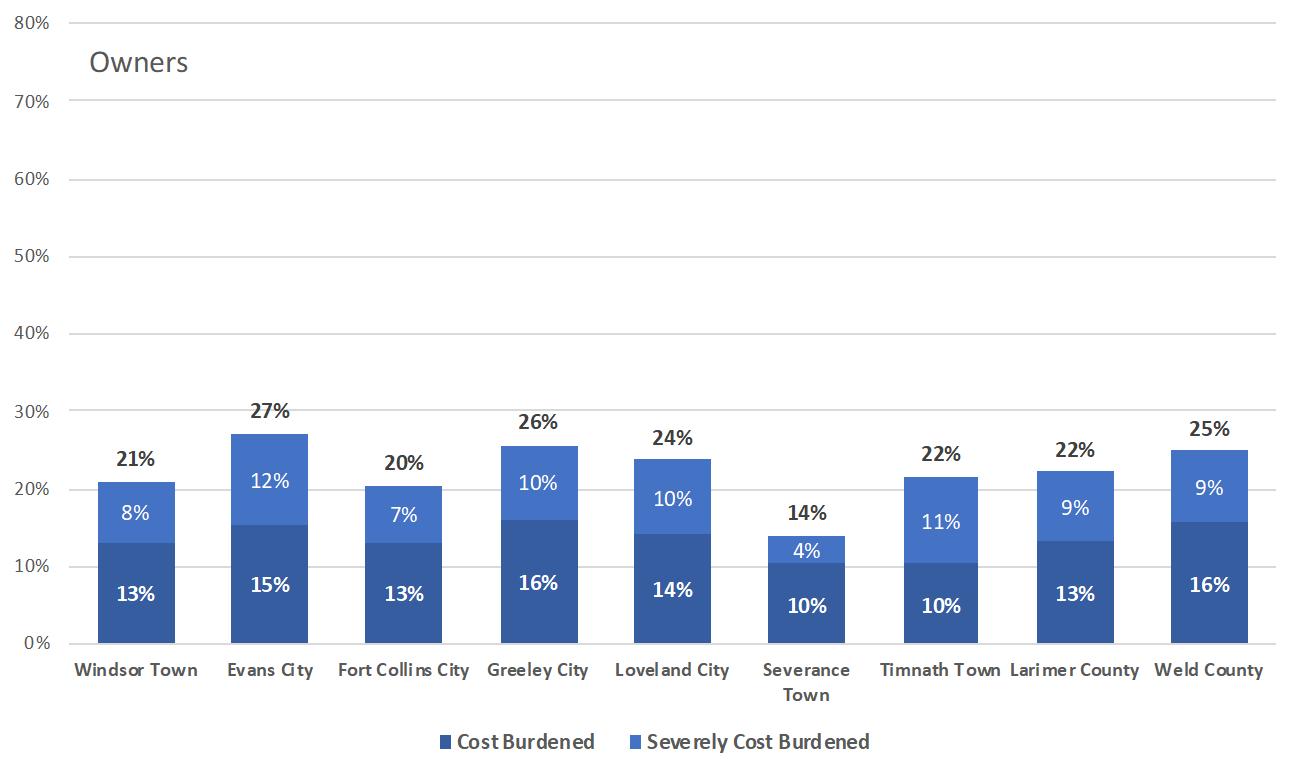
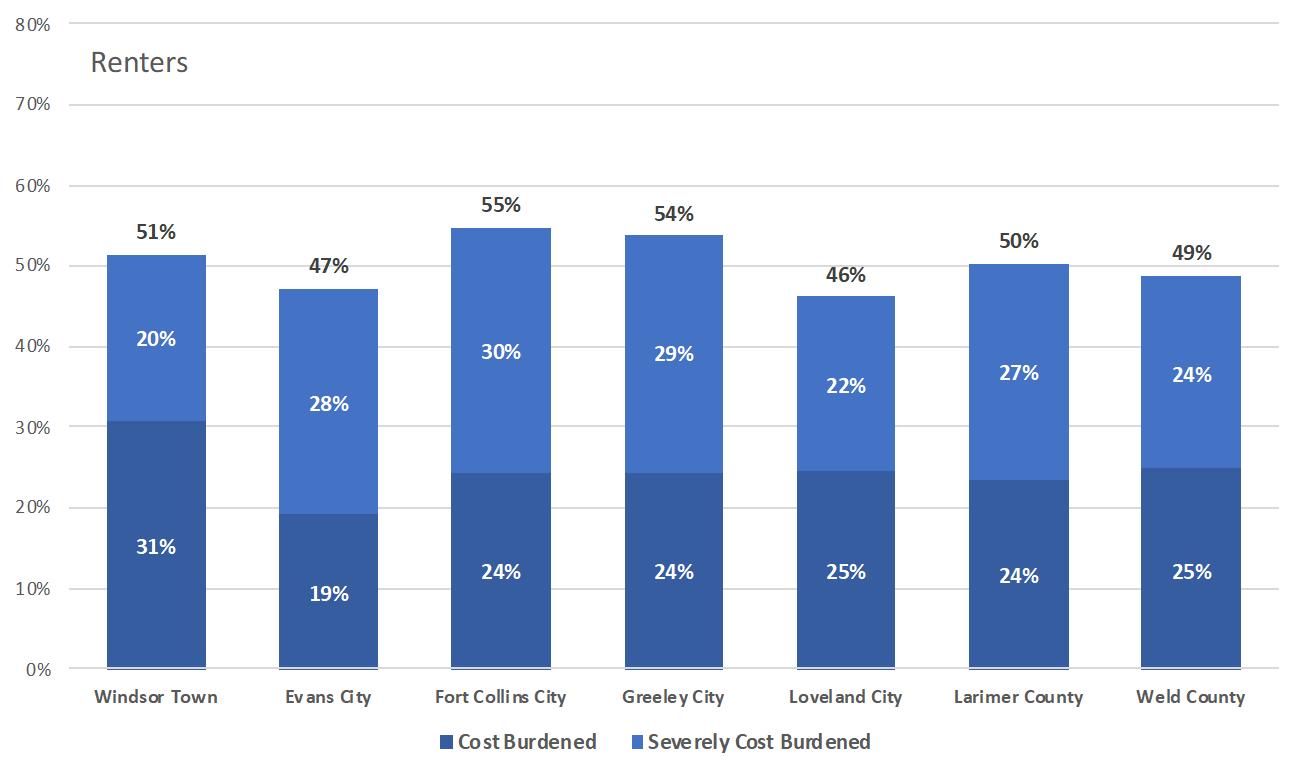
Note: Renter data does not include Severance or Timnath due to small sample size. Source: U.S. Census, 2022 American Community Survey 5-Year Estimates; TischlerBise.
A-62 WINDSOR COMPREHENSIVE PLAN | Existing Conditions Report | Page 19
Figure 12. Owner and Renter Housing Cost Burden by Jurisdiction, 2022
Using median incomes from the U.S. Census, a “supportable” house value and rent can be calculated for Windsor and compared to actual median values and rents. In 2022, the median value for an owneroccupied housing unit is just under the affordable threshold for a household earning the median income. Renters earning the median income are able to afford the median rent.
13. Supportable House Value and Rent, Town of Windsor, 2010 and 2022
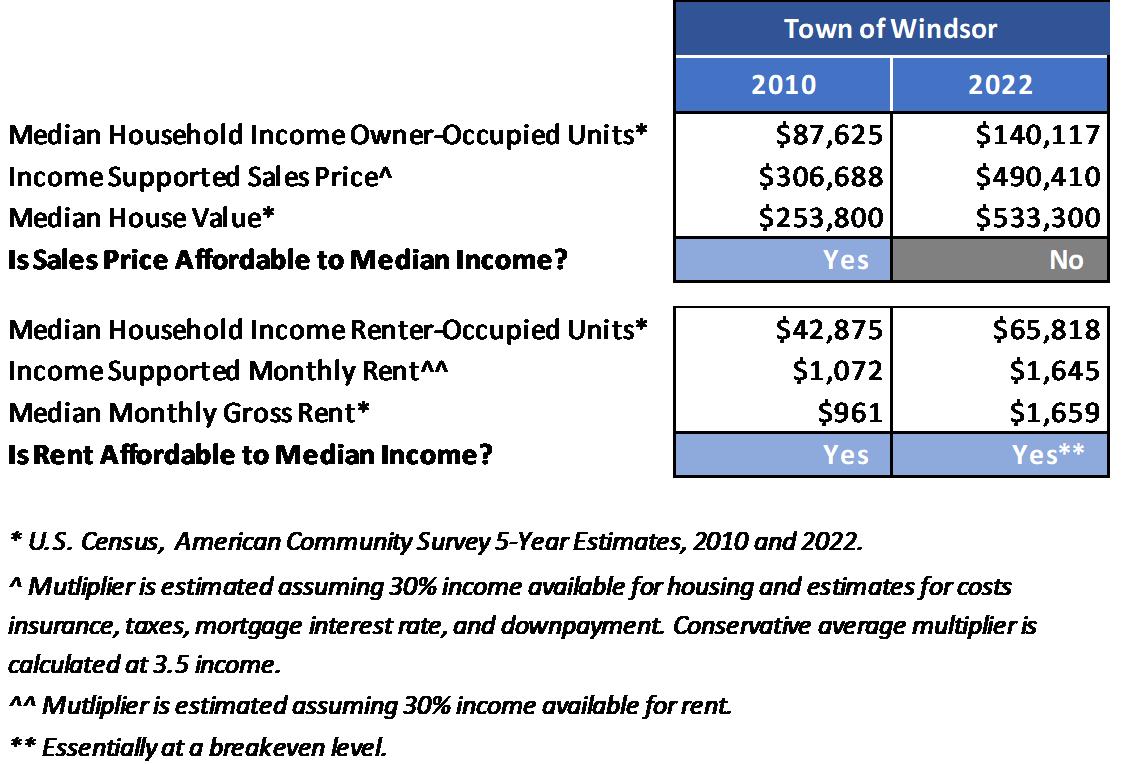
Housing Market Strength
The website Realtor.com provides a useful housing market index that can be used to compare housing markets over time. The “Market Hotness Index” 4 evaluates and compares the extent to which local markets are experiencing fast moving supply and rising demand. It should be noted that data is only available by zip code and therefore does not align with jurisdictional boundaries.
The index accounts for two aspects of the housing market: (1) market demand, as measured by unique views per property on Realtor.com, and (2) the pace of the market as measured by the number of days a listing remains active on Realtor.com.
The index is scaled from 0 to 100, 0 representing the lowest and 100 representing the highest housing market activity. Recent rankings for Windsor and neighboring locations are shown in
Figure 14. Windsor’s housing market is “cool” relative to its neighbors with Loveland, Eaton, and Greeley currently identified as stronger.
4 Source: Realtor.com Market Hotness Index, www.realtor.com/research/data/
A-63 Existing Conditions Report | Page 20
Figure
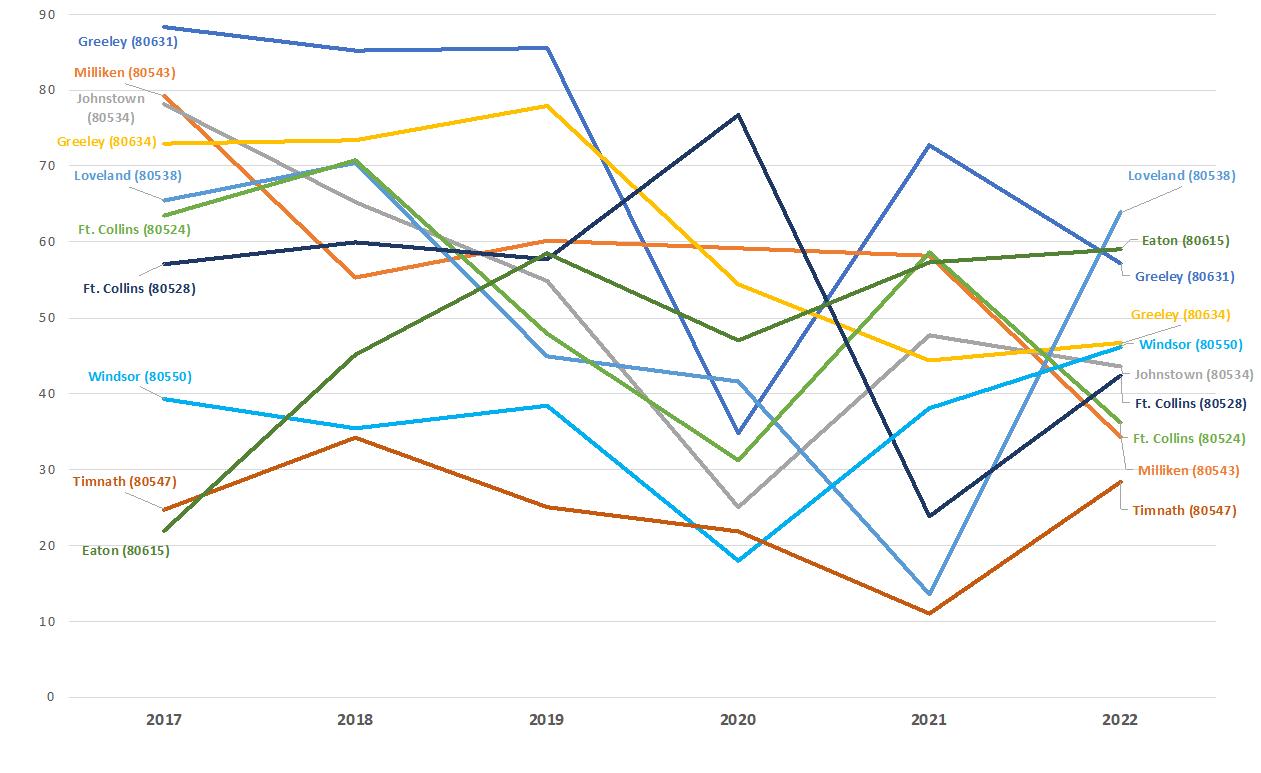
Note: Data is for the zip code indicated with the main city labeled; data is not exclusive to conditions inside municipal city boundaries.
Source: Realtor.com, Market Hotness Index, https://www.realtor.com/research/data/.
Median list prices and changes over time for Windsor and Larimer and Weld counties are shown in the next two figures. Windsor values track closer to Larimer County median values despite a larger portion of Windsor being in Weld County. Windsor list prices have seen relatively sizable changes over the last five years, most recently experiencing growth but at a lower rate than 2020 to 2021.
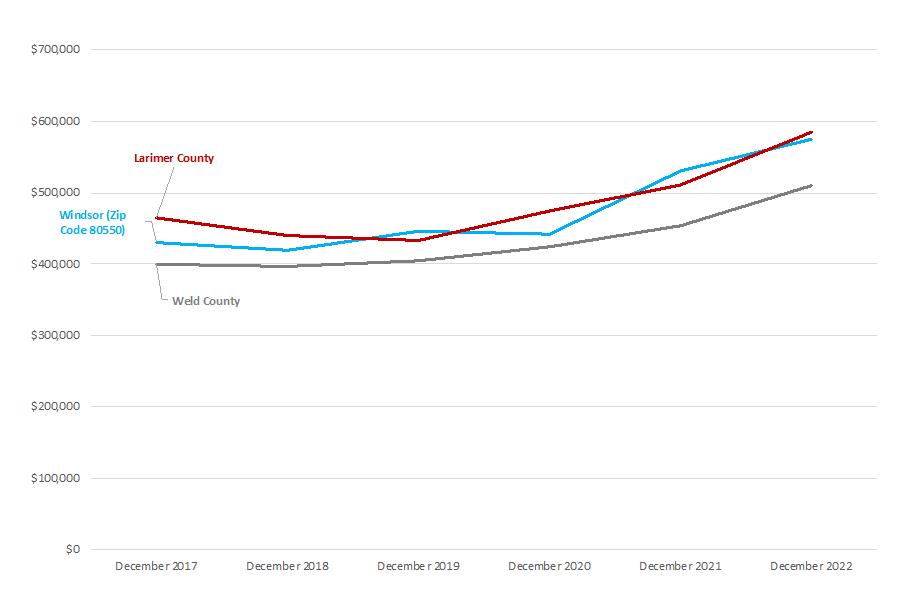
Note: Windsor data is for the zip code indicated; data is not exclusive to conditions inside municipal city boundaries. County data is for the respective county as indicated.
Source: Realtor.com, Market Hotness Index, https://www.realtor.com/research/data/.
A-64 WINDSOR COMPREHENSIVE PLAN | Existing Conditions Report | Page 22
Figure 14. Housing Market Hotness Index, 2017-2022
Figure 15. Median List Price, 2017 to 2022
16. Median List Price Change Year over Year, 2017 to 2022
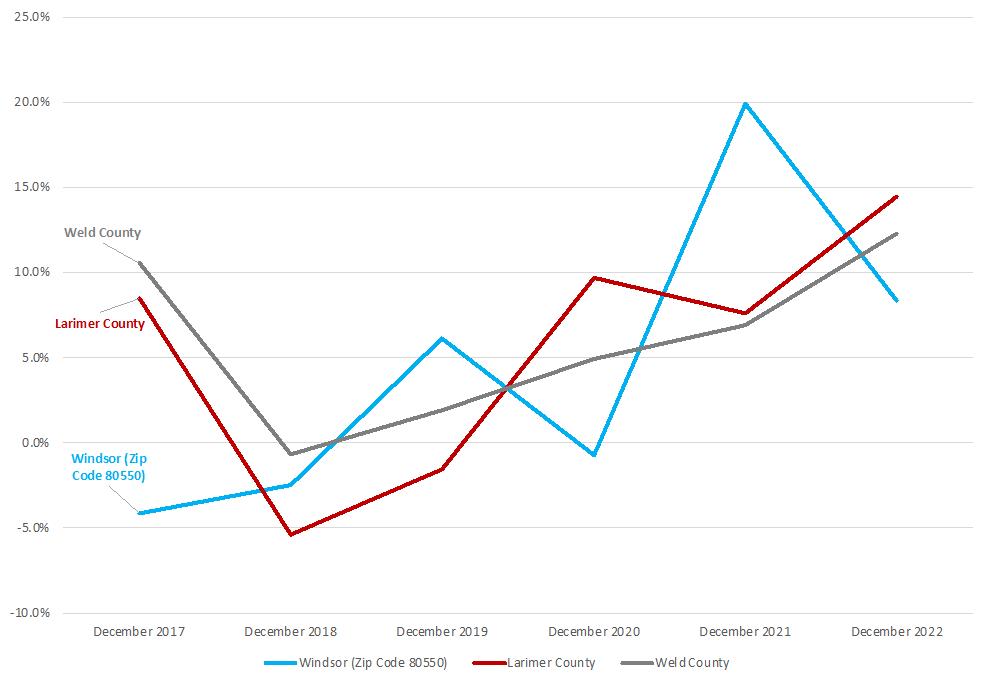
Note: Windsor data is for the zip code indicated; data is not exclusive to conditions inside municipal city boundaries. County data is for the respective county as indicated.
Source: Realtor.com, Market Hotness Index, https://www.realtor.com/research/data/.
Advancing Opportunities through Windsor’s Comprehensive Plan
Key considerations for the Comprehensive Plan update, related to housing, include the following:
1. Identify policies that support increasing affordable housing options, especially for currently costburdened and severely cost-burdened renters, which make up half of renter households.
2. Identify policies that promote senior housing development along with a range of housing types. Consider additional development incentives.
3. Consider strategies that promote sustainable housing development, especially related to water usage.
A-65 Existing Conditions Report | Page 23
Figure
3. ECONOMY
Overview
This section covers Windsor’s economic activities, trends, and predictions. Along with existing conditions, this section includes gaps, challenges, and opportunities, indicating where Windsor is doing well, and where the Town can focus more of its resources in the future. The information in this section will guide goals and objectives for the future economic development and growth of the Town.
Current Plans and Policies
The 2016 Comprehensive Plan, specifically Chapter 5d: Commercial and Industrial Areas Framework Plan, envisions a future where the downtown remains the “heart of Windsor” with thriving businesses and streets supported by mixed-use and multi-family housing. In addition, the Town envisions the I-25 interchange as a “bustling commercial and employment district that draws visitors from the north Front Range region…” and more broadly envisions the Town supporting a “dynamic and resilient local economy.” The plan also envisions a future where the Fairgrounds District is a “regional attraction”, and the Great Western Industrial Park has grown tremendously.
Community Perception
Broadly speaking, Windsor community members envision a future with “diversified businesses,” according to recent Comprehensive Plan Update questionnaire responses. More specifically, this means supporting the healthcare sector, encouraging and supporting small businesses, and attracting more commercial businesses, like restaurants and grocery stores. Furthermore, community members support focusing commercial development along Highway 392 and in the I-25 area.
Current Conditions and Trends
Employment Trends
The number of jobs located in the Town of Windsor has increased by over 65 percent from 2010 from approximately 5,600 to 9,300.
A-66 WINDSOR COMPREHENSIVE PLAN | Existing Conditions Report | Page 24
Figure 17. Town of Windsor Employment Trends
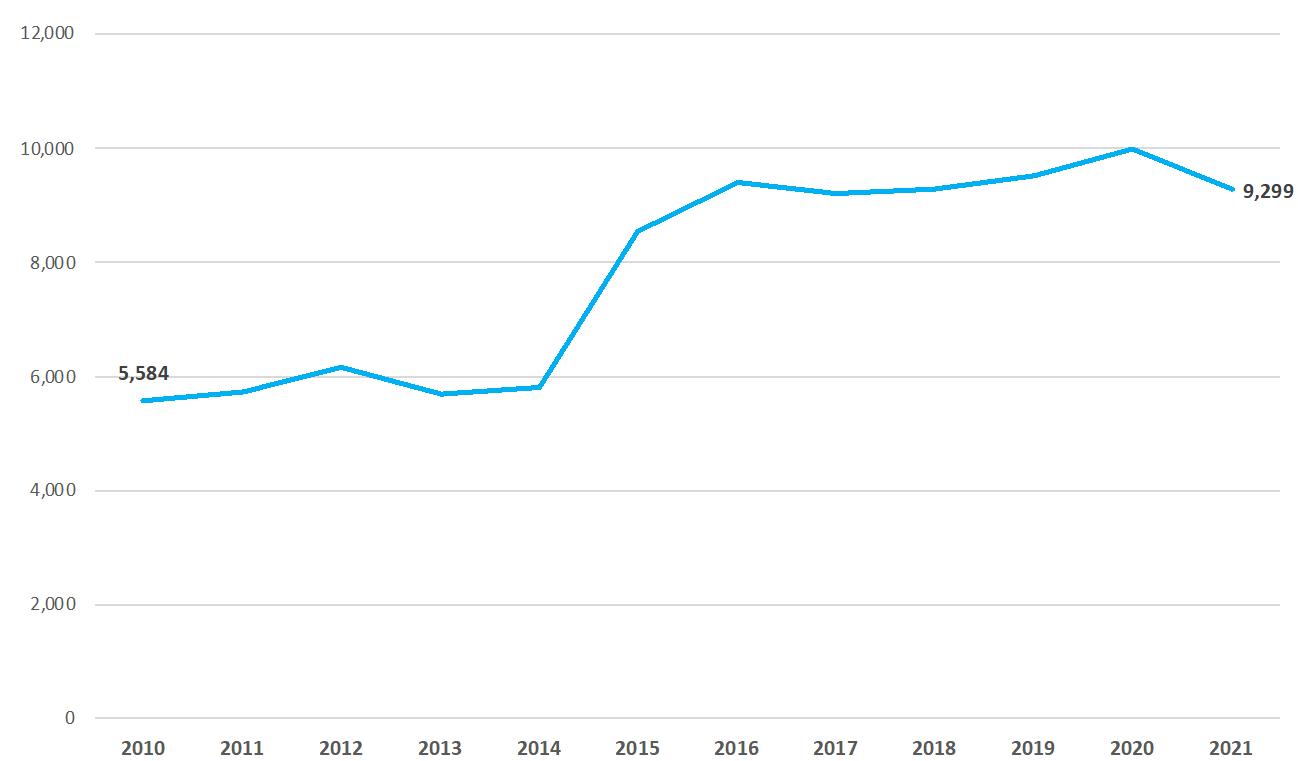
Source: U.S. Census Bureau, OnTheMap Application and LEHD Origin-Destination Employment Statistics (Beginning of Quarter Employment, 2nd Quarter of 2010-2021).
Approximately 20 percent of the Town’s jobs are in manufacturing, followed by construction, health care/social assistance, accommodation/food services, professional services, and retail trade
Figure 18. Town of Windsor Employment by Industry, 2021
Source: U.S. Census Bureau, OnTheMap Application and LEHD Origin-Destination Employment Statistics (Beginning of Quarter Employment, 2nd Quarter of 2021).
Employment Concentration and Growth
When an area is host to a diverse mix of industries, it is less vulnerable to changes in any one sector.
A-67 Existing Conditions Report | Page 25
Location Quotient (LQ) is a statistical measure of an industry concentration relative to other
Source: U.S. Census Bureau, OnTheMap Application and LEHD Origin-Destination Employment Statistics (Beginning of Quarter Employment, 2nd Quarter of 2021).
Employment Concentration and Growth
When an area is host to a diverse mix of industries, it is less vulnerable to changes in any one sector. Location Quotient (LQ) is a statistical measure of an industry concentration relative to other geographies.
An LQ above 1.0 indicates a local industry concentration higher than expected. Industry concentration can be measured relative to any geography in this case, we compare Windsor’s job base to Larimer and Weld counties, which double as this area’s Metropolitan Statistical Areas (MSA). 5
Compared to the two-county region, Windsor has a higher concentration of jobs in the following industries (i.e., an LQ equal to or above 1.0):
• Utilities
• Construction
• Manufacturing
• Real Estate/Rental and Leasing
• Arts, Entertainment, and Recreation
• Mining, Quarrying, and Oil and Gas Extraction
• Health Care and Social Assistance
• Other Services (excluding Public Administration)
• Professional, Scientific, and Technical Services
• Accommodation and Food Services (just under 1)
Consistent with these findings, one of the key sectors currently promoted by Windsor Economic Development is manufacturing. 6
5 Fort Collins-Loveland MSA is all of Larimer County; and Greeley MSA is all of Weld County.
6 Windsor Economic Development also promotes restaurants, breweries, and hospitality; and tourism.
A-68 WINDSOR COMPREHENSIVE PLAN | Existing
26
Conditions Report | Page
Figure 19. Town of Windsor Industry Concentration Relative to the Two-County Region (Location Quotient), 2021
• Professional, Scientific, and Technical Services
• Accommodation and Food Services (just under 1)
Consistent with these findings, one of the key sectors currently promoted by Windsor Economic Development is manufacturing. 6
Figure 19. Town of Windsor Industry Concentration Relative to the Two-County Region (Location Quotient), 2021
5 Fort Collins-Loveland MSA is all of Larimer County; and Greeley MSA is all of Weld County.
6 Windsor Economic Development also promotes restaurants, breweries, and hospitality; and tourism.
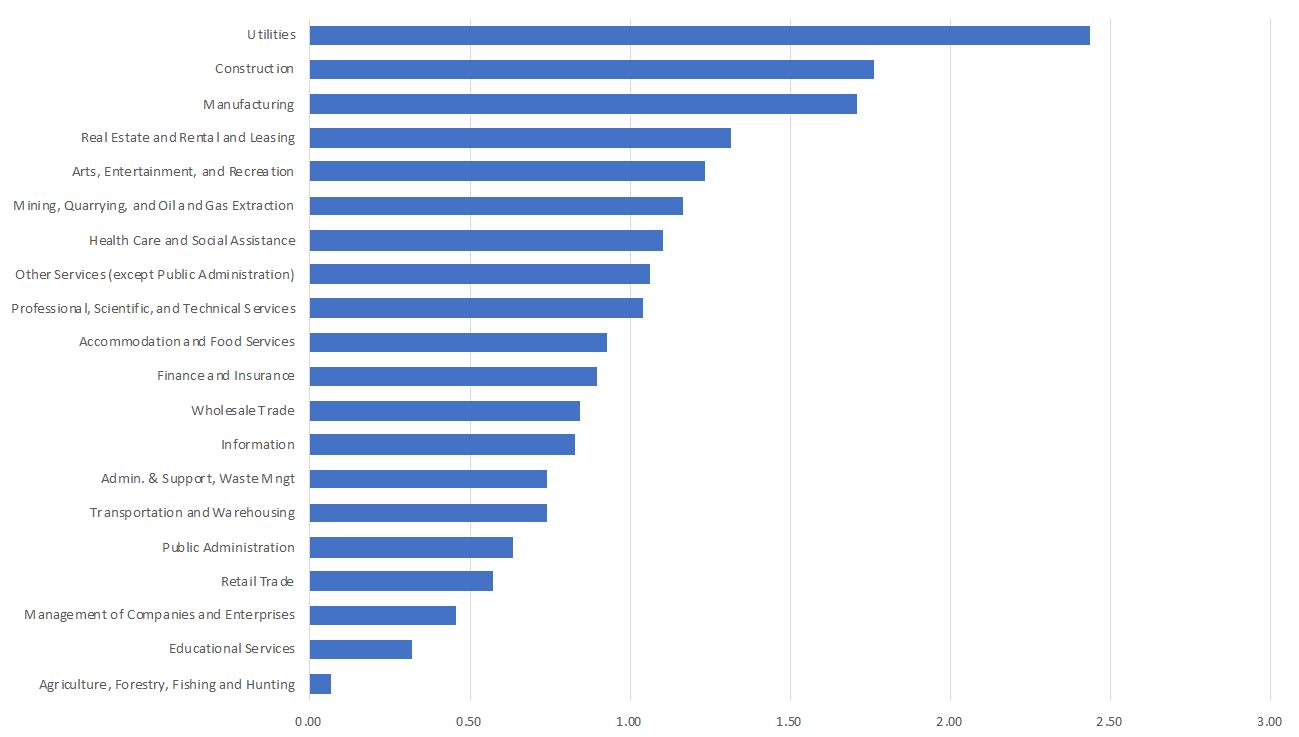
Source: U.S. Census Bureau, OnTheMap Application and LEHD Origin-Destination Employment Statistics (Beginning of Quarter Employment, 2nd Quarter of 2021).
Another key indicator of economic health is job growth. Both job growth and concentration in the Town are plotted in Job growth is charted along the horizontal x-axis and reflects growth between 2010 and 2021 for the industry sector in Windsor. Employment concentration is charted along the vertical y-axis using the location quotient information from Figure 1920. The size of each bubble illustrates the relative 2021 employment base by major industry cluster.
In some cases, the concentration of employment is both higher than the two-county average and growing, indicating a strong industry in the Town (e.g., Construction). In other cases, the concentration may be higher in the Town than the region, but employment is declining, as is the case with Arts/Entertainment/Recreation. Strong and growing industries include, Construction, Health Care and Social Assistance, Real Estate, Other Services, Professional/Scientific/Technical Services. Conversely, a few industries in the county are showing signs of growth but do not have a concentration of employment relative to the region, such as Wholesale Trade, Retail Trade, Public Administration, Accommodation/Food Service, and Information.
Understanding the four quadrants of industry growth and decline shown in Error! Not a valid bookmark self-reference. can help further inform land use decisions relative to industry requirements as well as business attraction, retention, and expansion strategies.
Figure 20
Job growth is charted along the horizontal x-axis and reflects growth between 2010 and 2021 for the industry sector in Windsor. Employment concentration is charted along the vertical y-axis using the location quotient information from Figure 1920. The size of each bubble illustrates the relative 2021 employment base by major industry cluster.
A-69
Existing Conditions Report | Page 26 • Other Services (excluding Public Administration)
Understanding the four quadrants of industry growth and decline shown in Error! Not a valid bookmark self-reference. can help further inform land use decisions relative to industry requirements as well as business attraction, retention, and expansion strategies.
Figure 20. Employment Strength and Growth
Note that Educational Services and Mining, Quarrying, and Oil and Gas Exploration industries were not included in this figure due to scaling issue. Both industries grew from 2010 to 2021 from single digit employment to over 200 jobs each, resulting in growth of 4000 and 1600 percent, respectively. Inclusion of these sectors compresses the x-axis and decreases readability.
Source: U.S. Census Bureau, OnTheMap Application and LEHD Origin-Destination Employment Statistics (Beginning of Quarter Employment, 2nd Quarter of 2010-2021).
A-70 WINDSOR COMPREHENSIVE PLAN |
employment relative to the region, such as Wholesale Trade, Retail Trade, Public Administration, Accommodation/Food Service, and Information
Existing Conditions Report | Page 28
Commuter Trends
The Town of Windsor has a larger number of working residents than jobs as of 2021. Approximately 17 percent of jobs in Windsor are held by residents (1,580 / (7,719+1,580)). For Windsor residents in the labor force, less than 10 percent work in the Town.
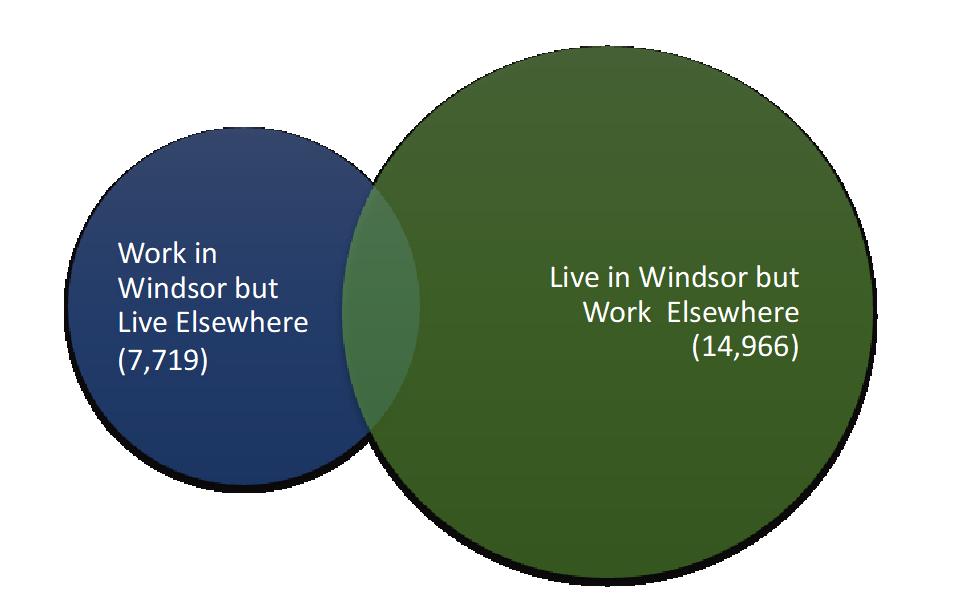



Source: U.S. Census Bureau, OnTheMap Application and LEHD Origin-Destination Employment Statistics (Beginning of Quarter Employment, 2nd Quarter of 2002-2021).
Employees working in Windsor primarily live in Windsor, Greeley, Fort Collins, Loveland, and Evans.
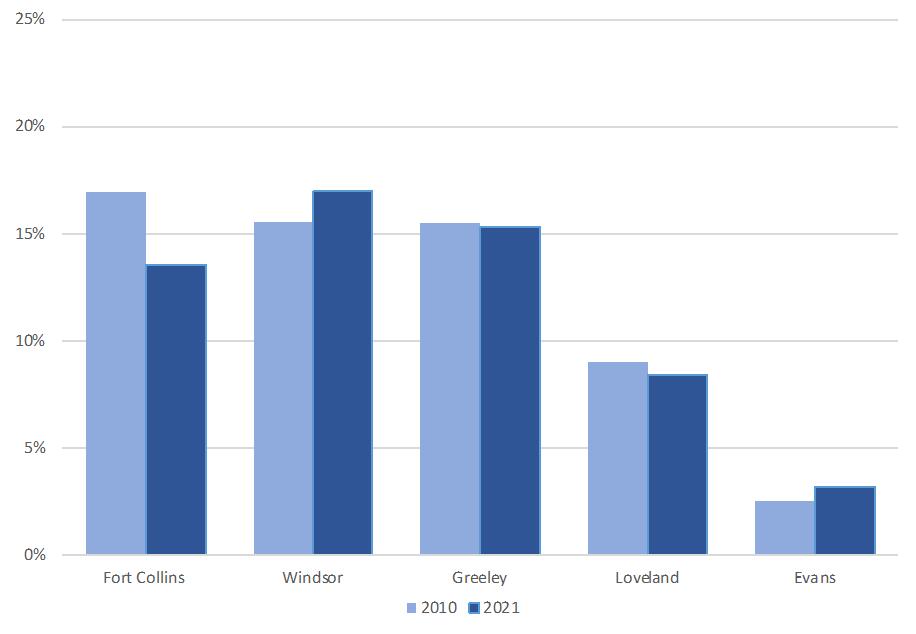
Source: U.S. Census Bureau, OnTheMap Application and LEHD Origin-Destination Employment Statistics (Beginning of Quarter Employment, 2nd Quarter of 2002-2021).
Windsor residents commute and/or work in establishments located in Fort Collins, Greeley, Loveland, and Denver.
A-71 Existing Conditions Report | Page 29
Figure 21. Town of Windsor Place of Work and Residence, 2021
Figure 22. Place of Residence for Workers in Windsor (Top 5 Locales), 2021
Work & Live in Windsor (1,580)
Figure 23. Place of Work for Windsor Residents (Top 5 Locales), 2021
Source: U.S. Census Bureau, OnTheMap Application and LEHD Origin-Destination Employment Statistics (Beginning of Quarter Employment, 2nd Quarter of 2002-2021).
Windsor residents commute and/or work in establishments located in Fort Collins, Greeley, Loveland, and Denver.
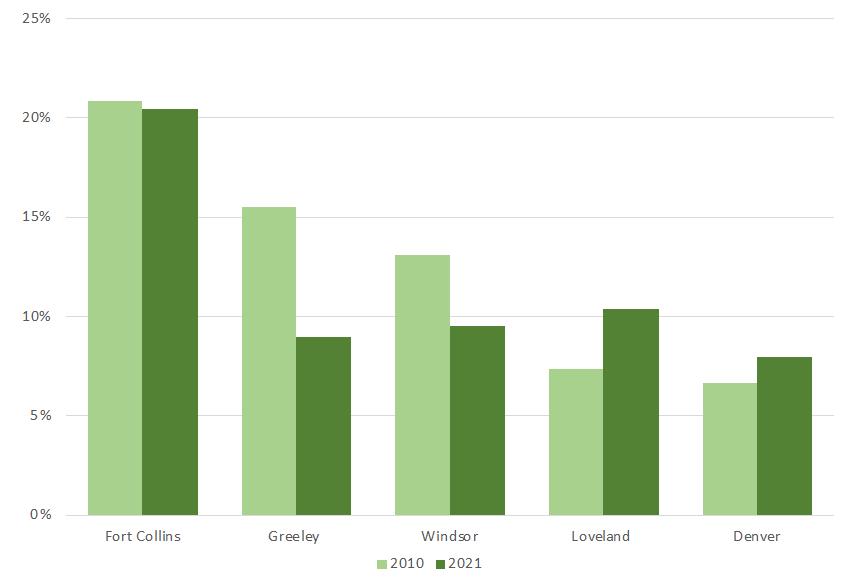
Source: U.S. Census Bureau, OnTheMap Application and LEHD Origin-Destination Employment Statistics (Beginning of Quarter Employment, 2nd Quarter of 2002-2021).
COVID-19 created a shift to remote working that is expected to continue, albeit not at the levels experienced during the height of the pandemic. Americans worked 60 percent of the time at home during the pandemic, up from 5 percent pre-pandemic. 7 According to WFH Research, as of its latest survey in fall 2023, approximately , 30 percent of U.S. employees worked from home in a hybrid arrangement 8 Workers surveyed expressed a desire and expectation to work in a hybrid system with some days working from home and some at the office. 9 The full impact of these trends will not likely be known until workplace locations have stabilized for a greater percentage of the workforce.
7 The Economist, “The Rise of Working from Home,” April 10, 2021, Special Report https://www.economist.com/specialreport/2021/04/08/the-rise-of-working-from-home.
8 Survey of Working Arrangements and Attitudes (SWAA), January 2024 Updates, https://wfhresearch.com/wpcontent/uploads/2024/01/WFHResearch_updates_January2024.pdf. Findings from initial survey in: Barrero, Jose Maria, Nicholas Bloom, and Steven J. Davis, 2021. “Why Working from Home Will Stick,” National Bureau of Economic Research Working Paper 28731.
9 Ibid.
A-72 WINDSOR COMPREHENSIVE PLAN |
Existing Conditions Report | Page 30
Figure 23. Place of Work for Windsor Residents (Top 5 Locales), 2021
Housing Affordability for Workers
Evaluating both housing costs and industry wages allows for an evaluation of whether a worker in Windsor can afford to own or rent a housing unit. This section explores this question.
First, average incomes by industry sector were obtained for Larimer and Weld Counties from the Colorado Department of Labor, Quarterly Census of Employment and Wages (QCEW). Using this average wage data, an income-supported sales price was determined and compared to Windsor’s median owner-occupied house value. Because owner-occupied households typically have more than one worker per household, the average multiplier of 1.5 is used to estimate potential household income by industry. This is charted in Figure 24
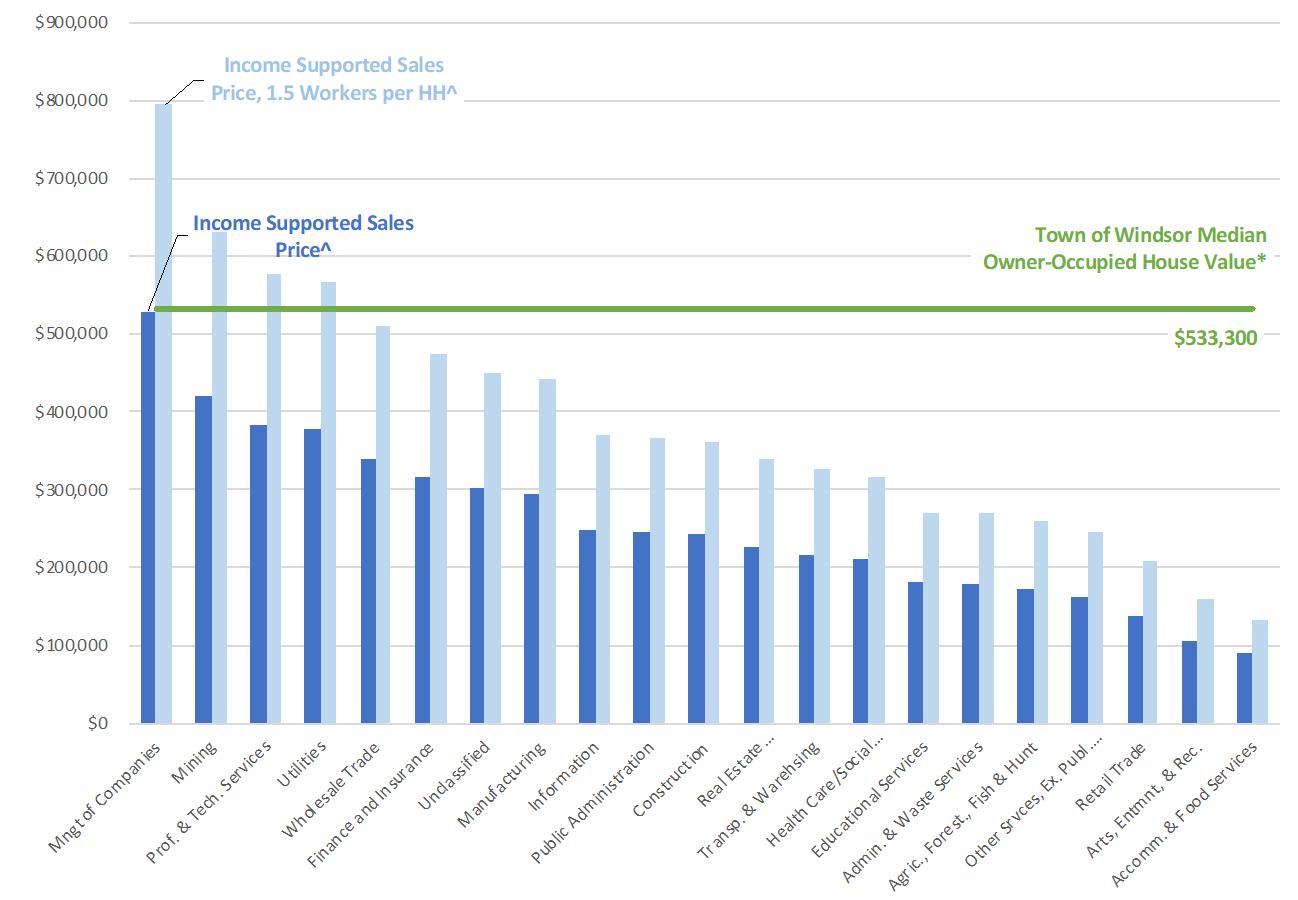
^ Multiplier is estimated assuming 30% income available for housing and estimates for costs insurance, taxes, mortgage interest rate, and down payment. Conservative average multiplier is calculated at 3.5 gross income. 1.5 workers per household assumes same industry per household for purposes of this evaluation. Average incomes by industry sector from Colorado Department of Labor, Quarterly Census of Employment and Wages (QCEW) for Larimer and Weld Counties, 2022
* U.S. Census, 2022 American Community Survey 5-Year Estimates.
Only the industry sector, Management of Companies, provides a sufficient salary for a one-worker household to afford a median house in Windsor. Assuming 1.5 workers per household expands the list to include: Mining, , Professional and Technical Services, and Utilities. It is interesting to note that Manufacturing a key industry in Windsor is under the threshold.
A-73 Existing Conditions Report | Page 31
Figure 24. Owner-Occupied Housing Affordability for Industries in Windsor, 2022
A similar analysis is done for rental affordability. Income supported rents compared to Windsor’s median rent is shown in Error! Not a valid bookmark self-reference.. Approximately 60 percent of the industries in Windsor pay enough for a one-worker household to afford the Town’s median rent
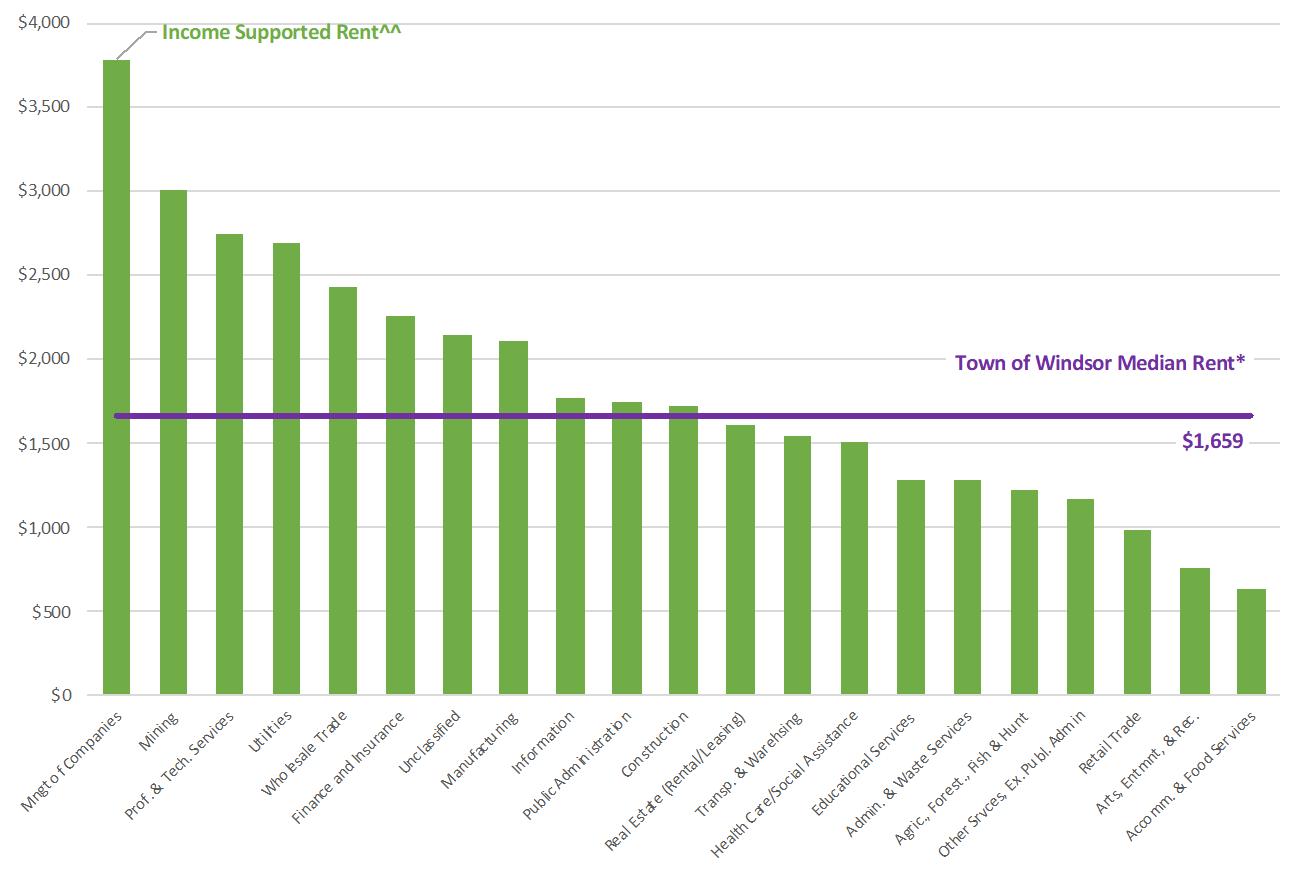
^^ Multiplier is estimated assuming 30% income available for rent. Average incomes by industry sector from Colorado Department of Labor, Quarterly Census of Employment and Wages (QCEW) for Larimer and Weld Counties, 2022
* U.S. Census, 2022 American Community Survey 5-Year Estimates.
As noted, households typically have more than one worker. In the Town of Windsor, there are an average of 1.77 workers per household with approximately 80 percent of households having one or more workers.
Source: U.S. Census Bureau, 2022: ACS 5-Year Estimates
A-74 WINDSOR COMPREHENSIVE PLAN | Existing Conditions Report | Page 32
Figure 25. Rental Affordability for Industries in Windsor, 2022
Figure 26. Average Workers per Household in Windsor, 2022
Figure 26. Number of Workers per Household in Windsor, 2022
^^ Multiplier is estimated assuming 30% income available for rent. Average incomes by industry sector from Colorado Department of Labor, Quarterly Census of Employment and Wages (QCEW) for Larimer and Weld Counties, 2022
* U.S. Census, 2022 American Community Survey 5-Year Estimates.
As noted, households typically have more than one worker. In the Town of Windsor, there are an average of 1.77 workers per household with approximately 80 percent of households having one or more workers.
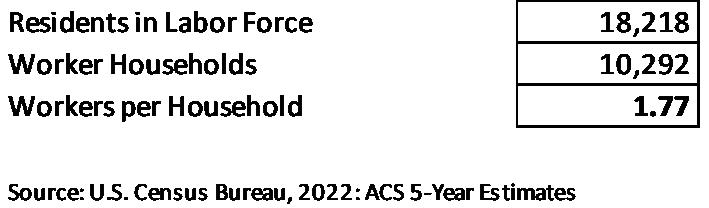
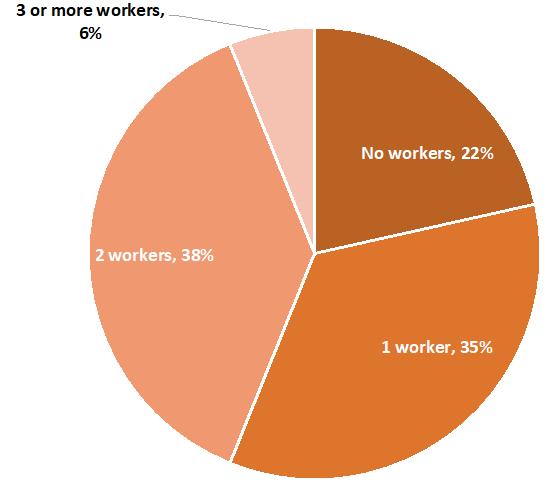
Conditions
A-75
33
Existing
Report | Page
Figure 26. Average Workers per Household in Windsor, 2022
Figure 26. Number of Workers per Household in Windsor, 2022
Source: U.S. Census Bureau, 2022: ACS 5-Year Estimates
Future Outlook
Residential Projections
As noted elsewhere, development activity in Windsor is expected to slow down in the coming years due to water supply limitations, financial market uncertainty (namely, interest rates), and the potential for a near-term economic slowdown. A series of four population projections was developed to account for these conditions. Results are shown in Error! Not a valid bookmark self-reference.
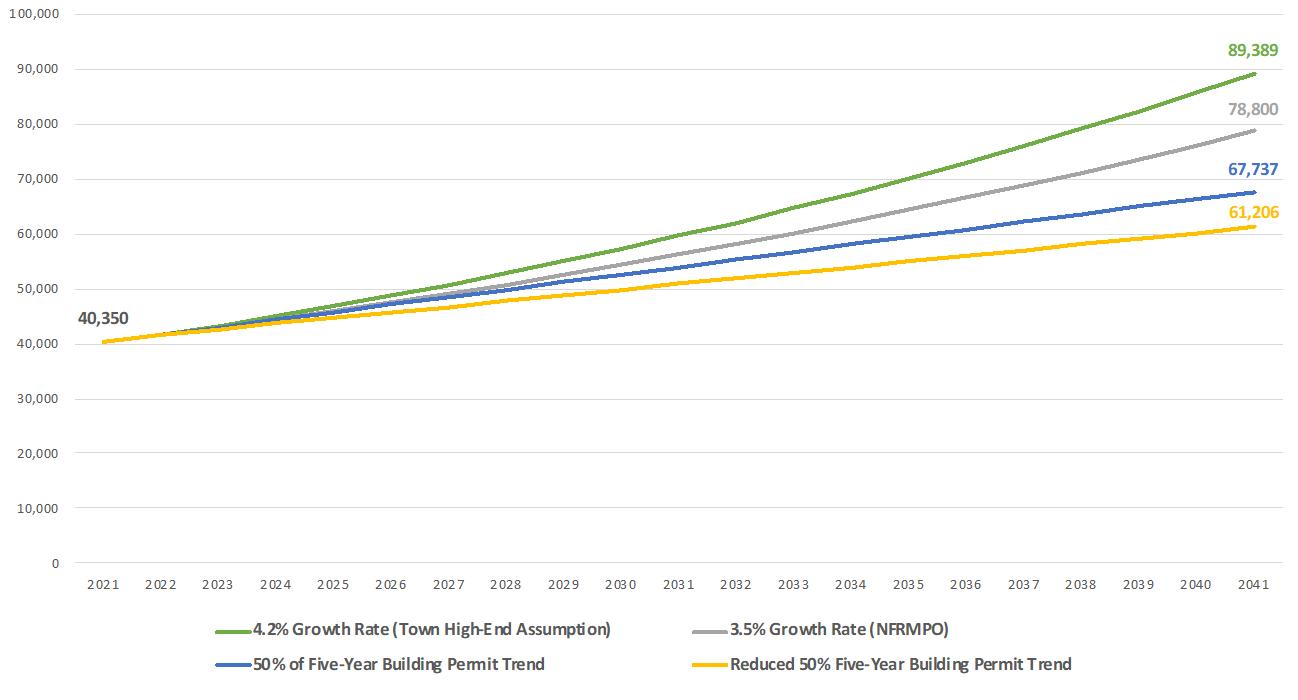
Sources: Northern Front Range Metropolitan Planning Organization; Colorado State Demographer’s Office; TischlerBise.
Note: Projections were developed at the initiation of the Existing Conditions analysis. For continuity with other components of the Plan, original projections are retained.
The approach for the range of projections is as follows:
• The Town of Windsor population is estimated at 40,350 as of the end of 2021 (and used as the base year for the projections).
• In the Town’s projection efforts, multiple ranges of projections are considered including high-end (“aggressive”), moderate, and conservative approaches.
• In addition, the regional transportation planning entity, the Northern Front Range Metropolitan Planning Organization (NFRMPO), produces regional and local projections.
• Given the above sources, four approaches are presented to project future population:
o A growth rate of 4.2 percent, reflecting the Town’s high-end growth rate, derived from the Colorado State Demographer’s Office.
o The NFRMPO growth rate of 3.5 percent.
A-76 WINDSOR COMPREHENSIVE PLAN | Existing Conditions Report | Page 34
Figure 27. Population Projections
o Reducing recent building permit activity by half, given what is known regarding slowing development activity in the Town.
o A further reduction to development activity by reducing the number of new units by 25 percent from the already reduced scenario.
Further detail is provided in the table below.
Figure 28. Residential Projections Detail
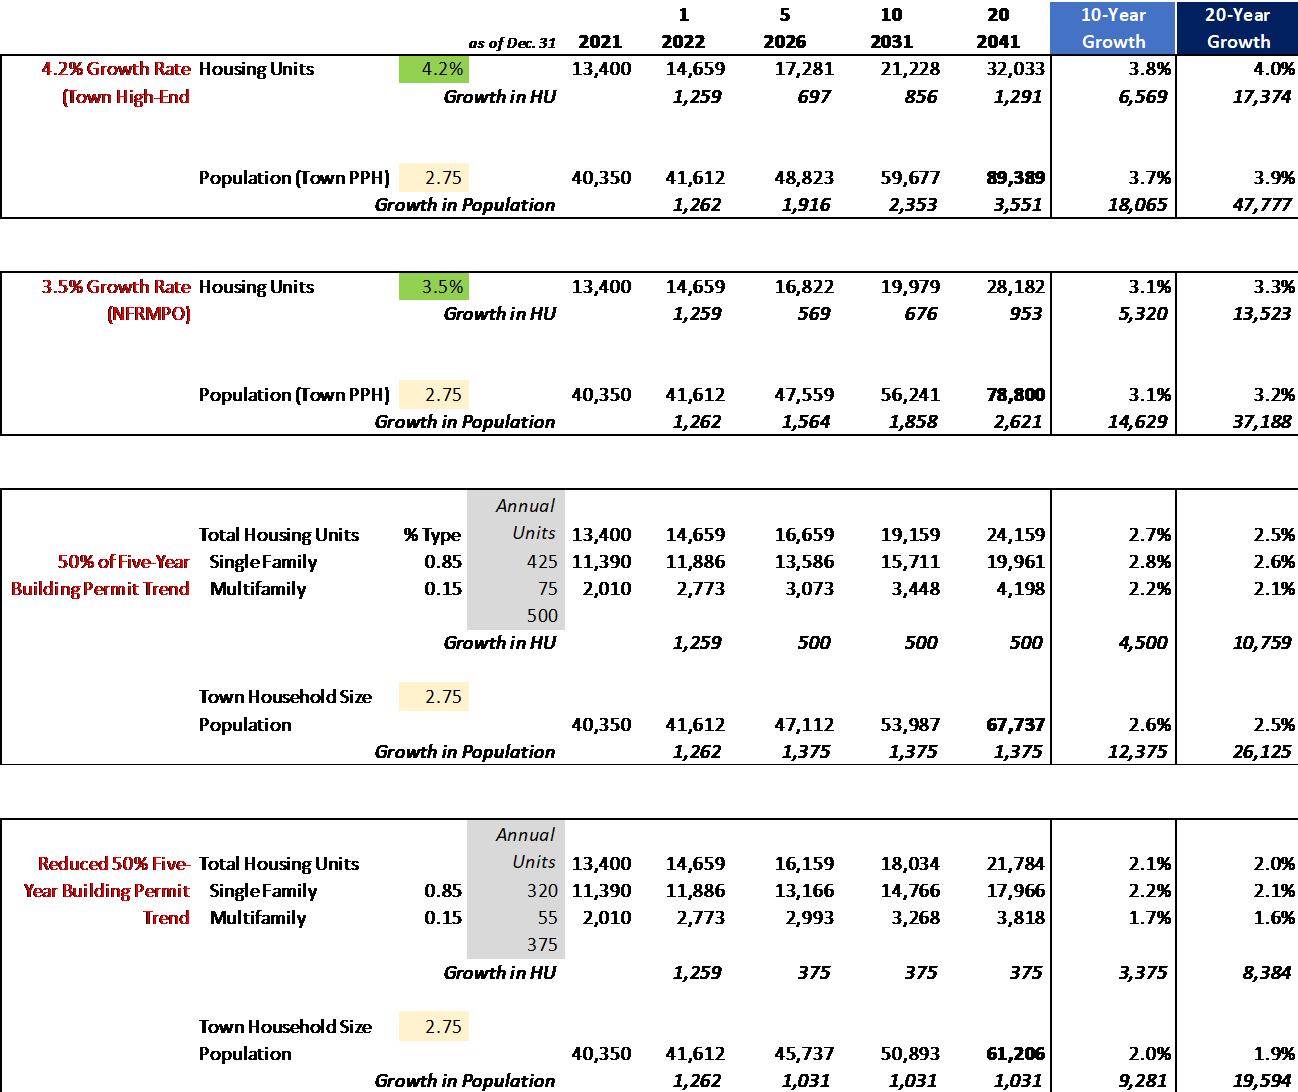
Sources: Northern Front Range Metropolitan Planning Organization; Colorado State Demographer’s Office; TischlerBise.
A-77 Existing Conditions Report | Page 35
Nonresidential Projections
The Colorado Department of Labor produces statewide and county-level employment projections. To project future nonresidential growth in Windsor, Larimer County and Weld County projections were consulted, as shown in Figure 29
Figure 29. Regional and State Employment Projections, 2021-2031
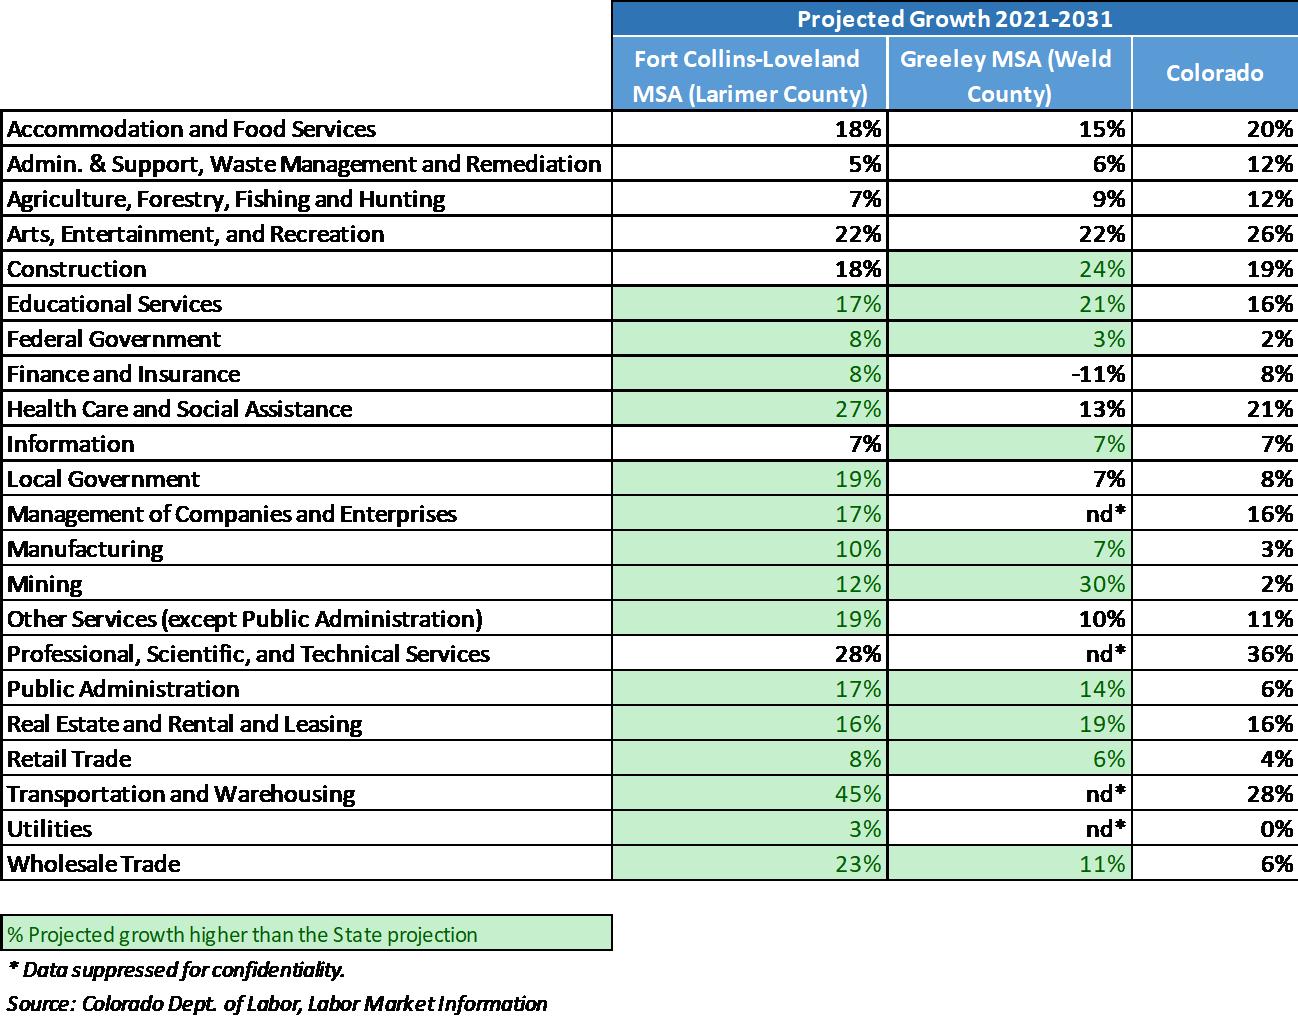
A-78 WINDSOR COMPREHENSIVE PLAN | Existing Conditions Report | Page 36
To link employment growth to nonresidential land use, industries are grouped generally into major nonresidential land use categories of Retail, Office/Institutional, and Industrial. A summary of Larimer County and Weld County groupings is provided in Figure 30
Figure 30. Regional Projected Employment Growth, 2031
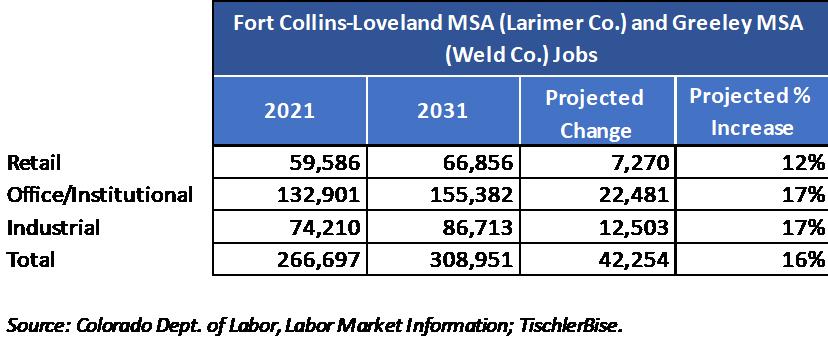
To project potential growth in Windsor, the above rates are applied to the same general land use groupings. A summary of Town jobs by general group for 2010 and 2019 10 is provided below.
Figure 31. Town of Windsor Employment by General Land Use Categories, 2010 and 2019
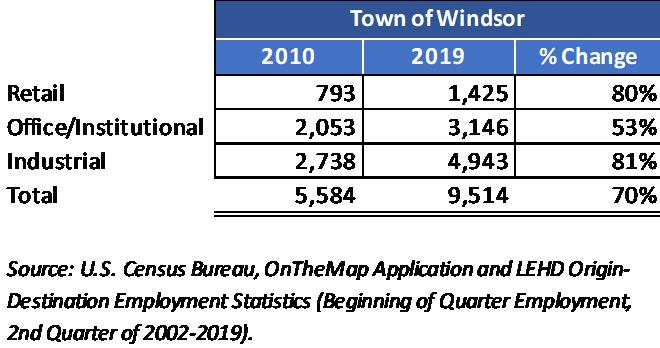
The above projected regional growth rates are applied to recent job figures in Windsor resulting in projections as shown in
10 At-place employment data for municipalities (sub-county level) is not reported as frequently as county-level data. A reliable source for sub-county data is U.S. Census OnTheMap Application; original projections are retained using 2019 data, which was the latest available at the time the projections were developed.
A-79 Existing Conditions Report | Page 37
Figure 32
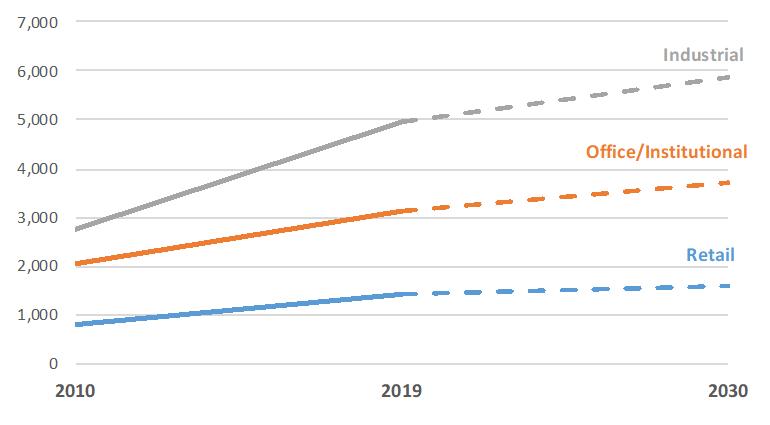
Source: U.S. Census Bureau, OnTheMap Application and LEHD Origin-Destination Employment Statistics; Colorado Dept. of Labor, Labor Market Information; TischlerBise.
Nonresidential Market Outlook
The Windsor market is relatively affluent with available land and good access. This presents an attractive location for nonresidential development, particularly retail. However, current regional competition may limit market potential and conditions nationally are characterized by uncertainty given the ongoing recovery from a global pandemic, likely impending recession, inflationary pressures, high interest rates, labor market challenges, and shifts in retail habits. These economic and financial conditions directly affect commercial real estate development.
Retail Market Outlook
• The retail sector (including restaurants and hospitality) has grown commensurately with other industries in Windsor. Regionally, the retail sector is projected to grow by 12 percent over the next 10 years. This amount of projected growth in retail jobs would translate to approximately 100,000 additional square feet of retail.
• Another approach to project potential retail demand in Windsor is to evaluate current retail square foot per capita and apply it to future population growth. TischlerBise estimates that Windsor has 20 square feet per capita today. 11 Assuming a continuation of this relationship, the projected population by 2030 of approximately 50,000 would generate demand for an additional 280,000 square feet.
• A final approach is to consult a third-party source for retail market information. ESRI Business Analyst produces market-based reports and projections for retail spending potential in Windsor. Although this is geographically neutral in other words, these needs could be met in any location, we can estimate the potential square footage needed to meet those demands.
• Some potential retail spending is assumed to occur online (see Figure 33), and other spending as tracked by ESRI does not require a physical location (e.g., financial investments). TischlerBise
11 Retail square footage was estimated using number of retail jobs in 2019 (1,616) multiplied by 450 square feet per employee (approximately 640,000 square feet) compared to 2019 estimated population of 33,000 to derive approximately 20 square feet per person. It is assumed that the current retail environment in Windsor accounts for online retail shopping.
A-80 WINDSOR COMPREHENSIVE PLAN | Existing Conditions Report | Page 39
Figure 32. Town of Windsor Employment Projections
adjusted the data for these attributes and projects demand for approximately 200,000 to 300,000 square feet of new retail space.
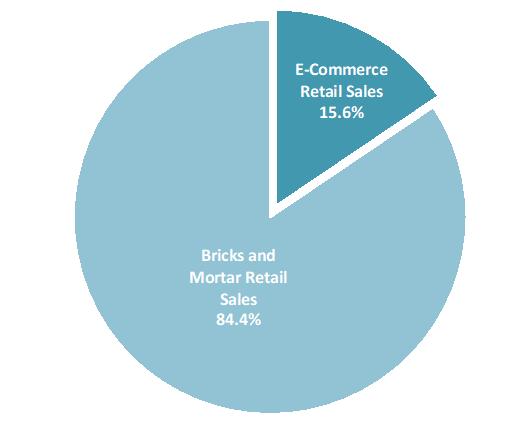
Source: Retail Indicators Branch, U.S. Census Bureau
Based on the above approaches, approximately 100,000 to 300,00 square feet of additional retail space is projected over the next 10 years.
Office / Industrial / Flex Space Market
The Town of Windsor has a robust industrial sector with existing and available property in 13 business/industrial parks. 12 As office markets continue to recalibrate after the COVID-19 pandemic, it is likely that there will be minimal demand for new office space in Windsor. Given employment projections (see
Figure 32), an additional 150,000 to 200,000 square feet is projected over the next 10 years.
Figure 32), an additional 150,000 to 200,000 square feet is projected over the next 10 years.
For industrial/flex space, given the town’s strength in this sector, employment is projected to grow by over 900 jobs in the next ten years, which could lead to an additional 600,000 to 1 million square feet, depending on the end user.
For industrial/flex space, given the town’s strength in this sector, employment is projected to grow by over 900 jobs in the next ten years, which could lead to an additional 600,000 to 1 million square feet, depending on the end user.
Advancing Opportunities through Windsor’s Comprehensive Plan
Advancing Opportunities through Windsor’s Comprehensive Plan
There is a demonstrated need for Windsor to create a sense of place for its community through economic activities, which are currently being lost to the areas surrounding Windsor. Although Windsor has been and will continue to experience rapid growth, visualizing goals and creating policies that enhance its regional and local economic identity will provide a diverse range of services for its residents and support community needs. Economic gaps that currently exist include retail and jobs that allow Windsor to live and work in the same community. Policies that address the links between local industry attraction and housing affordability should be considered to fill these gaps
There is a demonstrated need for Windsor to create a sense of place for its community through economic activities, which are currently being lost to the areas surrounding Windsor. Although Windsor has been and will continue to experience rapid growth, visualizing goals and creating policies that enhance its regional and local economic identity will provide a diverse range of services for its residents and support community needs. Economic gaps that currently exist include retail and jobs that allow Windsor to live and work in the same community. Policies that address the links between local industry attraction and housing affordability should be considered to fill these gaps
12 It is noted that some of Windsor’s business parks are for retail and recreation uses.
A-81 Existing Conditions Report | Page 40
Figure 33. E-Commerce Retail Sales Relative to Bricks and Mortar Spending,3rd Quarter 2023
4. LAND USE AND COMMUNITY CHARACTER
Overview
This chapter provides insight into the relationship between land use and community character and how their interactions have shaped the development of present-day Windsor. Community ideas and visions for the future are captured in the community perceptions. The Future Land Use Map (FLUM) is a visualization of the desired mix, character, and location of future land uses.
Current Plans and Policies
The 2016 Comprehensive Plan separates Land Use policies into three distinct categories: Growth and Development, Residential Areas, and Commercial and Industrial Areas.
Most Growth and Development policies are focused on providing services and supporting growth in areas that are already within the Town’s capacity, utilizing strategies such as infill development. Within Residential Areas, Windsor has prioritized creating connected, diverse neighborhoods through multi-modal connectivity and various housing types, including affordable housing and mixed-use. Additionally, conservation-design is integrated into any new development. For Commercial and Industrial areas, most policies aim to create a lively Downtown area and invest in commercial development that helps define Windsor’s character.
Community Perception
Community perceptions are focused on several key themes that were captured in Phase 1 Engagement. The main concern of respondents was cohesion and creating a more “complete” community rather than a “bedroom” community. Activities that would support a sense of place are a performing arts center, historic preservation, local events (farmer’s markets, public art, etc.), trail development, and small business growth. Respondents also felt that the Town could establish scenic areas and gateways that helped define the “small-town” character of Windsor, especially Highway 257 and 7th St. and New Liberty Rd. Overall, there is a desire to support the growth of the Town in a sustainable way. Planning decisions should add to Windsor’s small-town charm and enhance quality-of-life for residents, increasing its recognition as a family-friendly community.
Current Conditions and Trends
Current Comprehensive Plan Future Land Use Map (FLUM)
The FLUM in the Comprehensive Plan serves as a guide for the Town’s future land use and development decisions. The map, shown on the following page, generally follows parcels lines to categorize specific land uses, some of which align with the underlying built form. Other areas, however, have not been developed or fully built out and the land use categories are intended to serve as a guide and conceptual framework for the future.
A-82 WINDSOR COMPREHENSIVE PLAN | Existing Conditions Report | Page 42
of Current Comprehensive Plan Future Land Use
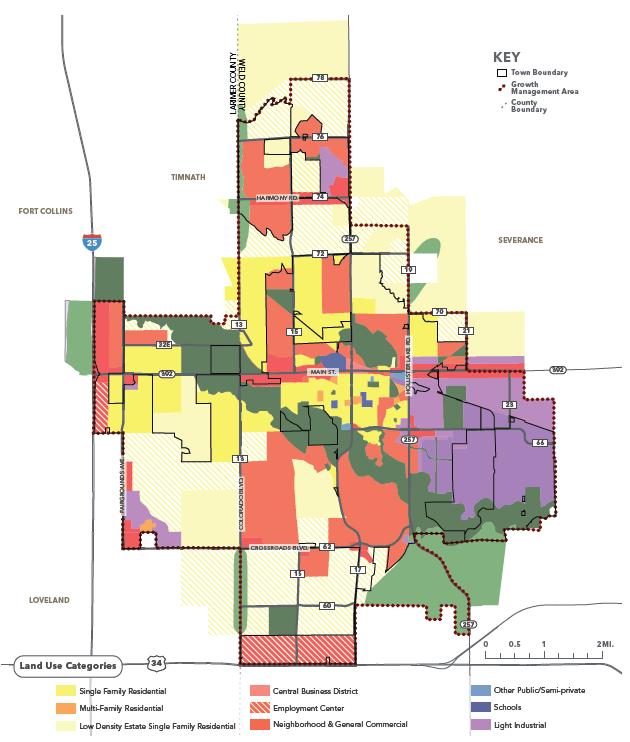
A-83 Existing Conditions Report | Page 43
Map
Undeveloped Parcels
While Windsor has grown significantly in recent decades, there is still opportunity for new development across the Town as indicated in the Undeveloped Parcels map below and the Undeveloped Parcels by Land Use Map on the following page.
The large parcels on the Town’s eastern boundaries, as shown on the following page, are designated as heavy and light industrial areas, making up a significant portion of the approximately 1,950 acres of undeveloped, industrial land across Windsor. Furthermore, approximately 542 acres of land identified for employment centers remains undeveloped along with approximately 538 acres of neighborhood and general commercial.
Given the high acreage of land designated for single-family housing across the Town, it is unsurprising that over 4,400 acres of undeveloped residentially designated land remains with an additional 1,172 acres of undeveloped land designated as residential mixed-use. The below on the following page and bar chart illustrates undeveloped parcels by land use in more detail
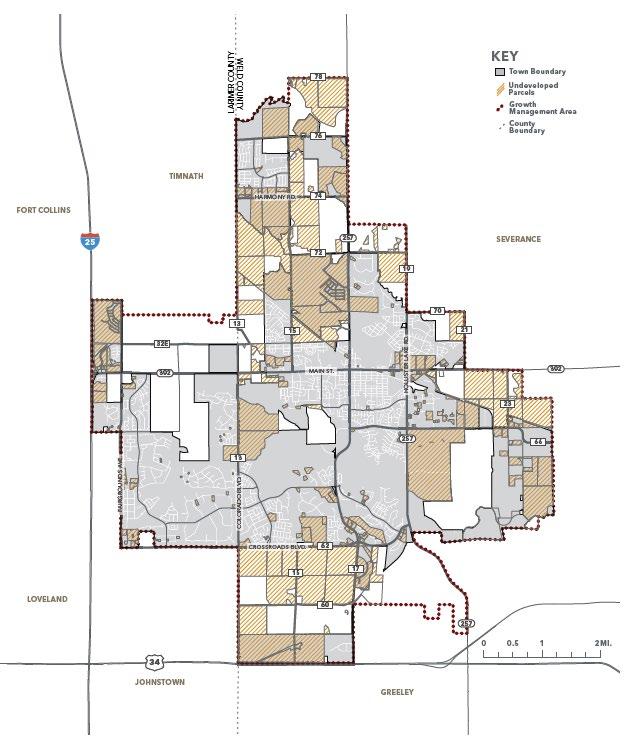
A-84 WINDSOR COMPREHENSIVE PLAN | Existing Conditions Report | Page 44
Undeveloped Parcels by Land Use
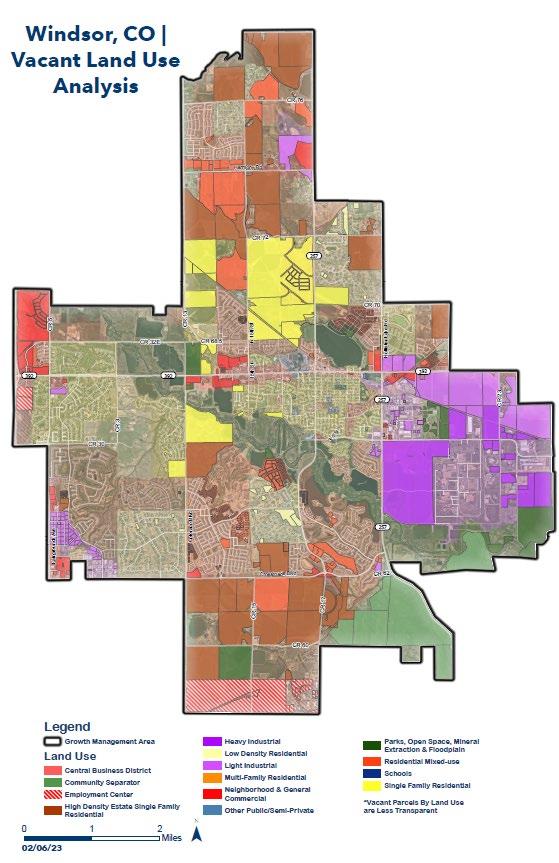
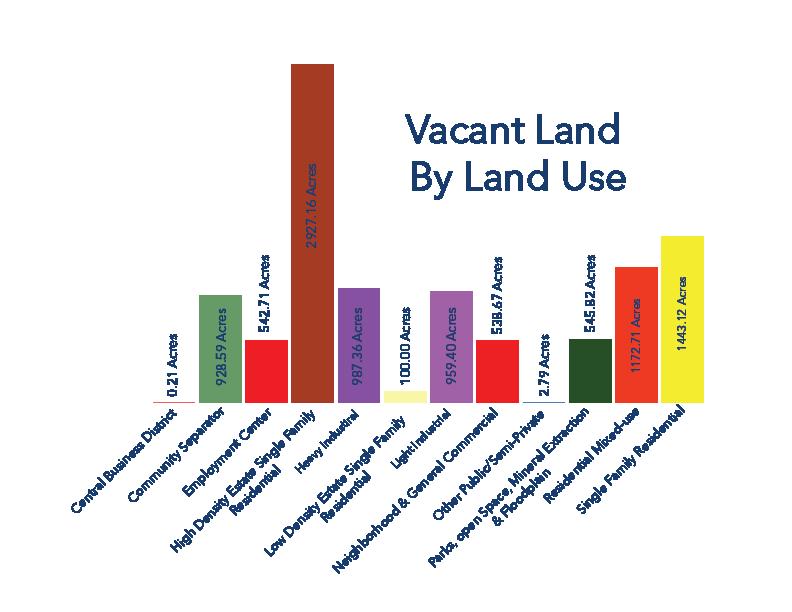
A-85 Existing
Report | Page 45
Conditions
Character Area Analysis
Windsor has experienced rapid growth in the last three decades that has transformed the 19th century agricultural and railroad town. From the Main Street and historic homes near Downtown, to newer subdivisions, the town encompasses a wide variety of special character areas.
This character analysis has identified nine different character types, the classification is based on their spatial attributes, street pattern, zoning, and land use. Spatial attributes include the height, sizes of buildings and lot, also the relationship between the buildings and street. The street pattern greatly influences connectivity, and major modes of transportation.
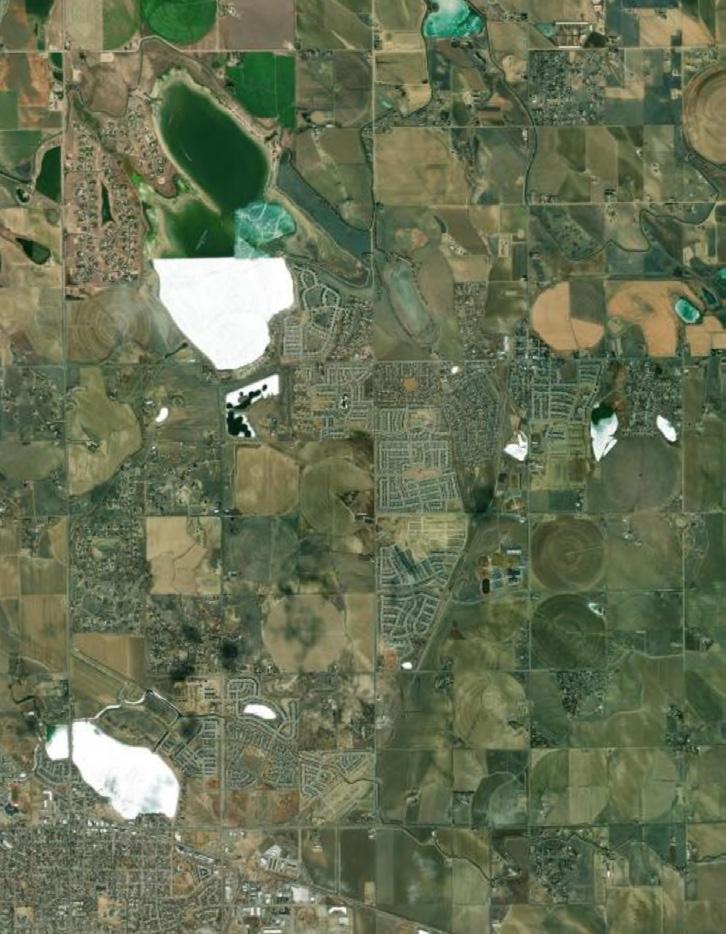
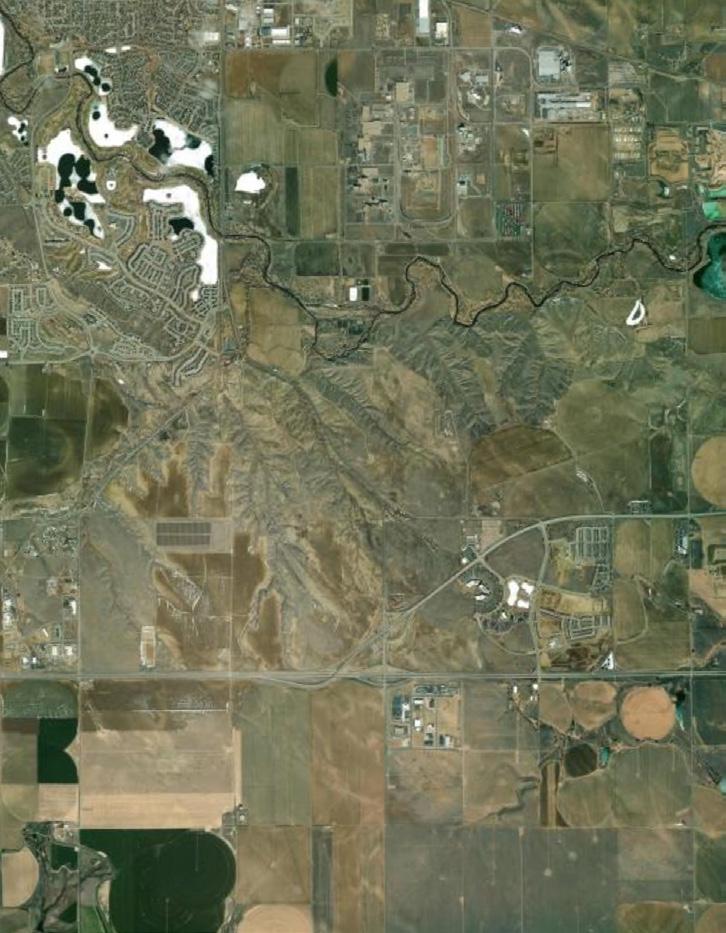
A-86 WINDSOR COMPREHENSIVE PLAN | Existing Conditions Report | Page 46
257 CR 62 CR 72 CR 64 75 CR 68.5 CR 19 CR 30 CR 76 CR 21 CR 60 CR 34C CR 3 CR 17 CR 70 CR 5 CR 23 CR 15 CR 13 CR 78 CR 32E 392 Harmony Rd Hollister Lake Rd Colorado Blvd 3rdSt Crossroads Blvd N 15th St Fairgrounds Ave 15th St 0 1 0.5 Miles Natural Edge and Open Space Light Industrial Heavy Industrial Commercial Corridor Institutional Emerging Growth Suburban Cluster Development Traditional Neighborhood Downtown Core Character Areas Growth Management Area Town Limit Waterbodies
Map of Character Types
Downtown Core
The downtown core of Windsor is near Windsor Lake. The Great Western Railway of Colorado runs through Downtown diagonally, creating a triangular space with 7th Street and Main Street. The downtown core has the highest concentration of restaurants, shops, and various services in town.
Traditional Neighborhood
Traditional neighborhoods surround Downtown and were mostly developed before 1970. These neighborhoods have smaller blocks and well-connected street networks. The land use is mostly singlefamily housing with amenities such as corner stores, schools, and religious institutions and are integrated with residential areas with services and jobs in the downtown core only a short walk away.
Cluster Development
This character area encompasses neighborhoods that arrange homes and developments in clusters to conserve open space, parks, or sensitive environmental areas. These neighborhoods typically have more public spaces and connected streets.
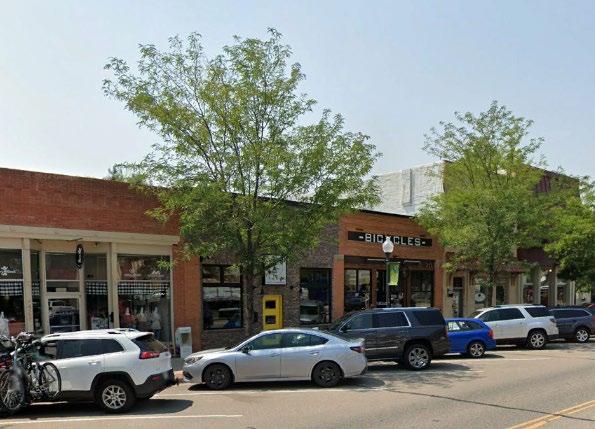
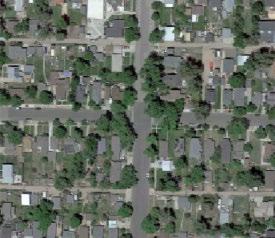
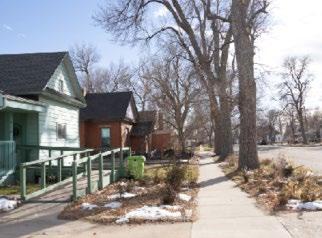
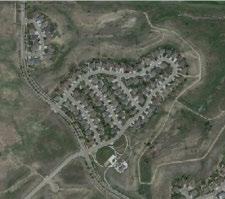
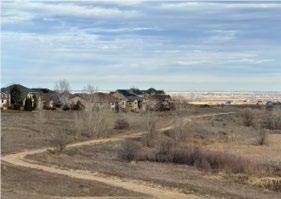
A-87 Existing Conditions Report | Page 47
Suburban
The suburban character type is the most common development pattern in the Town of Windsor. This type of development mostly consists of detached single-family homes, often as part of a planned subdivision and garages often face the street.
Emerging Growth
This character type refers to lands that are currently vacant or used for agricultural purposes. Current zoning allows for development with higher intensity and future growth is expected in these areas.
Institutional
The institutional character type covers civic and educational spaces such as the Windsor High School, police buildings, fire stations, Town Hall, and Windsor Community Recreation Center.
Corridor Commercial
Corridor commercial areas refer to retail and office developments that prioritize vehicular access and are usually located around major roads and corridors. The areas along Highway 392 outside of downtown currently have the highest concentration of corridor commercial developments.
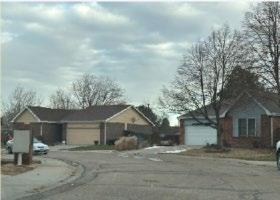
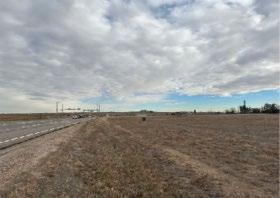
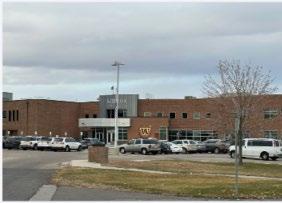
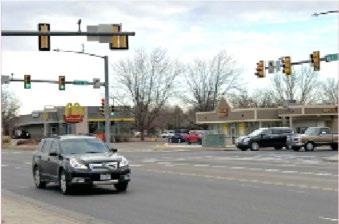
A-88 WINDSOR COMPREHENSIVE PLAN | Existing Conditions Report | Page 48
Heavy Industrial
Most of the heavy Industrial areas are in the eastern side of the town. The buildings and structures in this character area tend to occupy a bigger footprint and often have convenient access to major roadways and railroads.
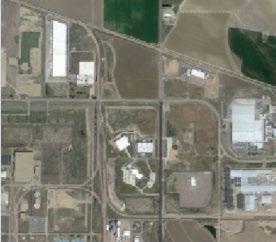
Light Industrial
Light industrial uses produce smaller consumer goods and include warehousing and research and development. These areas have less environmental impact than heavy industry. Factories tend to cluster together to form bigger light industrial zones and are usually separated from residential areas.
Natural Edge and Open Space
The natural edge and open space are lands conserved for parks, outdoor recreational, and ecological services. The riparian buffer along the Poudre River plays an important role in protecting biodiversity and water quality.
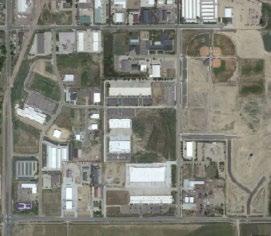
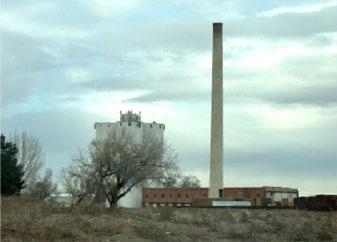
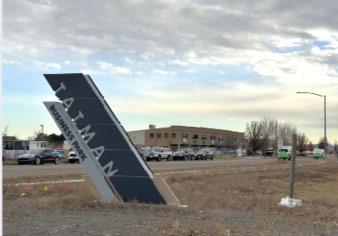
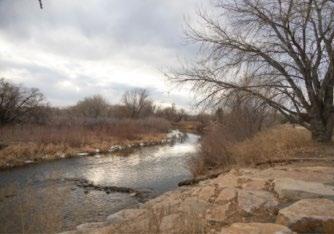
Advancing Opportunities through Windsor’s Comprehensive Plan
Windsor has many opportunities to develop areas that contribute to its desired character. Many of the 2016 Comprehensive Plan’s policies are still applicable to the Town’s aspirations and should continue to be pursued. Overall, future policy should address the creation of connected commercial and residential areas, especially Downtown. As Windsor grows, land use decisions and goals should focus on integrating the Town’s residential uses with other types of land uses that would benefit each community. Windsor can leverage access to natural areas or commercial areas to help define residential districts that contribute to the overall community character.
A-89 Existing Conditions Report | Page 49
5. TRANSPORTATION
Overview
Built on a traditional, rural county grid, Windsor is located southeast of Fort Collins, northwest of Greeley, and northeast of Loveland. As part of a network of communities with strong job hubs, Windsor has a growing multimodal transportation network, which provides effective options to travel both locally and regionally. However, as the town population has grown significantly over the past decade, planning for an efficient, comfortable, and convenient multimodal transportation network is becoming increasingly important. This transportation section highlights existing transportation-related infrastructure and programs, community perceptions of transportation needs, current conditions and trends, and opportunities for the Comprehensive Plan Update to further improve transportation in the Town of Windsor
Current Plans and Policies
This section summarizes existing transportation plans and policies including those in the 2020 Transportation Master Plan (TMP), Downtown Parking Study, and current Safe Routes to School program.
2020 Transportation Master Plan (TMP)
This document is Windsor’s first Transportation Master Plan. It assesses Windsor’s current conditions and outlines a guide for the community as it looks forward. Through the evaluation of existing conditions and extensive public outreach, the TMP sets the following vision statement: Windsor’s transportation system will serve all ages and abilities through a connected, multimodal network that is safe, equitable, efficient, comfortable, and intuitive. The TMP also outlines the following prioritized recommendations many of which the town has been implementing to fulfill the vision:
• Pedestrian and bicycle infrastructure improvements to enhance safety and connectivity
• Updating and prioritizing the 2017 Roadway Improvement Plan
• Supporting the Regional Greeley-Evans transit service
• Expanding and formalizing the Safe Routes to School Program
• Maintenance of vehicular, bicycle, and pedestrian facilities; prioritizing repaving and debris/snow removal
• Exploration of emerging mobility options, such as shared mobility, mobility as a service, and electric and autonomous vehicles
• Identification of internal and external funding sources to implement prioritized projects
• Annual tracking of TMP goals through performance metrics
Downtown Windsor Parking Plan
Adopted in July 2022, the Downtown Parking Plan outlines parking management strategies and recommendations to maximize the use of existing parking supply, better balance supply and demand, and reduce future parking demand. Strategies include increasing curbside capacity and implementing time limits for curbside parking, providing satellite parking and shuttles for events and peak periods, improving pedestrian/bicycle infrastructure and bicycle parking, establishing new off-street parking facilities and improving existing lots, installing additional wayfinding signage for parking, and revising the
A-90 WINDSOR COMPREHENSIVE PLAN | Existing Conditions Report | Page 50
Downtown parking code. Additionally, the plan recommends the creation of a parking management district to fund public realm improvements. As of November 2022, the Town of Windsor has identified over 361+ new downtown parking spaces.
Safe Routes to School (SRTS) Program
Although Windsor has already implemented several SRTS projects, the program is not formalized. Formalizing this program opens it up to more funding sources, as almost all funding for SRTS is distributed at the state level by CDOT. Additionally, the TMP identifies four high priority schools where more formalized SRTS programs could be implemented based on crash data, bicycle/pedestrian networks near schools, and survey results.
Community Perceptions
This section summarizes community input on transportation-related topics from two outreach efforts: the 2020 Transportation Master Plan, which had over 3,300 total points of engagement, and the Phase One Engagement of the current comprehensive plan update, which included a questionnaire and community interviews.
Overall, the public's concerns focus on issues such as congestion, safety, pedestrian and cyclist infrastructure, trail accessibility, infrastructure capacity, and parking availability. Addressing these concerns would involve implementing measures to alleviate congestion, enhance safety for all road users, improve pedestrian and cyclist crossings, expand trail connectivity, upgrade infrastructure, and provide adequate downtown parking solutions. Public input highlights the desire to reduce traffic, improve safety, enhance walkability and bike facilities, promote sustainability, and foster connectivity within and beyond Windsor. Community feedback also underscores the interest in staying informed about regional transportation initiatives and creating transportation systems that support both local and regional travel needs.
Current Conditions and Trends
This section details the current conditions and trends related to transportation in Windsor, including an evaluation of transportation costs, commuting patterns, and multimodal transportation options.
Transportation Costs
The Housing and Transportation Affordability Index (H+T Index), developed by the Center for Neighborhood Technology, uses 2020 regional data to understand the cost of housing and transportation for a typical household 13 and defines affordability as a combined housing and transportation cost of no more than 45% of household income. The index reports that a typical household in Windsor 14 spends 50% of their income on housing and transportation. Therefore, housing and transportation in Windsor is considered unaffordable for many residents and is slightly less affordable than the rest of Larimer and Weld Counties, which have H+T indexes of 48% and 47%, respectively, as shown in Figure 34.
13 https://htaindex.cnt.org/map/
14 The H+T Index is modeled for the regional typical household and uses data from 2020 (for all comparable communities).
A-91 Existing Conditions Report | Page 51
Source: Housing and Transportation Affordability Index
Windsor households also have the highest vehicle miles traveled (VMT) compared to neighboring communities (Error! Reference source not found.), and therefore high greenhouse gas emissions, with an average of 9.37 tons per household (H+T Index, 2020). These numbers could be different in a postCOVID world where a larger number of people work from home.
Comparison
Source: Housing and Transportation Affordability Index
Finally, the index provides a job access score based on access to jobs and the variety of employment types in the area. On a scale of 0 to 10 (0 representing the lowest job access and mix, 10 representing the highest job access and mix), Windsor’s score of 2.9 is lower than peer, neighboring communities of Erie, Loveland, and Ft. Collins (Figure 36).
A-92 WINDSOR COMPREHENSIVE PLAN | Existing Conditions Report | Page 52
Figure 35: Vehicle Miles Traveled
50% 48% 47% 45% 46% 47% 48% 49% 50% 51% 52%
22,254 21,670 18,441 16,293 15,000 16,000 17,000 18,000 19,000 20,000 21,000 22,000 23,000 24,000 25,000
Town of Windsor Larimer County Weld County
Windsor Erie Loveland Ft. Collins
Figure 34: Housing and Transportation Affordability Index Comparison
Source: Housing and Transportation Affordability Index
Commuting Patterns
Most Windsor residents are employed outside of the town (61.7%) (Figure 37). Further, a high percentage of people who work in Windsor live outside of Windsor. Only a small portion of the population (6.5%) both live and work within Windsor. The jobs-housing balance score is 0.96, which indicates that Windsor has more residential land uses than employment land uses. This is one of the causes of the high VMT in Windsor; the less jobs that residential communities have access to, the more people must travel for work, resulting in increased transportation and environmental costs
Figure 37: Commuting Patterns in and out of Windsor (2021)
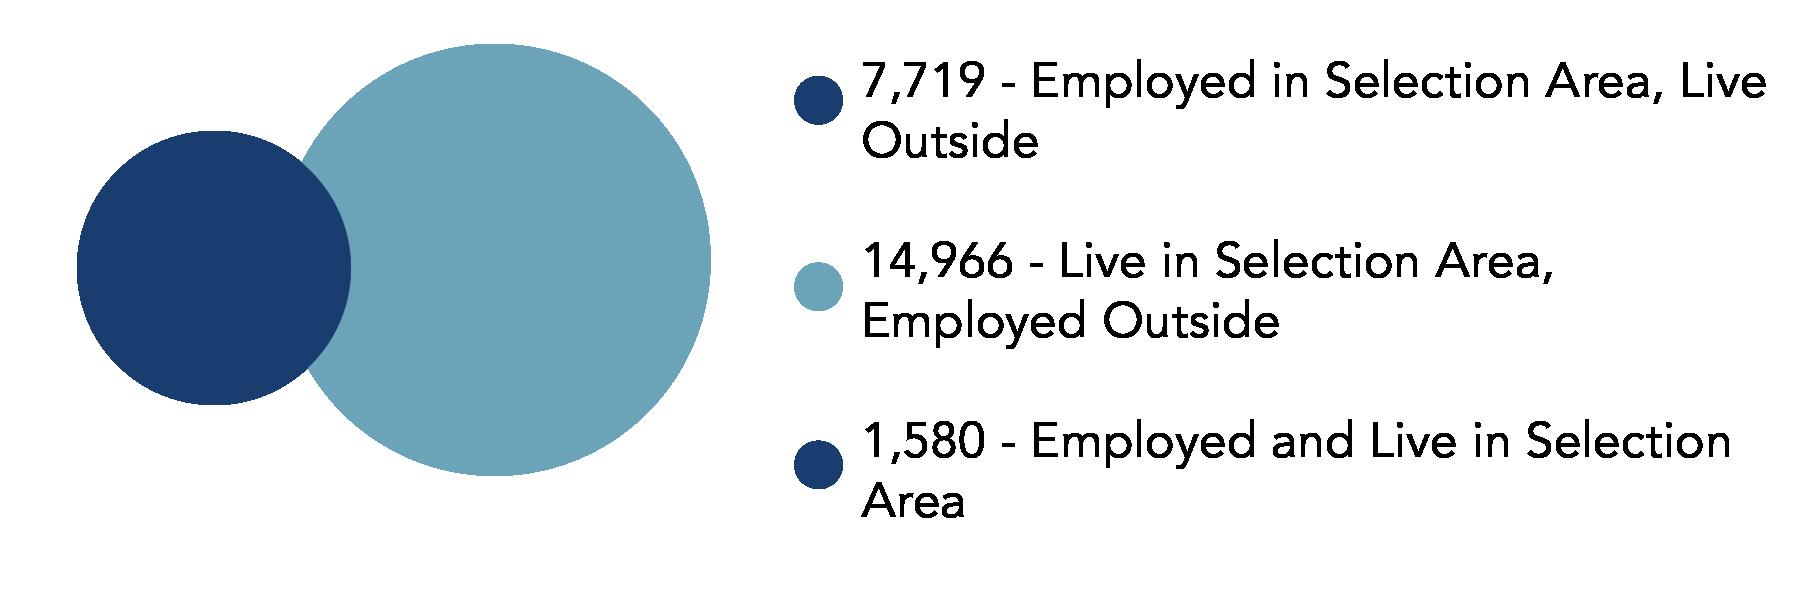
Source: LEHD, U.S Census
The largest portion of Windsor residents (49%) travel less than ten miles to work, and most residents travel less than 25 miles. About 11% of Windsor residents travel more than 50 miles to work. Most Windsor residents work in Fort Collins, Greeley, Loveland, and other communities along I-25.
A-93 Existing Conditions Report | Page 53
Figure 36: Job Access Score Comparison
2.9 3 4.3 5.7 0 1 2 3 4 5 6 Windsor Erie Loveland Ft. Collins
Most Windsor residents (75%) drive alone as their means of getting to work, but notably, a large portion of the population (18%) work from home (Error! Reference source not found.). There is limited data on Windsor-specific public transit usage, given its small sample size and new service.
Table 1: Mode of Transportation to Work (2022)
Source: U.S Census, ACS K200801: Means of Transportation to Work: 2022: ACS 5-year estimates
Mode of Transportation to Work (2022)
Multimodal Transportation Options
This section describes the existing multimodal transportation options in Windsor-- transit, walking, and biking.
Greeley Evans Transit (GET) is a dedicated commuter bus line connecting Greeley, Windsor, and Fort Collins and the only public transit provider in Windsor. The Poudre Express travels between Fort Collins and Greeley and is the only GET route with stops in Windsor The service launched in early 2020, and it currently runs seven round trips with service between 5:30 AM and 6:57 PM. The TMP recommends
A-94 WINDSOR COMPREHENSIVE PLAN | Existing Conditions Report | Page 54
Mode Population Percent of Population Drove Alone 12,869 74.9% Carpool 905 5.3% Public Transportation 25 .1% Bicycle, Walked, other 326 1.3% Work from Home 3,058 17.8%
75% 5% 0% 2% 18%
Drove Alone Carpool Public Transportation Bicycle, Walked, other Work from Home
educational campaigns to message to potential users of the Poudre Express. The TMP further recommends conducting public outreach to assess feasibility of an on-demand transit service and investing in high quality bus stop amenities and infrastructure that accommodates all modes of transportation connecting with transit.
Windsor has an extensive existing trail network with a few on-street bicycle facilities The 2020 TMP guides the completion of this network, stating that although the multimodal network itself is extensive, it lacks direct and convenient connections to key destinations and primarily serves recreational biking and walking. The walk and bike scores, according to walkscore.com, are 25 and 39, respectively. Both scores signify that Windsor is car-dependent and lacks infrastructure that is supportive of people biking and walking. To address this, the TMP proposes completion of the low-stress bicycle network and implementation of a bicycle wayfinding program. It also proposes a pedestrian program with dedicated funding to build out Windsor’s sidewalk network and upgrade deficient sidewalks by 2040. Finally, the TMP recommends that the town adopt an ordinance that regulates block length, dead ends, and cul-desacs to improve walkability and connectivity. Since the adoption of the TMP, the Town has incorporated language in their Land Use Code to reduce the length of blocks, improve street connectivity, and to reduce the occurrence of cul-de-sacs in new development.
Filling in gaps in infrastructure can lead to a more economically vital town with a high quality of life, as more people may have access to, from, and within the Town of Windsor. By filling in gaps in bicycle and pedestrian network and increase land use density and mix, Windsor can improve walkability and bikeability for transportation. As discussed previously, Windsor’s VMT is high, yet at the same time, there is a large portion of the population that works from home. A multimodal network can also support people who are seeking to travel within the Town of Windsor for non-commute trips.
Advancing Opportunities through Windsor’s Comprehensive Plan
There are key opportunities that the Comprehensive Plan can recommend moving Windsor towards the 2020 TMP’s vision a transportation system that serves all ages and abilities through a connected, multimodal network that is safe, equitable, efficient, comfortable, and intuitive.
Codify TMP Recommendations as Policies
Given the recent investment in the development of the 2020 Transportation Master Plan, the Comprehensive Plan should prioritize codifying the TMP recommendations as policies, where appropriate.
Coordinate Transportation and Land-Use
Land use has a direct impact on transportation costs and needs. As mentioned previously, the jobhousing balance favors housing over jobs in Windsor, resulting in a high demand for transportation. If land use more directly supports employment centers, more people can live and work in Windsor, resulting in shorter trip lengths. This would balance out the jobs-housing balance, and therefore decrease household transportation costs, decrease environmental impacts, and increase residents’ quality of life, as they can live, work, and play within Windsor. There are specific locations within the Town that if developed may also open regional transportation options. In particular, opportunities exist at the i-25 Commercial Activity Center, which could help connect the Town to the Bustang, and open future transit options for the community.
A-95 Existing Conditions Report | Page 55
Further, developing policies, programs, and practices to promote the orientation of development around the transportation network can result in better connections and less reliance on a personal vehicle when traveling throughout Windsor. For example, dense development around transit stops can make transit a more viable option by reducing the first/last mile gap. Connecting key bicycle, pedestrian, and transit networks to parks, commercial centers, and employment centers will greatly shorten trips and encourage use of alternative modes of transportation.
Improve Transit Service
Increase Transit Frequency
The existing GET service is a beneficial connection, especially with so many Windsor residents working in Greeley or Fort Collins. There are two main ways the Comprehensive Plan should consider expanding this service:
• Increase the frequency of the route- This will improve the flexibility for riders and reduce wait time
• Evaluate if stops are optimally located, based on Windsor travel patterns and increase the number of destinations that can be reached via transit- An analysis of travel patterns through LEHD on the Map (Error! Reference source not found.) display Loveland and other communities along I-25 as employment centers for Windsor residents. A transit system which aligns with the origins and destinations will encourage multimodal transportation.
Improve Transit Coverage
Transit coverage could be enhanced through a microtransit service. Microtransit is a form of demandresponse transit using a smartphone app to match trip requests in real-time. It typically uses small vans or shuttle buses and can operate as a dynamic route with established time points or be point-to-point within a defined area. Microtransit can also allow riders to have the vehicle stop at any point along a route (flag stops).
Microtransit could be beneficial in transporting people within Windsor for short trips such as to the grocery store or community centers without having to rely on a personal vehicle. It can also act as a first/last mile connection between existing Poudre Express regional transit stops and riders’ destinations, encouraging the use of public transportation.
Increase Bicycle and Pedestrian Infrastructure
The following recommendations from the 2020 Transportation Master Plan provide opportunities to add connections in the multimodal network.
• Complete 1,000 feet of missing sidewalk gaps a year
• Implement at least one enhanced pedestrian crossing per year
• Complete the low-stress bicycle network
• Implement bicycle/pedestrian cut-thrus to connect dead ends and cul-de-sacs
The implementation of these recommendations can significantly help in the following ways:
A-96 WINDSOR COMPREHENSIVE PLAN | Existing Conditions Report | Page 56
• Investing in locations with high rates of bicycle and pedestrian-involved crashes will improve real and perceived safety.
• Constructing accessible and connected multimodal facilities will make it convenient for residents, employees, and visitors to utilize alternative forms of transportation.
• Connecting bicycle and pedestrian networks with key destinations such as recreation, commercial, and employment will promote walking and biking for transportation to supplement the high rate of recreational trips.
A-97 Existing Conditions Report | Page 57
6. WATER EFFICIENCY
Overview
Understanding current water-related issues and conditions will be critical to guiding Windsor into the future in a responsible and forward-thinking manner. Water supplies that serve municipalities in the Front Range are limited and are increasingly stretched to meet the demands of growing communities. Windsor is no exception and has long relied solely on the Colorado Big Thompson (CBT) project for all of its raw water.
Overall, the key issues revolve around water availability, efficiency, and infrastructure, while the opportunities lie in implementing water-saving practices, investing in storage solutions, and improving water management policies and treatment methods.
Current Policies and Plans in Place
There are several plans and studies that help guide the future development of water supplies and efficiency efforts in Windsor to help ensure adequate long-term supplies meet long-term growth goals and projections. Relevant plans include:
• The Town of Windsor’s 2015 Municipal Water Efficiency Plan was developed in accordance with the Water Conservation Act of 2004 and the Colorado Revised Statute section 37-60-126. The plan outlines the goals, strategies, and measures to improve water efficiency and reduce water demand in Windsor.
• 2021 Drought Management Plan guides the Town in assessing future drought conditions and preparing a response program to mitigate impacts to the Town’s treated water supply in times of drought. Windsor recognizes that drought planning is crucial as the Town continues to grow and new water supplies become more competitive among municipalities. The Drought Management Plan establishes the following order to prioritize water uses during drought periods and in mitigation efforts. 1. Health and safety 2. Economic impacts 3. Outdoor use.
• The 2009 Potable Water Master Plan recommended several solutions for diversification and correctly identified conservation efforts as a key component of the Town’s long term water plan.
• The 2016 Comprehensive Plan suggested enhanced stormwater practices to improve local water quality and encouraged the Town to consider its own water utility to maintain water “independence.”
• 2003 Non-Potable Water Ordinance requires secondary water systems for irrigation of new residential development. Construction of non-potable secondary water systems are a condition of annexation and subdivision
Community Perceptions
Public input from Phase 1 and 2 indicated an interest in water efficiencies. Public comments express concerns about water availability constraints and a desire to improve water efficiency in new developments. Residents are interested in implementing low water use landscape alternatives, such as native plants, to lower water consumption while maintaining attractive landscapes. There is an interest in enforcing more efficient water usage in commercial development and making the use of non-potable water for irrigation a requirement in new subdivisions The Town Subdivision Ordinance already requires new subdivisions in special (feasible) areas in the Town GMA to construct non-potable secondary water
A-98 WINDSOR COMPREHENSIVE PLAN | Existing Conditions Report | Page 58
systems as a condition of development approval. The definition for feasibility may change over time as the Town grows and as the concern for water conservation evolves. For some, the goal is to achieve 100% non-potable water use in parks and private property irrigation. Suggestions were made to identify investment opportunities for water storage and to expand sanitary sewer capacity, particularly up to Harmony Rd., to facilitate further development. Lastly, there is a call to enhance the Town's autonomy through improved water policies and local water treatment.
Current Conditions and Trends
Big Picture Water Source Development
Like other Colorado Front Range municipalities, Windsor is faced with the challenges of meeting water demands associated with significant anticipated growth. Water sources that are available to Windsor are shared with other communities in the region.
The Town of Windsor obtains its water rights from two sources: the Colorado Big Thompson (CBT) and the North Poudre Irrigation Company. The CBT project delivers water from the western slope of the Rocky Mountains to the eastern plains through a series of reservoirs, canals, and tunnels. The North Poudre Irrigation Company operates a network of reservoirs and ditches that divert water from the Cache la Poudre River. Windsor also has some groundwater wells that provide backup water supply in case of emergencies.
The Town of Windsor receives its treated potable water from three separate water providers: Fort Collins-Loveland Water District (FCLWD), North Weld County Water District (NWCWD), and the City of Greeley (Greeley). The Town pays different rates to each provider based on their contracts and annual water transfers.
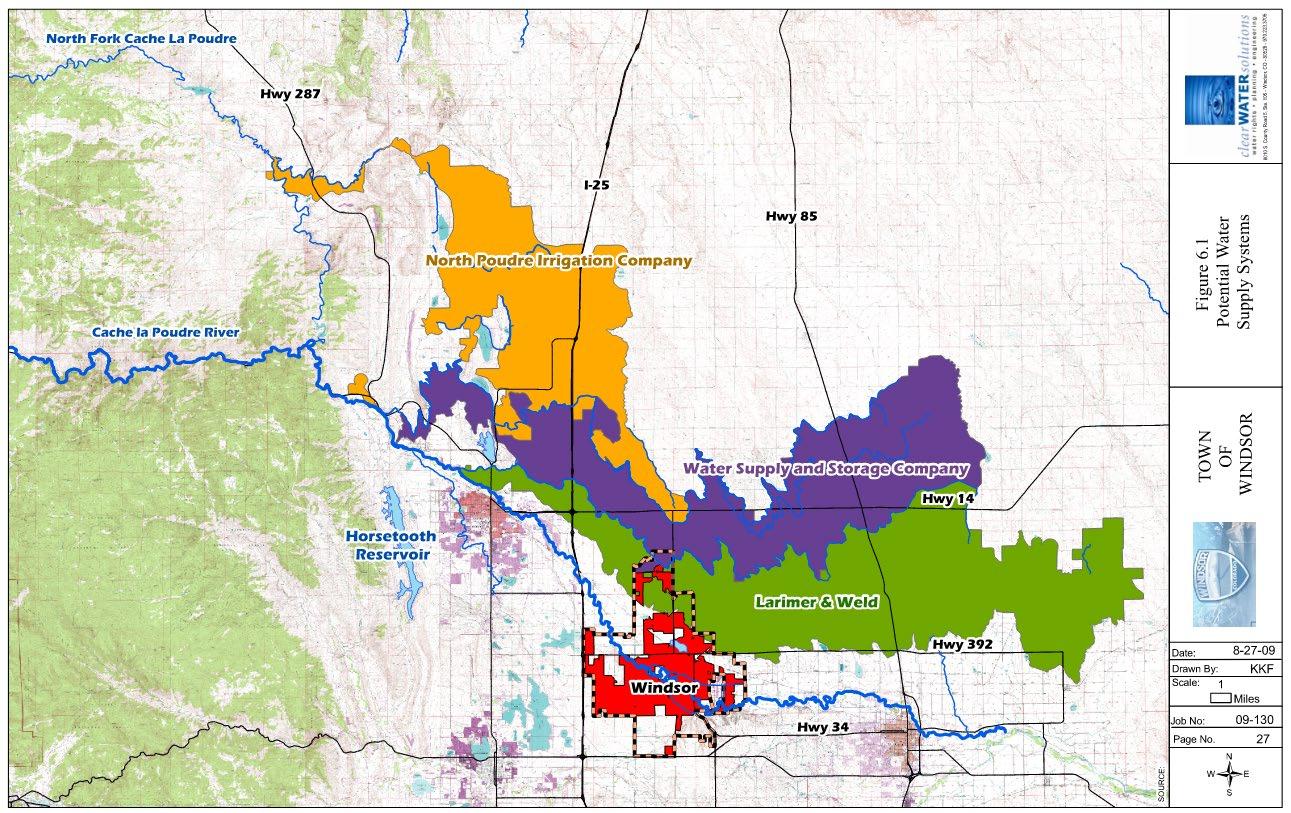
A-99 Existing Conditions Report | Page 59
Water is used for various purposes, such as domestic, commercial, industrial, agricultural, and recreational. According to the 2019 Consumer Confidence Report, Windsor delivered about 1.8 billion gallons of potable water to its customers in 2019, with an average daily demand of 4.9 million gallons. The Town also has required non-potable water for irrigation of parks, open spaces, golf courses, and some residential areas. The Town has a water conservation program that offers education, incentives, and regulations to encourage efficient water use among its customers.
The Town faces some challenges in managing its water resources:
• Meeting the increasing demand from population growth
• Ensuring adequate water quality and quantity
• Adapting to climate variability and change
• Protecting watershed health and ecosystem services
• Coordinating with other water providers and stakeholders in the region
Efforts to increase water efficiency are key factors in the long-term management of available water supplies. The Town of Windsor’s efforts to maximize water use include installing water efficient appliances, enforcing lawn watering restrictions, using irrigation system rain sensors, detecting and repairing water leaks, and promoting xeriscape gardening.
The benefits of water efficiency for Windsor and its residents include saving money on water bills, preserving the environment and wildlife habitats, enhancing the quality of life and recreation opportunities, and ensuring a secure and reliable water supply for the future.
Windsor is exploring several options to increase its water supply and treatment capacity in the future. Some of these options are:
• Participating in the Northern Integrated Supply Project (NISP), which is a regional project that would create two new reservoirs to supply water to 15 northern Colorado communities. The project would provide Windsor with an additional 3,300 acre-feet of water per year. A record of decision was approved in 2023. Although opposition came from some environmental groups who were concerned about its impacts on the Poudre River ecosystem.
• Building a regional water treatment plant with Severance, Eaton, and the Fort Collins-Loveland Water District. The plant would be located east of Interstate 25 and north of Colo. 14. The plant would cost about $25 million for Windsor’s portion and would give Windsor more control over its own water treatment process. However, the plant would require finding enough water to treat to justify the cost.
Water Rights Dedication and Allocation for Various Land Use Types
Integral to a water efficiency plan is the proper allocation of water dedication for various use and property types. Ensuring that dedication amounts and costs reasonably represent site usage allows the Town to maintain a robust water portfolio while not unduly burdening property owners. Windsor currently has a simple, straightforward water dedication policy for residential properties that is relatively well matched to actual water use in Colorado. Water dedication and development is smoothly
A-100 WINDSOR COMPREHENSIVE PLAN | Existing Conditions Report | Page 60
implemented when clear, rational water dedication policies, for a variety of land planning options are provided
Currently, indoor water use dedication is divided into two categories: single family and multi-family. Windsor may consider expanding to specifically identify a number of lot types and residential options. This will provide clarity for developers as they create new or unique housing types to meet future needs and demands.
Exterior, irrigation water use dedication is categorized by potable and non-potable Current dedication requirements call for 3 acre-feet (AF) per acre of landscape area This requires a significant overdedication of water for non-turf grass related materials.
Colorado landscape design, as well as Town of Windsor landscape recommendations, emphasize the use of native, adaptive, and drought tolerant plant materials. There is a current contradiction in the dedication requirement and native plant material focus. The Town will likely be called upon to provide an incentive to use native plant materials through a reduction in required irrigation water dedication.
There is broad ability for the Town to review unique projects and assess irrigation water demand on a per project basis through custom site irrigation water demand. The Town may consider providing a published mechanism for residents and developers to run budgetary water use calculations. It will be important to see clear instructions for industrial, commercial, and various residential types.
Water Rates
The Town charges its customers a monthly base rate and a tiered volumetric rate for potable water use. The Town also owns shares in several ditch companies which it uses for non-potable irrigation of some of the Town parks and open spaces. The non-potable irrigation system is separate from the treated water system and has different rates and billing methods. Some neighborhoods in Windsor have a flat rate per home for non-potable water use, while others charge for usage. For example, Windshire Park Metro District charges a flat rate of $252 per year for non-potable water use, while Water Valley Metro District charges a monthly base rate of $15 and a volumetric rate of $0.75 per 1,000 gallons. Nonpotable water rates cover the costs of water rights, expected usage, operational costs, and reserves for system repairs.
The Town has a tiered system of pricing with a clear threshold description in place.
Time-of-use pricing is a mechanism for driving water efficiency that is not commonly used for water pricing but may be a strategy for further investigation. According to the Organization for Economic CoOperation and Development (OECD), putting the right price on water will encourage people to waste less, pollute less, and invest more in water infrastructure.
Design Requirements & Incentives
The Town currently offers incentives for installing efficient irrigation systems and offers a High-Efficiency Irrigation Rebate which allows residents to upgrade an existing irrigation system with high efficiency spray nozzles, rain sensors and/or smart controllers and receive up to $500.
Additionally, the Town of Windsor is partnering with Resource Central to offer a $25 discount to Windsor Utility customers on Garden In A Box kits. These pre-designed kits are tailored to Colorado soil
A-101 Existing Conditions Report | Page 61
and include simple plant-by-number maps. Residents can visit ResourceCentral.org/Gardens to order a water-wise Garden in A Box
Residents may take advantage of a grant program which supports efforts to improve water efficiency sponsored by Northern Water. This is a collaborative water-efficient landscape grant program to promote water-efficient, Colorado climate-friendly landscapes The program is open to new or redeveloping landscapes at public or private facilities, including cities, enterprises, non-profits, businesses, schools, multi-family complexes and HOA-managed landscapes. The facilities must be located within Northern Water’s boundaries.
Technology Use
The Town has taken steps to maximize water conservation using proven practices and technologies, including the following:
• Installation of water-efficient appliances and irrigation systems at town facilities
• Lawn watering restrictions (no watering from 10 am-6 pm daily)
• Use of irrigation system rain sensors and ET based scheduling
• Detection of water leaks and repair
• Establishment of a xeriscape garden to assist residents to understand and implement water saving landscapes and related technologies
The benefits of promoting water conserving technologies and practices include reducing infrastructures costs and ensuring that it can meet future needs, reducing water waste and pollution, and allowing for future town development and growth.
Installation Requirements
The Town of Windsor has established standards and specifications for irrigation system installation, which are part of its construction standards and specifications for water and sewer systems. These standards generally comply with typical industry guidelines. The standards include the following general guidelines:
• The non-potable distribution system in all areas shall be designed to have a maximum static head of 100 psi and a minimum static head of 60 psi.
• The irrigation system shall be designed to provide adequate pressure and flow for the intended use, and shall include pressure reducing valves, backflow prevention devices, flow meters, isolation valves, and other appurtenances as required.
• The irrigation system shall be installed in accordance with the manufacturer's recommendations and the town's specifications. The contractor shall provide a warranty for the materials and workmanship of the irrigation system for one year after acceptance by the Town.
• The irrigation system shall be tested for leaks and proper operation before acceptance by the town. The contractor shall provide a test report to the town engineer showing the results of the pressure and flow tests.
A-102 WINDSOR COMPREHENSIVE PLAN | Existing Conditions Report | Page 62
• The irrigation system shall be operated and maintained by the property owner or a designated entity. The owner or entity shall comply with the Town's water conservation program and watering restrictions.
Long Term Monitoring, Management, and Enforcement
Water conservation and management practices in Northern Colorado are important for ensuring the efficient and sustainable use of water resources in the region. Some of the practices include:
• Using best management practices (BMPs) to reduce water consumption and protect water resources and the natural environment. BMPs are recommended voluntary practices for residential, business, agricultural, commercial, and industrial applications. They include design, installation, and maintenance/operation tools and practices that support water efficiency and quality within various sectors.
• Participating in regional water projects that aim to increase water supply and storage for multiple communities. For example, the Northern Integrated Supply Project (NISP) is a regional project that would create two new reservoirs to supply water to 15 northern Colorado communities, including Windsor. The project would provide additional water for municipal and agricultural uses, as well as environmental and recreational benefits.
• Implementing water conservation programs that offer education, incentives, and regulations to encourage efficient water use among customers. For example, Windsor has a water conservation program that provides rebates for installing water-efficient appliances, fixtures, and landscapes; offers free irrigation audits and workshops; and enforces watering restrictions and drought response plans.
• Collaborating with other water providers and stakeholders in the region to coordinate water planning and management. For example, Windsor is exploring the option of building a regional water treatment plant with Severance, Eaton, and the Fort Collins-Loveland Water District. The plant would give Windsor more control over its own water treatment process and reduce its reliance on other sources.
Advancing Opportunities through Windsor’s Comprehensive Plan
The Comprehensive Plan Update can strengthen existing water efficiency policies and introduce new strategies to efficiently use and manage the Town’s water supply in the future. By incorporating these opportunities below into the Comprehensive Plan, Windsor can effectively utilize the Northern Integrated Water Supply Project, accommodate diverse residential options, assess irrigation water demand on a case-by-case basis, provide tools for water use calculations, and establish monitoring and enforcement mechanisms to ensure long-term water sustainability.
1. Northern Integrated Water Supply Project (NISP): The Town of Windsor's involvement in NISP presents an opportunity to secure 3,300 acre-feet of raw water, supporting the Town's growth. The Comprehensive Plan can include strategies to effectively utilize this water supply and integrate it into future development plans.
2. Expansion of Indoor Water Use Categories: The current division of indoor water use dedication into single-family and multi-family categories can be expanded to include additional lot types
A-103 Existing Conditions Report | Page 63
and residential options. This expansion would provide clarity for developers as they create new or unique housing types to meet future demands.
3. Custom Site Irrigation Water Demand Assessment: The Comprehensive Plan can outline a mechanism for the Town to review unique projects and assess irrigation water demand on a per-project basis. This approach would enable tailored evaluation and ensure efficient water use in different development scenarios.
4. Published Mechanism for Water Use Calculations: The Town may consider providing a published mechanism for residents and developers to run budgetary water use calculations. This tool would assist in planning and decision-making, offering clarity on water use requirements for industrial, commercial, and various residential types.
5. Monitoring and Enforcement of Long-Term Water Use: The Plan can incorporate measures for monitoring and enforcing adherence to long-term water use allocations. This proactive approach goes beyond passive incentives, such as tiered water rate structures, and ensures sustainable water management practices in the community.
A-104 WINDSOR COMPREHENSIVE PLAN | Existing Conditions Report | Page 64
7. INFRASTRUCTURE SYSTEMS
Overview
While today’s water, wastewater, stormwater, and broadband infrastructure is currently meeting demand, it is based on old models that would require updating. Given that much of Windsor's development has been recently built, much of its infrastructure has not required major renovation or replacement. However, as the Town continues to age, it must continue to include the full life cycle cost (i.e., maintenance and repair) of infrastructure systems in their budgets. This is of particular importance for the broadband efforts the Town is currently undertaking to provide access to service in underserved areas. Today’s stormwater, sewer, and water rates do include life cycle costs and they undergo a fee study every 5 years.
Current Plans and Policies
The Town’s Potable Water Master Plan was adopted in 2009, but with a growing population and regional water projects in the works, the document must be updated to consider other realities and opportunities.
The Town has a Master Drainage Plan (Addendum 2018) and Storm Drainage Criteria (2020) that is referenced to create Capital Improvement Plans (CIPs) and to incorporate into new development.
The Town of Windsor and City of Greeley partnered to conduct a Broadband Feasibility Study to determine the need, feasibility, and recommendations regarding broadband Internet services for Windsor and Greeley residents. The study helped identify several recommendations for improving broadband availability and speeds identifying potential levels of investment for consideration and options available for increased levels of service.
Community Perceptions
Public input from Phase 1 and 2 indicated an interest in efficient and high-quality infrastructure. There is a concern that growth is outpacing the investment in infrastructure. The community feedback shows support for capitalizing on existing infrastructure, improving what we have, and filling in growth around that infrastructure. Generally, community members are not aware of the total costs associated with development, but there is a preference that new growth pays for itself and doesn’t push the cost onto existing residents. There is also support to put infrastructure in place to continue to accommodate growth and development.
Current Conditions and Trends
Infrastructure Costs
The cost of infrastructure is linked to the spatial distribution and maintenance of each system. The spatially linked costs that Windsor is responsible for are mostly tied to infrastructure systems like roads, water, sewer, and stormwater systems. Significantly, these systems are directly connected to Windsor’s development patterns. Certain land use and development types require more expansive infrastructure networks to support them than others. Some land use types generate more tax revenue than others. Matching costs with revenues give a more complete picture of Windsor’s fiscal health and can help identify areas of Windsor that cover their costs versus those that do not.
A-105 Existing Conditions Report | Page 65
ROADS


•Windsor maintains approximately 601 lane miles of road.
•The annual cost of maintanance is estimated around $16.2 million
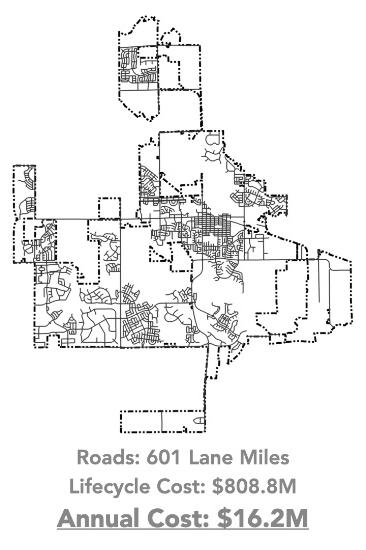
Source: Urban3
WATER

•Windsor maintains approximately 170 miles of water pipe and thousands of other water system components.
•The annual cost of maintainance is estimated around $9.5 million.
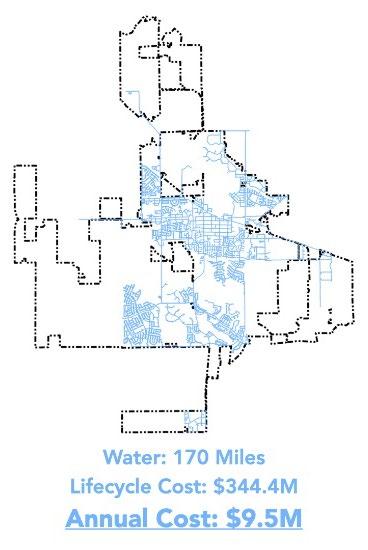
SEWER/WASTEWATER

•Windsor maintains approximately 138 miles of sewer pipe and thousands of other sewer system components.
•The annual cost of maintainance is estimated around $6.3 million.
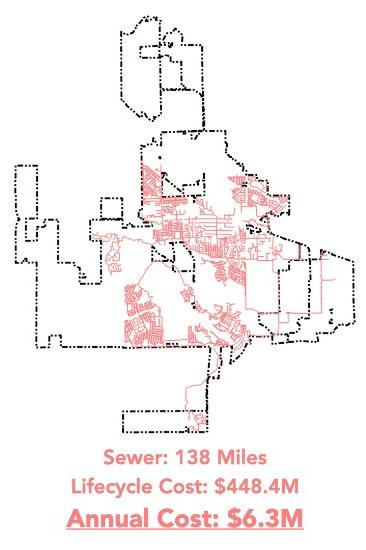
STORMWATER

•Windsor maintains approximately 86 miles of stormwater ditches, culverts, and pipes.
•The annual cost of maintainence is estimated around $1.6 million.
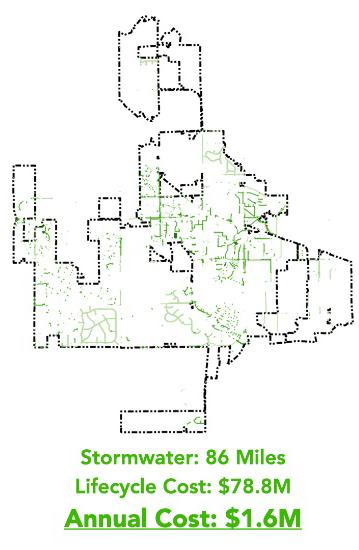
The four main infrastructure systems that Windsor is responsible for are roads, water, sewer, and stormwater. Water, sewer, and stormwater are different from roads in that they are each financially managed by a dedicated fund. There is a water fund, a sewer fund, and a storm drainage fund. Additionally, since these three systems are classified as utilities, they are able to directly charge consumers who use their services. The charges for services, in addition to other more minor revenue streams, should cover the costs of operating and maintaining these systems.
Roads, however, do not have a dedicated fund that manages the operations and maintenance of the system. Windsor’s road system is managed by Public Works and Engineering, which falls under the General Fund, along with many other government departments like Police, Recreation, and Planning. The roads system receives significant funding for improvements and expansion from the Capital Improvement Fund, along with other general government departments when they make larger, longterm investments. These two funds help support the road system to ensure it is well-maintained and meets the needs of the community.
Using spatial data and collaborating with Town Staff, the consulting firm, Urban3, was able to map these systems and estimate their lifecycle cost. It is important to point out the difference between lifecycle cost and replacement cost. Replacement cost only considers the amount needed to rebuild a system but
A-106 WINDSOR COMPREHENSIVE PLAN | Existing Conditions Report | Page 66
does not account for the ongoing maintenance needed to keep a system in good repair and functioning effectively as long as possible before replacing it.
The lifecycle costs for each system are described along with maps showing the extent of each system. By distributing these costs spatially and comparing them to the revenues, it is possible to identify the net revenue or cost generated across the town. By comparing areas in Windsor that have different development patterns, we can see how the net revenue or cost varies depending on how land is used.
Water Infrastructure
As discussed in the previous chapter, Windsor obtains its water rights from two sources: the Colorado Big Thompson (CBT) and the North Poudre Irrigation Company. There are three separate water providers serving the Town of Windsor: North Weld County Water District, the City of Greeley, and Fort Collins-Loveland Water District.
Town of Windsor water flows through 170 miles of pipelines and is stored in two water tanks. One holds 2 million gallons and the other holds 3 million gallons. Today, Windsor uses approximately 3.1 million gallons of water each day. Although the Town does not own a water treatment plant, the Town has the delivery system capacity and water rights to service current demand. However, models are based on historic land use maps and therefore, any change in densities in the future land use map may require system upgrades.
Stormwater Infrastructure
The Town’s current policy requires development to detain 100-year events and discharge at 10-year historic rates. Windsor has been designated by the Colorado Department of Public Health and Environment (CDPHE) as a Municipal Separate Storm Sewer System (MS4) municipality. This requires the Town to manage runoff from rain and snowmelt in the cleanest way possible. While water from the sanitary sewer is sent to a treatment plant for removal of pollutants, stormwater ends up in the Cache la Poudre River untreated, along with any pollutants it picks up along the way. The Town has multiple resources for different business types (e.g., restaurants, construction, etc.) and for residents to do their part in preventing stormwater pollution.
Sewer/Wastewater Infrastructure
The Town’s wastewater treatment system is an environmental and public health necessity. It helps clean the wastewater so that it can be discharged safely for animals and plants downstream. The Town operates and maintains a wastewater treatment facility with a capacity of 2.8 million gallons per day (MGD) and over 90 miles of sewer line. Current flow is 1.9 MGD with a peak hourly flow of 3.60 MGD. Additionally, the Town treats 275,000 gallons per day of Severance Sewage. The current plant capacity is 2.8 MGD with organic capacity at 7,006 BOD/day. The Town’s sewer interceptors (large pipelines that carry sewage to the treatment plant) are sized to accept current flows. However, like the water, models were based on the 2006 land use map and density assumptions, so any changes in densities may require recalibration of the sewer system.
A-107 Existing Conditions Report | Page 67
Broadband Infrastructure
In November 2021, voters approved passage of a measure that allows the Town of Windsor to partner with private businesses to provide affordable and high-speed Internet service throughout the entire community. This will support local industries, business, and remote workers.
Advancing Opportunities through Windsor’s Comprehensive Plan
The comprehensive planning process is an appropriate time for the Town to revisit its vision and guidelines for a sustainable growth pattern that favors contiguous development, over leapfrog development. Contiguous development not only ensures infrastructure and cost efficiencies, but it is also conducive to better quality of life, promoting more integrated land use uses and daily activities (working, shopping, recreating, etc.) for the community
A-108 WINDSOR COMPREHENSIVE PLAN | Existing Conditions Report | Page 68
APPENDIX E. CONCEPTUAL DESIGNS FOR FIVE FOCUS AREAS
Corridor Activity Center
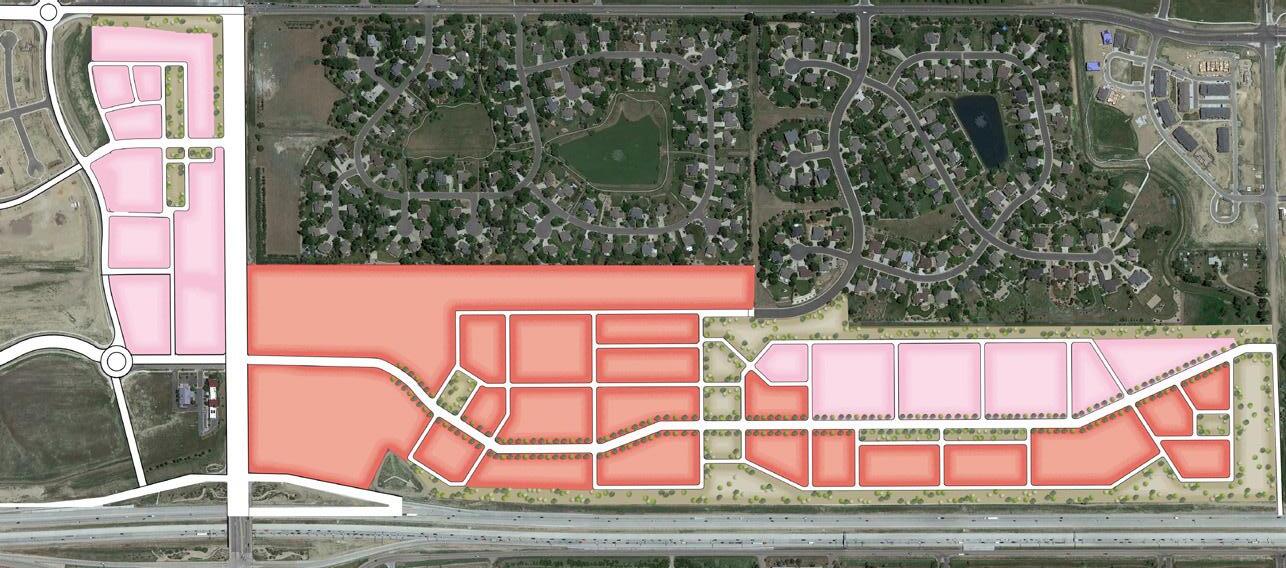


Corridor Activity Center, Future Land Use Plan
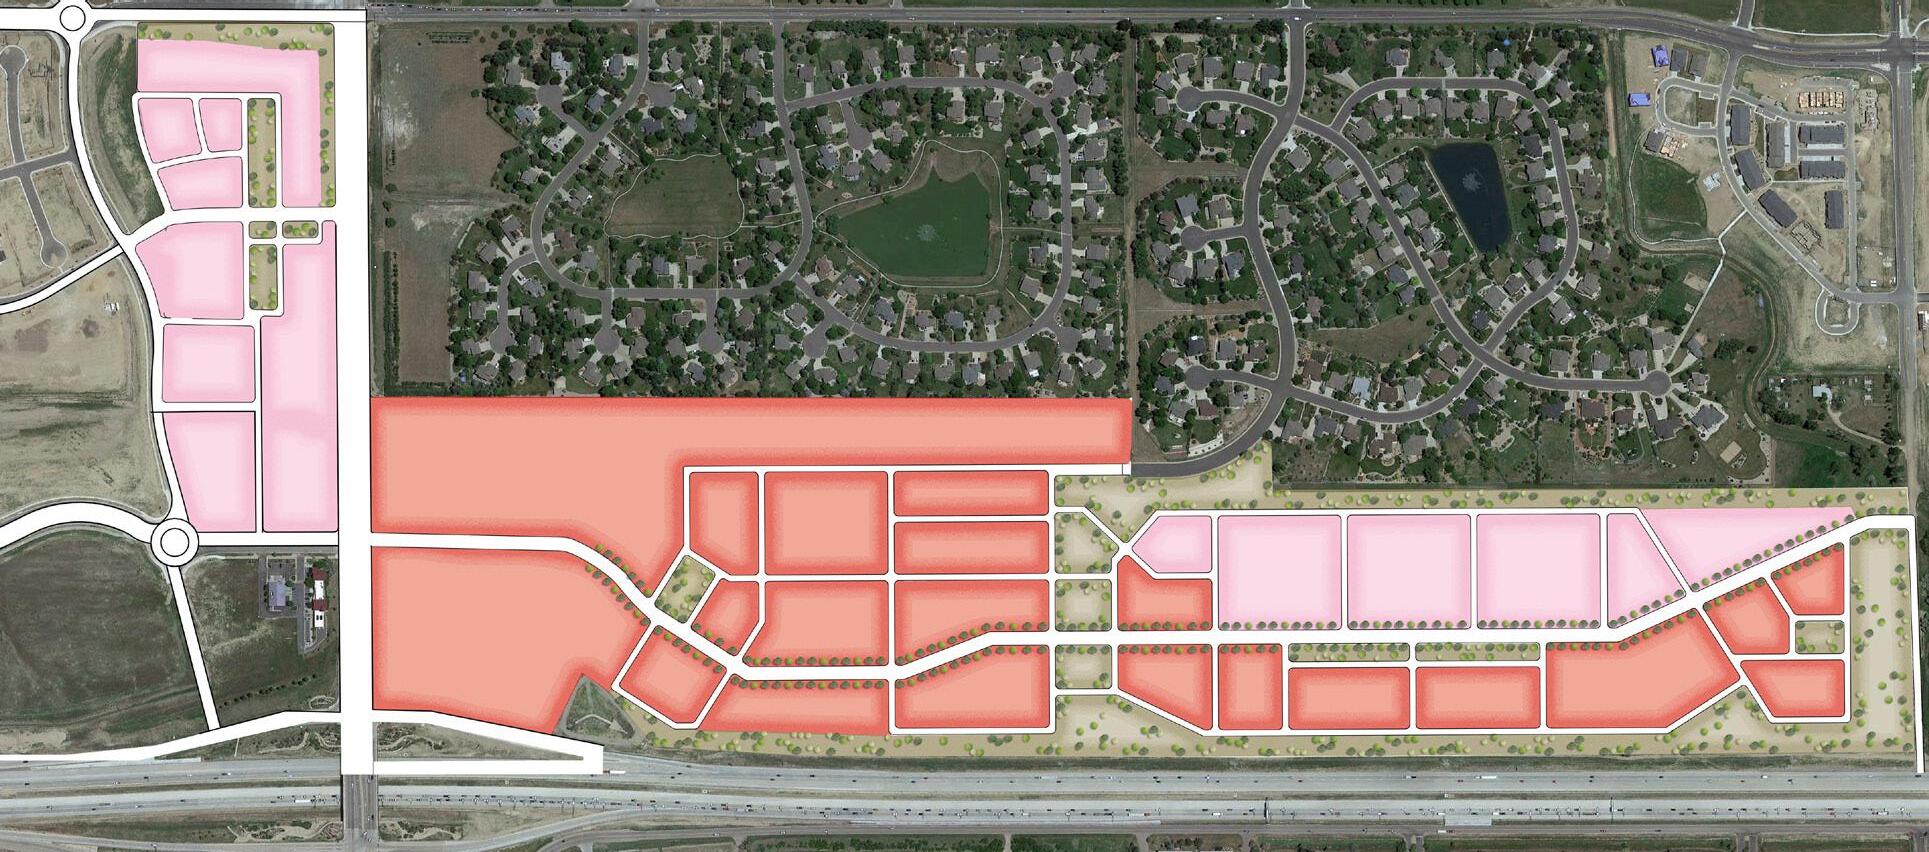
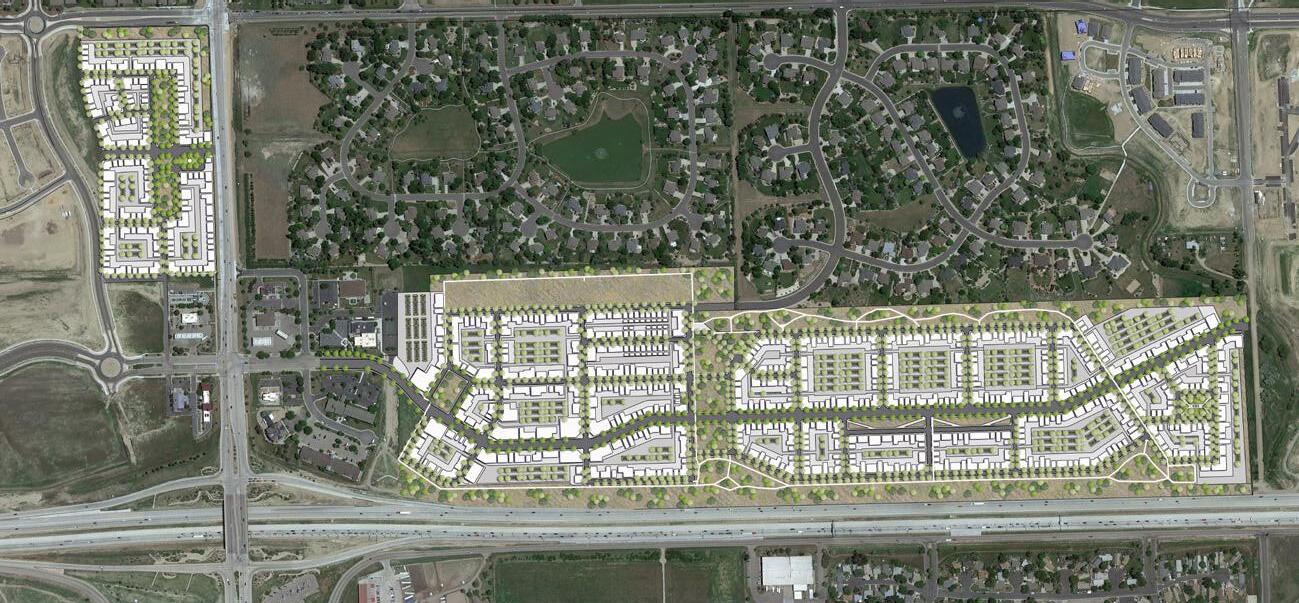
Corridor Activity Center, Conceptual Site Plan
Disclaimer: The Future Land Use Plan and Conceptual Site Plans are representative of the type of development allowed in this area. Actual development will vary.
A-109 S. Co Rd. 5 Future Land Use Plan 60% General Commercial 25% Commercial Mixed Use 15% Parks and Open Space I-25 0 375’ 1”=375’ 750’ 1500’ Primary Gateway Secondary Gateway Future Land Use Plan 60% - General Commercial 25% - Commercial Mixed Use 15% - Parks and Open Space
Downtown Windsor Extension and Infill


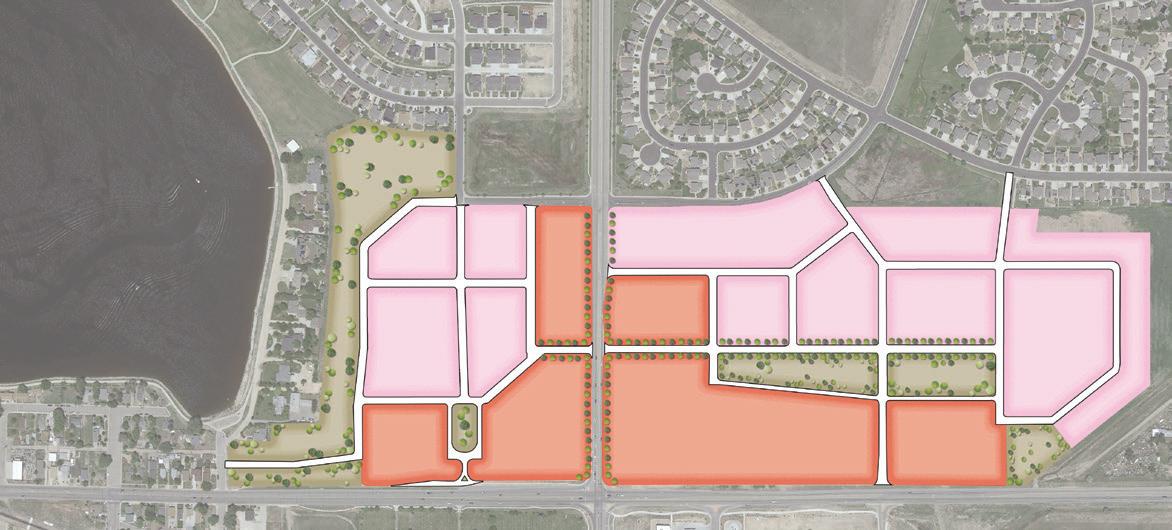
Downtown Windsor Extension and Infill, Future Land Use Plan


Hwy. 392
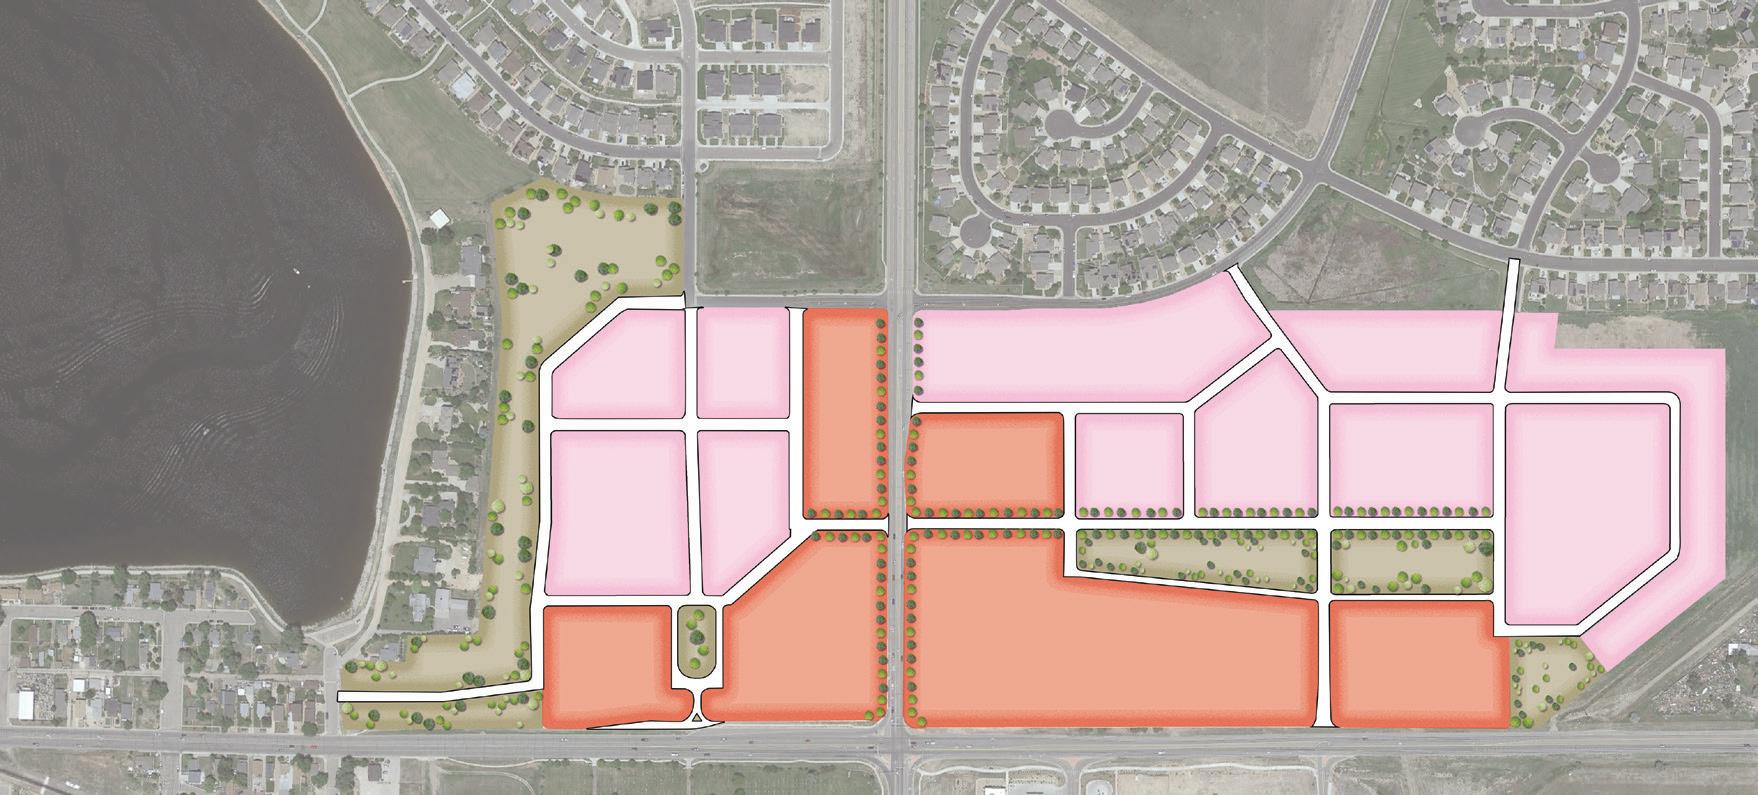
Downtown Windsor Extension and Infill, Conceptual Site Plan
Disclaimer: The Future Land Use Plan and Conceptual Site Plans are representative of the type of development allowed in this area. Actual development will vary.
A-110 WINDSOR COMPREHENSIVE PLAN |
Hollister Lake Rd. Primary Gateway Secondary Gateway Future Land Use Plan 50% - Mixed Residential 40% - Commercial Mixed Use 10% - Parks and Open Space Hollister Lake Rd. 0 375’ 1”=375’ 750’ 1500’ Primary Gateway Secondary Gateway Future Land Use Plan 50% - Mixed Residential 40% - Commercial Mixed Use 10% - Parks and Open Space
Highway 34 Area


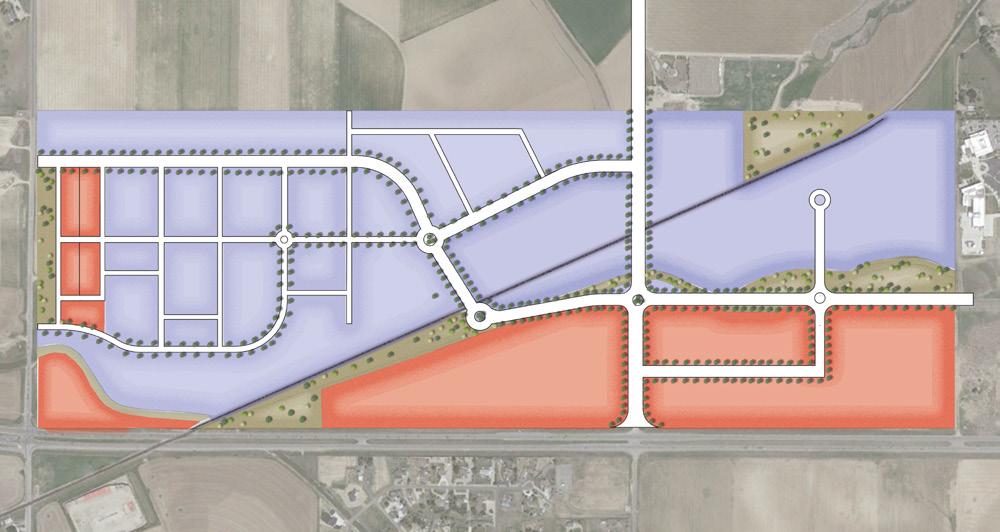
Highway 34 Area, Future Land Use Plan
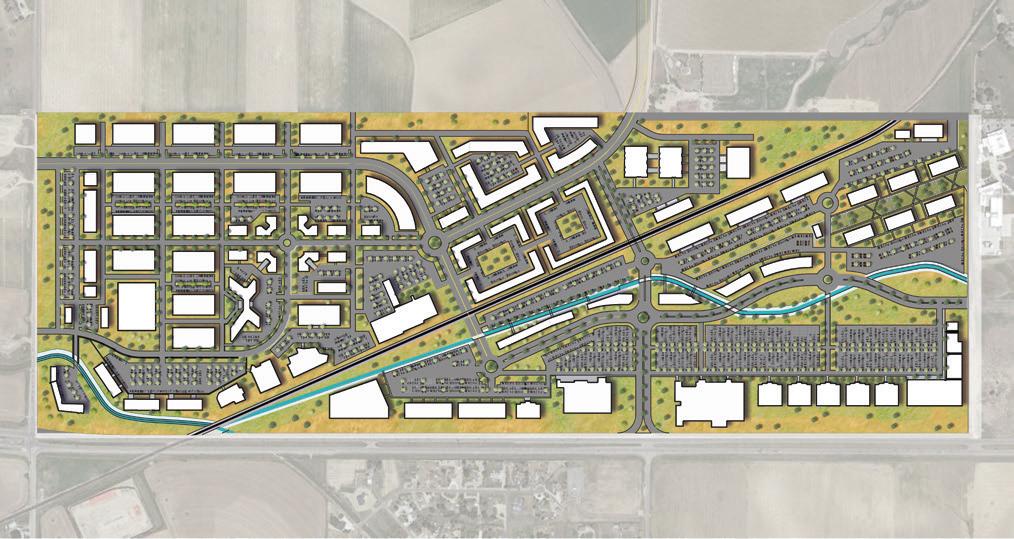
Highway 34 Area, Conceptual Site Plan
Disclaimer: The Future Land Use Plan and Conceptual Site Plans are representative of the type of development allowed in this area. Actual development will vary.
A-111
US 34 Colorado Blvd. 0 375’ Future Land Use Plan 25% - General Commercial 60% - Employment/ Flex Industrial 15% - Parks and Open Space 1”=375’ 750’ 1500’ Primary Gateway Secondary Gateway US 34 Colorado Blvd. 0 375’ 1”=375’ 750’ 1500’ US 34 0 375’ Future Land Use Plan 25% General Commercial 60% Employment/ Flex Industrial 15% Parks and Open Space 1”=375’ 750’ 1500’ Primary Gateway Secondary Gateway US 34 0 375’ Future Land Use Plan 25% - General Commercial 60% - Employment/ Flex Industrial 15% - Parks and Open Space 1”=375’ 750’ 1500’ Primary Gateway Secondary Gateway
Harmony and Highway 257 Area
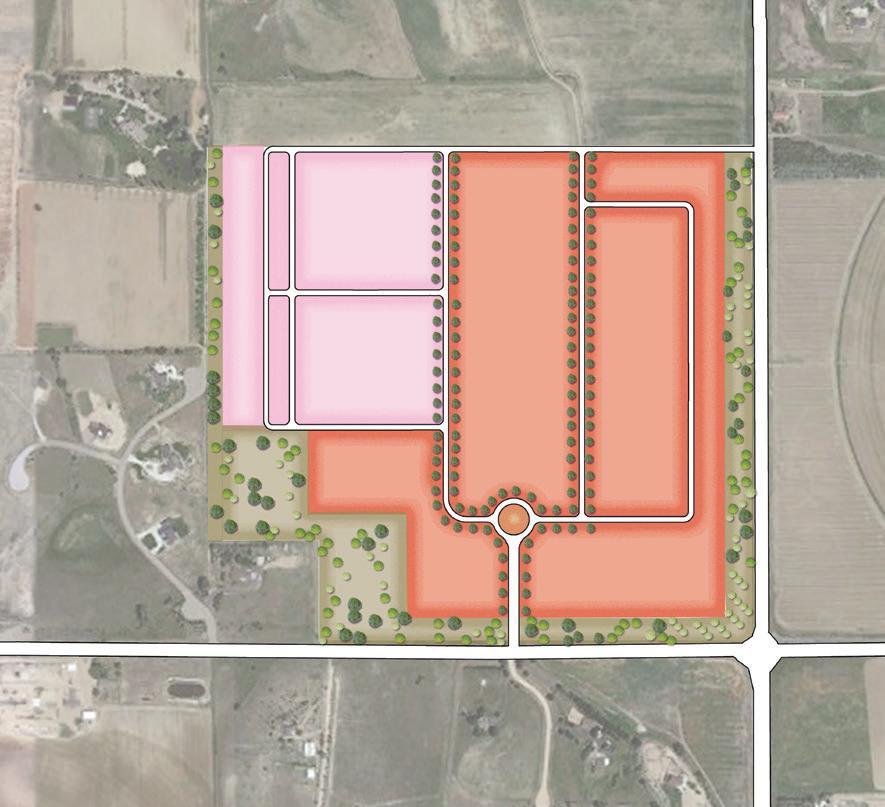
Harmony and Highway 257 Area, Future Land Use Plan
Disclaimer: The Future Land Use Plan and Conceptual Site Plans are representative of the type of development allowed in this area. Actual development will vary.
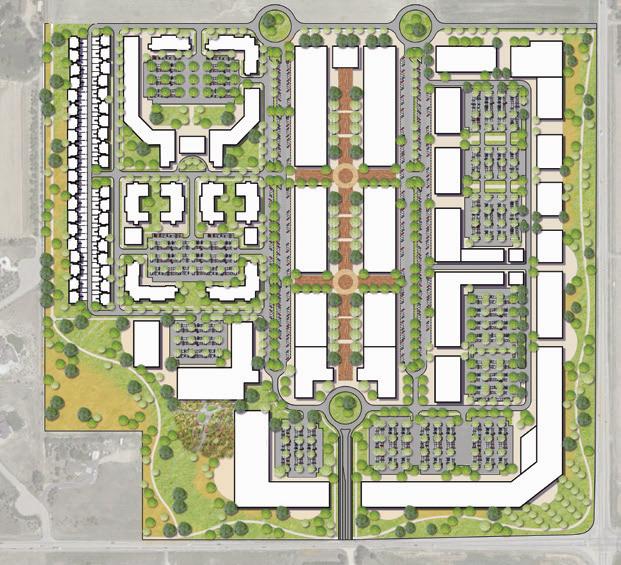
Harmony and Highway 257 Area, Conceptual Site Plan
A-112 WINDSOR COMPREHENSIVE PLAN |
E. Harmony Hwy 257 Future Land Use Plan 60% - General Commercial 30% - Commercial Mixed Use 10% - Parks and Open Space Primary Gateway Secondary Gateway 750’ 1500’ E. Harmony HWY 257 Hwy 257 Future Land Use Plan 60% - General Commercial 30% - Commercial Mixed Use 10% - Parks and Open Space Primary Gateway Secondary Gateway 0 375’ 1”=375’ 750’ 1500’ E. Harmony Hwy 257 Future Land Use Plan 60% - General Commercial 30% - Commercial Mixed Use 10% - Parks and Open Space Primary Gateway Secondary Gateway 0 375’ 1”=375’ 750’ 1500’
Fairgrounds
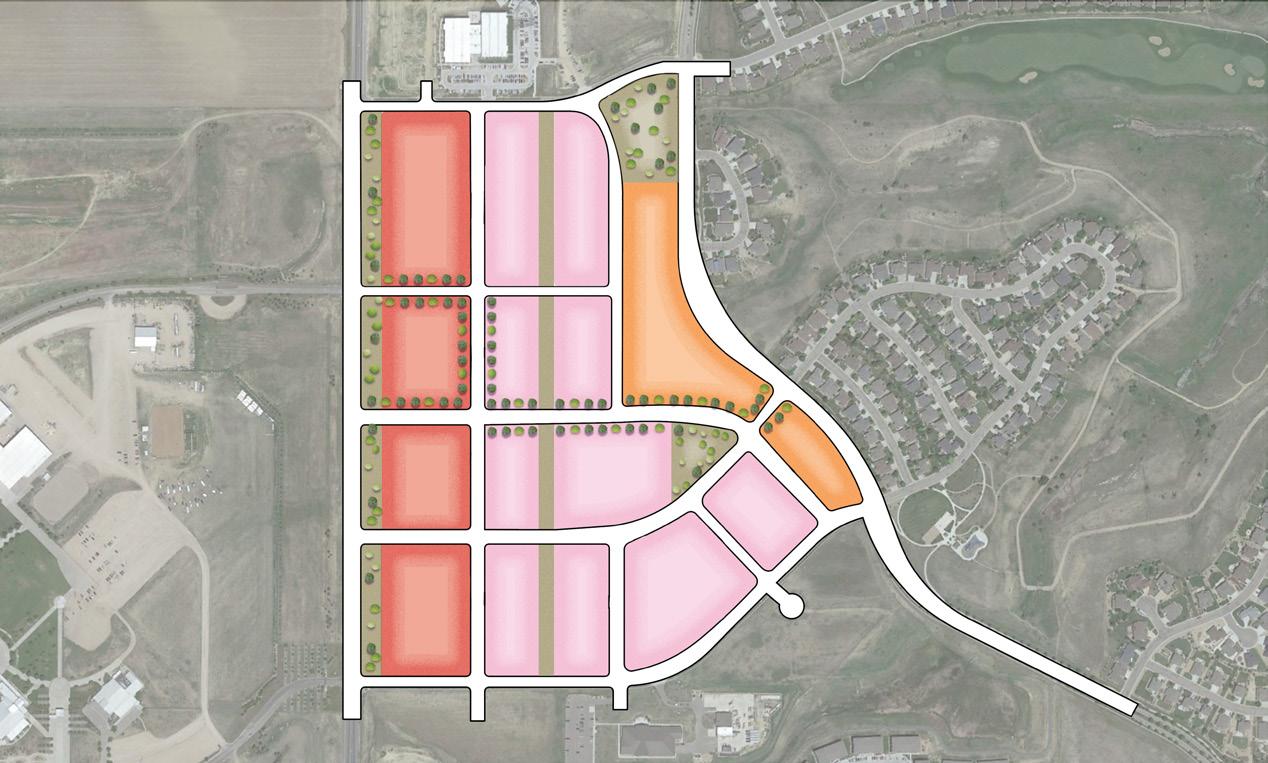
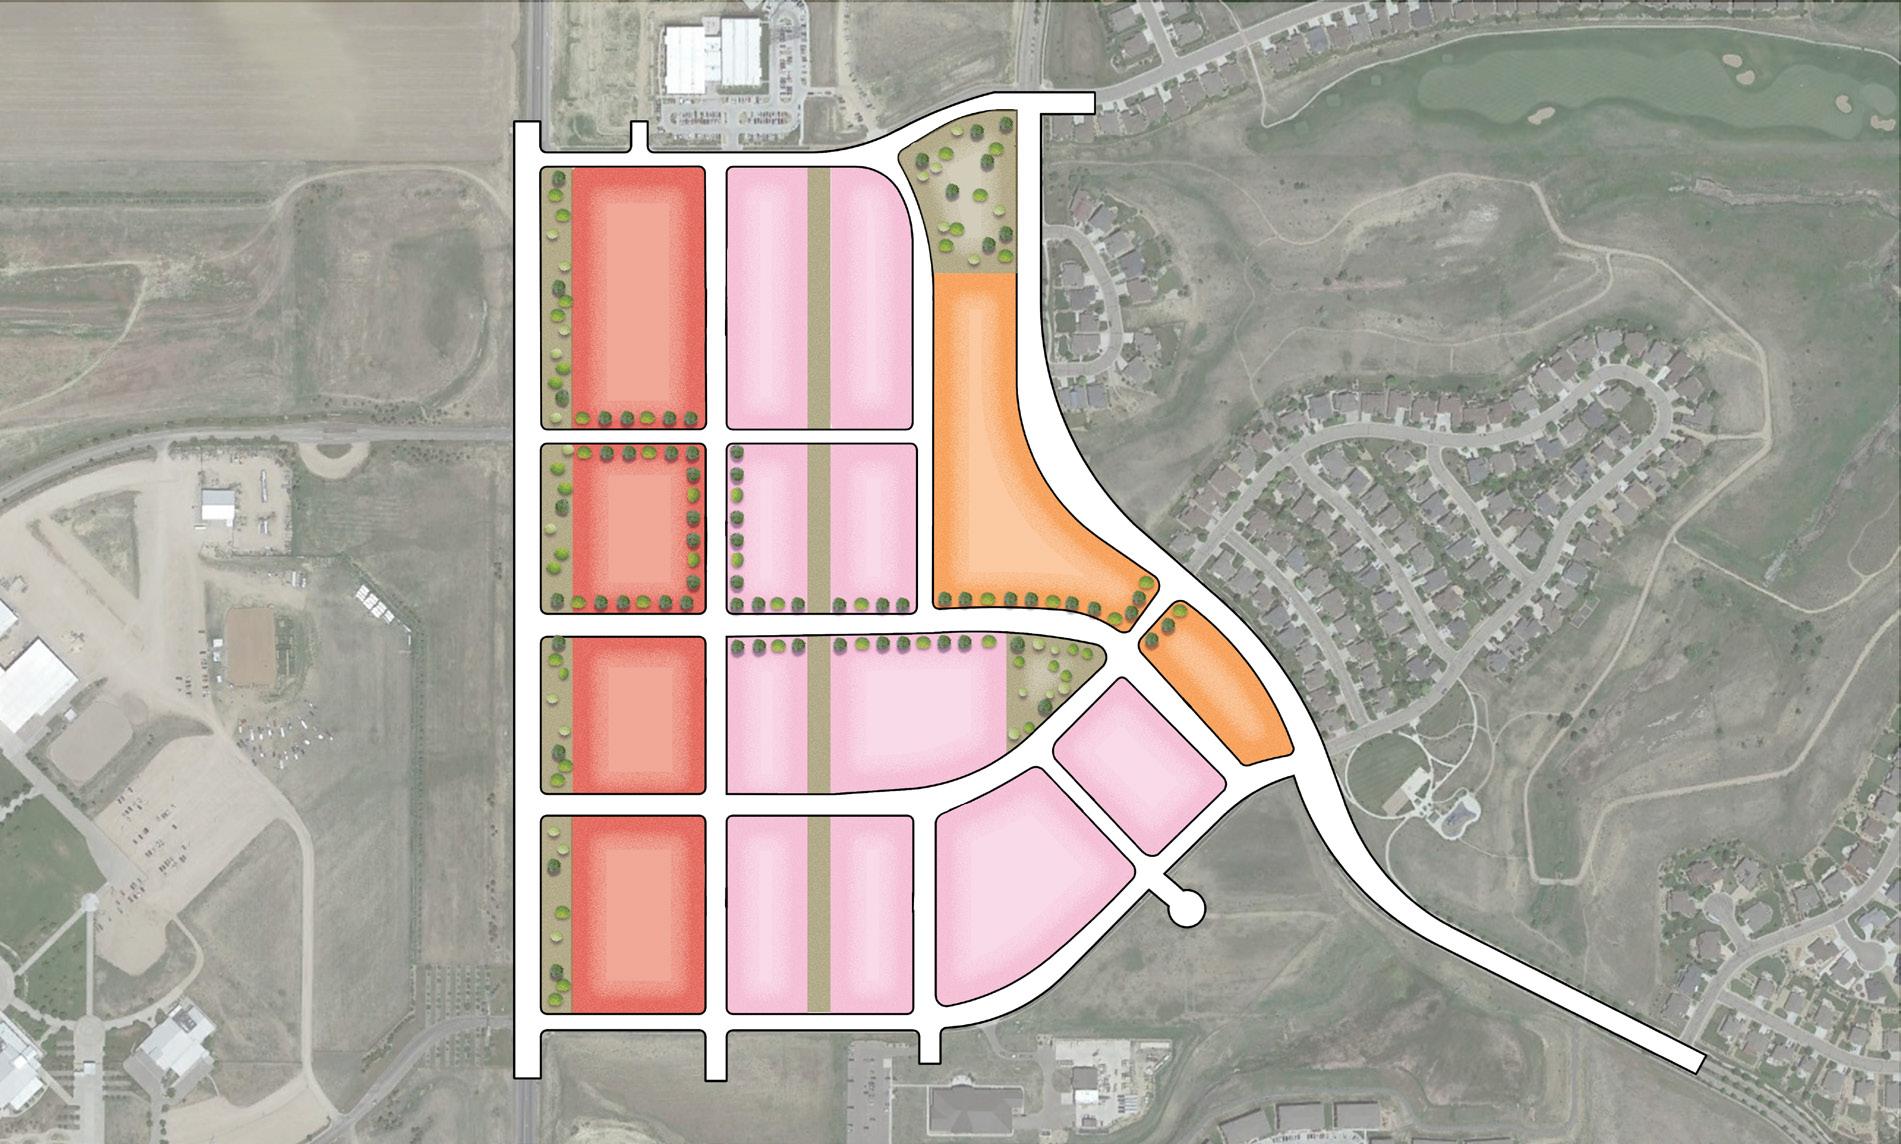
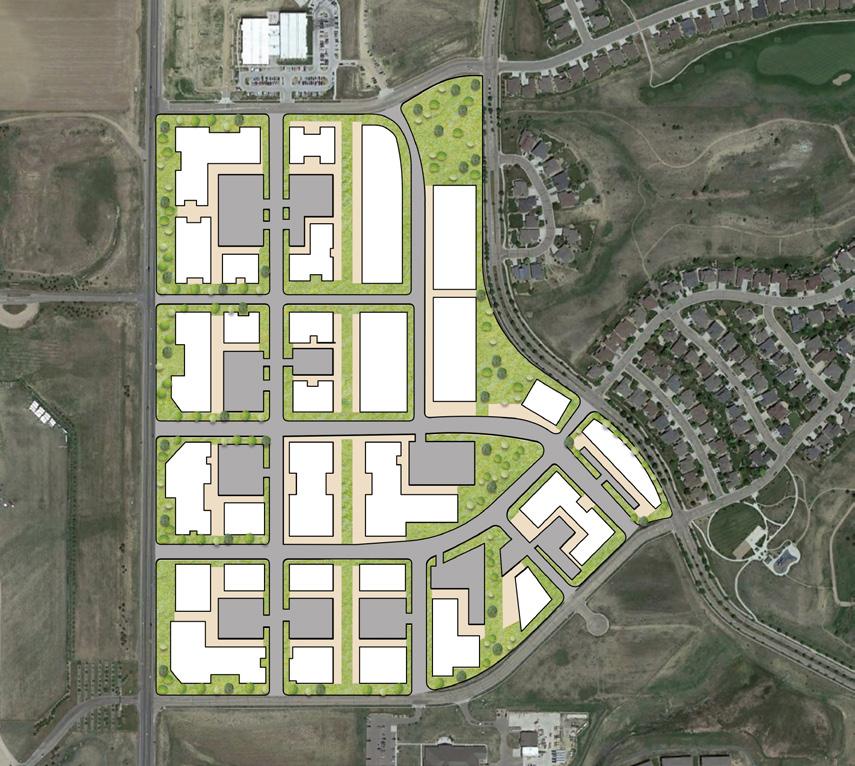
A-113
Primary Gateway Secondary Gateway Future Land Use Plan 40% - Commercial Mixed Use 10% - Parks and Open Space 30% - General Commercial 20% - Mixed Residential Primary Gateway Secondary Gateway Future Land Use Plan 40% - Commercial Mixed Use 10% - Parks and Open Space 30% - General Commercial 20% - Mixed Residential
Area Fairgrounds, Conceptual Site Plan
This page is intentionally left blank.
A-114 WINDSOR COMPREHENSIVE PLAN |
APPENDIX F. ECONOMICS OF COMMUNITY DEVELOPMENT REPORT
A-115
A-116 WINDSOR COMPREHENSIVE PLAN |
A-117
Economics of Community Development
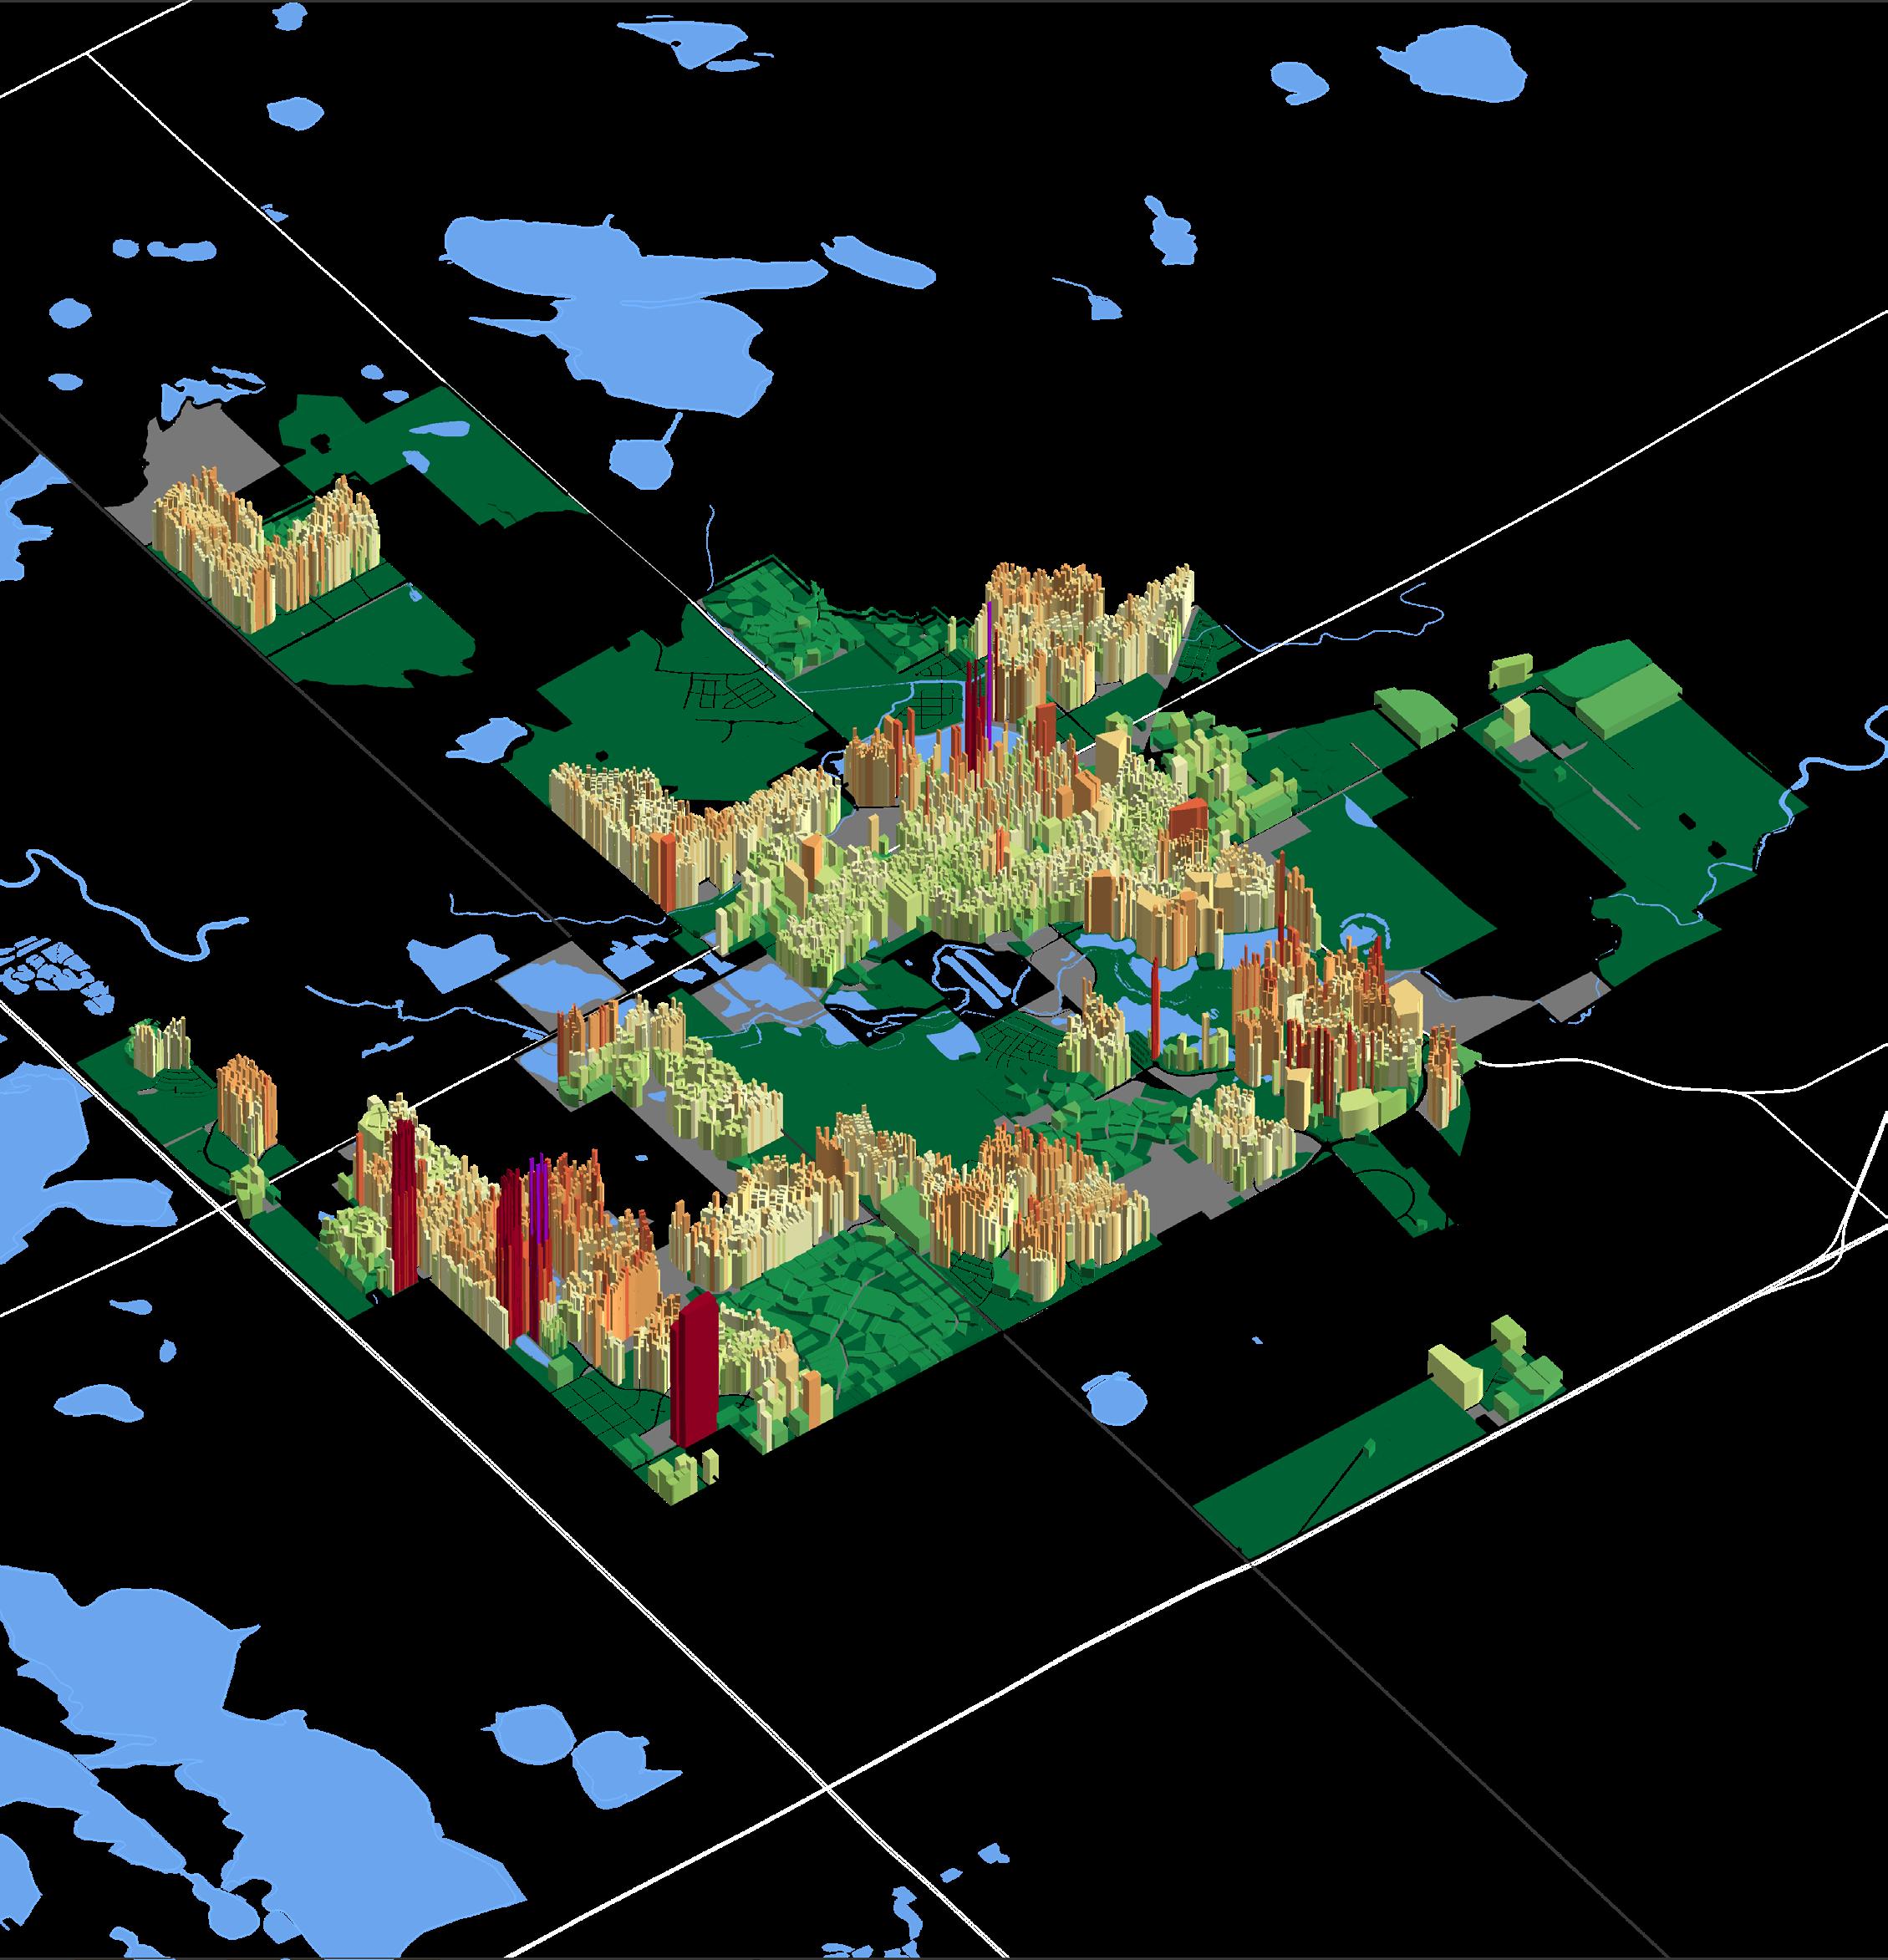
Windsor, Colorado

2024
A-118 WINDSOR COMPREHENSIVE PLAN |
About the Author

We are a consulting firm specializing in land value economics, property tax analysis, and community design. Our approach bridges the gap between economic analysis, public policy, and urban design. Our work will empower your community with the ability to promote development patterns that both secure its fiscal condition and create a strong sense of place.
We provide communities with an in-depth understanding of their financial health and built environment by measuring data and visualizing the results.
Glossary
Assessed Value
The valuation of a real estate asset that determines the amount of property tax applicable to it.
Geoaccounting
Process of mapping a community’s revenues and expenditures to understand how different land uses and development patterns perform financially.
Infill Development
The process of developing vacant or under-utilized parcels within existing urban areas that are already largely developed.
Land Uses
Regulating the use of land to achieve urban and regional planning goals; land uses include commercial, residential, industrial, agricultural, open space, recreational, etc.
Mixed-Use Development
A development that combines two or more land uses on one site. A classic mixed-use development type is a building with ground-floor retail spaces and apartments above.
Parcel
Area of land that is owned (i.e. lot, plot).
Urban Revitalization
Improving urban areas that are in a state of economic, social, or environmental decline.
Value Per Acre (VPA)
A metric used to evaluate the effectiveness of land use policy; property value divided by acres utilized.
Economics of Community Design: Windsor, Colorado
ii
A-119
iii Table of Contents About the Author � � � � � � � � � � � � � � � � � � � � � � � � � � � � � � � � � ii Glossary � � � � � � � � � � � � � � � � � � � � � � � � � � � � � � � � � � � � � � ii Table of Contents � � � � � � � � � � � � � � � � � � � � � � � � � � � � � � � � � iii History of Urban3 & the Rebirth of Asheville � � � � � � � � � � � � � � � � � � � iv Introduction to Windsor � � � � � � � � � � � � � � � � � � � � � � � � � � � � � � 6 Understanding Local Finance � � � � � � � � � � � � � � � � � � � � � � � � � � � 6 2022 Budget: General Fund Overview � � � � � � � � � � � � � � � � � � � � � � � 7 Value Per Acre � � � � � � � � � � � � � � � � � � � � � � � � � � � � � � � � � � � 8 Average Value Per Acre Comparison for Residential Properties � � � � � � � � 11 Value Per Acre Comparison for Big Box vs� Main Street Commercial � � � � � � 11 Taxable vs� Exempt Land � � � � � � � � � � � � � � � � � � � � � � � � � � � � � 12 Productivity Ratios � � � � � � � � � � � � � � � � � � � � � � � � � � � � � � � � 12 Land Value Per Acre � � � � � � � � � � � � � � � � � � � � � � � � � � � � � � � 13 Sales Tax Analysis � � � � � � � � � � � � � � � � � � � � � � � � � � � � � � � � 14 Growth Over Time � � � � � � � � � � � � � � � � � � � � � � � � � � � � � � � � 15 Infrastructure Analysis � � � � � � � � � � � � � � � � � � � � � � � � � � � � � � 17 Sewer Fund Budget History � � � � � � � � � � � � � � � � � � � � � � � � � � � 18 Average Infrastructure Spending: 2018-2022 � � � � � � � � � � � � � � � � � � 19 Return on Investment (ROI) � � � � � � � � � � � � � � � � � � � � � � � � � � � 19 Growth Projections � � � � � � � � � � � � � � � � � � � � � � � � � � � � � � � 22 Downtown Projections � � � � � � � � � � � � � � � � � � � � � � � � � � � � � � 24 Public Asset Analysis � � � � � � � � � � � � � � � � � � � � � � � � � � � � � � � 27 Key Takeaways � � � � � � � � � � � � � � � � � � � � � � � � � � � � � � � � � � 29 Appendix: Development Evaluator Tool � � � � � � � � � � � � � � � � � � � � � 30 Sample Development A: Main Street-Style Building � � � � � � � � � � � � � � � 30 Sample Development B: Commercial Center Development � � � � � � � � � � � 32 Expanded Readings � � � � � � � � � � � � � � � � � � � � � � � � � � � � � � � 34 A-120 WINDSOR COMPREHENSIVE PLAN |
History of Urban3 & the Rebirth of Asheville
Before Urban3 helped communities understand the true value of good design, there was Julian Price.
Julian moved to Asheville and saw the dilapidated state of the downtown against the backdrop of the stunning Blue Ridge Mountains and began to dream. In the early 1990s, Downtown Asheville, like many downtowns, faced an uncertain future after years of neglect and disinvestment. Its vacant storefronts and empty streets repelled visitors and locals alike, despite the beautiful scenery. The city had lost its soul.
Julian had inherited a family fortune and decided to invest his money into the people and places that, with a little help, could reinvigorate downtown. Despite cries of “that’s impossible” and “that’ll never work here,” Julian created the development company Public Interest Projects in 1990 and tapped Pat Whalen to take the lead. Mr. Whalen focused 75% of the $15 million portfolio on fixing buildings, and the remaining 25% was invested in entrepreneurs as a revolving fund. The investments focused on catalytic projects with a
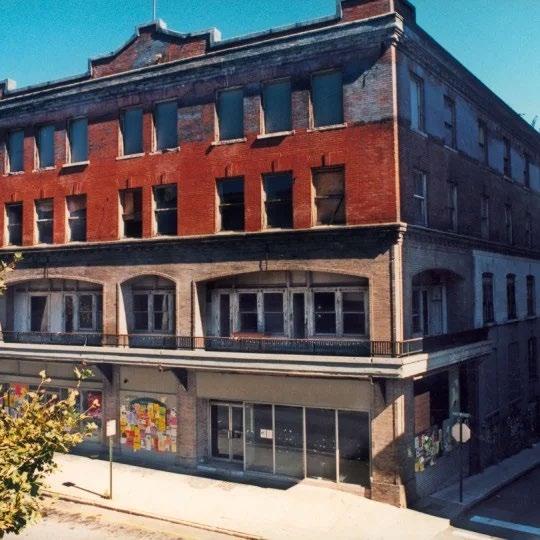
focus on making downtown more liveable as a neighborhood. Julian wasn’t afraid to get down in the weeds—he picked up trash and fixed park benches, but he also had a crystal clear, big-picture vision. He knew that investing in restaurants, local media outlets, mixed-use buildings, and a self-help credit union would gradually create a self-sustaining ecosystem that would attract downtown residents, invite tourists, and help small businesses thrive. Together, these ingredients brought Downtown Asheville back to life.
Urban3 was created at Public Interest Projects to share the lessons of community revitalization and explain the importance of municipal economics to communities across the country.
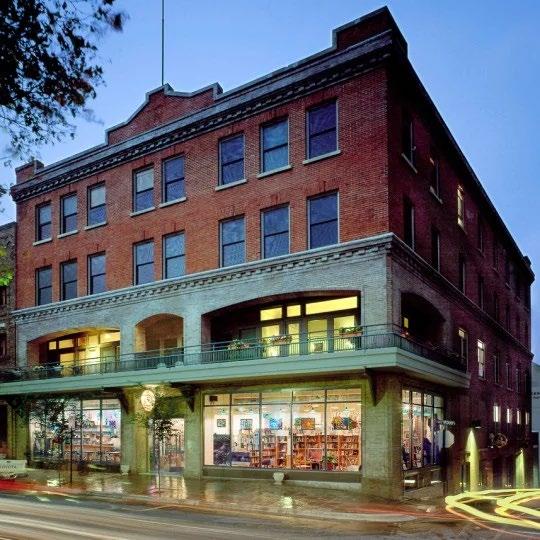
iv
Economics of Community Design: Windsor, Colorado
Source: urbanthree.com Before After
A building in downtown Asheville before (left) and after (right) revitalization
A-121
v A-122 WINDSOR COMPREHENSIVE PLAN |
Introduction to Windsor
Windsor, situated in Northern Colorado near the Front Range of the Rocky Mountains, is a town that straddles Weld and Larimer Counties. Windsor is located to the southeast of Fort Collins and to the northwest of Greeley. According to the 2020 census, Windsor had a population of about 33,000. Windsor was incorporated in 1890, but remained a small town for about a century until more rapid population growth began in the 1980s and 1990s. This growth corresponded with significant suburban residential development and expansion. Windsor is projected to continue growing, so it will be important for the town to understand how different development patterns and land uses impact the long term financial health of the community.
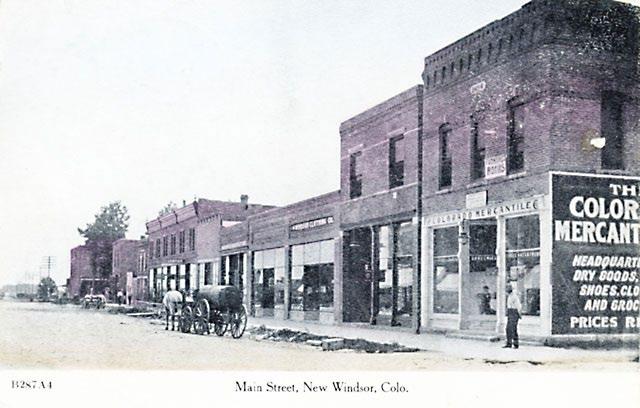
Windsor’s Main Street, circa 1905
Understanding Local Finance
To understand the financial health of a community, we must begin by understanding the underlying tax structure. Most communities rely on a mixture of revenues, primarily from taxes, users fees, and state and federal government. Taxes tend to comprise a large share of local revenue. Communities use these funds to run their government, pay for public services, and build and maintain infrastructure. When available, spatial data allows Urban3 to map and visualize both tax revenue and infrastructure costs, an approach we call “geoaccounting.” We use geoaccounting to uncover the relationship between land use decisions and public revenue production.
When public revenues vary geographically, comparisons can be made to other spatially relevant factors, such as development patterns, commuting patterns, and public investment. Analyzing both the source of government revenues and the patterns they come from is critical to planning for a strong financial future.
How Your Property Tax Bill is Calculated
6 Economics of Community Design: Windsor, Colorado
Actual Value Assessed Value Tax Rate Tax Bill = x = x - Exemptions Assessment Rate
A-123
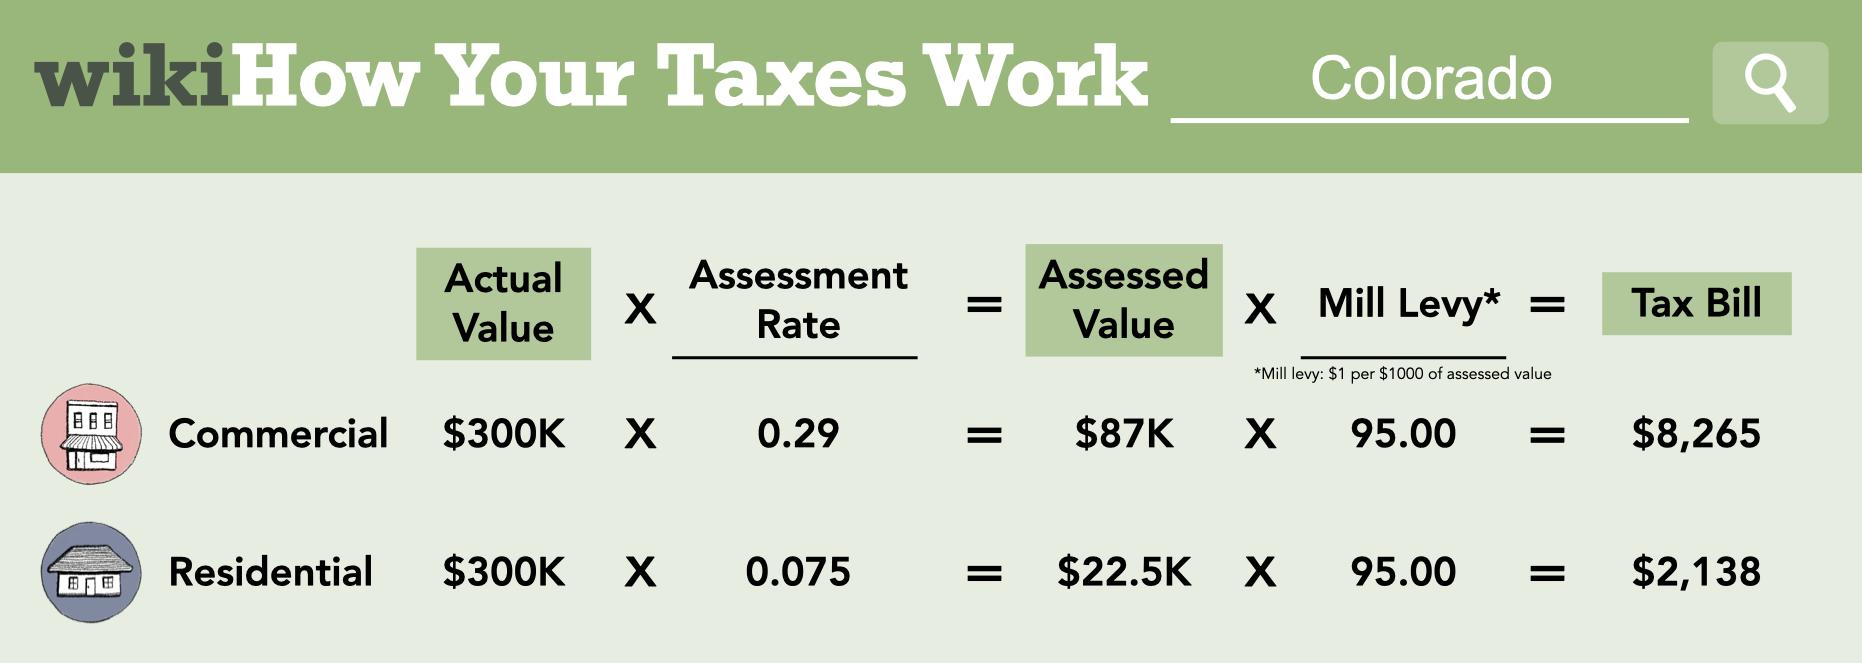
The equation on the previous page serves as a model for calculating property taxes in Windsor, employing a rate-based tax system. In Colorado, different types of property are assessed at different rates. Commercial, industrial, and mixed-use properties are assessed at about 29% of its market value, while residential property is assessed at about 8% of its market value. The assessed value is then multiplied by the tax rate to determine the tax bill.
2022 Budget: General Fund Overview
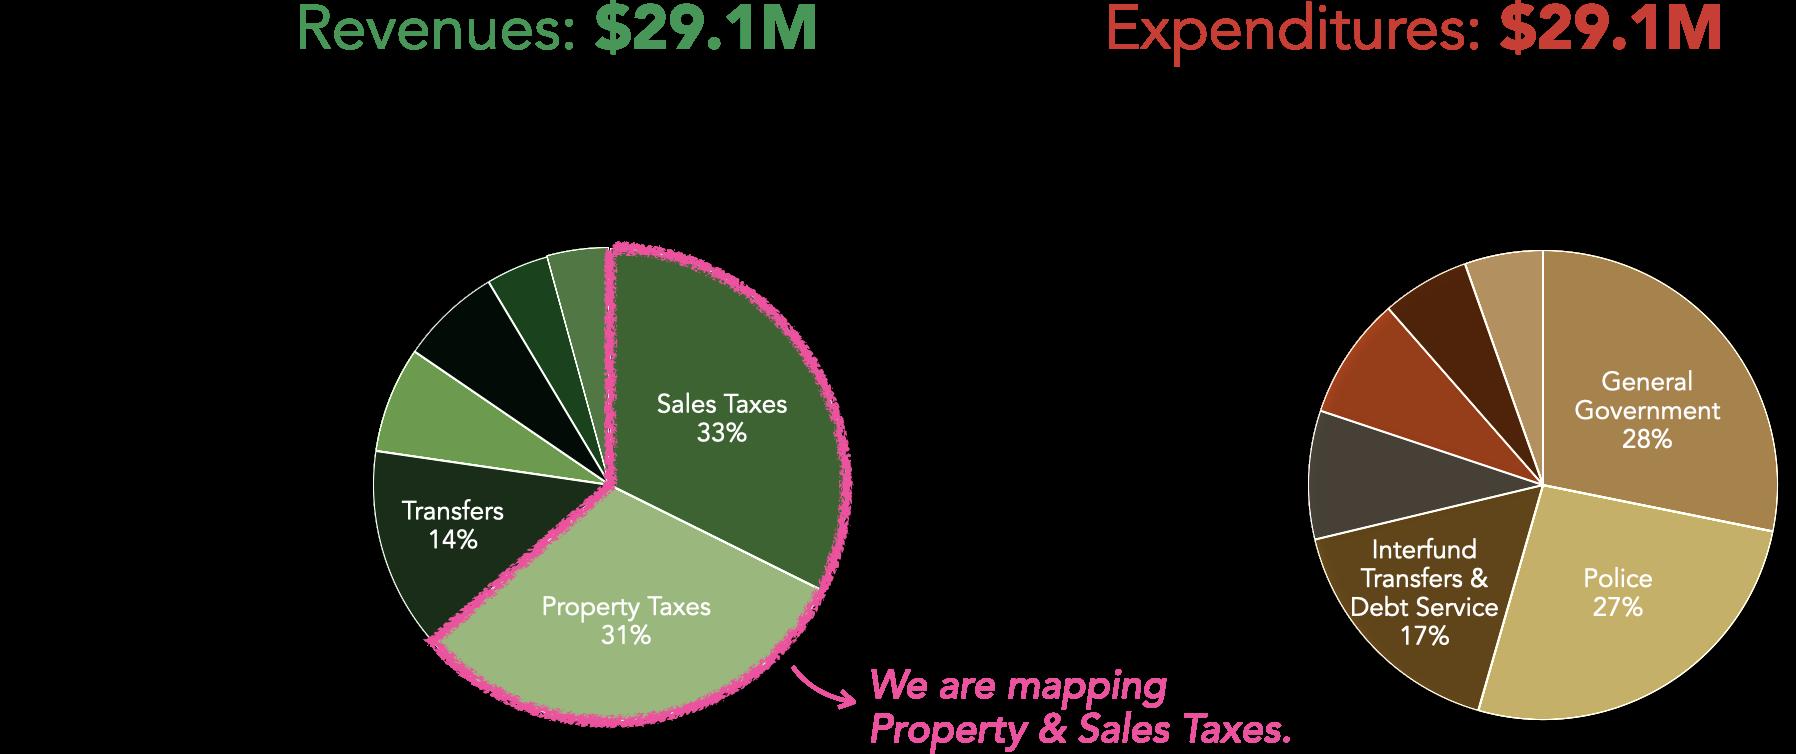
The diagram on the next page offers an overview of the fiscal activity in Windsor during the 2022 fiscal year, illustrating the flow of $29.1 million from various revenue sources to the general fund and its subsequent allocation across different expenditures. Sales and property taxes make up the largest portion of general fund revenues, contributing 33% ($9.4 million) and 31% ($9.1 million), respectively. Transfers, miscellaneous revenues and fees, charges for services, and collections for other governments round out revenues, totaling 36% ($10.6 million) of general fund revenues.
7
A-124 WINDSOR COMPREHENSIVE PLAN |
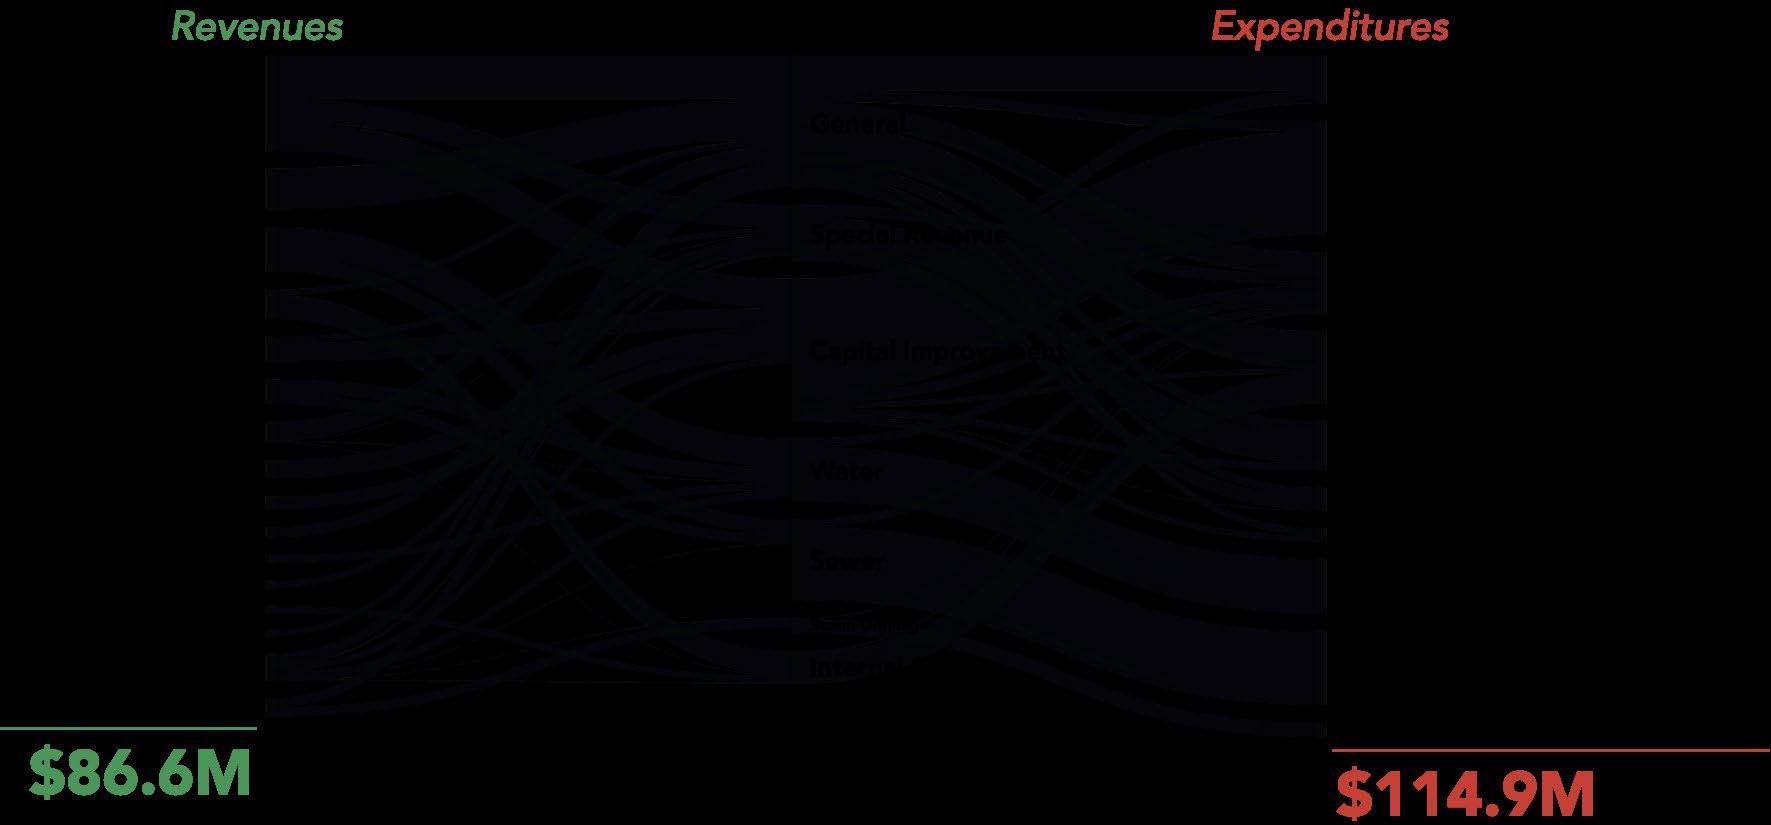
Value Per Acre
Total taxable value is one way to analyze the overall value of a city, but when it comes to understanding economic productivity, it is not always the most useful. Urban3’s analysis focuses on the “per acre” metric as a unit of productivity. After all, cities and counties are, at their simplest, finite areas of land. How that land is used has a direct effect on municipal budgets. Value per acre is calculated by taking a parcel’s value and dividing it by its acreage. For example, if a property has a value of $200,000 and sits on 0.2 acres of land, its value per acre would be $1,000,000. The per acre metric normalizes total revenues and tax values, creating direct “apples-to-apples’’ comparisons utilizing land consumed as a unit of productivity.
Using VPA to compare properties is like using miles per gallon (MPG) to compare cars. When comparing cars, the miles a car can go per tank isn’t typically referenced because it only reflects the size of the tank, not how efficient the engine is. We apply the same principle to measure the financial productivity of various development types across a community.
A few notable patterns emerge when considering Windsor’s Economic MRI. First, though there are some
properties with high total value scattered across Weld and Larimer Counties, the most productive areas are concentrated around the incorporated areas of Windsor, Fort Collins, Loveland, and Greeley. The more developed and compact land uses in these areas contribute to higher value per acre numbers. However, there is a clear separation between Fort Collins and the other communities, with Fort Collins having a robust grouping of highly productive land uses compared to the others.
Focusing on Windsor, there are some interesting patterns to highlight. First, there are clear areas of moderate productivity associated with residential development. The newer and more compact the lots, the greater the value per acre. This can be seen when comparing low density single family to the west of Raindance, the more compact single family development in Raindance, and the townhouse-style development in Country Farms Village. These range from about $500,000 per acre for the low density single family, to $3,000,000 per acre in Raindance, to over $6,000,000 per acre in Country Farms Village. Also, note the potency of Downtown Windsor. Many main street buildings have minimal, if any, parking require-
8 Economics of Community Design:
Windsor, Colorado
A-125
Windsor’s 2022 Budget
ments. By reducing the amount of parking that properties here are required to provide they can put more of their land towards buildings, which generate much more value compared to surface parking. The Downtown Development Authority also helps to support and promote activity in downtown, creating an ecosystem that can support local businesses. The classic main street development pattern in downtown creates a significant productivity boost, which helps support areas of lower property value productivity in town.
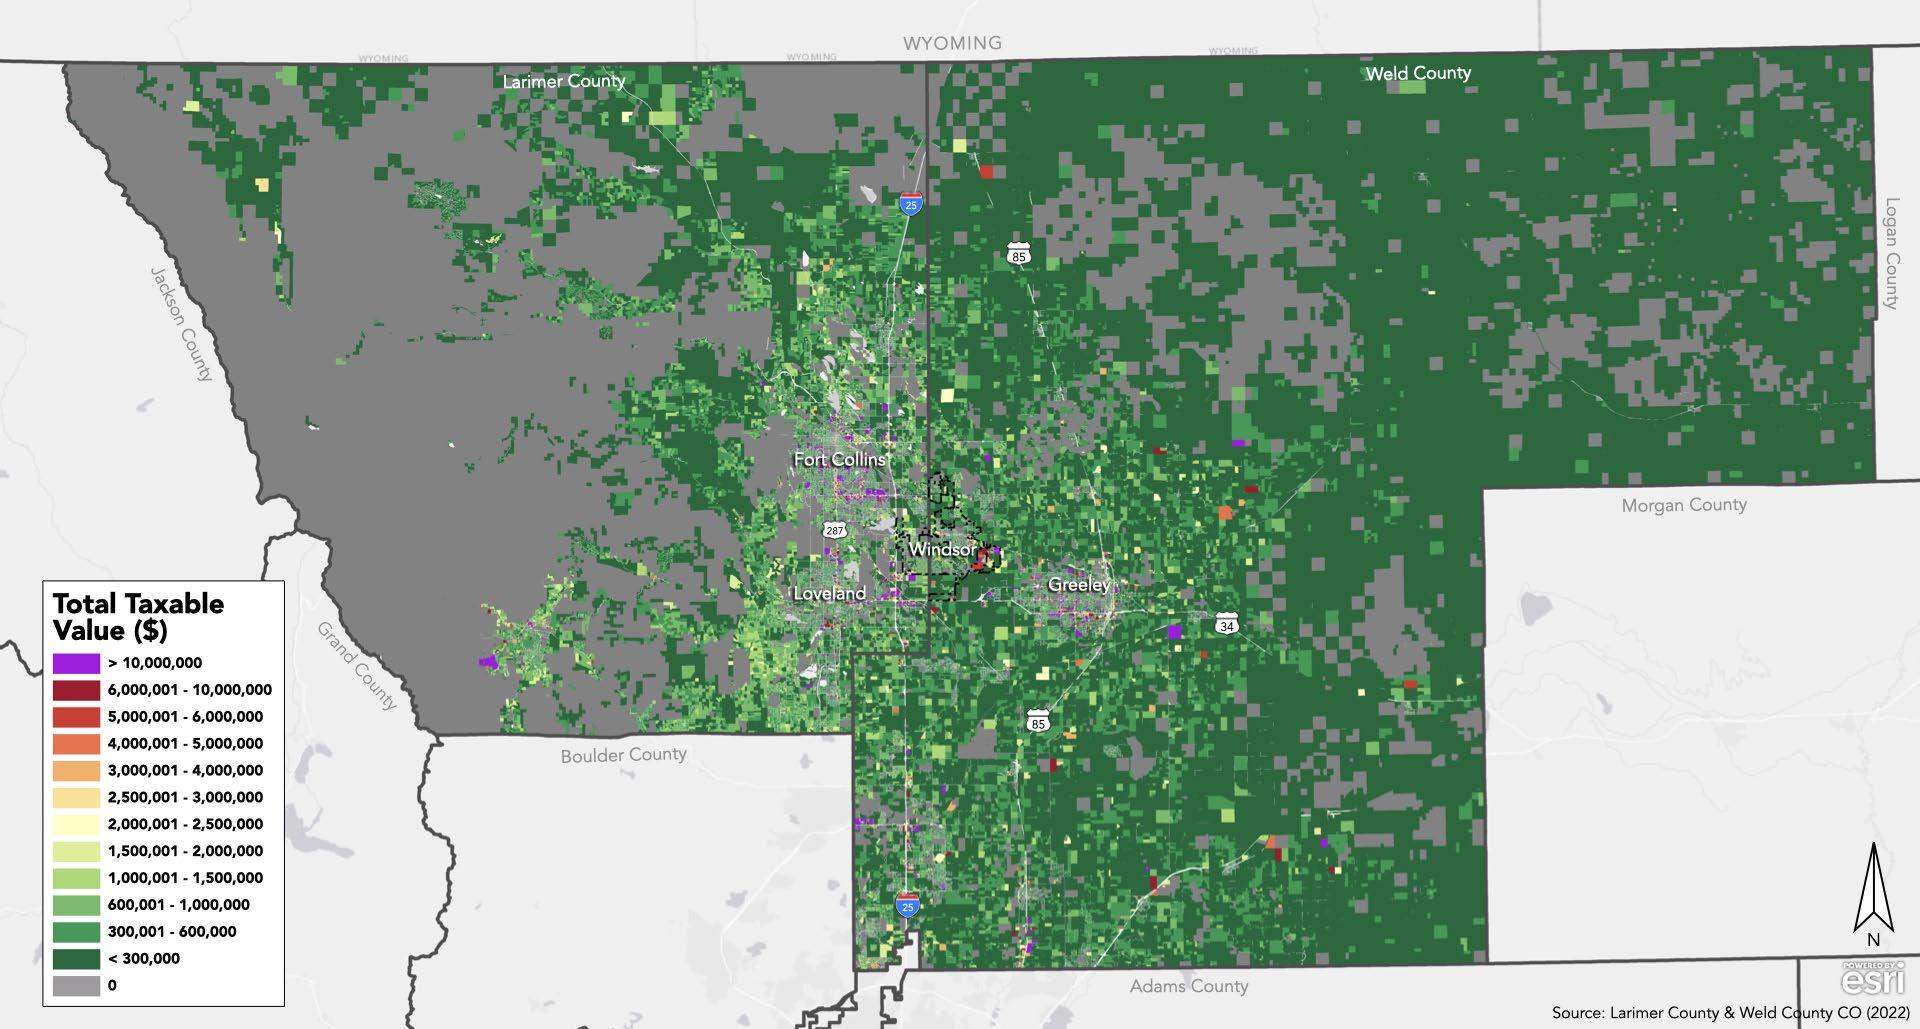
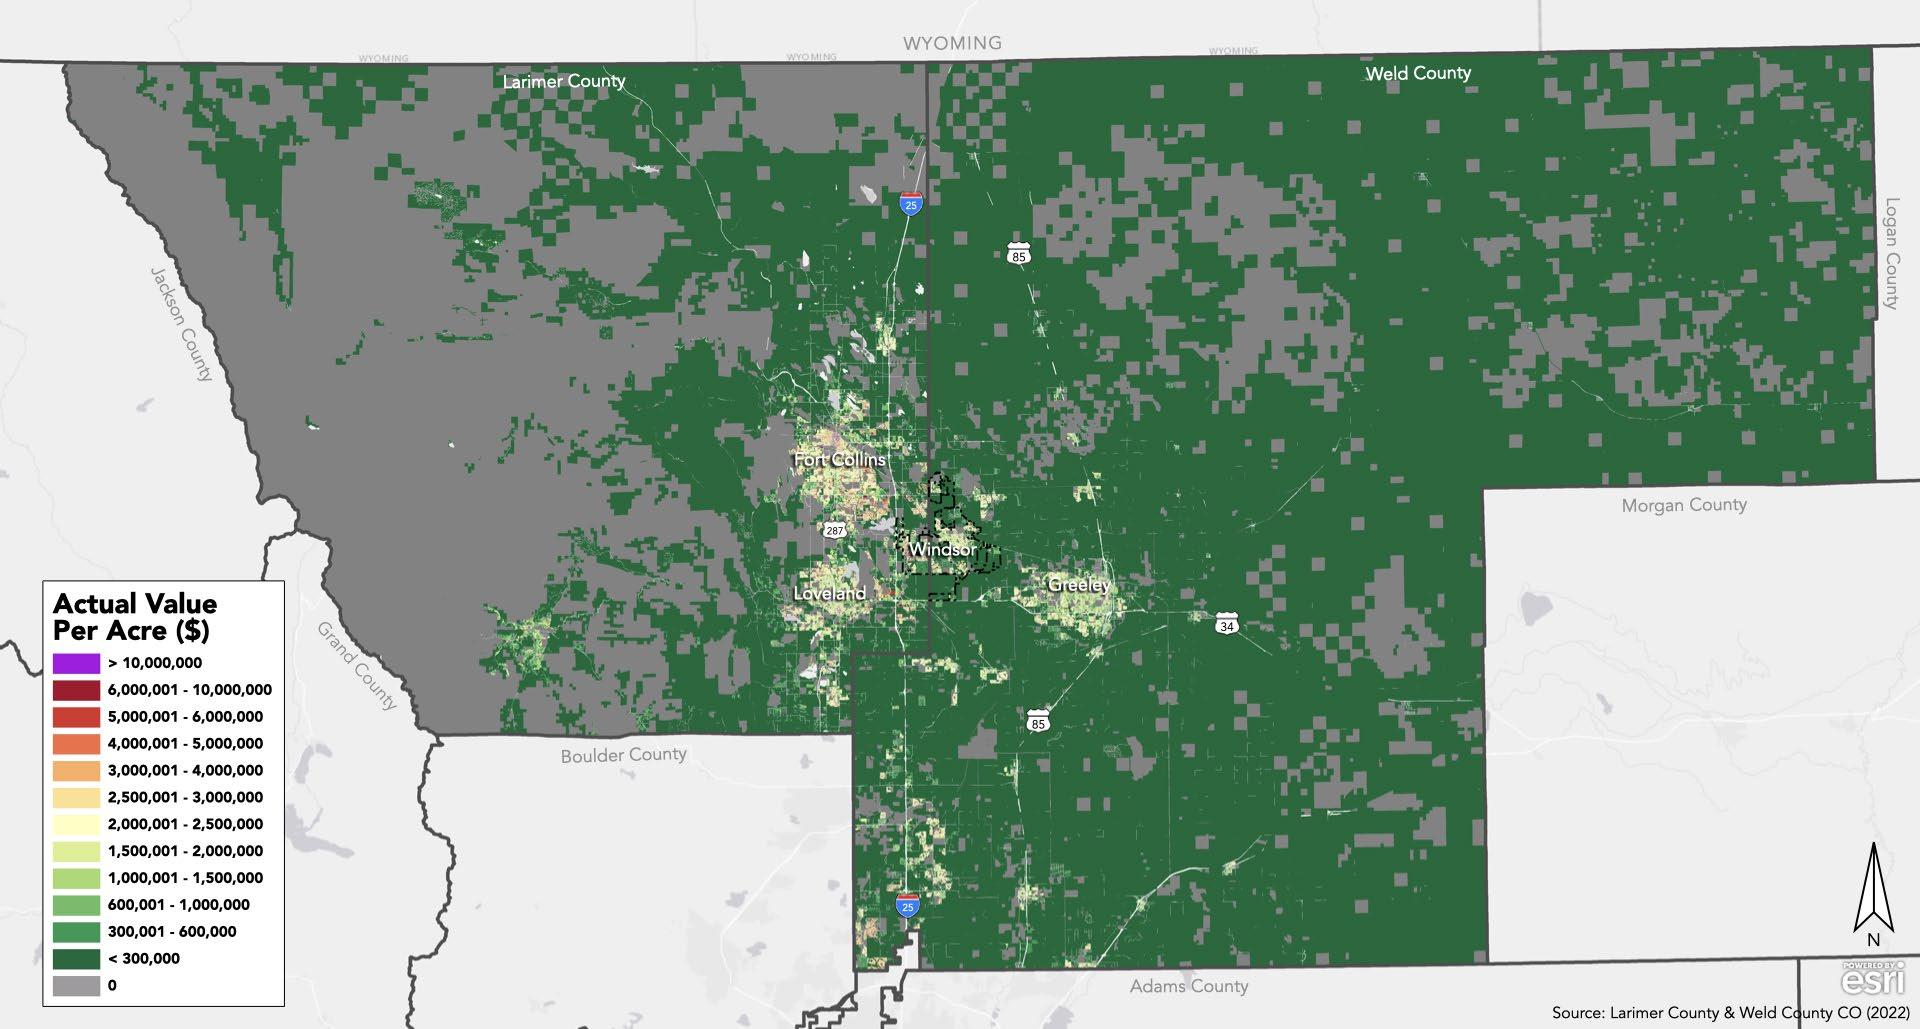
9
Total Taxable Value (top) versus Actual Value Per Acre (bottom) for Larimer and Weld counties
A-126 WINDSOR COMPREHENSIVE PLAN |
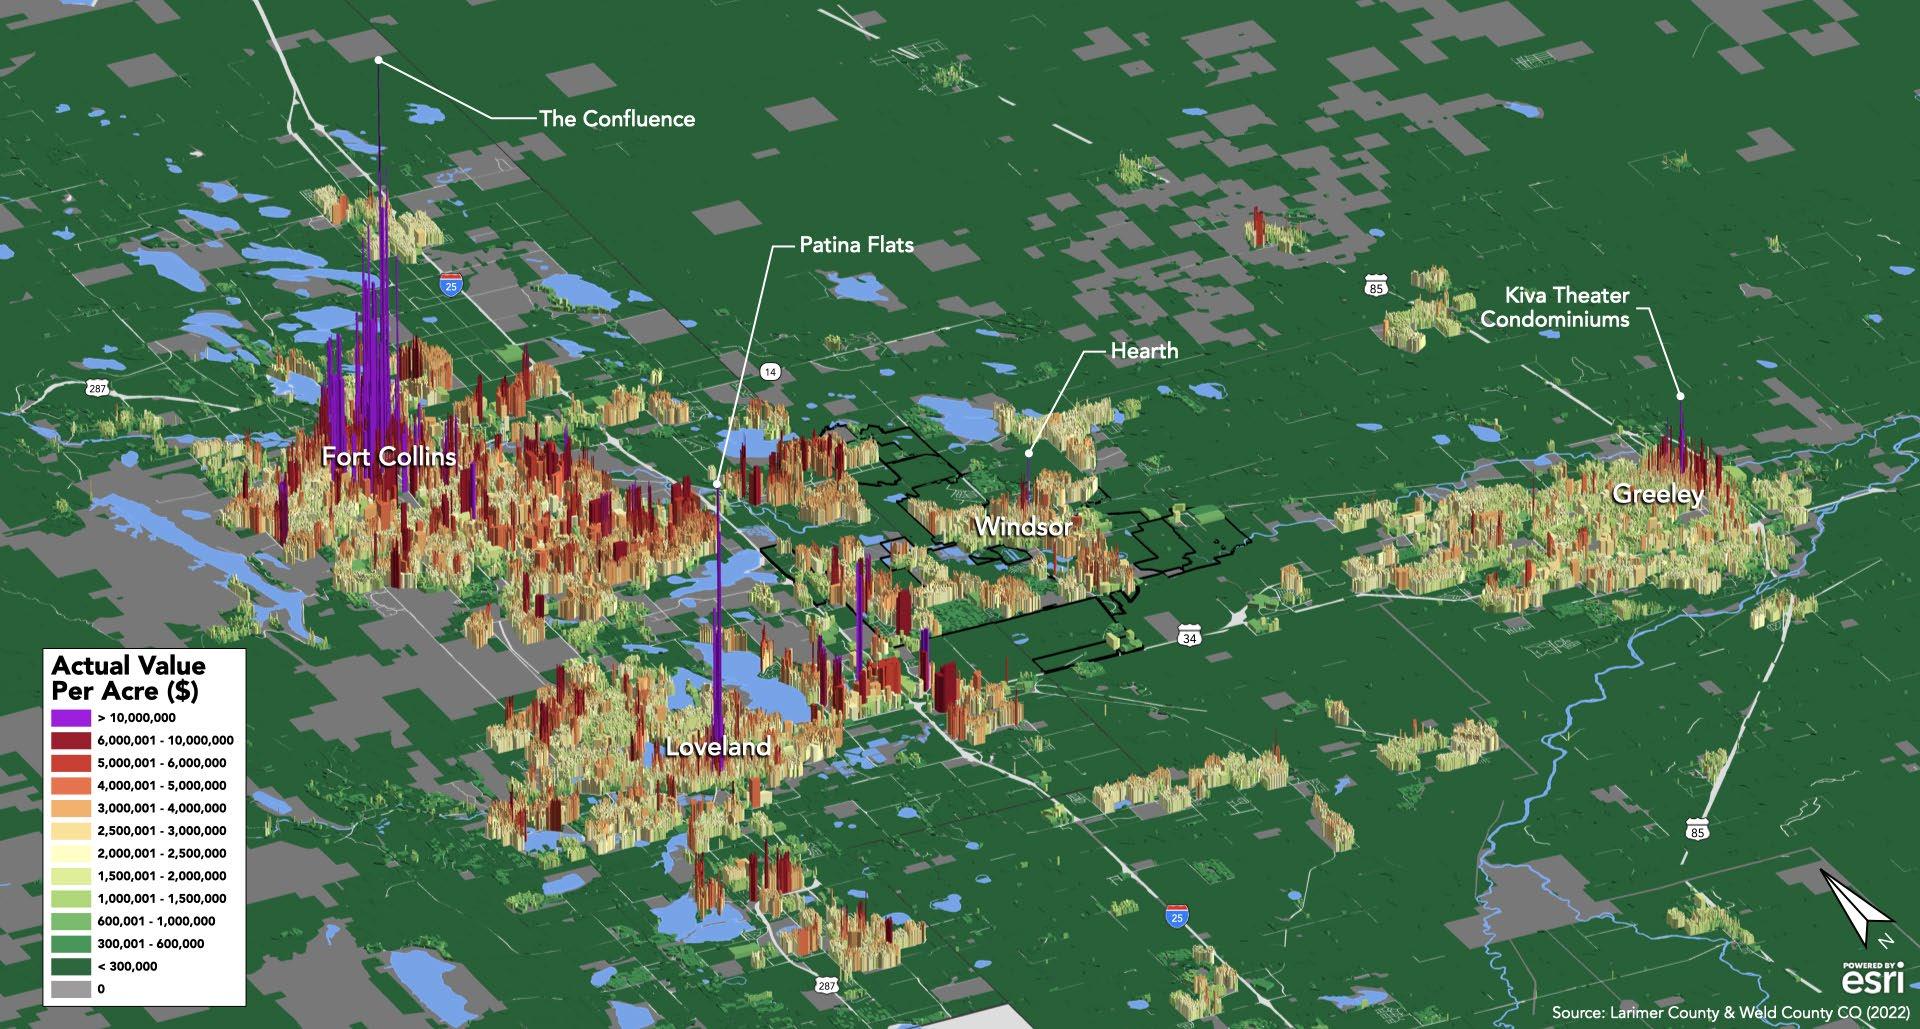
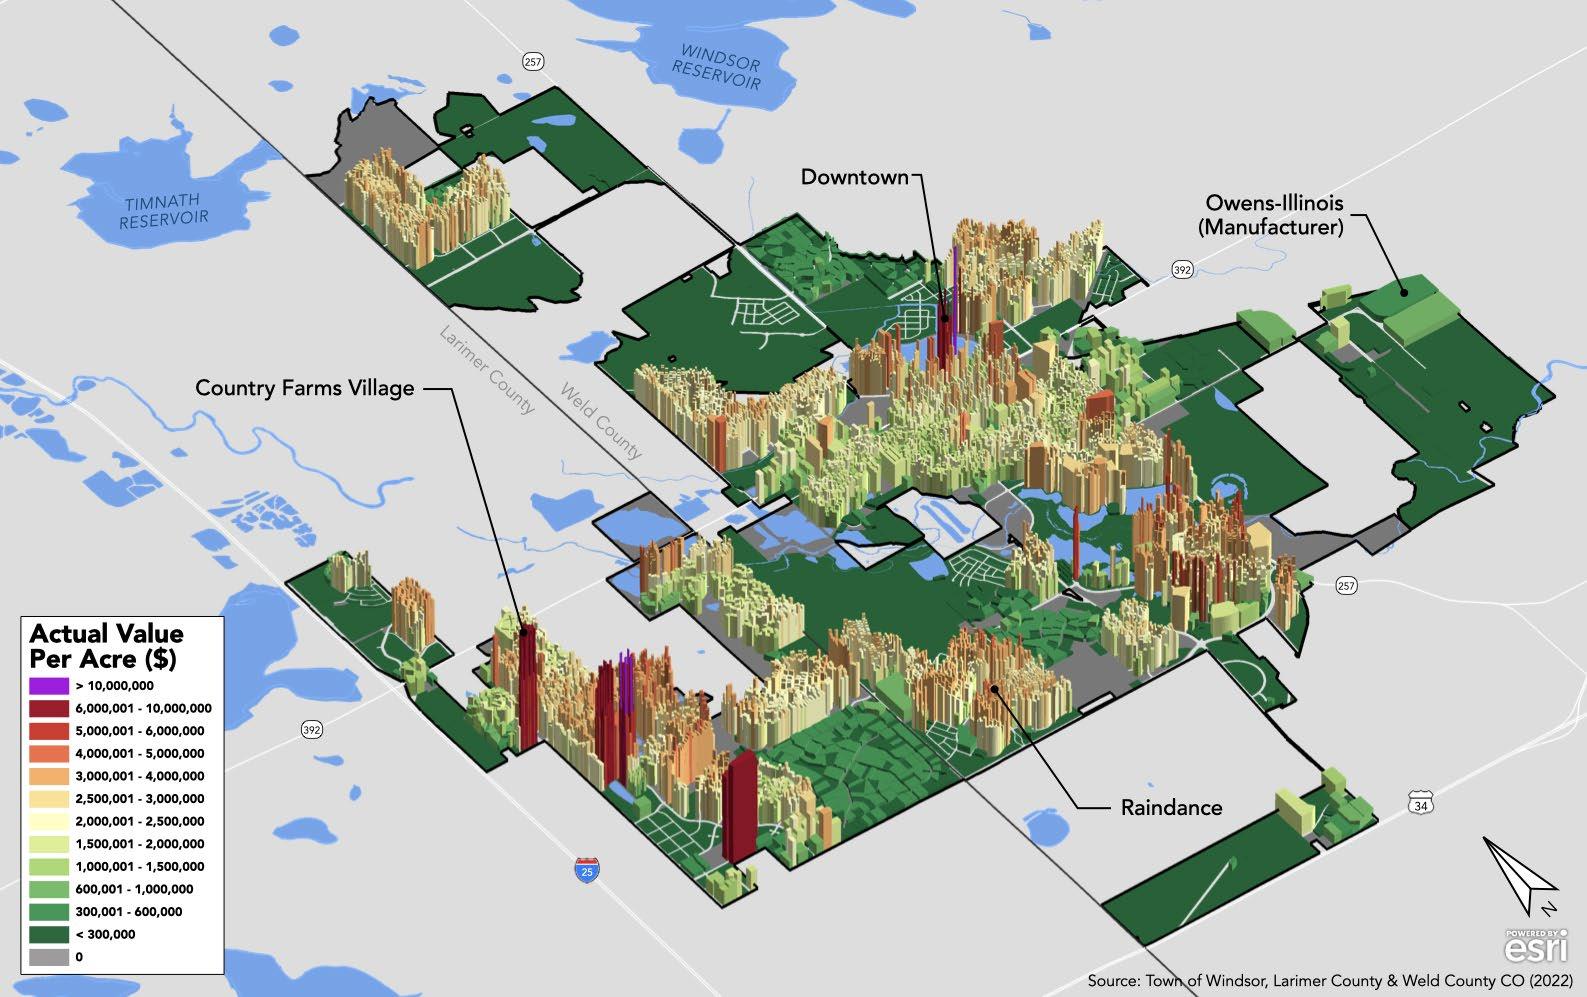
10
Economics of Community Design: Windsor, Colorado
3D Actual Value Per Acre model of Larimer and Weld counties
A-127
3D Actual Value Per Acre model of Windsor, CO
Average Value Per Acre Comparison for Residential Properties
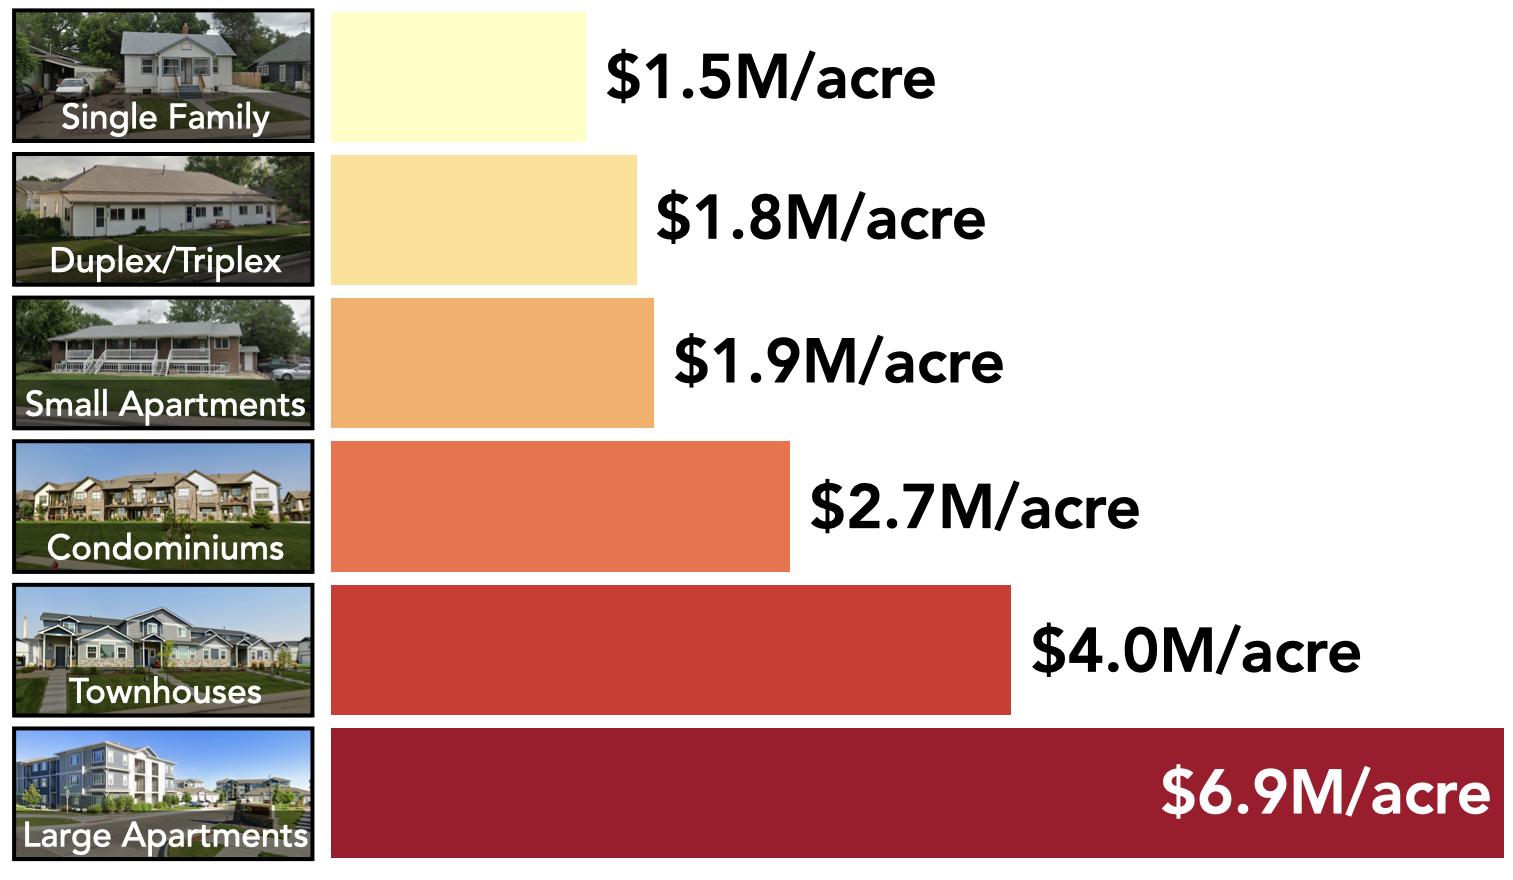
Value Per Acre Comparison for Big Box vs. Main Street Commercial
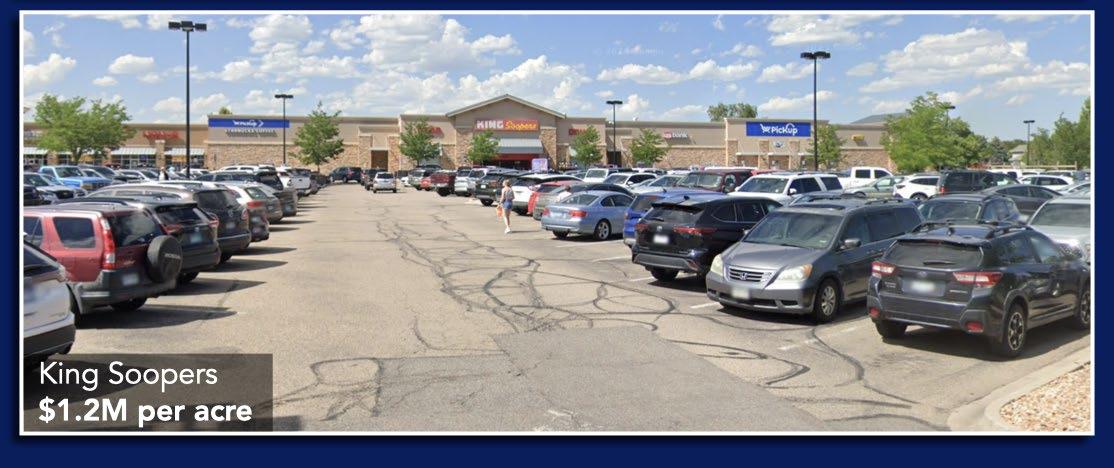
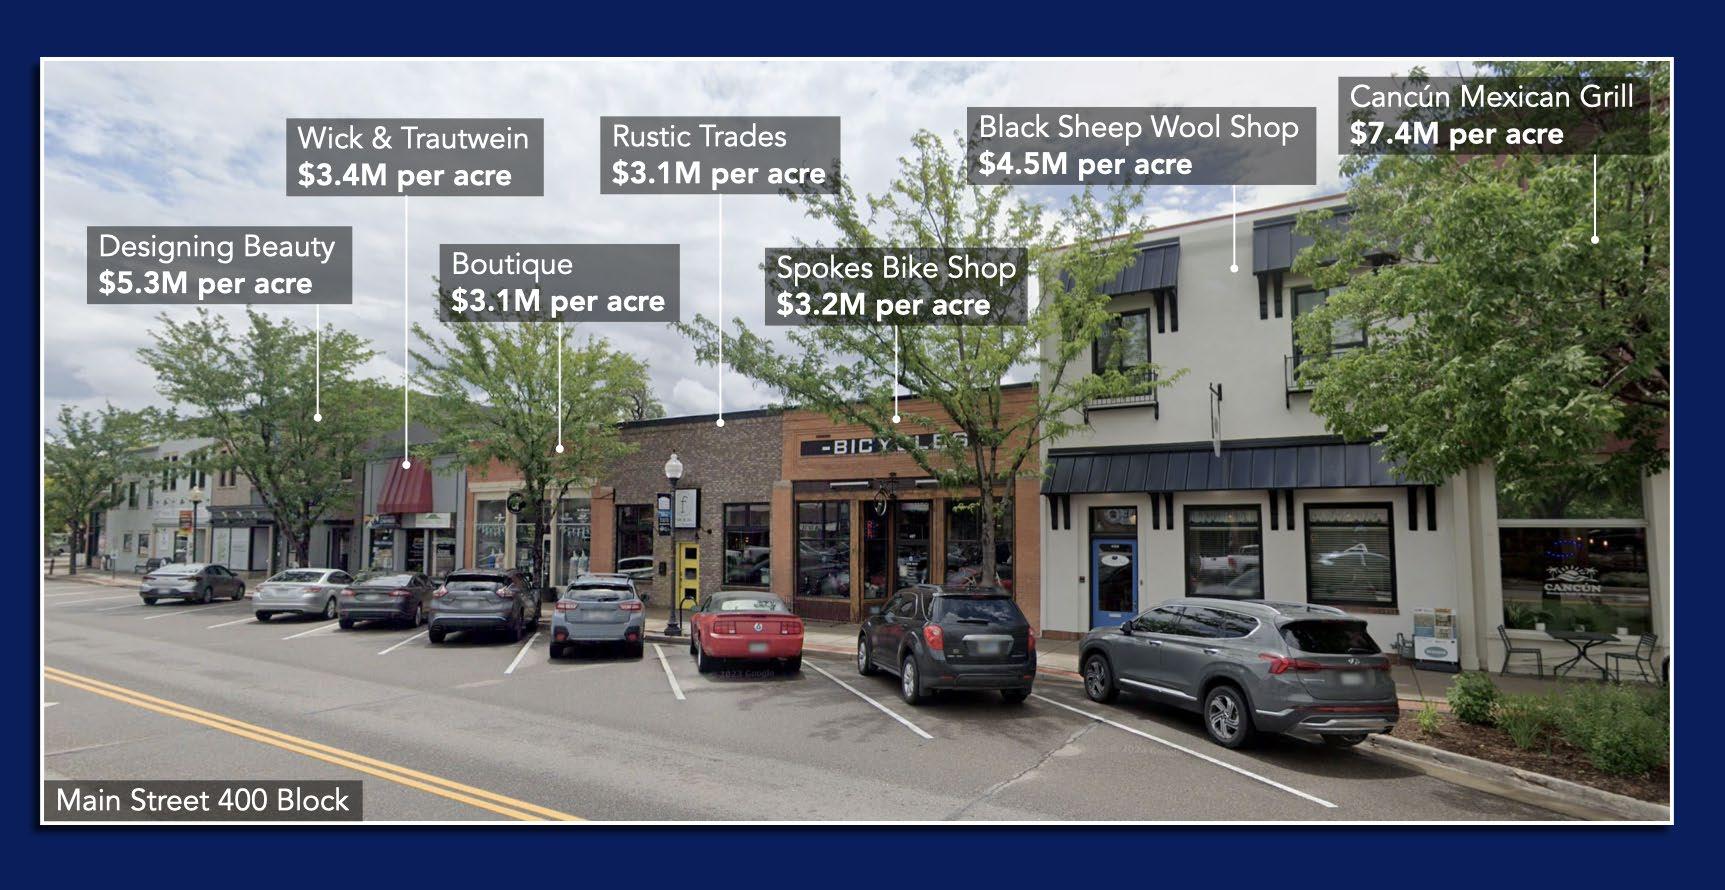
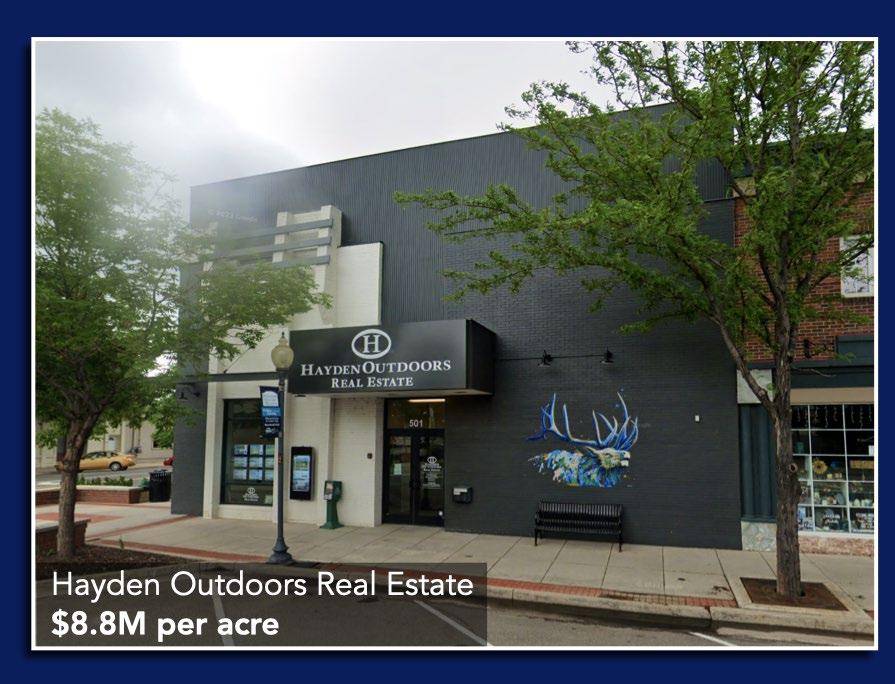
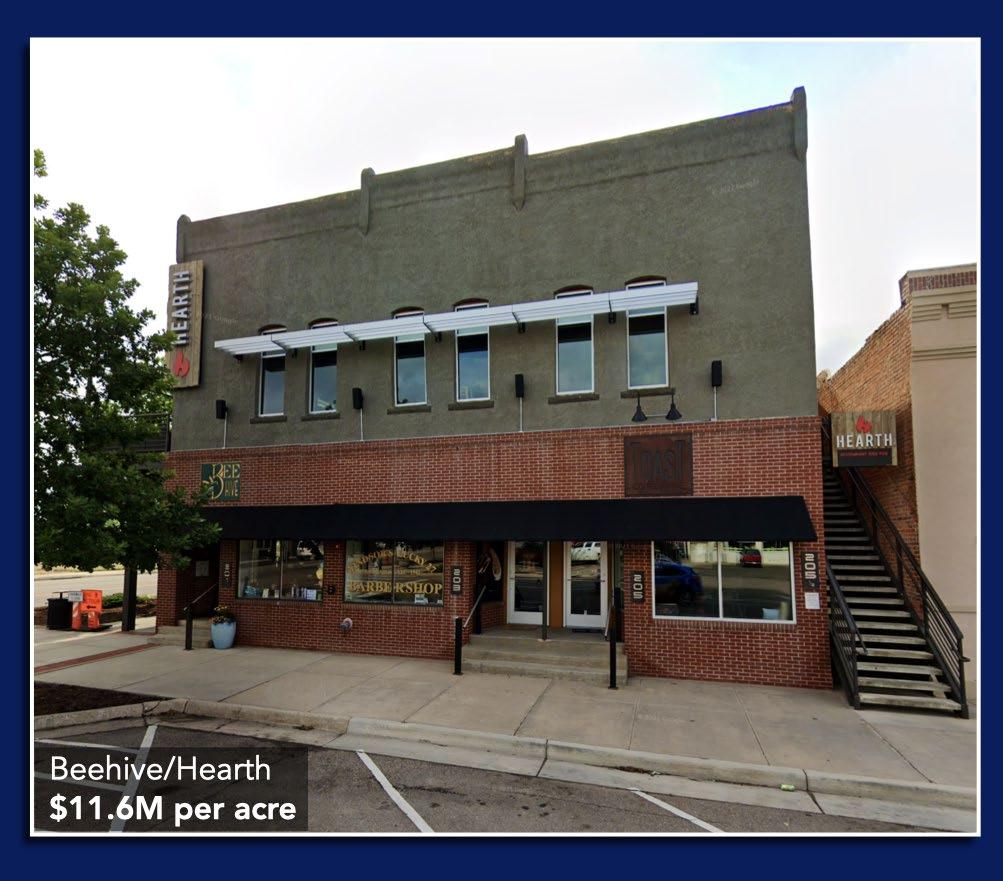
11
A-128 WINDSOR COMPREHENSIVE PLAN |
Taxable vs. Exempt Land
In Windsor, approximately 24% of property is tax exempt, with 76% being taxable. It is important to keep this in perspective when considering what land is available for private development and how that land may be used.
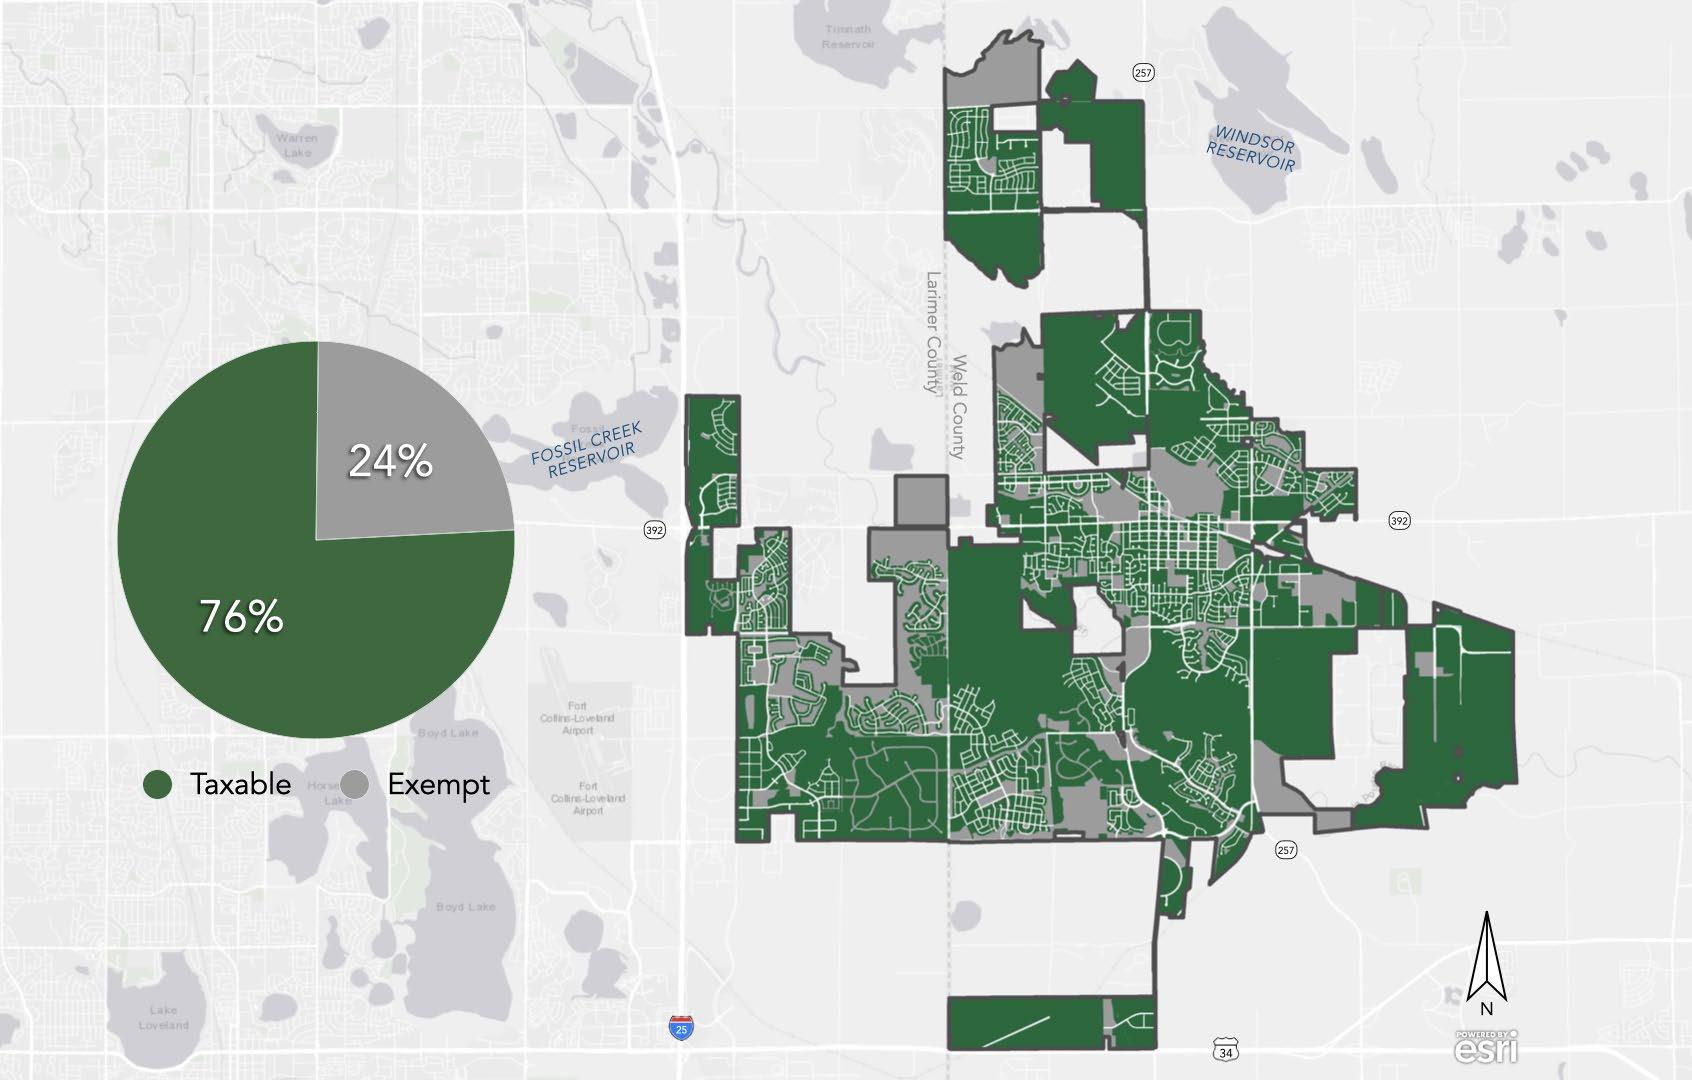
Productivity Ratios
Visual representations comparing the ratio of value to land area between the Town of Windsor and Downtown Windsor helps to shed light on Downtown’s relative productivity. Downtown Windsor is five times as productive as the Town as a whole. While this is not a bad relationship, Urban3 recommends striving for at least 6 times as productive to support a healthy downtown that effectively supports the community.
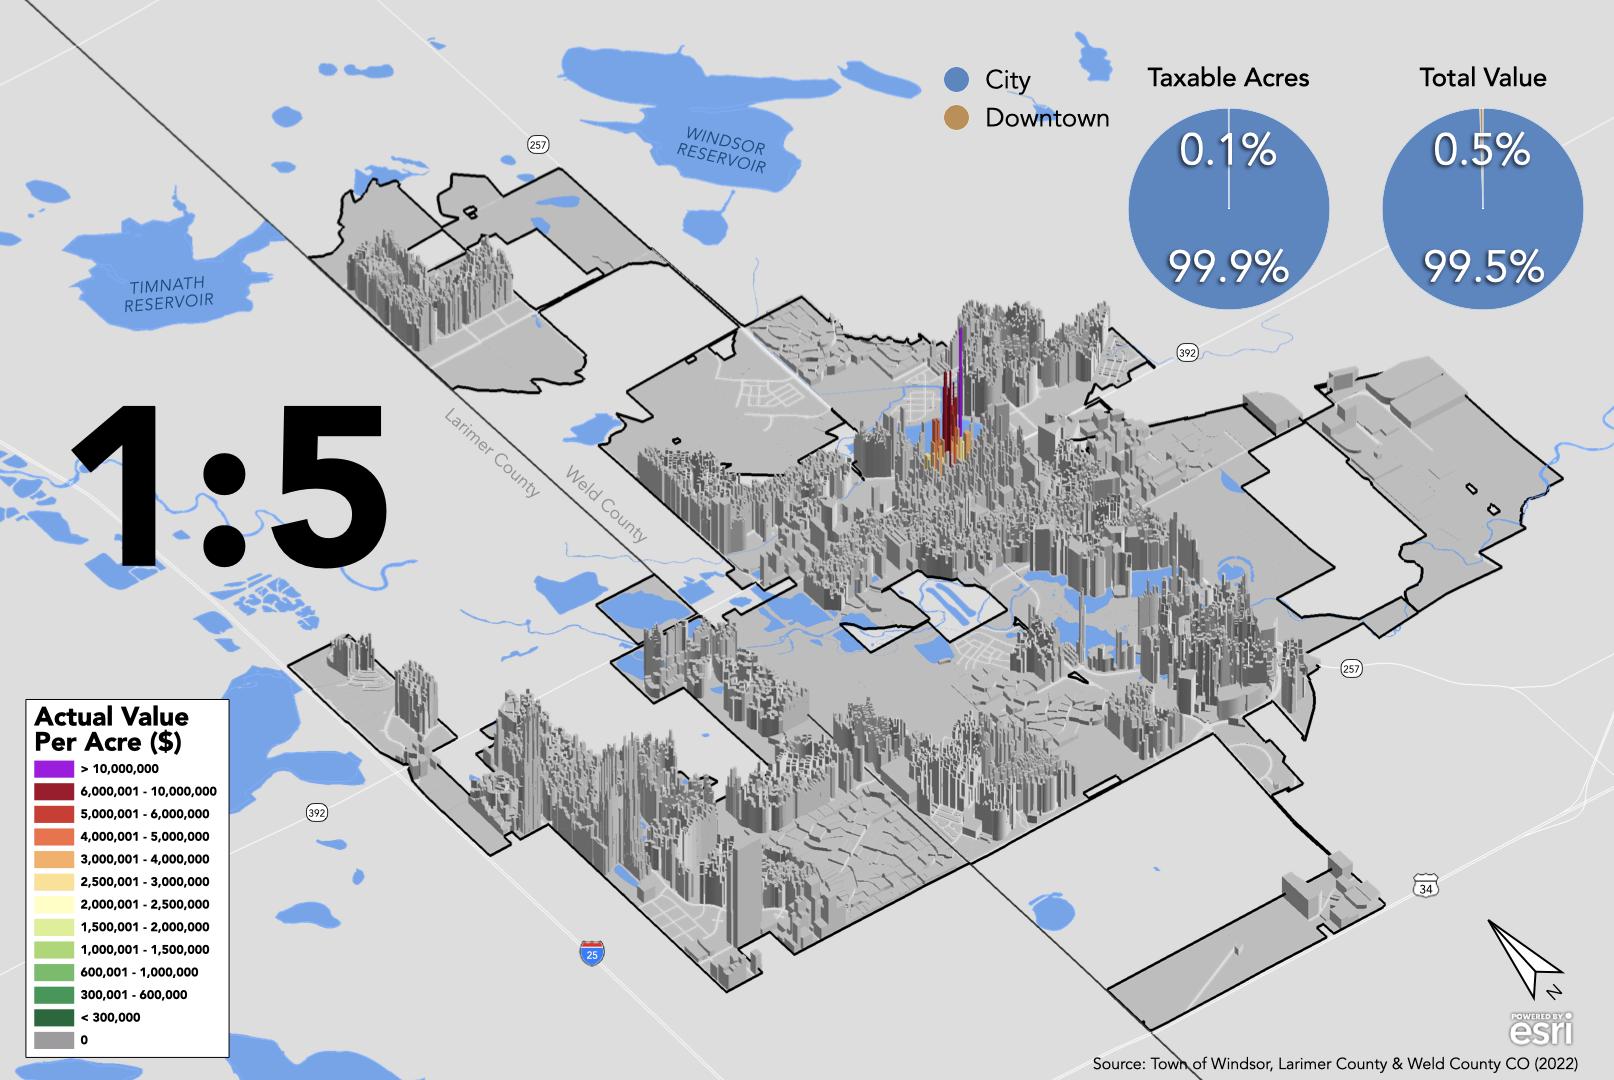
“Downtown Windsor is five times as productive as the Town as a whole.”
12 Economics of Community Design: Windsor, Colorado
Comparing the total acreage and the total value of Downtown Windsor to the whole Town of Windsor yields a ratio of 1:5.
A-129
Land Value Per Acre
The model shown below, which focuses solely on land value per acre, illustrates interesting variations in the value of property across Windsor. By removing the value of any improvements we see nuances in how property is valued. For example, many of the older residential areas close to downtown are relatively low in land value per acre compared to newer subdivisions on the periphery. The land value per acre shoots up particularly when property has been subdivided: generally, the smaller the lot the higher the land value per acre. This is highlighted in situations like the Country Farms Village townhomes (pictured below), which have some of the highest land value per acre in Windsor.
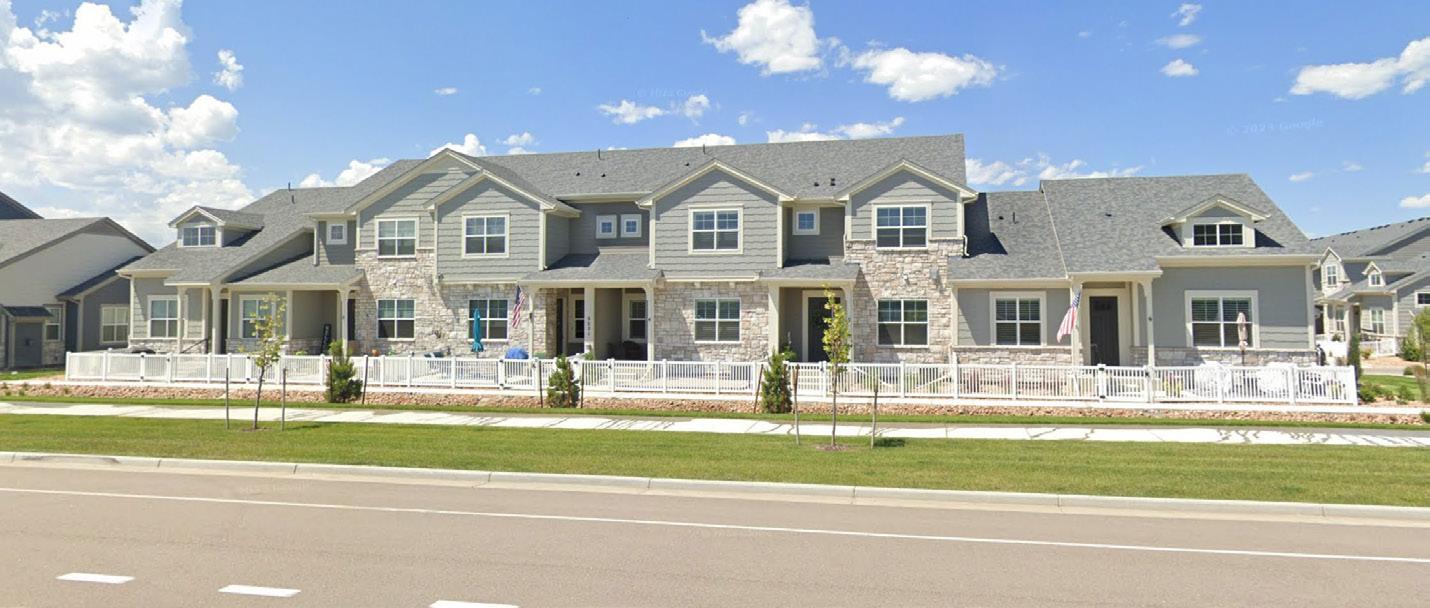
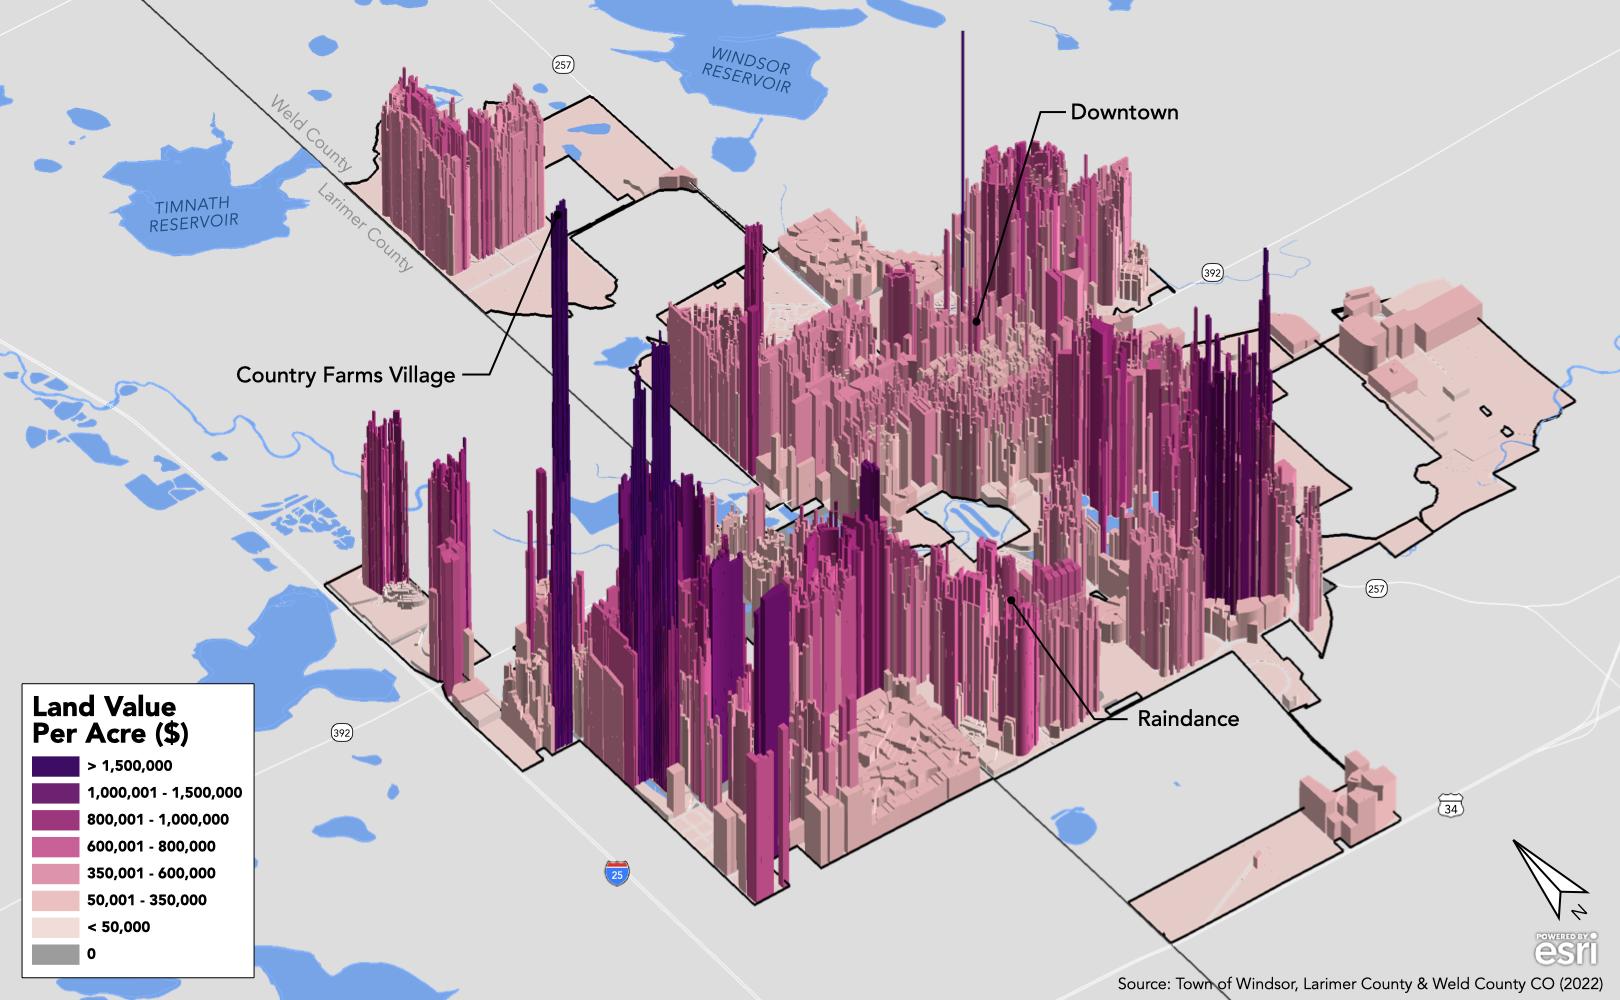
13
A-130 WINDSOR COMPREHENSIVE PLAN |
3D model of Windsor’s Land Value Per Acre
Sales Tax Analysis
Sales tax plays an important role in Windsor’s revenue base, even more so than property tax. Similar to property tax productivity, sales tax productivity is dependent on how land is used in different commercial development patterns. By understanding how different commercial property development patterns influence sales tax productivity, Windsor can make knowledgeable choices about what development patterns to encourage.
Sales tax data was mapped in Windsor using geographic boundaries larger than parcels in order to preserve the anonymity of indi-
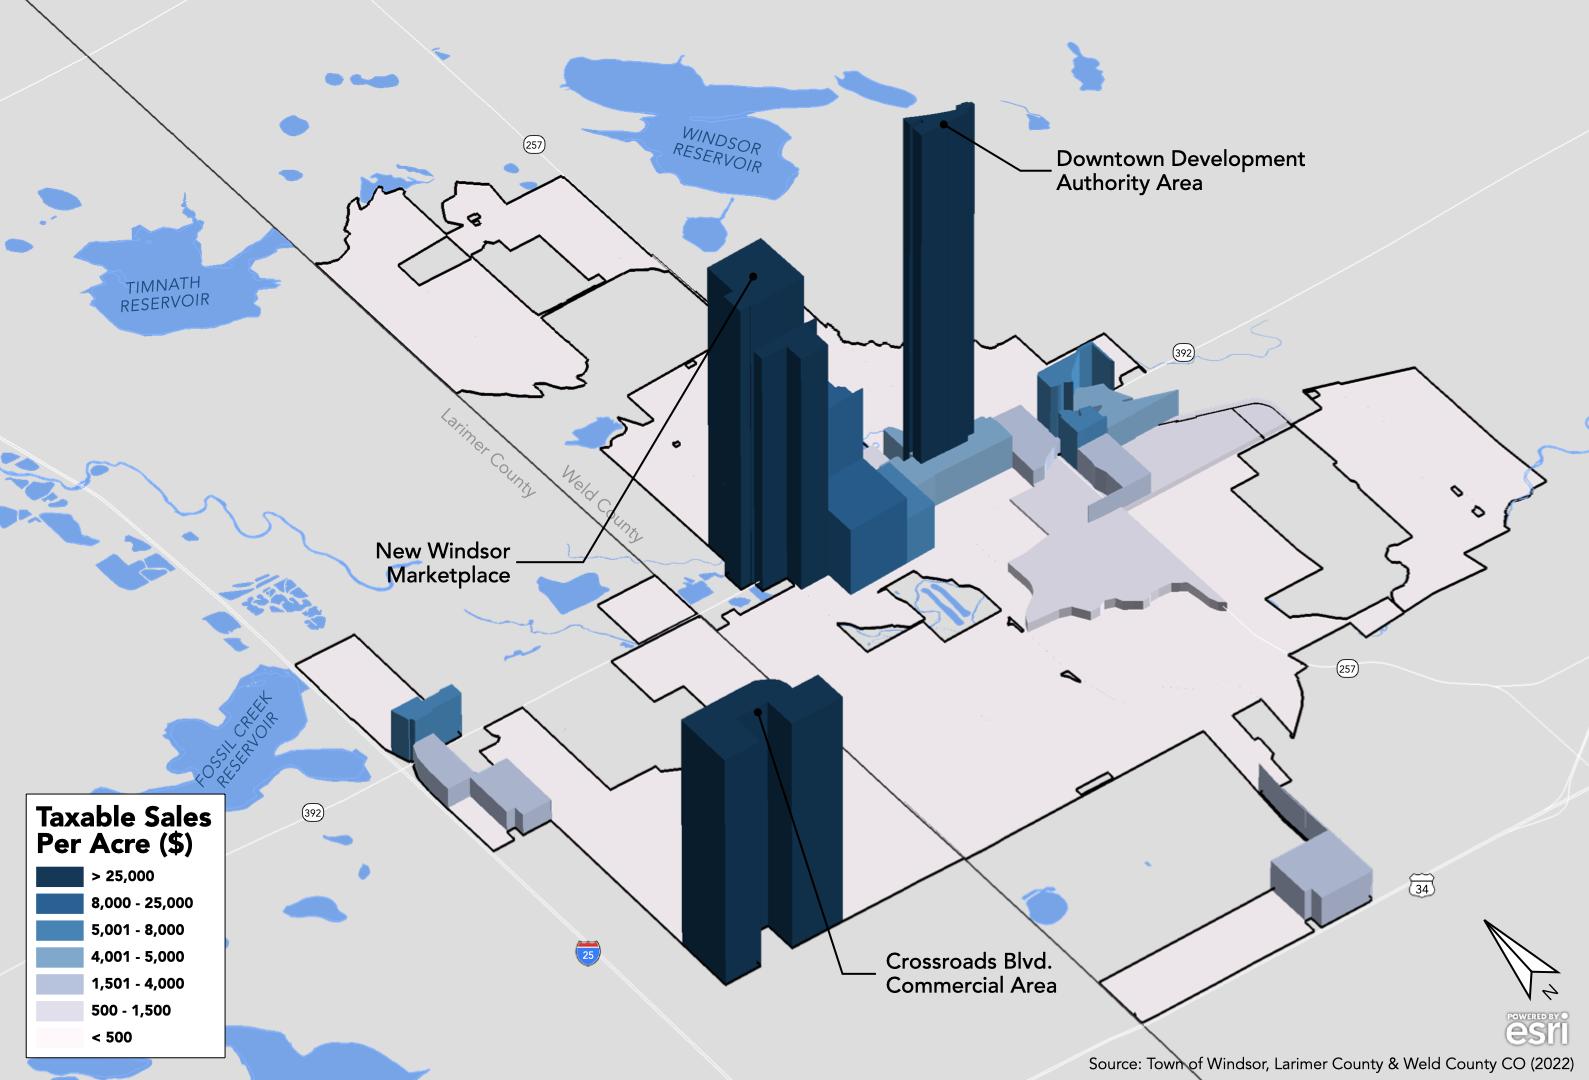
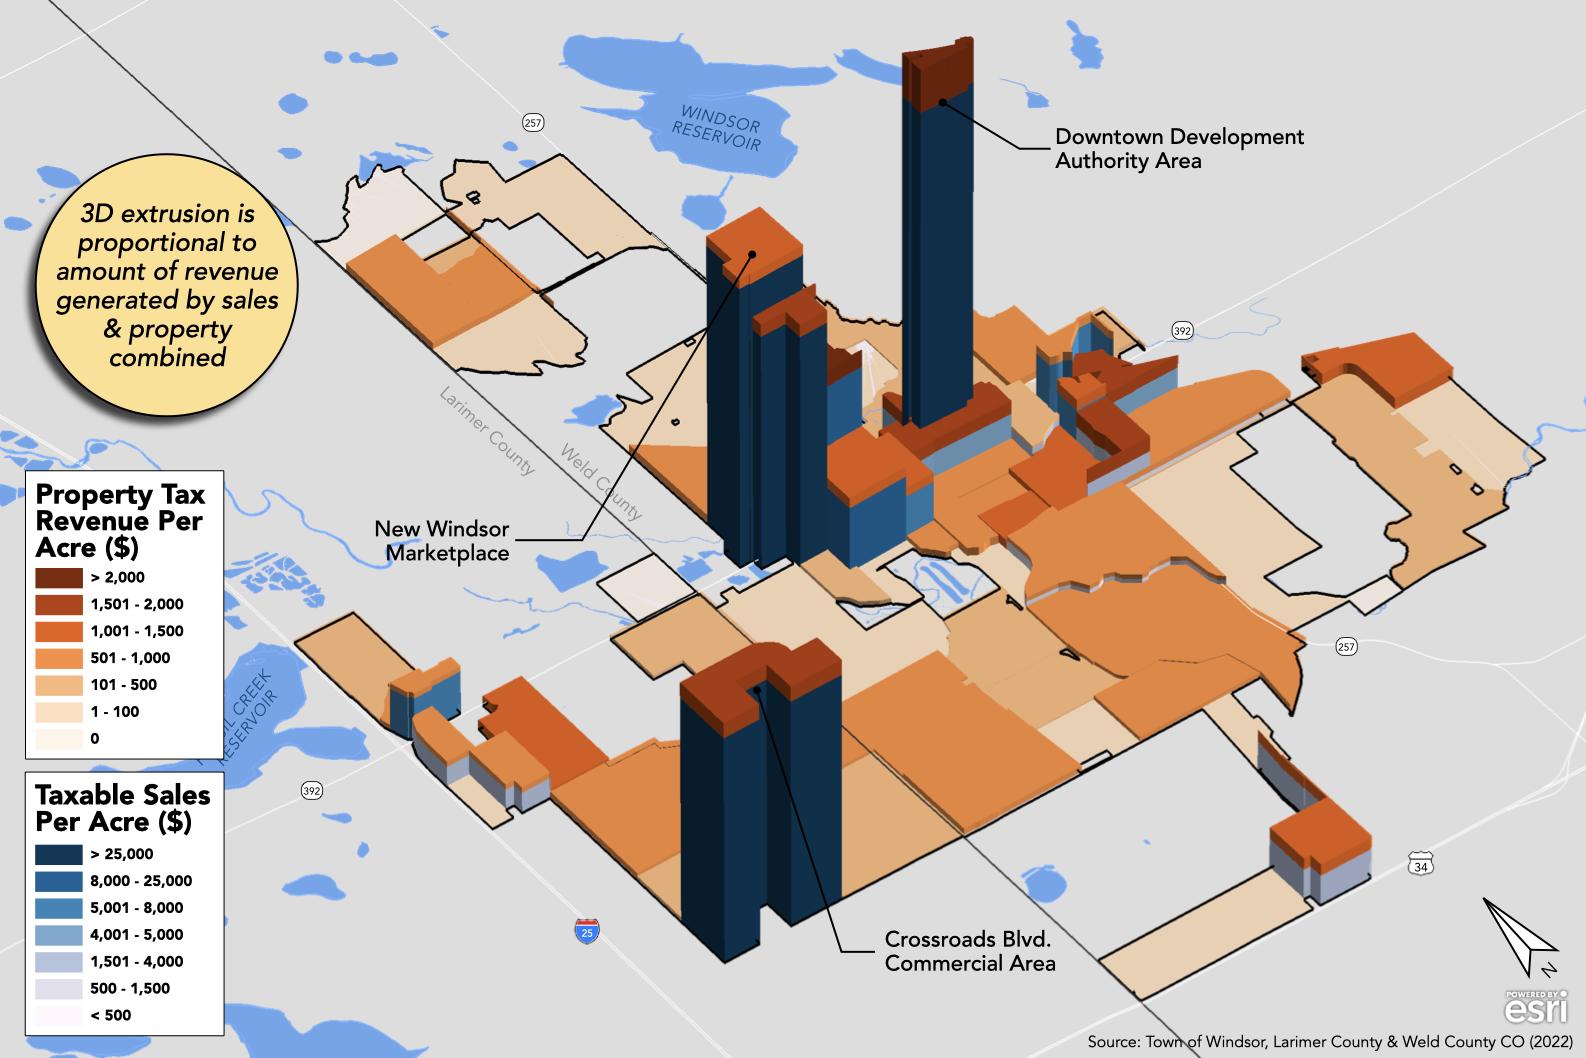
14 Economics of Community Design: Windsor, Colorado
A-131
vidual businesses. However, these areas can be compared by considering the general commercial land uses they contain. For example, the zone described by the New Windsor Marketplace is one of the most productive areas in town from a sales tax value per acre perspective, with a similar productivity to downtown. The same is true for the Crossroads Boulevard area near Fairgrounds Avenue.
However, when considering both sales and property tax productivity, the economic strength of Downtown Windsor shines. Though lower density commercial areas are productive for Windsor’s tax base, the even higher potency of main street style development is clear.
Growth Over Time
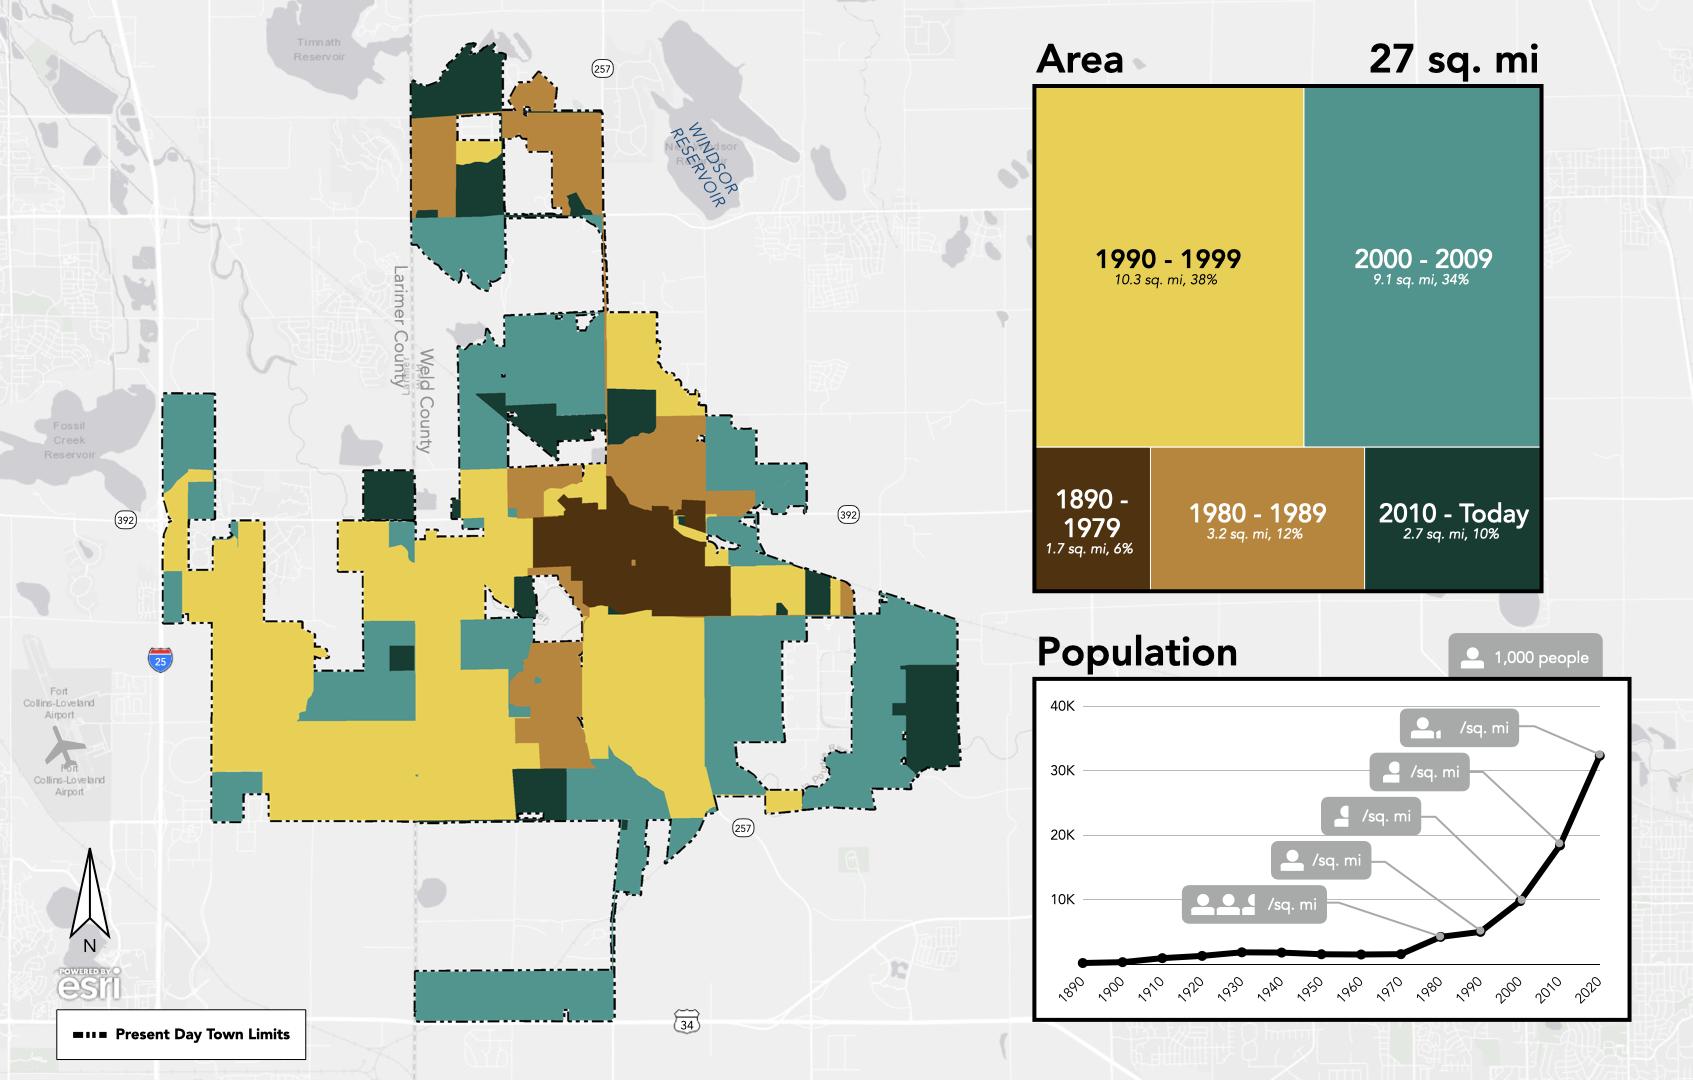
Windsor’s growth pattern, 1890 - today
Windsor has experienced significant growth over the past few decades. Since 1980, Windsor has increased by about 30,000 people, nearly eight times the population in 1980. With this growth, Windsor has expanded and annexed significant amounts of land. Up until 1980 Windsor saw stable growth, reaching a population density of about 2,500 people per square mile. However, by 2010 Windsor added nearly 23 square miles of territory, increasing its size by more than fourteen times its area in 1980. Over that time, Windsor’s population only grew a little more than four times its 1980 population. This led to a population density of about 750 people per square mile. From then to the present, Windsor has slowed its horizontal expansion and added more people, with a current population density of around 1,200 people per square mile.
15
A-132 WINDSOR COMPREHENSIVE PLAN |
While expanding its borders and population, Windsor also expanded its road network. The road network, and related feet of road per person, followed a similar pattern as the population density, just in the opposite direction. In 1980, Windsor only had about 31 feet of road per person, but by 2010 had increased by more than 1.5 times to nearly 50 feet of road per person. It has since dropped to about 40 feet per person, but future development will determine where the number goes from here.
The chart below helps us visualize the compounding of road building over time in Windsor. Road building really picked up starting in the 1980s and 1990s, reaching a peak in the 2000s. As these roads reach the end of their useful life and need to be rebuilt, the costs will be significant and stack up as other roads reach their second and third rebuild cycle. It is important for the Town to consider these costs and the impact of new roads on road maintenance budgets.
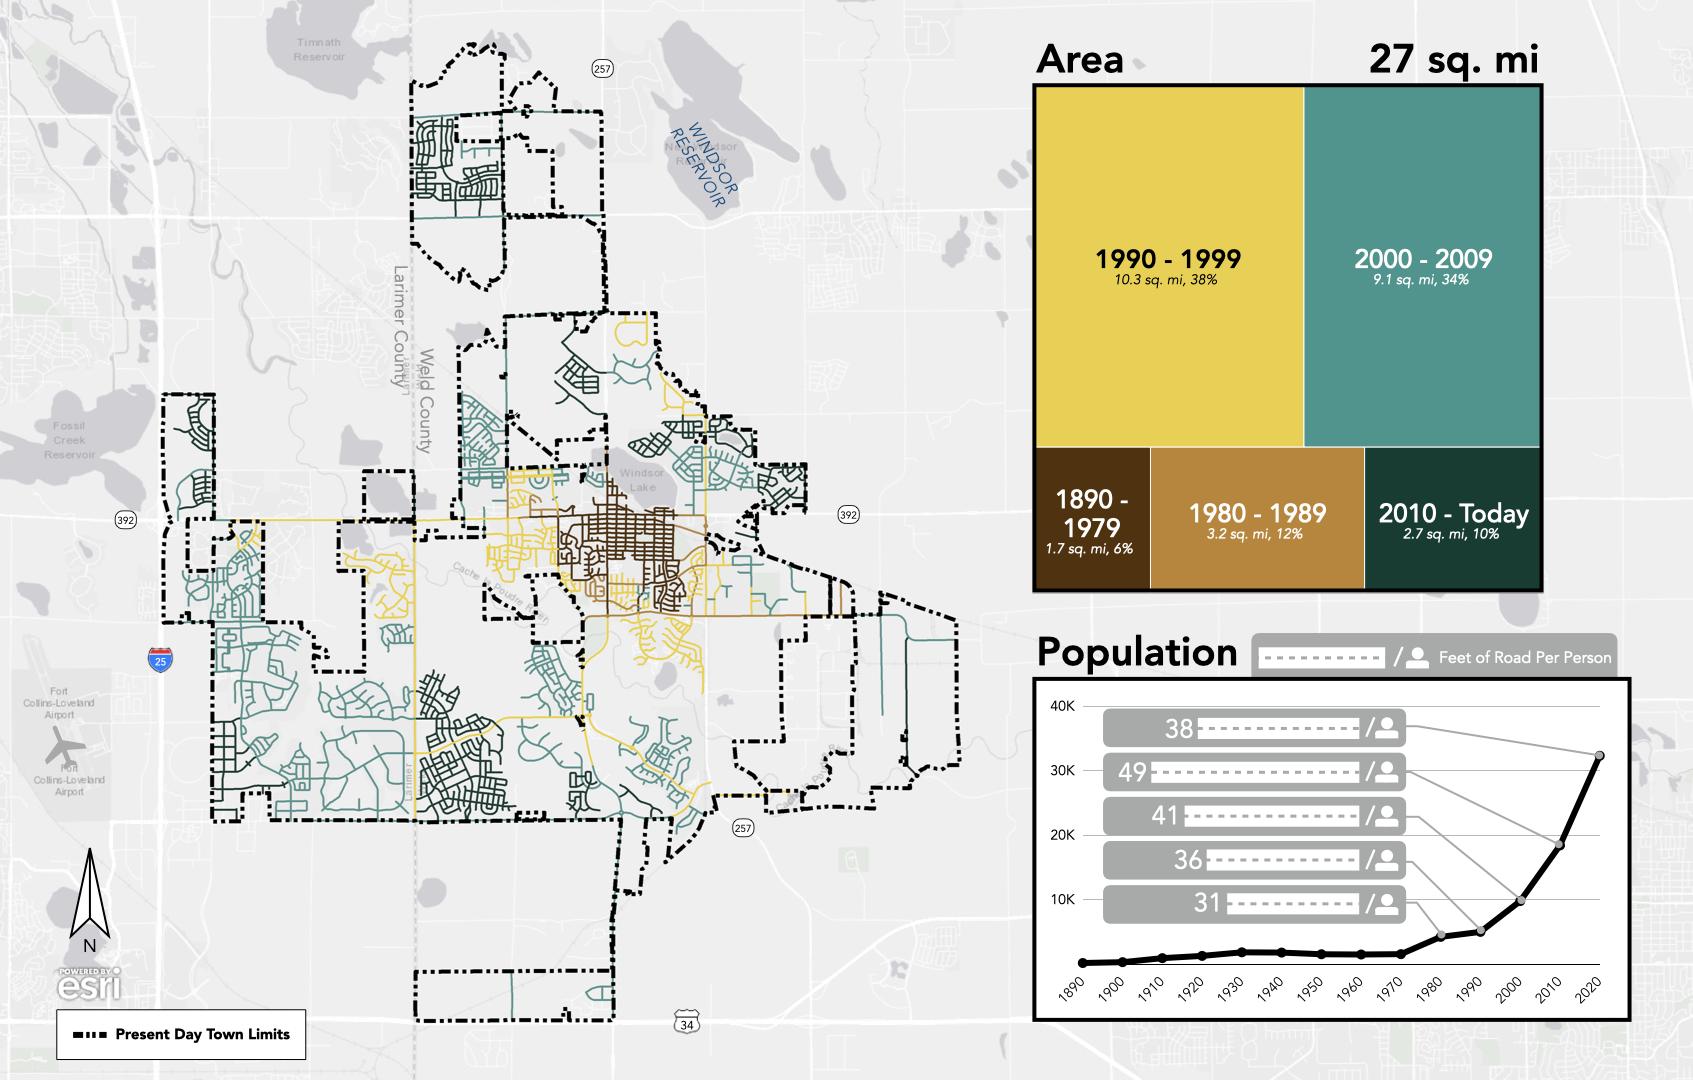
“As these roads reach the end of their useful life and need to be rebuilt, the costs will be significant and stack up as other roads reach their second and third rebuild cycle.”
16 Economics of Community Design: Windsor, Colorado
Windsor’s growth pattern illustrated on its road map, 1890 - today
A-133
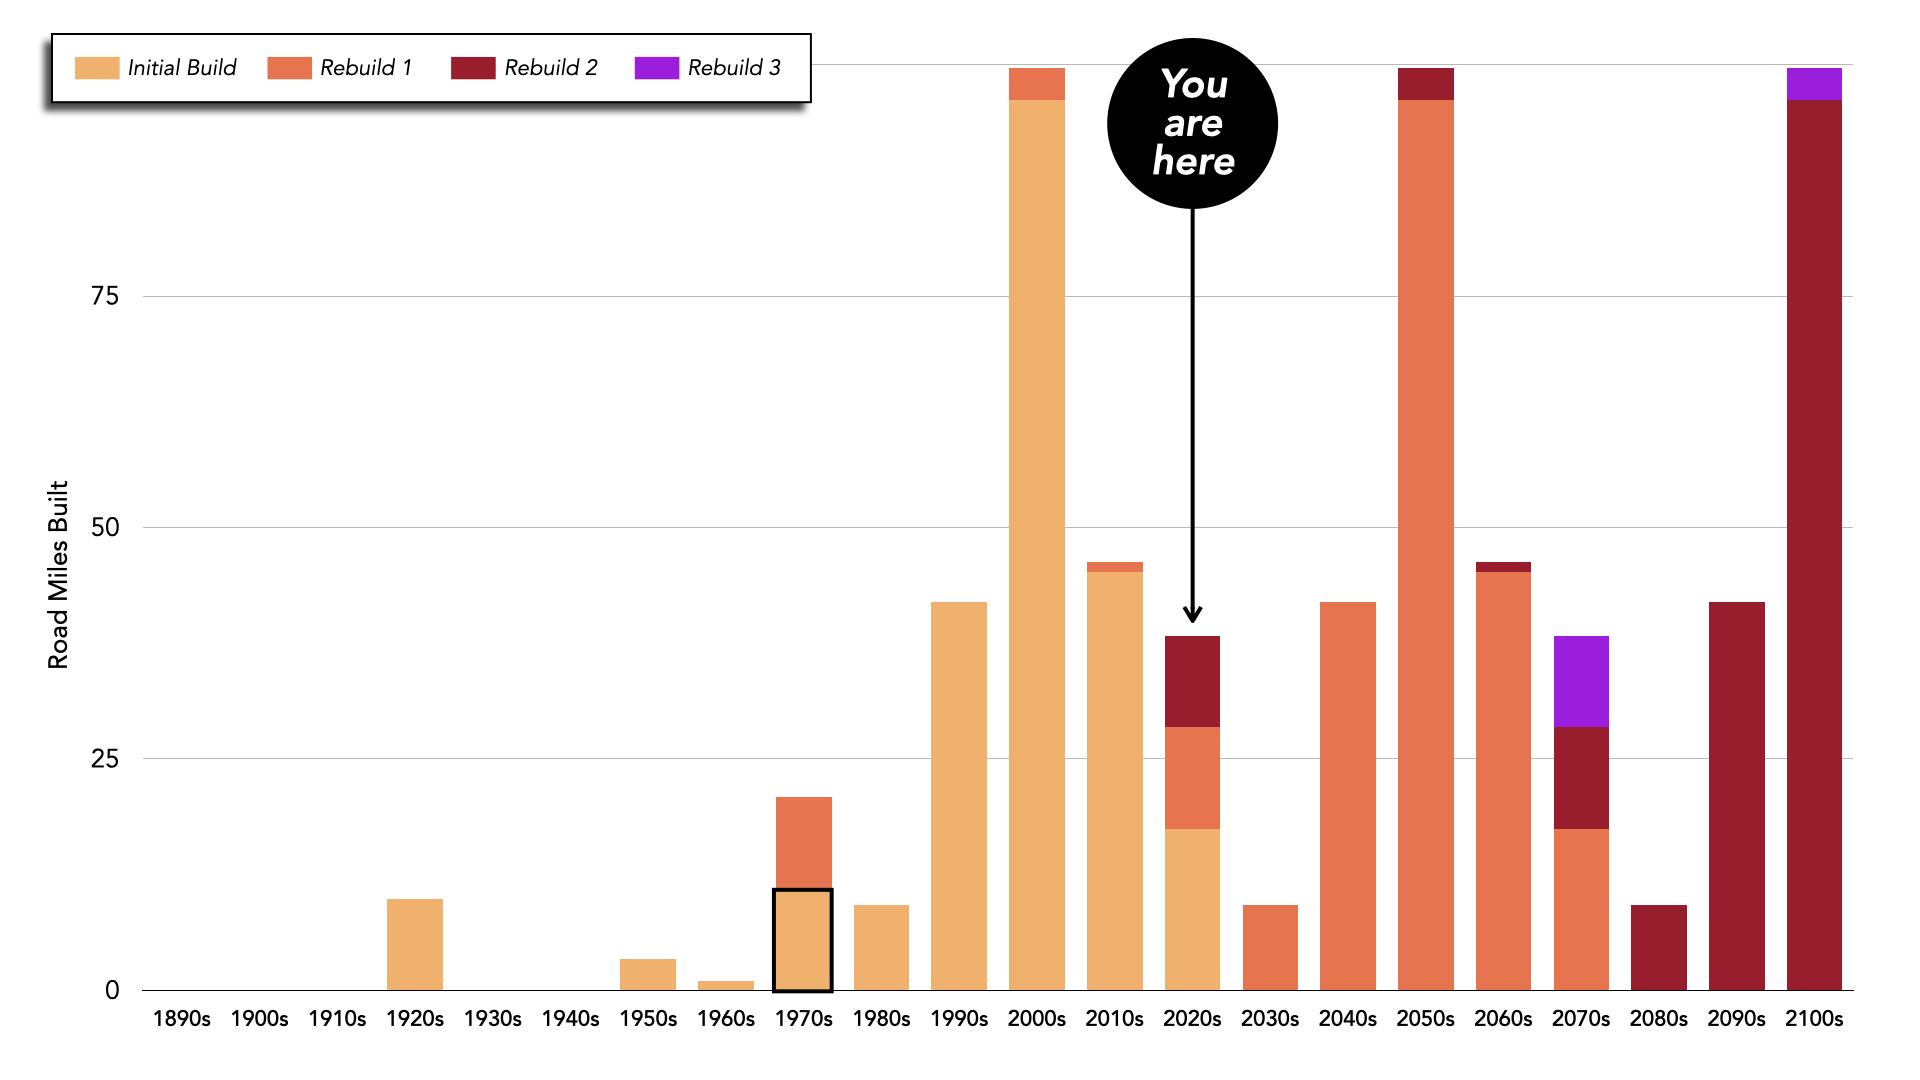
Infrastructure Analysis
Nowthat we have an understanding of the revenue implications of Windsor’s development pattern, we can move on to analyzing the Town’s infrastructure systems and the costs associated with maintaining them. Urban3 uses a different methodology when it comes to considering the costs of infrastructure systems by taking into account the complete lifecycle costs associated with maintaining and operating these systems year after year. Once a jurisdiction puts infrastructure in the ground, it is typically responsible for maintaining that infrastructure in perpetuity. Ongoing maintenance and eventual replacement of these systems is costly, though more frequent maintenance schedules can extend the lifetime of these systems and improve the average system quality before replacement is required. Though this expenditure can seem more costly up front, it pays for itself by reducing the frequency of replacement, which is the most expensive action taken in infrastructure maintenance.
First, on the following page, we consider each of the main infrastructure systems Windsor is responsible for: roads, water, sewer, and stormwater. Each system varies in scale, but each is significant. Looking at the annual lifecycle cost for these systems, we get an understanding of the budgetary commitment required for their maintenance.
“Once a jurisdiction puts infrastructure in the ground, it is typically responsible for maintaining that infrastructure in perpetuity.”
17
Road maintenance load and rebuild schedule (conceptualized chart)
A-134 WINDSOR COMPREHENSIVE PLAN |
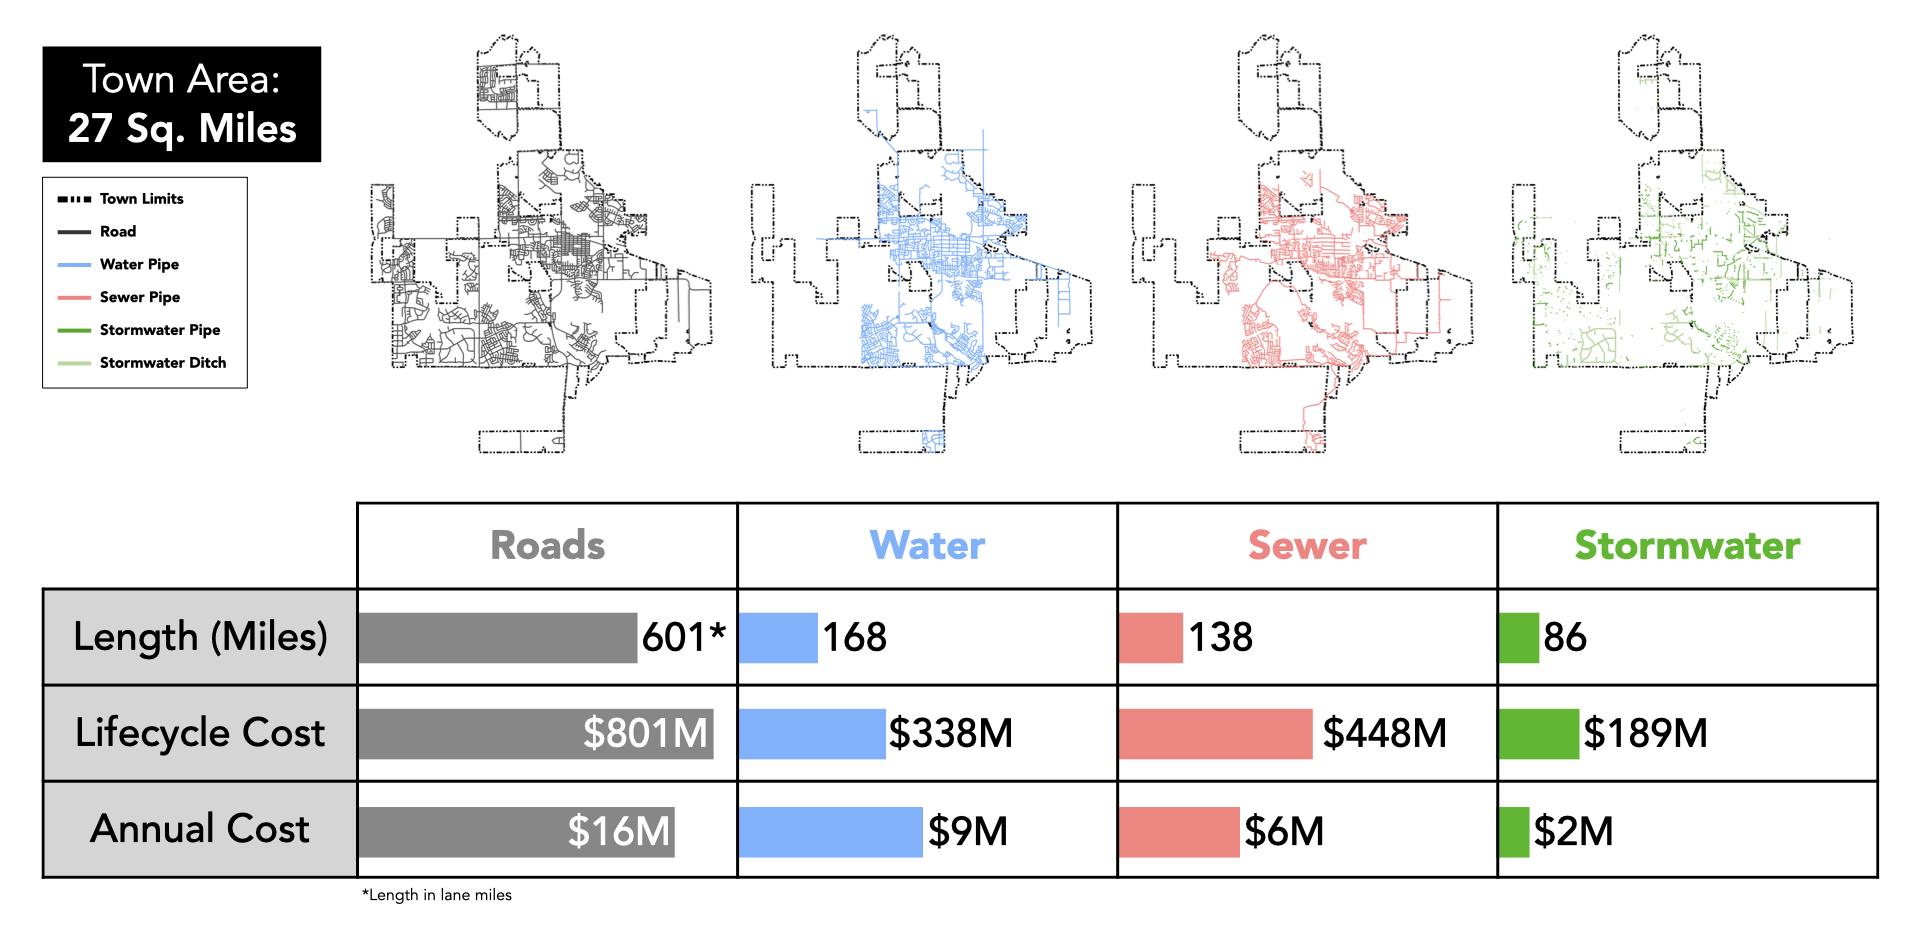
Sewer Fund Budget History
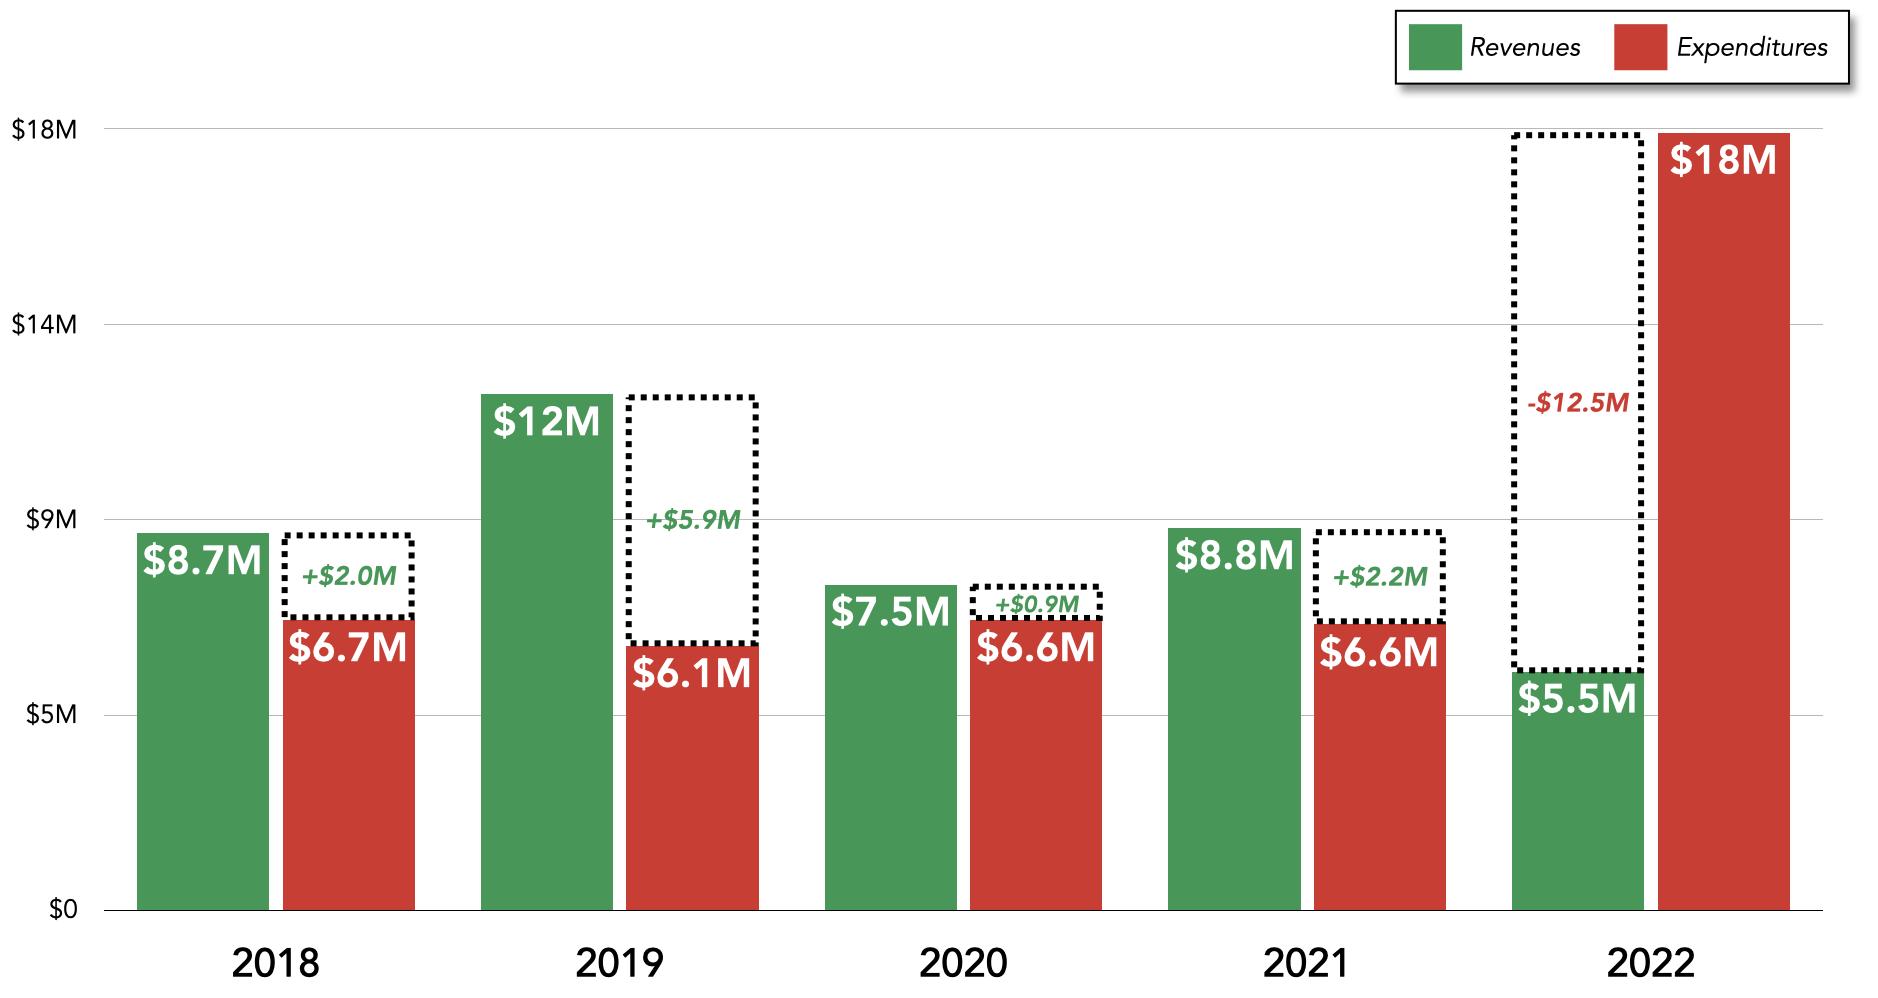
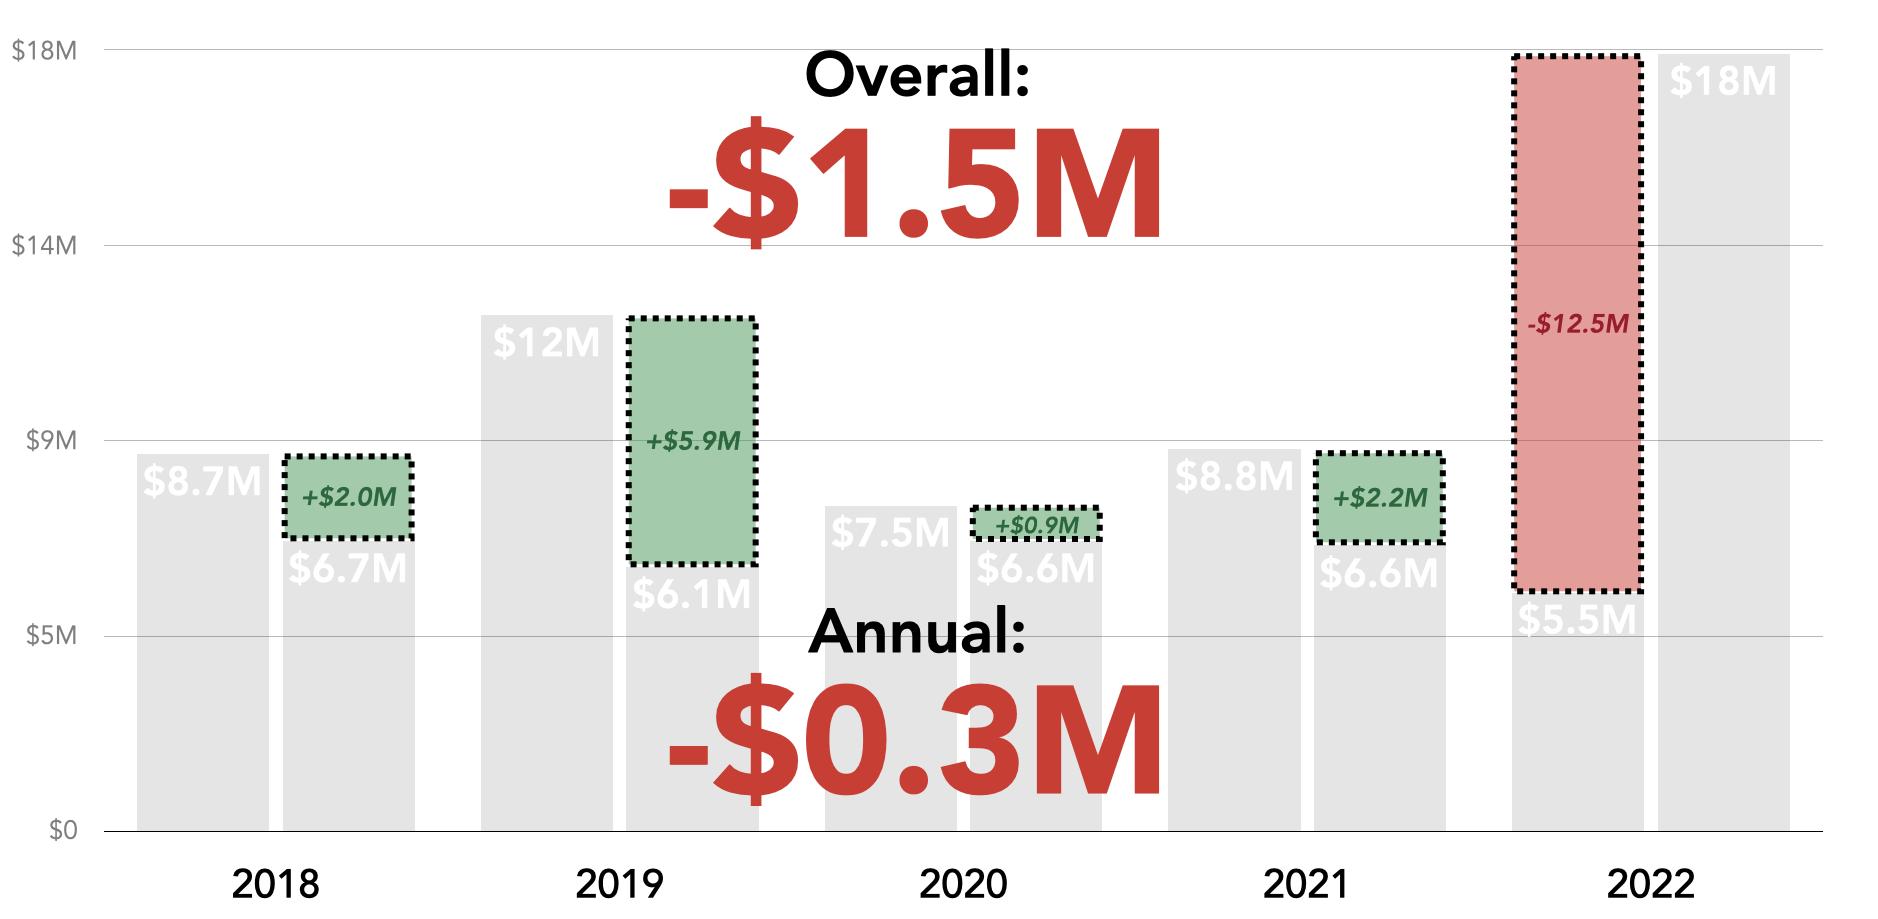
As an example, we look at the sewer system and its revenue versus expenditure over the past few years. From 2018 to 2021, the sewer fund ran at a surplus. But then in 2022, there was a major capital expenditure that had to be made. If you average it out from 2018 to 2022, there was a net deficit of about $300,000 per year for the sewer fund. This isn’t too bad, but shows the nature of funding these infrastructure systems.
There is an ongoing cost for annual maintenance, but periodically there will be major expenses for large capital investments. These should be considered in the annual budgeting for the system.
18 Economics of Community Design: Windsor, Colorado
Windsor’s key infrastructure types: Roads, Water, Sewer, and Stormwater
A-135
Average Infrastructure Spending: 2018-2022
We then compare the average annual expenditure for each system over the past 5 years compared to Urban3’s systems analysis. At first, it looks like each system is covering the needed costs. However, when we start to break down expenditure, we can see that it is composed of three main pieces: operation and maintenance; capital operations and maintenance; and new capital, or adding new infrastructure. This last piece, adding infrastructure, actually increases the future expenditures through expanding the current system. We don’t want to compare that to maintaining the current system, so if we remove that piece, we can see that most systems aren’t keeping up with the required expenditure to maintain them.
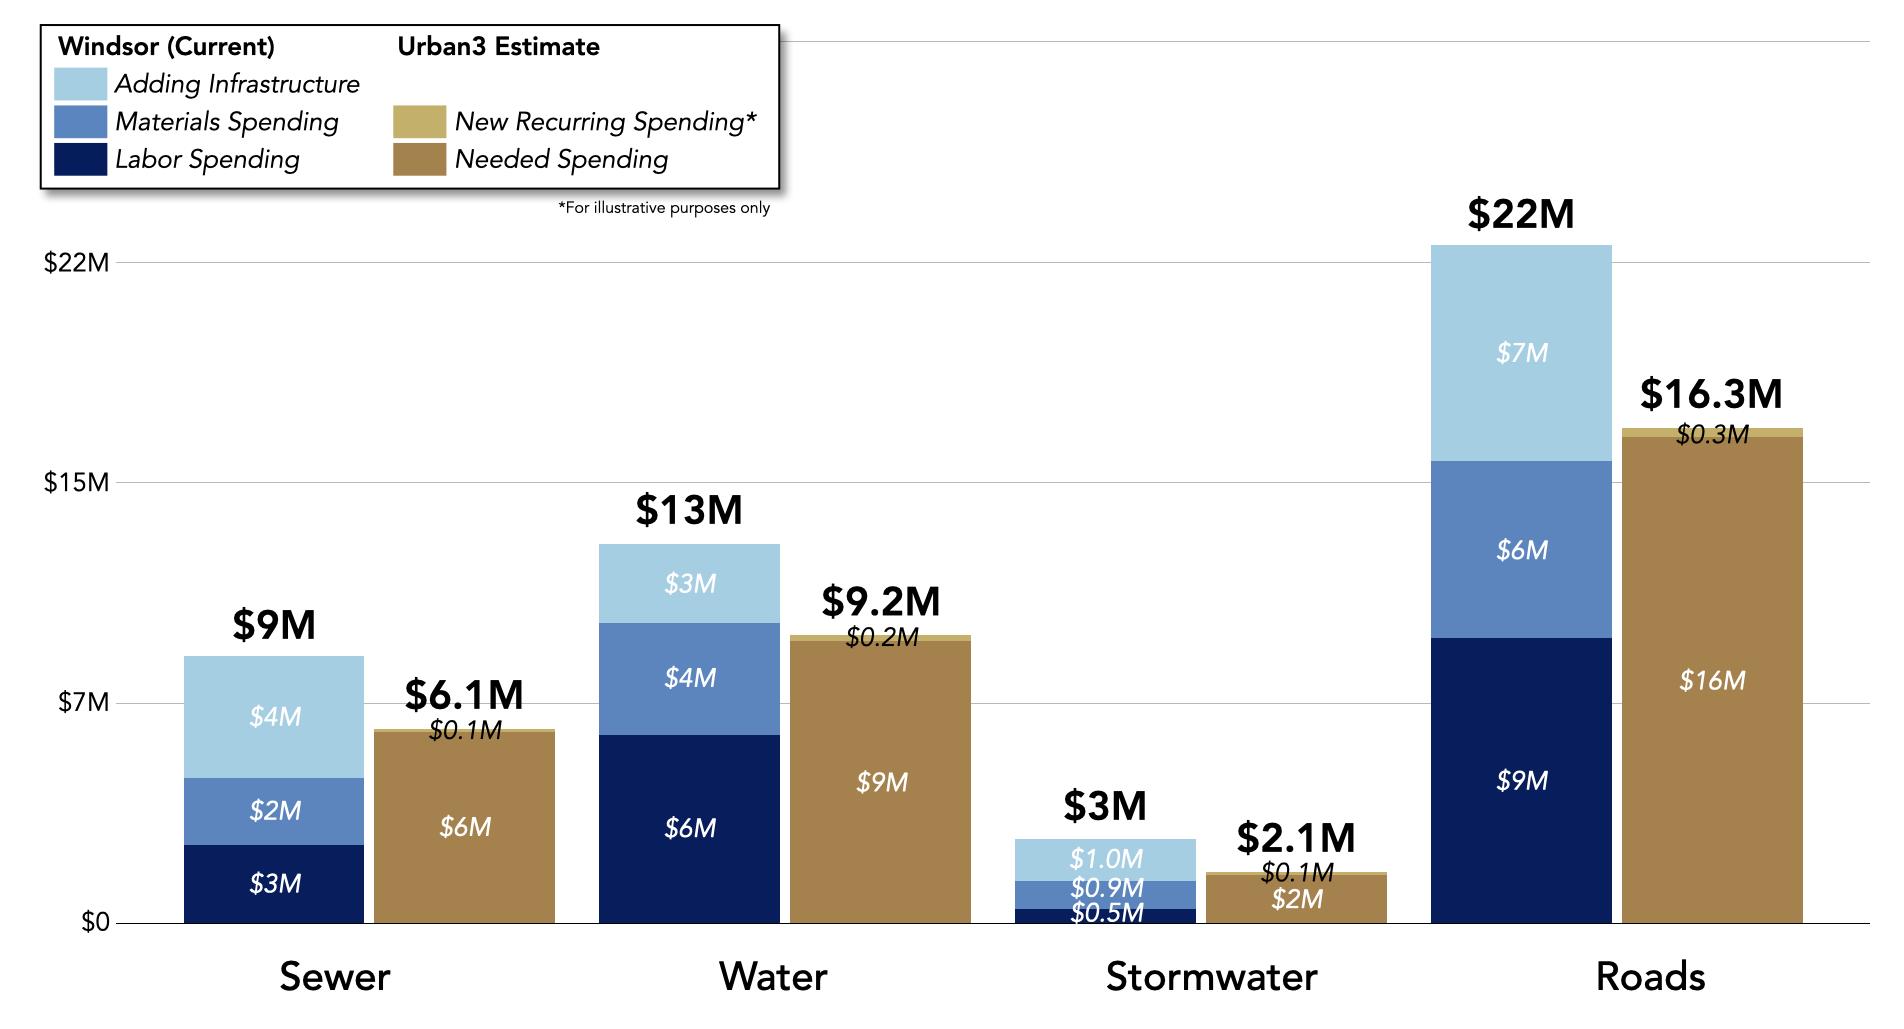
Return on Investment (ROI)
From here, we spatialize the cost data and compare it to revenue. We map the total revenues of Windsor against the total costs to see what areas of town are net revenue or cost producers. When we net out the costs against the revenues, we see that commercial and mixed use areas tend to be net producers for Windsor, compared to residential areas. This is a function of the tax system that Windsor operates under in Colorado, with commercial areas being taxed higher compared to residential areas and sales tax playing a more significant role compared to property tax. However, we can see differences within each land use group. Lower density residential areas with significant infrastructure investments tend to perform worse compared to residential areas with moderate density. And then comparing commercial areas, lower density commercial performs worse compared to more dense, mixed use areas. This can be seen when looking at the three highest peaks of net value per acre in Windsor: the Crossroads Boulevard Commercial Area, New Windsor Marketplace, and Downtown. Each of these areas has significant retail tax productivity, but adding in the significantly higher property tax productivity in the Downtown compared to the others helps create a more net positive position compared to Crossroads and New Windsor Marketplace.
19
A-136 WINDSOR COMPREHENSIVE PLAN |
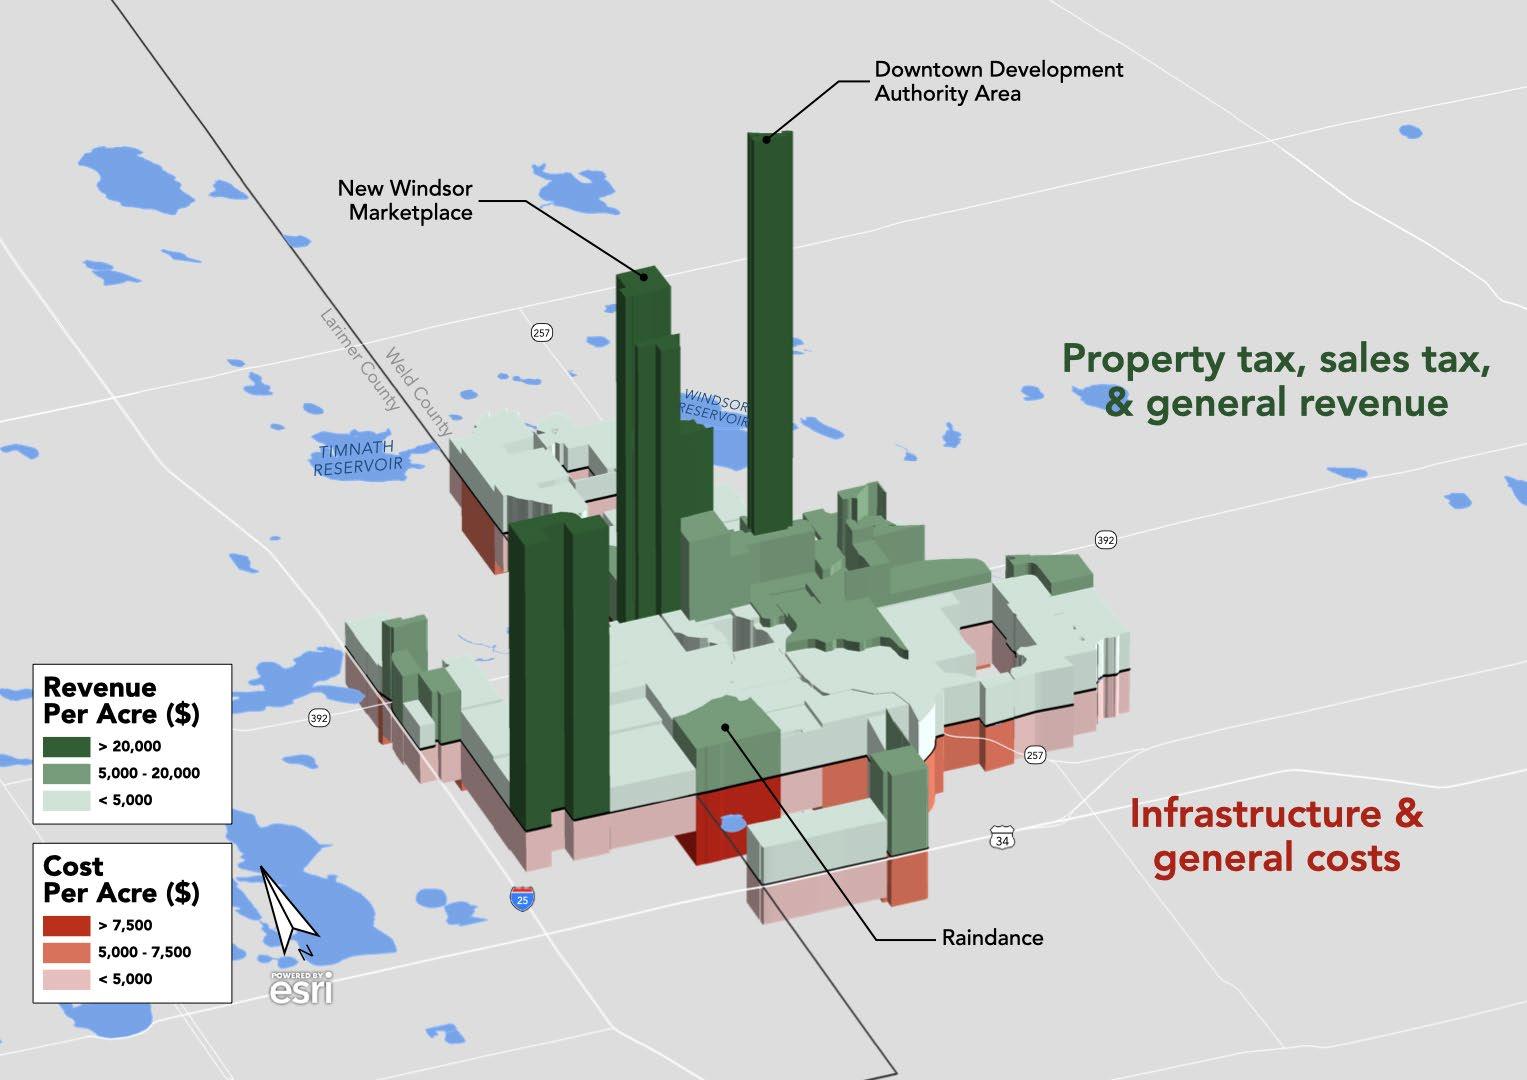
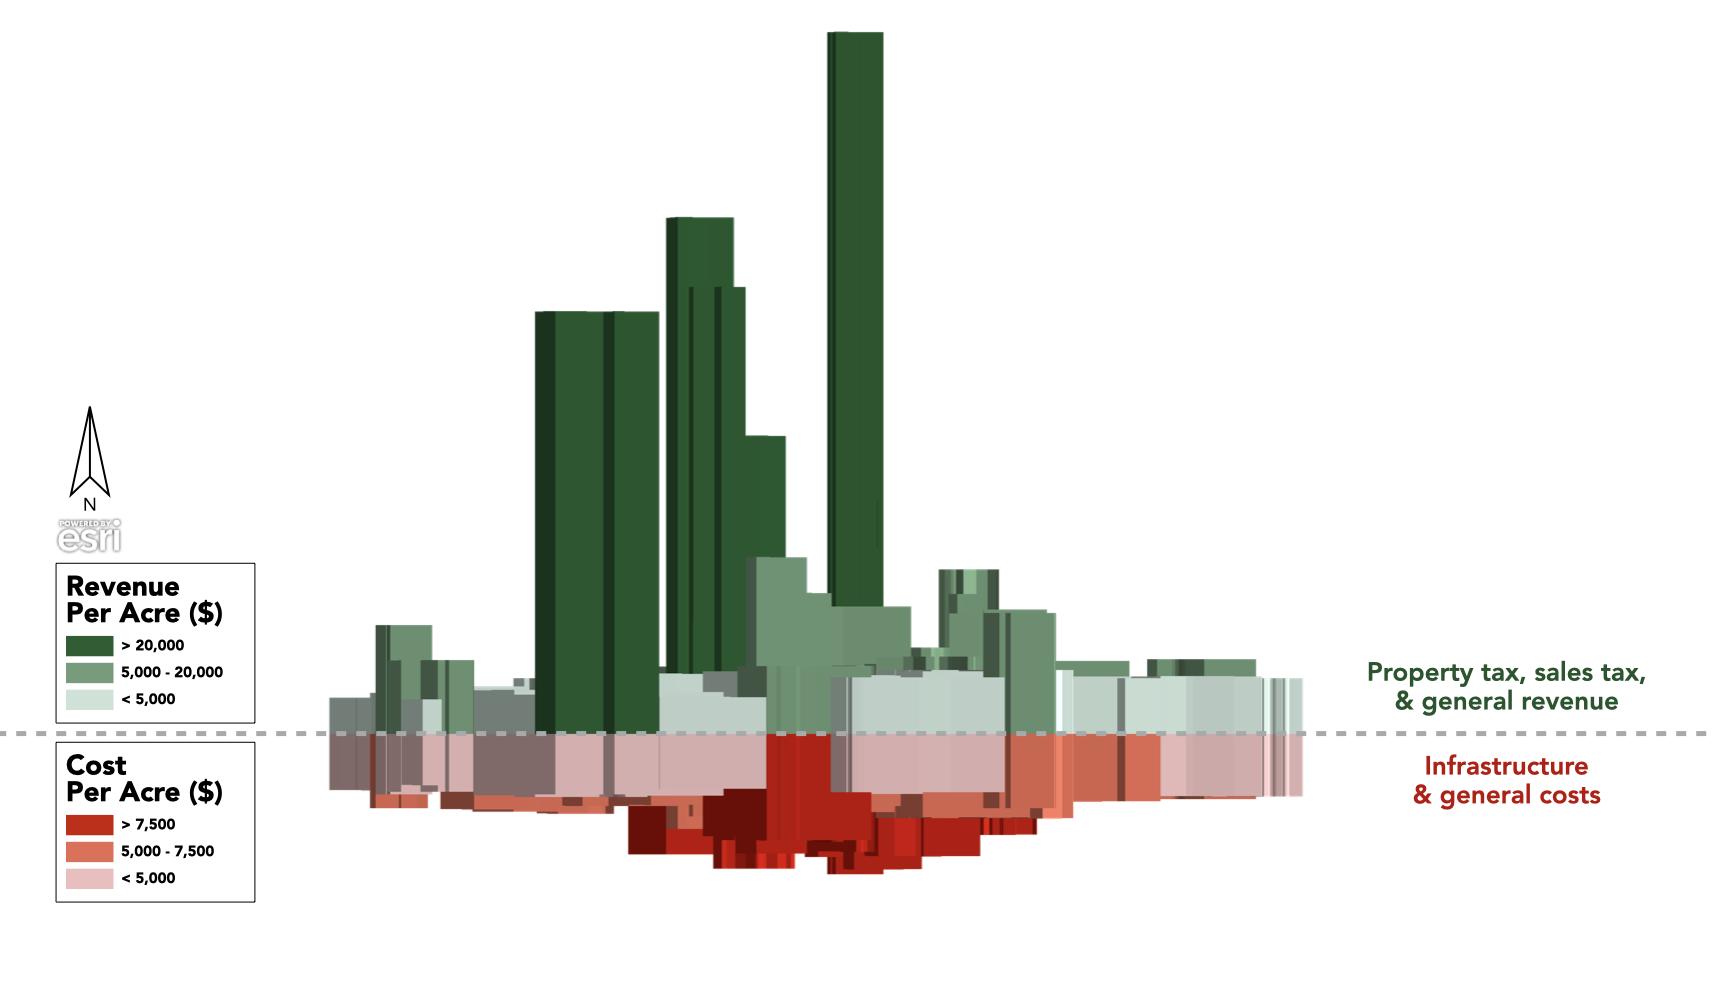
20
A-137
Economics of Community Design: Windsor, Colorado
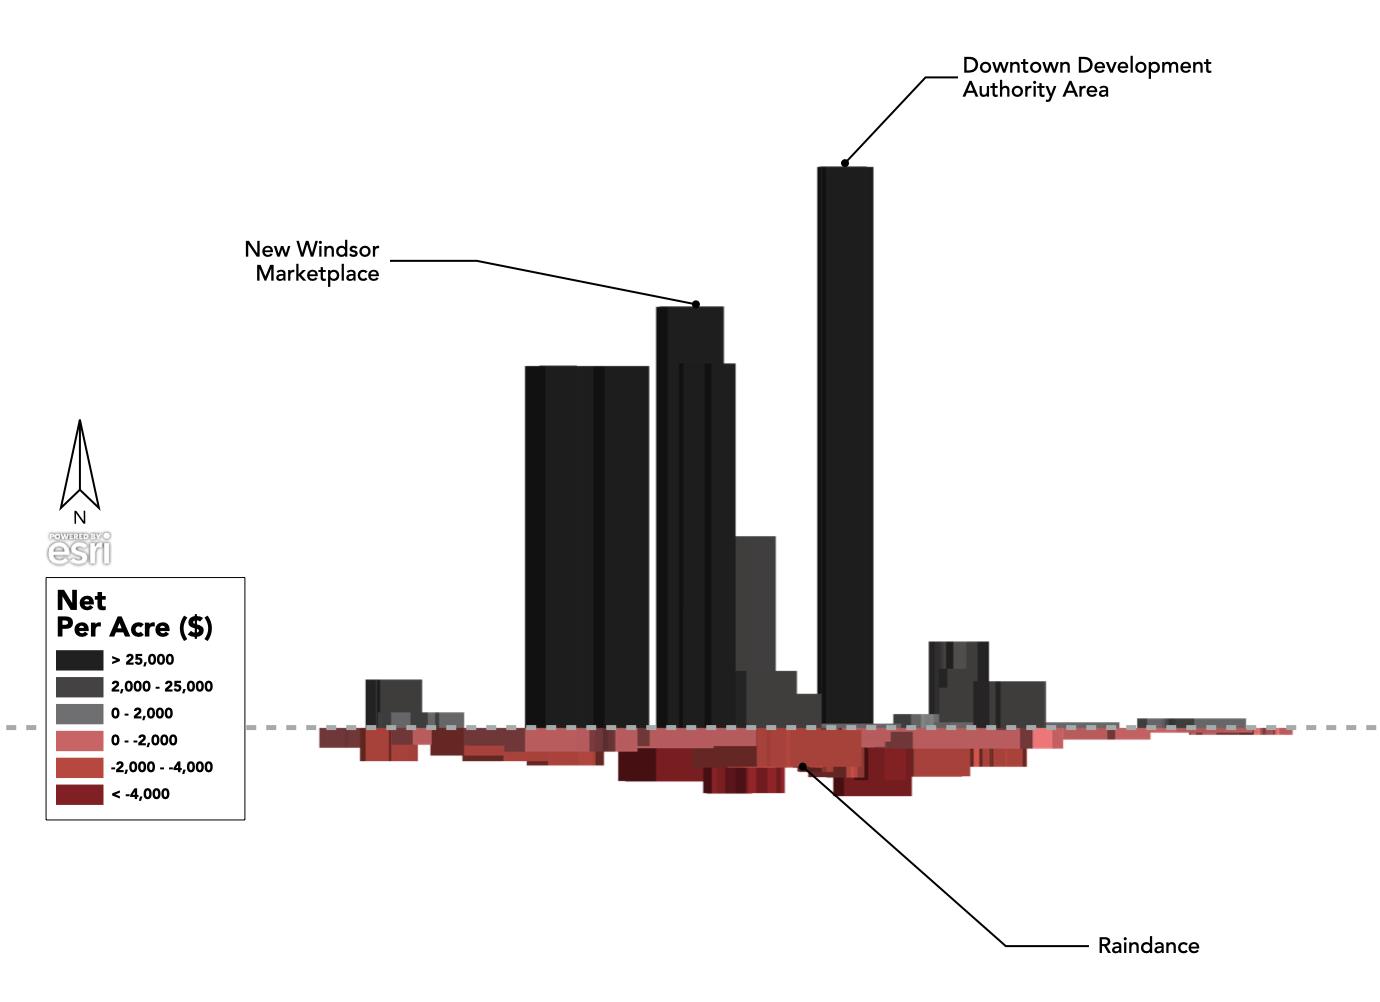
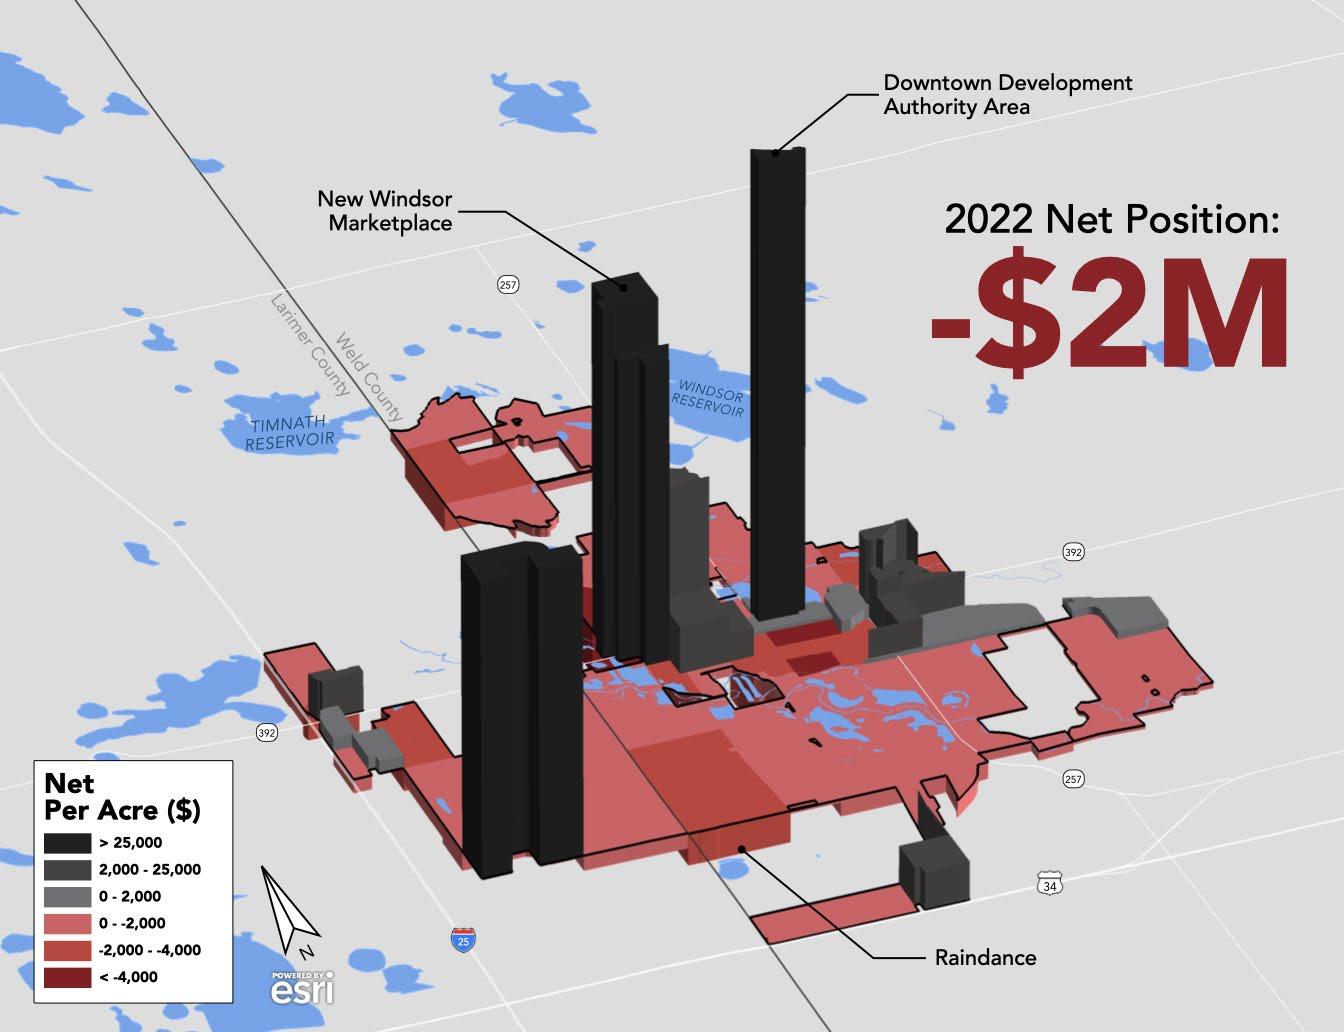
21 A-138 WINDSOR COMPREHENSIVE PLAN |
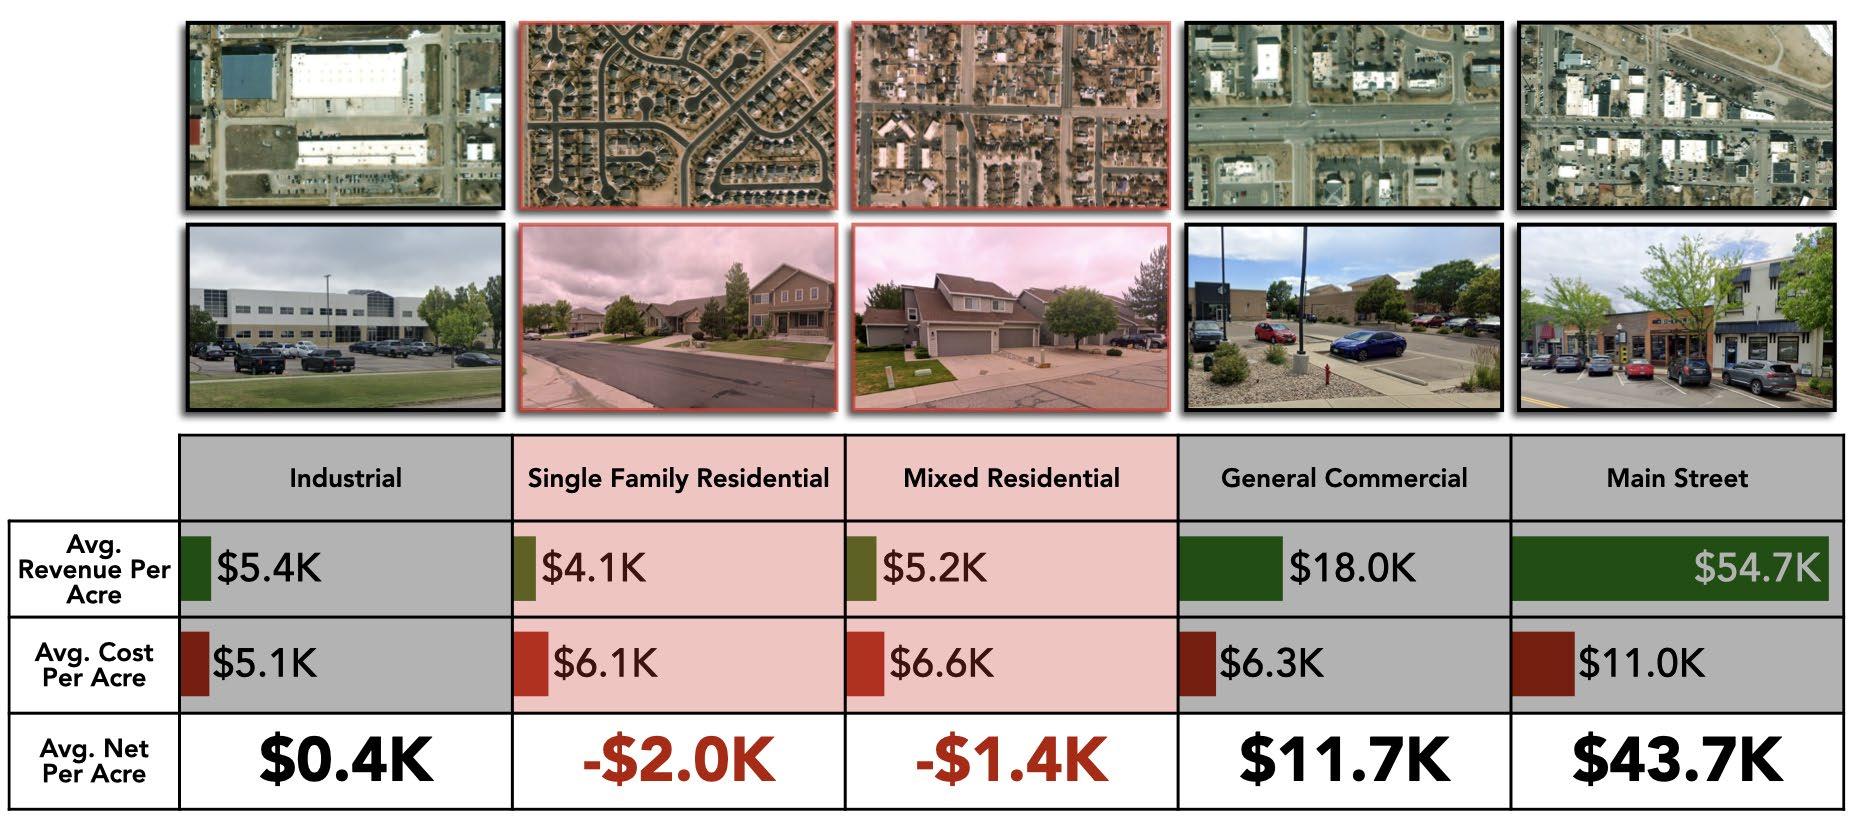
“Lower density residential areas with significant infrastructure investments tend to perform worse compared to residential areas with moderate density.”
Growth Projections
As Windsor continues to grow, the Town will be able to make choices regarding how that growth will look and the resulting financial implications of that growth. Here we look at four subareas in Windsor that are slated for new development: the I-25 CAC, Downtown, Harmony & Highway 257, and Highway 34. Each has its own mix of uses, but generally the I-25 CAC and Downtown are more similar and Harmony & 257 and Highway 34 are more similar.
When applying the estimated net revenue or cost per acre to each of the land uses in the projection areas, we can see that all end up being revenue positive. However, the influence of commercial versus residential
and open space plays an important role. We can see that subareas that include residential and open space tend to have lower net revenues. This is because these land use types aren’t as financially productive as commercial and mixed use. However, they are important land uses to include in Windsor because they create a community where people can and want to live. Windsor could focus on creating as many commercial uses as possible, but then would lack the people and environment to maintain a thriving community. Balancing these land uses and understanding their influence on the town’s health is key to sustainability moving forward.
22 Economics of Community Design: Windsor, Colorado
Comparison of different development types in Windsor
A-139
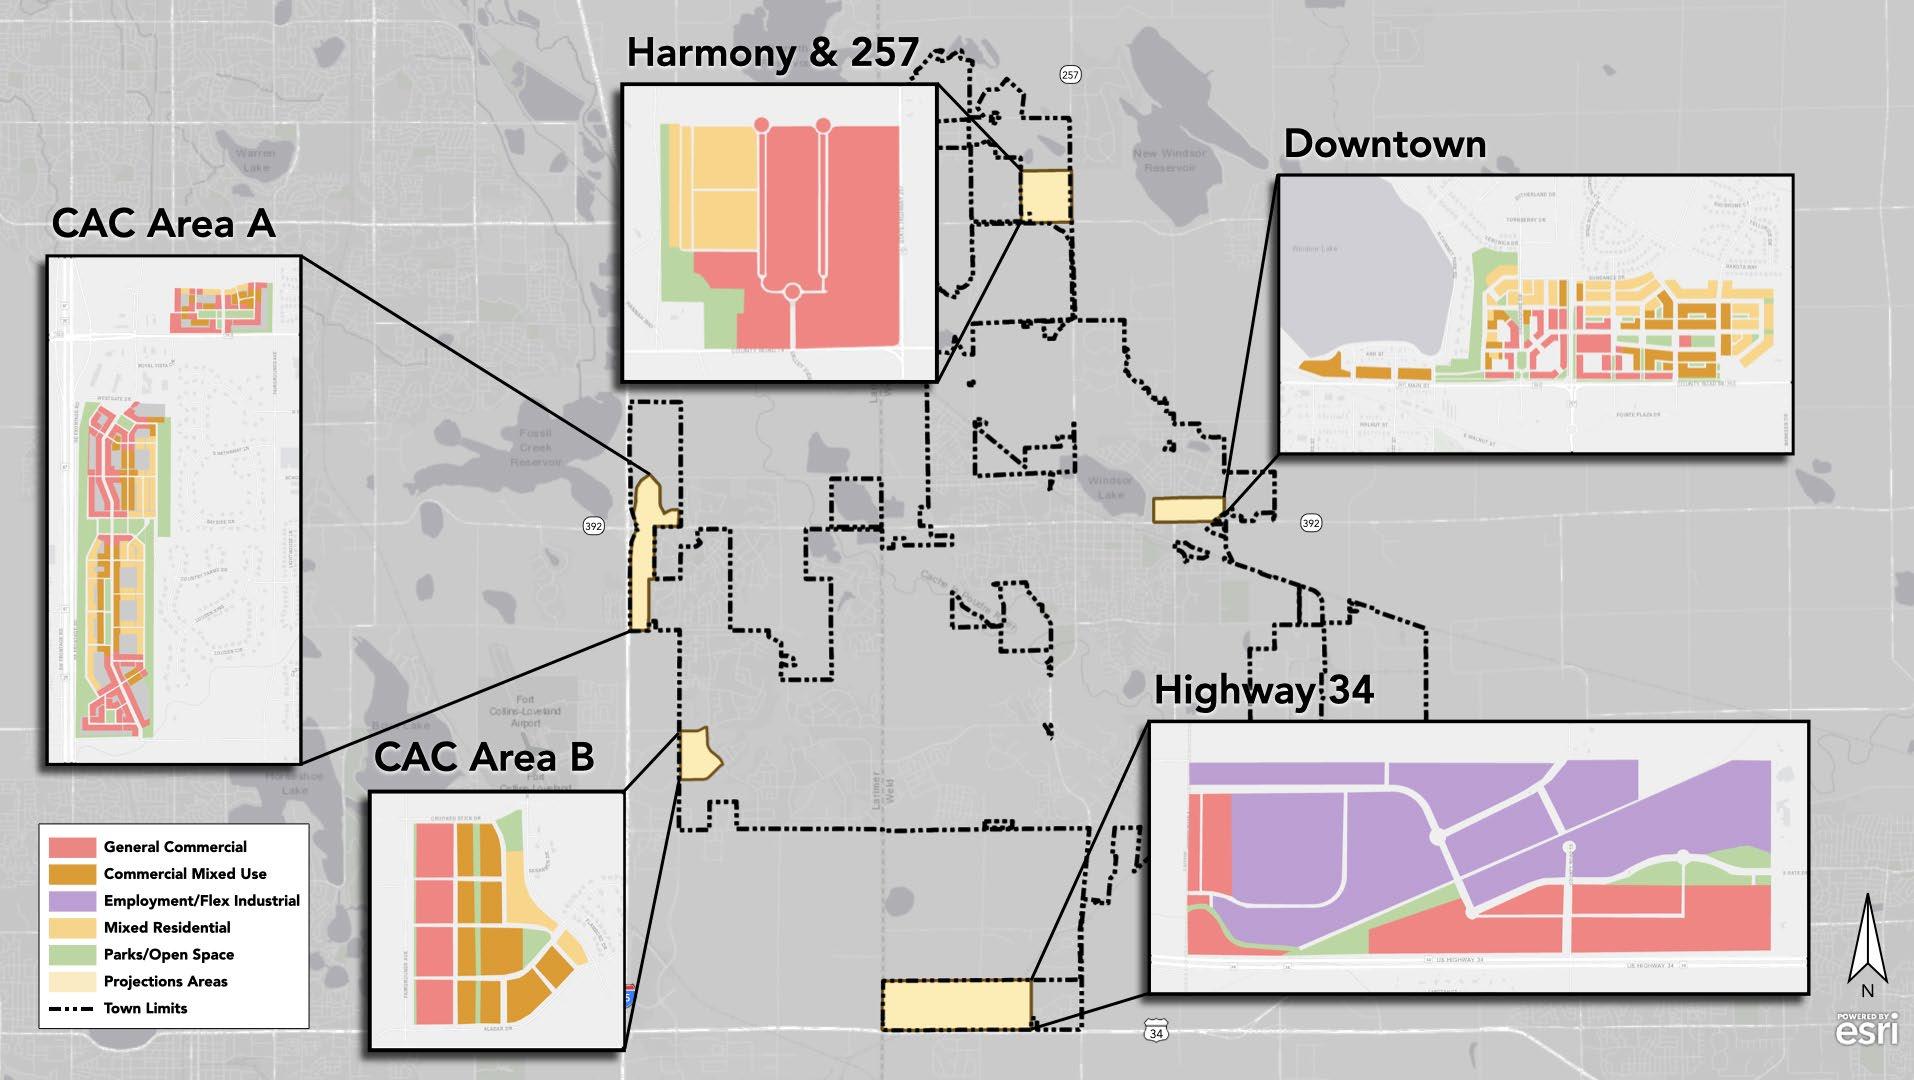
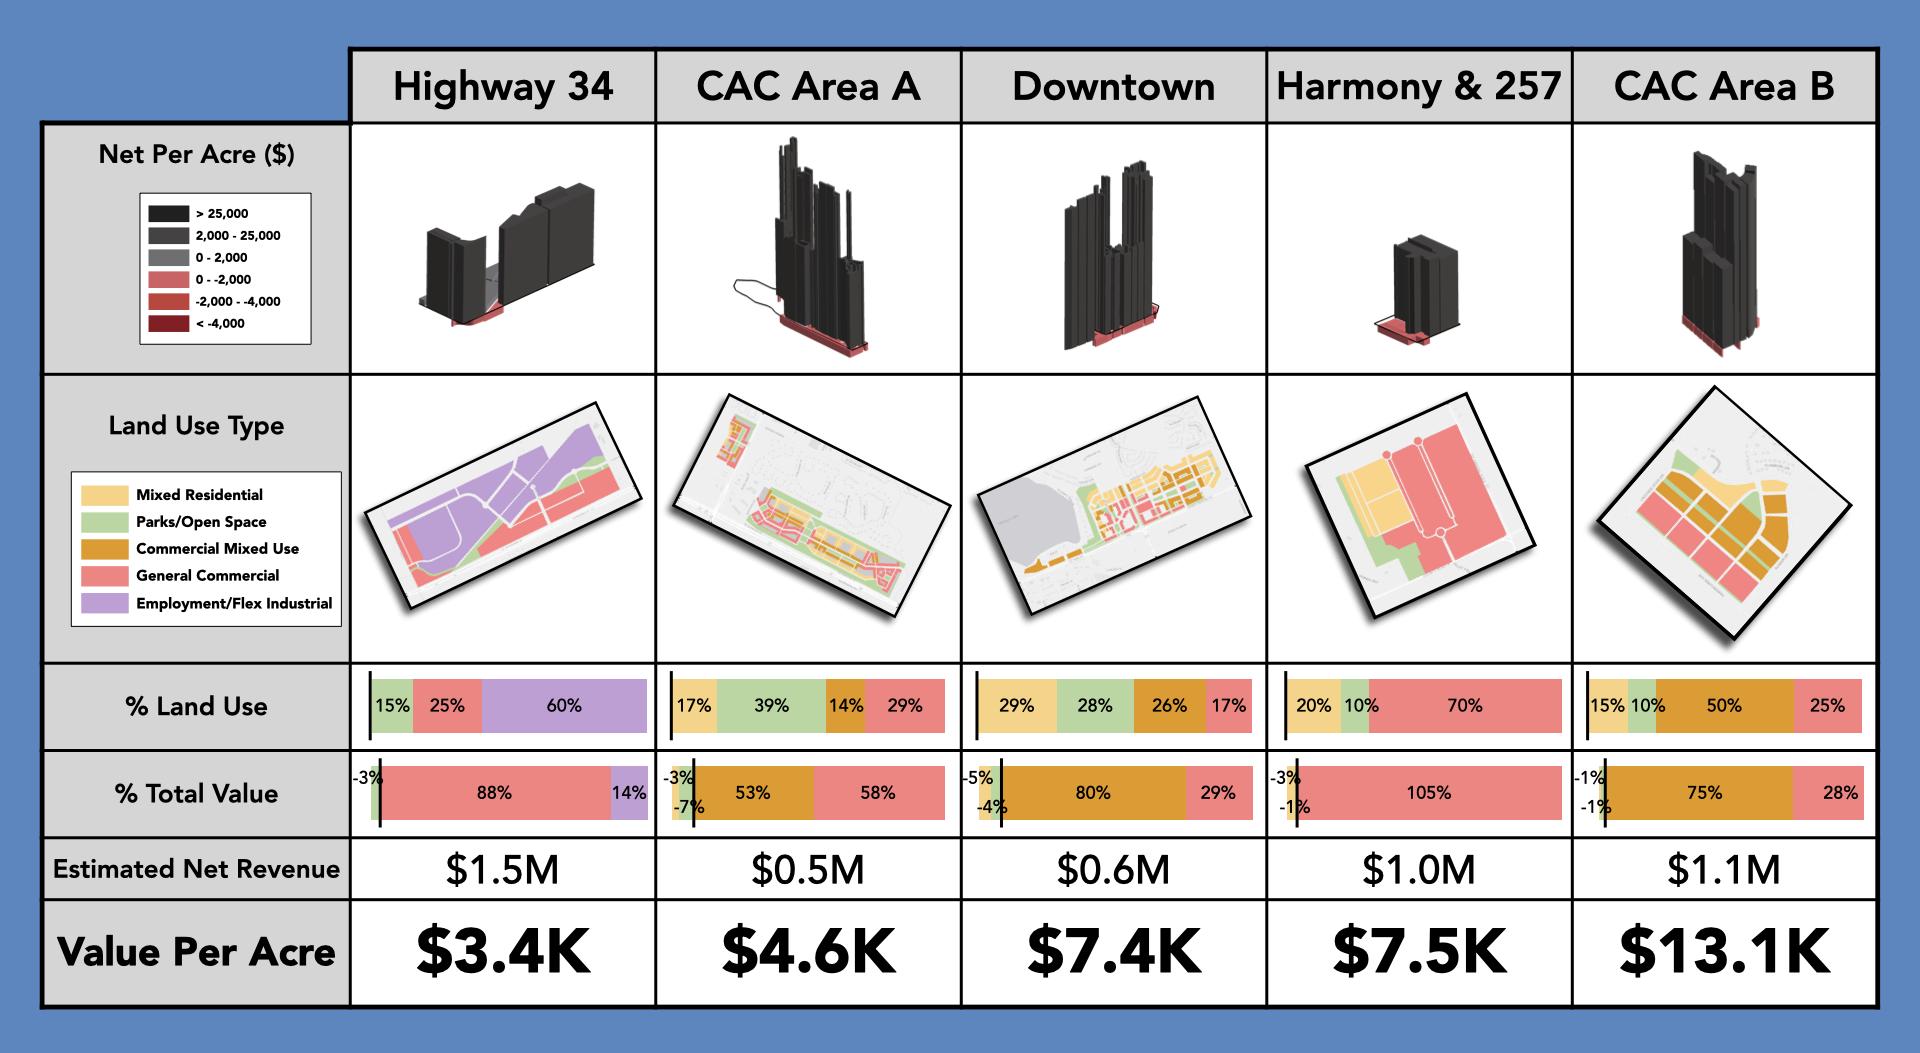
of Windsor’s five subareas and the monetary value that each would contribute to the City
23
Comparison
A-140 WINDSOR COMPREHENSIVE PLAN |
Four subareas in Windsor that are slated for new development
Downtown Projections
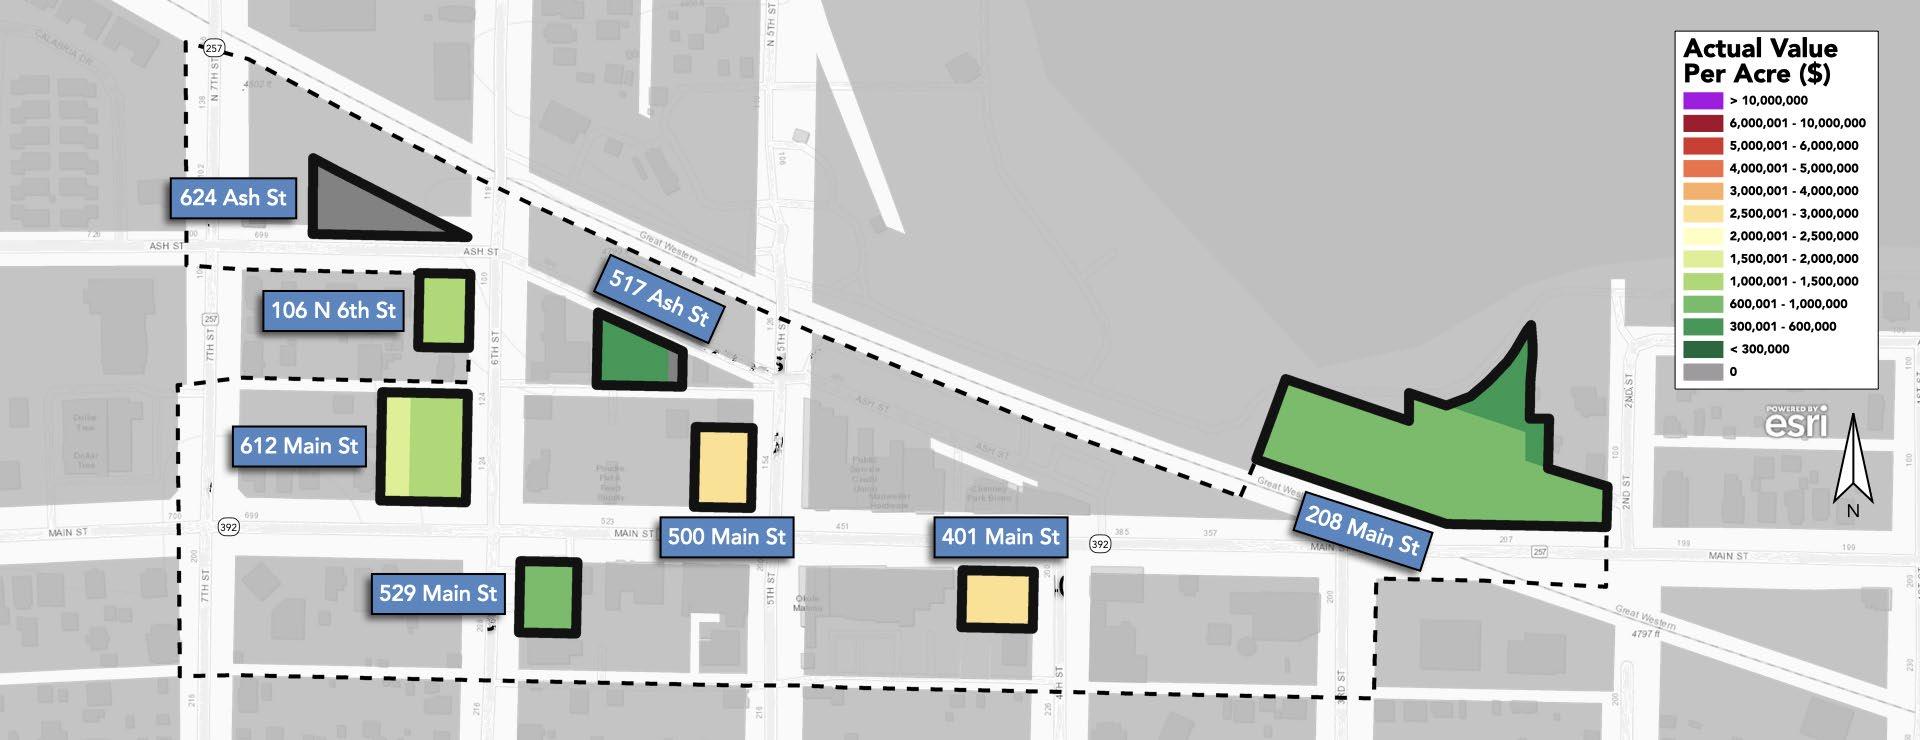
Projections were also completed for eight individual sites in Downtown Windsor. These properties have been highlighted as locations for potential redevelopment to help grow and sustain a vibrant downtown. The sites range from relatively standard main street lots to a larger lot on the edge of downtown that could create a new node of activity.
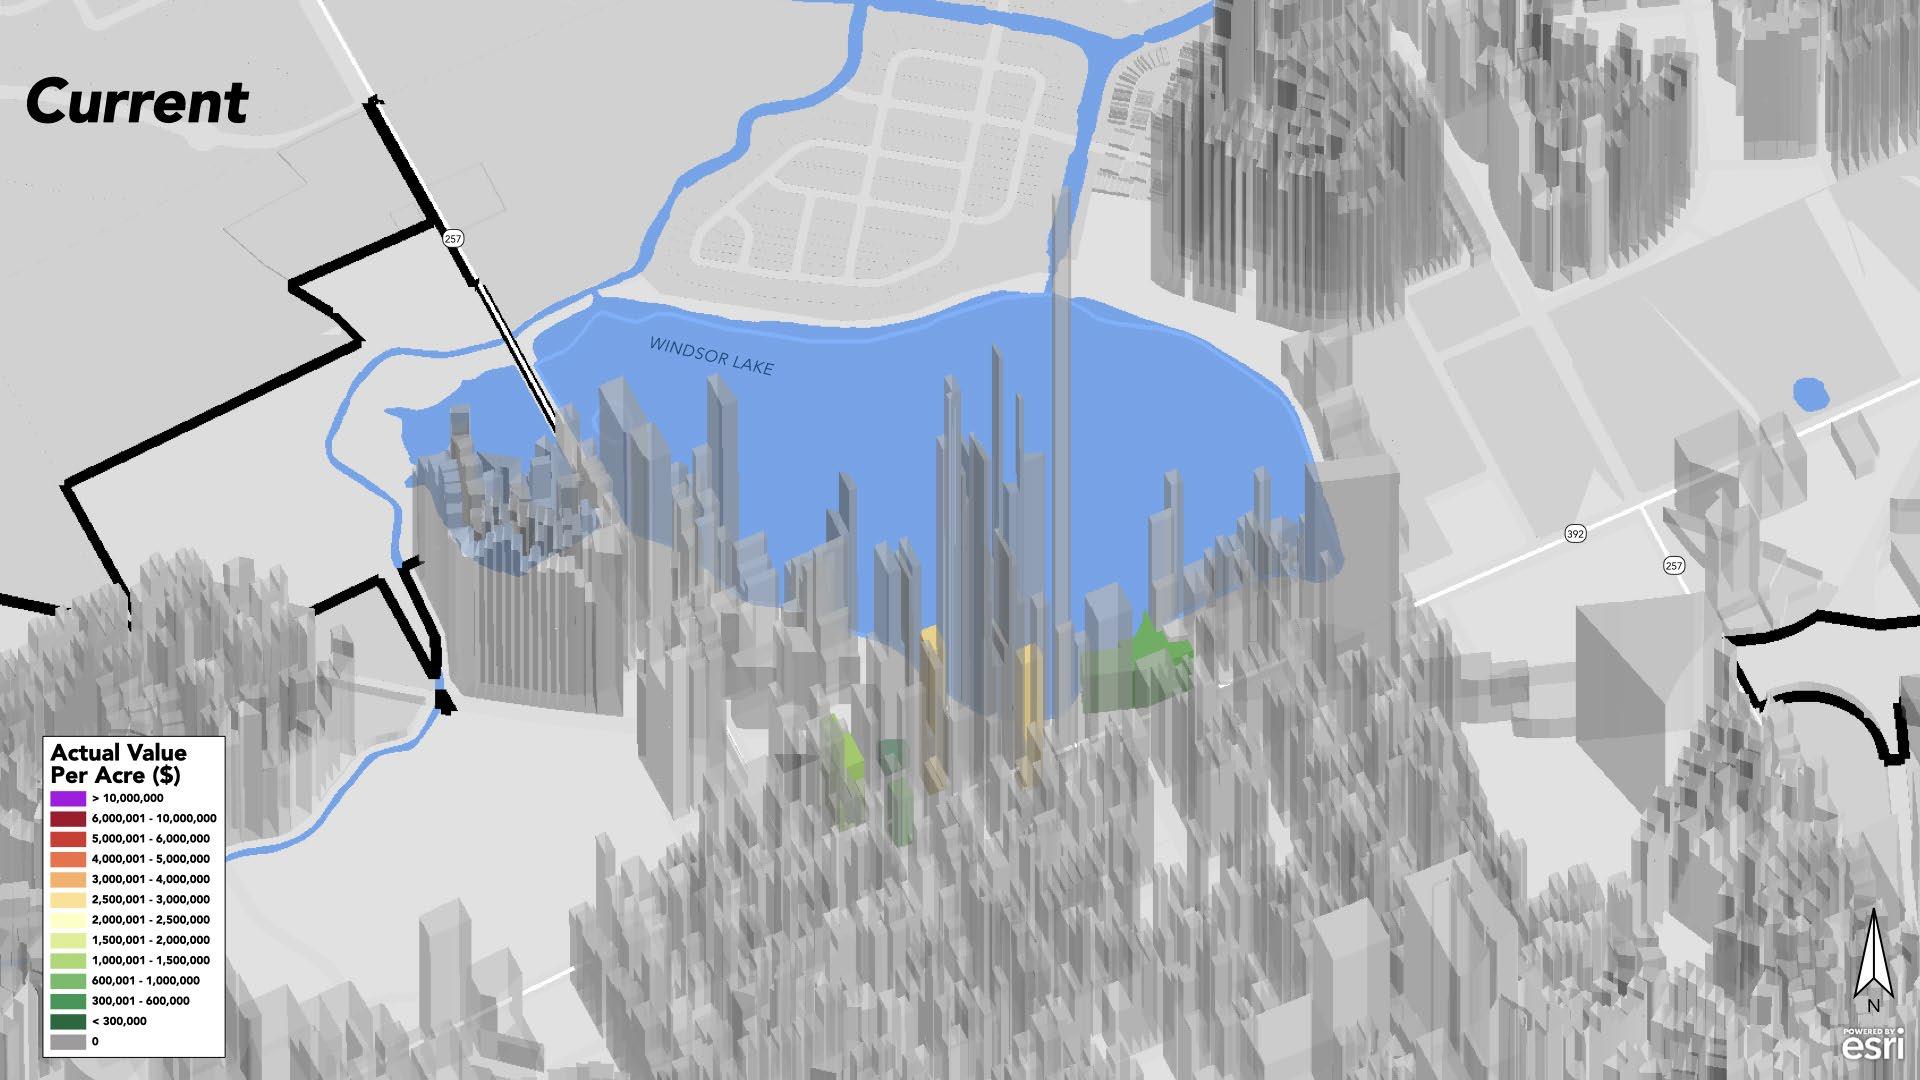
24 Economics of Community Design: Windsor, Colorado
Sites in Windsor’s downtown that are slated for potential redevelopment
A-141
Current 3D model of study area
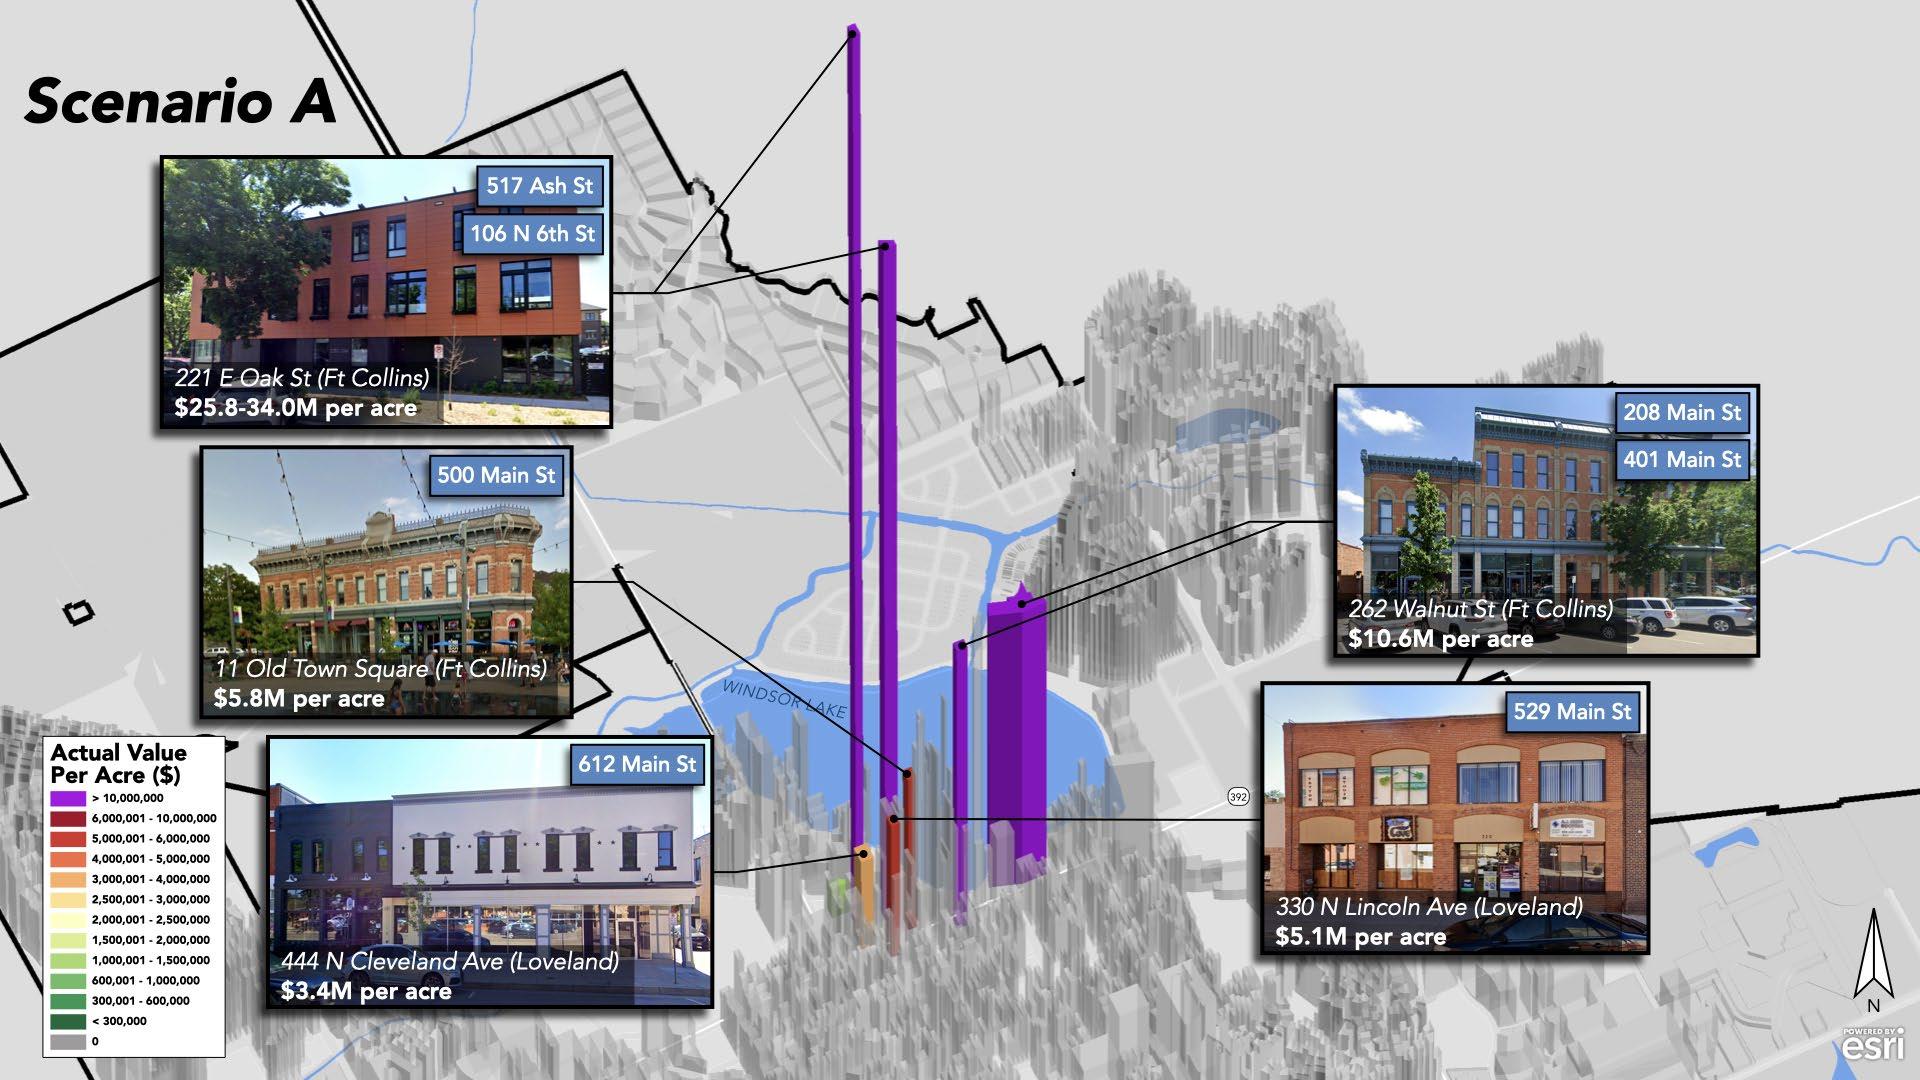
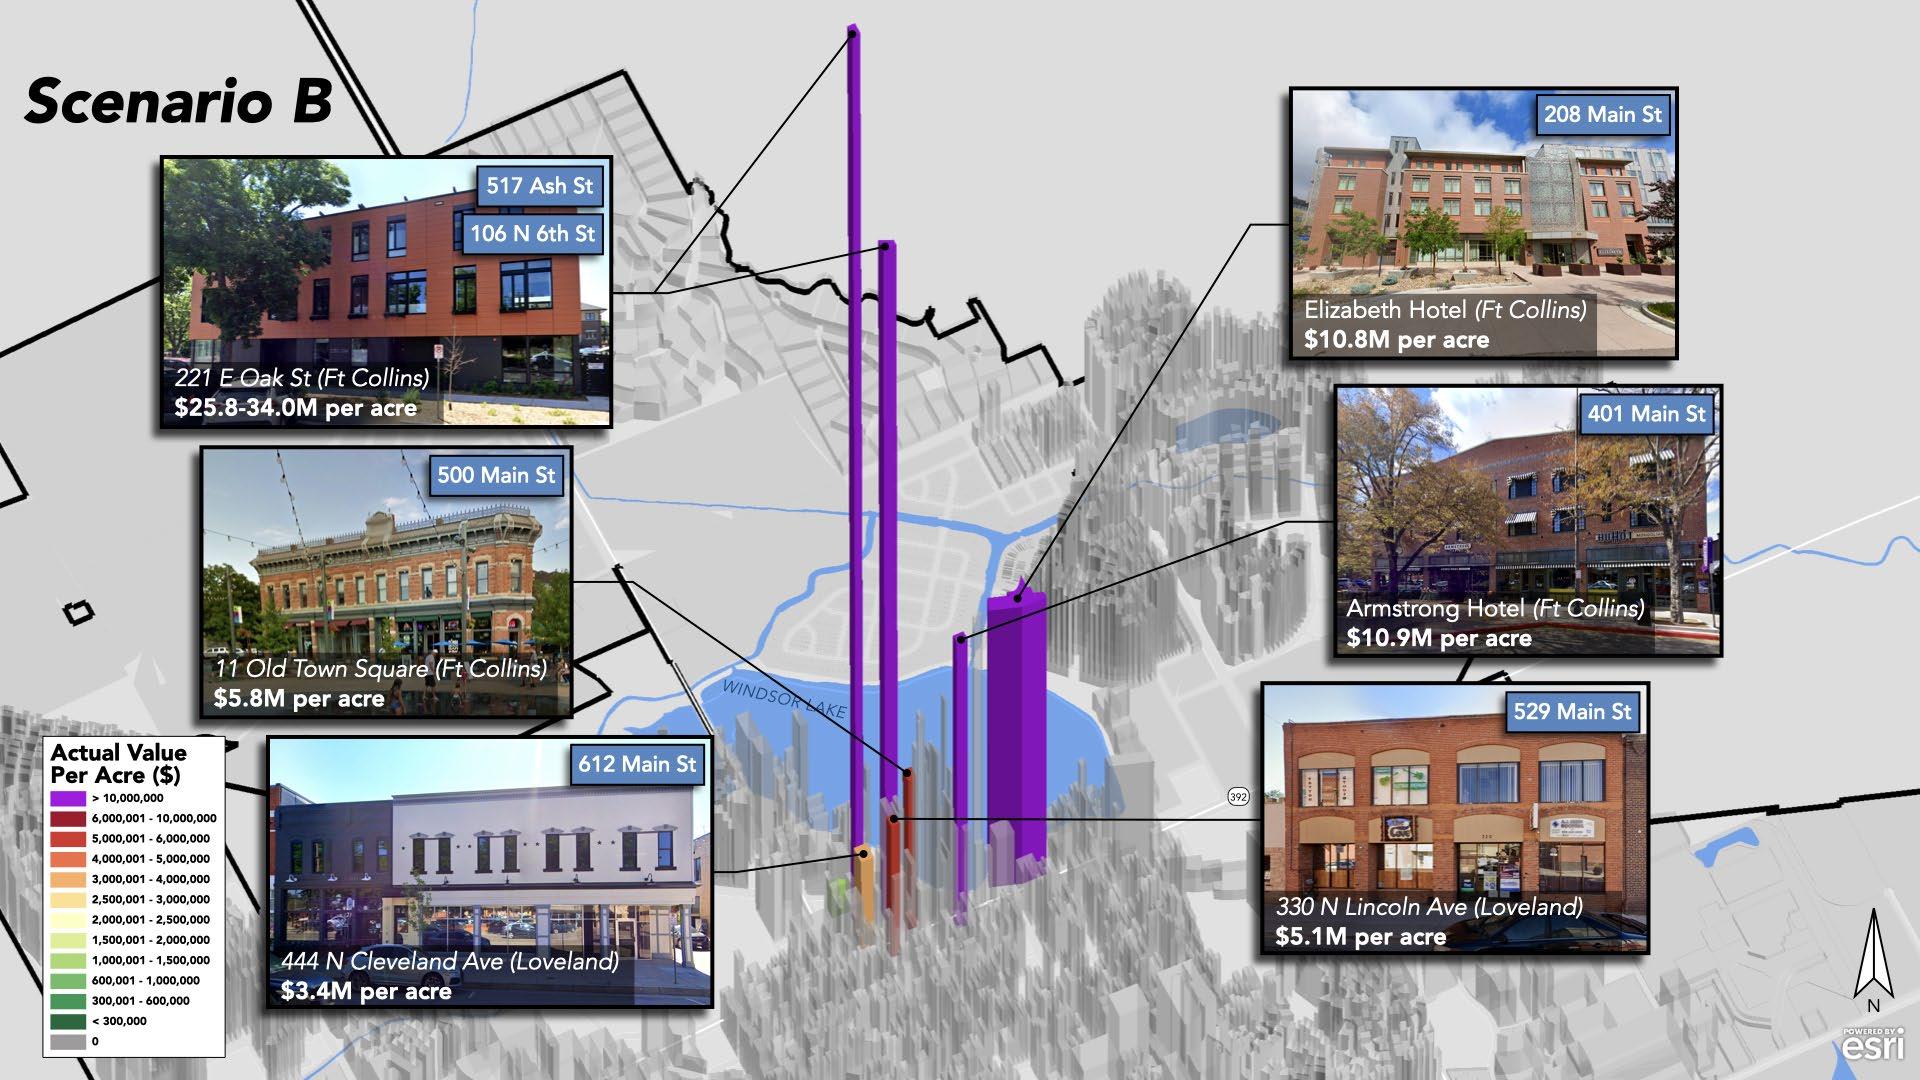
25
A-142 WINDSOR COMPREHENSIVE PLAN |
3D model showing the potential value of new development under Scenario A (top) and Scenario B (bottom)
In this analysis, various developments from surrounding communities were used as samples based on potential development proposals or desired uses for these sites. However, only the improvement value of these developments were considered when looking at the potential financial impact. The existing land value of the sites in Windsor was paired with the improvement value of the sample developments to arrive at a projected value. Two projection scenarios were completed, one where hotel examples were included and one where they were excluded.
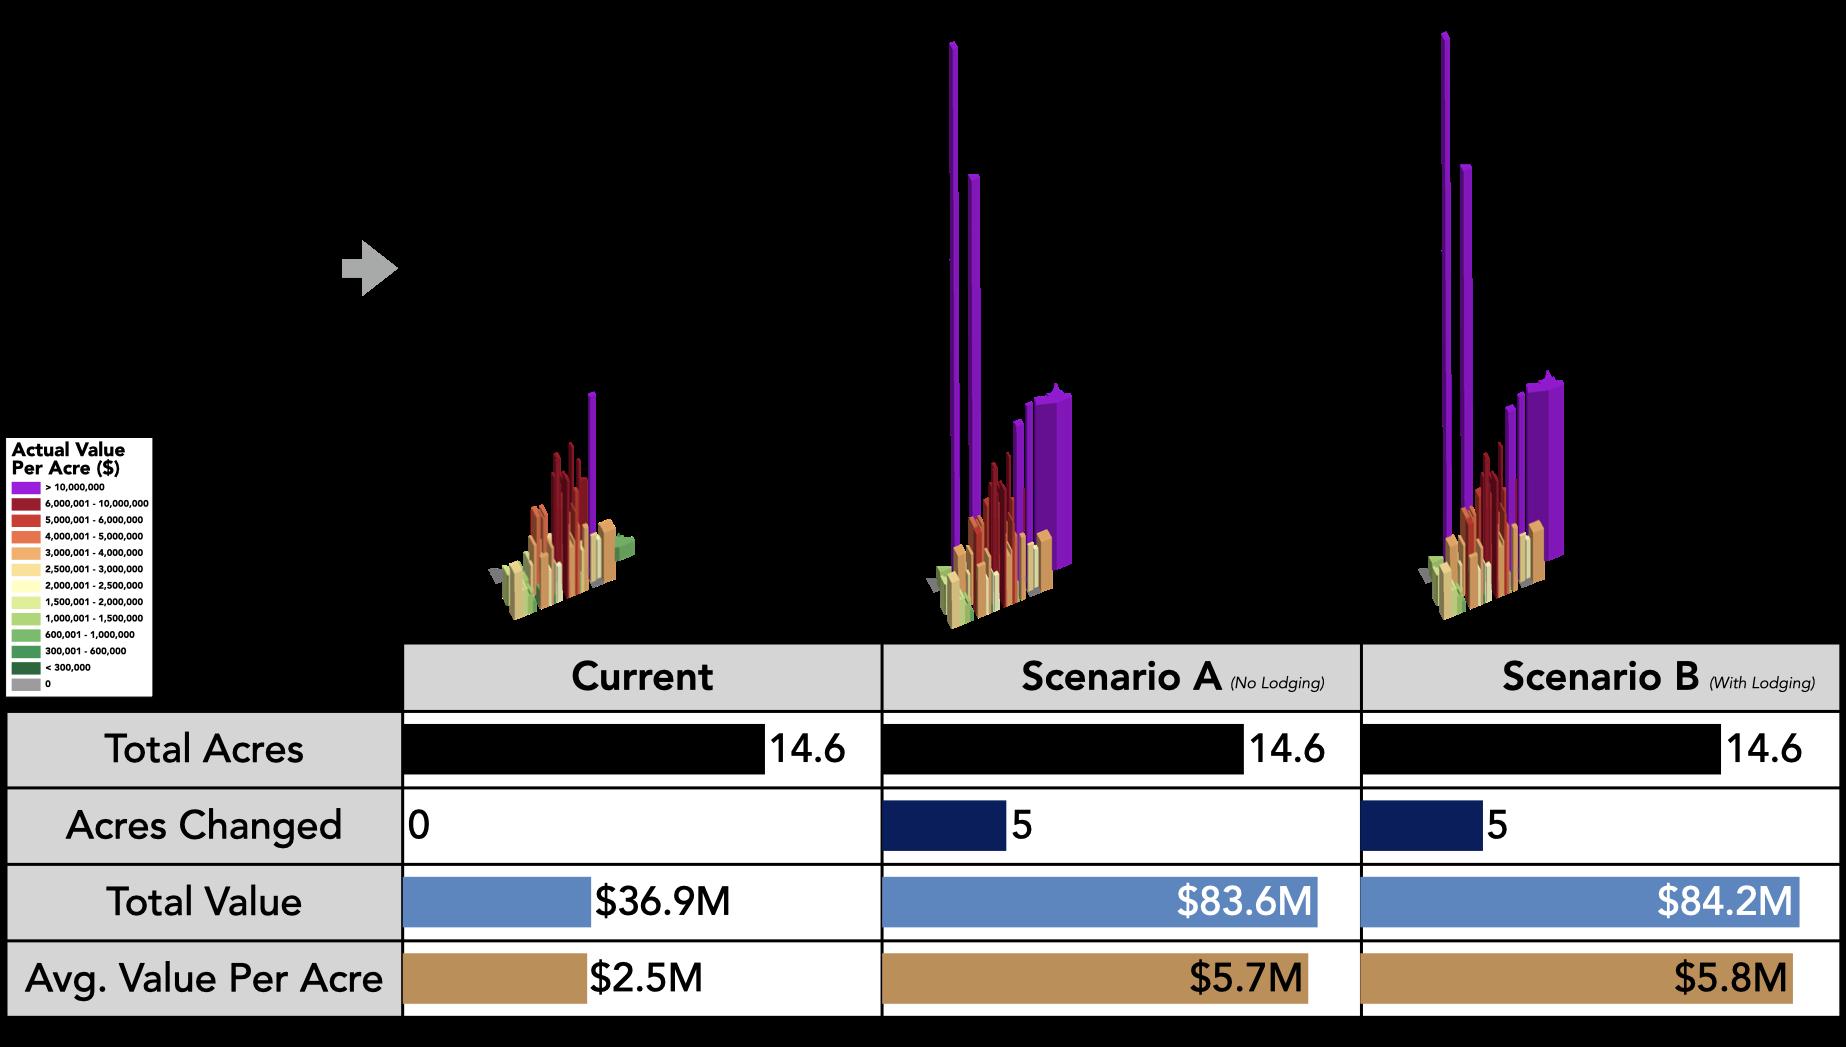
The results of the analysis show a serious opportunity for supporting downtown development, more than doubling the value and productivity of the downtown, while redeveloping only about a third of the area. Keep in mind, the sample developments used in these projections are almost all three stories or less and fit in with the existing development pattern in Windsor’s downtown. Though there is a difference between the scenarios where lodging is included or excluded, it is relatively minor and both scenarios create similar boosts in value to downtown. Based on this analysis, there are clear opportunities to support continued growth in downtown while maintaining the area’s character.
“There are clear opportunities to support continued growth in downtown while maintaining the area’s character.”
26 Economics of Community Design: Windsor, Colorado
Comparison of Scenarios A and B with current Downtown Windsor
A-143
Public Asset Analysis
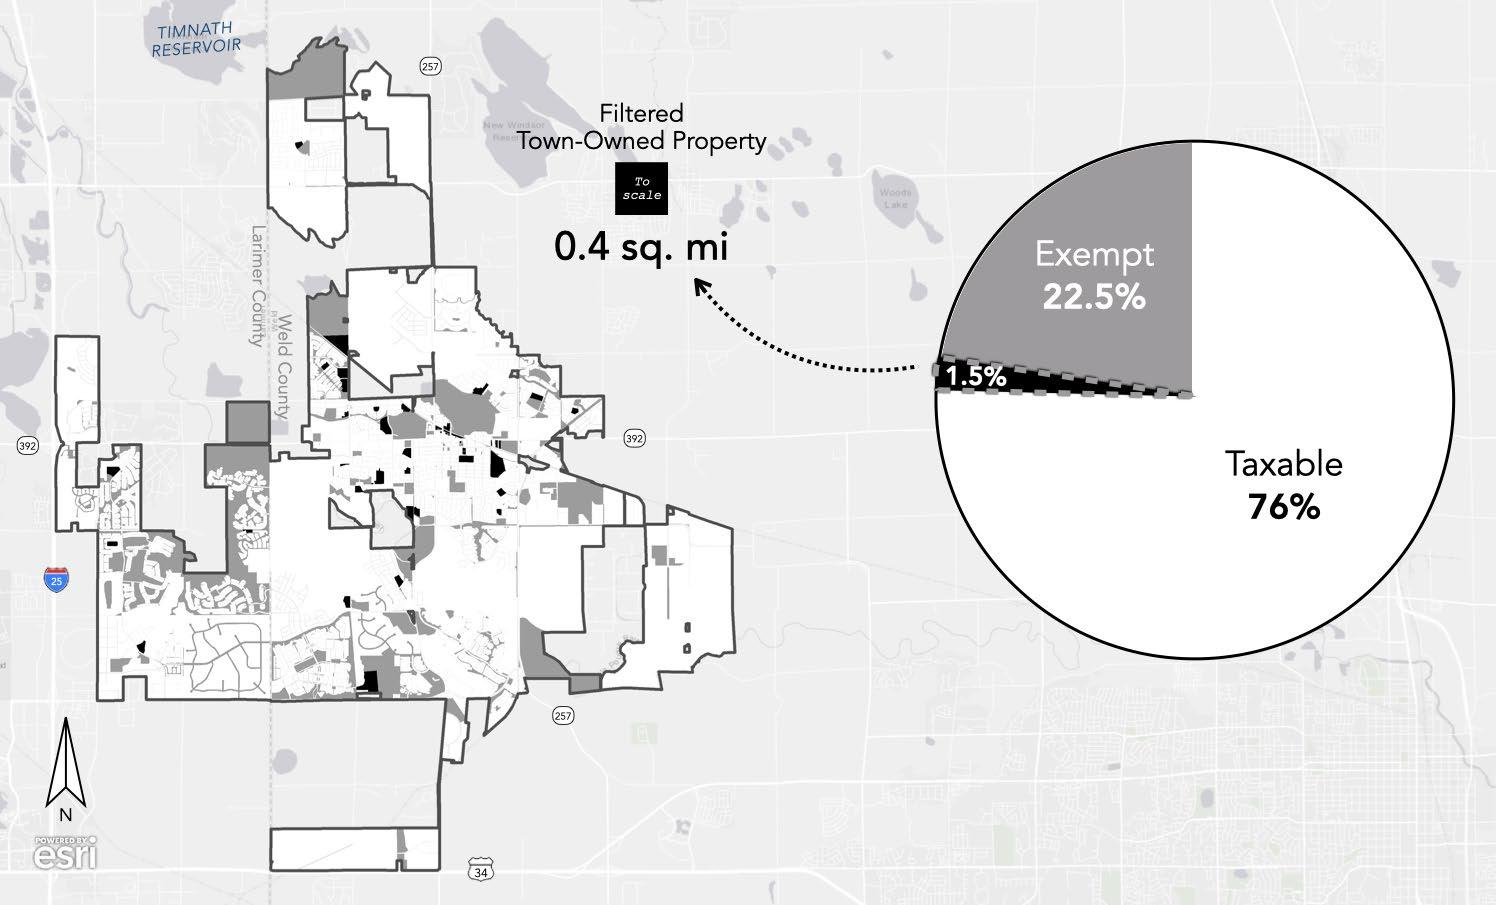
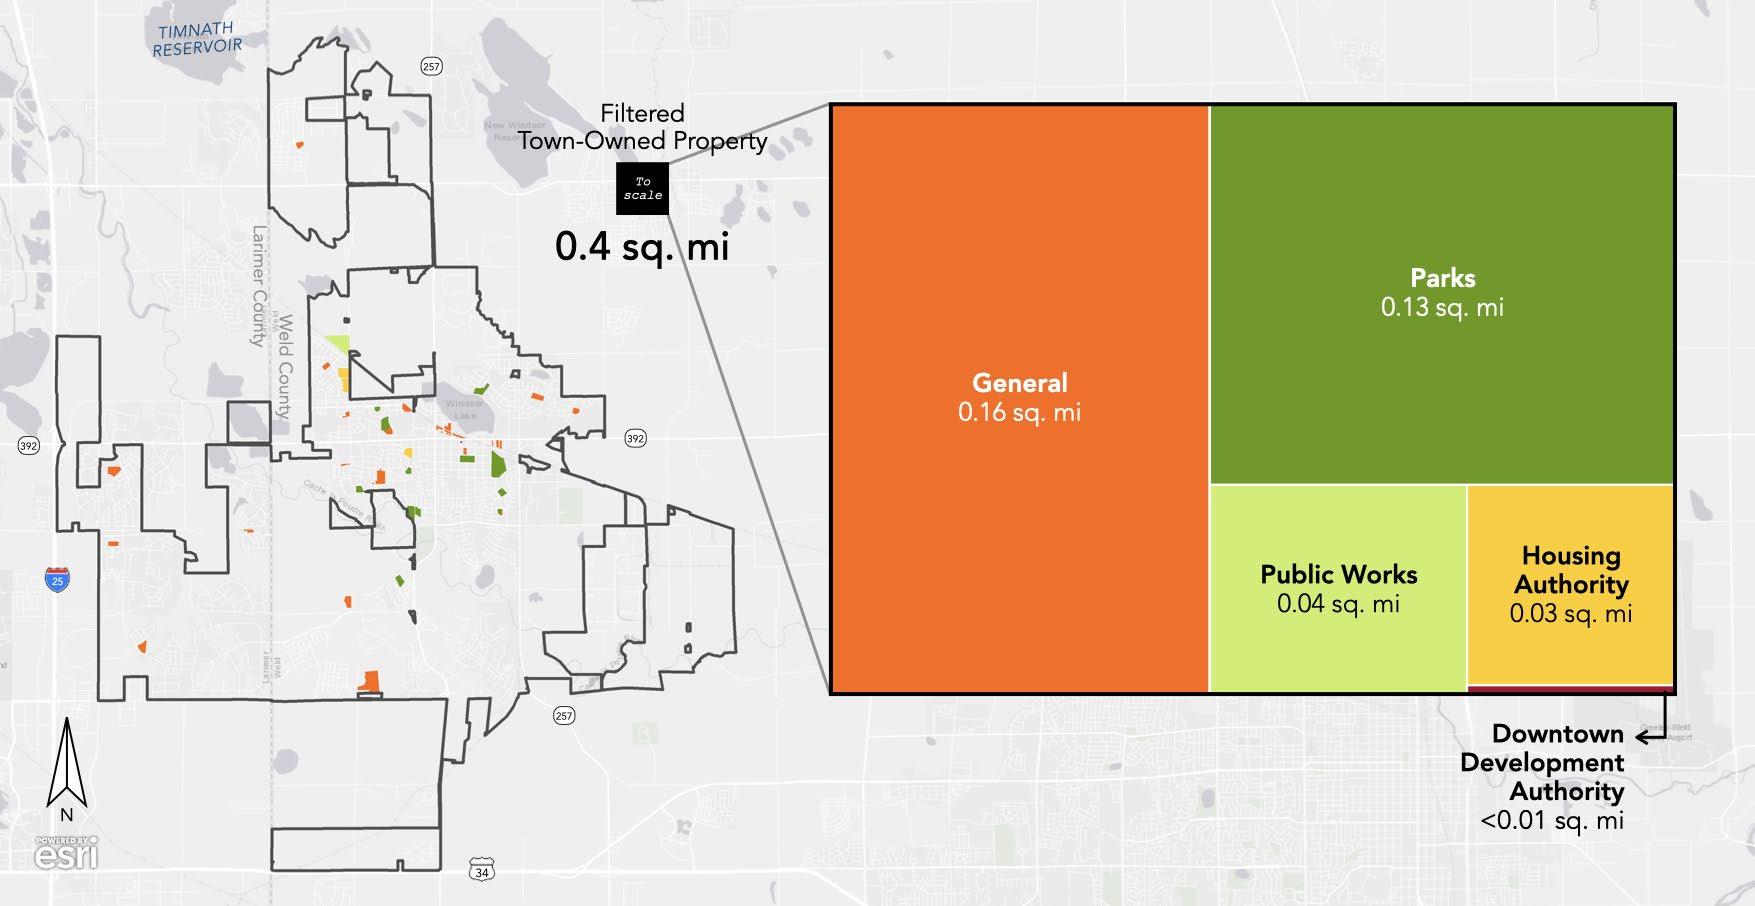
27
The Town of Windsor owns 1.5% of property, which has an area that totals 0.4 square miles.
A-144 WINDSOR COMPREHENSIVE PLAN |
Tree map illustrating the property types within the 0.4 square miles of total land that Windsor owns
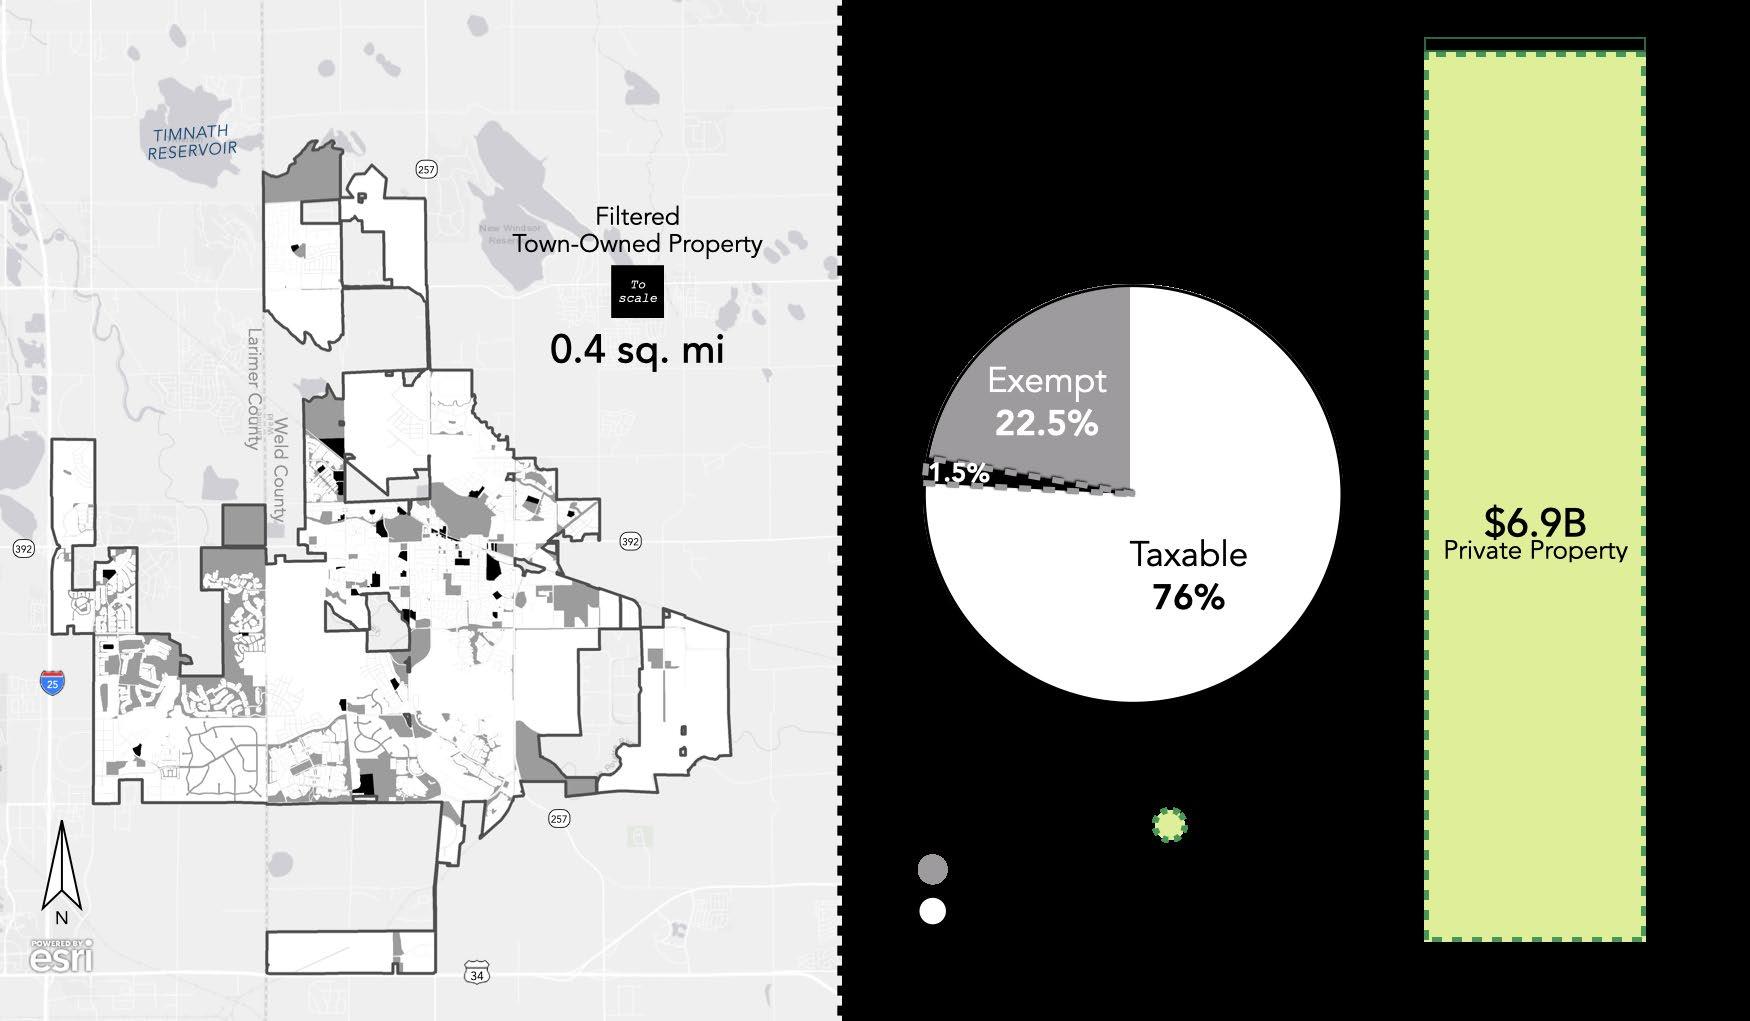
Public entities like the Town of Windsor often own significant amounts of land in their jurisdiction that are underutilized and could be put to use in a different way that could help generate value for the community. In Windsor, about 24% of the town is non taxable. The Town of Windsor owns 9% of property in town limits, or about 2.2 square miles. From here we can filter that property down to land that is more feasible to consider for redevelopment opportunities. With these properties selected, we can understand what sort of
potential value this land can have.
Focusing on 0.4 square miles of land owned by the town, we see that land could be worth approximately $100 million. This is additional value that could be added to the town. We aren’t advocating for all of this property to be redeveloped immediately, but instead for the town to keep in mind opportunities to leverage the land it owns moving forward and consider how to best use its assets to support public service goals.
“Focusing on the 0.4 square miles of land owned by the town, we see that land could be worth approximately $100 million.”
28 Economics of Community Design: Windsor, Colorado
Windsor has the potential to add $0.1 billion to its total property value.
A-145
Key Takeaways
The Town of Windsor is a community in Northern Colorado that has witnessed tremendous growth over the past few decades. The rapid change in the community has highlighted differences in development patterns that create varying impacts on Windsor’s long-term financial health. The significant role that sales and property tax play in the Town’s revenue generation has an important impact on land development considerations. Similarly, different development patterns lead to dramatic differences in the cost of service delivery, primarily related to the key infrastructure systems that Windsor maintains.
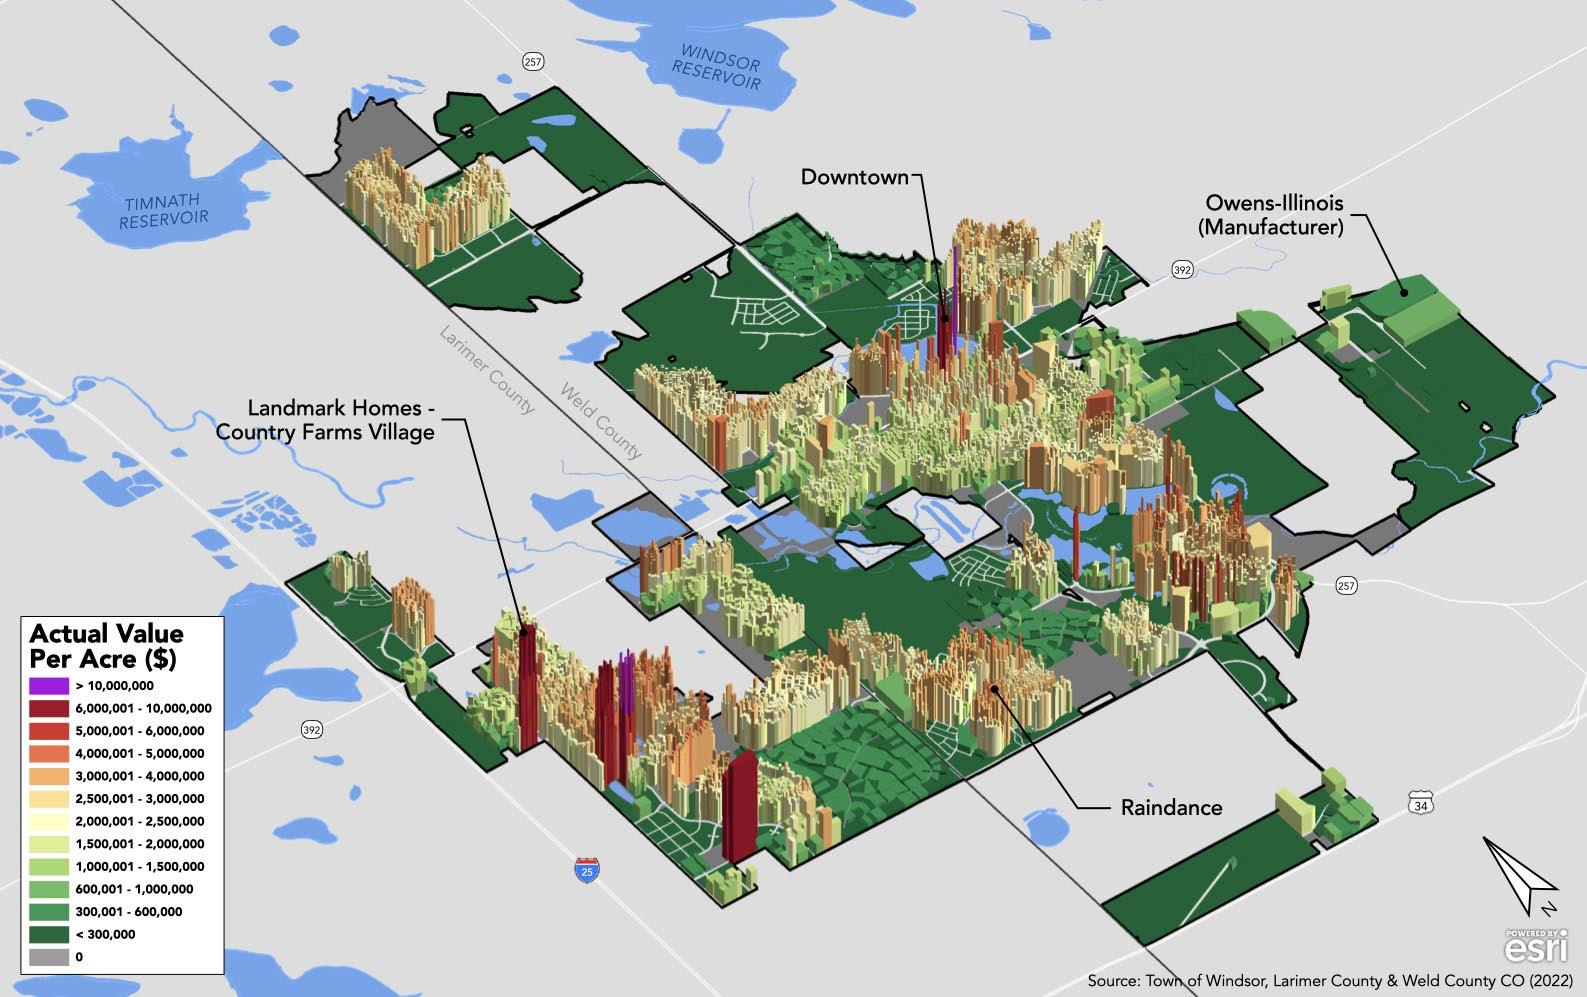
As the Town moves forward with future development, Urban3’s analysis helps ensure there can be a better understanding of the impact that different development types will likely have on Windsor’s financial health. More compact, mixed use development patterns tend to generate more revenue and lower costs. Making space for lower density residential development may be important for certain portions of the community, but there must be a balance of land uses and an understanding of the costs associated with different land use choices. Approaching these decisions with eyes wide open will help Windsor remain both a desirable place to live and a fiscally healthy community.
29
A-146 WINDSOR COMPREHENSIVE PLAN |
Appendix: Development Evaluator Tool
As part of the final deliverables associated with this project, Urban3 generated a Development Evaluator Tool which Windsor can use going forward to evaluate the financial impact of proposed developments in the town.
Below are two examples of the development evaluator tool with different sample developments. The parameters associated with each development are described below and two key output pages from the tool are shown. These pages help to outline the characteristics of each development and the resulting estimated revenues and costs that are expected to be generated by the projects over their lifetime.
Sample Development A: Main Street-Style Building
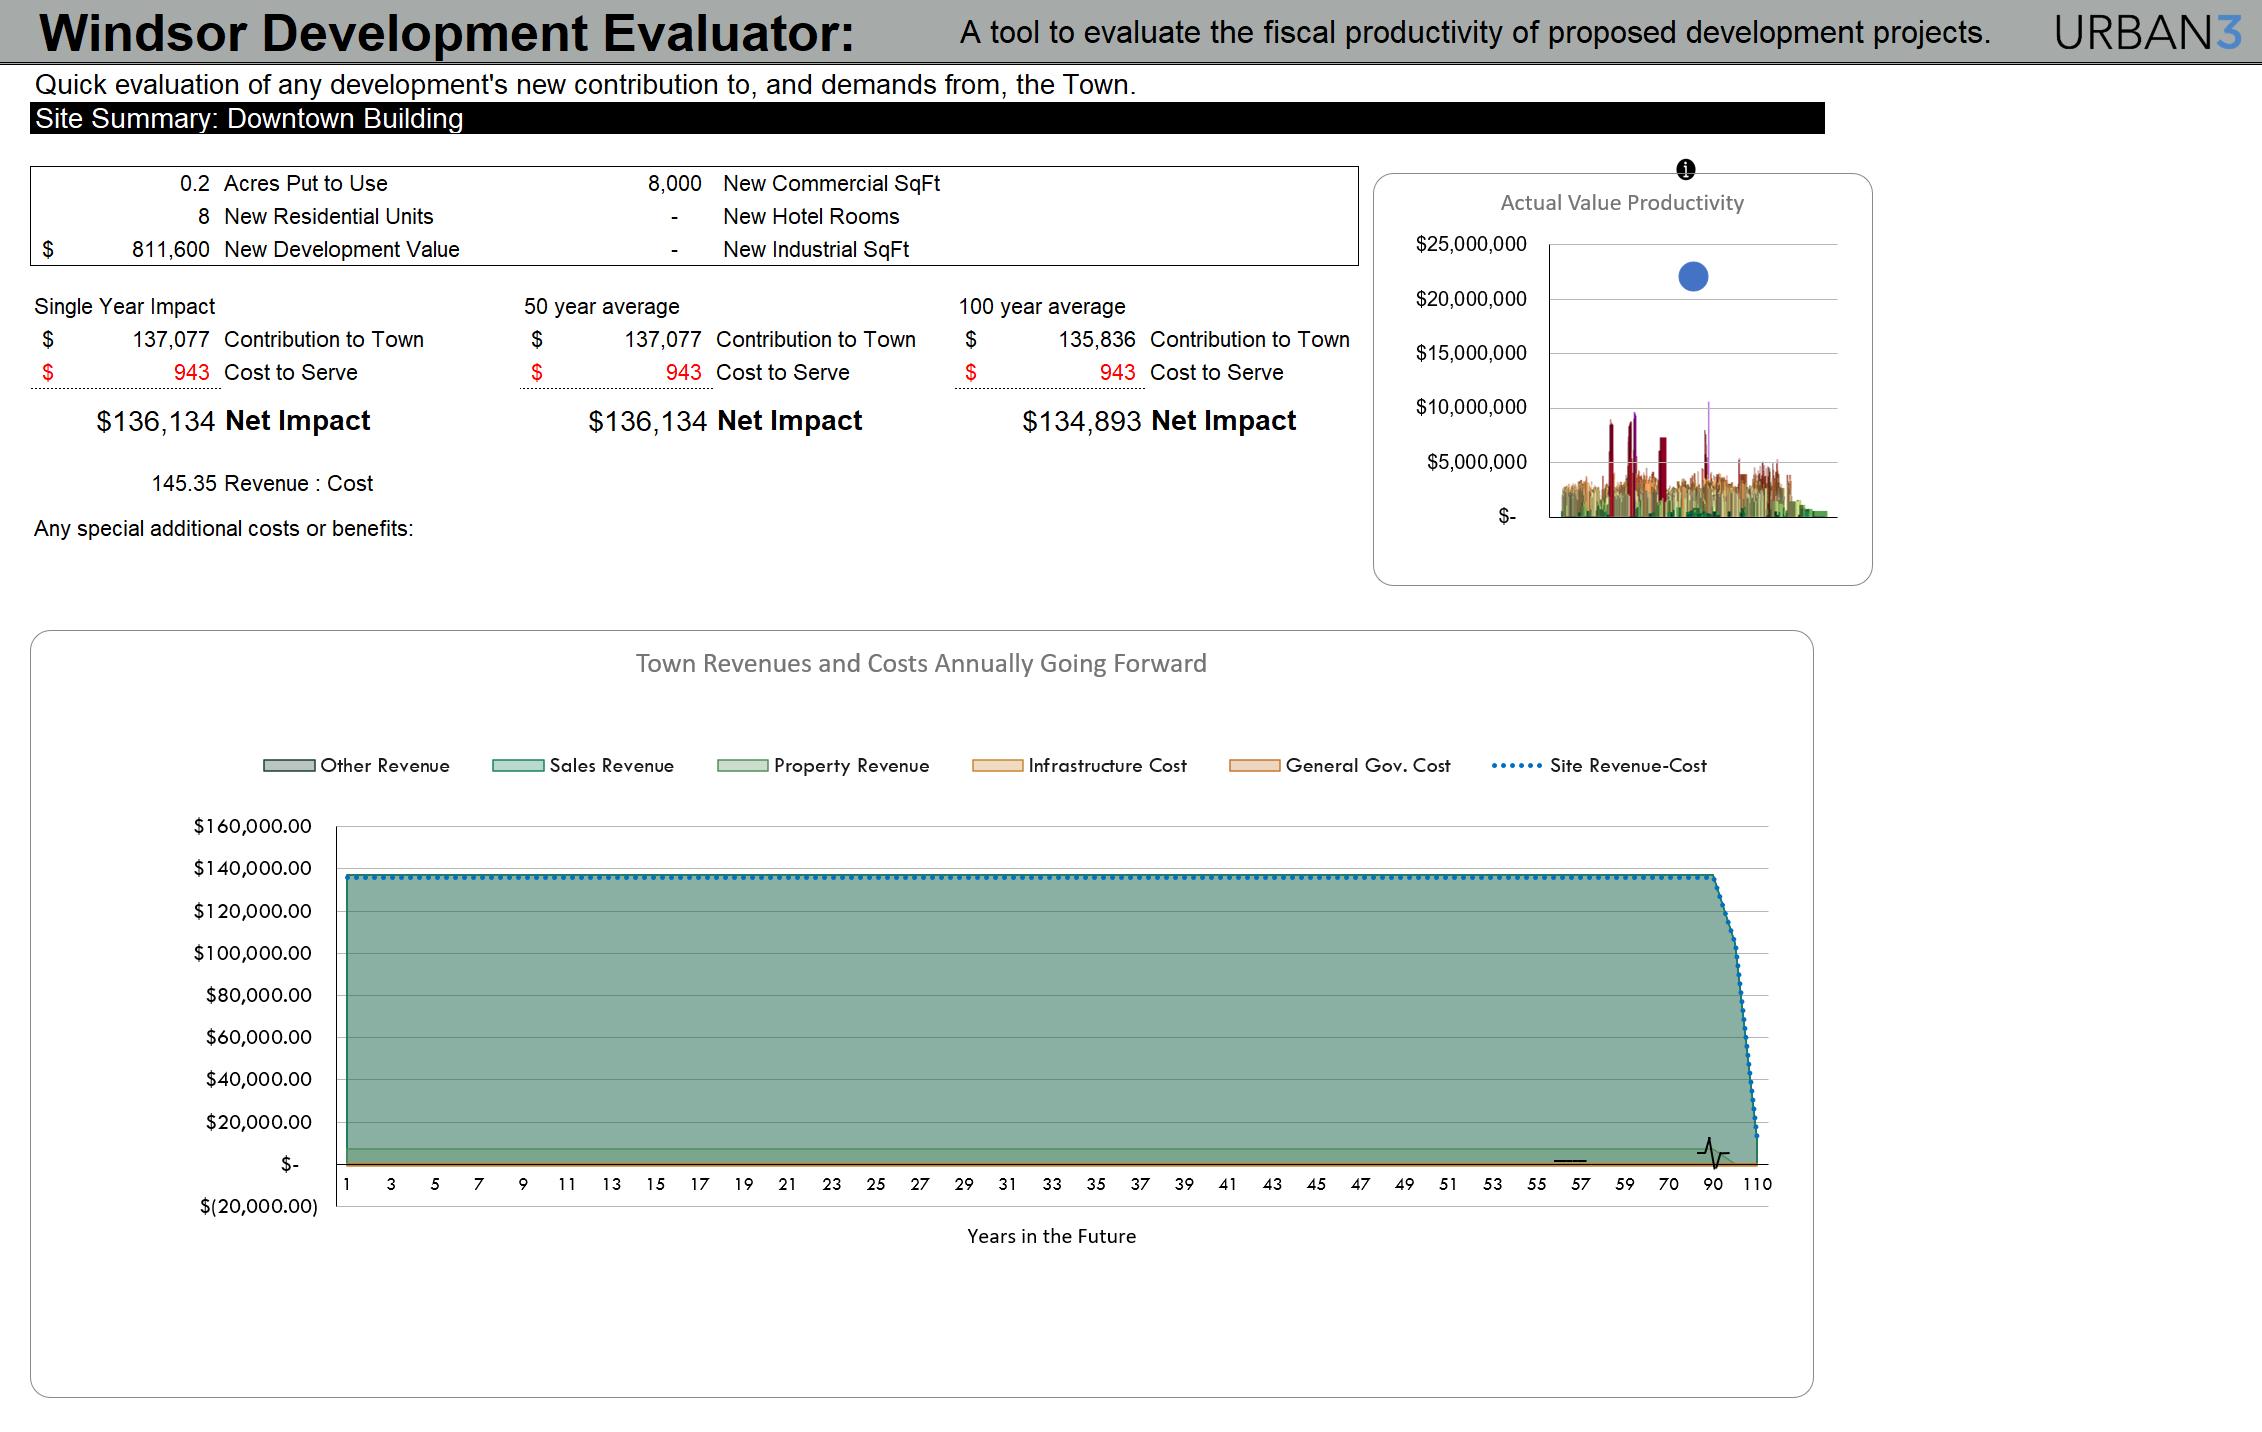
30 Economics of Community Design: Windsor, Colorado
0.2 acre site 1 two story, mixed use building First story 4,000 sq. ft retail space $338 sales per sq. ft $280 per sq. ft building value 4,000 sq. ft restaurant space $550 sales per sq. ft Second story 8 residential units, average 900 sq. ft $300 per sq. ft building value A-147
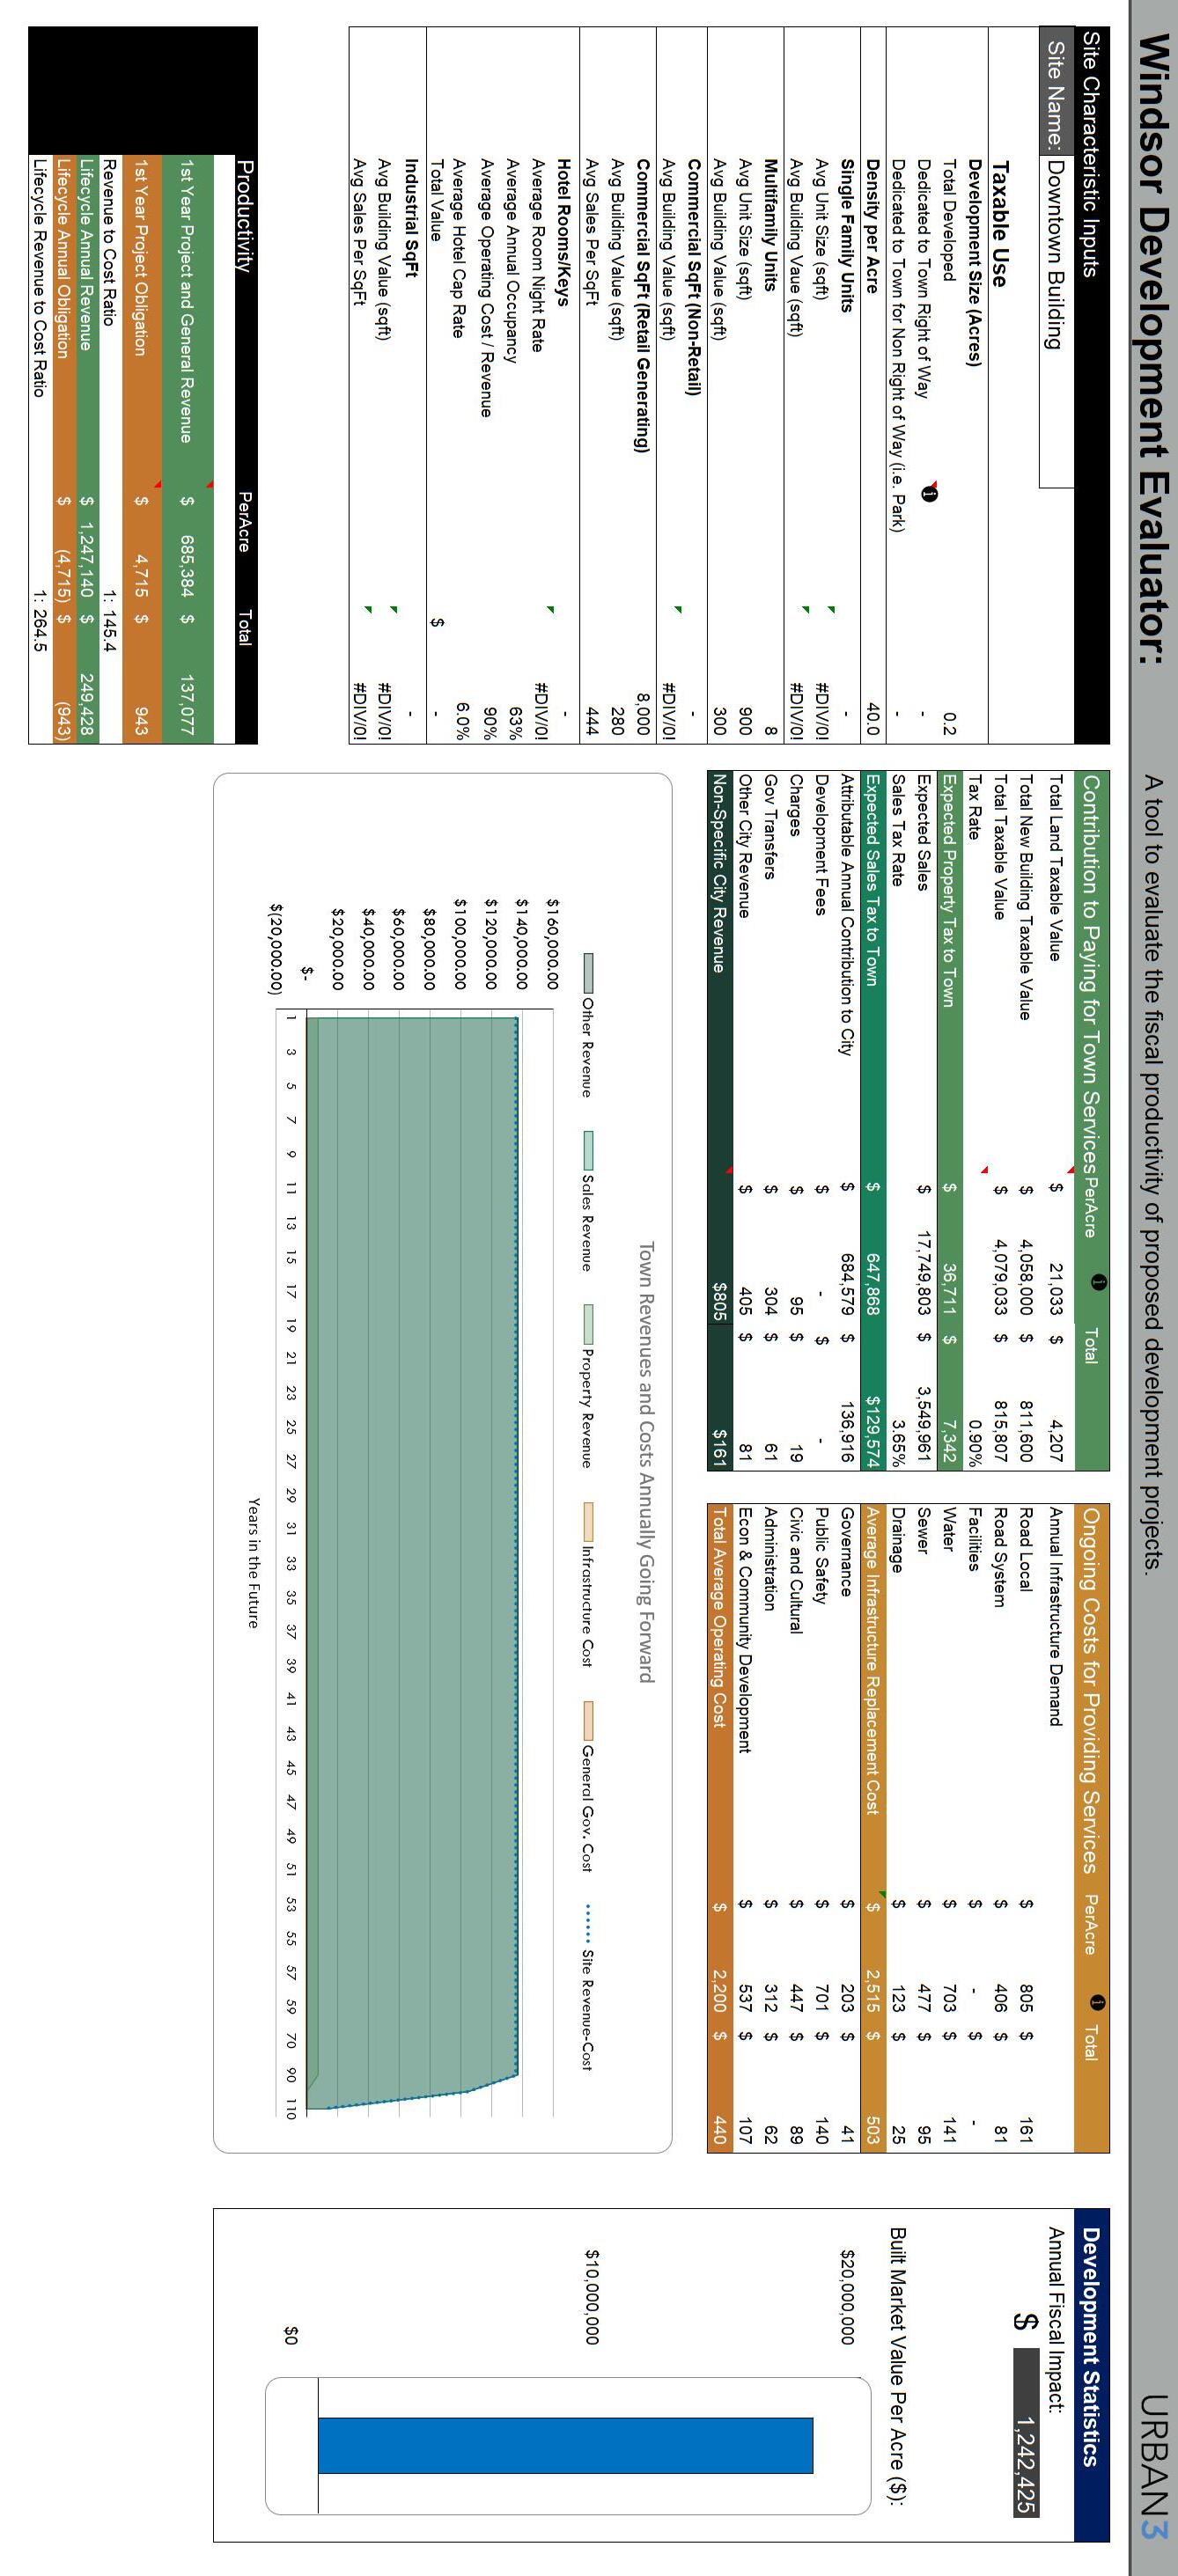
Sample Development A: Main Street-Style Building
31
A-148 WINDSOR COMPREHENSIVE PLAN |
Sample Development B: Commercial Center Development
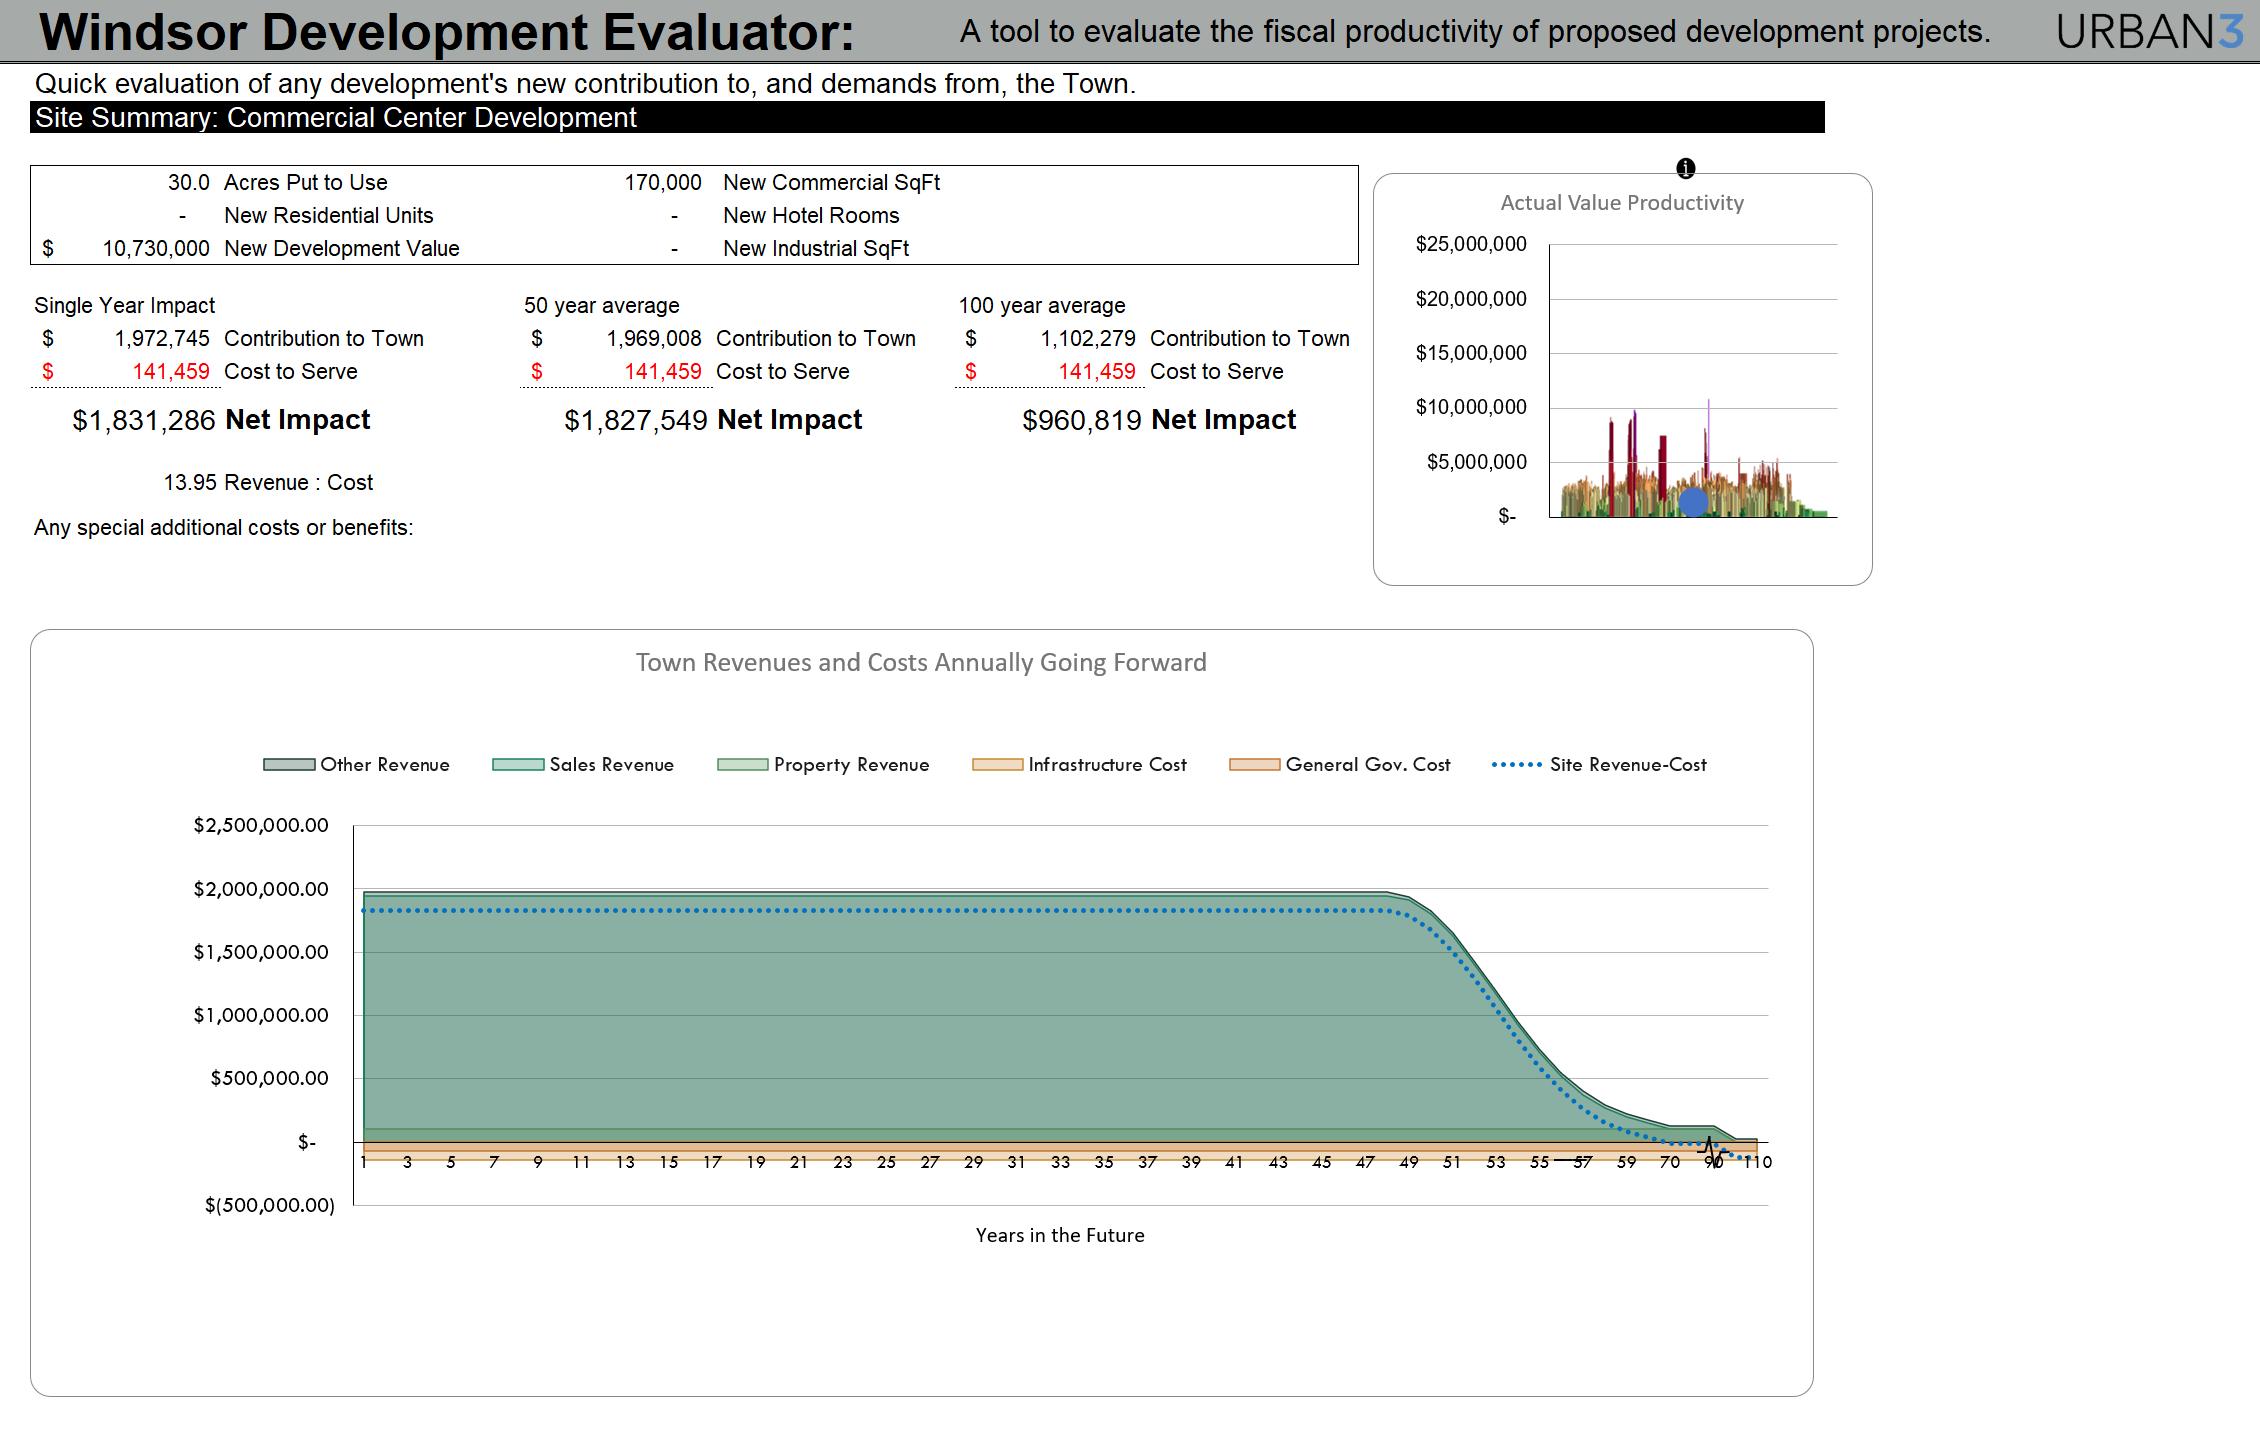
32 Economics of Community Design: Windsor, Colorado
30 acre site 6 single story buildings 120,000 sq. ft grocery store (X1) on 20 acres 10,000 sq. ft retail stores (X5)
per sq. ft building $200 per sq. ft building value
sales per sq. ft generation $365 sales per sq. ft generation A-149
$225
$269
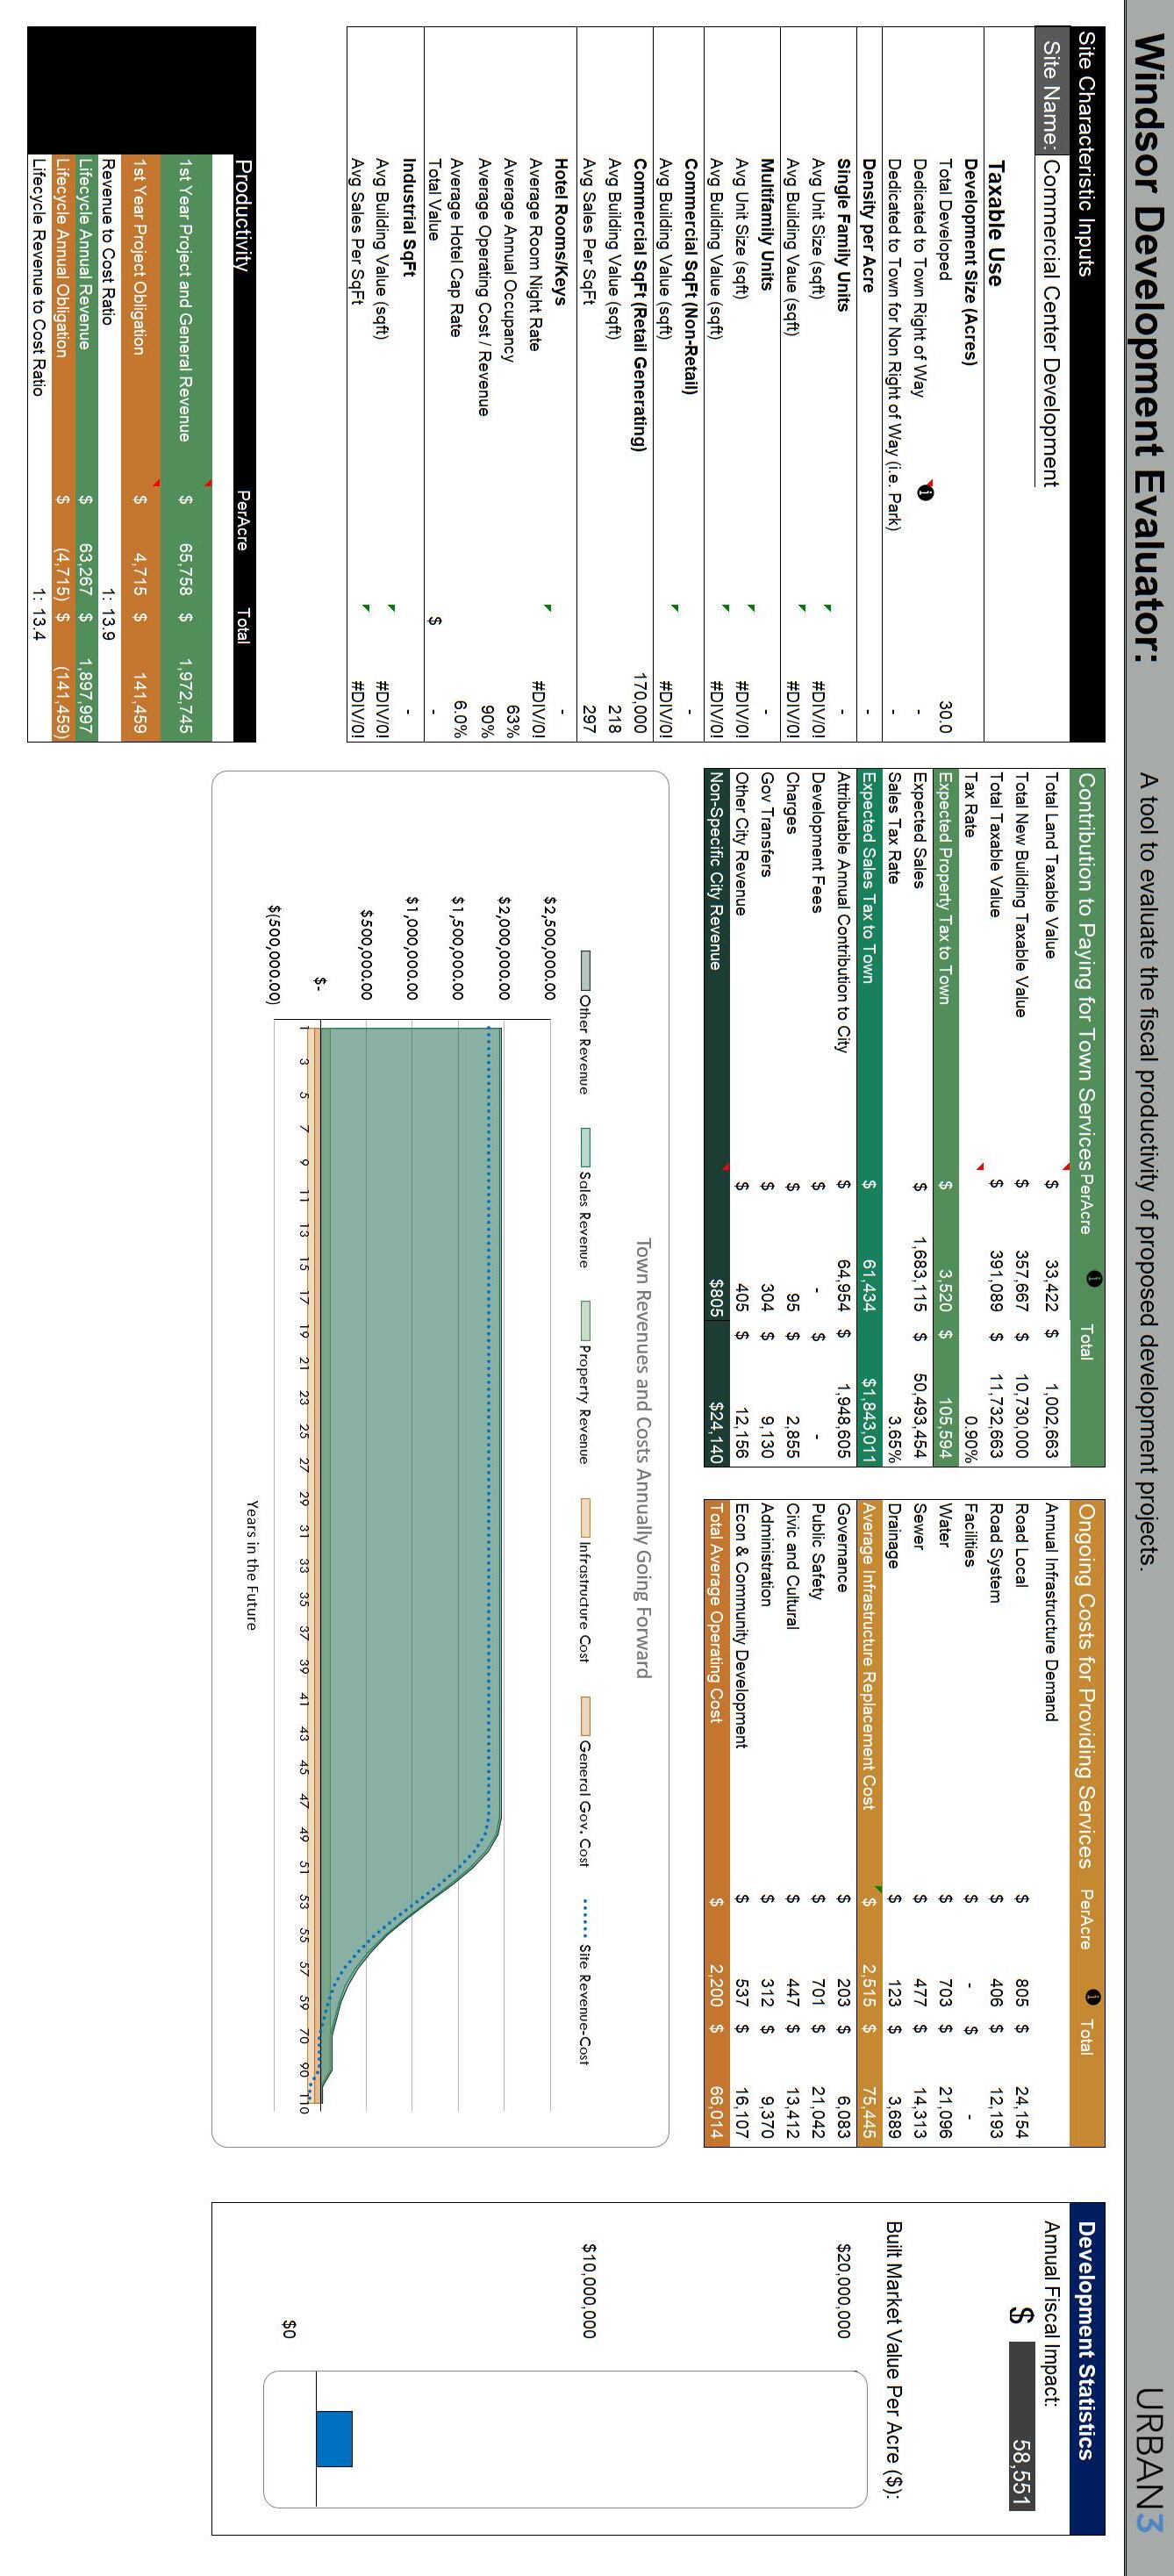
Sample Development
B: Commercial Center Development
33
A-150 WINDSOR COMPREHENSIVE PLAN |
Expanded Readings
Strong Towns: A Bottom-Up Revolution to Rebuild American Prosperity
Charles L. Marohn, Jr.
Walkable City: How Downtown Can Save America, One Step at a Time
Jeff Speck
Happy City: Transforming Our Lives Through Urban Design
Charles Montgomery
Confessions of a Recovering Engineer: Transportation for a Strong Town
Charles L. Marohn, Jr.

Data-driven storytelling
Principal Joe Minicozzi, AICP
Senior Planning Analyst Phillip Walters
Project Coordinator & Analyst Adam Carr, AICP
Graphics Specialist Brooke Robinson
urbanthree.com
All maps are created with ESRI software, and all data used in this analysis and report (unless otherwise noted) was provided by Google Maps; the Town of Windsor, Colorado; and Larimer & Weld Counties.
A-151
A-152 WINDSOR COMPREHENSIVE PLAN |

A-153