Appendix 6: Report by Collaborate for Social Change
Appendix 7: Equalities Impact Assessment (EIA)
Appendix 8: Engagement report
Appendix 1: Options appraisal
Appendix 1: Options appraisal
Mobilisation and stakeholder engagement (February 2025)
• Rapidly formed a collaborative way of working with all 15 councils across Hampshire and the Isle of Wight to establish a baseline position around possible viable options around the place, prior to any analysis being undertaken. This included 22 core stakeholder meetings with Chief Executives, Leaders, S151 officers. Council Chief Executives and Leaders shared their initial views, requirements and key challenges relating to LGR.
• Held an initial session with our key partners, including representatives from Police, Fire, Health and National Parks, to understand their views on potential opportunities and challenges through LGR.
Development of the public databook (February 2025)
• Across each council area, the latest available data was gathered from public data sources to enable detailed analysis for shortlisting activity. The data was captured to align with government evaluation criteria:
o Governance and efficiency: Population size, geographic area, council tax band D rates
o Financial sustainability: non- earmarked reserves, Gross Value Added, homelessness rates and rough sleeper counts
o Service delivery and outcomes: Life expectancy, Indices of multiple deprivation, unemployment rates
o Economic and social impact: GVA per capita, crime rates
o Geographic and demographic: Population by age group, population density
o Strategic alignment: IMD and housing delivery data
o Debt sustainability: Financing costs, gross external debt and capital financing requirement
o Council tax equalisation: Council tax base and additional incomes, adjusted debt metrics and retained business rates
• Where relevant in analysis of unitaries, data was adjusted to account for Hampshire County Council allocation
• The data collected for this analysis is listed below.
Total population 2023
Test
£2,142.04 New
Homelessness rate
Income deprivation
Financing costs
Capital financing requirement (CFR) Council
East Hampshire
13,597,984
Test Valley 28,784,641
New Forest 30,902,242
Southampton 51,208,447
Eastleigh 26,157,401
Fareham 17,974,990
Portsmouth 42,006,006
Havant 14,203,359
Gosport 7,431,529
Total 328,627,238
Gross business rates Council
Basingstoke and Deane
79,269,303
Rushmoor 57,634,430
Hart 33,559,217
Winchester 65,268,023
East Hampshire 32,401,279
Test Valley 70,924,178
New Forest 75,720,145
Southampton 102,829,879
Eastleigh 64,355,293
Fareham 44,740,386
Portsmouth 84,750,401
Havant 35,122,059
Gosport 18,713,451
Total 765,288,044
Winchester
188,781,858.28
East Hampshire 150,283,935.16
Test Valley 183,182,068.28
New Forest 235,553,354.50
Southampton 248,294,405.55
Eastleigh 175,166,773.82
Fareham 141,271,523.62
Portsmouth 214,166,193.80
Havant 130,602,508.99
Gosport 79,282,657.11
Total
Total rateable value
Basingstoke and
2,226,136,419.32
198,802,125
Rushmoor 144,177,237
Hart 78,772,540
Winchester 169,620,278
East Hampshire 98,329,591
Test Valley 168,162,703
New Forest 196,158,475
Southampton 270,163,577
Eastleigh 147,128,033
Fareham 114,072,431
Portsmouth 232,262,183
Havant 89,586,535
Gosport 49,695,122
Isle of Wight
Gross disposable housing income
Council
Basingstoke
Initial longlist of potential options for LGR (February 2025):
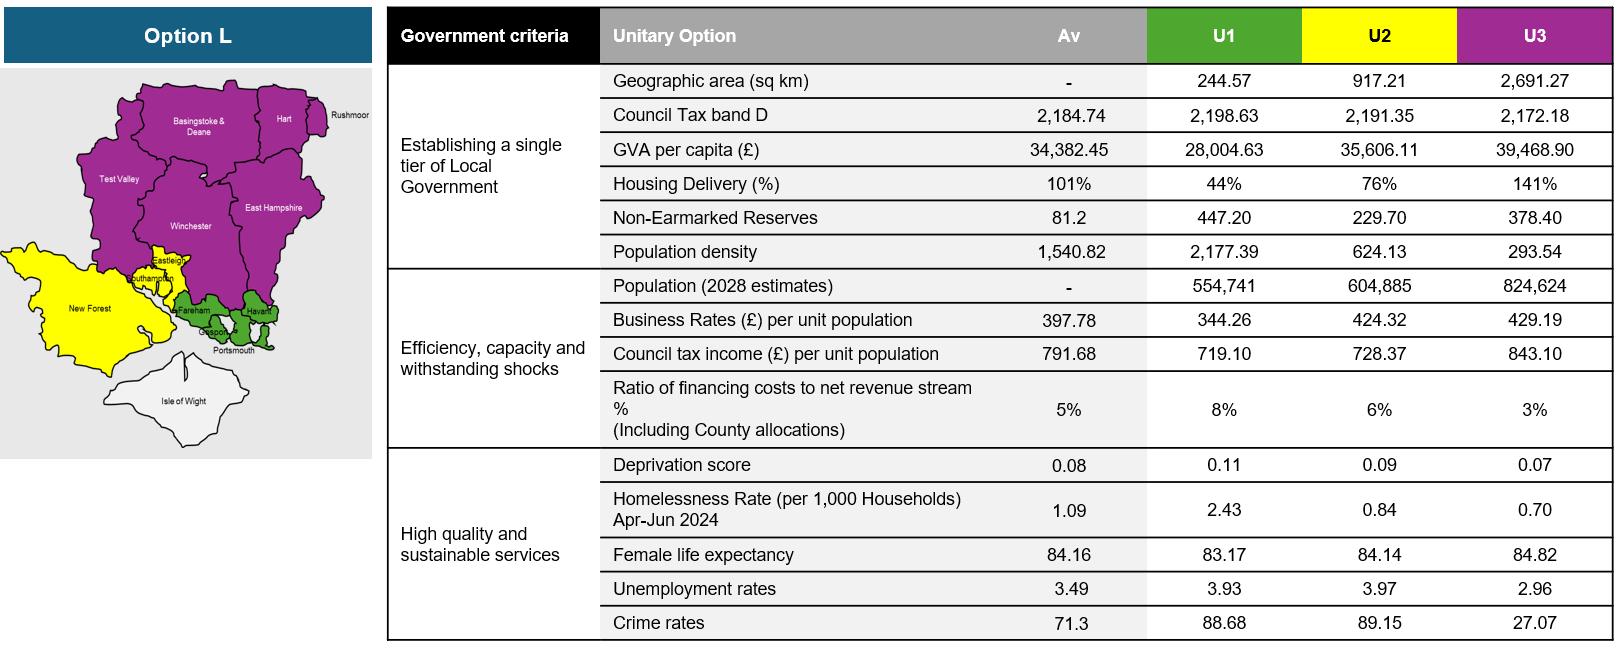
• A longlist of potential options was consolidated from around the 15 councils, ranging two new mainland to four new mainland configurations. There was a unanimous agreement that the Isle of Wight should remain an existing unitary early on in the process due to their unique island complexities. This meant a total of 12 options (A-L) were initially considered.
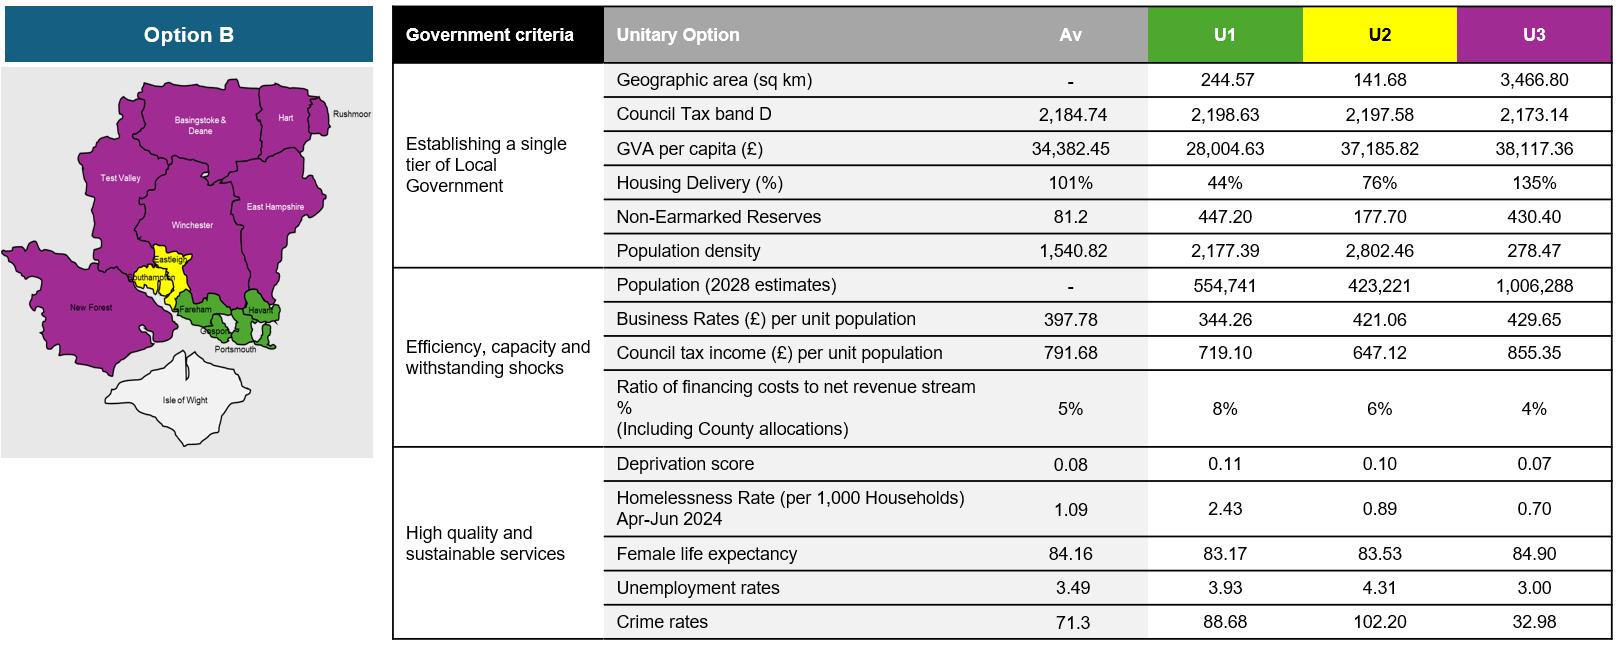
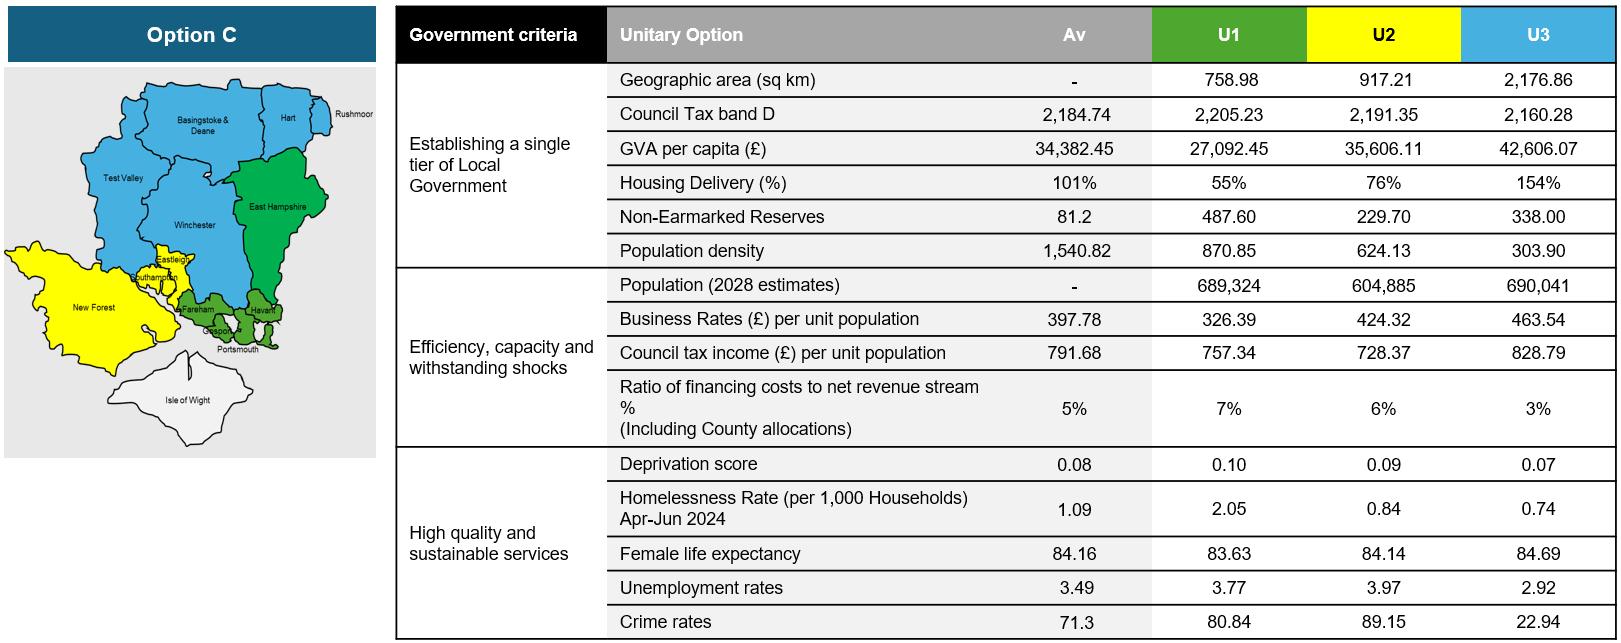
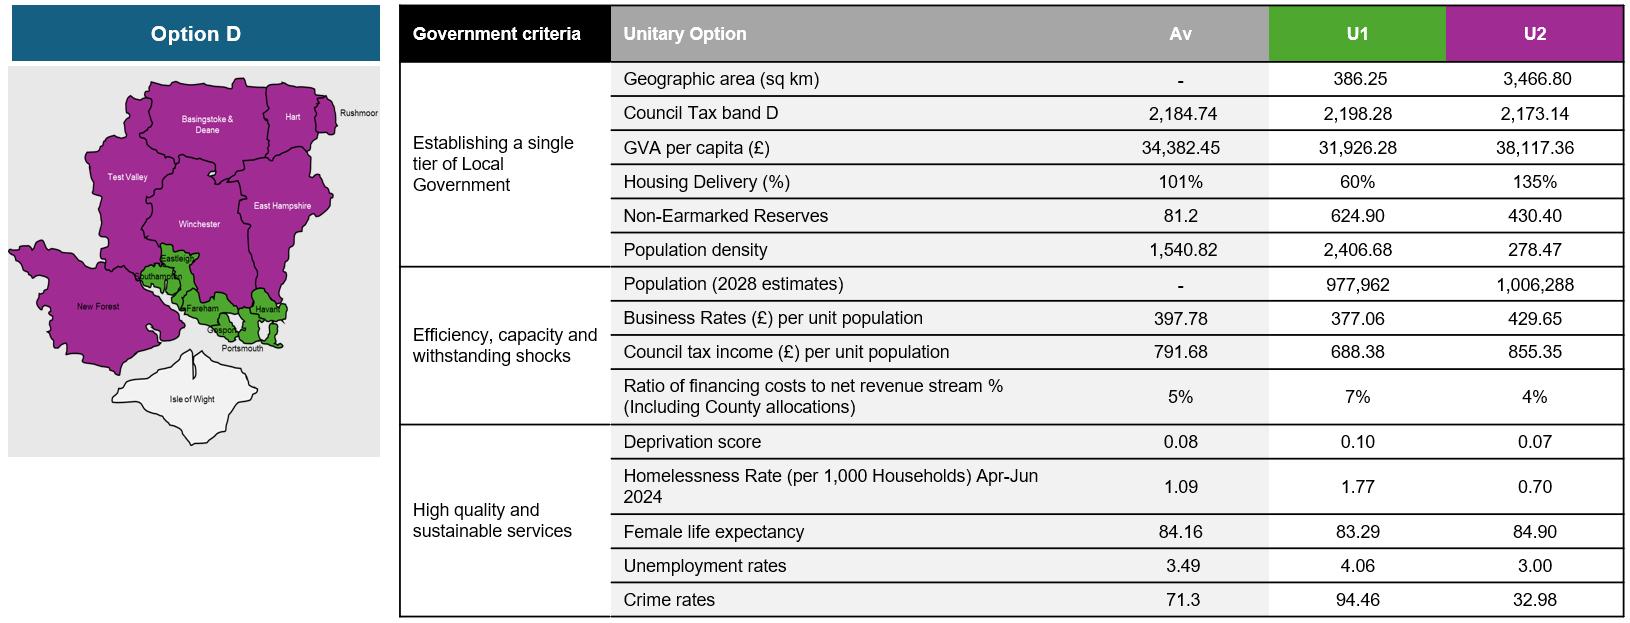
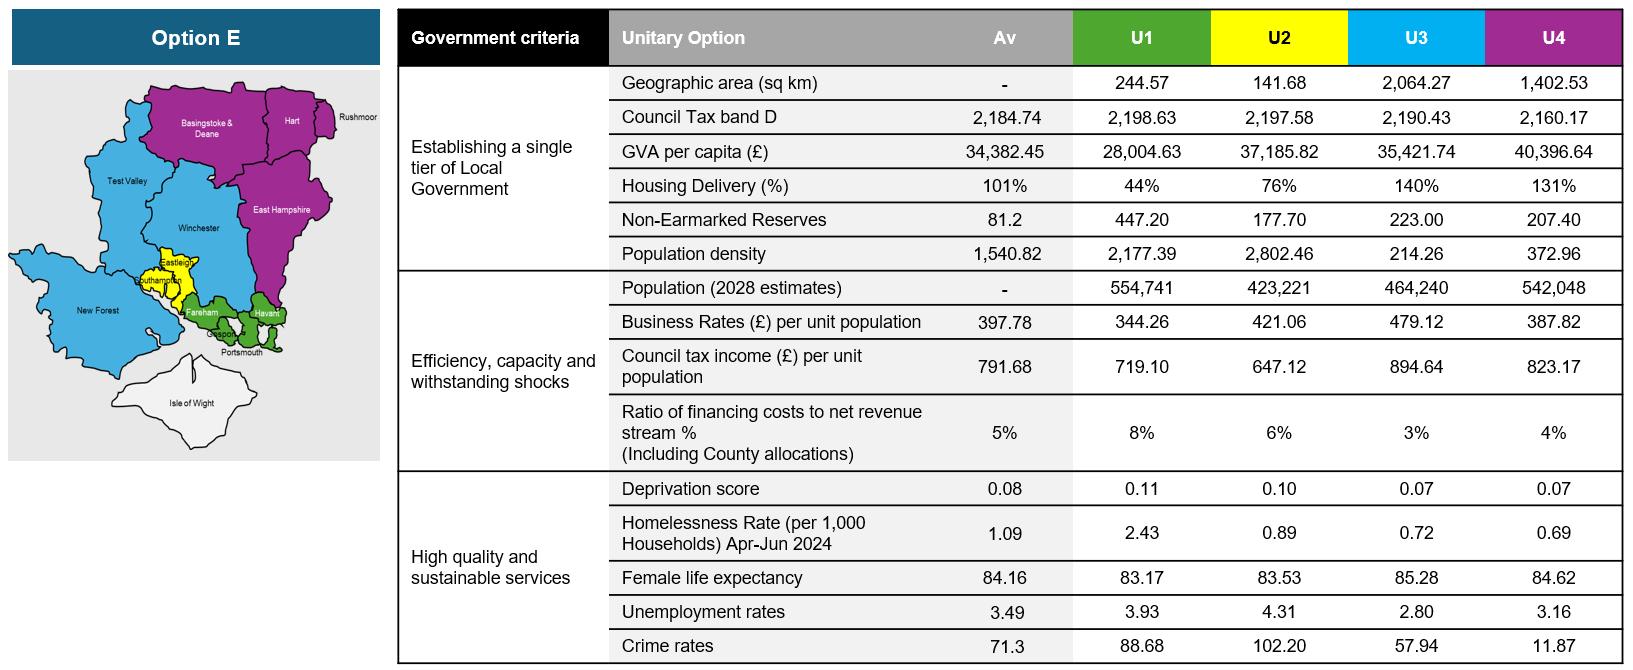
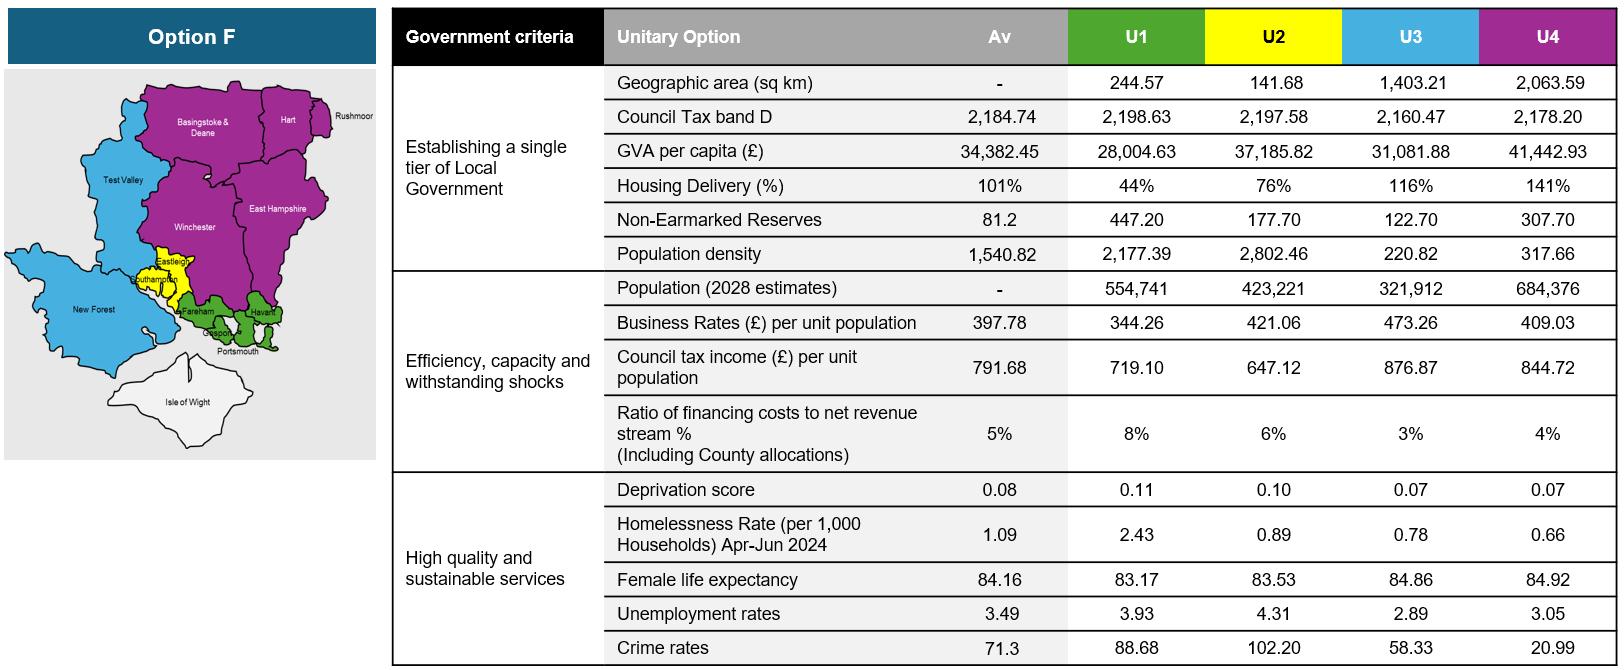
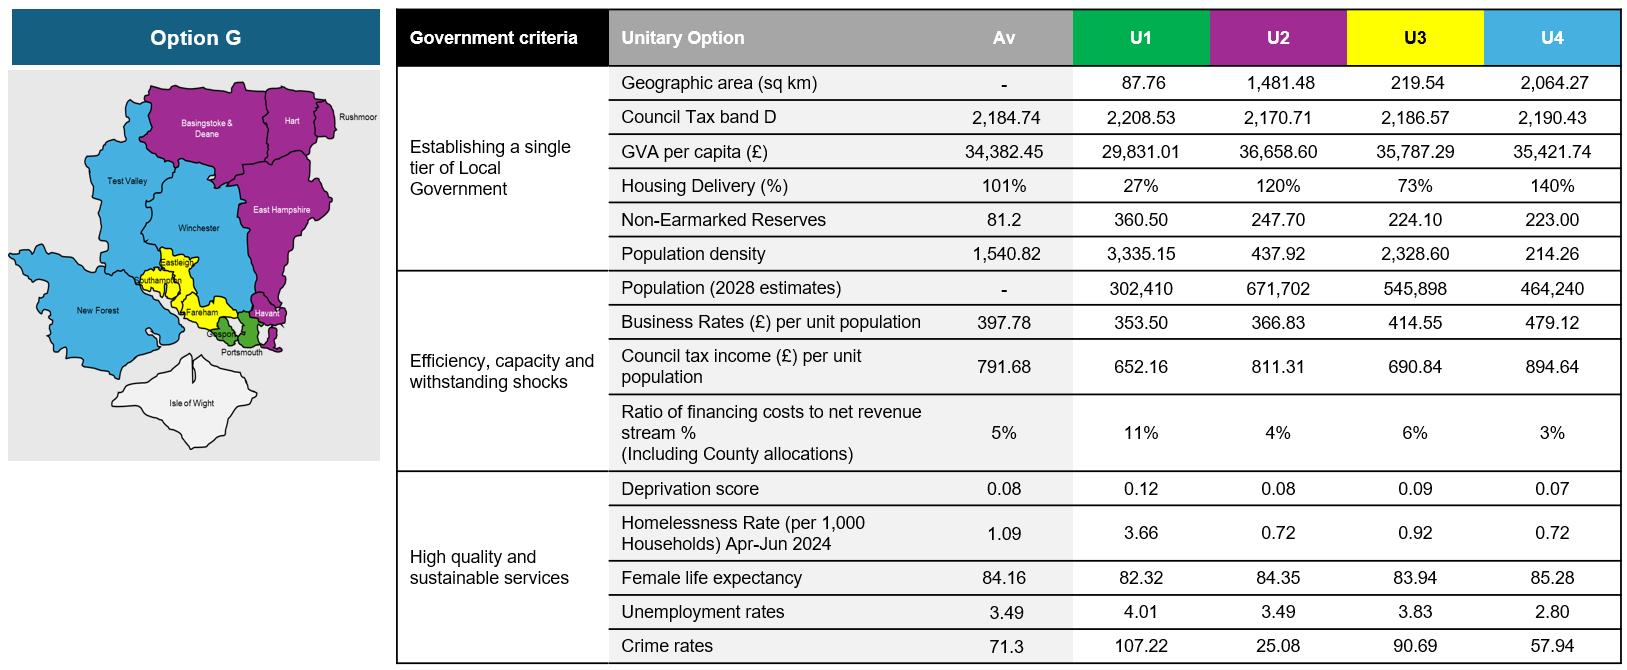
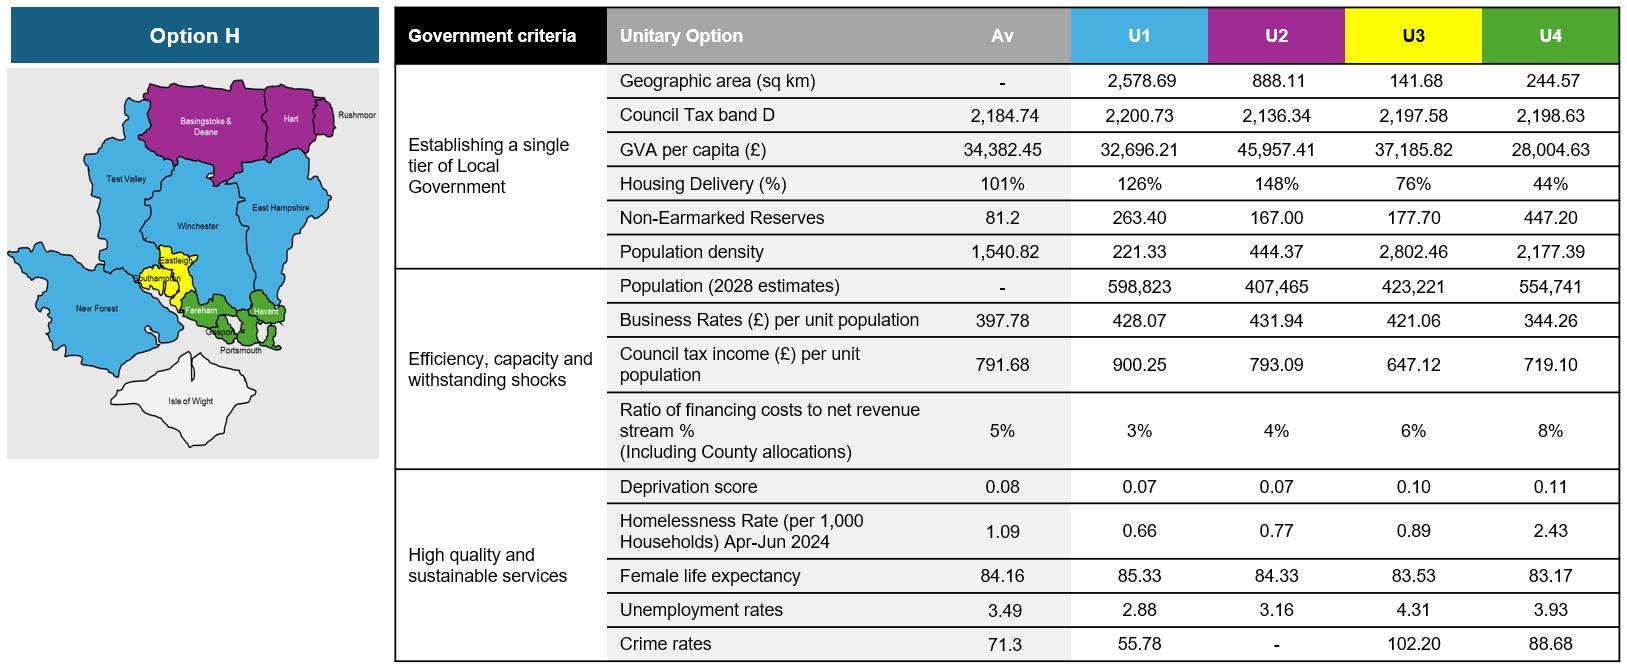
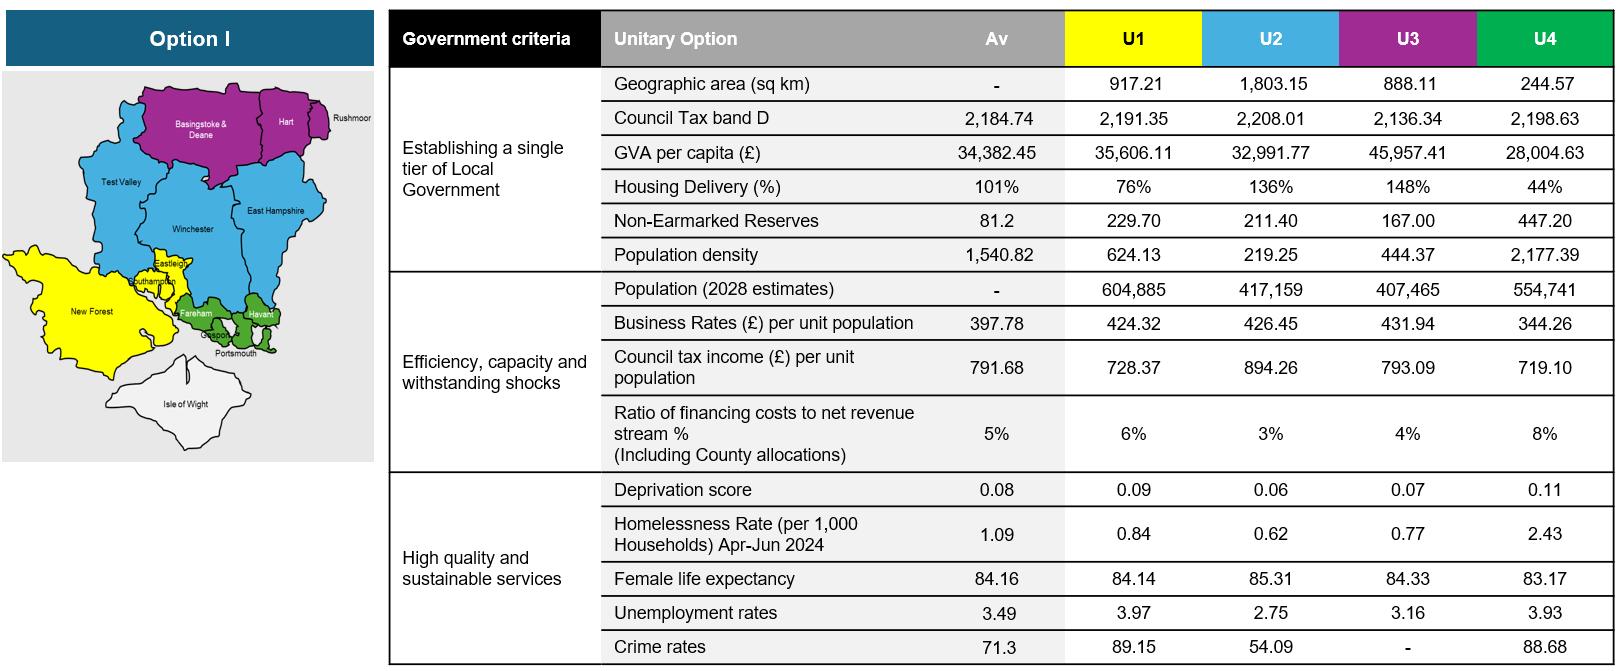
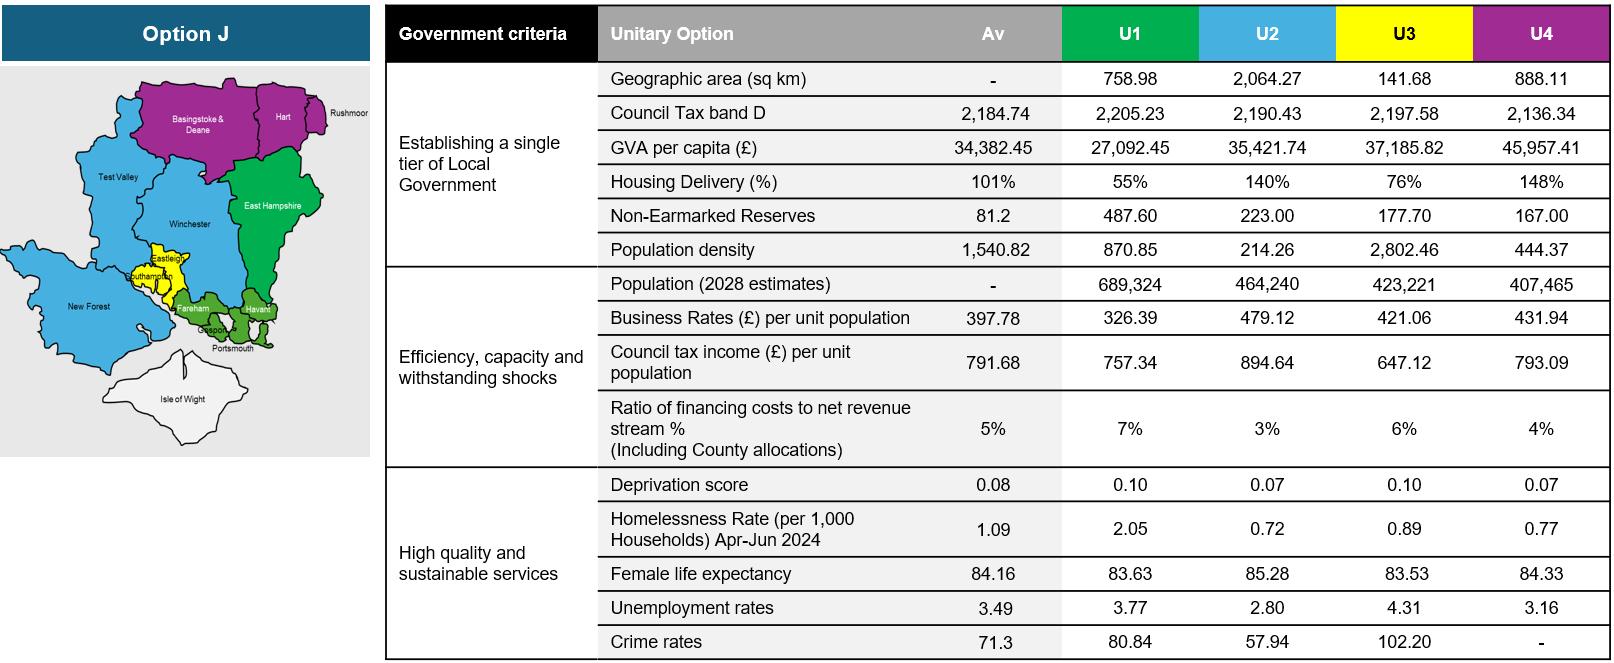
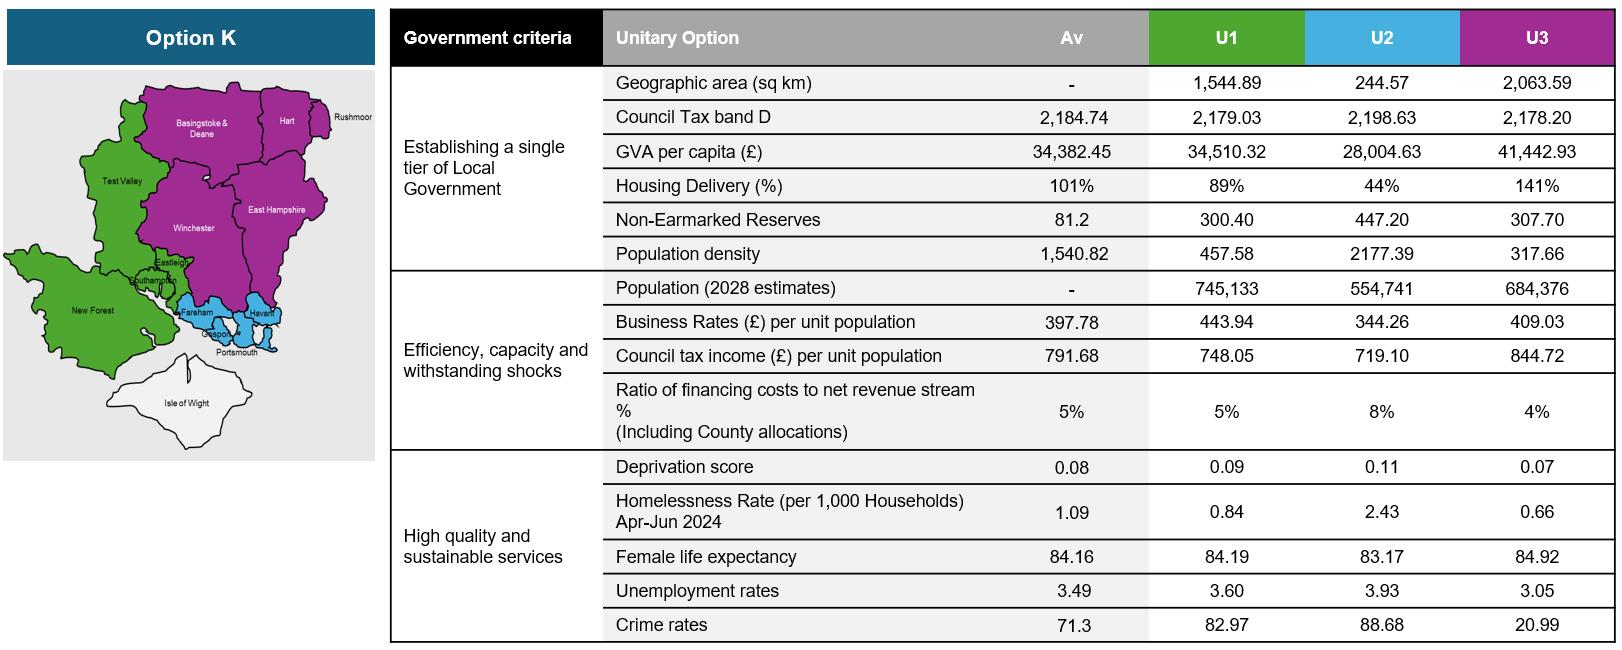
• To assess the 12 options, information from the databook was consolidated at a unitary level to be used as an evidence-base for decision-making on initial refinement, aligning to government criteria 1-3 where initial quantitative analysis was most applicable. The
aim of analysis was to demonstrate balance or imbalance across the unitary configurations. Each of the options, with initial data against government criteria 1-3, can be found below.
• This then informed a Leaders’ session where we were able to determine which options councils wished to continue refining, informed by this initial analysis. This reduced a long list of 12 options down to seven for further detailed analysis. The approach to do this was agreed with all Leaders and Chief Executives. Six options (A, B, C, D, F, G) were removed due to significant imbalances across unitaries after majority agreement.
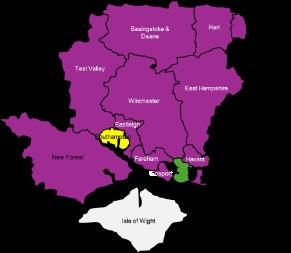
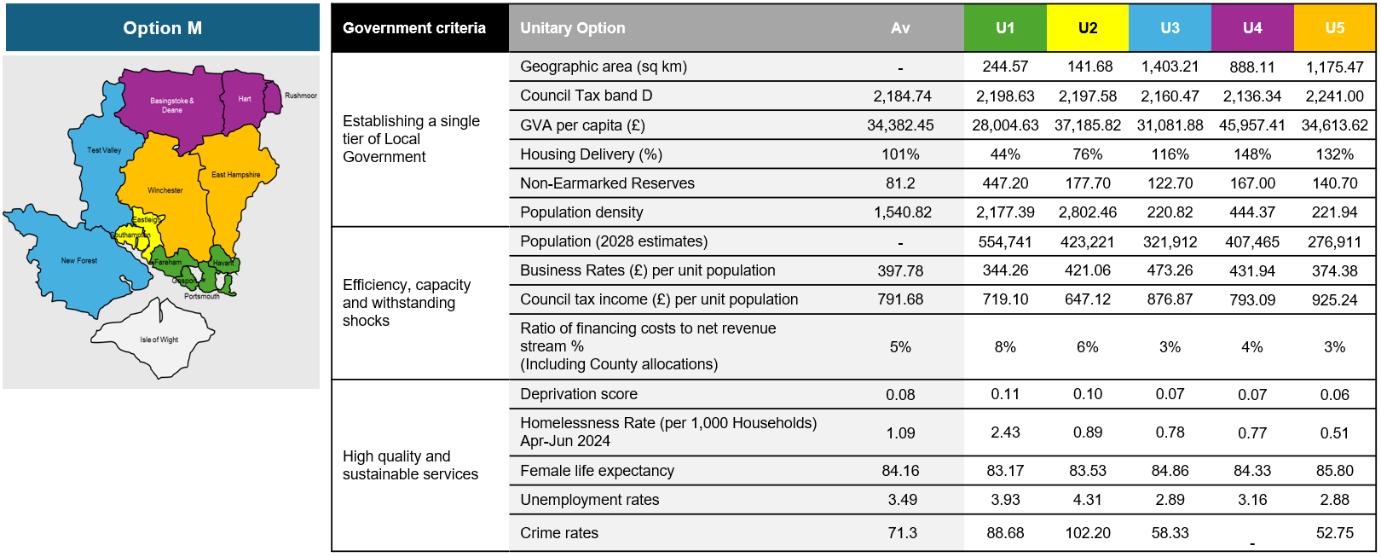
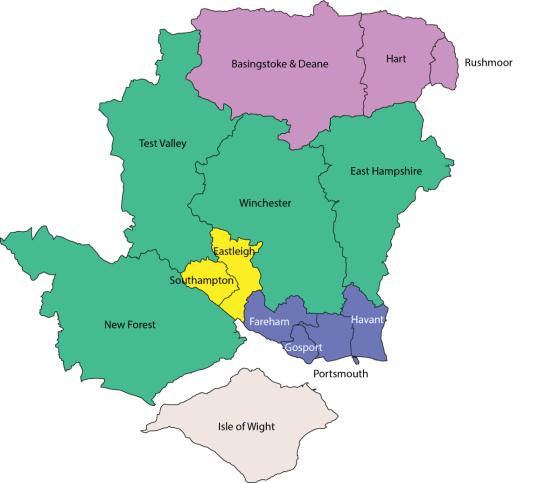
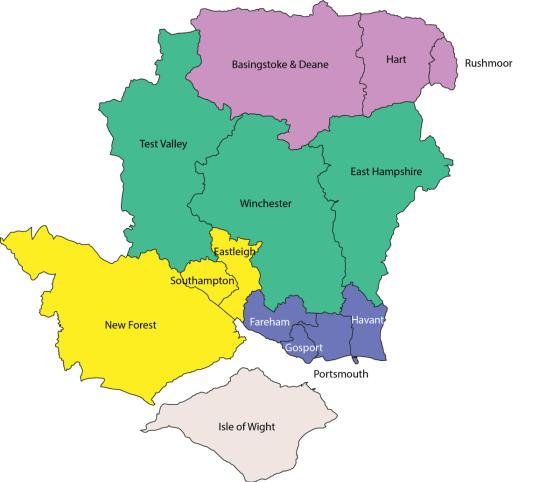
The maps and tables below show the initial longlist of options outlining unitary datapoints for metrics agreed against government criteria 1 to 3.
Interim proposal (March 2025)
• At the interim proposal stage, there was agreement from each of the councils to not submit any of the options refined because of lack of full consensus at that stage and the need to further scrutinise each of the options through a detailed appraisal.
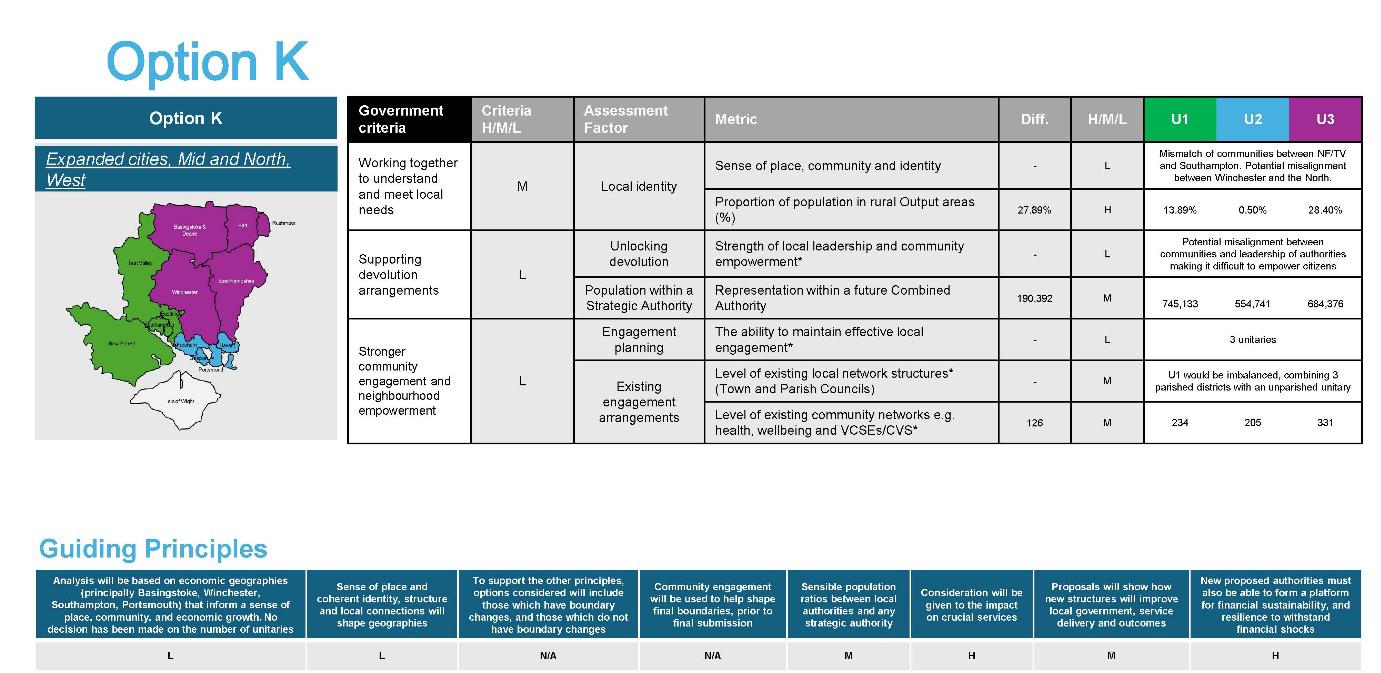
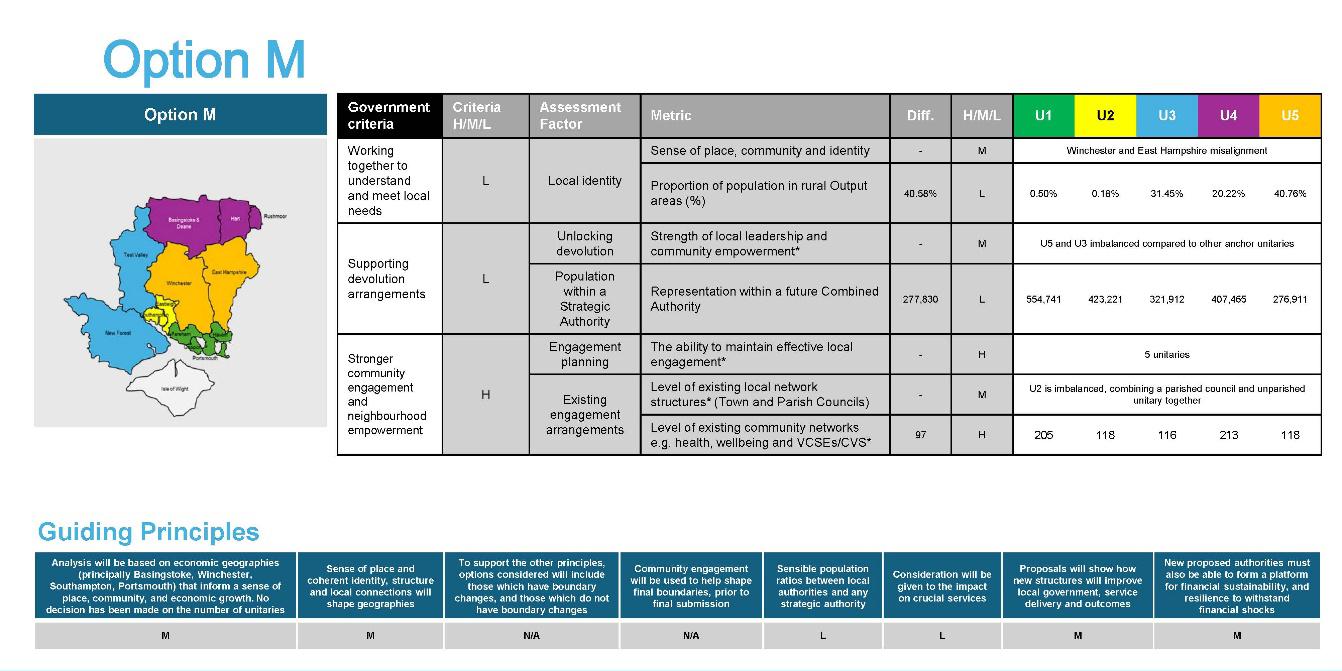
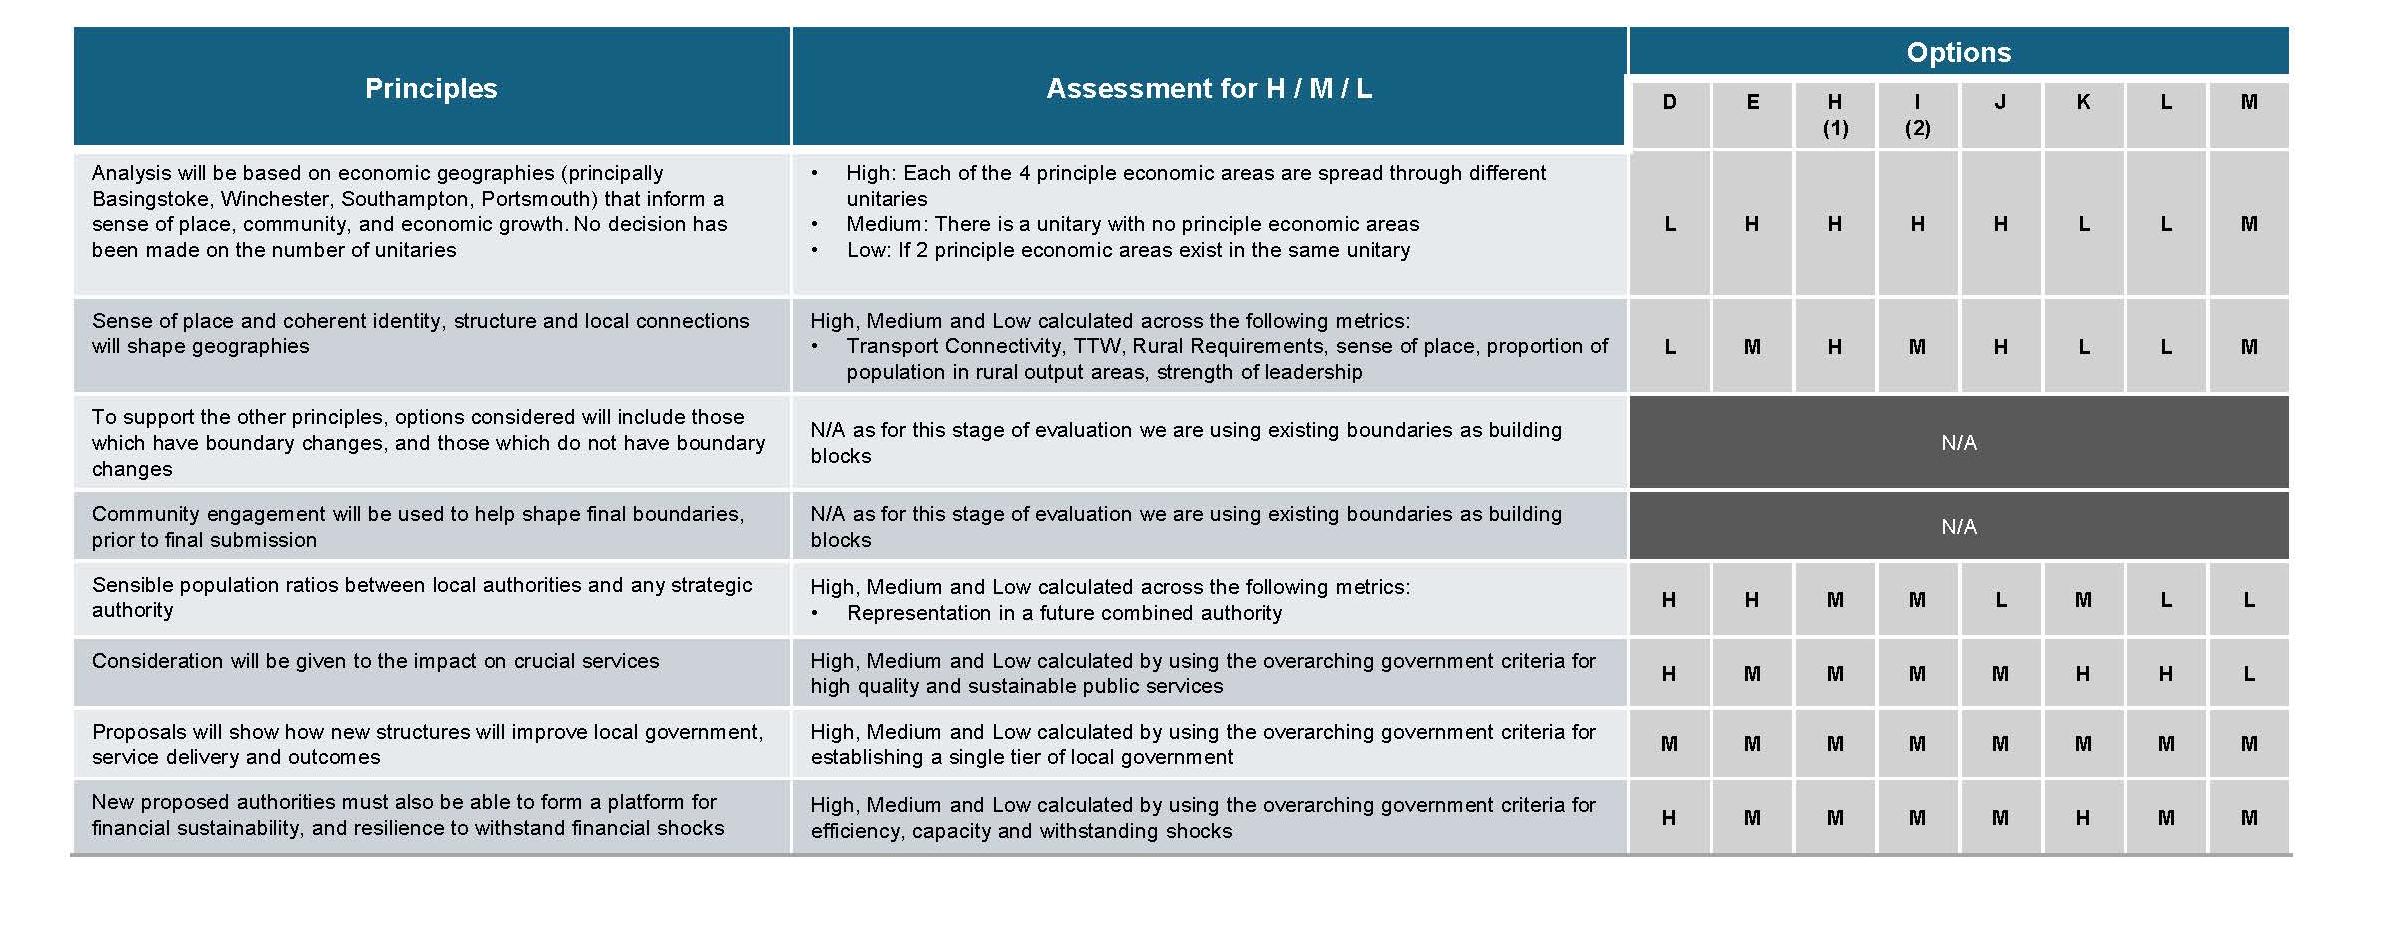
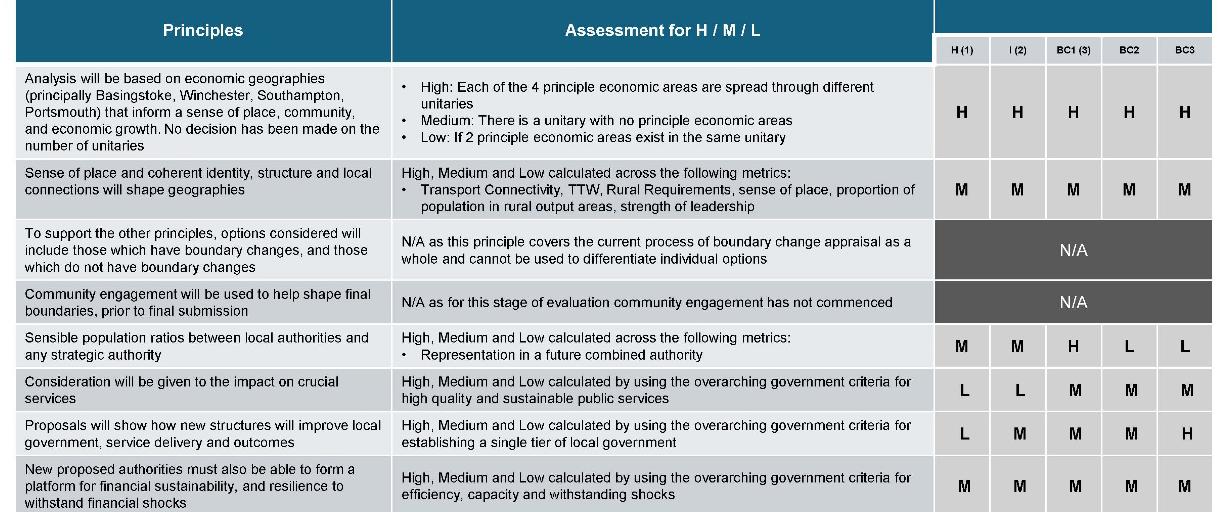
• In the meantime, all 15 councils agreed on the following guiding principles that would be used to underpin future decisions and incorporated into the interim proposal. A joint submission was made by the 15 councils across Hampshire and the Isle of Wight, outlining the guiding principles, timelines, key areas and how councils are working together.
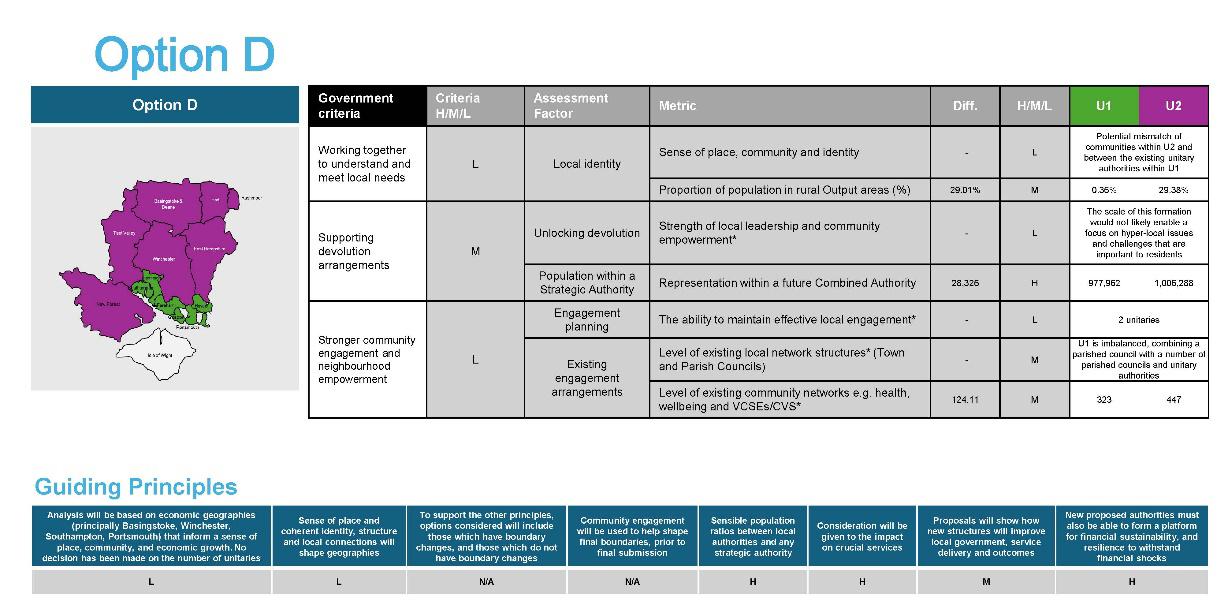
1. Analysis will be based on economic geographies (principally Basingstoke, Winchester, Southampton, Portsmouth) that inform a sense of place, community, and economic growth. No decision has been made on the number of unitaries.
2. Sense of place and coherent identity, structure and local connections will shape geographies.
3. To support the other principles, options considered will include those which have boundary changes, and those which do not have boundary changes.
4. Community engagement will be used to help shape final boundaries, prior to final submission.
5. Proposals will ensure there are sensible population ratios between local authorities and any strategic authority, with options retaining equitable representation and voting rights.
6. Consideration will be given to the impact on crucial services.
7. Proposals will show how new structures will improve local government, service delivery and outcomes.
8. New proposed authorities must also be able to form a platform for financial sustainability, and resilience to withstand financial shocks.
Preferred options by councils (March 2025)
• Post Interim submission, an activity was conducted whereby each council submitted their preferences on options based on their knowledge of the area and data considered to date. For completeness and transparency, this was done for each of the initial 12 options, with the seven refined options being taken forward for further analysis per the initial longlist section.
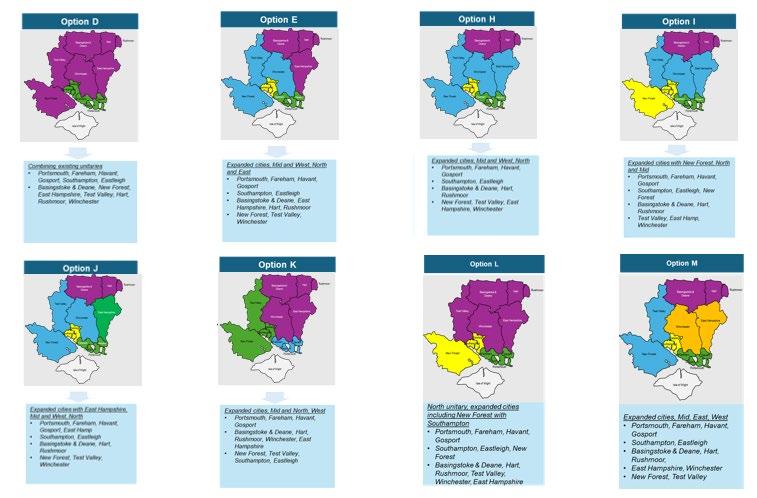
• Each council was also able to submit their preferences (below) related to boundary changes. Option M was added post-workshop after agreement from all councils that a five new mainland unitary model should also be considered as part of the options appraisal. Option D was also re-added due to council support and to ensure the detailed analysis covered options from two to five mainland unitaries. This meant that a total of eight options were taken forward to the detailed options appraisal stage (D, E, H, I, J, K, L, M).
The table and maps below show the preferred options by councils, along with boundary change details.
Boundary Changes
Boundary changes will only be considered at a Parish boundary level and the impact of any change must be evidenced by credible data Any new boundary proposed must also be contiguous to existing neighbourhoods and have full resident support Any change that damages the viability of a mid Hants unitary will not be supported
Without boundary changes Would want to assess impact of New Forest going into a southern unitary and request to be modelled
Councillors have asked if avariation of Option F(M) is worked up that establishes 5 UAs It would see Winchester and East Hampshire together and a northern UA of Basingstoke, Hart and Rushmoor The rest of option F would remain as is
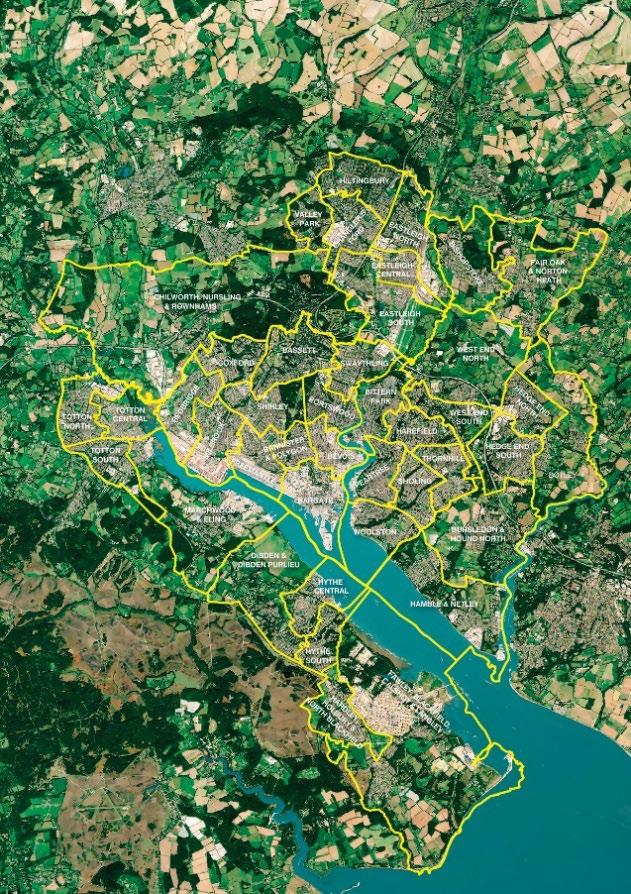
With and withoutboundary changes A further option with boundary changes that is based around consolidating the urban areas to maximise the economic growth potential for the region- Southampton (all), Test Valley (Chilworth Nursling and Rownhams ), Eastleigh (all), New Forest - (Waterside -Totton North, Totton Central, Totton South, Marchwood & Eling, Dibden & Dibden Purlieu, Hythe Central, Hythe South, Hardley Holbury & N Blackfield, Fawley Blackfield Calshot & Langley )
I – without boundary changes H – with boundary changes Option H 1: all of Southampton, all of Eastleigh, plus the following wards : Test Valley : Valley Park , North Baddesley , Chilworth Nursling & Rownhams , New Forest : Totton North, Totton Central, Totton South, Marchwood & Eling Dibden & Dibden Purlieu, Hythe Central, Hythe South, Hardley Holbury & N Blackfield, Fawley Blackfield Calshot & LangleyOption H 2: as H 1 plus additional Test Valley wards : Ampfield & Braishfield, Romsey Cupernham Romsey Abbey , Romsey Tadburn
With boundary changes
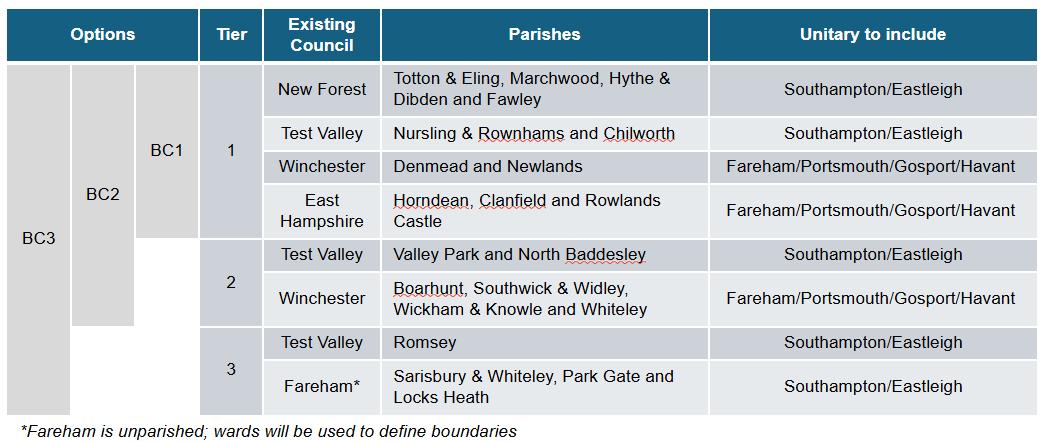
H , I or J with boundary changes – Waterlooville – Newlands Parish Would welcome discussion re Denmead Ward Ward boundaries around Rowlands Castle and Clanfield
• The first activity as part of the detailed options analysis was to agree the metrics to be used to assess each of the remaining options. Each of the potential metrics were discussed with the Chief Executive group and refined based on which metrics would allow for Leaders to make an evidence-based informed decision.
• Each of the agreed upon metrics were aligned with government criteria and associated ‘assessment factors’, which were used to be more targeted for each criterion and guidance. The metrics were also aligned with the agreed upon guiding principles submitted as part of the Interim proposal.
• A combination of quantitative and qualitative metrics was agreed as part of this process, with relevant data sources identified. Some sources were available public, whereas other service demand and financial data was requested as part of the council s151 data request (used also to inform the financial case).
(2022)
Travel to Work Areas (December 2011) Boundaries UK BUC
Travel to Work Areas (December 2021) Boundaries UK BUC
Administrative Areas (December 2023) in the UK
Existing initiatives across the current councils e.g. health and wellbeing, VCSE organisations
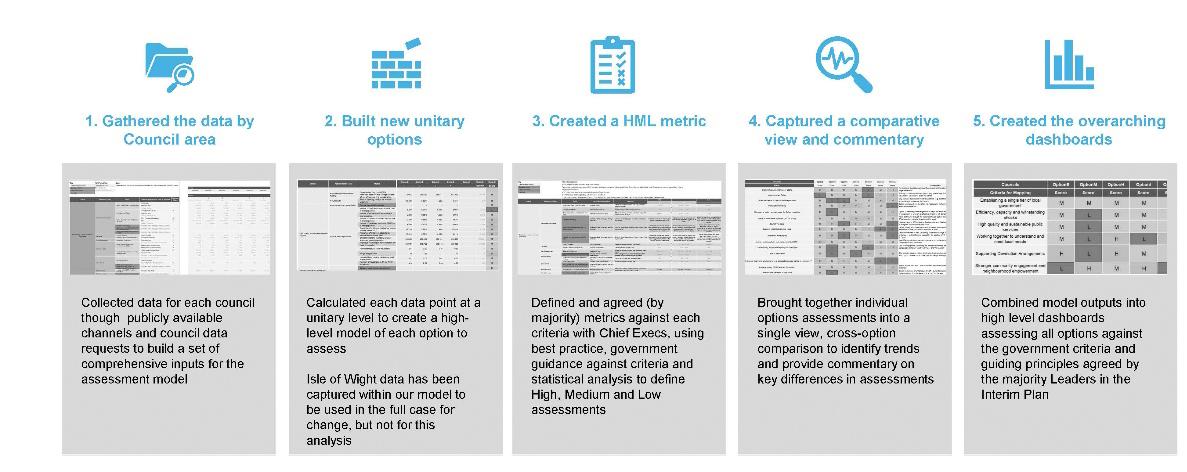
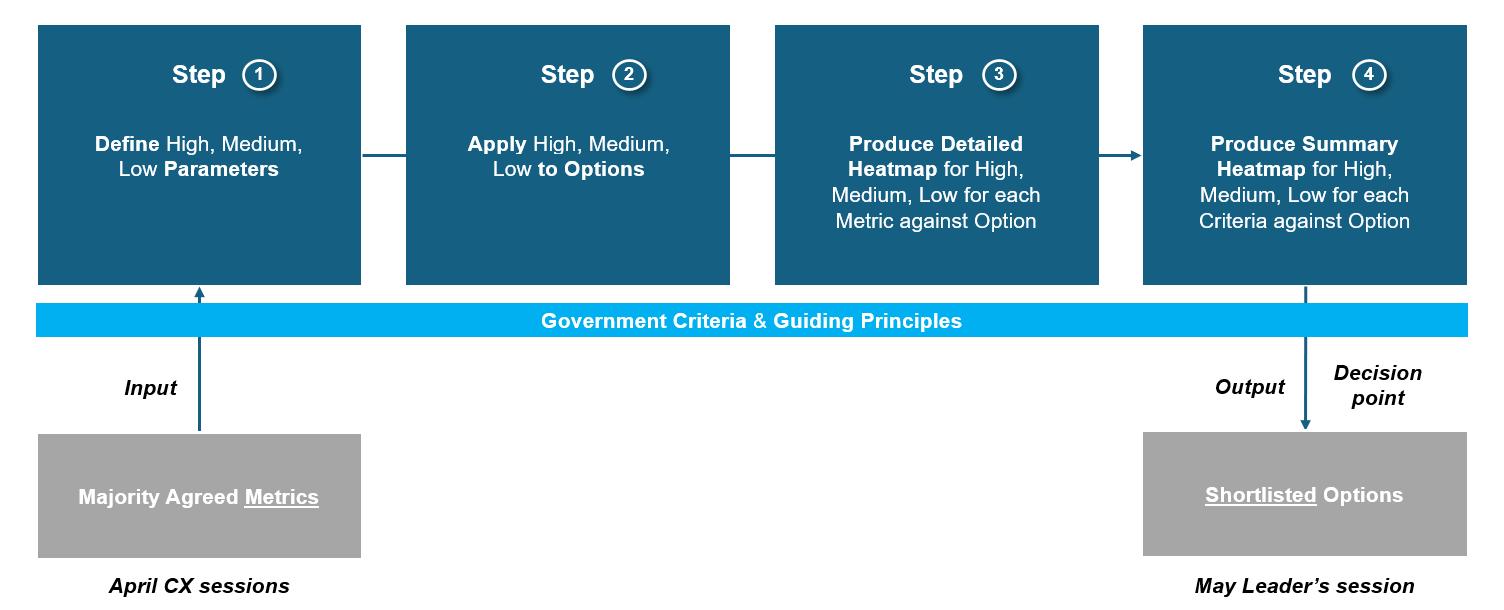
• Data was gathered following agreement on the metrics for the detailed appraisal and entered into a model. This model focused on creating balanced and financially sustainable future unitary authorities that would deliver effective services for the communities. (For this analysis, Isle of Wight figures were excluded as a separate case for remaining as-is was under development, which would have skewed the analysis.) The image below provides an overview of the process from raw data to analysis outcomes of the options considered for refinement.
• Inputted and continuously validated financial information with s151s, as well as data collated by each council into the model. The finances captured from each council covered revenue budgets and medium-term forecasts, reserves and provisions, balance sheet, capital programme, statutory and ring-fenced accounts, existing shared services, pooled budgets, and contracts.
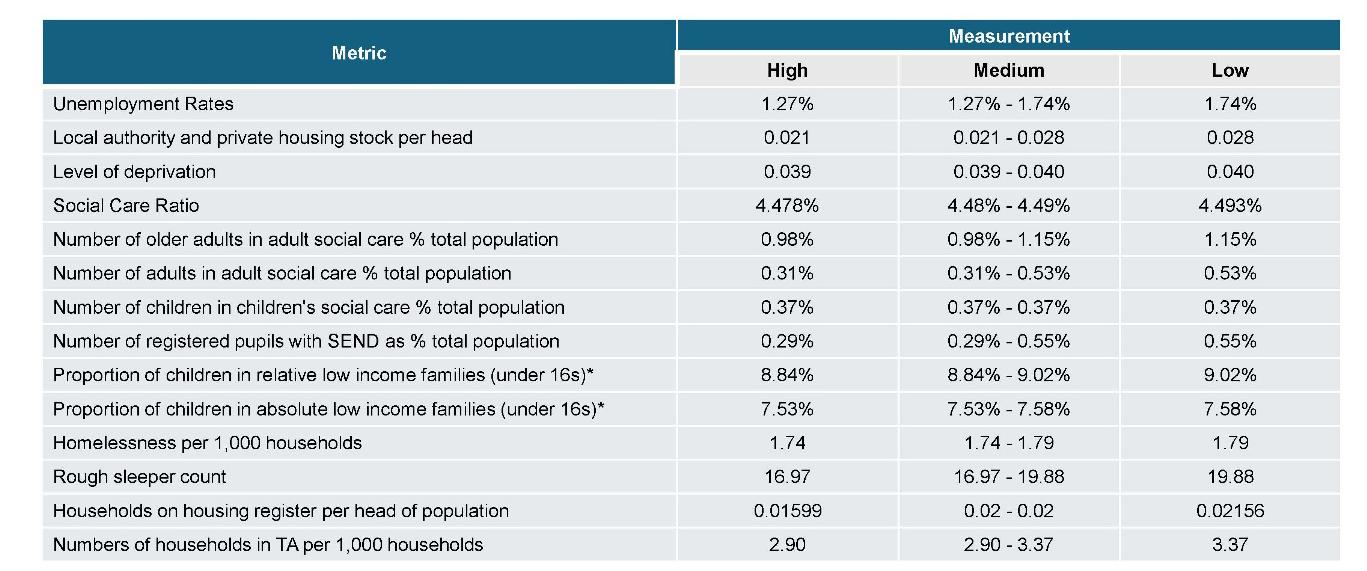
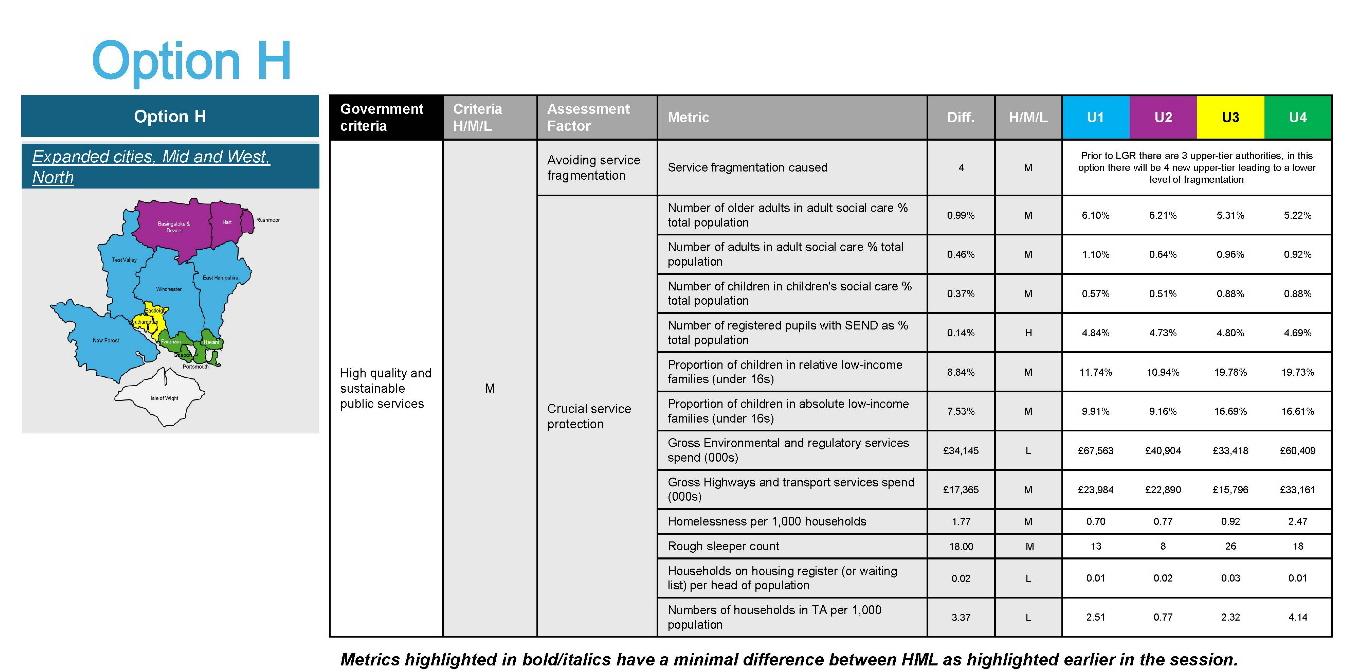
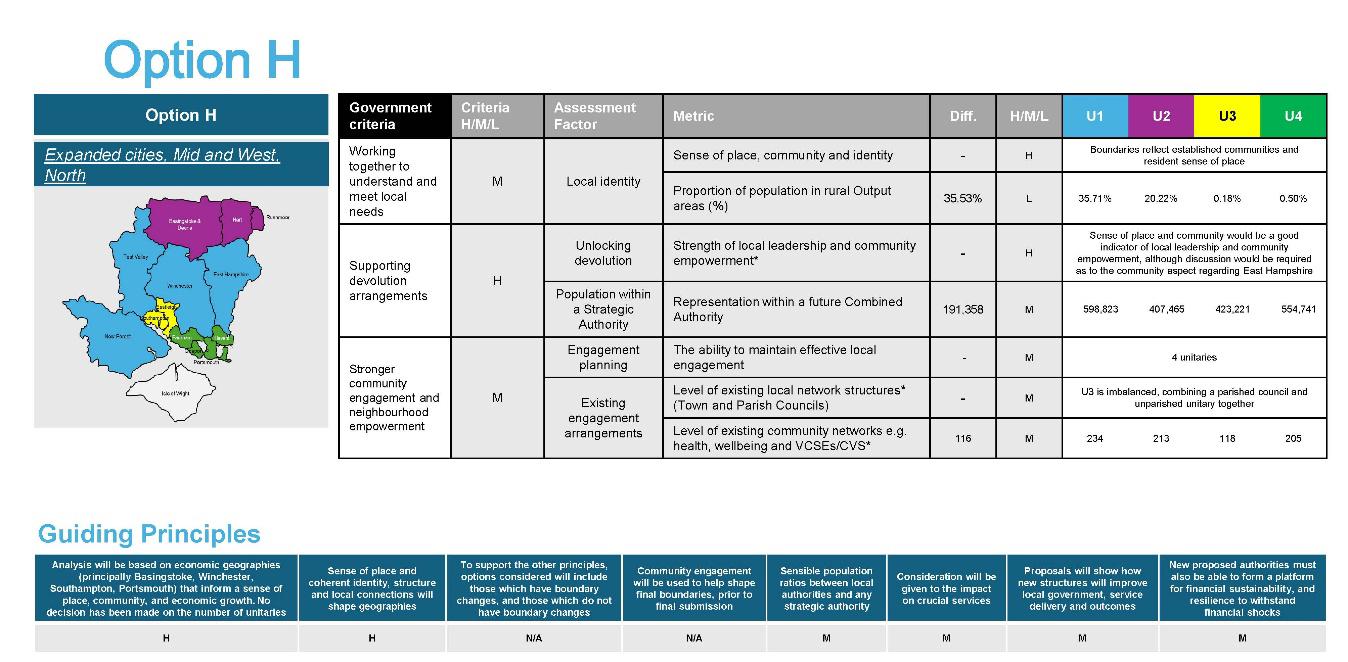
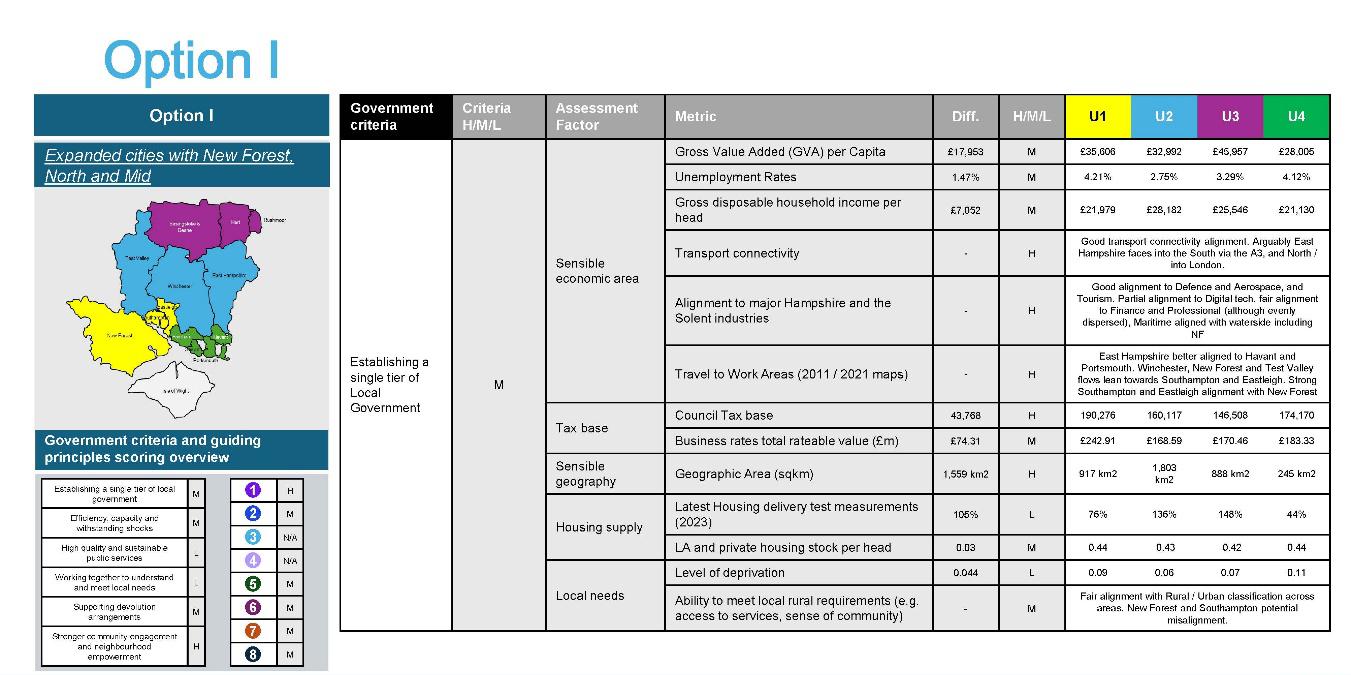
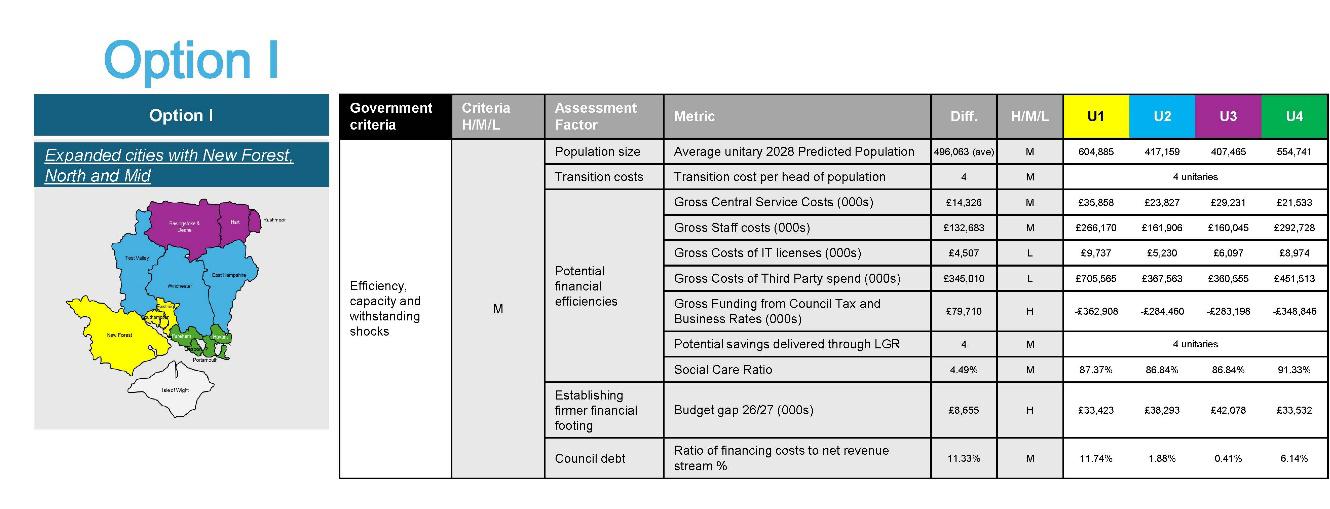
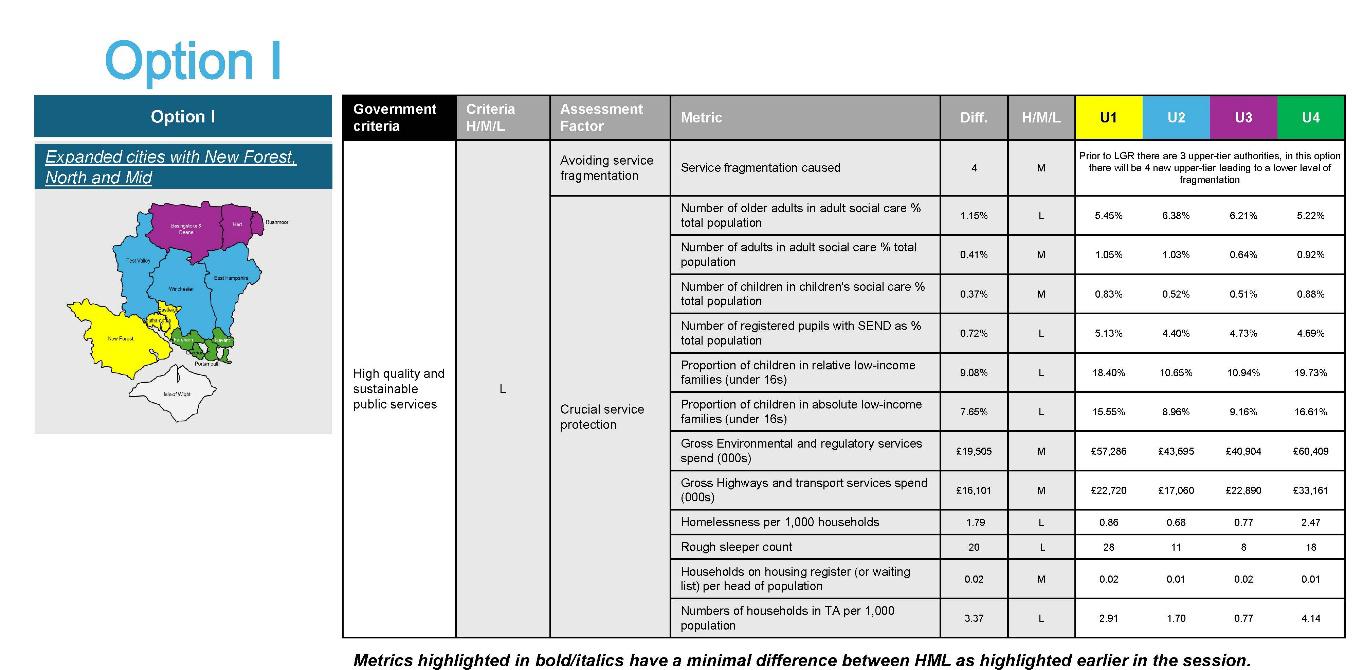
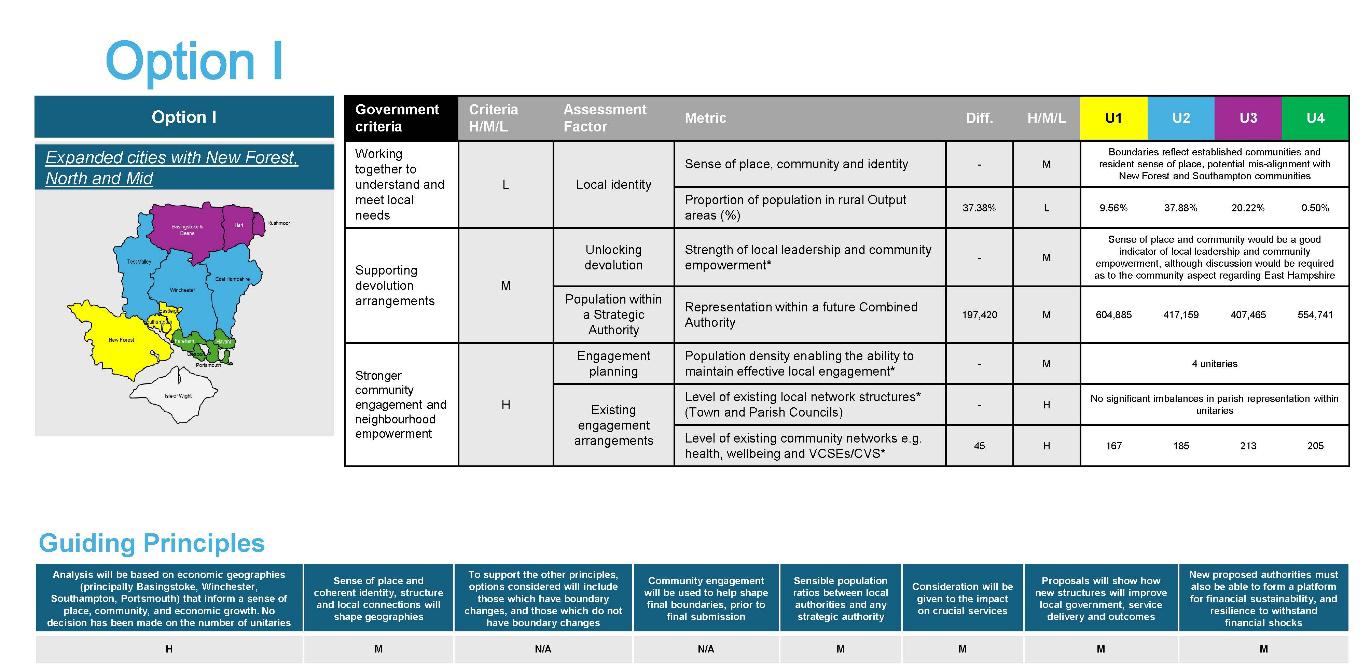
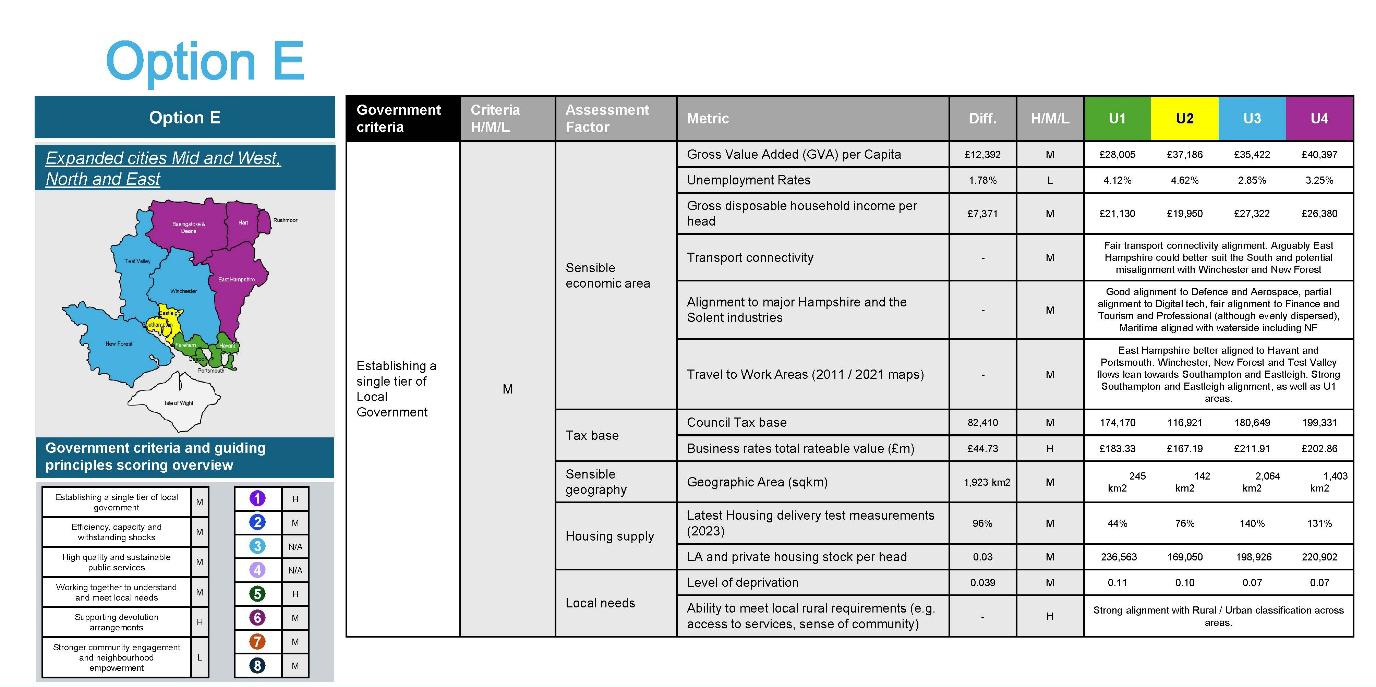
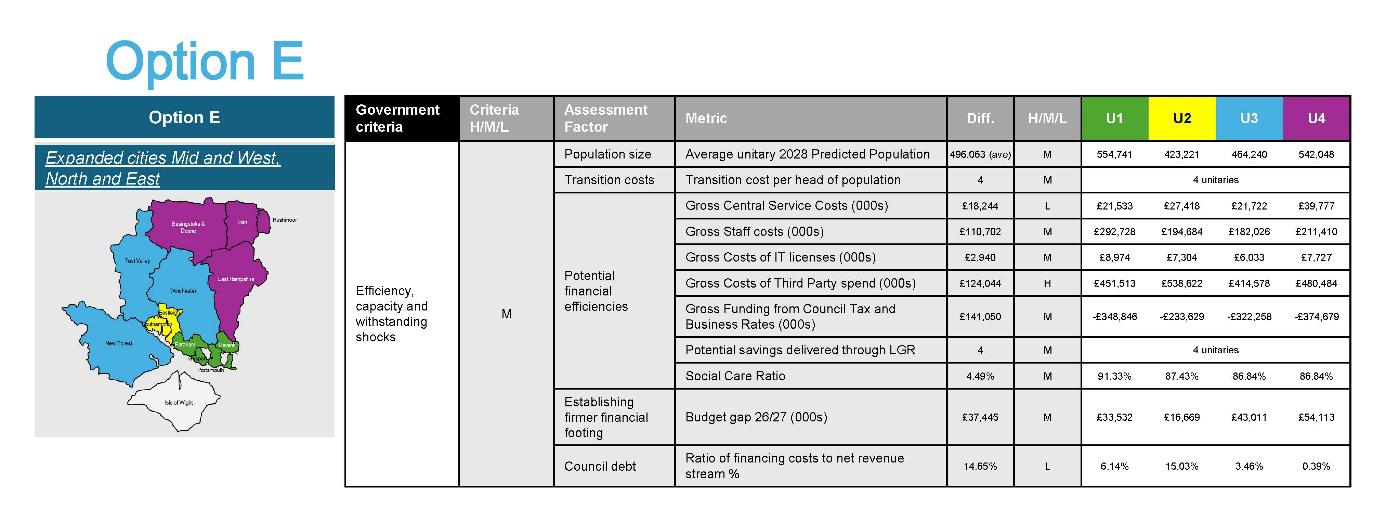
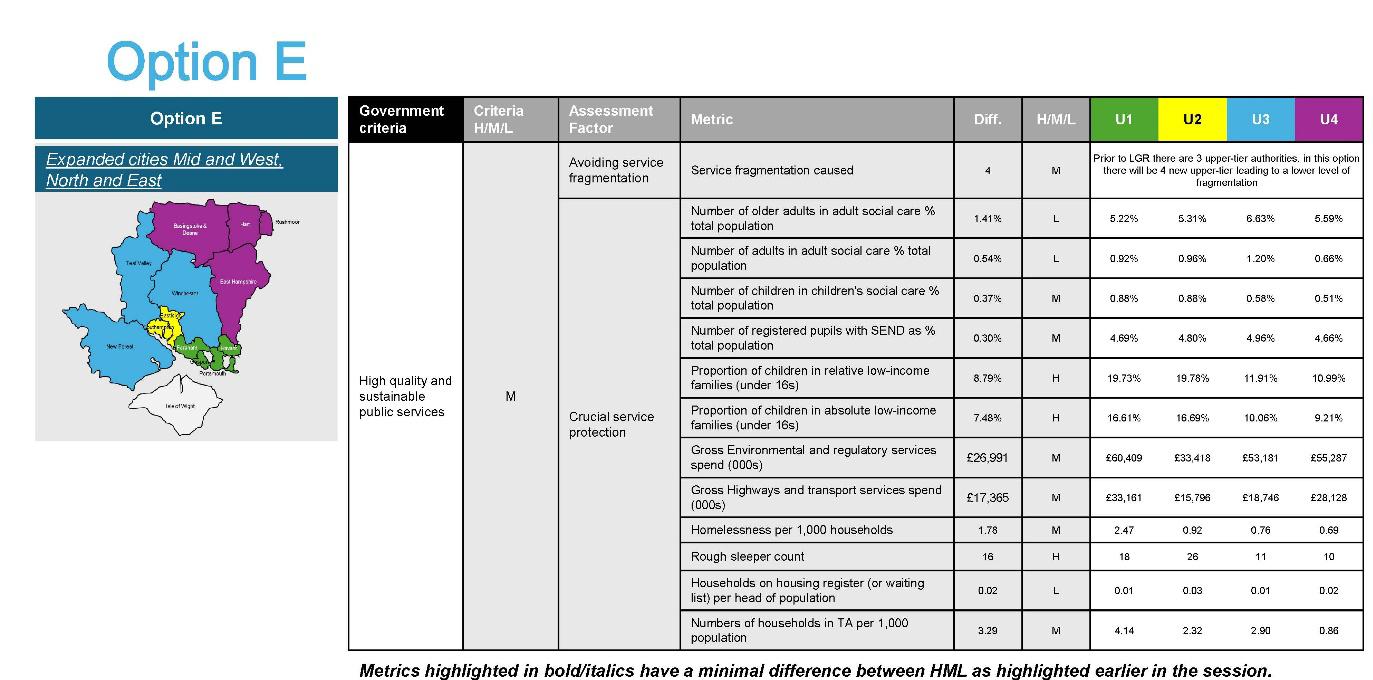
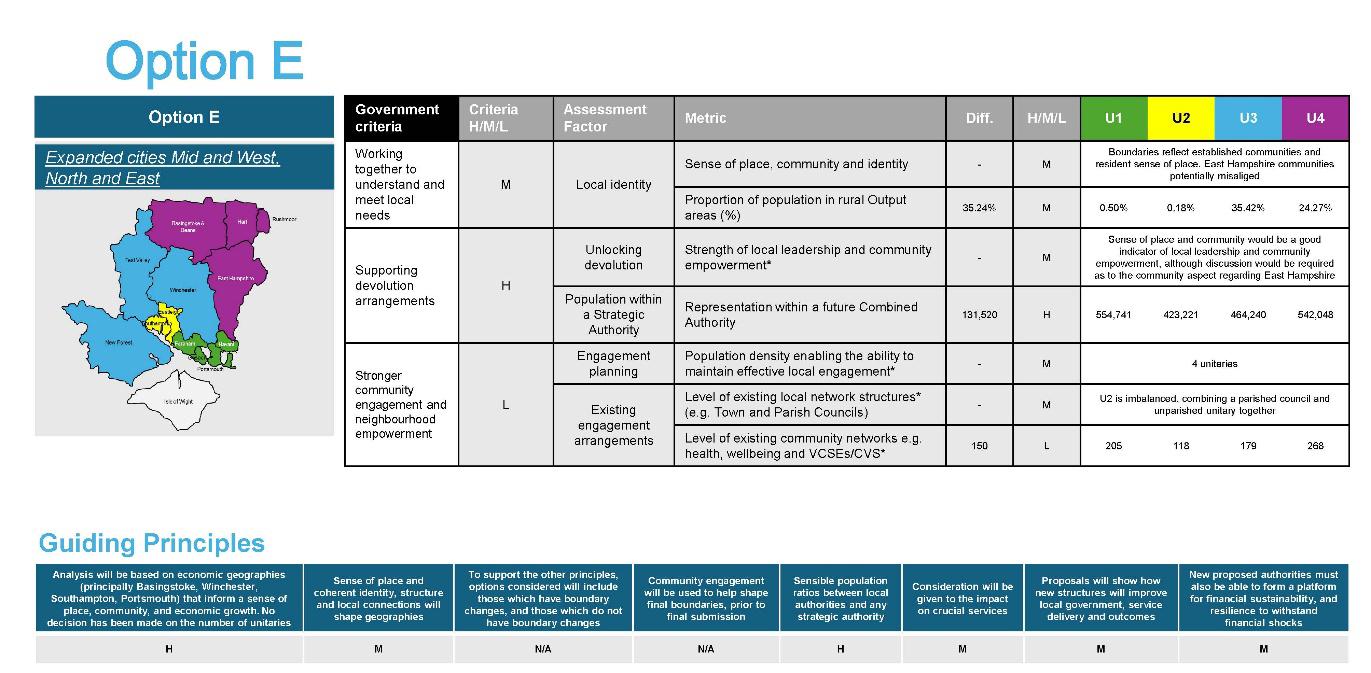
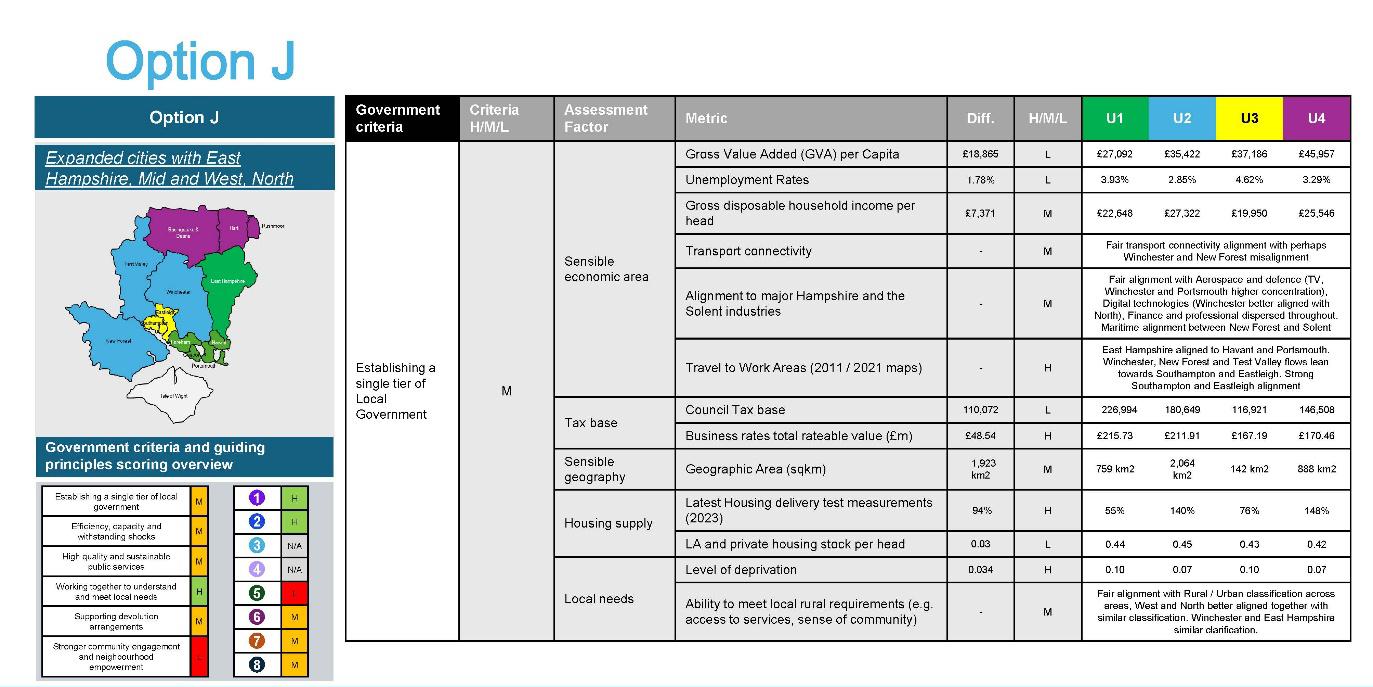
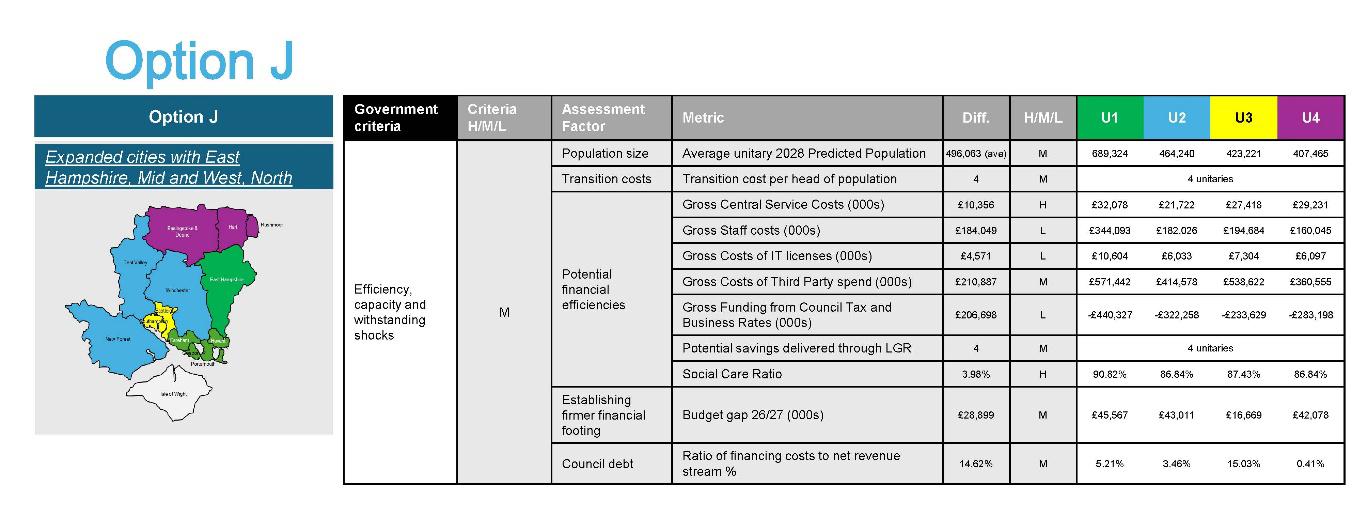
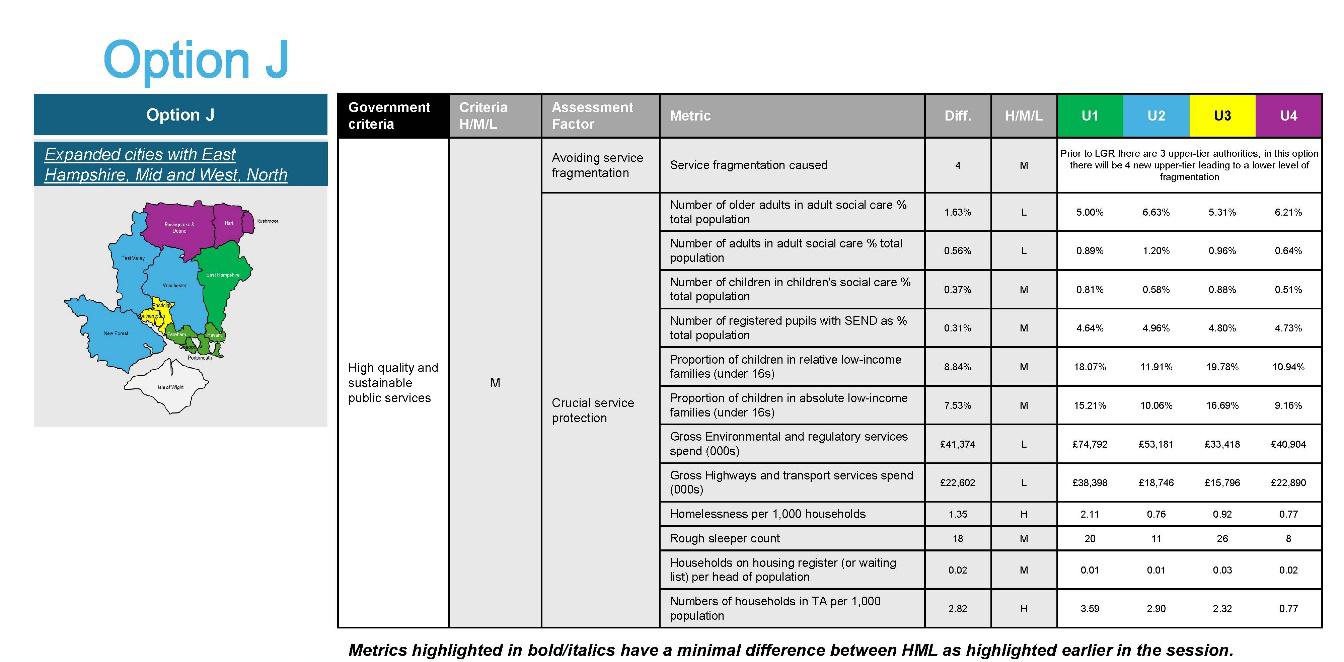
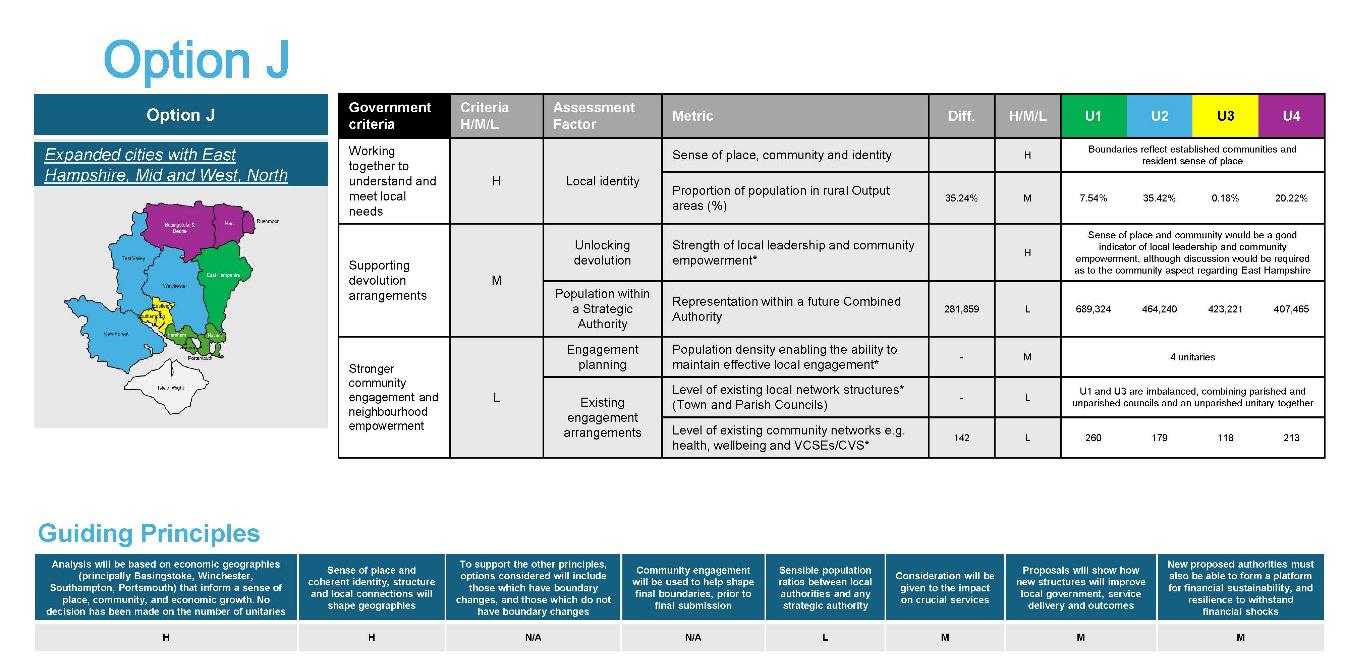
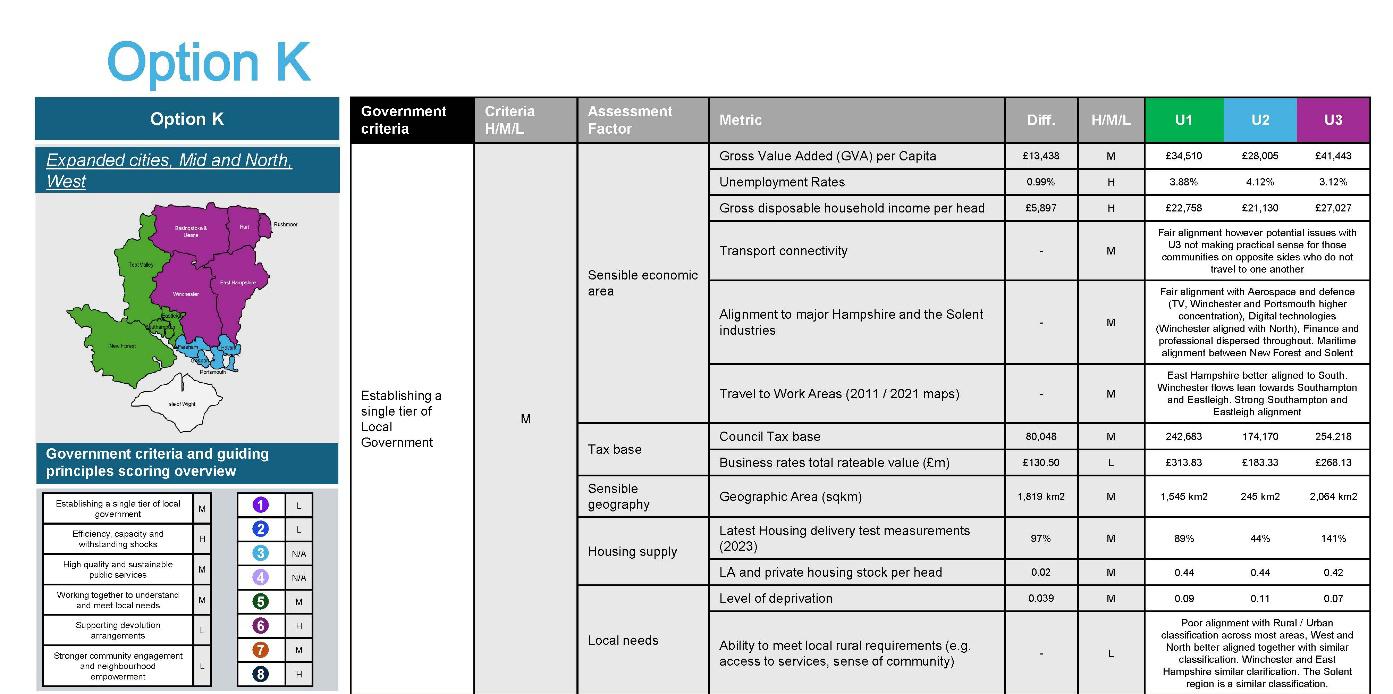
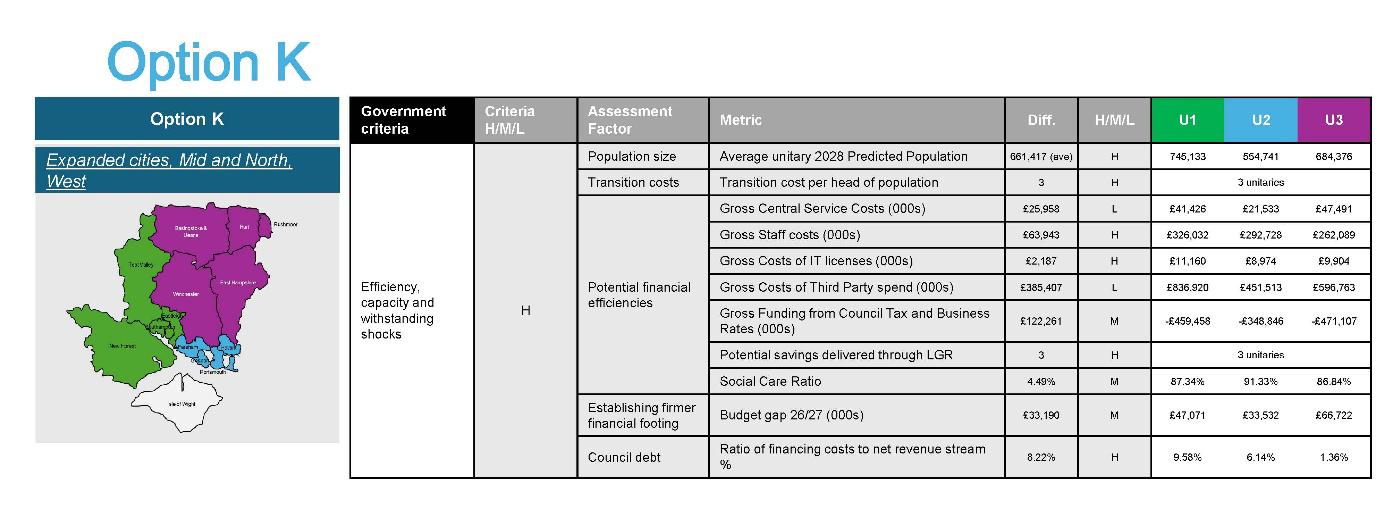
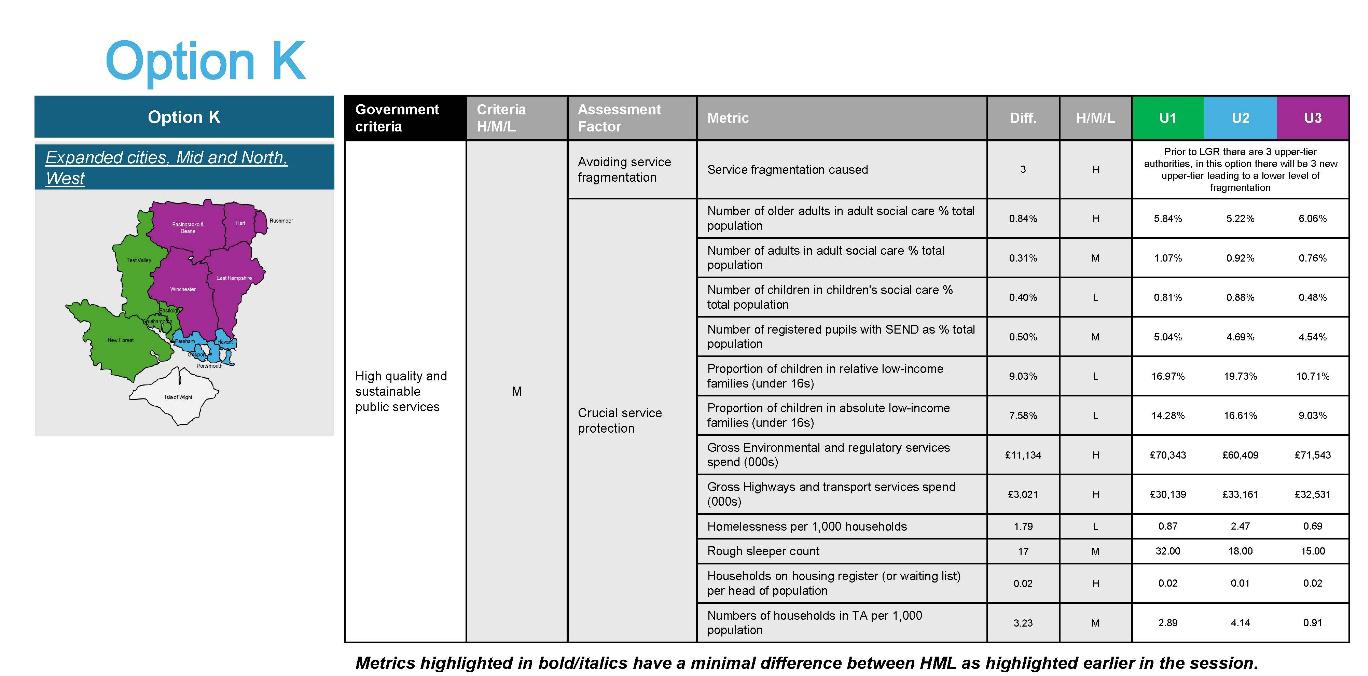
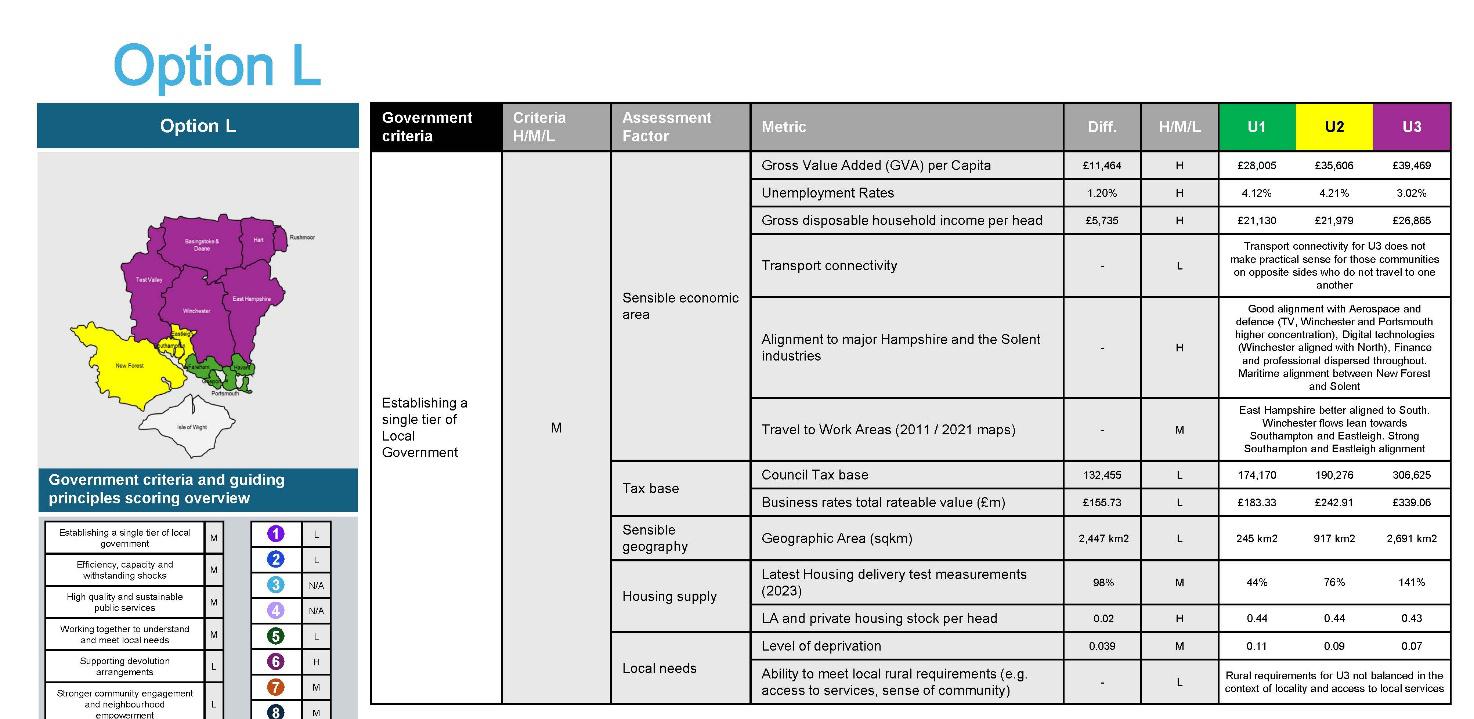
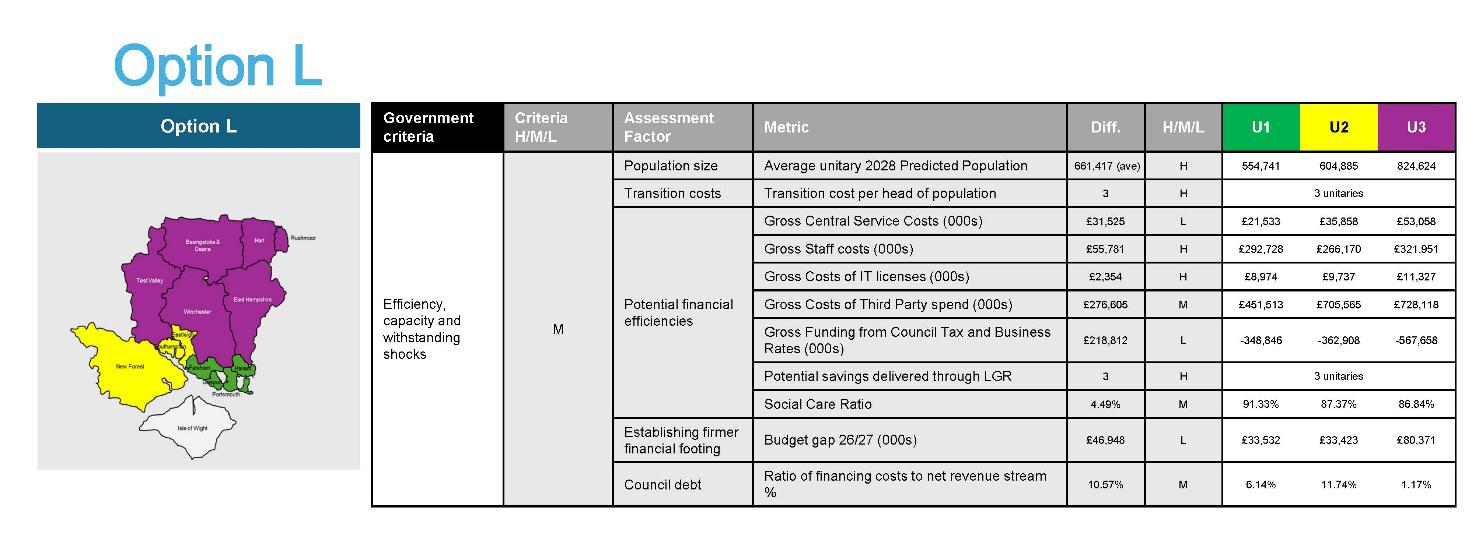
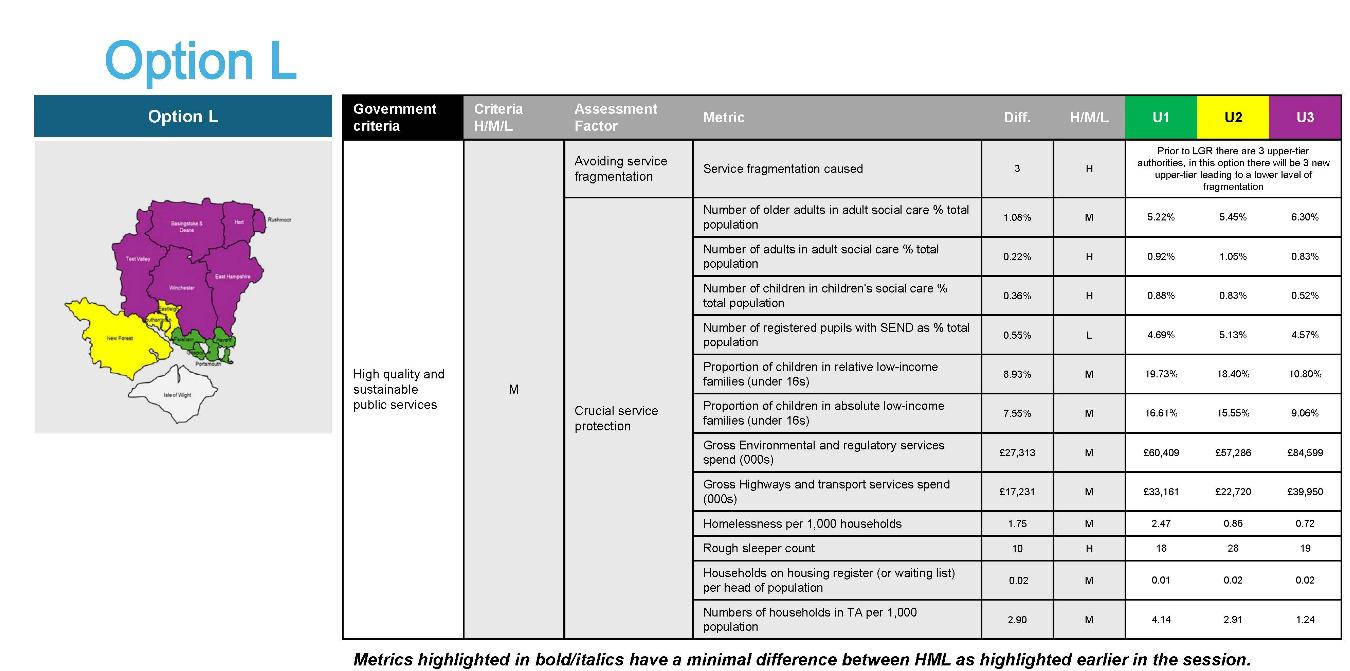
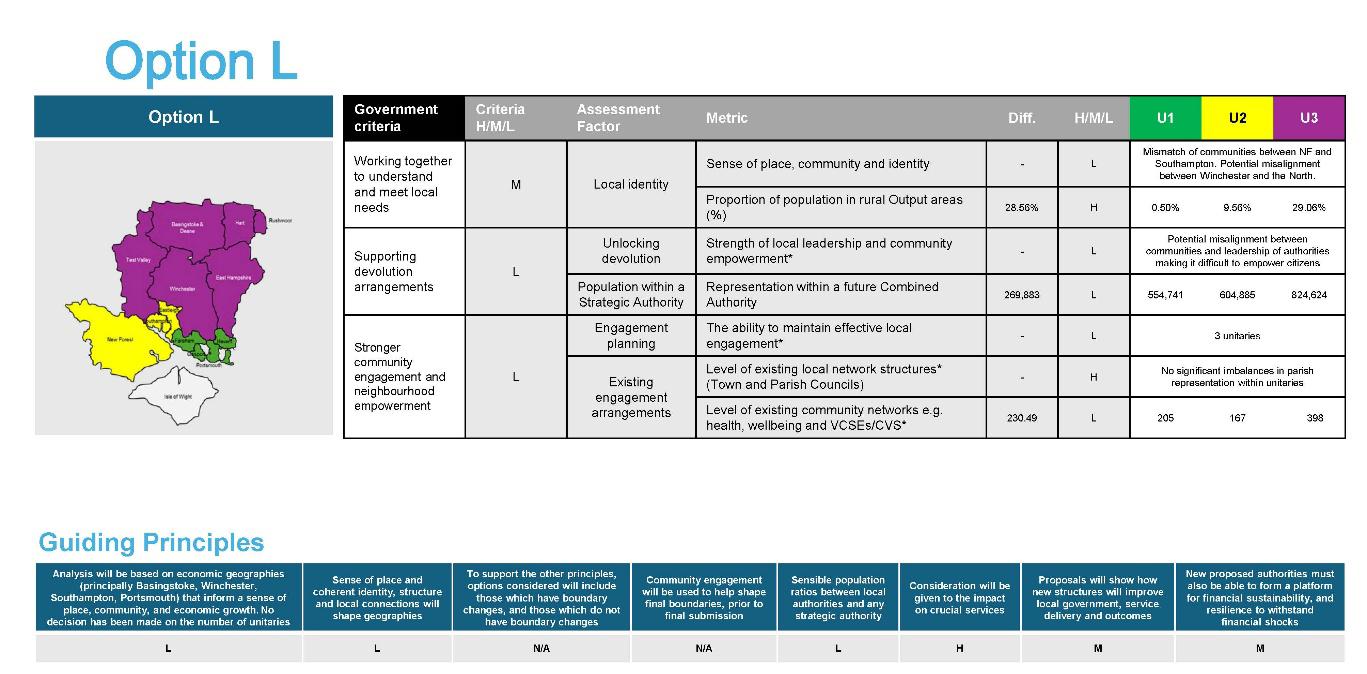
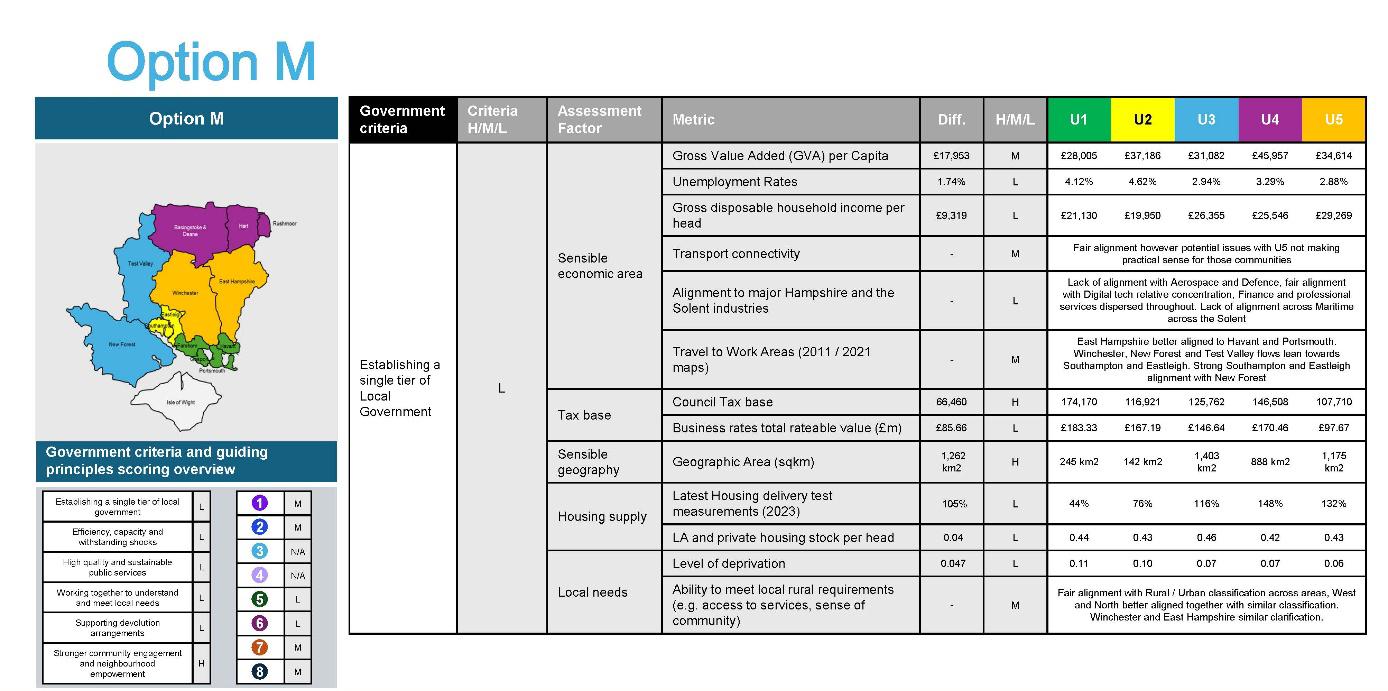
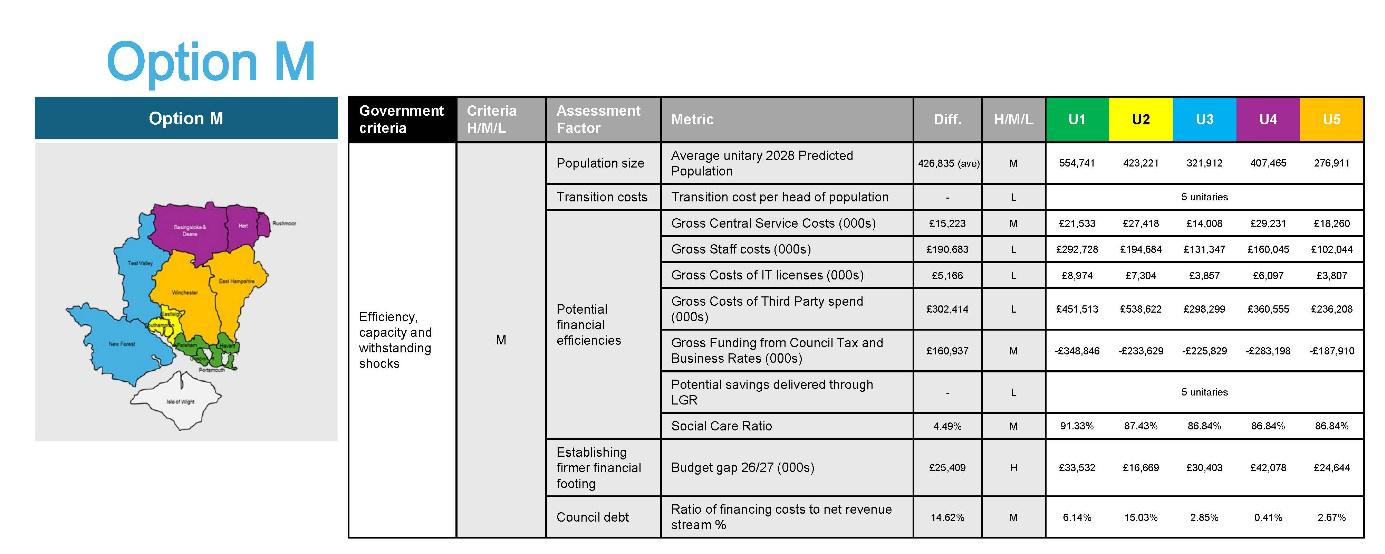
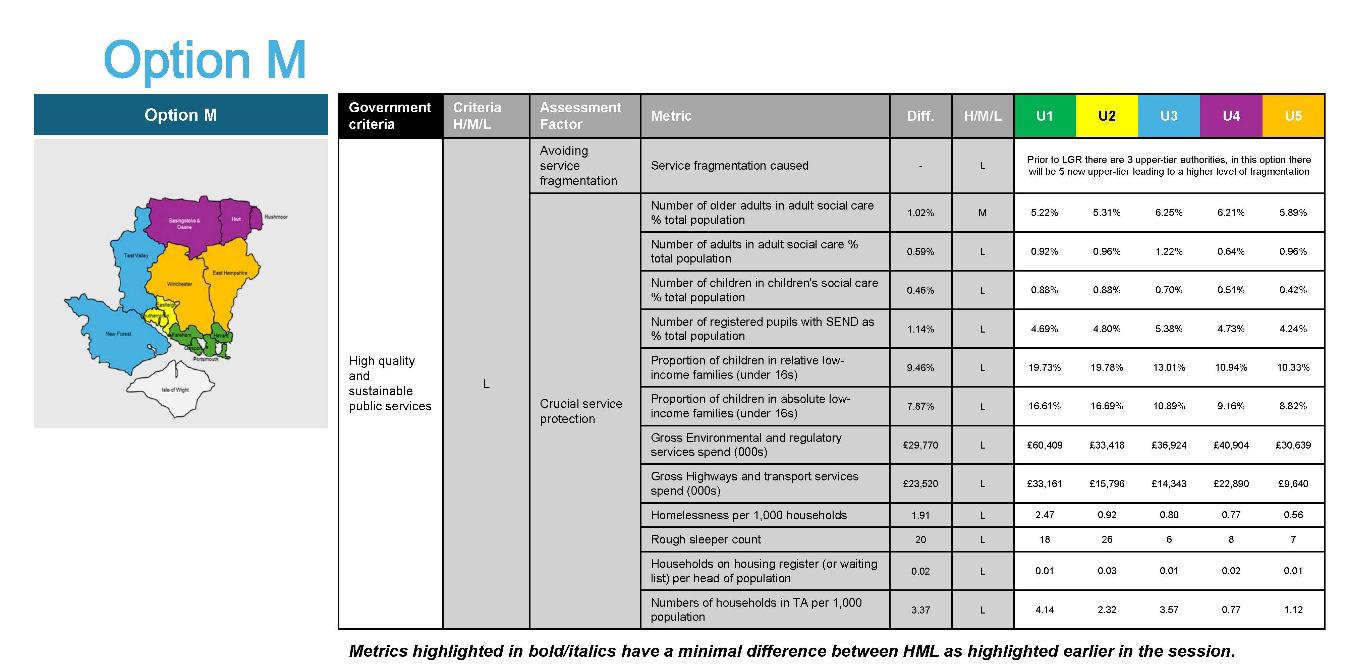
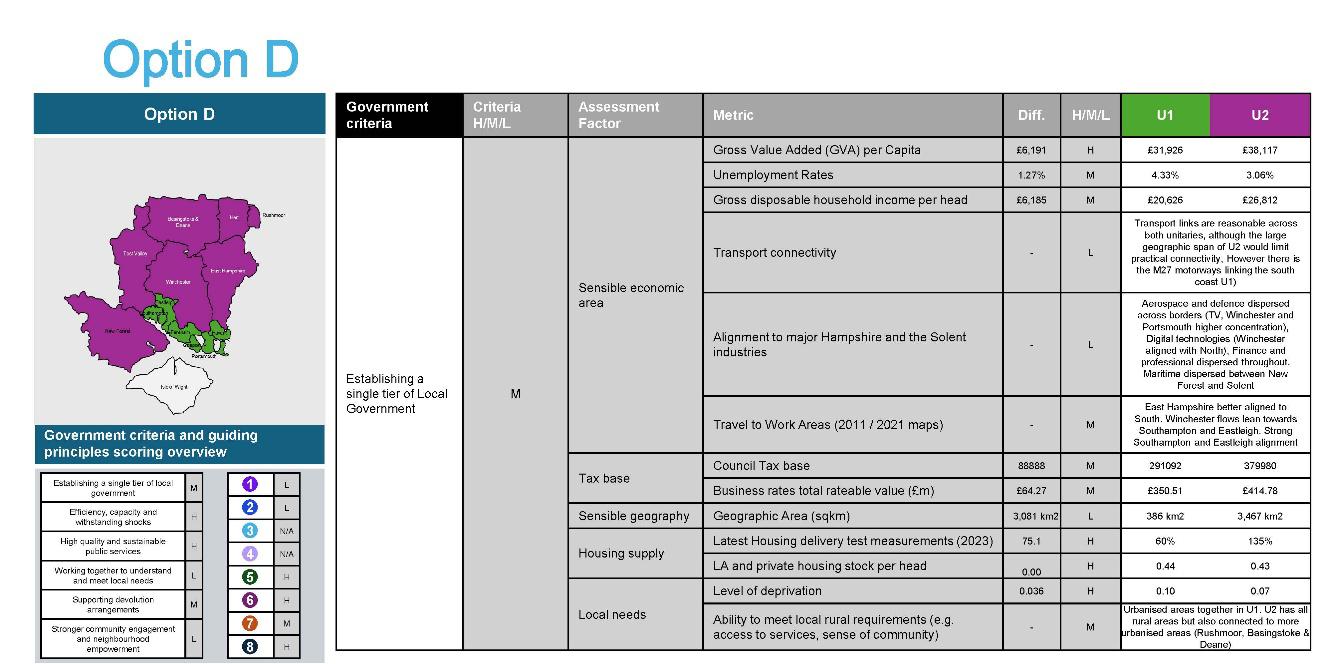
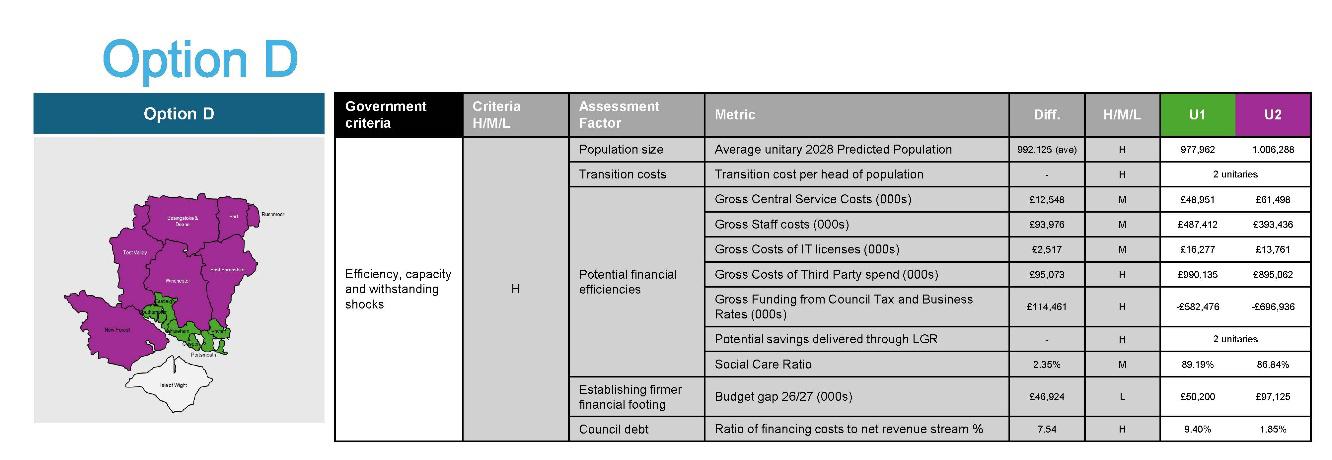
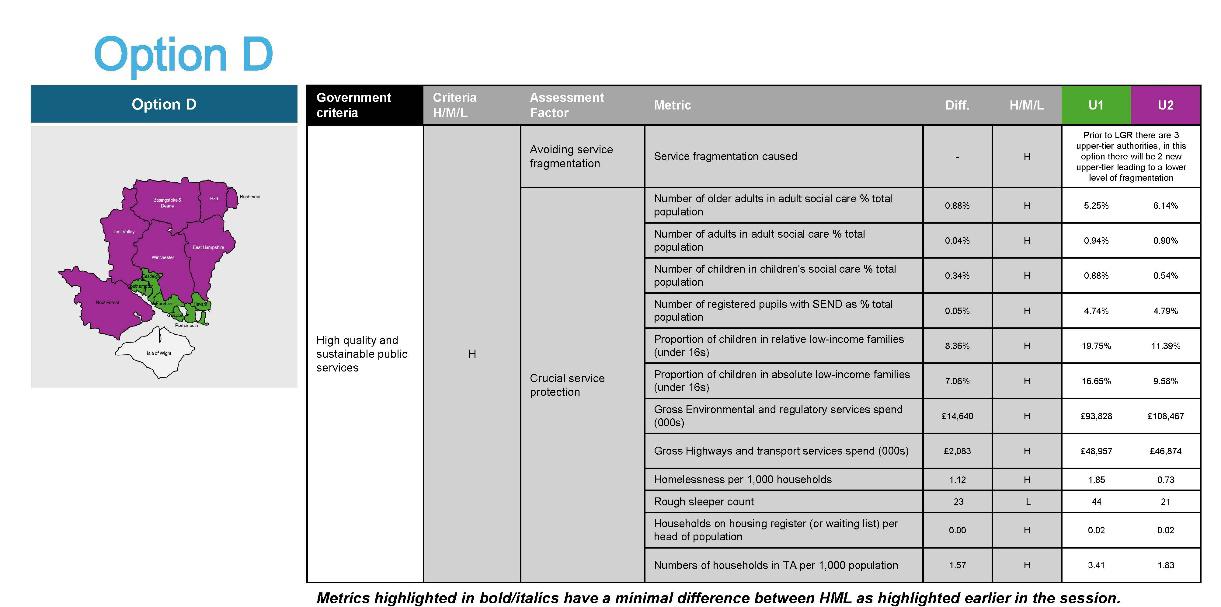
• Step 1 of the analysis process (shown in the tables below) was to define ‘High’, ‘Medium’ and ‘Low’ parameters, created by averages based on the data received, split into third percentiles. In some cases, the difference between ‘High’, ‘Medium’ and ‘Low’ parameters were miniscule due to small differences between unitary data.
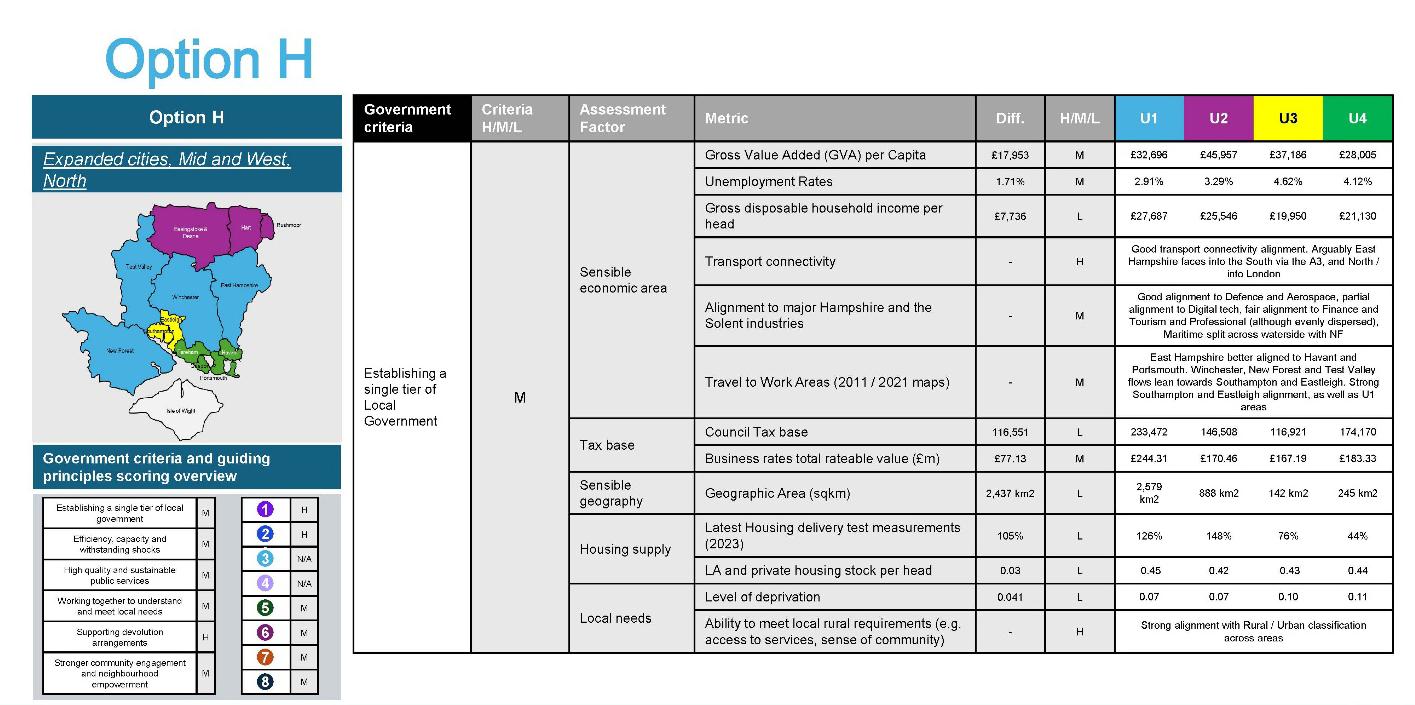
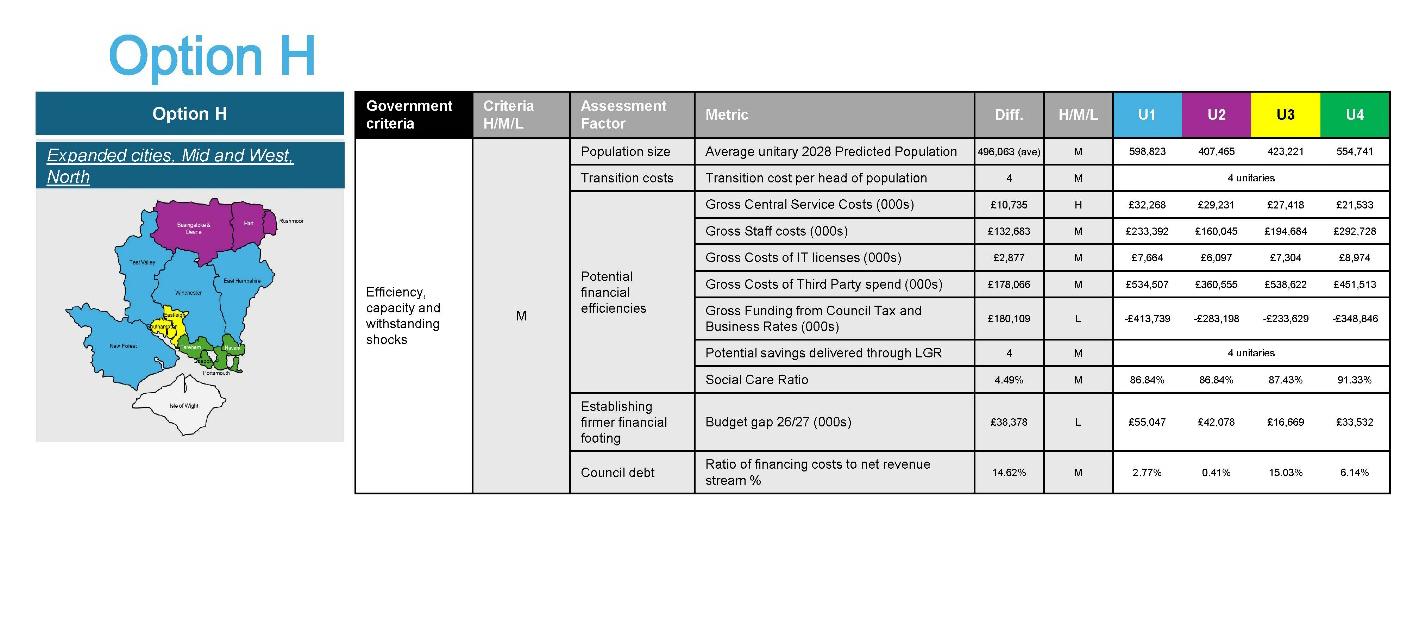
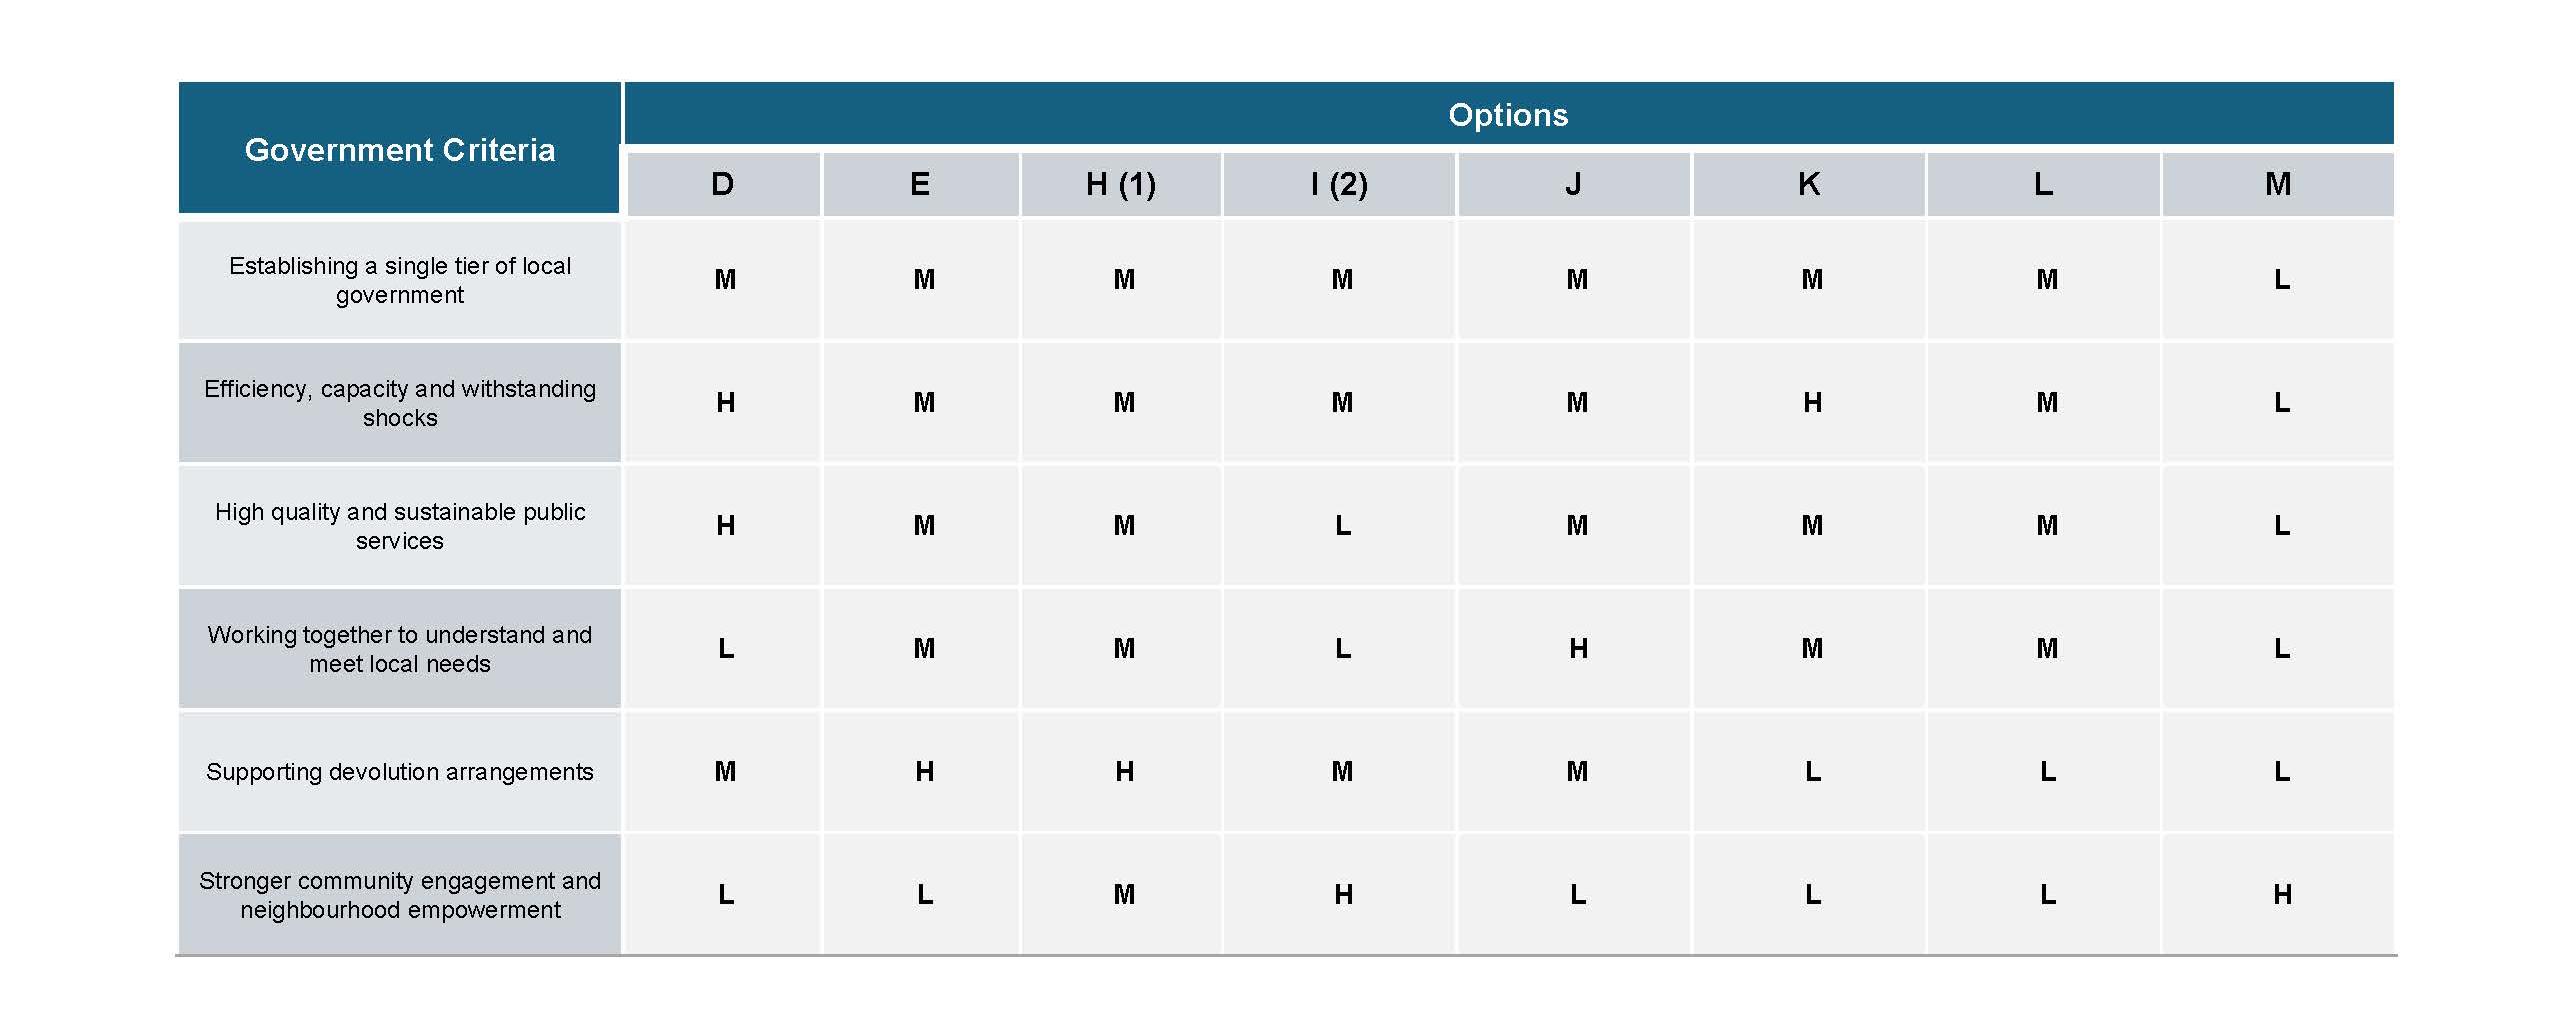
• Step 2 of the analysis was then to apply a ‘High’, ‘Medium’ or ‘Low’ to each of the options based on how many metrics were assessed as ‘High’, ‘Medium’ or ‘Low’. This meant that options could be assessed easily on a macro -level but also at a detailed metric-bymetric level. The result of this exercise can be seen on the series of images below.
• Step 3 and 4 consolidated the information from Step 2 into a dashboard as seen below. The dashboards were produced to show how they assessed alongside both the government criteria, and the guiding principles agreed as part of the Interim proposal.
• The above material was presented in a workshop to Leaders and Chief Executives to agree on the options to proceed with. Several key arguments were highlighted in favour of progressing with a four new mainland and Isle of Wight unitary model:
• Larger unitary authorities may struggle to meet local needs, as the nuances of local areas could be lost.
• A four new mainland unitary model creates a more balanced tax base (comprising council tax base and business rates total rateable value).
• A four new mainland unitary model ensures relative balance in the future combined authority, allowing each representative council to have equal representation. All unitaries in this model would have a population between 400,000 and 600,000 (excluding the Isle of Wight), whereas a three new mainland unitary model would include unitaries with populations potentially exceeding 800,000.
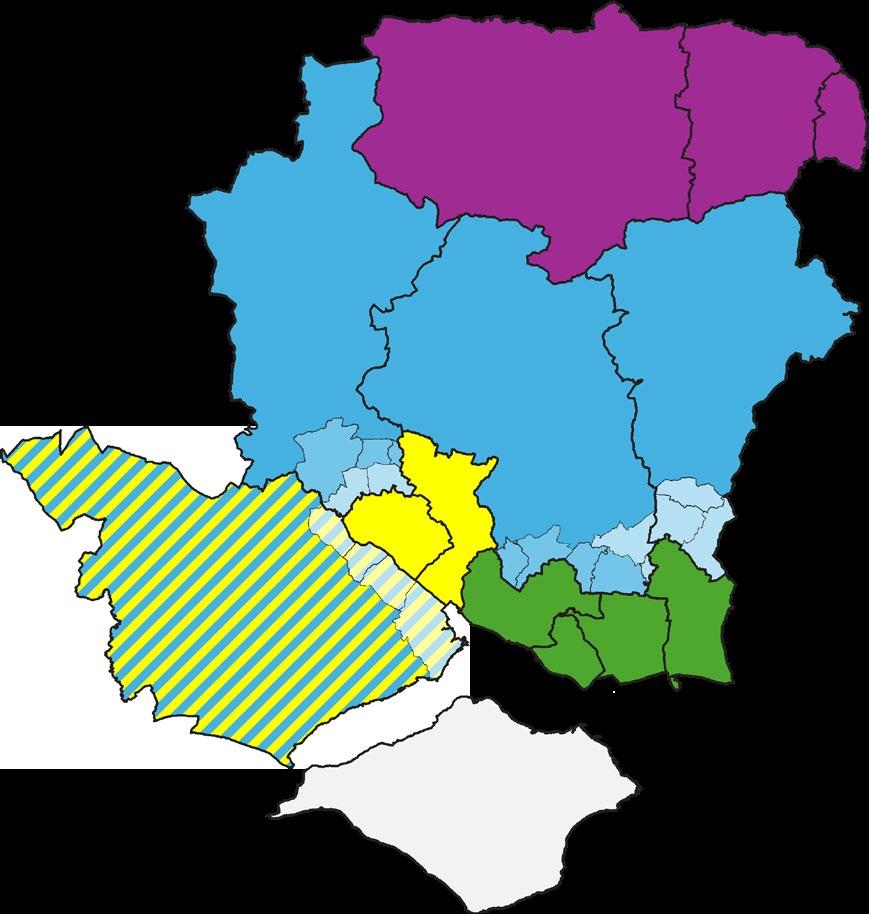
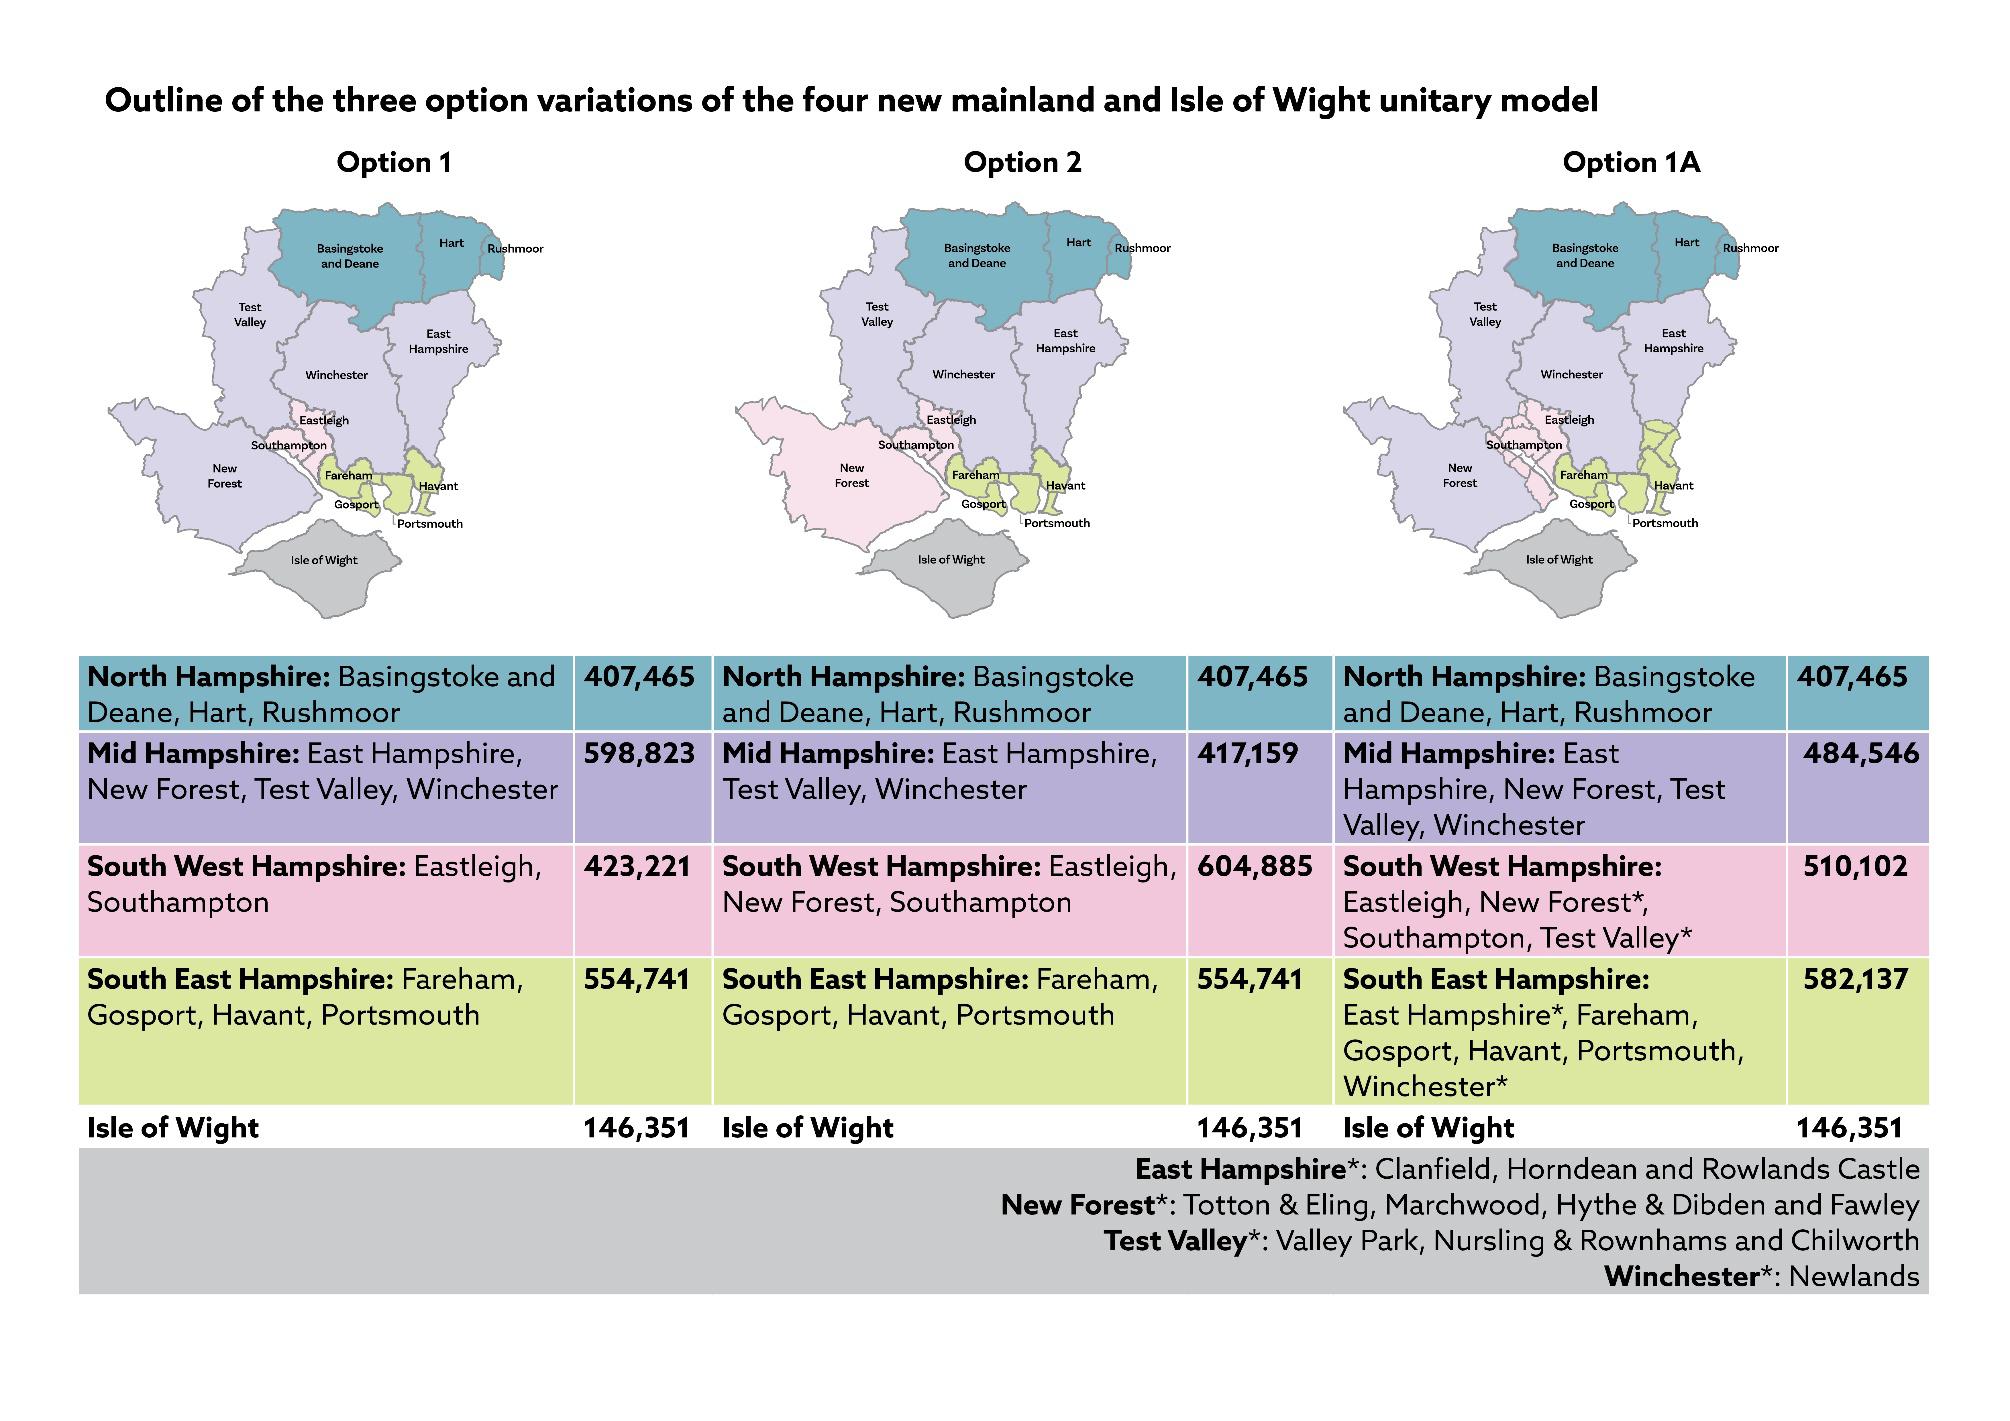
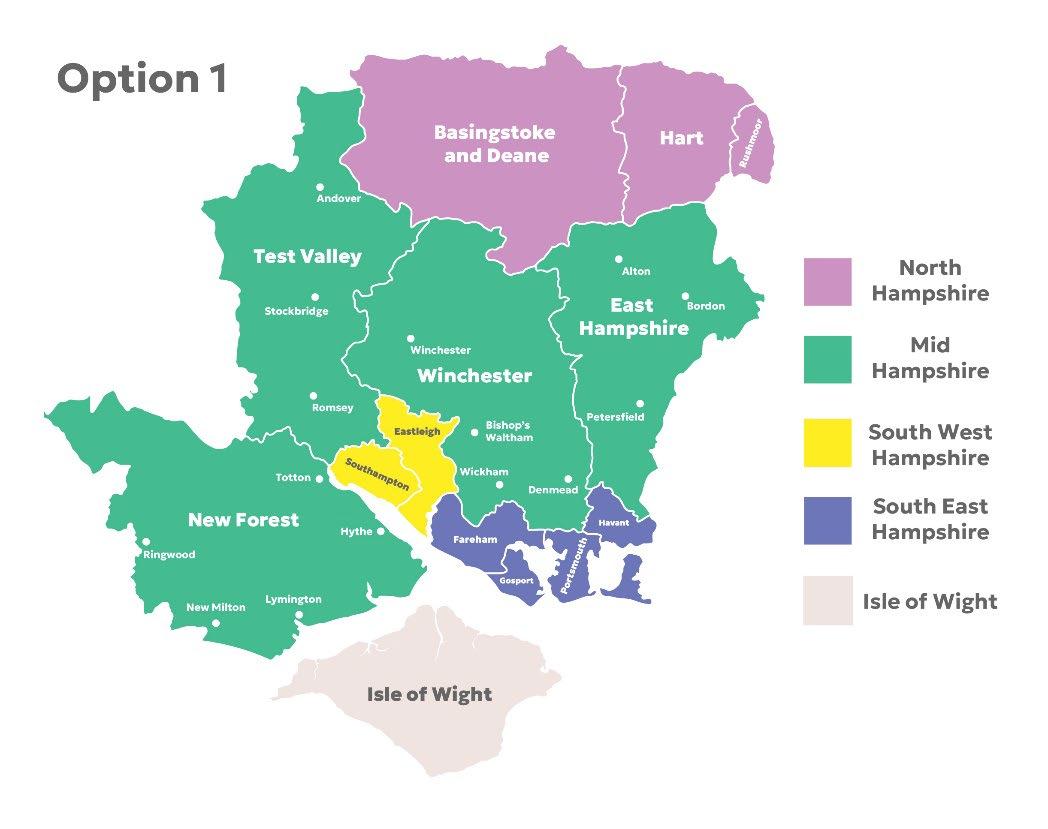
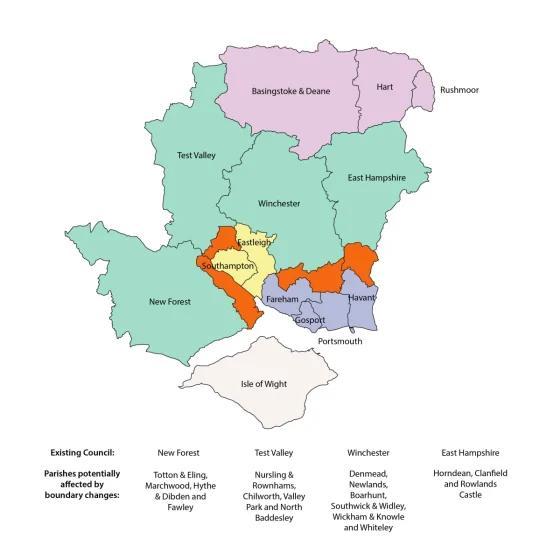
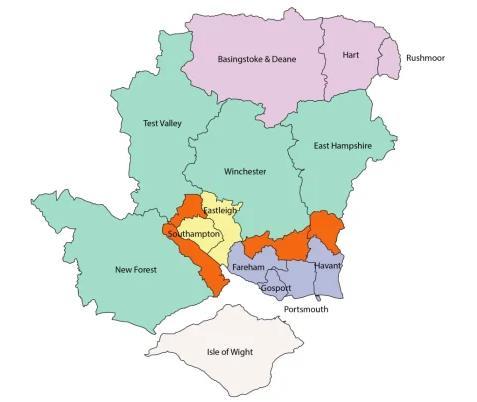
• There was majority agreement to progress options 1 and 2 after being viewed favourably in the appraisal by Leaders and Chief Executives. The two options were agreed to be progressed, as well as a third option that includes boundary changes, particularly focusing on the New Forest and other city hinterlands around Portsmouth and Southampton that are currently within a district building block. The image and table below details the potential boundary changes across Hampshire and the Isle of Wight.
Boundary change modelling (June 2025)
• A session was held with council Chief Executives at the end of June to agree the boundary change option to be progressed as part of the final proposal. The three boundary change options can be found in the section above.
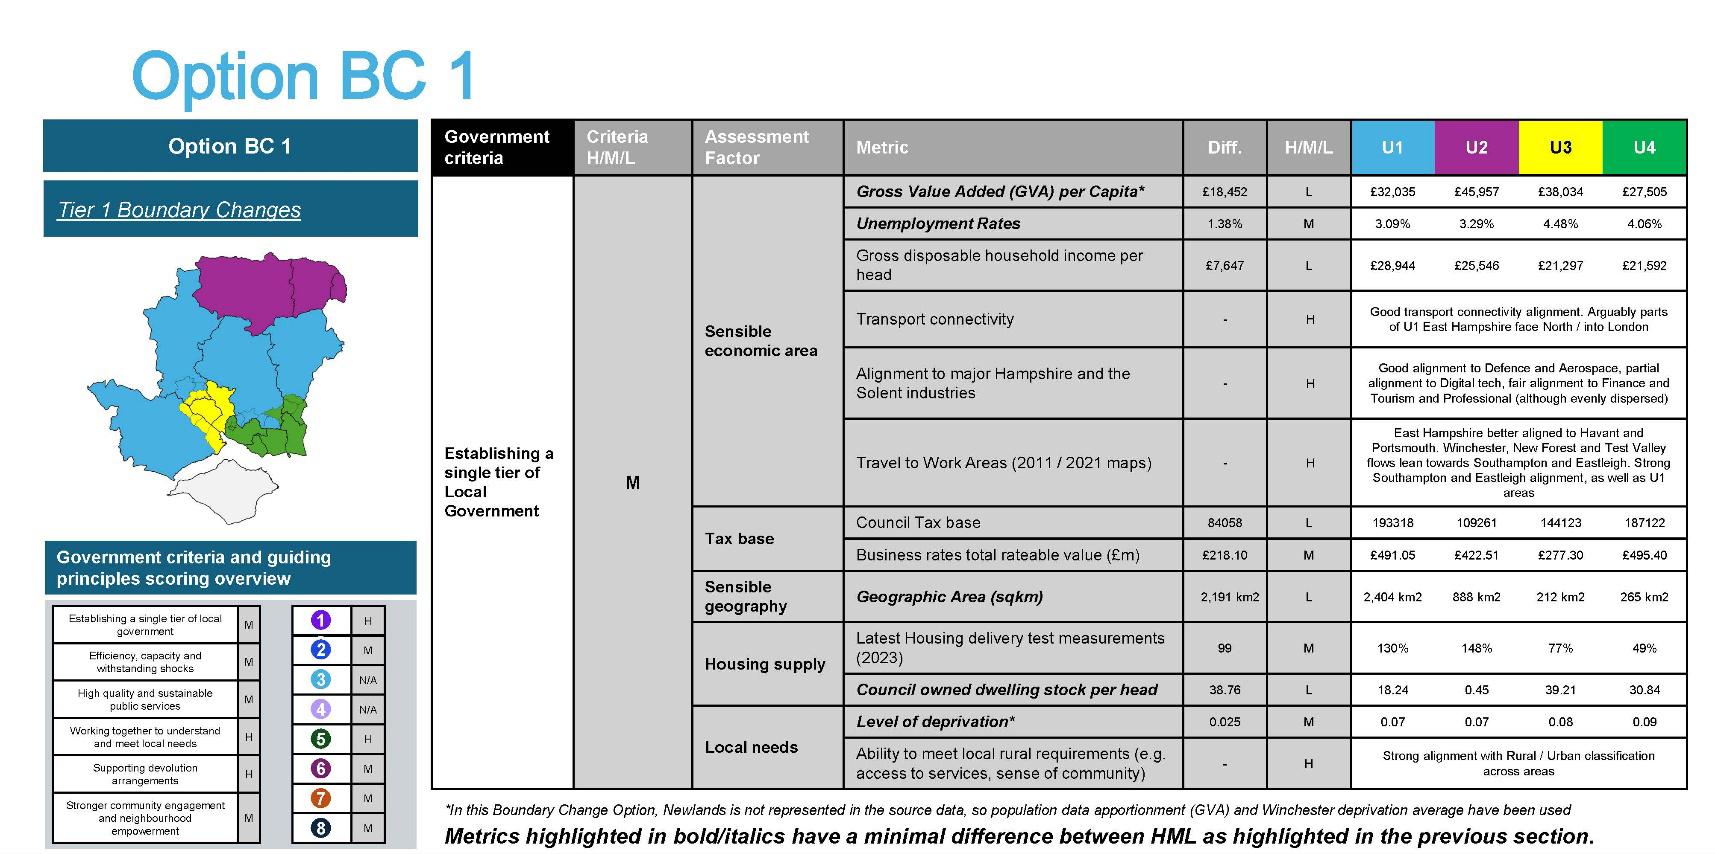
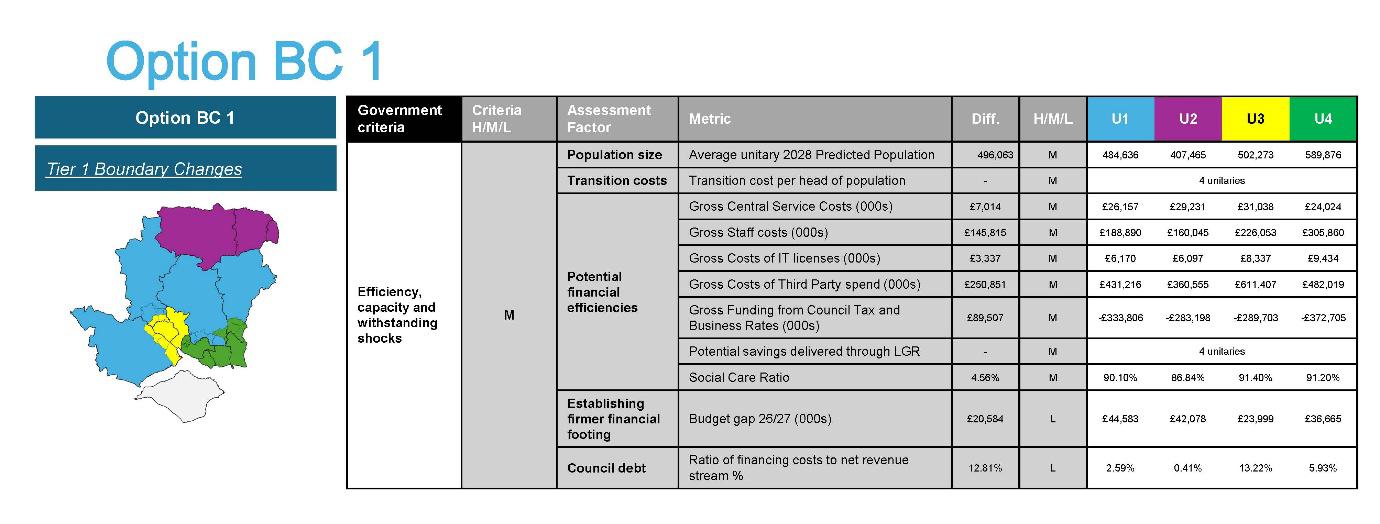
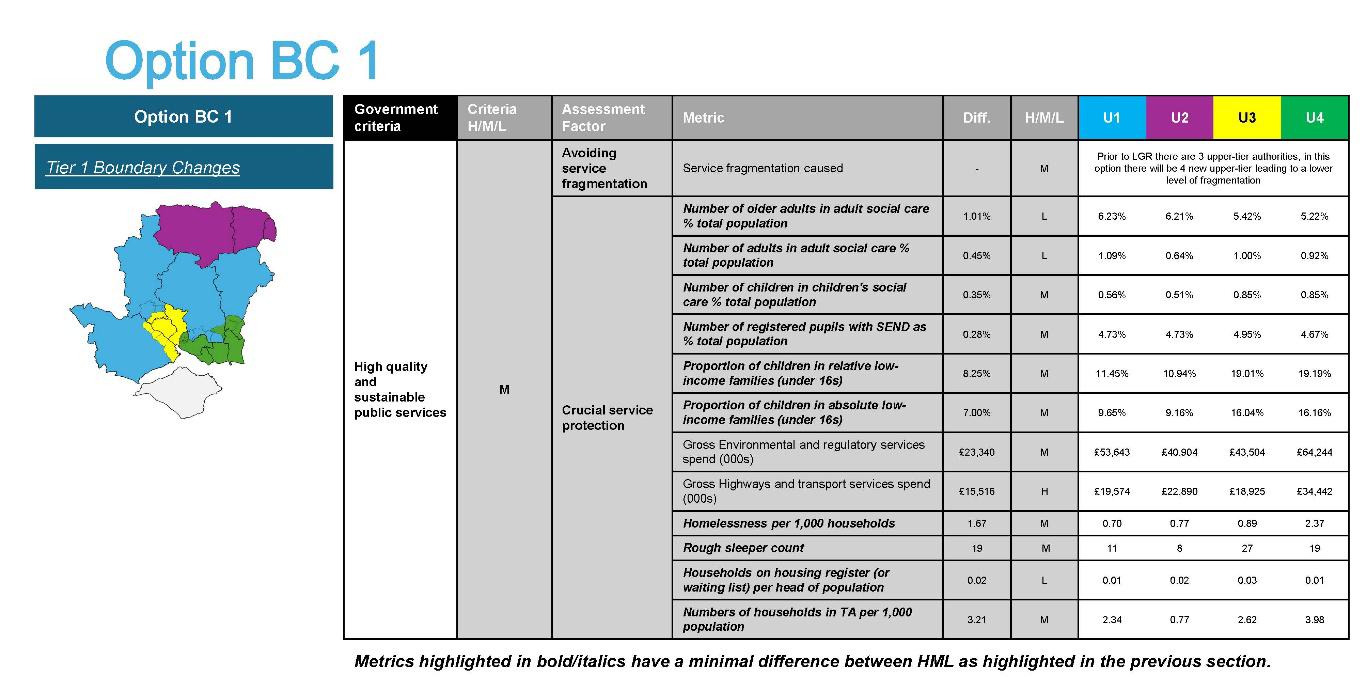
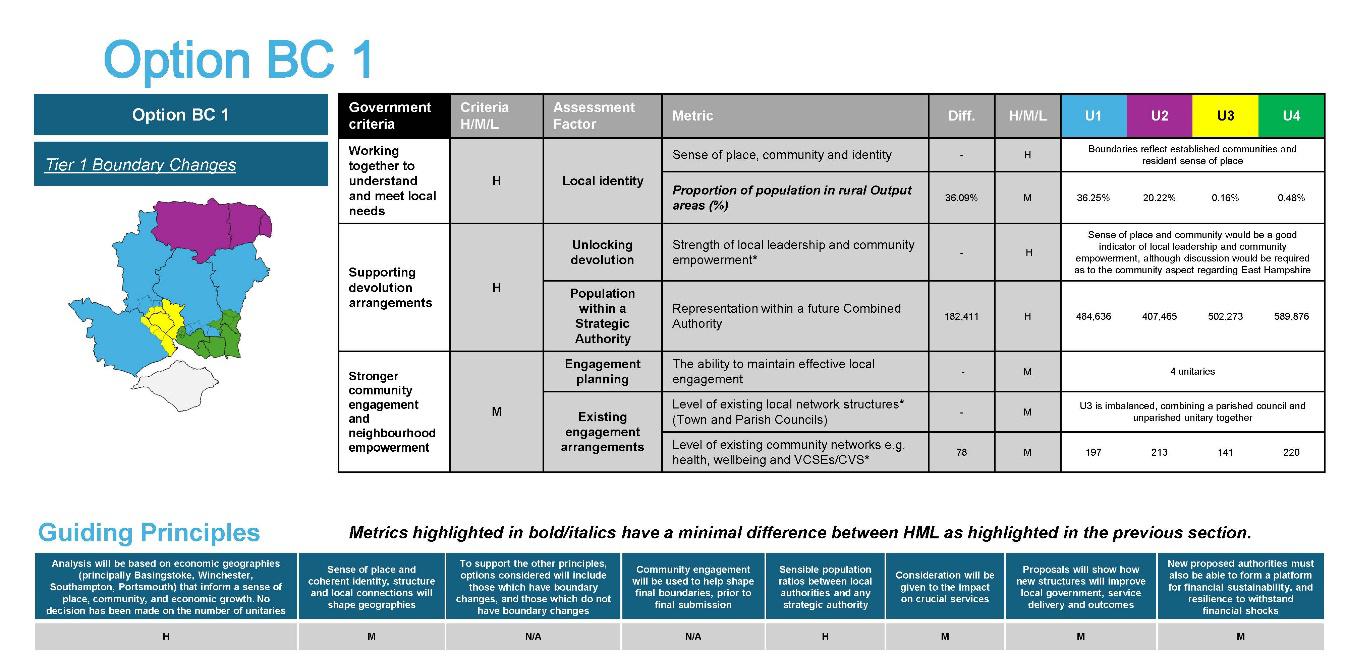
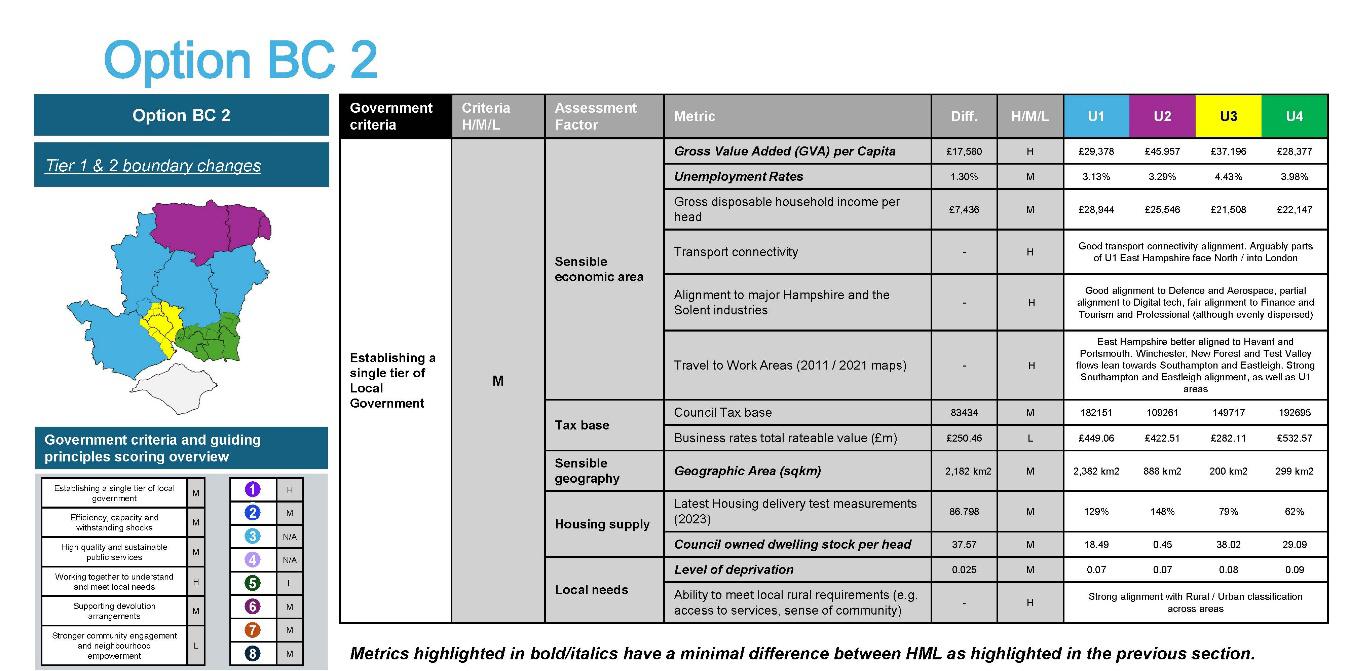
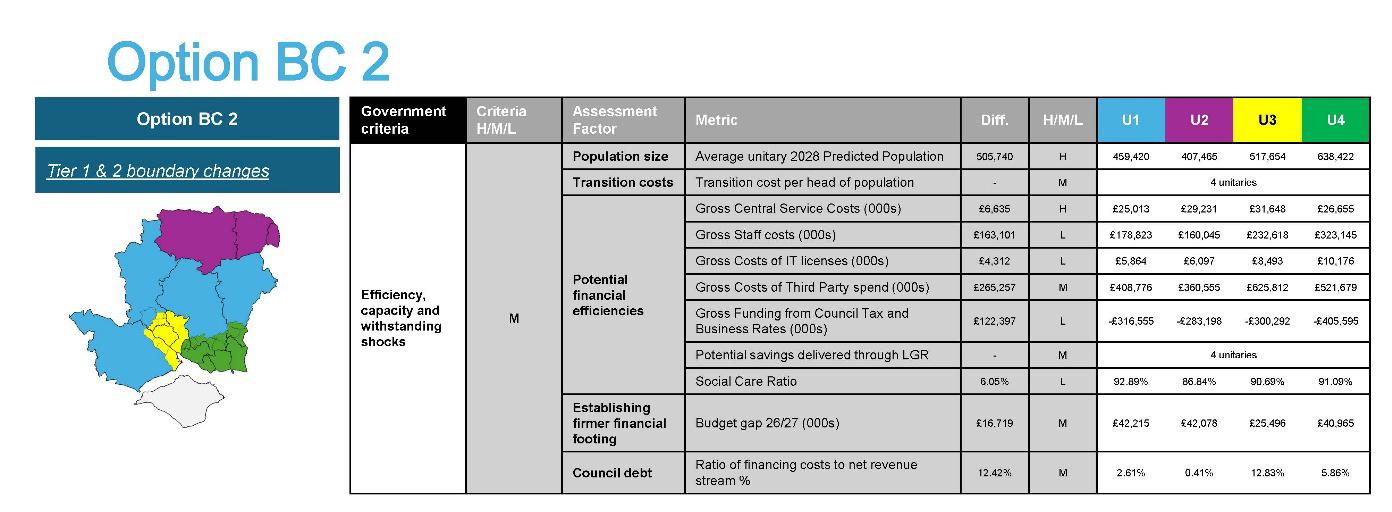
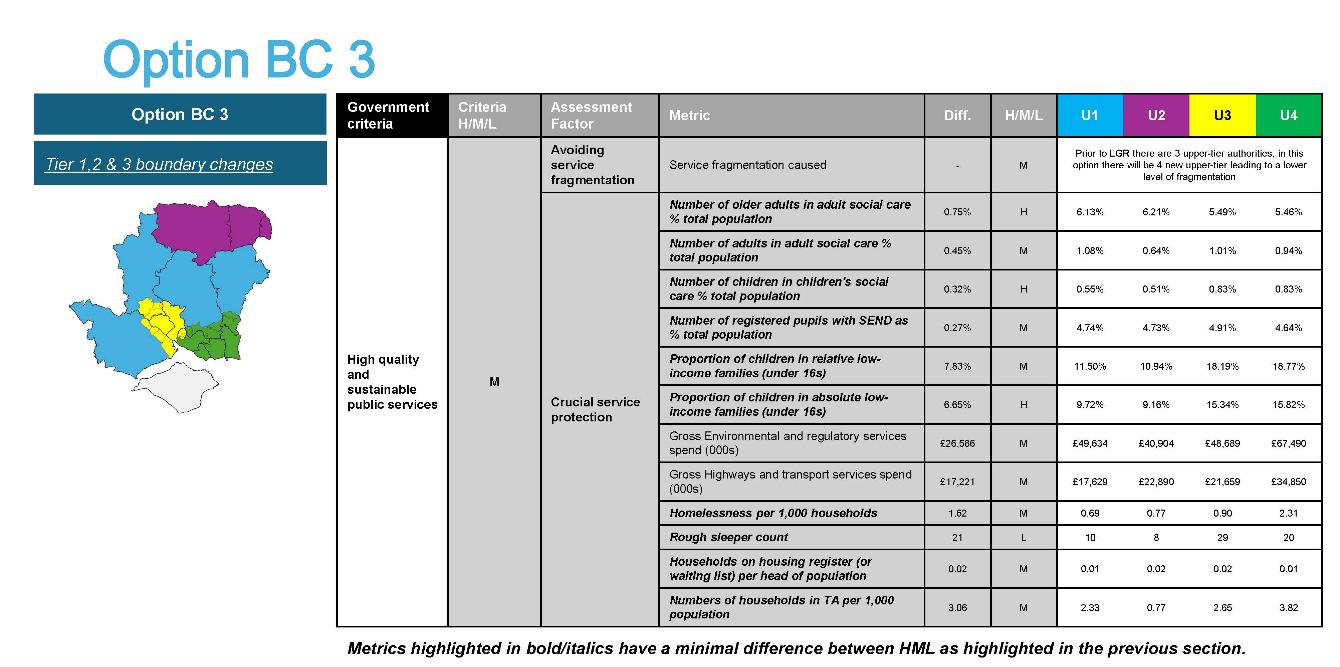
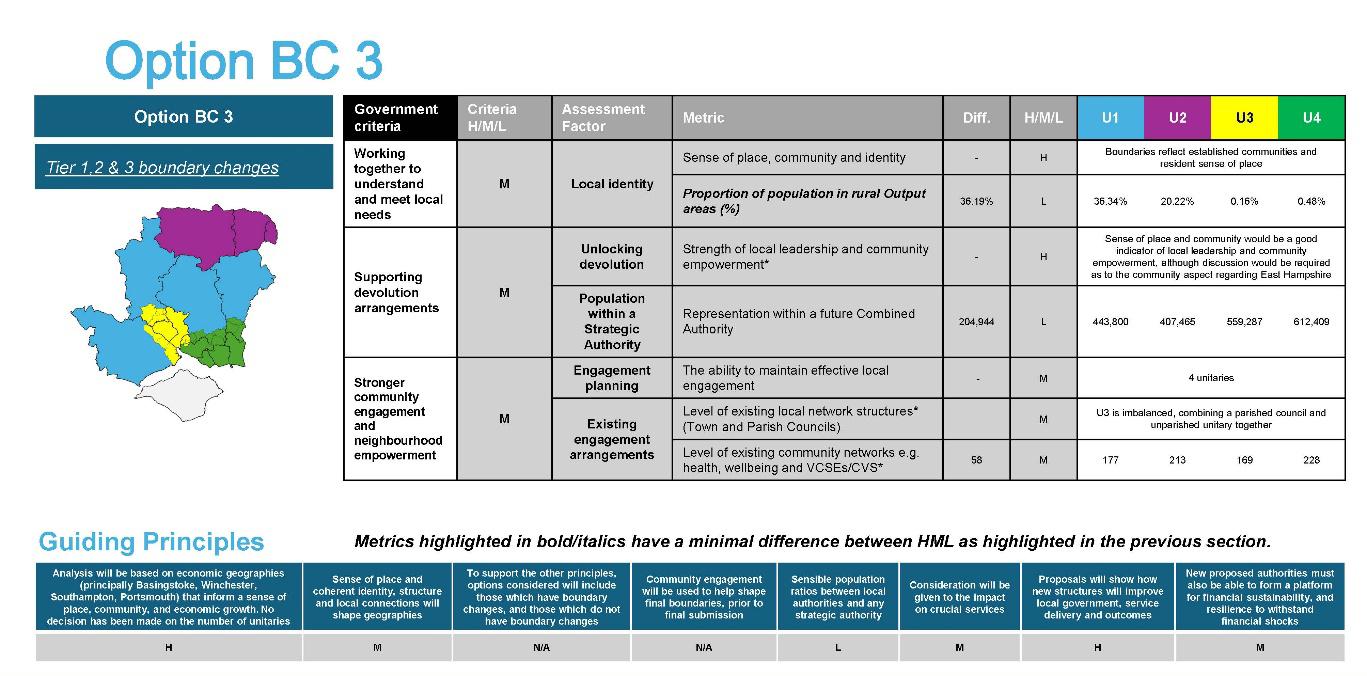
• The same process was applied, in terms of applying ‘High’, ‘Medium’ and ‘Low’ parameters at an option, metric and guiding principles level. The outputs from this exercise can be seen below. For the purposes of this proposal, BC1 is now referred to as Option 3.
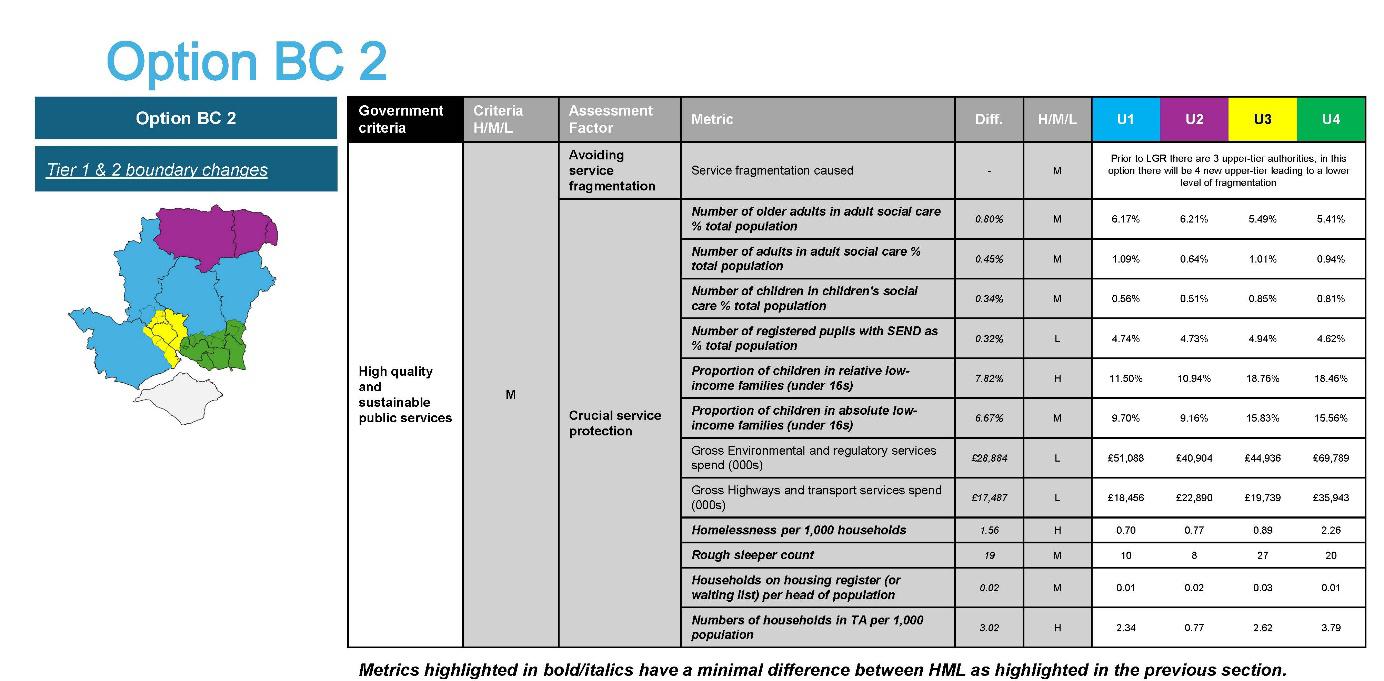
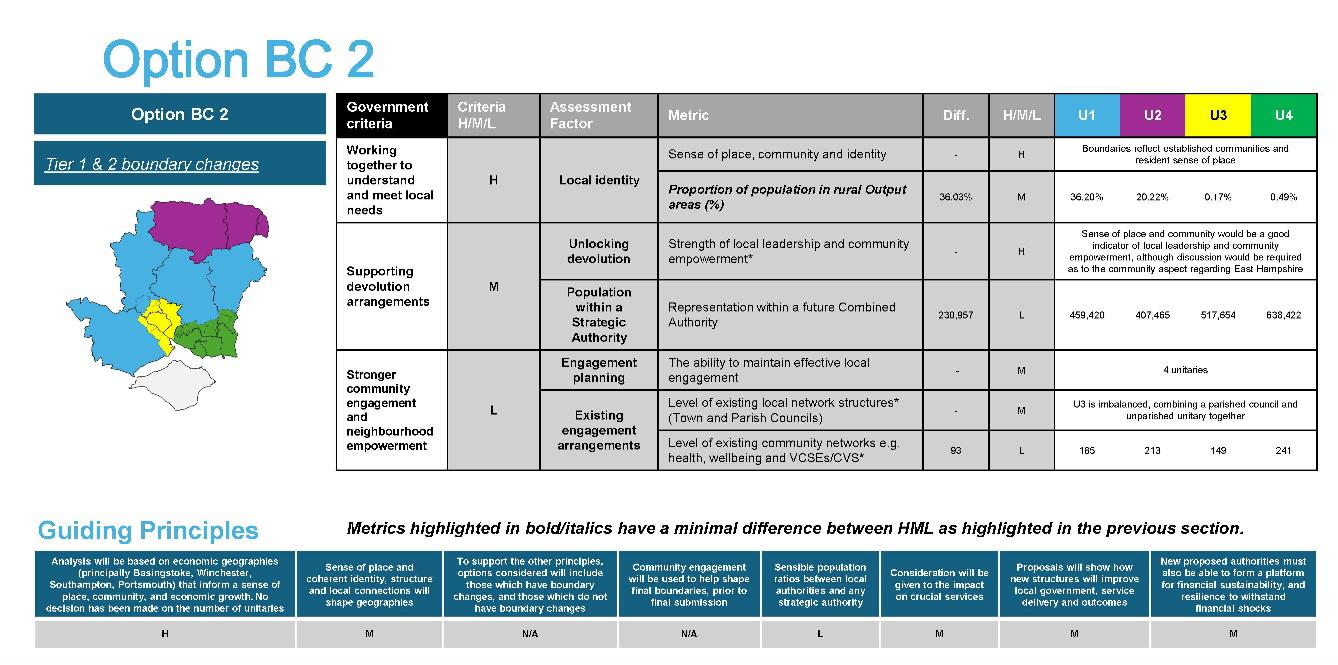
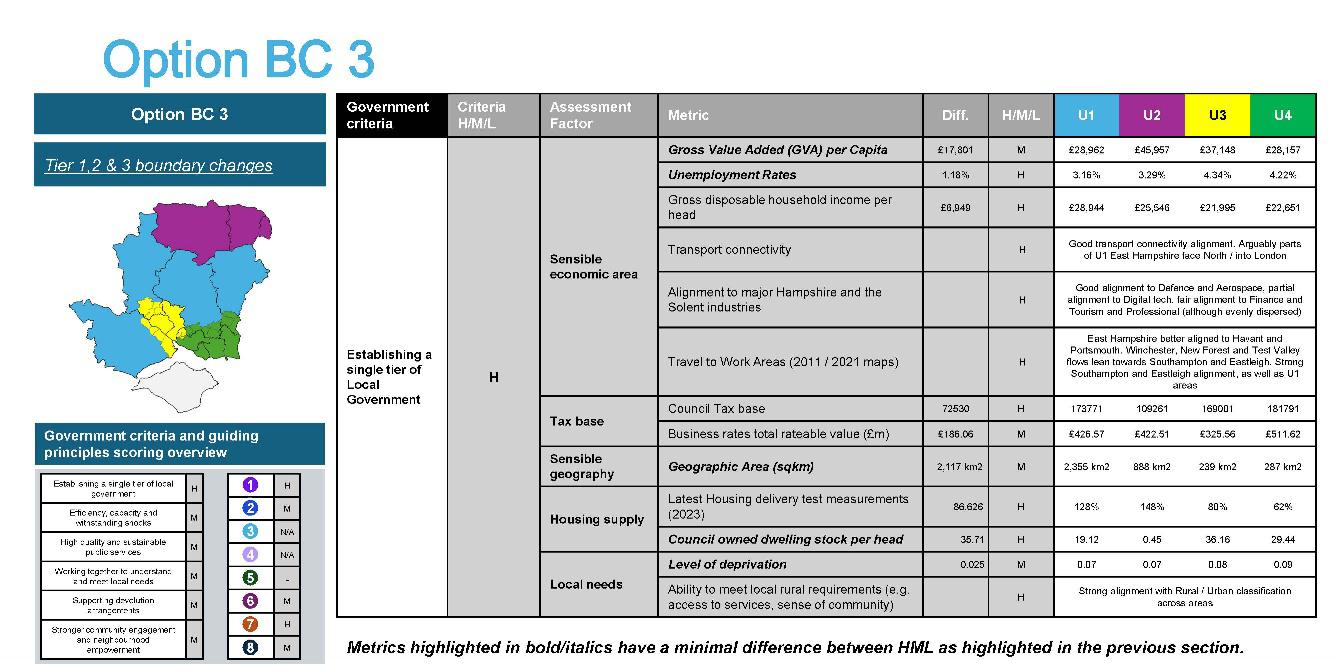
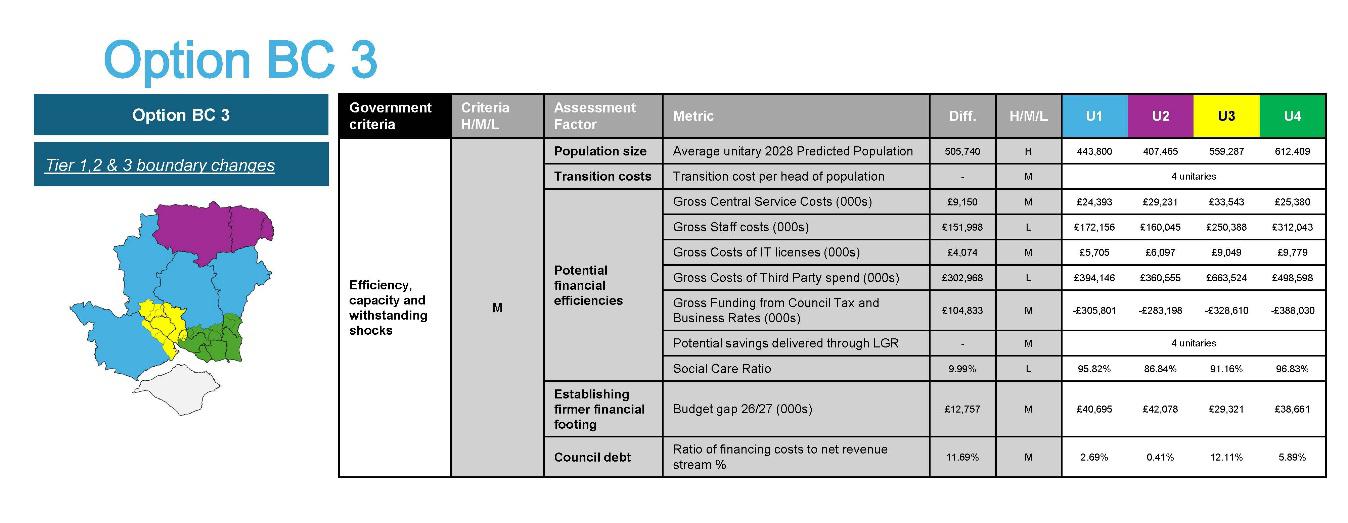
The images below provide a breakdown of metric analysis across each boundary change option.
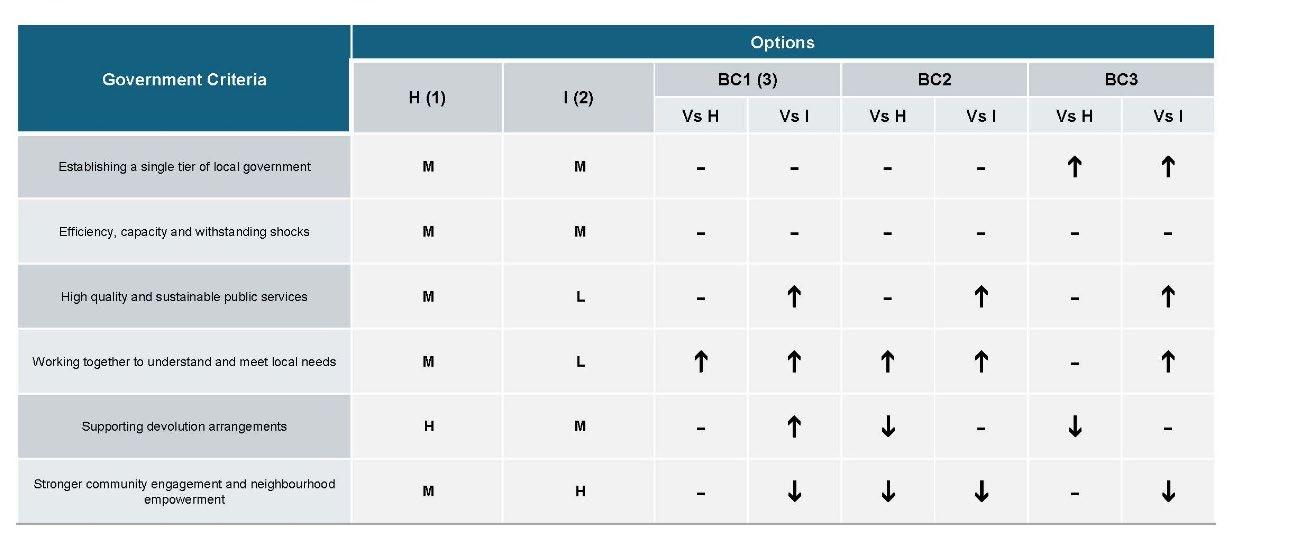
• The boundary change options were assessed against the options taken forward as part of the May Leaders’ session (H & I/Options 1 and 2). When assessing BC1-3 in our analysis against options H and I, the arrows indicate where BC options performed favourably or not. The analysis showed strong performance for BC1 when compared with options H and I.
The tables below show how each of the boundary change options have been assessed against options H and I, government criteria and the Hampshire and the Isle of Wight guiding principles.
Resident feedback and case for change (June to September 2025)
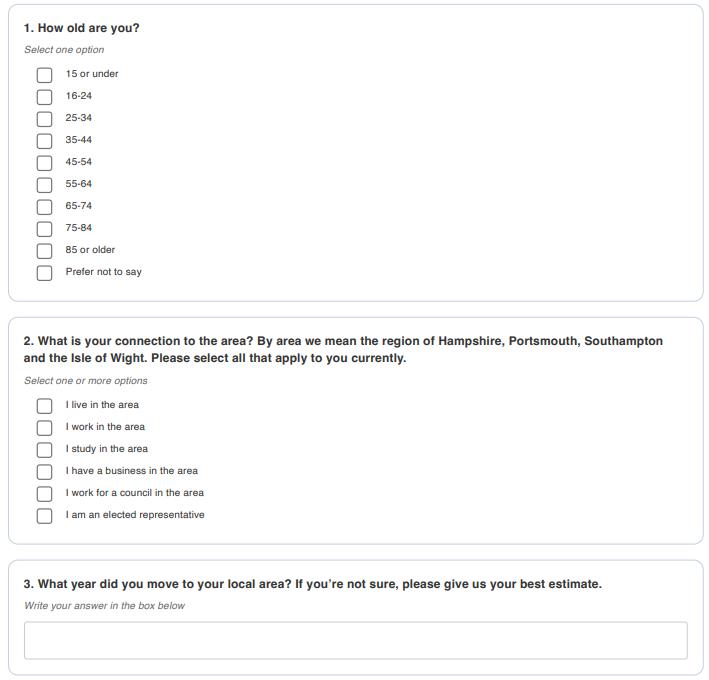
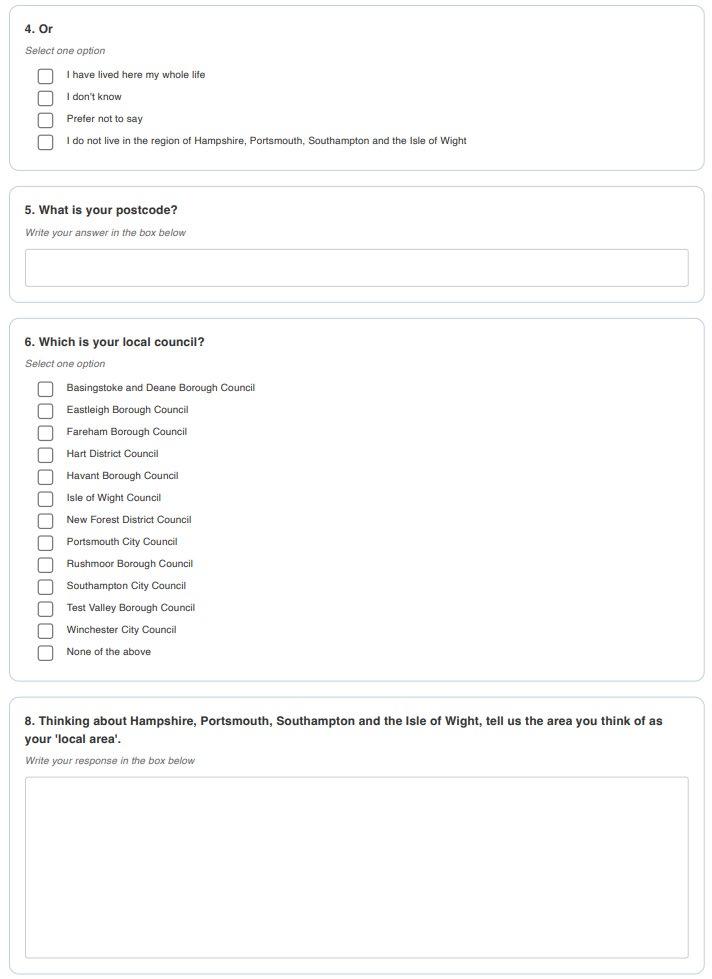
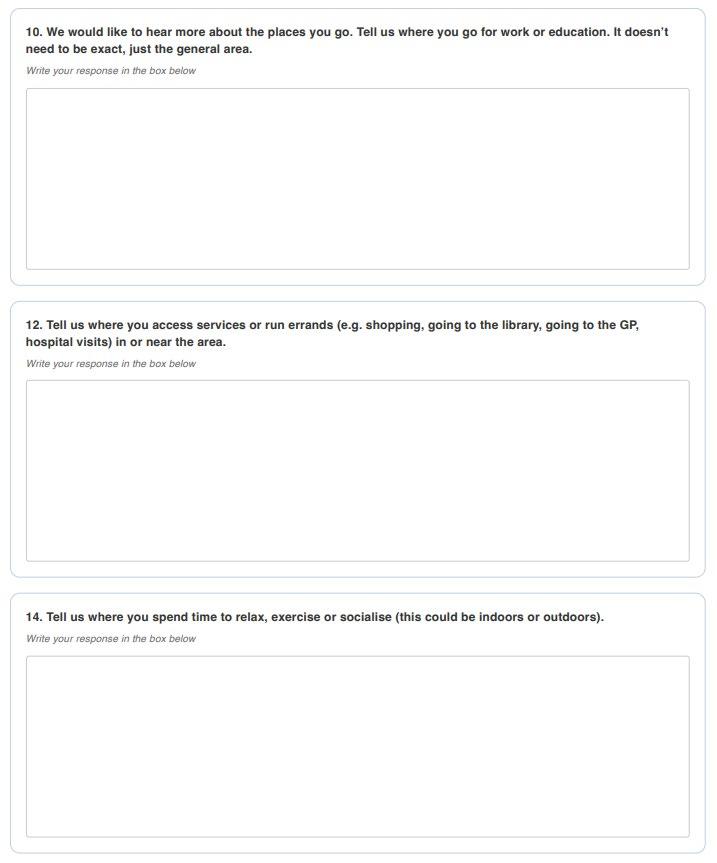
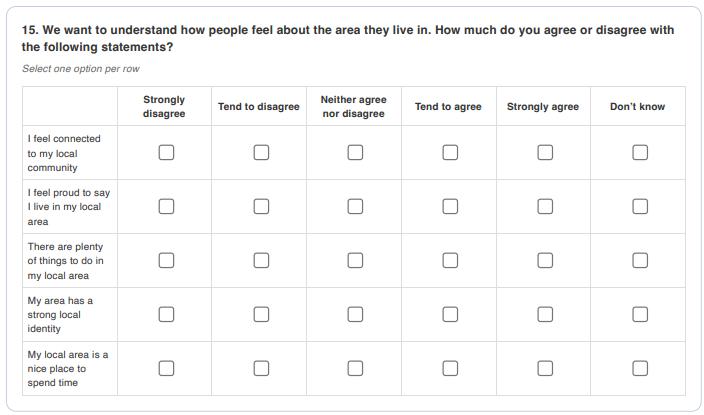
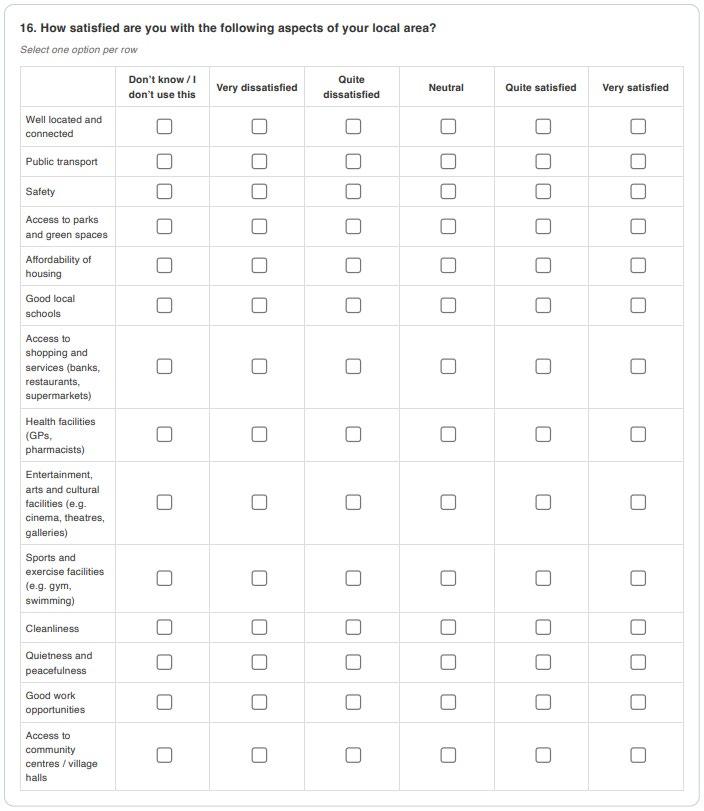
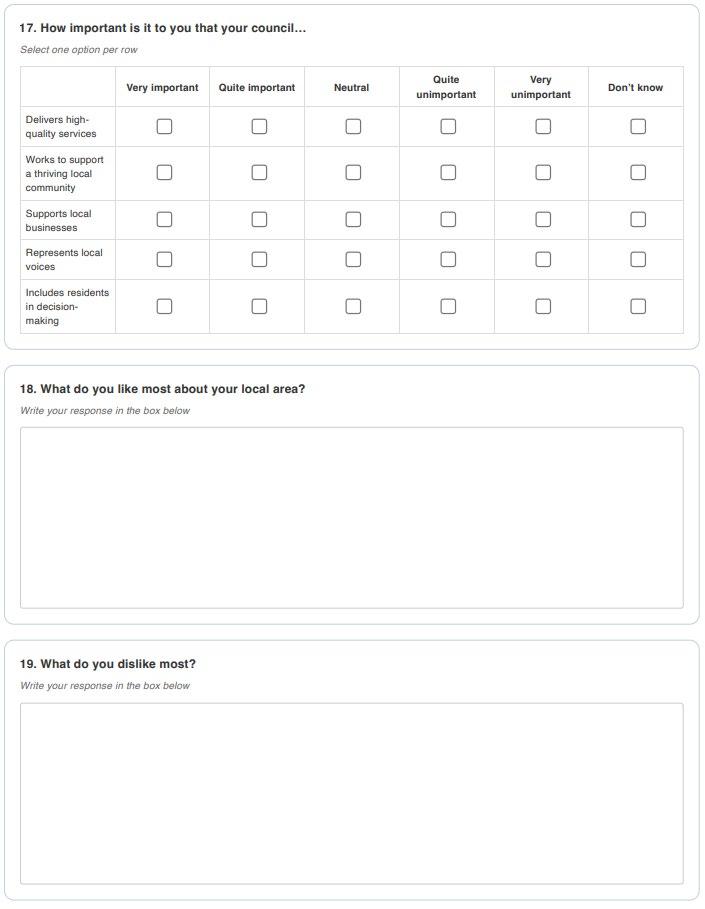
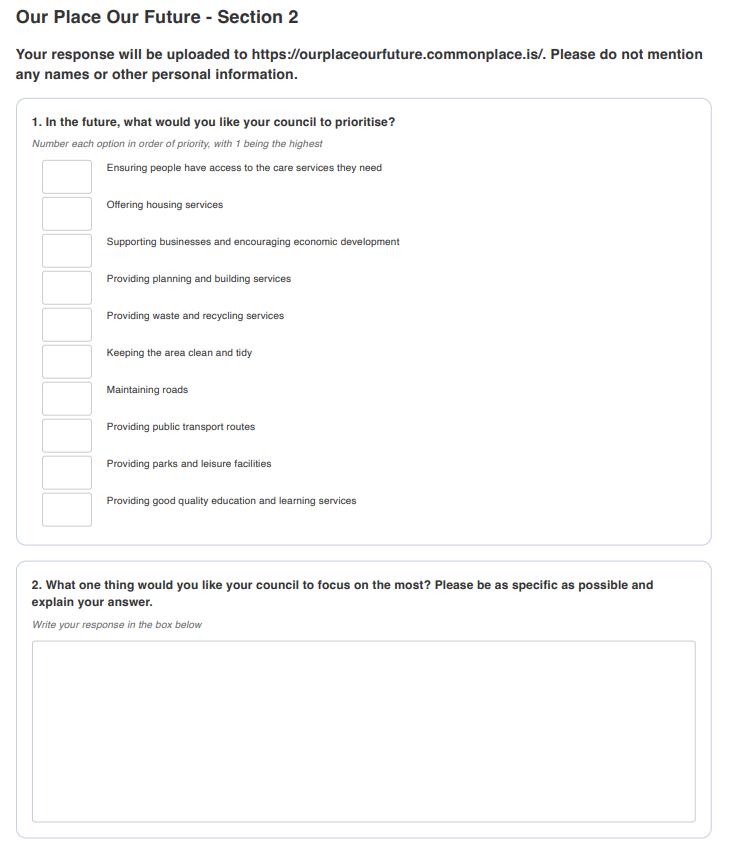
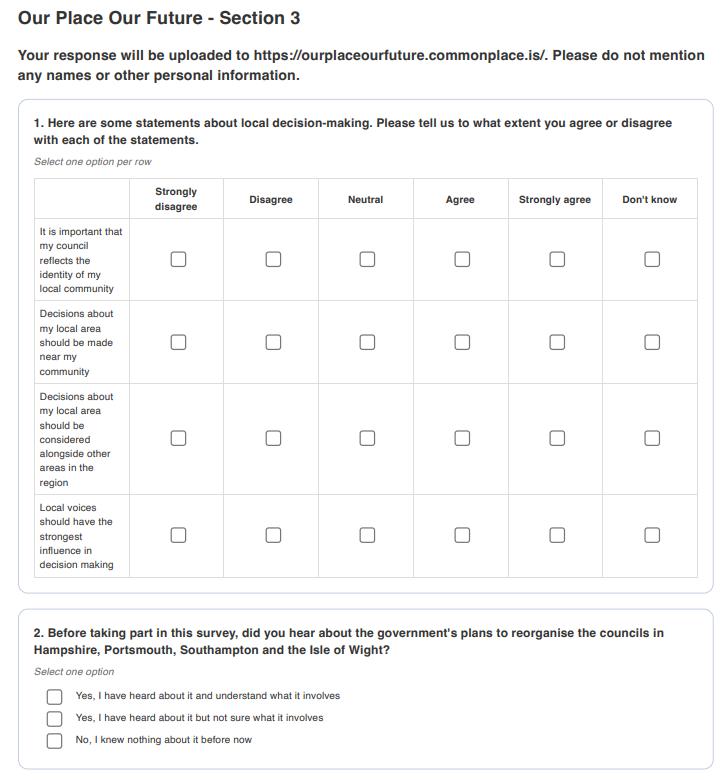
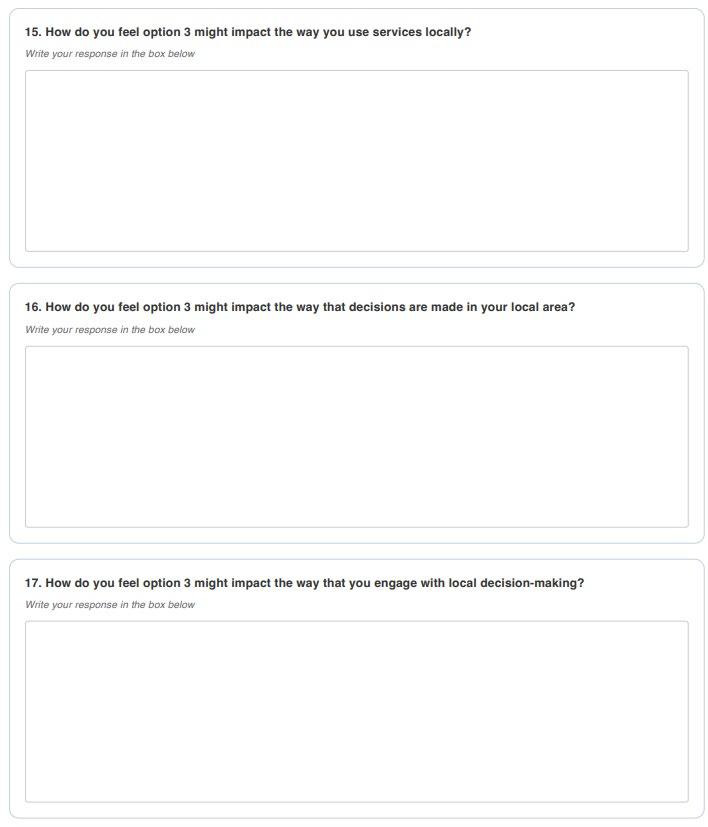
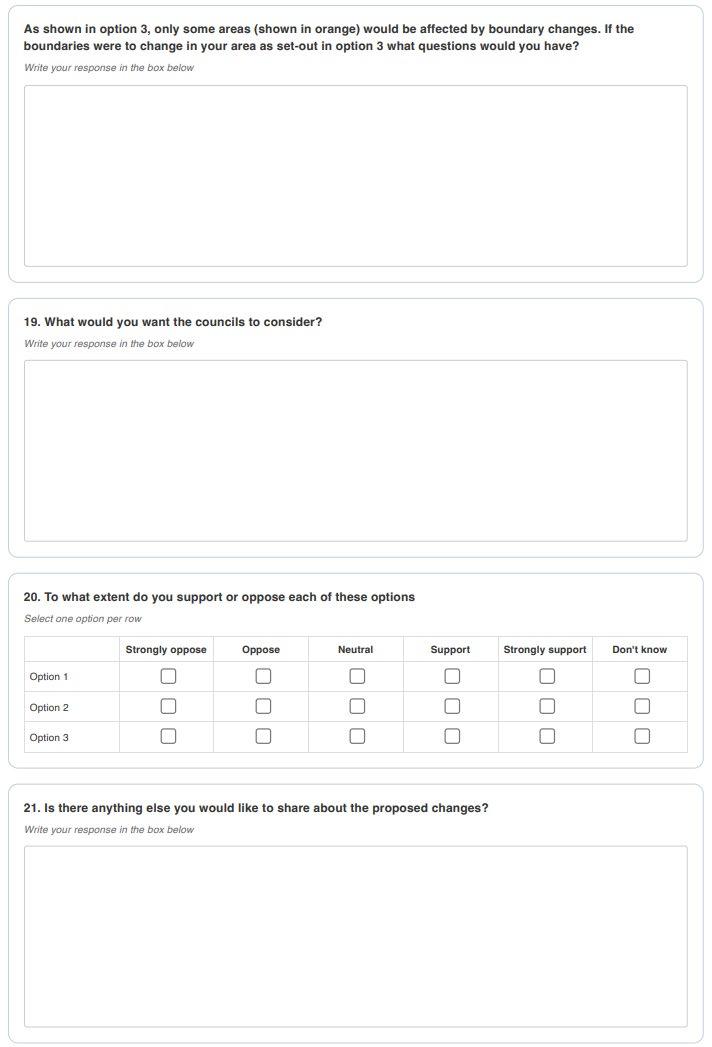
Due to the complexity of boundary change modelling and the requirement to understand resident views, as part of the resident engagement activity, a survey ‘Our Place Our Future’ was launched. The series of images below show the questions that were asked as part of this survey. The findings of this survey can also be found in Appendix 8: engagement report.
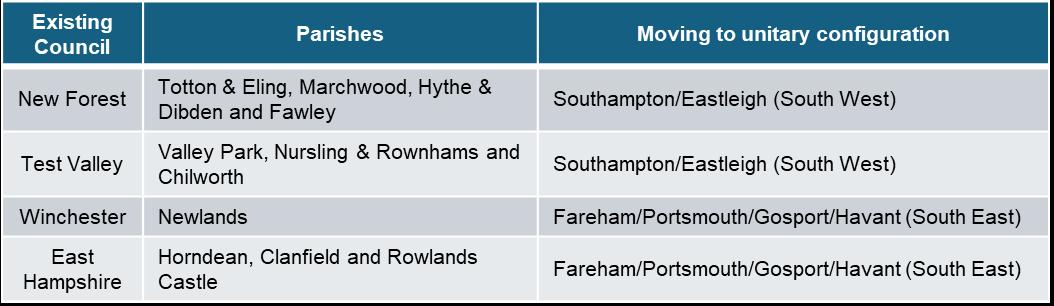
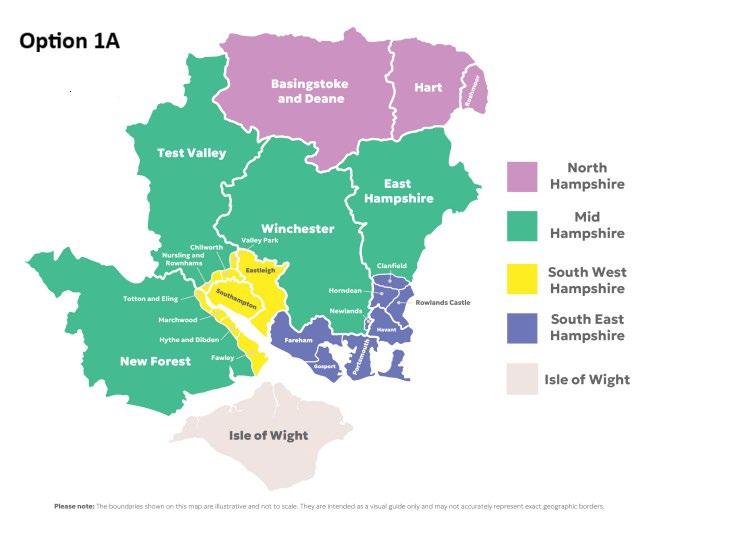
• Following some further analysis and targeted resident engagement it was agreed by council Leaders that a single boundary change option (Option 1A) would be developed and submitted as one of the three options in this proposal, based on the four mainland and Isle of Wight unitary foundation. The details of the boundary changes for Option 1A are outlined below.
• The final step in determining the support for each option was a preferencing session with Leaders to understand which councils supported which option. The following table outlines the support from councils against each of the options.
Modelling assumptions
The following assumptions were made when conducting the detailed options appraisal:
Disaggregation of county council figures
• There were some instances when county council data is Hampshire wide. Where this is the case, the data was disaggregated by district council population (these are predominantly financial metrics e.g. central service costs, staff costs and highways spend).
Assessment at an option level
• The assessment followed process whereby having balanced unitaries within an option is below the 33-percentile therefore scores highly. Creating an imbalance whereby a minority of unitaries has disproportionately positive or negative figures could lead to one unitary area of Hampshire and the Isle of Wight having much greater or worse outcomes than the others and therefore will score Low at an option level.
• At the moment in time when options appraisal was performed, we had not fully assessed the financial sustainability of any individual unitary in any of the options. As per the above, analysis had been conducted based on balance and a full financial model has since been developed for options progressed to a full case.
Generating H/M/L scores for metrics based on difference
• To generate a High, Medium or Low score, the following process was applied:
o For each option, the difference between the lowest and highest unitary figures was identified.
o The range of differences across options were then split into percentiles which were then used to determine High, Medium and Low scores, whereby Low is anything that is within a 66+ percentile difference, High is anything below a 33-percentile difference and Medium is anything between High and Low.
Additional boundary change options assumptions
• Options Comparison: Only options included in this appraisal (Options H, I and BC 1, 2 & 3) have been scored. As HML criteria are based on percentile ranges between options, scores were different to the previous Options appraisal which included different options; direct comparisons to the previous appraisal scores cannot be made.
• Data Apportionment: As noted in the data audit section of this report, any data where a new data source was not agreed has been apportioned based on Parish population percentages.
• Data mapping: Multiple resolutions of data (Parish, Ward, 2011 & 2021 LSOAs) was used for new boundary change data sources. 2021 LSOAs have been visually mapped to Parish Boundaries using ONS data, and 2011 LSOAs matched to 2021 LSOA boundaries using ONS records. These boundaries do not perfectly align with Parish boundaries; as such, new data sources are the greatest resolution approximation of Parish boundaries.
Option variation appendices
Our proposal for a four new mainland unitary configuration, with the Isle of Wight remaining an existing unitary authority, has been unanimously supported by all 11 councils working together as part of a collaborative process. This support has been achieved through a robust and evidence-based process, with all 12 councils committed to making informed decisions based on data, public feedback and financial case, and a clear rationale outlined in the main body of the case as to why our four new mainland and Isle of Wight unitary proposal provides the best platform to unlock and sustain positive outcomes for our citizens.
Our four new mainland and Isle of Wight unitary proposal not only benefits our citizens but also positively impacts all stakeholders, including businesses and partner organisations. It strongly aligns with government criteria and priorities, the LGOF, and the broader public sector reform agenda. To summarise, our proposal:
1. Aligns structures with economic geographies
• Aligns with the four major economic and population centres: Basingstoke, Winchester, Portsmouth, and Southampton.
• Reflects how people live, work, and travel, supporting integrated transport, housing, and economic planning.
• Enables tailored strategies for growth, infrastructure, and skills development in each area.
2. Builds financially sustainable and efficient structures
• All three variations of our proposal (Options 1, 2 and 1A) are financially viable with payback within 2.2-3.1 years.
• By Year 3, the reorganisation is projected to deliver annual recurring savings of £81.8 million in the Base Case and £111.5 million in the High Case across options 1, 2 and 3.
3. Improves public services
• Enables place-based service delivery tailored to local needs.
• Supports prevention-first models in adult and children’s social care.
• Enhances integration with NHS and voluntary sector partners.
• Maintains strong local relationships that large “mega-unitaries” would dilute.
4. Promotes community identity and engagement
• Respects and preserves distinct local identities and geographies.
• Empowers neighbourhoods through local governance models and enhanced councillor representation.
• Avoids the democratic deficit and service detachment associated with larger, mass-aggregated councils.
5. Supports Devolution and Combined Authority Model
• Provides a balanced structure for a future MCA.
• Ensures equitable representation and avoids dominance by any single authority.
• Facilitates strategic planning at the regional level while maintaining local delivery.
There are variations whereby councils have differing views on the configuration of certain future unitaries, principally relating to the New Forest. As a commitment to remaining part of a jointly collaborative process, all 11 councils agreed to the process through which these variations would be presented in this case. Councils supporting each option have worked together, as well as remaining part of the main group supporting the four new mainland and Isle of Wight unitary model, to draft the arguments for their preferred variation. To ensure fairness, several principles and a defined structure were agreed upon before drafting began.
Council support for the options:
Option 1 – Appendix 2
Basingstoke and Deane Borough Council
New Forest District Council
Test Valley Borough Council
Option 2 – Appendix 3
Winchester City Council
Option 1A – Appendix 4
Eastleigh Borough Council
Fareham Borough Council
Hart District Council
Havant Borough Council
Portsmouth City Council
Rushmoor Borough Council
Southampton City Council
Please note that although the Isle of Wight Council has been fully involved in developing the proposals set out in this case and remain supportive of the approach in the proposals to include the Isle of Wight as an independent unitary authority, in September they felt unable to endorse a specific proposal that relates to councils on the mainland. The Isle of Wight Council is continuing to liaise with the government to confirm its position.
The following appendices outline the differences between each option, particularly regarding the position of New Forest (either wholly or partially through a boundary change). As each of the three options include a North Hampshire Unitary Council on the same boundary, the arguments and rationale for this is included in the main document and this is supported by all councils, and so this is not repeated in the three appendices on the different variations.
Appendix 2:
Appendix 2: Option 1
The Power of Place: a transformative vision for local government in Hampshire and the Isle of Wight
Introduction
This appendix builds upon the case for change and shows why Option 1, a new Mid Hampshire unitary authority, including the New Forest, is essential for the success of the overall proposal. Whilst Mid Hampshire is not a single place, its communities do share many similar characteristics and are economically and demographically highly aligned. Mid Hampshire is different from the mainly urban communities in the North, South East and South West of Hampshire and the Isle of Wight.
How is this option different
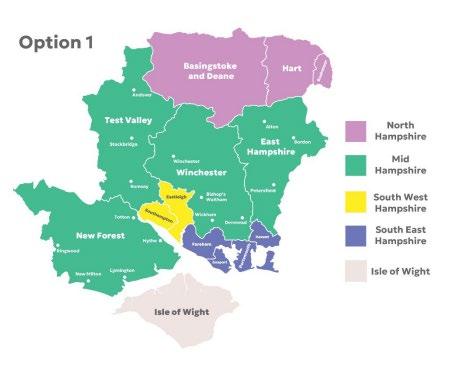
Option 1 differs from Option 2 as it proposes to establish a Mid Hampshire unitary authority on the current footprint of New Forest District Council, Test Valley Borough Council, Winchester City Council and East Hampshire District Council. Option 2 removes the New Forest from this cluster and places it with the city of Southampton and Eastleigh borough.
The Isle of Wight unitary, the North Hampshire unitary and South East Hampshire unitary are unchanged between Option 1 and Option 2 and the benefits in these regions remain as set out in the main document.
Option 1 specifically differs from Option 1A in that Option 1 proposes to use existing administrative boundaries when the new authorities are formed, avoiding the complexity, disruption and costs involved in splitting existing districts. The government feedback on boundary changes, states that such modifications could be considered where
there is strong justification. As the area most significantly impacted by these proposed changes, New Forest District Council will be submitting a separate representation to the Secretary of State setting out why we believe these modifications do not meet the government’s threshold, given their scale, associated risks, and the overwhelming views expressed by the community and businesses during local engagement.
Option 1 ensures a well-balanced mayoral combined authority of four mainland authorities plus the Isle of Wight where it can fulfil its strategic role in respect of the Freeport and the future of port development. It also allows the representation of wider local authority views, representing a greater geography in the development of key port infrastructure which is of national and regional economic significance where all strategic interests are represented.
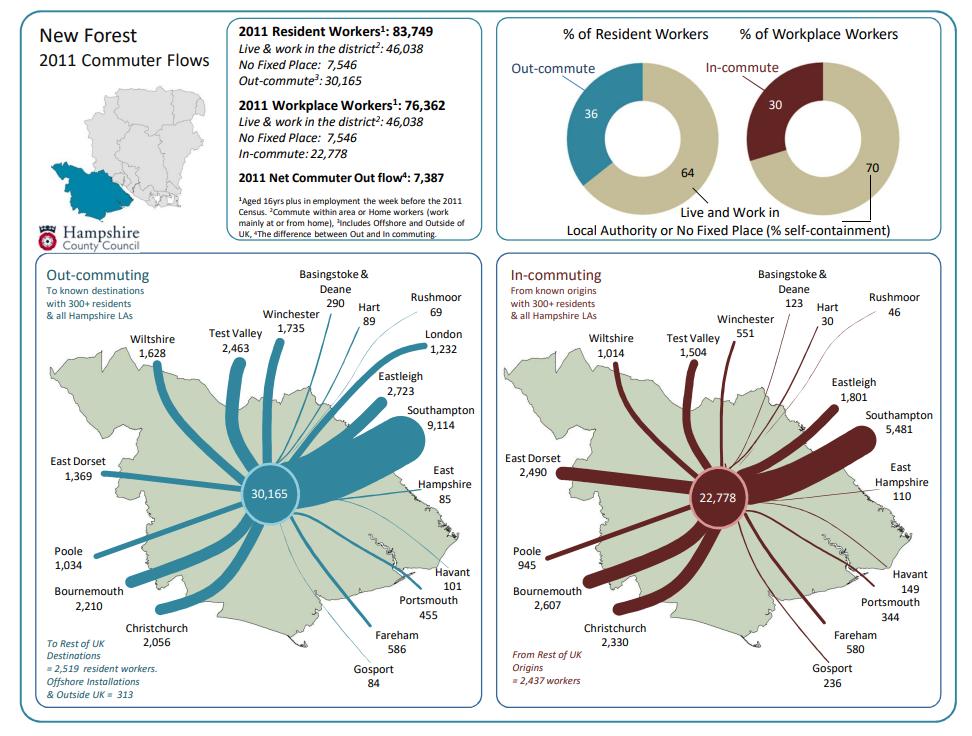
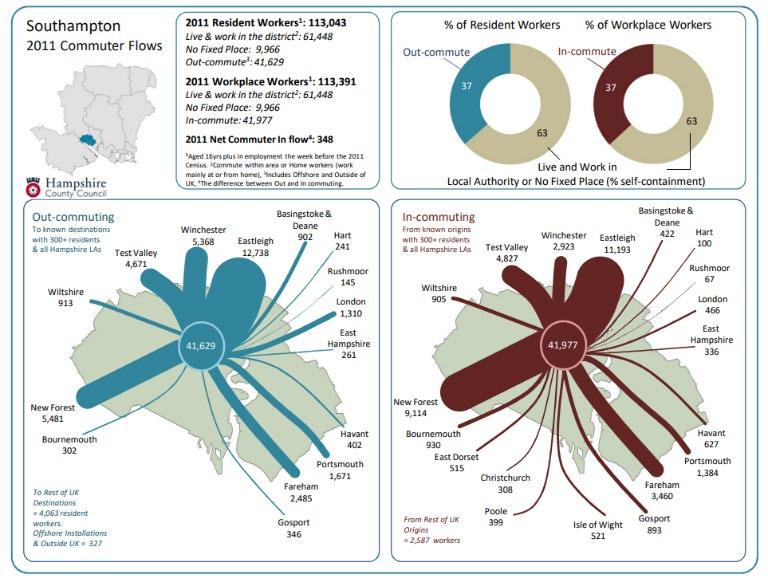
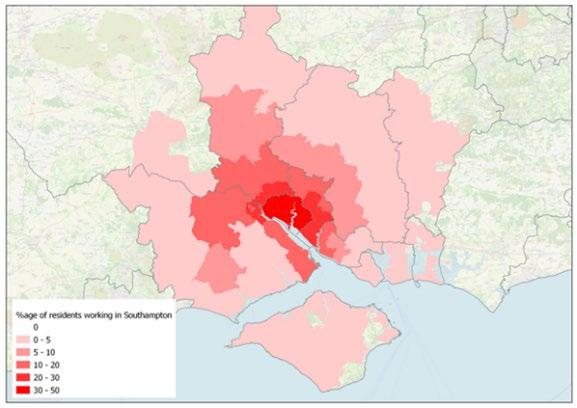
In 2015, ONS produced travel to work areas (TTWA), based on 2011 census data for the whole country. Whilst these remain the latest available TTWA data set it does not reflect the changing nature of the economy and work patterns post Covid, and whilst commuting will inevitably still occur this shouldn’t form the main basis for justifying proposals.
Our engagement exercise demonstrates that, in community terms, people look to their local facilities such as pubs and community buildings, before their location of employment and that’s the basis of our preventative approach, directing services to the locations where people identify with, not their place of work. In fact, with populations (EIA Appendix 7) for those aged 55 and over of 28% and 21% for the New Forest and Test Valley respectively, and the population of 25 to 54-year- olds at 30.2% and 37.6%, compared with that of Southampton at 45.6% commuting numbers are a less relevant factor in community identity. Commuters will always only be a minority of the overall population and this, as a result, should not be the factor that shapes the new authorities.
Option 1 recognises and understands that the communities and economies of the building block areas share many similar characteristics and are ultimately very different to the mainly urban communities in the rest of mainland Hampshire. Option 1 provides four new mainland authorities that we are confident are right sized to deliver the annual estimated benefits and provide an excellent platform to build financially resilient and sustainable new unitary councils that can facilitate necessary public sector reform.
As such, this appendix focuses on the benefits of the proposed strong Mid Hampshire authority, including the entire New Forest, for the four new mainland unitaries with the Isle of Wight remaining independent, as set out in the Case for Change.
A summary of what this option delivers
The economy of the area is distinct and a Mid Hampshire authority established on the current footprint of New Forest, Test Valley, Winchester and East Hampshire would be best placed to support the new Mayoral Strategic Authority (MSA) to develop the unique economic potential of the area. The MSA will, as a result, benefit from a balanced membership of five constituent councils which collectively represent the full range of different economic interests in the region.
Establishing a single unitary authority to work with similar communities across Mid Hampshire and including the New Forest will enable an extension of our already strong place-based working with frontline local councillors supporting local communities to identify and deliver on their own aspirations and build their own resilience. This place-based approach will establish the conditions for transformative public service reform, that supports a preventative agenda to tackle demand, particularly in relation to adult and children’s social care. This approach reflects the preferences of residents and local partners, who value strong local identity, coherent delivery, and collaborative governance rooted in place.
The proposal to create a Mid Hampshire Council brings together the unique natural geography of the New Forest, the Hampshire South Downs, the world-renowned chalk streams of the Test, Itchen and Meon, with, at its centre, the cathedral city of Winchester.
In summary, this option will:
• Secure the benefits of devolution, including economic growth, by ensuring that the MSA is set up for success with a balanced set of constituent authorities, with a united voice for the mid Hampshire communities which are distinctly different from the rest of the geography. This option is better able to represent the diversity of communities and place across the region.
• Deliver a transformative vision for local government, addressing the challenges within the Hampshire area by creating the conditions for a new council with a vision to move on from outdated models of service delivery towards more place and asset-based approaches with a focus on prevention and reducing demand, thereby enabling the delivery of high quality and sustainable public services to all communities across the region.
• Align closely with communities’ views, as expressed in our recent cross-Hampshire survey and wider insight gained from targeted deliberative engagement across the Mid Hampshire area and specific feedback from key Forest town and parish councils and communities including the Commoners.
• Deliver new arrangements, and benefits to citizens, at pace by avoiding additional risk and lengthy bureaucracy associated with boundary change and the disaggregation of key services at a district level such as housing, waste, revenues and benefits and elections.
Key reasons for support
The main point of difference between this option and others in this Case for Change – and the option put forward by Hampshire County Council and East Hampshire District Council – is the proposal to establish a Mid Hampshire unitary authority on the current footprint of New Forest District Council, Test Valley Borough Council, Winchester City Council and East Hampshire District Council. This would operate alongside three new unitary authorities on the mainland to serve the more urban areas in and around the economic centres of Southampton, Portsmouth and Basingstoke in the South East, South West and North of the county. As such, this appendix focuses on the benefits of the proposed strong Mid Hampshire authority, including the entire New Forest, for the four new mainland and Isle of Wight unitary model set out in the Case for Change.
Securing the benefits of devolution, including economic growth
This approach would establish a balanced group of five strong and collaborative unitary authorities able to advocate effectively for their communities and support the MSA to deliver on its new strategic functions. There is a track record of place-based leadership, public service reform, and economic delivery in the Mid Hampshire area, which a new Mid Hampshire unitary authority would build on to actively partner with and strengthen the MSA.
A Mid Hampshire unitary authority would bring substantial and complementary economic strength, and a strong platform for future growth to support the devolution agenda. With a GVA of £18.2bn, Mid Hampshire is a strategically positioned, high-performing economy that is already driving regional prosperity and national productivity. It forms the natural link between the Solent’s coastal economy, anchored by Freeport tax sites in the New Forest, and the Midlands’ industrial base, offering seamless access to regional and international markets. Its connectivity is underpinned by nationally significant infrastructure: the M3, A34, A303, and M27 form the
backbone of freight and logistics across the region, while fast, frequent rail services connect key towns to London in around an hour, supporting labour mobility and access to talent. Proximity to Southampton International Airport and the Port of Southampton further enhances global reach. The rise of hybrid working patterns has also boosted the area’s attractiveness to residents and businesses seeking high quality of life, digital connectivity, and proximity to major centres without urban congestion.
The area is home to global brands such as INEOS, IBM, Estée Lauder, Arqiva, and Stannah, alongside a vibrant ecosystem of high-growth SMEs in sectors such as green technology, advanced manufacturing, agri-tech, and logistics. The Waterside area of New Forest, home of the internationally significant Fawley Oil Refinery, operated by ExxonMobil, anchors the area’s strengths in energy as well as supporting service delivery in sparse rural areas through its tax base and business rate generation.
This diverse and resilient economic base offers significant headroom for further expansion, particularly in innovation-intensive, exportled industries. Nationally recognised higher education institutions and sixth forms contribute to a high- quality skills pipeline, while active public-private collaboration enables research, workforce development, and enterprise growth. The New Forest faces skills challenges that are aligned with Mid Hampshire councils, as opposed to an urban area. It recently produced with partners a Skills plan to tackle local challenges such as an ageing population, low-paid jobs, and limited access to training. It focuses on helping young people, women returning to work, over-50s, job changers, and aspiring entrepreneurs. The key goals of the plan include supporting lifelong learning and digital skills, helping people into better paid, higher skilled jobs, and strengthening sectors like health, tourism, and green industries, as well as promoting inclusive growth and equal access to training.
Option 1 enables bespoke economic infrastructure and skills solutions right for the area to be developed, enabling Mid Hampshire to accelerate economic development, attract inward investment, and support the wider growth ambitions of the Hampshire and Solent region.
This economic dynamism is deeply intertwined with the area’s natural capital and landscape-led economy. Shaped by two National Parks and internationally protected environments, Mid Hampshire’s geography enables sustainable economic development and housing growth that respects environmental constraints. Tourism is a cornerstone of this model, generating hundreds of millions in annual visitor spend, supporting thousands of jobs, and sustaining a thriving network of small businesses across hospitality, retail, food and leisure. Over eight million people visit the Winchester district every year, spending over £370 million and supporting over 5,760 jobs. The New Forest alone attracts over 15 million visitor days annually and underpins one of the UK’s most valuable rural visitor economies. Its environmental role goes hand in hand with innovation in green tourism, decarbonisation, and nature-based enterprise. Keeping the
district whole is not just about identity – it is about ensuring joined-up infrastructure, sustainability, and stewardship across one of England’s most sensitive and economically vital landscapes.
In addition to its environmental and economic importance, Mid Hampshire plays a nationally strategic role in defence and security. It is home to British Army Headquarters and Middle Wallop Flying Station (home of the Army Air Corps Headquarters) in Test Valley, the TriService Defence College in Winchester, and Marchwood Military Port in the New Forest. These nationally significant assets contribute materially to regional GVA, anchor long-term public investment, and provide high-value employment in defence and logistics sectors critical to UK resilience. Bringing them together in Option 1 will enable the future council to continue the long- established support for armed forces and the wider sector within Hampshire.
Delivering a transformative vision for local government
As set out in the main Case for Change, all the unitary authorities have been assessed to identify the most financially viable option. This option would build on the supporting councils’ history of financial stability and resilience, and their record of place-based leadership and public service reform. By leveraging the economies of scale derived from operating across similar areas and communities, particularly in more sparsely populated rural areas, a new Mid Hampshire unitary authority would build on an already strong placebased and preventative way of working amongst districts and extend it into the unitary context. Central to this is an operational culture that puts frontline councillors at the heart of the authorities work with communities, building on their representative role to empower people to shape their futures, strengthening resilience and trust in public services. There is a clear opportunity to reshape the operating model for local government, focusing on rebuilding the relationship between local people and public systems through neighbourhoodbased, preventative delivery.
Across Mid Hampshire, councils are already working in partnership with the NHS, voluntary sector, and communities to reduce pressure on acute services, support independent living, and improve health outcomes. From the nationally recognised Andover Health Hub to discharge and reablement models in New Forest, Winchester, and East Hampshire, the area is delivering the kind of hyper-local, personcentred public services promoted by the NHS Long Term Plan. These approaches are not isolated and reflect a shared ethos across all four councils. From co - designed regeneration projects like Andover Vision and the Totton Regeneration Partnership to East Hampshire’s Whitehill & Bordon transformation, where community-led design has delivered integrated housing, health and green infrastructure, there is significant evidence in this area of how services and places can be shaped with and for residents.
By establishing the new unitary authorities based on similar areas and communities, the conditions will be set for these ways of working to become the mainstream in the new authorities, grounded in community empowerment and environmental stewardship, reducing demand, and delivering better services more cost effectively. This approach is a blueprint for stronger democracy, offering effective, financially sustainable, and accountable governance. It is a success story to be protected.
Aligning with communities’ views
Transitioning to a unitary authority should protect local interests and identities. Our approach ensures that historical, cultural and community identity and the natural assets that matter to our communities are safeguarded.
Within the independent survey commissioned by the 12 councils this option is the preferred choice of those completing the sur vey, with 48% supporting or strongly supporting Test Valley, Winchester, New Forest and East Hampshire forming the building blocks of a new unitary authority.
Option 1 is strongly preferred by respondents from New Forest and Test Valley. Previous reorganisations have demonstrated that where there is community support for proposals this results in effective and sustainable governance.
Delivering benefits to citizens at pace
This option is the only proposal that both avoids the disruption of boundary change and keeps the New Forest intact within a coherent Mid Hampshire geography. This is critical to maintaining the functional and operational fit of the area, preserving how communities live, work, and access services. Indeed, residents, local councils, and district elected representatives across the New Forest have expressed unanimous concern about the risks of boundary change or splitting Waterside from the rest of New Forest. Both New Forest MPs have indicated their support for Option 1.
Reorganising with similar councils as building blocks will be more efficient than merging diverse areas with very different communities, service delivery models, governance structures and population needs.
Assessment against MHCLG criteria
Criteria one: A proposal should seek to achieve for the whole of the area concerned the establishment of a single tier of local government.
Option 1 provides the most coherent and deliverable route to establishing a single-tier structure for Mid Hampshire. It brings together Test Valley, Winchester, East Hampshire and the New Forest - four councils with closely aligned operational models, shared priorities, and high- quality public service delivery across similar mixed rural-urban geographies. This commonality in approach, particularly around neighbourhood services, housing, and environmental management, offers a strong foundation for integrated, place-based governance.
A key strength of Option 1 is that it preserves both the integrity of the entire New Forest district, including the Waterside, as well as retaining it within a coherent Mid Hampshire geography. Its use of whole districts as the building blocks of reform enables a rapid transition without boundary change, minimising disruption to services, preserving community identity, and providing a stable foundation for future transformation. By working with the grain of existing partnerships, Option 1 avoids the overhead of complex structural adjustments and supports faster, simpler implementation, particularly relevant given likely LGBC boundary reviews post-reorganisation. Equally, retaining the entire New Forest district, geographically, administratively, and strategically, within a coherent Mid Hampshire geography is not just a matter of community preference, but a public policy imperative: preserving a nationally significant landscape, furthering the purposes of the New Forest National Park Authority, and protecting ancient commoning practices and environmental stewardship.
This configuration also delivers significant strategic value to the MSA. With a balanced population of just under 600,000, Mid Hampshire provides democratic parity and operational alignment with other unitary partners. It links two National Parks, significant natural capital, and national growth corridors such as the Solent Freeport’s Waterside tax sites and strategic freight infrastructure (M3, A34, A303). This supports delivery of MSA-wide priorities including net zero, sustainable housing, and rural economic growth. Option 1 ensures rural priorities are properly represented without compromising the city-region focus, providing a completer and more resilient MSA footprint.
One of the most recent LGR processes saw the creation of North Yorkshire Council, which could be seen as a forerunner to the proposals contained in Option 1. North Yorkshire Council has a population of over 600,000 which is a similar sized population to that proposed for Mid Hampshire. North Yorkshire brings together communities covering a very large geographical area which are similar in nature, rather than claiming to be single place. This is very similar to the Mid-Hampshire proposal. North Yorkshire is bordered by larger
urban areas such as the city of York which, itself, has a population of 210,000. This is around half the size of the proposed new unitary authority for Southampton and Eastleigh. North Yorkshire is made up of two National Parks which cover 40% of its geography and has market towns running the depth and breadth of what is the largest unitary council by geographical size, in England.
Finally, this model supports the MSA to deliver on the Government’s ambition to maximise sustainable housing delivery across Hampshire and the Isle of Wight. The Mid Hampshire footprint includes areas of significant housing potential, delivered through sensitive, landscape-led models supported by partnerships with universities, Homes England and statutory environment agencies. The geography reflects real-world patterns of housing, employment, and infrastructure, making it an effective delivery platform for growth that is both ambitious and sustainable.
Criteria two: Unitary local government must be the right size to achieve efficiencies, improve capacity and withstand financial shocks.
With a projected 2028 population of 598,823, Mid Hampshire is the right size to achieve the government’s ambitions for local government reform: big enough to deliver transformation and economies of scale, while local enough to remain responsive and rooted in place. Its scale supports efficiency, strategic capacity, and resilience to financial shocks, while its geography and design allow services to be tailored to the distinct needs of rural, urban, and semi-rural communities.
The Mid Hampshire proposal brings together councils already shaped by a shared understanding of how to deliver for communities across a mixed rural/town landscape. This enables the new authority to maintain local relevance while achieving organisational efficiencies. By retaining the boundaries of existing authorities, Option 1 avoids the complexity, cost, and service disruption that would result from lower tier disaggregation allowing for a more seamless transition.
The Hampshire County Council forecast deficit to 2028 of £281m represents an enormity of financial challenge that proves why a different approach and scale of local authority across the county area is needed. The financial advantages of the four new mainland unitary model have been robustly tested during the building of this case for change and shows significant net budget improvements for all recommended authorities. Option 1 provides four new mainland authorities that we are confident are right sized to deliver the annual estimated benefits and provide an excellent platform to build financially resilient and sustainable new unitary councils.
Collectively, these councils have shown strong financial governance while investing in future efficiency, through retrofit programmes, nutrient-neutrality mitigation, and developer-funded infrastructure. This prudent, future-focused approach provides a strong platform for a financially sustainable unitary authority.
Mid Hampshire’s well- connected infrastructure, anchored by the M3, A34, A303, M27 and fast rail links to London, enables seamless movement of goods, people, and services. These routes are vital for national freight logistics and underpin the success of key industries in the region. The area also benefits from excellent access to international gateways including Heathrow, Gatwick and Southampton International Airport, further enhancing its strategic connectivity for business, trade and travel.
The area’s economy further reinforces its resilience and growth potential. Mid Hampshire is home to global companies such as INEOS, IBM, Estée Lauder, and Arqiva, alongside a thriving ecosystem of high-growth SMEs. Its economy is defined by both scale and momentum, anchored in key sectors like advanced manufacturing, logistics, agri-tech, environmental services, and green technology. These sectors are not only high value but strategically aligned with national economic and net zero priorities. This blend of multinational investment and entrepreneurial energy creates a dynamic environment for jobs, exports, and inward investment. Tourism also plays a vital role in the region’s economy. With millions of visitors each year to the New Forest, Winchester, South Downs National Park, and market towns such as Lymington, Romsey, Petersfield, and Alton, the area supports one of the UK’s most valuable rural visitor economies. Tourism sustains thousands of jobs across hospitality, retail, culture, and heritage, while also reinforcing local identity and landscape stewardship.
In summary, Option 1 is right sized to meet the government’s ambition for resilient and efficient local government. It combines scale with subsidiarity, builds on commonality in service delivery, and avoids the risk and disruption of boundary change. Its structure supports stronger partnerships, maintains close connections with residents, and delivers the long-term efficiency that reform is intended to unlock.
Criteria three: Unitary structures must prioritise the delivery of high quality and sustainable public services to citizens.
Mid Hampshire councils demonstrate a strong and consistent track record of delivering high- quality, sustainable public services, especially in housing, preventative health, and community infrastructure. They have a shared commitment to service models that are rooted in local communities, respectful of the natural environment, and responsive to the needs of rural and mixed geographies.
A particular strength of Option 1 is the design of services around the needs of rural populations, including isolated and less well served communities where deprivation is often less visible but no less acute. Mid Hampshire's model offers a credible, scalable route to tackling rural deprivation, one of the government’s key priorities, through outreach-based public services, targeted investment, and inclusive community infrastructure. From mobile and outreach health provision to housing strategies tailored to smaller settlements, services are delivered at the scale of recognised community footprints. This ensures local relevance, service take-up, and social impact, while maintaining efficiency and accountability.
The area is also well positioned to deliver integrated adult social care. All four councils have invested in neighbourhood-based preventative models that promote independence, reduce pressure on acute services, and align with national NHS and social care objectives. These models provide a scalable blueprint for joined-up care:
• In the New Forest, initiatives like Independence Matters and Just Got Home support recovery at home, reduce delayed discharges, and enhance patient choice – especially in hard-to -reach rural areas.
• The Andover Health Hub is a nationally recognised example of multi-agency coordination, bringing together NHS services, local government, and voluntary sector partners to improve discharge, reablement, and early intervention. Winchester and East Hampshire deliver embedded neighbourhood support through voluntary and primary care networks. In Winchester, locality teams collaborate with GPs and VCSE partners to support frail and older residents, while East Hampshire integrates community development officers into local hubs, focusing on early intervention, carers, and those at risk of social isolation.
The broader Option 1 model allows for coordinated transformation of complex services, including adult social care. Shared NHS providers, overlapping community networks, and a culture of place-based practice enable a safe, phased disaggregation of county functions. Together, these new authorities can redesign services around local geographies, ensuring smoother transitions for residents and stronger alignment with primary care, mental health, and voluntary sector partners.
Support for children and families is also integrated. Across Mid Hampshire, shared community assets such as dual-use halls and children’s centres support early years and family development. Joint work with schools, GPs, and VCSE partners enhances delivery of mental health and early help services.
Housing and infrastructure strategies demonstrate sustainable public service innovation. Across the region, councils have worked together, and with the Civic University Network, to plan and deliver homes that meet rural community needs while protecting environmental assets. This includes:
• Exception site housing for local people.
• Retrofit programmes to reduce fuel poverty and emissions.
• Nutrient neutrality mitigation to unlock stalled housing sites.
• Developer-funded infrastructure to support long-term public service integration.
Importantly, this geography supports simplification of planning and environmental governance. The New Forest National Park currently intersects four local planning authorities— creating complexity and fragmentation. Option 1 reduces this to three, streamlining delivery and strengthening the statutory role of the NPA. It also aligns strategic housing delivery with ecological stewardship, enabling services and infrastructure to be planned in harmony with the protected landscapes that define this area.
Option 1 presents the strongest alignment with the New Forest National Park Authority’s statutory purposes and strategic priorities, undertaken in a recent assessment by the NPA. By retaining the integrity of the New Forest as a whole and combining it with other predominantly rural authorities - Test Valley, Winchester, and East Hampshire - the option safeguards vital landscape, ecological, and cultural heritage links. It supports collaborative delivery of national objectives such as nature recovery, climate resilience, and the 30x30 targets, while recognising the socio - economic value of the New Forest’s natural capital. Crucially, it avoids fragmentation of the Waterside area, preserving the commoning system essential to the Park’s management and identity.
This approach reinforces national policy duties under the Environment Act 1995 and the Levelling Up and Regeneration Act 2023, supporting the statutory purposes of National Parks and preserving ancient commoning rights that are unique to the New Forest.
In summary, Mid Hampshire is already delivering high- quality services through preventative, environmentally respectful, and community-focused models. The proposed unitary would build on this foundation, scaling best practice, unlocking housing and health outcomes, and reducing the overheads associated with boundary reorganisation. Crucially, it offers one of the most coherent platforms to tackle rural deprivation and isolation, supporting inclusion, economic resilience, and improved outcomes in places often underserved by urban-led models.
Criteria four: Proposals should show how councils in the area have sought to work together in coming to a view that meets local needs and is informed by local views.
While the four councils have not historically operated as a formal partnership, they each bring strong and complementary relationships with NHS partners, town and parish councils, community groups, and local businesses. Their shared strategic values and deep commitment to place-based working create a robust foundation for integration.
This option builds on community consensus. Each authority has engaged extensively with residents, town and parish councillors, and civic partners as part of the local government reorganisation process. This feedback consistently supports a model that:
• Retains existing district boundaries and avoids unnecessary structural change.
• Respects local identity and reflects the distinct character of rural communities.
• Maintains proximity between residents and the services they rely on.
There is a clear desire for governance that keeps decision-making local, responsive, and grounded in how communities already live, travel, and access support. Option 1 reflects these preferences. It is designed around natural functional geography, reinforced by travelto -work flows and social connections between New Forest, Test Valley, East Hampshire and Winchester, and avoids boundary reorganisation that would weaken the alignment between local identity and governance.
This model also reinforces people’s connection to rural life. It recognises that rural residents value distinct things, such as access to local services, landscape stewardship, and direct influence over neighbourhood priorities. There are key communities within the New Forest including the New Forest Gypsy, Romani and Traveller communities some of whom were historically resettled from roaming freely across the Forest to settled areas including Totton within the waterside area, Fawley Parish, and Hythe.
Also, the Commoners who have a demonstrable historical continuity in the New Forest going back over a thousand years in unbroken continuity and have maintained a sociocultural identity and traditional way of life which is distinct from any other group in the UK. The continuation of our traditional way of life including culture, identity and practice is vital to maintaining the New Forest’s internationally important ecology and landscape.
By retaining whole districts and established footprints, Option 1 ensures that this relationship with place is maintained and strengthened into the future.
Mid Hampshire’s geography also includes a network of vibrant towns, from Andover and Alton to Romsey, Lymington, Petersfield, Bordon, Stockbridge and Bishop’s Waltham. These towns are more than service hubs; they are identity anchors for surrounding rural communities. The Mid Hampshire approach explicitly acknowledges their distinct needs and builds governance and delivery around them. It supports targeted economic growth, transport investment, and social infrastructure designed for market-town scale, something not always achievable in more urban- dominated unitary models.
Crucially, this proposal also protects and strengthens the role of town and parish councils. These local bodies play an essential role in shaping services, supporting vulnerable residents, and holding decision-makers to account. The councils within Mid Hampshire already operate highly localised governance structures, such as area planning committees, neighbourhood forums, and ward-led investment models, that empower local voices and ensure that frontline councillors are at the centre of all work with communities. Under a Mid Hampshire unitary, these mechanisms would not only be retained but elevated, embedding neighbourhood democracy in the new authority’s governance model.
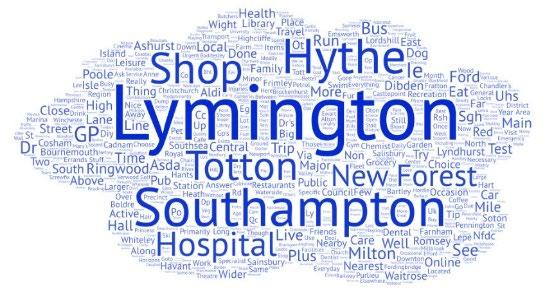
Independent deliberative engagement commissioned from Thinks Insight & Strategy found that “most New Forest residents see the New Forest as their local area, including towns in the area such as Lymington, Lyndhurst and New Milton. While many travel to Southampton to access services and amenities, people are reluctant to identify it as part of their local area.”
In summary, Option 1 is rooted in what communities have asked for. It:
• Builds on community consensus around boundaries, identity and local delivery.
• Supports people’s connection to rural life and distinctive places.
• Recognises and empowers market towns and their surrounding settlements.
• Strengthens collaborative working with town and parish councils.
• Reflects lived experience and patterns of movement across Mid Hampshire.
It is not just a configuration that works on paper, it is a model shaped by people, place, and local ambition.
Criteria five: New unitary structures must support devolution arrangements.
Mid Hampshire is well-positioned to support future devolution. Its size, strategic coherence, and delivery capability make it an ideal partner for taking on devolved powers and functions, ensuring that decisions are made at the most appropriate level, aligned to the needs and aspirations of communities and businesses.
The region already demonstrates the capacity and credibility required to operate at a devolved level:
• Major regeneration leadership at Andover and Winchester, driven by local ambition and strong delivery capability.
• Strategic influence on the Solent Freeport Board, particularly through New Forest’s Waterside sites with successful working through the Waterside Steering Group ensuring the business case delivers for local residents for example co -producing the New Forest Skills Plan.
• Collaborative housing and environmental planning, including joint solutions to challenges like nutrient neutrality and sustainable land use, with projects such as Whitehill & Bordon in East Hampshire exemplifying landscape -led regeneration and a proactive planning approach to Solent Freeport tax sites including Solent Gateway and Fawley Waterside.
• Successful attraction and deployment of Levelling Up Fund, UKSPF, Homes England, and DEFRA investment across all four districts, including targeted rural and market-town interventions in Petersfield and Alton.
In particular, the transformation of Andover, led by Test Valley through a nationally recognised co - design process, demonstrates Mid Hampshire’s readiness to lead place-based change. The emerging health and wellbeing campus integrates health, planning, and infrastructure in a way that exemplifies the area’s ability to align local innovation with regional priorities.
A Mid Hampshire unitary authority would also be well placed to maximise the economic and environmental opportunities available across Hampshire and the Isle of Wight. Its geography connects high-potential growth corridors with exceptional natural capital assets, such as the New Forest and South Downs National Parks, Sites of Special Scientific Interest, and internationally renowned chalk rivers. These areas are not only environmental treasures but economic engines: supporting land-based enterprise, eco -tourism, and green innovation.
The scale and coherence of Mid Hampshire enable it to act as a strategic delivery vehicle, harnessing this natural capital to drive inclusive, environmentally responsible growth. This includes:
• Sensitive delivery of housing and infrastructure in protected and constrained landscapes.
• Investment in sustainable transport and clean energy.
• Stewardship of ecosystems and biodiversity in ways that also support economic resilience.
Option 1 ensures that this unique blend of landscape and economy is governed in an integrated, place-sensitive way, aligning environmental responsibility with productivity and growth.
As a partner within the MSA, Mid Hampshire would provide geographic and functional balance. It complements more urban unitary areas by representing the rural and town perspective, ensuring strategic priorities, such as housing, health, and net zero, are delivered across a full spectrum of places. Its presence would help shape a more balanced regional offer, grounded in diverse strengths and shared ambition.
In summary, Mid Hampshire including the New Forest:
• Has the scale and leadership maturity to absorb devolved powers.
• Offers a strategic geography that links coastal, rural, and inland economies.
• Maximises the potential of natural capital to deliver green growth.
• Supports balanced, inclusive regional development in partnership with the MSA.
• Keeps governance rooted in place, while aligning delivery with national policy.
• This is not just a unitary proposal, it is a ready-made platform for meaningful devolution, designed to unlock the full potential of the area and contribute to the prosperity and sustainability of the wider South East.
Criteria six: New unitary structures should enable stronger community engagement and deliver genuine opportunity for neighbourhood empowerment.
Mid Hampshire councils are national exemplars in neighbourhood-based engagement. Their democratic and community development models go beyond consultation, they are embedded in how places are shaped, and services are delivered. This collaborative, neighbourhood-first approach strengthens local democracy, resilience, and ownership, and provides a robust platform for future innovation.
Crucially, Option 1 builds on the strength of having well- established parish and town councils across the entire geography. These structures already provide a direct, trusted link between residents and governance, especially in rural areas. Under this model, Neighbourhood Area Committees would be established to bring together representatives from the new unitary authority and existing town and parish councils. This approach ensures continuity of local representation, while enhancing capacity for coordinated, responsive delivery.
This configuration maintains people’s connection with rural life and supports the distinctiveness of market towns, which often require a different service focus from more urban centres. Rather than imposing a one-size-fits-all model, Option 1 enables locally bespoke governance that reflects the diversity of communities across Mid Hampshire, empowering residents to shape solutions that meet their unique needs.
Option 1 fulfils the LGBCEs requirement for effective and convenient local government. A unified governance model ensures coherent service delivery, environmental regulation, and planning policy, all of which would be compromised by fragmentation. For example, in ecological stewardship the Waterside forms a vital corridor between the Forest and the Solent. Fragmenting governance would disrupt biodiversity management and climate resilience strategies. In terms of planning for the area the Waterside Vision, A326 upgrade, and Freeport development are coordinated through cross-agency partnerships rooted in the New Forest context. Across the geography, councils are already empowering communities to shape their futures and Option 1 brings together place-based partnership delivery:
• Test Valley’s Andover Vision and Romsey Future partnerships are long-standing, community-led programmes that shape regeneration priorities and build consensus across sectors.
• Winchester’s neighbourhood forums support the development of new communities by giving voice to residents, ensuring new places are shaped from the ground up.
• The Totton Regeneration Partnership in the New Forest exemplifies collaborative place-shaping involving councillors, residents, and local organisations.
• East Hampshire District Council, through the Whitehill & Bordon regeneration, has engaged residents via community forums and placemaking governance schemes, ensuring public input shaped health infrastructure, environmental design, and sustainable master planning.
These initiatives have been enhanced through award-winning engagement methods, such as citizens’ assemblies and digital consultations, which reach a broader and more inclusive audience. Winchester’s lockdown- era consultation won two national awards for its impact and reach, while Test Valley has built a national reputation for deliberative public engagement.
In addition to engagement, formal governance structures are already close to communities. Ward-level funding, area-based planning committees, and dedicated community support teams extend the council’s presence and visibility on the ground. In New Forest, councillor budgets along with a £350,000 annual grants scheme enables residents to lead on local priorities. In East Hampshire and Winchester, community governance is adapted to reflect the needs of growing settlements and new developments.
The new Mid Hampshire unitary authority would not only maintain these structures, but it would also scale and strengthen them, combining the local accountability of parish and town councils with the strategic capacity of a larger, financially resilient UA. The introduction of Neighbourhood Area Committees would enhance joined up working across tiers of governance and deepen the reach of local democracy.
In summary, Option 1 empowers local communities, protects local identity, and reinforces the structures that already support responsive, democratic governance. It delivers on the Government’s ambitions for neighbourhood empowerment by rooting decisionmaking in place and extending trust and influence on the communities themselves.
Leaders’ and other key stakeholder endorsements
Cllr Jill Cleary, Leader, New Forest District Council
“Option 1 delivers reorganisation that works for the whole of Hampshire and the Isle of Wight, creating a governance model that is efficient, locally responsive, and positioned to maximise our shared economic and environmental potential.
“The district of the New Forest is more than a location, it is a connected community with a shared identity and a clear sense of direction. Our residents have told us they want governance that reflects that reality. And our communities have spoken with clarity and conviction, speaking up for governance that feels rooted in who they are, where they live, and how they connect with one another. For the New Forest, Option 1 builds on existing partnerships, aligns areas with complementary priorities, and creates the conditions for stronger, more resilient public services.
“This is about building on the very best of what we have; harnessing the Waterside’s economic potential within the wider region, championing the Forest’s role in environmental leadership, and ensuring a strong voice in decisions that shape our future.”
“Option 1 is the only configuration that can deliver LGR with community backing, regional coherence, and the credibility to make it work. It unlocks the full potential of Hampshire and the Isle of Wight while keeping the Forest whole.”
Cllr Phil North, Leader, Test Valley Borough Council
“Our communities are very supportive of Option 1. Whilst nobody is claiming that Mid Hampshire is a single place, its communities and economies share many similar characteristics. Ultimately it is very different to the mainly urban communities in the rest of mainland Hampshire.
“As a result, it will provide the conditions for public service reform to succeed and offers hope of a sustainable future for all our communities. It will ensure a well-balanced mayoral combined authority where all strategic interests are represented.”
Who supports the option?
Basingstoke and Deane Borough Council
New Forest District Council
Test Valley Borough Council
Conclusion: Why Option 1 offers the strongest path forward
Option 1 presents the most coherent, deliverable, and future-ready model, with a coherent and strong Mid Hampshire unitary authority at its centre. It builds on existing boundaries as building blocks, bringing together similar areas currently governed by councils with aligned priorities, shared delivery models, and a strong culture of place-based innovation, creating the right conditions for better services, stronger communities, and long-term financial sustainability for all councils.
It brings forward a geography that reflects commonality, ensuring a rural voice in strategic decisions and avoiding placing a predominantly rural area into a governance structure designed around a city. It is designed to support an effective Mayoral Strategic Authority, bringing together two National Parks to provide environmental leadership across the region.
Crucially, Option 1 is the only configuration that both preserves the integrity of the entire New Forest district, including the Waterside, and retains it within a coherent Mid Hampshire geography. This ensures that rural identity, operational coherence, and environmental stewardship remain intact, vital in one of the UK’s most sensitive and nationally significant landscapes. It produces coherent and effective local governance and builds on local identity, two key principles for shaping council boundaries.
Option 1 avoids both disruption and compromise. It offers:
• No boundary change, making it the least disruptive and most immediately deliverable option.
• Continuity in public service delivery, building on strong cross-sector partnerships already in place across health, housing, environment, and community services.
• Economic strength and connectivity, rooted in a high-performing £18.2bn GVA economy, key national infrastructure, and growing innovation clusters.
• Balanced population and tax base, enabling resilience and fair contribution within the MSA.
• A strong public mandate, reflecting resident and partner preferences for identity, coherence, and local empowerment.
Option 1 meets every one of the MHCLG criteria, not just on paper, but in practice. It supports national policy goals, aligns with how people live and work, and provides a credible, low-risk foundation for transformation. It is the option that delivers reform with consent, not disruption; a model that strengthens Mid Hampshire and contributes fully to the success of the wider Mayoral Strategic Authority.
Appendix 3:
Appendix 3: Option 2
Introduction
Simple, balanced and locally supported. Option 2 delivers a coherent and balanced set of authorities for the mainland. It has strong local identity and does not require any boundary changes, thus ensuring it is simpler to implement, while configured to better deliver services and ensure devolved power with a community focus.
This proposal creates four new mainland councils built around sensible, proportionate, place-based geographies.
The proposed unitary configuration balances shared local identity and existing service, economic and transport links. Each council is designed to deliver effective leadership, streamlined services and improved accountability, while remaining recognisably local and at a scale that is manageable and effective.
How is this option different
Option 2 differs from Option 1 in one respect: New Forest district forms part of the South West Hampshire unitary instead being located in the Mid Hampshire unitary.
It differs from Option 1A in in that there are no boundary changes or splitting of existing district building blocks when the new authorities are established (we remain open to boundary adjustments at a later stage via Principal Authority Boundary Review).
The Isle of Wight unitary, the North Hampshire unitary and the South East Hampshire unitary are unchanged between Option 1 and Option 2 and the benefits in these regions remain as set out in the main document.
Option 2 also offers substantially similar features to Option 1 in terms of a balanced population and viable financial assessment for example but enables a more balanced approach to geography and tax base across the whole geography.
This is coupled with the benefits in Option 1A of having the New Forest waterside area in the South West unitary – while continuing to ensure a strong and sustainable Mid Hampshire authority.
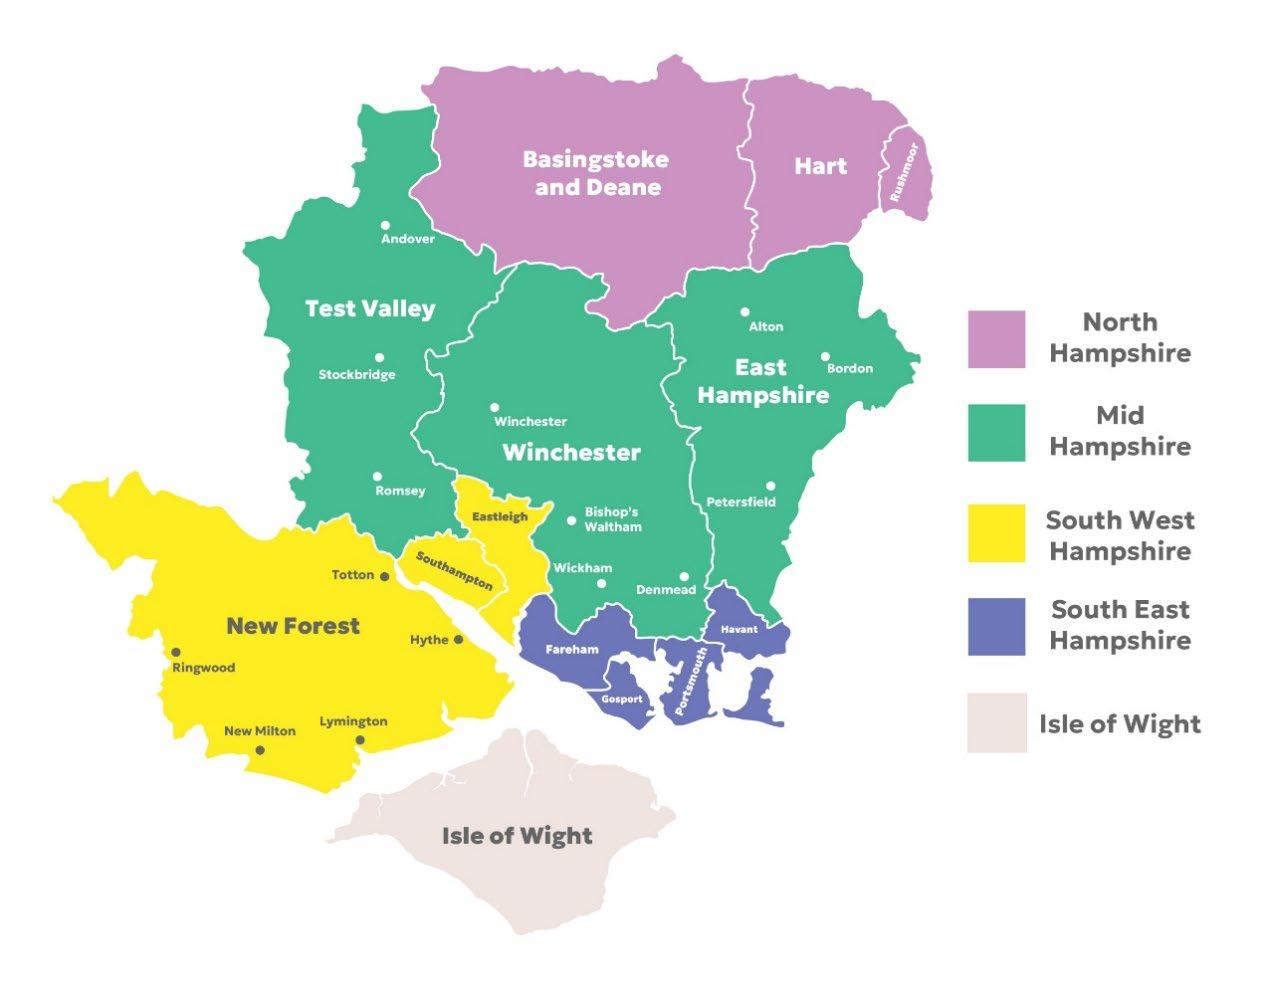
The image below shows the proposed geography of unitary councils in Option 2.
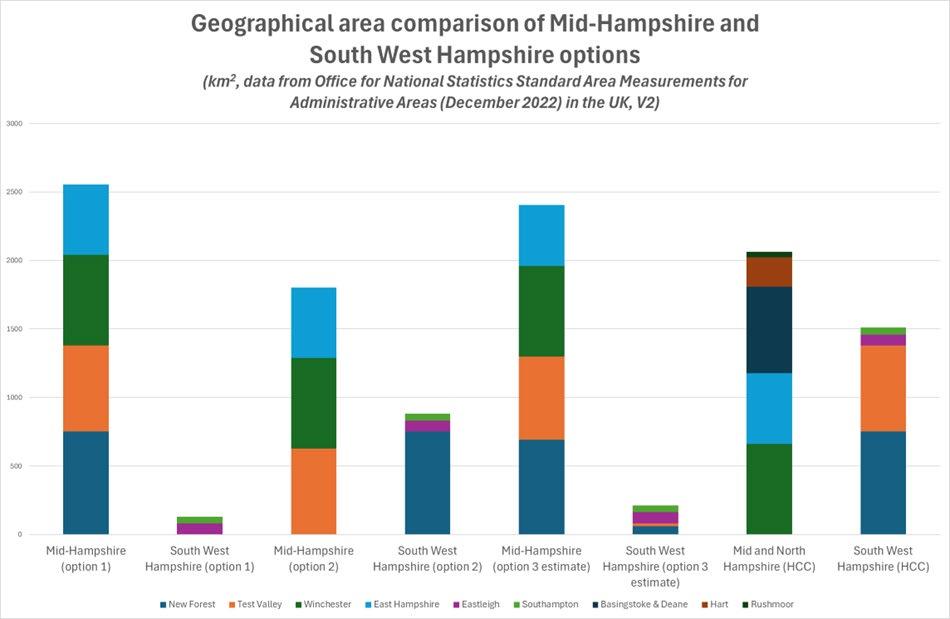
The key additional benefit of Option 2 is that it offers the most balanced geographical unitary configuration for Hampshire and the Isle of Wight. It creates four new mainland unitaries of similar size and scale, avoiding the risk of excessively large geographies or constraining the county’s largest settlement, Southampton, in the smallest unitary.
Option 2
The chart below shows that under Option 2, Mid Hampshire is only twice as large as South West Hampshire, rather than 20 times larger as in Option 1.
Creating a coastal economic powerhouse
As well as being the most geographically balanced, Option 2 also offers substantial economic benefits to the South West Hampshire Unitary. Including the New Forest and its waterside area in the proposed South West Hampshire unitary offers a strategic opportunity to
align governance with the region’s real-world economic and social dynamics. The area has strong industrial and maritime links with Southampton, including major employers like the Fawley oil refinery and significant commuting flows to Southampton and Eastleigh. By integrating this area into a single authority, the proposal supports more coherent planning across transport, housing, and infrastructure, enabling better service delivery and sustainable growth.
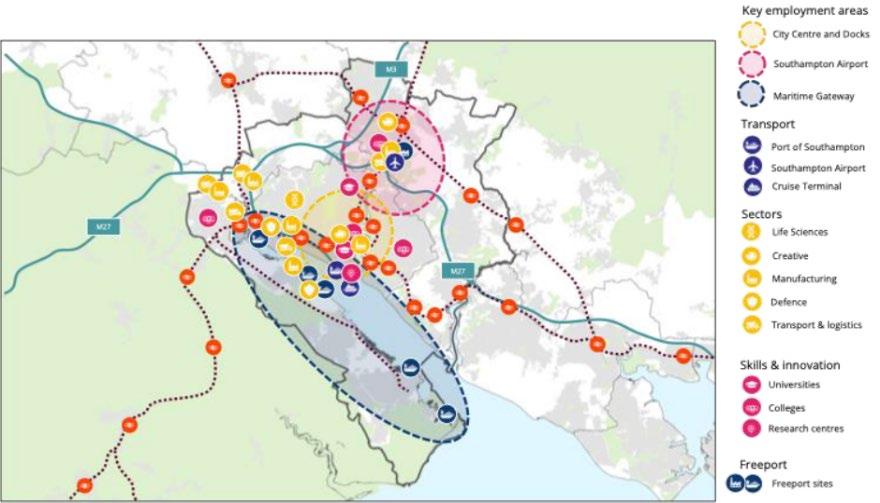
This unified approach would also bring together key economic assets, such as Southampton city centre, the docks, Southampton Airport, and Freeport investment zones, under one governance structure. This would streamline investment decisions, enhance coordination of skills and innovation strategies, and strengthen the region’s ability to attract funding. Overall, the proposal aims to unlock the full potential of the Solent corridor and establish the South West as a coastal economic powerhouse.
Strong coherent and effective central authority for Mid Hampshire
Creating a Mid Hampshire authority from the area of Test Valley, Winchester and East Hampshire avoids the challenges and associated costs of service delivery that comes with excessive geographic size while bringing together authorities and services with similar challenges, demography and experience of delivery in a mixed rural area. It integrates communities which self-identify as rural around the principal settlements of Andover, Winchester, Romsey, Petersfield and Alton – and their associated market towns and villages – with an economy and housing market defined by professional services, technology, creative enterprises, tourism – combined with a continuously developing rural economy and a strong commitment to sustainability.
The net effect is a Mid Hampshire Unitary that is well-placed to transform and localise its services and ensure that its residents and businesses achieve maximum benefit from local government reorganisation in an effective unitary geography for the Mayoral Combined Authority.
Practical to deliver
Option 2 is practical to deliver, being constructed using existing district boundaries, with each new unitary clustered around the main settlements. This places likely service bases at the geographic centre, bringing services nearer to local people and improving access for vulnerable residents who may depend on being closer to support. Natural pyramids of schools will be retained, trust built between schools and community and the new council maintained effectively supporting those with special educational needs.
Although existing district boundaries will only ever be an approximation, there is good evidence to suggest that Option 2 offers the best approximation to the functional economic areas of Mid Hampshire and South West Hampshire, with New Forest being more closely
aligned with Southampton than Winchester. A number of other public services already operate on similar geographies, such as the criminal justice system, with the magistrate’s court in Southampton covering Eastleigh and New Forest, and the crown court in Winchester covering the whole county.
Support for this option
• Respondents to a geography wide and local engagement exercise showed clear resistance to large, remote council models. Option 2 delivers the approach that best avoids this risk and is the only one delivering four mainland unitaries which are all geographically smaller than those proposed by Hampshire County Council.
• Although East Hampshire District Council withdrew from this proposal, the design of Option 2 has been mindful of the needs of the communities in East Hampshire as far as possible. It has been informed by the public engagement exercise undertaken, to which over 200 East Hampshire residents responded.
• Feedback prioritised local identity, access to decision-making, and visible leadership.
• Winchester City Council will make a decision as to its preferred option at its Council meeting on 25 September.
• Eastleigh Borough Council will make a decision as to its preferred option at its Council meeting on 25 September.
Leader’s endorsement
Winchester strongly shares with the other councils the desire to create new unitary councils for our region that are close enough to be local and big enough to stay strong.
This four new mainland and Isle of Wight unitary option delivers this and is:
• simpler to implement
• geographically and economically coherent and balanced
• creates strong councils that will deliver.
In this option, all five councils are constructed from existing district and unitary footprints without any boundary changes and all five councils make sense in their own right.
Our region's two great ports partner with their neighbours to create strong councils in the South East and the South West.
This proposal creates a coherent - and manageably sized – Mid Hampshire authority with its focus on the rural economy and professional services.
As with all other options, it supports a Northern council connecting together the high-tech industries of the M3 corridor and enabling close connection with similar economies in Surrey and Berkshire.
Finally, the unique and special nature of the Isle of Wight is reflected the continuation of its own separate council.
This option is right for Hampshire and the Isle of Wight, and all the councils created are coherent and make sense for the future.
Cllr Martin Tod – Leader of Winchester City Council
Who supports the option?
Winchester City Council
Assessment against MHCLG criteria
Criteria one: A proposal should seek to achieve for the whole of the area concerned the establishment of a single tier of local government.
Proposals should be for sensible economic areas, with an appropriate tax base which does not create an undue advantage or disadvantage for one part of the area.
Financially sustainable
Option 2 has the same financial benefits that have been demonstrated in the core case for change. The four new mainland and Isle of Wight unitary model in this variant continues to offer a streamlined governance model and opportunities to redesign and transform services to achieve significant efficiencies and savings through a place focused approach. The main case for change document quantifies the financial impact of the reorganisation model and demonstrates financial viability. It also demonstrates that Option 2 enables councils to pay back within 3 years, delivering annual savings of £63.8 million.
Specifically, Option 2 offers the most balanced financial position (based on current data and financial positions) across the mainland authorities.
The table above shows combined business rates and council tax per capita and proportion of NRE funded by business rates and council tax position for Option 2.
Economic alignment
Option 2 aligns the new council areas to reflect the functional economic areas and travel-to -work zones.
Hampshire County Council’s Economic Intelligence Reports show a very strong relationship between Southampton, New Forest and Eastleigh in particular (shown in the figures above).
The same data for Test Valley, New Forest District’s only neighbouring authority other than Southampton, indicates a stronger commuting relationship with Wiltshire, Winchester, Eastleigh and Southampton than with New Forest.
As such, the key transport data confirms that the best approximation of sensible economic geographies using existing district boundaries is to bring New Forest into the same unitary area as Southampton and Eastleigh, but to leave Test Valley in Mid Hampshire, as is done under Option 2.
The images above show the New Forest and Southampton 2011 commuter flows. It is noted that post pandemic hybrid working may have reduced the absolute numbers commuting but there is no data to suggest the work orientation between the New Forest to Southampton and Eastleigh has changed.
Economic sectors
As set out in the introduction, the Port of Southampton is a critical piece of national / international infrastructure, and the opportunities for growth spread across both sides of Southampton Water. The Port and marine-related industries extend across Southampton and the New Forest, including Solent Gateway / Marchwood Military port, Fawley refinery and the land identified in the Port Masterplan for expansion at Dibden Bay. The Solent Freeport has its centre of gravity around Southampton Water, with key sites in New Forest, Southampton and Eastleigh.
There is a clear link between the largely urban Waterside and Southampton in economic, labour force and transport terms, but Option 2 reflects that wider rural area of New Forest also provides an attractive residential environment for many who work in the Waterside, Southampton and Eastleigh areas, contributing to the range of skills available to the city’s economy, while also providing a significant recreational resource for residents of more urban areas. There are strong socio - economic links between urban and rural areas, reflecting the fact that cities are interdependent with their hinterlands of towns and villages.
In more general terms, Southampton is clearly a sub -regional centre which is the economic, retail / leisure, cultural and transport hub for the wider area, urban and rural. Geographically, all parts of the New Forest are closer to this hub than to any other hubs within Hampshire, such as Winchester.
Proposals should be for a sensible geography which will help to increase housing supply and meet local needs.
Alignment to Housing Market Areas
The government has defined official local housing market areas (these date from 2010 but are still in use). The final report recommended the use of map 6 on page 25, which clearly shows the Southampton housing market area stretching across most of the rural New Forest.
Effective blending of urban and rural within unitary councils
The existing New Forest district benefits from a mix of rural national park and urban-fringe, industrially developed areas. This blend would be extended in Option 2, combining the current New Forest district with the predominantly urban and suburban areas of Eastleigh and Southampton. This avoids arbitrary urban/rural segregation and supports the mix of existing urban areas, market towns and parishes.
In planning terms, while rural New Forest is a very different type of area to Southampton, under Option 2 the National Park Authority would still undertake its local planning function, providing a continued focus for addressing the unique planning issues faced by rural areas. The National Park Authority would work closely with the wider unitary, with the new council providing the economic / housing / transport functions across the area, aligned to the direction provided by the mayoral strategic authority.
Housing Delivery Targets
Option 2 supports delivery of much-needed housing supply across the whole of the Hampshire and Solent area by balancing housing targets across the new unitary councils. Option 2 avoids having two National Parks in one single unitary authority (as in Option 1), which would create pressure on the amount of available land for development, thus threatening capability of the new unitary council to successfully deliver housing growth.
Criteria two: Unitary local government must be the right size to achieve efficiencies, improve capacity and withstand financial shocks.
Efficiencies should be identified to help improve councils’ finances and make sure that council taxpayers are getting the best possible value for their money.
Option 2 has a more balanced geographical areas than Option 1 – therefore promoting greater agility and responsiveness and benefits of existing partnership working can be leveraged. Asset rationalisation in Option 2 is more deliverable due to moderate travel distances, offering a range of council hubs across the area in principal towns at reasonable cost to the tax payer.
Similarly with no boundary change required, this configuration of councils can move forward without additional work to redefine service boundaries, allowing immediate progress on integration and the early realisation of the benefits of unitary status.
Established partnership working can be amplified at pace to reap efficiencies, building on a strong track record of collaboration.
Mid Hampshire Council: Test Valley, Winchester, East Hampshire
• Joint Planning approaches already in place (e.g. East Hampshire and SDNPA co -plan).
• Strong record of cross-border housing delivery: £12m funding secured jointly for affordable housing at the Winchester/Test Valley border.
• Shared geography for waste, leisure, countryside, and environmental services, including green space and depot planning.
• Opportunity to build on exiting, established shared services (such as the integrated IT service between TVBC and WCC) as well as historical shared service arrangements.
• Costs for large scale services such as waste can vary by up to 50% between urban and rural areas — geographic tailoring is essential for efficiency and can be best delivered by Option 2.
• And in addition, location of the New Forest with the South West council brings additional efficiency benefits.
South West Council: New Forest, Eastleigh, Southampton
• By including all of the New Forest, Option 2 ensures there are no areas at risk of geographical isolation from centralised services.
• Opportunity to place operational service hubs at the geographical centre of the new unitary, following the example of municipal waste from all three areas being disposed of at the Marchwood Energy Recovery Centre at the north end of the Waterside.
• Shared leisure partnerships with NHS and Active Partnerships across the footprint.
• Aligned ICS/health geography covering major hospital and community care services.
• All councils work together through Partnership for South Hampshire to deliver homes for the local South West housing market, while Eastleigh and Southampton have shared resources to deliver Local Plans for both authorities.
• Shared services between Eastleigh and Southampton include building control and licensing. Including all of the New Forest will add scale and resilience to these partnerships.
Criteria three: Unitary structures must prioritise the delivery of high quality and sustainable public services to citizens.
Proposals should show how new structures will improve local government and service delivery, and should avoid unnecessary fragmentation of services
Opportunities to deliver public service reform
A Balanced Model for Public Service Reform
Option 2 offers highly practical geographies for public services, bringing together the most balanced combination of councils and residents for the efficient delivery of coordinated services. Distances to access services in the four main service and economic hubs are lower in Option 2.
This is important for continuing effective delivery of social care services with the present Hampshire adult social care domiciliary care zoned contracts coordinated by contract relationship managers CRM. Those zones and CRM do not map onto Option 1, requiring fragmentation of existing contracts and management and threatening vital services for vulnerable people. Option 2 offers a geography that supports existing care contracts; whilst still positioning the unitary councils to transform care services as set out in the core document.
Children’s and Adults’ Social Care – Local Offer Examples
Delivering high- quality, sustainable care requires a deep understanding of the unique needs and dynamics of local communities. Smaller, place-based unitaries are better placed to:
• Tailor early intervention and safeguarding models around local schools and families.
• Build integrated health and care pathways with local NHS partners (e.g. Solent and Hampshire ICS geographies).
• Invest in trusted community hubs and voluntary sector partnerships. For example:
• Jointly commissioned local supported living schemes, enabling transitions from residential care for example Chesil Lodge in Winchester.
• Top quartile performance in Homelessness prevention working with the third and voluntary sector to support early discharge from HMP Winchester and support asylum applications.
• Stock holding experience in Winchester, and integrated care services supported by the social care authority to maximise ‘at home’ care packages.
This model ensures that the Mid Hampshire Authority in Option 2 can amplify current approaches that that reflects its population profile, geographies, and partner landscape. If unitary councils were to cover vast, disparate geographies, they risk losing touch with specific community needs, especially in social care.
Transport Links
Transport links for service delivery are more clearly defined for Option 2.
As can be seen from the image below, the main road network in the New Forest area forms a triangle pointing towards three large settlements outside the district: Salisbury in Wiltshire, Bournemouth in Dorset, and Southampton in Hampshire. This illustrates the critical economic and social links between the district and its neighbours in other counties.
From a Hampshire and Solent perspective, the district is primarily oriented towards Southampton, with onward traffic progressing to the rest of the county and beyond. All rail traffic through the New Forest also passes through Southampton.
Likewise, the transport links in the Mid Hampshire area are focussed around the M3, A34, A303, A31.
Criteria four: Proposals should show how councils in the area have sought to work together in coming to a view that meets local needs and is informed by local views.
From the geography wide engagement work, 54% of Winchester respondents and 51% of East Hampshire respondents favoured Option 2 - stating support or strong support for this configuration, compared to 29% and 24% supporting Option 1.
Only 20% and 17% of Winchester and East Hampshire respondents supported a boundary change option, with 60% and 51% against changing boundaries.
Option 2 was the second favoured preference for Test Valley residents at 31% support for this option, and there was a clear lack of support for boundary changes at 70% against this proposal.
Option 2 is felt to be a more manageable size of council, which respondents say is beneficial. Respondents expressed concern that services could become too stretched and decision making too far removed over a large geography. However, respondents said the merging of more rural councils would bring benefit.
In July 2025, a deliberative workshop was held with sample of residents across the Winchester district. A similar workshop was also held in Test Valley and a range of deliberative workshops took place in the New Forest.
In Test Valley, participants supported simplification and efficiency but emphasised the need for local decision-making and responsiveness. They valued the rural character and community spirit of their towns and villages.
This is similarly reflected in Winchester participant’s feedback who expressed a need for a connected joined up approach, efficient services, ensuring local voices are meaningfully heard and that services are designed and rooted in the local area, to best serve local communities.
Local identity and culture, and community spirit in their local area was highly valued. Winchester participants support a centralised and simplified approach as long as local needs were met and community voices were heard in decision making.
Through a range of qualitative methods, New Forest residents, including those in Waterside, expressed a strong Forest rooted local identity.
And across all areas concerns were raised that services may not be tailored specifically enough for local populations in larger councils.
Several of the local parish councils in Winchester affected by boundary changes also sought the views of their members and residents in respect of potential boundary changes and potential geographies and their views have been incorporated.
This option supports community feedback and alleviates concerns that councils which are spread over too large a geography to be able to respond to local needs and local identity. It also alleviates the concerns that have been expressed about boundary changes as this option is based on existing boundaries.
Criteria five: New unitary structures must support devolution arrangements.
Where no CA or CCA is already established or agreed then the proposal should set out how it will help unlock devolution.
Option 2 provides the best platform for successful devolution in Hampshire and the Isle of Wight:
• The five unitary authority model provides a stable platform for a pan-Hampshire devolution model.
• Option 2 presents the most equal balance of population and geography, ensuring fair representation for all at the strategic authority.
• With financial stability and maintenance of district boundaries in the Option 2 proposal there will be a stable set of partners for the elected Mayor from day 1.
• The two largest unitaries cover the two largest cities, enhancing the attractiveness of the area for investment in growth coupled with each new council large enough to participate in future Combined Authority arrangements.
Importantly Option 2 avoids the risk to growth posed by a very large rural unitary or the county’s biggest settlement being constrained in a small unitary without sufficient additional land capacity.
Criteria six: New unitary structures should enable stronger community engagement and deliver genuine opportunity for neighbourhood empowerment.
Local representation at a community level is of critical importance. There are 49 town and parish councils in the Option 2 South West unitary and 144 in the Mid Hampshire unitary. This enables ready and effective community engagement at the most local level.
Option 1 would lead to 181 town and parish councils in the Mid Hampshire and only 12 in the South West Unitary comprising Eastleigh and Southampton. Neighbourhood and community engagement is the bedrock of the new unitary councils, therefore a more even split of towns and parish councils to best resource support and share expertise and experience is preferable.
of Parish Councils:
Cultural factors that tend to support Option 2 include features of daily life such as the geographies served by the Southern Daily Echo, which lists the New Forest as one of its districts, and the Hampshire Chronicle, which lists Winchester, Romsey and Hampshire
Public sentiment through a geography wide and local engagement exercise showed clear resistance to large, remote council models.
Respondents prefer governance structures that retain local identity and clarity of purpose. This option avoids the creation of excessively large, remote unitaries and instead offers a more balanced population split across councils, making them more relatable and connected to the communities they serve.
Option 2 delivers the approach that best avoids this risk and is the only one delivering four new mainland unitaries which are all geographically smaller than those proposed by Hampshire County Council.
Option 2 enables each unitary to develop a single corporate plan shaped by local priorities and grounded in neighbourhood knowledge. This is particularly important in services like social care, housing, leisure, and public health, where local understanding, true connection and familiarity with communities allows for more targeted and responsive delivery in local place based on community needs and aspirations.
Locally focused councils are better equipped to:
• Integrate services with local NHS and VCS partners.
• Build trust through consistent presence and familiarity.
• Tailor their strategies to reflect coastal, urban, or rural needs.
In this way, community engagement and neighbourhood empowerment are not simply principles, but daily practices embedded in the design of this proposed structure.
For social care, this is vital: priorities for early years, SEND or elder care differ widely between coastal, rural and urban places. Locally rooted services for families, carers and vulnerable adults reinforce trust in the authority, increasing engagement with formal structures such as area boards and participatory budgeting with effective engagement with pyramids of schools.
Feedback prioritised local identity, access to decision-making, and visible leadership. This model delivers meaningful community engagement not as an afterthought, but as a central design principle. By keeping councils recognisable, place-based, and locally scaled, it empowers residents to participate, influence, and shape the places they live.
Conclusion: Option 2 offers the strongest path forward
Option 2 delivers a coherent and balanced set of authorities for the mainland. It has strong local identity and does not require any boundary changes, thus it is simpler to implement; is configured to better deliver services; and ensures devolved power with a community focus.
This proposal creates four new mainland councils built around sensible, proportionate, place-based geographies. With the unitary configuration balancing shared local identity and existing service, economic and transport links.
• Balanced geography and population across new mainland authorities.
• Practical to deliver, with no boundary change and close proximity to services.
• Continuity and efficiency in public service delivery, with practical geographies, building on strong cross-sector partnerships already in place across health, housing, environment, and community services.
• Focused on natural economic areas, good local connectivity and ability to focus housing delivery on a natural local market
• Balanced tax base, with a financial assessment as good as the other options, enabling resilience and fair contribution within the MCA.
• A varied and natural local community, with a vibrant combination of urban, suburban and rural areas and many shared cultural and economic interests.
Appendix 4:
Appendix 4: Option 1A - modification request
Building coastal powerhouses - rooted in community, powered by partnership, driving local and regional prosperity
Introduction
The creation of a new unitary authority across the proposed boundaries is more than an administrative change; in the view of the cities, and their urban hinterlands, it is a chance to align places which are already intrinsically connected into a functional geography. This will allow for a strategic and integrated approach to addressing long-standing challenges and enable better services to support communities from Hythe to Eastleigh and Clanfield to Fareham. By integrating places that we believe are already economically and socially linked, this amended boundary option provides a platform to attract investment, deliver infrastructure more effectively, and plan services that reflect the realities of how communities live and the services they access.
How is this option different?
This appendix (Option 1A) is based on our proposal for Option 1 but requests a modification based on a few select boundary changes. This submission is conditional upon this modification being approved by the Secretary of State using the modification powers under the 2007 Act as this represents the stronger case for change. In the view of the Local Authorities that support this option, these boundary changes better meet government criteria, drive economic growth, create unitary authorities that reflect and serve cohesive communities, and realise the full potential of local government reorganisation.
Option 1A uses the district building blocks of Option 1 but with some, critical boundary changes to create stronger, more balanced unitary authorities that are set up to drive economic growth across the region.
The Isle of Wight and North Hampshire remain the same in all three options as supported by the rationale outlined in the core document.
Unamended Option 1 proposes:
While Option 1 meets the government criteria, unamended we believe it misses the opportunity for the new authorities to fully drive economic growth. The option 1A proposed geography concentrates high-value sectors that already characterise the local economy and have the capability to thrive but would require the requested boundary modifications to maximise potential. An analysis of Location Quotients (LQs) for Gross Value Added (GVA), business counts and employment demonstrates well- established local specialisms that outperform national averages. These specialisms align directly with the priority sectors identified in the UK’s Modern Industrial Strategy, which focuses on areas with the greatest potential to enhance productivity and deliver sustainable, long-term growth.
In addition, Option 1A supports the creation of new unitaries with balanced populations across the mainland which will support devolution governance and improve the financial stability of the new city based unitaries by improving the equity of council tax and business rate bases.
While the proposed Mid-Hampshire council brings together similar rural communities, there are notable exceptions to this, with communities included that have more in common with the urban areas around the cities of Southampton and Portsmouth.
With a small number of specific boundary changes, the imbalance in proposed unitary populations across the region can be addressed, aligning communities existing natural linkages to the south coast’s urban hubs.
Option 1A proposes:
In the view of the cities and their urban hinterlands, there is a compelling case for some select boundary changes as detailed below.
Option 1A recommends the following select boundary changes from the Option 1 proposal:
• Move the parishes of Totton and Eling, Marchwood, Hythe and Dibden, Fawley (currently under the New Forest District Council) and Chilworth, Nursling & Rownhams and Valley Park (currently under Test Valley Borough Council) to the proposed South West unitary.
• Move the parishes of Newlands (currently under Winchester City Council), Clanfield, Horndean and Rowlands Castle (currently under East Hampshire District Council) to the proposed South East unitary.
In making these suggested boundary changes, Option 1A establishes two dynamic new unitary authorities along the south coast designed to unlock growth, strengthen local leadership, and better reflect the way people live, work, and travel today. The carefully considered boundary changes are minimal yet meaningful, aligning with real communities and economic geographies rather than outdated historic lines. This is a forward looking, growth- oriented plan that builds stronger, more resilient councils better equipped to tackle future challenges and seize new opportunities with confidence.
The Option 1A proposed South West unitary boundary brings together Southampton, Eastleigh, the Waterside parishes of the New Forest as well as two parishes from Test Valley. This unifies the county’s main trading gateways, key transport arteries, docks and industrial and related infrastructure both sides of Southampton Water.
The Option 1A proposed boundary for the South East unitary option brings together Portsmouth, Havant, Gosport, Fareham and adjacent parishes currently in the districts of Winchester and East Hampshire, but where the clear economic and social centres of gravity for those areas are the city regions, rather than those areas where the characteristics are more obviously rural.
We believe that communities in the parishes that would become part of the new unitary authorities would benefit from remaining with their aligned urban centres, with much more common community interests reflecting where they live their lives, rather than being part of a new large rural authority.
“The creation of new unitary authorities on these proposed boundaries is more than an administrative change; it is a change to bring together a coherent economic area, remove long-standing barriers to growth, and enable better services. It is sensible to integrate places that are already economically and socially linked, and this proposal provides a platform to drive investment across existing city regions, deliver infrastructure more effectively, and plan services that reflect real-life’’
Who supports the option?
Eastleigh Borough Council
Fareham Borough Council
Hart District Council
Havant Borough Council
Portsmouth City Council
Rushmoor Borough Council
Southampton City Council
Key reasons for support
Driving growth through bold reform: a vision for our region’s future
Economic growth is central to the government’s national vision, and it is equally central to our vision for the future of our county. This proposal sets out what we believe to be the most effective local government arrangements to unlock and accelerate economic and housing growth across our region. Option 1A’s strategic vision for city-region growth clearly meets the threshold set by Government for changes to administrative boundaries.
Southampton and Portsmouth are the beating hearts of our regional economy, historic cities with thriving communities and dynamic industries. Building on their strengths, our proposal for Option 1A outlines the creation of two new coastal powerhouse unitary councils. These councils will be rooted in economically and demographically connected communities, supported by a small number of targeted boundary changes to ensure coherence and impact.
We believe Option 1A is the preferred boundary configuration to deliver councils which:
• Deliver services across a geography that reflects practical realities of local people.
• Have balanced populations and council tax distribution.
• Are designed to deliver economic and housing growth.
This option reflects the real-world patterns of how people live, travel, and work today (not how they did when the current boundaries were drawn in 1972), and aligns with the existing economic footprint of our communities. The split between rural and primarily urban areas reflects the differing priorities and challenges for each. It is a pragmatic yet ambitious approach that supports both local identity and regional prosperity.
Option 1A also represents the most balanced in terms of population numbers, council tax base and business rates per capita across the county. This will ensure new unitaries are set up to succeed with sustainable finances to build from.
We acknowledge the complexities involved in altering existing district boundaries. However, we firmly believe that these changes are essential to unlock the full potential of our region that can better support the new Mayoral County Combined Authority for Hampshire and the Isle of Wight.
How this proposal meets government LGR criteria
Criteria one: A proposal should seek to achieve for the whole of the area concerned the establishment of a single tier of local government.
Option 1A proposes four new unitary areas on the mainland plus the Isle of Wight remaining as an independent council:
1. South West: Southampton, Eastleigh and the Parishes of Totton and Eling, Marchwood, Hythe and Dibden, Fawley (New Forest) and Chilworth, Nursling & Rownhams and Valley Park (Test Valley).
2. S outh East: Portsmouth, Gosport, Fareham, Havant, and the Parishes of Newlands, Clanfield, Horndean and Rowlands Castle.
3. North Hampshire: Basingstoke and Deane, Rushmoor and Hart.
4. Mid Hampshire: Winchester, Test Valley and the New Forest, excluding the Parishes specified above.
5. Isle of Wight
This proposal reflects how the community and demographic geography of our area has changed since the current councils were established in the 1970s. For example, the growth of Southampton, Hedge End, Chandler’s Ford, Totton and other settlements has meant more people in the surrounding areas developing close links with the city, whether through work, leisure, shopping, education or accessing local services. The same is true for the area around Portsmouth where the investment in local transport and highways infrastructure over the last 50 years has led to new developments, across the wider area, which are better linked to the urban centre of Portsmouth. As a result, many of the communities in our proposal already have a close relationship with the cities and have similar challenges and ambitions for the area.
South West Unitary
In addition to Southampton and Eastleigh, this proposal includes wards from both the Waterside area of the New Forest, and the lower Test Valley area.
To the West, the A326 forms a clear physical boundary between Totton and Waterside and the rest of the New Forest. An economic study commissioned by New Forest District Council sets out that the New Forest economy can be sub - divided into three sub -areas, Totton and Waterside, Core Forest and Coastal Towns and Avon Valley. Totton and Waterside is the smallest area of the forest geographically, but also the largest by population reflecting its significantly higher population density.
The Waterside is also the most industrialised part of the current district, hosting manufacturing and marine activities in Totton and Hythe and the Fawley oil refinery which is a major industrial employer. As such, the area has strong economic ties to Southampton through industrial and maritime industry either side of Southampton Water, and significant out- commuting from the area, primarily to Southampton and Eastleigh to the east and Dorset authorities in the west. The area’s economic profile is more reflective of the more urban area within the South West unitary, compared with the more rural makeup of the wider New Forest and proposed Mid Hampshire unitary.
To the north, the M27 marks a significant physical boundary for the proposed South West unitary. On a practical level, the urban areas of Rownhams and Nursling are directly connected to the Southampton city urban geography. Similarly, the Valley Park Parish is a continuation of the Chandler’s Ford urban area. While much of the population Chilworth is part of the Southampton urban area, the rest of the existing Chilworth, Nursling & Rownhams Parish also has close links.
South East Unitary
Parishes of East Hampshire proposed for inclusion in the South East unitary are those which lay south of the Butser Hill nature reserve, with all three parishes part of the continued urban geography along the A3(M) / A3 corridor.
The Parish of Newlands, currently located in Winchester, identifies strongly with Waterlooville as the closest town area, and serves two relatively new development areas with a strong connection to Waterlooville. Growth has meant that Newlands is a physical continuation of the Waterlooville area, giving a strong argument for bringing this Parish into the new South East unitary to ensure the local authority structure is harmonious and respects the local identity of those residents based around the Waterlooville area. Newlands Parish Council has stated that it is important that for any future unitary authority they should be in the same new authority as Havant Borough Council because of their natural links to Waterlooville.
The Parishes areas south of Butser Hill that have been proposed to be included in the new South East unitary authority align closely with the Portsmouth and South East Hampshire area. This is true for housing market area, for travel to work, for accessing major retail centres, accessing the health economy, education or the leisure and cultural offer. The characteristics of the area are much more similar to urban South East Hampshire than they are to the rural Mid Hampshire linked by the railway line and the A3(M) / A3 corridor.
Criteria two: Unitary local government must be the right size to achieve efficiencies, improve capacity and withstand financial shocks.
A more equitable distribution of population across new council areas is an integral element of ensuring financial sustainability of new unitaries and relative parity of representation both locally and on the new Mayoral Combined County Authority (MCCA).
Excluding the proposed North Hampshire unitary as it is the same across all options, the Option 1A proposal offers the smallest population differences between the three remaining councils and aligns most closely with the government’s stated criteria of councils of around 500,000.
The table below shows the population projections for proposed unitary councils for the three options.
Creating unitaries with greater population parity also increases financial stability across the region by creating more equal tax bases and opportunities for economies of scale.
Analysis of council tax projections identifies Option 1A as the most balanced with the lowest variance between the council tax bases of the proposed unitaries. Similarly, Option 1A is projected to have the smallest difference in average band D council tax.
Together this means Option 1A provides the most equal council tax rates for local residents, and the most equal council tax base for each new council.
The same is true for business rates, with business rates funding per capita projected to be the most equal in Option 1A .
Criteria three: Unitary structures must prioritise the delivery of high quality and sustainable public services to citizens.
This proposal builds on the principles and detail of public service delivery set out in the main business case. As existing unitary councils both Southampton and Portsmouth City Councils’ have the experience of the delivering the full range of high quality and sustainable public services. Underpinning both the existing councils is a commitment to driving local economic growth, not just to provide new skills, employment and housing for residents, but also to contribute to the financial sustainability of the cities and councils.
The proposed South West and South East unitaries are built on geographies with clear economic and social links with the existing cities and are designed to drive financial sustainability better able to withstand financial shocks.
South West
The South West unitary geography offers a strategically located, high-performing economic hub, uniquely positioned to drive growth across the wider region, while balancing the distinct needs of communities across the area. It benefits from a series of competitive advantages:
• Europe’s busiest cruise port and the UK’s second-largest container port.
• A maritime sector with 1.8 times the national average job concentration.
• An emerging life sciences hub centred around University Hospital Southampton.
• A coastal-industrial corridor delivering energy, advanced manufacturing, and green innovation.
• Access to two universities and a range of specialist training providers, underpinning a skilled workforce and innovation ecosystem. The proposed South West boundary brings together several strategic economic nodes under one authority. These nodes are currently split across administrative lines in Southampton, Eastleigh and the New Forest, limiting their impact and complicating investment and planning decisions. These include:
• City Centre & Docks
Southampton’s docks are the UK’s leading port for cruise and container freight, contributing over £2.5bn GVA annually to the UK economy. They support around 45,600 jobs nationwide, including significant supply- chain impacts in the West Midlands automotive sector. Bringing the port and its hinterland into one governance structure will unlock new efficiencies and growth.
• Southampton Airport
A key regional gateway and growth zone, the airport contributes £96m GVA and supports 1,390 jobs (2023). Its direct link to the Navigator Quarter Freeport site means improved coordination could unlock thousands of new jobs and millions in retained business rates.
• Maritime Gateway
Anchored by the Solent Freeport, this hub drives 26,000 jobs and £2bn into the local economy, with significant spillover benefits nationally. Over £1.35bn in private investment has already been committed, with plans to double cruise traffic to 4 million passengers by 2030. Importantly, the Freeport’s footprint spans across the proposed geography; bringing these sites under a single unitary would resolve fragmented oversight, enabling a more joined-up approach to planning and delivery of innovation corridors and infrastructure.
The image above shows the key employment areas, assets and transport infrastructure across the Option 1A geography.
South East
The proposed boundary for the South East option brings together Portsmouth, Havant, Gosport, Fareham and adjacent Parishes currently in the districts of Winchester and East Hampshire, but where the clear economic and social centres of gravity for those areas are the city regions, rather than those areas where the characteristics are more obviously rural. The key benefits for the South East arrangements anchored around the Portsmouth region are:
• Bringing together a strong functioning economic cluster, and associated travel to work area.
• Following the natural geography of the region, linking those areas south of Butser Hill.
• Creating a region with opportunities for growth.
• Following the transport infrastructure corridors associated with the A3(M) / A3.
• Creating a cohesive area for local communities, linked in with provision of services including health services.
• Reflecting education catchment areas including for example the University Technical College and also with significant access to the University of Portsmouth.
The proposal reflects the extent to which Portsmouth functions as the engine-room of the local area with people in the surrounding areas developing close links with the city - whether through work, leisure, shopping, education or accessing local services. As a result,
many of the communities in our proposal already have a close relationship with the city and have similar challenges and wishes for the area.
Delivering high- quality public services in the South West and South East
Both the proposed South West and South East unitaries incorporate an existing unitary authority (Southampton City Council and Portsmouth City Council) with experience of delivering adult social care, children’s services and planning for changes in population and demand. Southampton and Portsmouth Children’s Services were both rated 'Good' by Ofsted in 2023. This experience will be directly transferable to the new unitaries, building on strong foundations to establish new services tailored to the needs of their communities.
Health
Across the region there are significant health inequalities, driven by similar determinants including poverty and deprivation. There is good evidence that residents in the proposed footprints already look to the major cities to access many public services, including the NHS. For example, analysis by the Office for Health Improvement and Disparities (OHID) (data from 2020) shows that in the South East unitary area, 84-88% of patients in proposed additional wards attend Portsmouth Hospitals NHS Trust. This compares to 70% for the MSOA immediately to the north, 39% for the parish to the west, and 24% for the MSOA bordering to the east.
In the South West the same data suggests over 90% of patients in all of the Test Valley and New Forest wards proposed for inclusion in the new unitary attended the University Hospital Southampton NHS Trust, with lower levels in wards outside of the new proposed unitary boundary.
The two images above show the NHS Acute (hospital) Trust catchment populations – Office for Health Improvement and Disparities (OHID).
Education
Close relationships between the areas also exist in further and Higher Education provision. For example, 31.5% of 16 or 17 year-olds living in Southampton currently in education, employment or training are studying at a college outside the city but within the proposed South West proposed unitary, and these young people are using well established public transport links to do so. The link between the proposed geographies and existing service use demonstrates how people in proposed additional wards already access services within the new unitary boundaries.
The closest Further Education College for students from the three East Hampshire Wards and Newlands are the two southern campuses of the Havant and South Downs Colleges which also have high student numbers from the rest of the South East Unitary area.
Travel
While new unitaries will seek to provide services close to communities, the availability of strong transport links across the proposed South East and South West unitary footprints, ensures residents are able to access services across the proposed unitaries. Strong travel to work patterns also drives economic and employment growth.
For example, in the South West, the existing bus network links all the proposed South West area configuration as shown below. Travel to work data also highlights close transport connectivity across the proposed South West unitary footprint.
The 2021 Census shows that 62.7% of people who commuted into Southampton travelled from the New Forest, Eastleigh, or Test Valley, reflecting close economic geography and location of jobs. While based on 2011 census data, the map below shows that there is a higher concentration of people from the relevant Waterside and Test Valley parishes travelling into Southampton than from the wider districts.
The images above show the travel to work patterns in Southampton, Map of existing bus network in South West covering all of the proposed new unitary area.
The image above shows travel to work patterns in Southampton.
Similarly in the South East, overall patronage on routes bus routes (Portsmouth - Wecock Farm) and 8 (Portsmouth - Clanfield) linking the city with parishes proposed for inclusion in the new unitary, is in the order of 100,000 journeys per month (+/- 10-15k per month depending on seasonal demand etc) on each route, equating to around 200k journeys per month combined. Those originating at the far end of the route and travelling into Portsmouth is estimated to be 5-10% of this total, equating to around 20k journeys.
From the 2021 census that looked at the issue, we can also see that the typical daily commute flows (outbound journeys only, i.e. starting from census zones in the fringes of Waterlooville) to Portsmouth itself, and to the wider areas of Havant, Fareham & Gosport are around half of all journeys made.
The map below illustrates the largest overall travel flows and highlights significant travel demand from areas proposed for inclusion in the South East unitary. For example, there are an estimated 1,000-2,000 trips a day from Horndean/Cowplain to northern Portsmouth
and 400-600 highway trips a day from the Clanfield area. These areas also have higher interaction with central Havant and Waterlooville, which in turn have significant interaction with Portsmouth.
The image below shows a map of trip matrix from Solent Sub Regional Transport Model (Solent Transport).
Criteria four: Proposals should show how councils in the area have sought to work together in coming to a view that meets local needs and is informed by local views.
The engagement activities outlined in criteria four of the core document outline the breadth of activity that that has been undertaken across the South East and the South West to date, recognising there is more to be done as we move forwards to understand and address concerns from across our communities and to articulate the benefits of the new unitary structures.
A survey that was undertaken on behalf of 12 of the region’s authorities gave residents across the region the opportunity to share their views on LGR options. The overall response rate was <1% and from a relatively narrow demographic, and while the survey showed that
Option 1A was the least supported, it also highlighted that it was the least well understood. Whilst there was a higher response rate in New Forest and Test Valley, these were still low percentages of the population (c2%) and may have been impacted by the concurrent publicity campaign against the option.
It is also worth noting, that whilst the sample size was small, that more respondents from Newlands parish in Winchester supported than opposed the boundary change option.
The survey showed residents in the parishes that would be impacted by boundary change were concerned about losing their rural character, increased urbanisation, and reduced influence over decisions. These concerns are something that would need to be more clearly understood and addressed as we move forward.
Residents felt there were:
Positives around
Aligning more urban areas with Southampton/Portsmouth, which may mean better service delivery for those areas.
Better reflecting reality for those who live in those areas and linking them to where they access services.
Those living in semi-urban areas being served by a council that better reflects their needs.
Negatives around
Disruption to those living in the affected areas.
Fragmenting existing communities. Particularly when it comes to separating the New Forest from the Waterside, which is seen as integral to the identity of the area.
Residents in affected areas losing local representation and influence in decision-making.
Criteria five: New unitary structures must support devolution arrangements.
The balanced population spread across the unitary authorities as proposed in this option helps ensure a fairer representation within the Mayoral Combined County Authority (MCCA) by creating governance structures that reflect the true demographic and economic diversity of the region representing urban and rural communities. This balance avoids dominance by any single area and ensures more equitable decision-making power across the MCCA.
This proposal is rooted in the existing economic areas across the South East and South West Hampshire, building on functional economic areas and grouping places with shared characteristics.
By creating unitary authorities that are predominantly urban (such as those encompassing Southampton, Portsmouth, and Basingstoke) alongside more rural and town-focused areas like mid-Hampshire and the Isle of Wight, the MCCA can attract stronger and targeted investment. This approach reduces competition for funding within the region by aligning development priorities based on local needs and economic profiles. It also enables infrastructure decisions to reflect the diversity of the areas, for example, urban-focused investments where population density and economic activity are highest, alongside rural development initiatives that support sustainability and quality of life in less densely populated areas.
This balanced and cohesive approach supports the government’s devolution goals by fostering stronger local leadership capable of driving tailored economic growth and prosperity. The Solent region, comprising these unitary authorities, has a strategic growth ambition aligned with national growth priorities as set out in the UK Industrial Strategy and UK Invest, highlighting the area's potential to become a globally significant maritime and economic hub. Coordination across these authorities fosters a unified identity and capacity for innovation and investment, amplifying local voices in negotiations with national government and other stakeholders.
In summary, this population-balanced, economically coherent proposal underpins the principles of devolution by ensuring fair representation, boosting economic growth in key urban centres, supporting rural communities, optimising investment, and enabling infrastructure development that reflects local realities. This ultimately empowers the MCCA to deliver sustainable, equitable, and regionally tailored outcomes for all communities across the region.
Criteria six: New unitary structures should enable stronger community engagement and deliver genuine opportunity for neighbourhood empowerment.
Given the existing place -based links, a new unitary would be well placed to develop strong arrangements to involve and empower local neighbourhoods.
As demonstrated in the response to criteria three above, there are clear similarities and links between the communities in Southampton, Eastleigh, the Waterside and lower Test Valley wards as areas with significant urban characteristics. Bringing these communities together gives the opportunity to address similar challenges and opportunities.
While varying in form, there are strong examples of good practice community involvement and empowerment in the area which could be built on across the Option 1A footprint. In Eastleigh, Local Area Committees work closely with a wide range of community partners
including schools, colleges, community groups, youth partnerships and business groups to champion the local area, determine local levels of council services and deliver local community priorities.
Similarly, Hythe and Dibden, Totton and Eling, Marchwood, and Fawley all operate town or parish councils ensuring local voices and perspectives area heard in decision making. Our proposed unitary would create a meaningful democratic forum for the Waterside area, ensuring that local voices continue to be heard. Similar arrangements are in place in the parishes proposed as part of the new South East unitary.
We will build on these existing arrangements and design any new community involvement and empowerment arrangements with communities, respecting local identity, history and needs.
Any arrangements would be developed to meet the government’s neighbourhood governance ambitions as set out in the Devolution and Community Empowerment Bill and subsequent guidance.
Closing Statement
Option 1A presents a bold yet pragmatic vision for local government reform in Hampshire. It is one that reflects the realities of how communities live, work, and connect today. By aligning governance with functional economic geographies and travel-to -work patterns, this proposal offers a coherent framework for delivering sustainable public services, driving inclusive growth, and empowering local communities. It is a future-focused solution that balances ambition with practicality, ensuring that new unitary authorities are equipped to meet the challenges of tomorrow while staying rooted in the identities and needs of the people they serve.
Appendix 5:
Appendix 5: Financial technical appendices
Introduction
This section provides the comprehensive technical evidence base that underpins the financial analysis presented in earlier sections of the proposal. It consolidates all supporting data, calculations, and assumptions used in constructing the financial model for the assessed local government reorganisation options, ensuring that the analysis is both transparent and auditable. The content here has been developed in close collaboration with finance teams from each existing council, reflecting shared understanding of local data and a jointly agreed methodology.
The purpose of this section is to serve as the detailed reference layer that supports the narrative and conclusions reached in the main body of this document. Each appendix clearly documents its source data, allocation approach, assumptions, and any material judgement applied in the modelling process. This ensures a clear audit trail from base data through to headline findings.
To support clarity and usability, the section is structured into four technical appendices, each aligned with a core element of the financial analysis:
• Appendix A – Methodology and Assumption Log: Captures the overarching modelling approach, data sources, macro assumptions, and the engagement steps taken to validate inputs with local finance leads.
• Appendix B – Savings Assumptions: Sets out the savings estimates in full, including baseline costs, percentage reductions, and rationale by category, as well as the modelling behind the base and high scenarios.
• Appendix C – Implementation Cost Breakdown: Breaks down one- off transition and disaggregation costs by year and type, with cost drivers and any contingency assumptions clearly noted.
• Appendix D – Boundary Change Cost Breakdown: Breaks down the one- off Boundary Change cost with cost drivers and other assumptions clearly noted.
Each appendix is structured for ease of navigation and aligned to the relevant sections of the main report. Where appropriate, appendices are supplemented with footnotes, citations, and version tracking to ensure reproducibility and clarity for external reviewers, auditors, and government stakeholders.
This section acts as the technical foundation upon which the financial case is built. It allows readers, particularly finance professionals, Section 151 Officers, and programme sponsors, to interrogate the detail behind each modelling decision and to have confidence in the robustness, transparency, and evidential basis of the conclusions drawn.
Appendix A – Methodology and Assumption Log:
The phased model has been prepared in three sections – assumptions, calculations and outputs. The outputs include the calculation of payback period, individual year impact of LGR and a cumulative impact of LGR. These outputs help in assessing the viability of the LGR options being assessed.
The model is based on the following four key assumptions:
1. Savings costs
2. One- off implementation costs
3. Disaggregation costs
4. Boundary change costs (Option 1A only)
The phased model projects the above across thirteen years, including three pre-implementation years (Base Year, Year -1 and Shadow Year) and ten post-implementation years.
The model is, however, based on 2025/26 prices and does not include any adjustment for future inflation for both costs as well as savings. The phased model also does not include the impact of any Council Tax Harmonisation due to uncertainty of implementation.
The inputs as well as outputs have been prepared and validated with Section 151 officers. These reflect the best estimates as of the writing of this case.
Appendix B – Savings Assumptions:
The overall savings assumptions have been prepared using a mix of top down and bottom-up savings approaches, as outlined below.
Top - down approach:
The overall savings assumptions for the current reorganisation has been calculated based on the outlined savings of unitary authorities as outlined within previous local government reorganisation documentation. These included 14 previous cases for change across England ranging from cases submitted between 2009 and 2023. The data included Low Case and High case savings.
For each individual previous case, an average savings per population base was calculated for Low and High case savings, with the average of these reflecting the Base case savings. These were subsequently indexed up from the relevant transition year (per the previous case for change) to April 2025 prices. A simple arithmetic average of indexed savings per population base informed the overall average indexed saving per population, which was used to calculate the total ‘top - down’ savings. The savings were reduced by 10% to reflect the erosion of benefits of having four new mainland unitaries.
The top - down savings were split into underlying savings categories (as reflected in table below) using a percentage allocation mix based on internal discussions and experience.
Saving Name Description
Optimising Leadership
Right Sizing the Organisation
Reviewing the number of managerial roles to eliminate duplication and enhance operational efficiency, by merging similar responsibilities into fewer and more impactful positions.
Determining the right size of the organisation, proportionate to the services that are being delivered, offset by the costs of new technology and upskilling individuals. Reducing overall workforce through role consolidation and automation.
and Assumptions
Assumes a single senior leadership team for each new unitary replaces multiple councils' executives (Chief Execs, Directors, S151s, Monitoring Officers).
Assumes no significant delays from legal/TUPE or governance negotiations.
Assumes c. 5% of workforce (primarily backoffice/admin roles) reduced through consolidation, automation and voluntary redundancy.
Realisation depends on culture change, system integration and union engagement.
Centralising Corporate Services
Service Contract
Consolidation
Consolidating back- office functions, such as Human Resources (HR), Finance and Information Technology (IT) to streamline operations, enhance efficiencies and unlock savings.
Understanding current and joint service arrangements between Councils, and what savings (or costs) may be incurred on consolidation.
Determining the optimum sourcing arrangements for contracts that are either currently outsourced or could be outsourced. This will need to consider both financial and operational efficiency and will consider existing arrangements with third parties.
Merger of finance, HR, payroll, legal and comms into centralised functions for each new unitary.
Requires effective digital systems, unified policies and process harmonisation.
Assumes merging of contracts (waste, highways, care) and renegotiation over time. Dependent on contract cycles, procurement capacity and provider cooperation. 30%
Proportionate Democratic Services
Reviewing the costs of democratic services (elections, committee support, etc.) to be proportionate to the new authorities.
Reducing the number of councillors and governance costs (e.g. committees, elections).
Improved Digital & IT Systems
Implementing unified digital platforms, automating repetitive tasks, streamlining workflows, and eliminating manual processes, can lead to significant time and cost savings. Unified platforms and systems rationalisation reduce licensing, support, and admin overheads.
Assumes reduction in number of councillors and associated committee and democratic support costs.
Assumes new governance models implemented immediately postreorganisation. 4%
Streamlining systems and licenses, introducing self-service platforms, rationalising IT estate. Dependent on investment in digital infrastructure and culture shift to online services.
Asset & Property Optimisation
Customer Engagement
Reviewing property portfolio to ensure alignment with the council's overall objectives and community needs.
Release of surplus office space, lease terminations, or revenue from letting/disposals.
Contingent on lease terms, capital receipt strategy and local market conditions.
Consolidating Fleets & Optimising Routes
Enhancing customer contact facilities, determining the needs of citizens in the new authorities and developing proportionate customer contact centres, where appropriate including self-service through digital channels, to improve customer engagement, satisfaction and drive operational efficiencies and cost savings.
Exploring consolidation of fleets and any route efficiencies, to reduce costs and minimise environmental impact. Reducing fleet size and improving vehicle routing to lower transport costs.
Channel shift to digital, contact centre consolidation, and automation of transactions. Assumes digital access for residents, workforce reskilling, and strong comms. 6%
Integration of transport assets across services (e.g. waste, social care, facilities). Benefits depend on fleet management tools, depot locations and service redesign. 4%
Savings by category as calculated from the top - down approach was subsequently compared with the savings calculated using the bottom-up approach.
Bottom-up approach:
To estimate the potential savings using the bottom-up approach, an overall spend against each of the savings’ categories (as per above table) was identified and a corresponding high-level saving against spend (in percentage terms) was made against each of the categories.
The total savings were then aligned across the bottom-up and top - down approaches to ensure a realistic savings assumption by category. The alignment continued to assume a 10% saving erosion due to Hampshire and the Isle of Wight local government
reorganisation having four new mainland unitaries, across all options. The savings were then allocated to individual unitaries based on the unitary’s share of total population.
No savings from LGR have been assumed to be realised in Base Year and Year -1. However, they start to ramp up in Shadow Year and build up to be fully realised per annum by Year 3. The savings have then been phased based on expected realisation as per the below table:
The savings assumptions are consistent across all 3 options being assessed.
Appendix C – Implementation Cost Breakdown:
The overall implementation cost assumptions have been prepared using a top - down approach only, based on the implementation costs as outlined within previous Case for Change documentation. These included the same previous cases for change used to inform the top - down Savings assumptions, to ensure consistency. The data included Low Case and High case implementation costs.
These were calculated as One- off implementation costs and Disaggregation costs.
One- off implementation costs:
For each individual previous case, an average one- off implementation cost per population base was calculated for both the Low case and High case, with the average of the two informing the Base case. These were subsequently indexed up from the relevant transition
year (per the previous case for change) to April 2025 prices. A simple arithmetic average of indexed one- off implementation cost per population base informed the overall average indexed one- off implementation per population.
These were subsequently adjusted for an increase of £11.8 million to reflect that there will be a total of four new mainland unitaries and that each new authority requires its own setup processes, including establishing governance structures, IT systems, and administrative frameworks, leading to higher cumulative transition costs. An additional 25% increase in costs were subsequently applied to reflect optimism bias risk of delivering the programme. These have been assumed consistently across all cases.
The final figure was then apportioned across the cost categories underpinning the one- off implementation costs (see below table).
Category Description Rationale and Assumptions
Workforce - Exit Compensation paid to employees as a result of restructuring/redundancies, including redundancy payments, pension strain, TUPE, salary harmonisation, and other contract termination fees.
WorkforceDevelopment Additional costs to upskill and reskill employees to adapt to new roles and responsibilities.
Redundancy and termination costs reflect staff length of service. 30%
Cost allowed for retraining through redeployment of workforce. 4%
Transition - Team Implementation programme team including Legal, Contract Negotiation, Project and Programme Management, and specialist support. A significant transition team required for each unitary authority.
Includes legal, HR, project support, public consultation.
Some benchmarks include change management and creation of new councils. 11%
Transition - Culture and Communications Costs to develop communications, branding, training, and public information in relation to new
Cost allowed for other culture and comms change. Includes all rebranding, change, and engagement. 4%
authorities. This should inform the public, stakeholders, and employees of proposed changes and address concerns.
Transition - Processes Work required to harmonise processes and facilitate effective service transition. This includes specific constitutional changes and developments, democratic transition, and new policies and procedures.
ConsolidationSystems Alignment of systems and digital infrastructure, including merging systems, data migration, commonality of cyber security, and training for new systems.
ConsolidationEstates and Facilities Reconfiguration of buildings, costs of disposal, and termination fees on leases.
Cost allowed for efforts to harmonise processes and procedures as part of the transition.
Costs reflect previous examples of system implementation.
Some benchmarks do not include allowance for ERP and data migration, cleansing and interface development.
Some benchmarks do not include capital receipts, which can be used to fund, for example transformation or regeneration. 8%
Contingency Additional 10% contingency to allow for prudence in estimates. Standard across Cases to build out contingency. 8%
Total
One- off implementation costs have been assumed to start ramping-up from Base Year and build up by Year 3. These have then been phased as per the below table:
Disaggregation costs:
The disaggregation costs have been assumed due to the additional costs of providing Adult Social Care Services, Children Social Care Services, Place Services and Corporate & Support Services, resulting from the disaggregation of County’s services. These have been quantified based on a percentage of the County’s 2025/26 budget spend against each service (summarised in table below).
The high-level percentages assumed and rationale for the disaggregation costs across the services are outlined in the below table.
Cost Category Rationale and Assumptions
Adult Social Care
Inefficiencies
Children's Services
Inefficiencies
Management - Assumes additional DASS’s and ADs, head of legal roles.
ICT & Systems - Requires data segregation, integrations, separate instances and eventually separate case management systems.
Performance & Strategy - Additional statutory reporting and strategic development.
Management - Requires additional DCS’s and other new roles required.
ICT & Systems - Requires data segregation, integrations, separate instances and eventually separate case management systems.
Performance & Strategy - Additional statutory reporting and strategic development.
Calculation method
+1.6% of budget
+0.9% of budget
Place Service
Inefficiencies
Management - Assumes shared service for Emergency Planning but additional management roles. Could hold resilience and Emergency Planning County wide.
Procurement / Third Party - New contracts required
ICT costs - Small increase in systems costs through multiple contracts.
+1.4% of budget
Corporate & Support Services to the Council Duplication
Management - Small increase in management roles
Staff - Increase in Finance, HR, legal and policy, ICT/digital and performance roles
ICT costs - Requires data segregation and integrations
+3.8% of budget
These disaggregation costs are assumed to be validated for the Base case, while the High case assumes these to be 10% higher than Base case. These costs have been allocated to the individual unitaries based on the share of population within the new mainland unitaries, excluding the population of existing upper tier authorities.
These costs are all assumed to be reflected 100% from Year 1 of the implementation, without any ramp -up.
The implementation cost assumptions are consistent across all 3 options being assessed.
Appendix D – Boundary Change Costs Breakdown:
Boundary Change Costs reflect the additional one- off implementation costs associated with additional complexity due to splitting existing Districts. No Boundary Change costs have been assumed for Option 1 and Option 2. However, Option 1A assumes changes in boundary for Winchester, East Hampshire, Test Valley and New Forest and therefore assumes additional Boundary Change Costs.
The Boundary Change Costs have been quantified as 5% of the current total service expenditure associated with client facing services. As there has not been a precedent for Boundary Changes within Local Government Reorganisation, the quantification assumption of 5% is based on Local Government judgement. Where a District is being split across two Unitaries, the associated Boundary Change Costs are assumed to be split equally among the new Unitaries, to support Unitary analysis.
Boundary Change Costs by Unitary (£'000)
Districts with Boundary Changes
These costs are assumed to be consistent across the Base and High scenarios and are phased to be incurred 30% incurred in Year -1 (2026/27) and 70% incurred in Shadow Year (2027/28).
Appendix 6:
Report by Collaborate for Social Change - The bigger you go, the less you know
“The bigger you go, the less you know”
Why place-based, relational approaches to public services must be core to Local Government Reorganisation
Prepared for Test Valley Borough Council by Collaborate CIC May 2025
Introduction
The English Devolution White Paper speaks of shifting power and resources from the centre and sets out a bold plan for Local Government Reorganisation to enable this.
Place-based and relational approaches can help rebuild the social contract between communities and the organisations that serve them. By working at a scale of place that people identify with, building better relationships with communities, giving them more power over the decisions that affect them, and investing in preventative, relational, and asset-based ways of working, local authorities can not only continue the spirit of devolution, they can reduce demand and deliver better services more cost effectively.
Based on a comprehensive literature review, interviews with practitioners and Collaborate’s work in places across the country, this paper sets out the benefits produced by place-based, relational approaches to public services. We outline the underlying conditions that enable these approaches to be effective and give examples of what the work looks like in practice, illustrated by brief case studies.
This evidence base has been created in support of an argument that place-based, relational working should be at the heart of the operating model for new strategic authorities.
The case for change
A golden opportunity
Local Government Reorganisation offers a once in a lifetime opportunity to re-examine and re-shape the operating model of local government.
The English Devolution White Paper set out the government’s vision for simpler local government structures. It proposes that these structures can lead to better outcomes for residents, improved local accountability, and savings which can then be reinvested in public services. It doesn’t say how this will be achieved. Instead, it is for each place to determine an effective organisational and administrative structure, based on what they know about the people who live there and the geography in which they live.
This process is an opportunity to remind ourselves and recommit to what local government is for, what it can do, and why it matters. It’s an opportunity to put purpose at the heart of decisions about what new, old, and amalgamated institutions and their partners do, how they do it, and who they do it for.
We know what doesn’t work, and what wrongs need to be righted
Decades of having to ‘do more with less’ has hollowed out services, increased thresholds for support, stripped out opportunities for early intervention and prevention, and decimated social infrastructure. There’s a growing level of dissatisfaction, with many feeling that vital public services1 don’t meet their expectations, with this being felt most acutely in those places that have the least, highlighting entrenched geographic and social inequalities.
Those people that services are supposed to support feel they have to fight to get what they need and often the needs of the most vulnerable go unmet, leaving people bouncing around the system with unresolved problems and increasing costs with every contact. Not only is this not helping people, it negatively affects those who work in public services, contributing to poor staff recruitment and retention rates, high sickness levels, and decreasing productivity.
Service failures sit within a challenging context in which demand is increasing alongside a population that is growing, and ageing, and presenting with ever more complex and interrelated problems, far outstripping the ability of the current mode of delivering public services to effectively meet people’s needs.
1 Can Labour deliver? Public services face inequality crisis, IPSOS
New Public Management has run out of road. The importation of private sector practices and the introduction of market concepts such as choice for ‘consumers’ and competition between providers has contributed to a system of managing services that is dehumanising, slow to learn, fragmented, and expensive, with commercial providers driving the costs up at every turn. It is part of a bureaucracy whose ‘do to’ mentality fails to see and lift up the assets of people and place and recognise communities’ knowledge and abilities. A system of management where a focus on organisational boundaries, ring-fenced resources, competitive commissioning, goals, and targets block the ability of place-based systems to effectively work together to support their place and its people to thrive.
It all adds to the rising sense of dissatisfaction and loss of trust in public services, in the institutions that provide them, and in the politicians in charge.
We can see a better way
“No society has the money to buy, at market prices, what it takes to raise children, make a neighbourhood safe, care for the elderly, make democracy work or address systemic injustices… The only way the world is going to address social problems is by enlisting the very people who are now classified as ‘clients’ and ‘consumers’ and converting them into co-workers, partners and rebuilders.”
2
There is a growing movement towards a focus on neighbourhoods as an ‘engine of change3’, towards councils working alongside residents to build community capacity and capability and services co-locating to work together at a hyper-local scale. This movement is a direct response to rising demand, public service failure and an unmet appetite for people to have more influence over their own lives and the places that matter to them.
This different approach to local government and public services has been emerging for many years. The mounting body of evidence is captured in the overwhelming number of reports about neighbourhood and place-based approaches that are available. From the LSE’s 1999 report ‘Neighbourhood Management’ to ICON’s Neighbourhood Policy Green Paper published this month there is a long-term, escalating call to invest in building community capacity and social capital, backed up by data and insight from multiple initiatives across the country.
2 Edgar Cahn, US-based civil rights lawyer and inventor of Timebanks
3 Neighbourhoods as engines of change, James Plunkett
Despite the proven promise of these approaches, they have tended to remain on the margins of organisations or systems, often struggling to get the support, investment or attention needed to be sustained or expanded beyond the pilot phase, or to survive political shifts.
Local Government Reorganisation provides the opportunity to take the great practice happening at the margins into the mainstream by embedding it within the operating model, culture, and practice of the new strategic authorities. To do so requires an understanding of scale.
Bigger isn’t intrinsically better
Devolution and the transfer of power to a more local level is welcome, but the creation of new strategic authorities comes with an organisational design challenge. How can the model for the new organisations, serving larger populations, be built to enable the new, emergent practice and avoid replicating the same blockers to innovation, but at a larger scale?
Learning from places across the country, and the councils that serve them, means responding to evidence showing that within the current operating model, running services at ever larger scales, doesn’t make them more efficient or cost effective. It means recognising that the bigger they go the less they know about the people they’re serving. This lack of insight into people’s lives – what their lives are like, and the ways that where and how they live affects them, and what a good life looks to them – makes it impossible to address the root causes of demand for public services.
Place-based and neighbourhood approaches can reduce demand and make services more effective through building better relationships with local people and communities, by giving them more power over the decisions that affect them and greater access to the resources local government and other partners hold. Focusing on a scale of place that people identify with, enabling community power, and investing in preventative, relational, and asset-based ways of working, all have the potential to improve outcomes as well as enable better use of resources and sustainable cost reductions for the long term.
This may seem challenging to an orthodoxy that sees increased scale as the best route to efficiency savings. But this movement has been emerging for many years, producing many examples of inspiring practice, a growing body of evidence and an understanding of the underlying enablers of success. Services that are failing to improve people’s lives are not efficient, even if they cost less to deliver
Close collaboration with communities and with local partners, systems leadership, developing new capabilities across the workforce, and local government taking on the role of enabler and place shaper are all key ingredients. This is happening in metropolitan boroughs like Wigan, London boroughs like Camden and Barking and Dagenham, in rural counties including Gloucestershire and Cumbria, and in districts and boroughs including Test Valley. There are plenty of stories, case studies, and evidence to learn from and help shape the next generation of public management.
Learning from Goldilocks
“Civil society grows proportionate not to the extent people’s needs are addressed by institutions but by the strengths connected and addressed by citizens”4
Creating a new tier of large unitary councils with populations over 500,000 risks further disconnecting local communities from the decisions that affect them. This is especially so in rural communities which risk losing access to services and viable local democracy. The new organisations need to adopt an operating model that enables them to remain close to the diverse range of communities living within their boundaries, developing the local insight that enables them to be responsive, approachable, and trusted.
The danger is that reorganising local authorities to a larger scale and a ‘higher altitude of operation’ will have a homogenising effect, weakening the link to the specific nature and needs of the patchwork of neighbourhoods that make up local places.
Small can be beautiful. New strategic authorities need to be designed to find a balance and appropriate scale to operate at in order to support different activities. They can be bigger, if they can also connect effectively at different spatial levels with the diverse populations within them. They need to be able to work at the human scale, accommodating human needs and human relationships, and at a system scale, connecting, coordinating, and stewarding all the resources that will enable places to flourish. Organising principles could successfully borrow from the way networks operate rather than replicate the monoliths of the past. These are akin to the principles at play in the best of place-based working –a focus on relationships, collaboration, and interconnectedness and flexible structures that are adaptable to change and innovation.
Local councillors are generally seen as more trustworthy than national politicians5, although there is evidence6 that creating larger councils erodes local democracy with a negative impact on trust in councillors, public engagement, and voter turnout. The new operating model needs to place active councillors with deep local insight and trusted relationships at its heart to counteract this risk.
The ‘democratic gap’ will affect places in different ways7. Where there are effective parish and town councils, communities have a hyper local route to mobilising resources, managing local assets, and shaping the decisions that affect them most. But only 36% of England’s population is covered by parish councils and even in places where they are present, there is no guarantee that they will be active or effective enough to make a difference without support to do so
4 Rekindling Democracy, Cormac Russell
5 Trust and Confidence in Councils - What the public think, APSE
6 English Devolution White Paper: DCN’s briefing, DCN
7 Local, Actually: Establishing hyperlocal governance in England, Re:State
New unitary councils must consider how to accommodate, enable and connect with hyper-local forms of governance that enable smaller places to exercise democratic control over public spaces and amenities in line with community needs and be genuinely democratically accountable. This will require key capabilities around participation and engagement. The role of local councillors will be core to closing the gap between communities, understanding the strengths and assets available to a place, and advocating for what they need.
In this way, LGR efforts can find the optimum scale – one that is not so big that the link with local people and places is lost, and one that is agile and flexible enough to enable and nurture the proliferation of the small, local initiatives that are key to flourishing neighbourhoods.
Culture eats structure for breakfast
The NHS reorganisation around Integrated Care Systems shows that structural changes alone do not guarantee a change in outcomes. For LGR to successfully shift public service delivery to operate at a neighbourhood scale, there must be a focus on developing a culture grounded in a mindset that is collaborative, systemic, long-term, and conscious of power and how it can be shared more equitably8.
Core to this mindset shift is a renewed sense of the purpose of local government – the reason councils exist, and the outcomes they are trying to achieve. Many local authorities are reframing their purpose around creating the conditions for people and places to flourish, and identifying their role as an enabler of, or platform for, citizens and partners to address common challenges together.
This shift requires a bold, enabling approach to place leadership in which leaders embody the commitment to working in partnership with communities; entrusting staff with the freedom to innovate and enabling community power.
8 Introducing New Operating Models for Local Government, Nesta & Collaborate
Outcomes: what improvements do place-based, relational approaches contribute to?
Understanding the size of the prize
Places are complex social systems. Any change in outcomes will be the product of many different variables interacting in a variety of ways, shaped by local context. The way that the impact of initiatives is understood needs to reflect this – it is unlikely to be the result of a series of traceable, measurable, causal actions.
However, new approaches suffer from an ‘evidence paradox’ in that the way impact is understood is governed by the rules and modes of the old system. “Community power practice, approaches and initiatives are required to demonstrate their own worth according to measures that are not set up to recognise their value. The value of community power is best captured qualitatively, yet the metrics are quantitative.”9
This is something many places and organisations have been working to overcome, producing a growing, albeit dispersed, evidence base.
In reviewing neighbourhood approaches we observed a spectrum ranging from those that were seeking service delivery outcomes and those that focus on community development outcomes. Different approaches are more commonly seen at different scales of place, with those that are more service focused typically being seen within administrative boundaries and those that are community focused at the more hyper local level.
Place-based approaches can have different starting points:
1. Led by local authorities, health, or VCFSE organisations acting at place-shapers, designed to build connections within and between local people and place, getting upstream of social problems to create the conditions for people to flourish.
2. Led by services, designed to improve links between local people and services, engage people in shaping those services to best meet their needs and ultimately reduce or delay demand.
3. Led by communities themselves, designed to make their place better in a way that meets their needs. Local authorities can play a crucial role in enabling these initiatives, offering them active support including access to assets, skills, and resources.
This report focuses more on those initiatives that are started or led by local authorities and the services they provide. However, the distinctions between them are not hard and fast and all effective place-based, relational approaches contribute to creating the conditions for people and places to flourish.
9 Community power: the evidence, New Local
Place-based outcomes
For communities to thrive and unlock their potential, there is strong evidence that many factors need to work together simultaneously. Social infrastructure is vital to social integration and community cohesion, helping communities to build meaningful and lasting relationships with each other. Social infrastructure is an ecosystem, made up of a mix of “hard infrastructure” – buildings and other spaces – and “soft infrastructure” –the groups, networks, online forums and individuals which bring the physical facilities to life10.
It’s not enough just to have a space, there needs to be activity to bring it to life. For bridges to be built between different communities they need to come into positive contact in shared spaces, enabling connections across differences. Higher levels of social capital11 are beneficial and are associated with better outcomes in health, education, employment, and civic engagement12. Community or social cohesion can be seen as a product of bonding and bridging capital13.
Community anchor organisations are a key ingredient in activating social infrastructure to generate social capital and creating a platform for associational life.
The following outcomes are strongly associated with place-based initiatives that help develop social infrastructure, bring people together to form connections and support active collaboration with and between communities themselves.
● Civic participation and trust: People having the power to change what happens in their community contributes to increased community-led decision-making and ownership of local initiatives and projects, building civic and democratic participation and boosting trust. People will identify more strongly with where they live and be prepared to contribute more.
● Community cohesion: When there are spaces and opportunities to come together, people discover common ground, and drive aspirations for their communities, building community cohesion and safety. Linked to higher levels of neighbourliness, lower levels of loneliness and isolation, more positive attitudes towards others, particularly those from other groups.
● Wellbeing and resilience: Increased social connections and networks of support within neighbourhoods can strengthen community wellbeing, reduce anti-social behaviour, and build resilience. Communities are better able to quickly mobilise and support each other in times of crisis and change, provide mutual support, and survive systemic shocks.
10 Connective Social Infrastructure: How London’s Social Spaces & Networks Can Help Us Live Well Together, Good Growth By Design
11 What is social capital?, DEMOS
12 Rapid evidence review of community initiatives, DCMS
13 Social capital – what we mean by it and why it matters, Belong Network
Place-based outcomes: the evidence
Local Conversations14
The Local Conversations programme, was a long-term grant initiative supporting residents in 13 neighbourhoods to come together to identify and agree local priorities, and then take action to help address them, utilising the flexible funding model of the programme. Evaluation undertaken by the New Economics Foundation found that the programme:
● Led to improved social and personal wellbeing including greater social connectedness and sense of belonging
○ Survey results showed that 65% of respondents agreed or strongly agreed that their Local Conversation had helped them feel more confident
○ 62% said their Local Conversation had helped them develop and learn new skills.
○ Participants reported being more satisfied with life, less anxious, and more likely to feel that what they do is worthwhile – compared to both national averages and other similarly disadvantaged neighbourhoods.
● Supported residents to increase their engagement with local decision-makers by building their capacity for influence through stronger relationships with local organisations and institutions.
○ In 2019, 14 out of 16 neighbourhoods were attempting to influence people in power, including councillors, MPs, and NHS
Somerset Local Community Networks15
There are 18 Local Community Networks (LCNs) covering the Somerset Council area, acting as the ‘voice’ of local communities and serving as hubs for engagement, partnerships and local decision-making. Their establishment is part of a move to ensure that all of Somerset is ‘parished’, involving the devolution of assets and services to town, city and parish councils (set out in their 2020 business case for moving to a single unitary council for Somerset, “One Somerset”). Somerset believes LCNs will contribute to:
● Effective local engagement, ensuring residents, businesses, and partners can influence council activity and service delivery.
14 Evaluating the impact of Local Conversations 2016 - 2021, People's Health Trust
15 Local Community Networks: Questions and answers, Somerset Council; One Somerset Business Case: Final Submission, Somerset County Council
● Democratic participation: promoting active community decision-making, scrutiny, and enhanced participation in local democracy
● Collaboration: bringing together representatives from partner organisations, city, town and parish councils, community groups, and others to share information, ideas, and solutions.
● Local influence: helping to ensure that local priorities across economic, social, and environmental issues shape council and public service activity.
Asset-based community development (ABCD) in Leeds16
ABCD is a core element of Leeds City Council’s approach to public service. ABCD is a neighbourhood-based model that focuses on identifying and harnessing local strengths, relationships, and networks to support citizen-led change.
A co-produced evaluation by Leeds Beckett University, Leeds City Council and community organisations found that in Leeds, ABCD has “supported better social connections and new friendships, with greater community cohesion: bridging differences in generations and neighbourhoods being more inclusive of people with disabilities.”
Barking and Dagenham Giving17
Through Barking and Dagenham Giving (BD Giving), the borough has created a model that challenges traditional grant-making and investment by shifting decision-making power directly into the hands of local people. BD Giving was established in 2020 as the UK’s first 100% community led investment fund. BD Giving’s approach is about more than distributing money; however, it is about building the capacity and confidence of residents to shape their neighbourhoods.
Residents who participate in BD Giving’s work report feeling more aware of local issues, more likely to engage in democratic processes, and more connected to their community. As people participate, their confidence grows, prompting them to question existing systems and explore new approaches. The process aims to build sustained civic engagement, as participants become more likely to volunteer, support local initiatives, and take ownership of community outcomes.
16 Asset-Based Community Development: Evaluation of Leeds ABCD Programme, Leeds Beckett University
17 Barking & Dagenham Giving, BD Giving; Trustees’ Report and Consolidated Financial Statements for the Year Ended 31 March 2024 for Barking and Dagenham Giving, UK Charity Commission
Local Area Coordination in Surrey18
In 2022, Surrey County Council introduced Local Area Coordination (LAC) as part of a broader strategy to support independence, promote prevention, and address health inequalities across the county. Residents supported by LAC have reported improvements in their sense of confidence and wellbeing, as well as increased engagement in community life. In some cases, individuals have gone on to take active roles in their communities, contributing to local initiatives and offering support to others.
Service-led outcomes
Many of the service-led initiatives we have explored contribute to the place-based outcomes listed above, being designed to move attention and resources upstream of direct service delivery to focus on creating the conditions for better outcomes with communities. However, these are longer term aspirations with a primary driver focused on more immediate goals – reducing, delaying, or preventing demand for services and service improvement.
Some councils have implemented a ‘locality model’, co-locating different services in centres that are closer to where people live, but still aligned with PCN footprints. These ‘Integrated Locality (or Neighbourhood) Teams aim to make services more accessible and convenient and enable them to engage more with people who need support. Many are focused primarily on health and social care and aim to improve health and well-being in the area by working collaboratively with various services, agencies, and groups. There is an emphasis on:
● Being closer and more accessible to communities, and visible to residents
● Making better use of shared resources, reducing running costs through shared use of high quality, sustainable buildings.
● Working in partnership, using integrated working to create a simpler, more joined up system that offers the right support at the right time.
● Supporting a transformation in culture and practice, based on recognising strengths, networking, and being based in community.
Adult Social Care services are often drivers of innovation at the community level, working in partnership with health and VCSE colleagues to use methods including Asset Based
18 An Analysis of 6 Stories of Local Area Coordination in Surrey: Positive Changes and Costs Avoided, Community Catalysts; Local Area Coordination in Surrey: Independent Evaluation 2024, Duggal Consultancy
Community Development, Local Area Coordination, and micro-business market development as investments in prevention.
Service level initiatives produce a wide range of outcomes, for service demand, for the system - and for individuals.
● Delay, reduce, prevent demand
○ People live happier, healthier, independent lives for longer.
○ People live in safer communities with fewer incidences of anti-social behaviour.
○ People find local solutions and use their own assets and strengths.
○ People volunteer and get involved in delivering local services.
● Prevent failure demand
○ People receive more personalised and flexible support that better meets their needs and supports them to navigate the system.
○ People can find the services they need on their doorstep, without navigating complex systems.
● Reduced staff turnover
○ Increased worker satisfaction and reduction in staff turnover.
● Effective commissioning
○ Stronger collaboration between VCSE and statutory partners enables collective problem-solving, driving progress on outcomes, not just outputs, to maximise value.
● Individual improvements to health and wellbeing
○ Increased independence, improved relationships, connections, and access to community resources, and improved personal safety, security, and stability19.
○ Reduced reliance on prescription drugs, reduction in the number of visits to the GP, being signed off from treatment by a clinician20
19 Transforming adult social care systems? A systematic review of the costs and outcomes of local area coordination in England and Wales
20 Building Community: An evaluation of asset based community development (ABCD) in Ayrshire
Service-led outcomes: the evidence
Old Ford and Nest Estates Local Conversation (Gateshead)21
The Old Ford and Nest Estates Local Conversation in Gateshead led to partnerships with schools, universities, local authorities, a counselling organisation, and GPs. As a result of these partnerships, community development workers were based in GP surgeries to support patients with non-clinical issues. Their evidence showed that patients accessing the scheme reduced their appointments by over 25%, saving money and ensuring people were receiving the support they needed.
Wigan: Progress with Unity22
A key feature of Wigan’s new ten-year approach, Progress with Unity, is its shift to smaller-scale, neighbourhood-based delivery. For example, adult social care has been recommissioned using a neighbourhood model, with teams empowered to deliver asset-based, relational support grounded in local knowledge and collaboration.
Seven ‘service delivery footprints’ have been established in the borough to reflect ‘natural communities’. These footprints serve as the foundation for integrated, multi-agency teams working from shared neighbourhood hubs. Wigan has found that co-located working in these hubs enables rapid, place-sensitive responses to local needs and that working at a neighbourhood scale ensures that public services are better connected to the lived realities of communities, fostering trust, responsiveness and improved outcomes. Some of these improved outcomes outlined by the Kings Fund 2019 report include:
● Increase in healthy life expectancy between 2016 and 2019
● Improved school readiness between 2016 and 2019
● Increase in physical activity between 2012 and 2015
● A higher rate of older people still at home 91 days after discharge than in England as a whole
● High rate of care home quality improvement
● Lower emergency re-admissions from care homes than England average
● Low rates of delayed transfer of care from hospital
● High rate of decrease in rates of premature mortality from cardiovascular disease and of premature mortality from cancer
21 Evaluating the impact of Local Conversations 2016 - 2021, People's Health Trust
22 A new era for Wigan Borough: from The Deal to Progress with Unity, Collaborate & Wigan BC; A citizen-led approach to health and care: Lessons from the Wigan Deal, The King’s Fund
In addition, underpinned by behaviours such as ‘Be kind’ and a culture which encourages staff to work differently, Wigan’s approach gives staff the freedom to take relational and person-centred approaches which prioritise the wellbeing and independence of those they work with. Wigan’s approach has resulted in improved staff satisfaction, stronger partnerships with the VCSE sector and a shared sense of purpose across their services.
Somerset Adult Social Care: micro-business market development23
Somerset’s adult social care strategy prioritises prevention, early intervention, and strong connections with neighbourhoods and communities. A key part of Somerset’s approach to adult social care is the support for micro-providers and since 2015, Somerset has supported the development of 1,250 new micro-providers, who deliver over 30,000 hours of care weekly to nearly 6,000 people in Somerset. The increased capacity of local, responsive support has enabled:
● Stronger local support: people are supported at home or in their communities by providers from their neighbourhoods, fostering trust, flexibility, and continuity of care.
● People and families know good support is available locally. As a result, people come home earlier from hospital.
● People-centred support: people design support together that is more personalised. “Creative people on both sides of the care equation find ways to do things differently”.
Community Micro-enterprise programme: Westmorland and Furness24
Over 2022-24 Community Catalysts partnered with Westmorland and Furness Council to increase the number of community microenterprises in the area providing care and support. Outcomes included:
● An established network of responsive, high-quality, and sustainable community micro-enterprises that provide a wider choice of care and support to older and disabled people in their homes.
● Increased the local care and support offer, with 125 people receiving 400 hours of support each week. (25 using direct payments, 100 self-funded).
23 Get help at home with micro-providers, Somerset Council
24 Community micro-enterprise development in Westmorland and Furness, Community Catalysts
● Reduced unmet need – commissioners, local health and social care teams, and people seeking care and support know that good support is available. As a result, people can choose from a range of care and support options locally.
● Increased choice and control over the support they choose – there is more choice locally for people who draw on care and support and people can choose to have a Direct Payment to pay for their support from a community micro-enterprise.
● Improved quality of service – personal relationships are at the heart of the community micro-enterprises. They offer support that is flexible and responsive to the person’s needs, and foster rich connection with others, which supports people’s quality of life.
Local Area Coordination in Surrey25
Initial insights from the implementation of LAC in Surrey have highlighted a range of early outcomes and there are indications that the model is contributing to broader shifts in service delivery. Improved health and mental health outcomes among residents suggest that Local Area Coordinators may play a role in reducing demand for crisis intervention over time. Feedback also points to strengthened relationships with local NHS services and community partners, including improved pathways for GPs to introduce patients to LAC.
Nationally, the LAC model has been subject to 15 independent evaluations across England and Wales, with findings indicating positive outcomes for individuals, communities, and wider systems. These include simplification of service pathways and greater cross-system collaboration and integration across agencies.
Community Health and Wellbeing Workers26
Community Health and Wellbeing Workers (CHWWs) are recruited from the communities they serve. They are not medical professionals, but trusted local people selected for their empathy, integrity, cultural competence and persistence. Operating across small geographies of 120–150 households, they make monthly visits to every home (regardless of need) to build relationships and offer holistic, proportionate support.
25 An Analysis of 6 Stories of Local Area Coordination in Surrey: Positive Changes and Costs Avoided, Community Catalysts; Local Area Coordination in Surrey: Independent Evaluation 2024, Duggal Consultancy
26 Community Health and Wellbeing Workers (CHWW) Programme, National Association of Primary Care
In Westminster, where the model was first implemented in the UK results have shown that:
● The households were 47% more likely to have immunisations that they were eligible for and 82% more likely to have cancer screenings and NHS health checks.
● There was a 7.3% reduction in unscheduled GP consultations among these households.
● Residents were appreciative of the ease of access, support and comprehensive approach provided
● Engagement had been maintained with 60% of residents and increasing. Residents who engaged with CHWWs did not disengage
● Multiple instances of issues being unearthed around suicidal ideation, child carers, domestic violence and intractable housing.
Additionally, in Cornwall, the model showed a 90% improvement in resident wellbeing (as measured by the MyCaw tool).
Social Prescribing27
Since it was included as part of the NHS Long Term Plan in 2019, social prescribing has become a key part of the move towards personalised care in England.
Evaluations across the country show that social prescribing can not only improve wellbeing but also significantly reduce pressure on health services:
● In Tameside and Glossop, an evaluation of 1,751 referrals showed a 42% drop in GP appointments.
● In Kent, A&E visits reduced by up to 23% for the 5,908 people supported.
● In Kirklees, support for frequent service users led to 50% fewer GP appointments and 66% fewer A&E attendances.
● In Rotherham, frequent A&E use reduced by up to 43%, with cost reductions of up to 39%.
27 The Impact of Social Prescribing on Health Service Use and Costs: Examples of Local Evaluations in Practice, National Academy for Social Prescribing
Financial outcomes
Much of the evidence reviewed used one of three ways to assess the financial outcomes of particular initiatives - cost benefit analysis, social return on investment or diverted costs. Money saved in one part of the system due to the action of another is problematic under current public sector accounting arrangements. It is often the case that investments made by local authorities save costs for the health system. Those developing an operating model for the new strategic authorities should consider how to take a ‘total place’ approach to assessing costs.
We identified the following outcomes that are likely to have financial benefits:
● Stronger local economy as flourishing micro- and community businesses create local job opportunities and keep service spend local.
● Reduced demand for emergency services.
● Reduction in cost of direct payments and home care through lower cost services from local micro-businesses.
● Reduced costs as a result of lower staff sickness and turnover.
Financial outcomes: the evidence
The Wigan Deal28
The Wigan Deal reframed the relationship between Wigan council and residents, encouraging co-production and strengths-based support which necessitated services which are built around individuals and families. This movement for change has enabled Wigan council to deliver over £180 million in efficiencies whilst improving services and maintaining the lowest council tax rate in Greater Manchester.
28 A new era for Wigan Borough: from The Deal to Progress with Unity, Collaborate & Wigan BC; A citizen-led approach to health and care: Lessons from the Wigan Deal, The King’s Fund
Changing Futures Northumbria29
Changing Futures Northumbria (CFN) is a collaboration across six local authority areas focussed on freeing up the creativity and compassion of front-line caseworkers, delivering more focussed and effective support by co-creating solutions and approaches with citizens, and building towards sustainable outcomes that stand a greater chance of reducing demand into services into multiple services, thus reducing costs and by being more effective, reducing inequality.
Changing Futures Northumbria found that a person they had been supporting, who had used over £450,000 of public service resource in the year prior to his engagement with their support, reduced his public service use to 0.3% of that level, within 18 months of being supported in a Human relational way, using only £1,932 in months 12 to 24 following the Changing Futures Northumbria intervention.
ABCD in Leeds30
ABCD is a core element of Leeds City Council’s approach to public service. A co-produced evaluation by Leeds Beckett University, Leeds City Council and community organisations estimated up to £14.02 of social value returned for every £1 invested.
Somerset Adult Social Care31
Somerset’s adult social care strategy prioritises prevention, early intervention, and strong connections with neighbourhoods and communities. A key part of Somerset’s approach to adult social care is the support for micro-providers and since 2015, Somerset has supported the development of 1,250 new micro-providers, who deliver over 30,000 hours of care weekly to nearly 6,000 people in Somerset.
The increased capacity of local, responsive support has enabled more cost-effective services, as the cost of care delivered by micro-providers is lower, and is associated with an increase in uptake of direct payments (which similarly have lower costs associated than commissioned care) as people and families know good support is available locally and so people come home earlier from hospital.
29 Changing Futures Northumbria Example of Practice, Human Learning Systems
30 Asset-Based Community Development: Evaluation of Leeds ABCD Programme, Leeds Beckett University
31 Get help at home with micro-providers, Somerset Council
Local Area Coordination in Swansea32
Swansea’s Local Area Coordination (LAC) programme is part of the council's Tackling Poverty Service based within Adult Services.
The Local Area Coordination model is explicitly designed to be place-based and relational. Its effectiveness is reflected in academic evaluations: a Swansea University study found that for every £1 invested, LAC returns £2–3 of savings to the wider system.
Local Area Coordinators also helped facilitate 28 new community groups and supported nearly 100 others to access funding – bringing over £85,000 into local communities via the council’s Enabling Communities Fund.
Local Area Coordination in Surrey33
In 2022, Surrey County Council introduced Local Area Coordination (LAC) as part of a broader strategy to support independence, promote prevention, and address health inequalities across the county. A Community Catalyst report reviewing six individual stories estimated £25,000 in likely immediate costs avoided from these six cases alone as a result of preventative action taken before crises emerged.
Nationally, the model has been subject to 15 independent evaluations across England and Wales. Where social return on investment has been measured, findings suggest a return of at least £4 in social value for every £1 invested (LAC Network, 2024).
Social Prescribing34
Since it was included as part of the NHS Long Term Plan in 2019, social prescribing has become a key part of the move towards personalised care in England. Evaluations across the country have shown that social prescribing can have positive economic returns:
● In Newcastle, secondary care costs were 9% lower than in a matched control group.
● A national evaluation of the Green Social Prescribing programme found a social return on investment of £2.42 for every £1 invested, alongside significant improvements in wellbeing based on ONS wellbeing measures
32 Local Area Coordination: Impact Report 2023, Swansea Council
33 An Analysis of 6 Stories of Local Area Coordination in Surrey: Positive Changes and Costs Avoided, Community Catalysts; Local Area Coordination in Surrey: Independent Evaluation 2024, Duggal Consultancy
34 The Impact of Social Prescribing on Health Service Use and Costs: Examples of Local Evaluations in Practice, National Academy for Social Prescribing
Barking and Dagenham Giving35
BD Giving was established in 2020 as the UK’s first 100% community led investment fund. As of May 2025, BD Giving has distributed over £950,000, including ~£778,000 in grants and approximately £77,000 distributed to the residents involved in participatory decisionmaking processes.
The largest share of BD Giving’s grant funding has gone towards Employment, Skills, and Enterprise, largely driven by their GROW Fund, which supports local businesses in scaling up and seeking further investment. Following this, funding is almost evenly distributed across arts, health, community cohesion, and education initiatives.
Local Conversations36
An evaluation by the New Economics Foundation found that the Local Conversations programme helped local lead organisations and residents access additional resources. On average, lead organisations secured between £192,000 and £216,000 in additional funding, which they attributed to their involvement in Local Conversations.
Community Micro-enterprise programme: Westmorland and Furness37
Over 2022-24 Community Catalysts partnered with Westmorland and Furness Council to increase the number of community microenterprises in the area providing care and support. Outcomes included:
● 26 local jobs created - people can work locally, earn an income and make a positive difference.
● The money flow stays within the local economy.
Levenshulme Inspire Community Hub38
In Levenshulme, located four miles south-east of Manchester city centre, is the Inspire Centre, a community hub owned by the people of Levenshulme. Through training, mentoring and enterprise activities, they have supported local residents into employment, started micro-businesses, and strengthened digital and social infrastructure.
36 Evaluating the impact of Local Conversations 2016 - 2021, People's Health Trust
37 Community micro-enterprise development in Westmorland and Furness, Community Catalysts
38 COVID Impact Report 2020/2021, Levenshulme Inspire; How to Set Up, Run and Sustain a Community Hub to Transform Local Service Provision, Locality
The building blocks of place-based working
Conditions that enable effective place-based approaches
System conditions are the factors that influence how a system behaves. The relationships and interactions between them determine the system's performance, and ability to achieve positive outcomes. Addressing the underlying conditions creates a powerful lever for change.
Effective place-based approaches share a common set of underlying conditions that are reflected in multiple examples of practice. They provide the foundation on which the different approaches and methods are built. We have split them into (1) system conditions - speaking to the network of organisations and institutions that make up the governance of a large-scale place e.g. local authorities, health partners, constabulary, VCSE etc; and (2) place-based conditions within neighbourhoods.
System conditions
● Strategic, intentional approach to partnership across a place
Alignment of vision & principles; collaborative governance structures; sharing of resources, including data and insight.
● Trusted, collaborative relationships and behaviours
System partners invest in building mature, equal, & trusting relationships across the place.
● Culture of learning that enables adaptation
Partners collectively reflect and use their learning to shape decisions and adapt their approach.
● Bold, enabling place leadership
Leaders embody commitment to working in partnership with communities; entrusting staff with freedom to innovate and enabling community power
Place-based conditions
● People have the ability to influence what happens in their community and shape the services and places that matter to them.
● Local voluntary, community and faith organisations are part of strategic system partnership, working with the public sector across organisational boundaries to create, pursue and implement opportunities for collaborative working.
● Strengthened spaces and opportunities for people to come together to develop collective goals and drive aspirations for their communities
● Strategic focus on local, relational neighbourhood-based working, recognising the value of trusted connections within a community.
What place-based, relational approaches look like in practice
There are many different methods and modes of operating and a variety of component parts in use to enable place-based, relational approaches and places are innovating, adapting and combining continually. This is fertile ground. Below is a snapshot of what we see in play at different geographic scales. See Appendix 2 for more detailed examples.
Approaches and actors common at the neighbourhood level
Asset Based Community Development (ABCD): The work of building and sustaining positive relationships across different groups, organisations and networks and enabling people to participate and influence decisions, activities and services and create stronger and more connected communities.
� ��� See case in practice
Community anchors: Small, established, neighbourhood-based organisations deeply embedded in local communities. Rooted in place, there for the long term with a deep understanding of an area and strong connections with local people. E.g. Heart of BS13, Bristol39.
Community asset transfer: The transfer of management and/or ownership of publicly-owned buildings or land or structures to local communities for less than the market value to promote social, economic and environmental well-being and empower communities.
� ��� See case in practice40
Community business: A locally rooted business run by local people for the benefit of the community, and creating broad community impact. E.g. Ashton Hayes and Mouldsworth Community Shop41
Community (or health) champions: Community members who volunteer to promote health and wellbeing or improve conditions in their local community. Champions use their social networks and life experience to address barriers to engagement and improve connections between services and disadvantaged communities. E.g. Camden Community Champions42
Community grants: Community-based funding and grants for projects like activities for young people, volunteer programmes and development of communal facilities.
39 Heart of BS13, Bristol
40 Bramley Baths, Leeds
41 Ashton Hayes and Mouldsworth Community Shop
42 Camden Community Champions
�
��� See case in practice43
Parish councils: Smallest, most localised tier of local government, delivering services to meet local needs, giving the community a voice and representation, and improving the quality of life and community wellbeing.
�
��� See case in practice44
Social infrastructure: Framework of institutions and physical spaces where people can meet, engage, and build relationships; and the networks of formal and informal groups, organisations, partnerships and initiatives that sustain the social fabric of a place. E.g. Space for Community: Strengthening Our Social Infrastructure45
Approaches and actors common at the ward level
Community development workers & Local Area Coordinators: Work in communities to help improve health, wellbeing and resilience of the people who live there.
�
��� See case in practice46
Councillors as community activists: Elected to represent their ward, to lead the local conversation and engage communities to make the area the best place it can be. �
��� See case in practice47
Participatory budgeting: A democratic process through which citizens decide directly how to spend part of a public budget, enabling them to have a greater say in how public money is used to improve their communities.
�
��� See case in practice48
43 Barking & Dagenham Giving, BD Giving
44 One Somerset Business Case: Final Submission, Somerset County Council
45 Space for Community: Strengthening Our Social Infrastructure, Power to Change
46 Local Area Coordination: Impact Report 2023, Swansea Council
47 Your local area and ward, Barnsley Council;
48 Barking & Dagenham Giving, BD Giving
Approaches and actors common at the locality level
Community hubs: Buildings or parts of buildings that provide and host community activities that local people need. Can be managed by a community-led organisation or by a public agency. Diverse range of possible services including activities that directly address community needs and provide opportunities for community engagement and social activities; and alternative approaches to service delivery –underpinned by the principles of community involvement and partnership.
�
��� See case in practice49
Integrated Neighbourhood Teams: Practitioners from health, social care, and the voluntary sector provide work with communities to understand what is important to them and co-design services that meet local needs, delivered in a way that works for the community. E.g.
Creating Integrated Neighbourhood Teams: Learning from experience50
Libraries, community & public venues: Publicly owned spaces that can host formal services alongside community activity. E.g. Cumbria Libraries51
Social prescribers: Link workers who support people to connect to activities, groups, and services in their community to meet the practical, social and emotional needs that affect their health and wellbeing. �
��� See case in practice52
Voluntary & community organisations: Third sector or civil society made up of a diverse range of groups and organisations focusing on social, environmental, or cultural goals. Typically non-profit and driven by volunteers, aiming to improve society or specific communities.
E.g. UK Civil Society Almanac 202453
49 Levenshulme Inspire
50 Creating Integrated Neighbourhood Teams: Learning from experience, National Association of Primary Care
51 Libraries as community hubs: Case studies and learning, Renaisi for Arts Council England
52 The Impact of Social Prescribing on Health Service Use and Costs: Examples of Local Evaluations in Practice, National Academy for Social Prescribing
53 UK Civil Society Almanac 2024, NCVO
Approaches and actors common at a whole-place level
Citizen assemblies: A type of participatory democracy in which a representative group of citizens selected at random from the population learn about, deliberate upon, and make recommendations about a particular issue or set of issues.
E.g. Blaenau Gwent Climate Assembly54
Community wealth building: A framework for redirecting economic activity to benefit local communities and residents. It aims to create a more inclusive and sustainable economy by ensuring that wealth generated in a specific area is retained and distributed within it.
�
��� See case in practice
Participatory democracy: A form of government in which citizens participate individually and directly in political decisions and policies that affect their lives, rather than through elected representatives. Can take different forms, including Citizen Assemblies. In East Ayrshire, communities have created 30 community-led action plans, supported by facilitation from the council.
E.g. Participatory democracy - what does it mean for elected members?55
54 Blaenau Gwent Climate Assembly
55 Participatory democracy - what does it mean for elected members?
Conclusion
“We have everything we need, if we use what we have”56
Devolution and Local Government Reorganisation present a once in a life-time opportunity to re-examine and re-shape the operating model for local government. To finally focus on building better relationships between local people and public systems, by giving them more power over the decisions that affect them and more equitable access to the resources local government and other partners hold. To work at a scale of place that people identify with, enabling community power, and investing in preventative, relational and asset-based ways of working. To move this practice into the mainstream by embedding it fully in the operating model, culture and core practice of the new strategic authorities.
Doing so promises better long-term outcomes for people and communities than our current top down, one-size-fits-all model. It allows places to have an identity that communities can engage with and responds to inequalities in assets, strengths and needs. It supports improvements for people and places through the focused efforts of the council, partners and residents on shared problems and builds local capacity, belonging and pride. It will support democratic renewal, rather than the disengagement we are experiencing today.
There is a wealth of good examples of place-based, relational practice happening across the country. We need to build new strategic authorities that can work at the human scale, accommodating human needs and human relationships, and at a system scale, connecting, coordinating and stewarding all the resources that will enable people and places to flourish.
Local Government Reorganisation has the potential to catalyse a step change into a different and better future and help repair the threadbare social fabric in our neighbourhoods.
This is a golden opportunity - let’s not waste it!
56 Edgar Cahn
Appendix A: What is place-based working?
“A place-based approach is a systems approach within a defined location, such as a suburb or small town. Restricting the scope of work to a geographic location can help in pinning a systemic issue down to a manageable size.”57 —
As with all systems change approaches, place-based work tends to go beyond programmatic activities focused on specific outcomes and instead tries to address the deeper systemic causes of a problem. From a service perspective it is often about getting upstream of a problem and creating the conditions that will prevent a problem occurring or proliferating over the long term or addressing failures in the services that create more demand.
Place-based approaches centre communities rather than services. Community members are involved in decision-making, with their aspirations for their lives and their place anchoring the work.
Common characteristics of place-based approaches include:
● working with communities to identify and work on collective priorities, valuing local over professional/expert knowledge and building relationships within and between groups and with sources of power and resource (bonding, bridging, linking capital)
● working with VCFSE organisations and / or community anchors as a source of trusting relationships
● focusing on strengths (or assets) to build the conditions that prevent problems from happening, or reduce their impact, rather than just intervening at a point of crisis
‘Community’ in this context can be taken to mean people brought together by geographic boundaries. However, some place-based approaches target more specific populations within that geography, communities brought together by identity, experience, interest or action.
Place-based approaches can take in population sizes from 100,000 (the average for a London Borough) to 150 people at a hyper-local level.
That population may live in dense urban areas or be more spread out across rural districts – geographical size is less important than whether there is a community of people that connects and identifies as a community.
57 Dr Jess Dart, Clear Horizon
What is a neighbourhood?
Neighbourhood approaches are contained within this broader 'place-based’ definition, along with many other scales of place, some defined geographically such as a street or village, some with boundaries constructed for administrative reasons like LSOAs, wards and localities.
Neighbourhoods are hyper-local communities of place. However, a “universal and generalisable definition of neighbourhood does not exist.”58
Two different models for understanding ‘neighbourhood’ currently dominate – one based on top-down administrative boundaries, the other defined by residents or communities themselves.
Unhelpfully, the NHS Long Term Plan uses its own definitions of place, with three different levels at which decisions are made:
● Neighbourhoods (populations circa 30,000 to 50,000 people) – served by groups of GP practices (PCNs)
● Places (populations circa 250,000 to 500,000 people) – served by a set of health and care providers in a town or district, connecting primary care networks to broader services including those provided by local councils, community hospitals or voluntary organisations.
● Systems (populations circa 1 million to 3 million people) - in which the whole area’s health and care partners in different sectors come together to set strategic direction and to develop economies of scale.
This definition of neighbourhood is significantly larger than others. Many local authorities have struggled with this, and the lack of coterminous boundaries – wards rarely map to PCN footprints and so have adopted the term ‘locality’. Some London boroughs have created new administrative boundaries in which two localities exist with a single PCN boundary.
None of these fictitious boundaries map to what local communities might identify as their neighbourhood. Approaches based in community development rather than service delivery tend to start with an invitation to residents to define their own neighbourhood boundaries based on their personal experiences, perceptions and relationships.
This can surface valuable insights into neighbourhood dynamics, social networks, and local identities. However, as the boundaries captured are subjective and personal they are unlikely to be consistent across a whole community, which can be challenging for those hoping to target policy decisions or capture and compare data.
58 The evidence for neighbourhood focused regeneration, Independent Commission on Neighbourhoods (ICON)
Each model produces different results in determining how many people or households may live in a neighbourhood. However, there is some consensus that the primary school is the last neighbourhood-scale institution and central to the way families with young children may conceive of their neighbourhood. Other ‘connecting places’ such as a place of worship, a parade of shops or a park may serve the same purpose for other members of the community. Similar consensus was seen in the notion that a neighbourhood is a place where you can comfortably walk to local amenities within 15 minutes.
The model chosen is important “because it influences how policy is targeted, implemented and evaluated; it informs which groups/areas are subject to the intervention and how data is collected and analysed.”59
Who chooses which model to use is also key to understanding where power lies and the extent to which the people any intervention may be aimed at will recognise and identify, or care about, the place being described.
This report focuses on the smaller end of the scale - localities, wards and neighbourhoods.
59 The evidence for neighbourhood focused regeneration, Independent Commission on Neighbourhoods (ICON)
Appendix B: Examples of Practice
Case in practice: Local Conversations, People’s Health Trust (2014-2023)60
The Local Conversations programme, funded by People’s Health Trust, was a long-term grant initiative supporting residents in 13 neighbourhoods across Great Britain experiencing high levels of disadvantage. Through Local Conversations, local people came together to identify and agree local priorities, and then take action to help address them, utilising the flexible funding model of the programme.
Evaluation undertaken by the New Economics Foundation found that the programme:
● led to improved social and personal wellbeing including greater social connectedness and sense of belonging
○ Survey results showed that 65% of respondents agreed or strongly agreed that their Local Conversation had helped them feel more confident
○ 62% said their Local Conversation had helped them develop and learn new skills.
○ participants reported being more satisfied with life, less anxious, and more likely to feel that what they do is worthwhile –compared to both national averages and other similarly disadvantaged neighbourhoods.
● helped local lead organisations and residents access additional resources.
○ On average, lead organisations secured between £192,000 and £216,000 in additional funding, which they attributed to their involvement in Local Conversations.
• supported residents to increase their engagement with local decision-makers by building their capacity for influence through stronger relationships with local organisations and institutions. In 2019, 14 out of 16 neighbourhoods were attempting to influence people in power, including councillors, MPs, and NHS leaders.
The Old Ford and Nest Estates Local Conversation (Gateshead) led to partnerships with schools, universities, local authorities, a counselling organisation, and GPs. As a result of these partnerships, community development workers were based in GP surgeries to support patients with non-clinical issues. Their evidence showed that patients accessing the scheme reduced their appointments by over 25%, saving money and ensuring people were receiving the support they needed.
60 Evaluating the impact of Local Conversations 2016 - 2021, People's Health Trust
Case in practice: Community Health and Wellbeing
Workers61
The Community Health and Wellbeing Worker (CHWW) model originated in Brazil – where it now forms the foundation of primary care for over 70% of the population. More recently, the model has been adapted in England to provide integrated, preventative support at the heart of neighbourhoods.
CHWWs are recruited from the communities they serve. They are not medical professionals, but trusted local people selected for their empathy, integrity, cultural competence and persistence. Operating across small geographies of 120–150 households, they make monthly visits to every home (regardless of need) to build relationships and offer holistic, proportionate support.
Working within the CHUI framework (Comprehensive, Hyperlocal, Universal and Integrated) CHWWs proactively address physical, mental and social wellbeing. Their role is to understand the whole household, build alliances with GPs, local authorities, and community services, and act as advocates, navigators, and early responders to a range of needs. In Westminster, where the model was first implemented in the UK results have shown that:
● The households were 47% more likely to have immunisations that they were eligible for and 82% more likely to have cancer screenings and NHS health checks.
● There was a 7.3% reduction in unscheduled GP consultations among these households.
● Residents were appreciative of the ease of access, support and comprehensive approach provided
● Engagement had been maintained with 60% of residents and increasing. Residents who engaged with CHWWs did not disengage
● Multiple instances of issues being unearthed around suicidal ideation, child carers, domestic violence and intractable housing.
Additionally, in Cornwall, the model showed a 90% improvement in resident wellbeing (as measured by the MyCaw tool),
Now operating in over 25 sites across the UK, the CHWW model exemplifies what can happen when services shift from reactive to proactive, and from transactional to relational. By embedding trusted local connectors into neighbourhoods, councils and NHS partners can reduce pressure on services, uncover hidden and unmet needs, and rebuild trust in public systems.
61 Community Health and Wellbeing Workers (CHWW) Programme, National Association of Primary Care
Case in practice: Local Community Networks62 in Somerset63
Somerset's Local Community Networks (LCNs) are a central part of its place-based strategy. There are 18 LCNs covering the Somerset Council area, acting as the ‘voice’ of local communities and serving as hubs for engagement, partnerships and local decision-making. Key functions of Somerset’s LCNs include:
● Community engagement: LCNs facilitate effective local engagement, ensuring residents, businesses, and partners can influence council activity and service delivery.
● Democratic participation: LCNs promote active community decision-making, scrutiny, and enhanced participation in local democracy.
● Collaboration: LCNs bring together representatives from partner organisations, city, town and parish councils, community groups, and others to share information, ideas, and solutions.
● Local influence: LCNs help to ensure that local priorities across economic, social, and environmental issues shape council and public service activity.
● Resource mobilisation: LCNs identify and secure resources for local projects.
The establishment of these community networks in Somerset is part of a move to ensure that all of Somerset is ‘parished’, involving the devolution of assets and services to town, city and parish councils.
A consultation conducted in Somerset (with representatives from the public sector, private sector and voluntary and community groups as well as some residents) to understand the level of support for change to Somerset’s local authority structure to one unitary authority, found that “there was recognition of the difficulty of reconciling scale with connection to localities, but an enhanced role for parish and town councils was seen as a possible solution”.
Somerset Council believes that devolving power and resources to the councils and organisations that are at the real heart of its communities will provide a focus for local engagement and become the channel for local views, feedback, consultation and communication. Beyond this, they see the move towards a more localised approach as holding value not just within the unitary authority, but also through the closer connections it will create with other local public services, notably the NHS, schools, and the voluntary sector.
62 Local Community Networks: Questions and answers, Somerset Council
63 One Somerset Business Case: Final Submission, Somerset County Council
Case in practice: A New Era for Wigan64
Wigan Council is recognised nationally for its work in public service reform through the Wigan Deal: an asset-based approach launched in 2012 in response to austerity. The Deal reframed the relationship between Wigan council and residents, encouraging co-production and strengths-based support which necessitated services which are built around individuals and families. This movement for change has enabled Wigan council to deliver over £180 million in efficiencies whilst improving services and maintaining the lowest council tax rate in Greater Manchester.
Underpinned by behaviours such as ‘Be kind’ and a culture which encourages staff to work differently, Wigan’s approach gives staff the freedom to take relational and person-centred approaches which prioritise the wellbeing and independence of those they work with. Wigan’s approach has resulted in improved staff satisfaction, stronger partnerships with the VCSE sector and a shared sense of purpose across their services.
In 2024, Wigan launched its new ten-year vision: Progress with Unity which builds on the success of the Deal while intensifying the focus on collaboration, tackling inequality, and integrated place-based delivery.
A key feature of Wigan’s new approach is its shift to smaller-scale, neighbourhood-based delivery. For example, adult social care has been recommissioned using a neighbourhood model, with teams empowered to deliver asset-based, relational support grounded in local knowledge and collaboration.
64 A new era for Wigan Borough: from The Deal to Progress with Unity, Collaborate & Wigan BC; A citizen-led approach to health and care: Lessons from the Wigan Deal, The King’s Fund
Seven ‘service delivery footprints’ have been established in the borough to reflect ‘natural communities’. These footprints serve as the foundation for integrated, multi-agency teams working from shared neighbourhood hubs. Wigan has found that co-located working in these hubs enables rapid, place-sensitive responses to local needs and that working at a neighbourhood scale ensures that public services are better connected to the lived realities of communities, fostering trust, responsiveness and improved outcomes. Some of these improved outcomes outlined by the Kings Fund 2019 report include:
● Increase in healthy life expectancy between 2016 and 2019
● Improved school readiness between 2016 and 2019
● Increase in physical activity between 2012 and 2015
● A higher rate of older people still at home 91 days after discharge than in England as a whole
● High rate of care home quality improvement
● Lower emergency re-admissions from care homes than England average
● Low rates of delayed transfer of care from hospital
● High rate of decrease in rates of premature mortality from cardiovascular disease and of premature mortality from cancer
Case in practice: Changing Futures Northumbria65
Gateshead Council has been experimenting with Public Service Reform prototypes since 2018, with its inaugural experiment focussing upon the use of council tax arrears as a signal of people requiring more holistic and bespoke support through relational approaches to public service.
Learning from these early prototypes led to the creation of the ‘‘Liberated Method’’ which is focussed on freeing up the creativity and compassion of front-line caseworkers, delivering more focussed and effective support by co-creating solutions and approaches with citizens, and building towards sustainable outcomes that stand a greater chance of reducing demand into services into multiple services, thus reducing costs and by being more effective, reducing inequality.
This approach has broadened beyond the initial Gateshead focussed prototypes in a regional programme. Changing Futures Northumbria (CFN) is a collaboration across six local authority areas (Gateshead, Newcastle, North Tyneside, Northumberland, Sunderland and South Tyneside) and includes partners from voluntary and community sector, probation, police and CCGs/ Foundation trusts.
65 Changing Futures Northumbria Example of Practice, Human Learning Systems
Case-by-case comparisons of the public service resource use of those they have supported, before and after the involvement of Human relational service.
Changing Futures Northumbria found that a person they had been supporting, who had used over £450,000 of public service resource in the year prior to his engagement with their support, reduced his public service use to 0.3% of that level, within 18 months of being supported in a Human relational way, using only £1,932 in months 12 to 24 following the Changing Futures Northumbria intervention.
Case in practice: Asset Based Community Development in Leeds66
Asset Based Community Development (ABCD) is a core element of Leeds City Council’s approach to public service. ABCD is a neighbourhood-based model that focuses on identifying and harnessing local strengths, relationships, and networks to support citizenled change. By 2022, Leeds’ ABCD programme included 14 ‘Pathfinder’ communities each with access to a Community Builder to identify people active in the community and bring others together, and council-funded ‘Small Sparks’ grants to develop and deliver ideas.
ABCD has also informed Leeds’ broader vision for adult social care, as expressed in its ‘Better Lives Strategy’ (2022-2027) which integrates housing, libraries, culture, parks and transport with care and support services. Central to this strategy is the belief that communities and the relationships within them are essential to people’s wellbeing.
Leeds’ commitment to relational, strength-based practice is also reflected in initiatives like “Talking Points,” which embed social workers directly into neighbourhoods, and its long-standing Neighbourhood Networks programme for older people.
A co-produced evaluation by Leeds Beckett University, Leeds City Council and community organisations found that ABCD has “supported better social connections and new friendships, with greater community cohesion: bridging differences in generations and neighbourhoods being more inclusive of people with disabilities.”67 Financially, the evaluation estimated up to £14.02 of social value returned for every £1 invested.
66 Better Lives Strategy 2022–2027, Leeds City Council
67 Asset Based Community Development and supporting the community response to Covid-19, Leeds City Council and Asset-Based Community Development: Evaluation of Leeds ABCD Programme, Leeds Beckett University
Case in practice: Participatory budgeting in Barking and Dagenham68
Barking and Dagenham is reshaping how local resources are allocated and how communities shape their future, placing participation, collaboration, and inclusion at the heart of its approach. Through Barking and Dagenham Giving (BD Giving), the borough has created a model that challenges traditional grant-making and investment by shifting decision-making power directly into the hands of local people.
BD Giving was established in 2020 as the UK’s first 100% community led investment fund. It recognised that many residents feel excluded from the economy, financial sector, and funding systems, which are often seen as disconnected and technical. By providing a safe and supported environment for residents to engage in grant-making, investment, infrastructure development, research, and advocacy, BD Giving aims to open up new opportunities for people to lead and influence the systems that affect their lives.
A core feature of BD Giving’s work is the Community Steering Group (CSG), a group of twelve local residents who meet regularly as a learning community and manage an investment fund. CSG members are paid for their time, underpinned by the belief that civic participation should be open to everyone, not just those who can afford to give their time for free.
As of May 2025, BD Giving has distributed over £950,000, including ~£778,000 in grants and approximately £77,000 distributed to the residents involved in participatory decision-making processes.
The largest share of BD Giving’s grant funding has gone towards Employment, Skills, and Enterprise, largely driven by their GROW Fund, which supports local businesses in scaling up and seeking further investment. Following this, funding is almost evenly distributed across arts, health, community cohesion, and education initiatives.
BD Giving’s approach is about more than distributing money however; it is about building the capacity and confidence of residents to shape their neighbourhoods. Residents who participate in BD Giving’s work report feeling more aware of local issues, more likely to engage in democratic processes, and more connected to their community. As people participate, their confidence grows, prompting them to question existing systems and explore new approaches. The process aims to build sustained civic engagement, as participants become more likely to volunteer, support local initiatives, and take ownership of community outcomes.
By putting control over resources into the hands of local people, the borough is building capacity for long-term change, equipping communities to think deeply about how to address complex social issues, and ensuring that public services are better connected to the lived realities of residents.
68 Barking & Dagenham Giving, BD Giving; Impact Dashboard, BD Giving; Strategy 2023–2026: Invested for the Long Haul, BD Giving and GROW Fund Year 1 Learning Report, BD Giving; Trustees’ Report and Consolidated Financial Statements for the Year Ended 31 March 2024 for Barking and Dagenham Giving, UK Charity Commission
Case in practice: Community Wealth Building in Lewes69
With a population of around 100,000, the district of Lewes in East Sussex is a site of both prosperity (in the county town of Lewes and much of the countryside) and considerable deprivation (in the coastal towns of Newhaven, Peacehaven and Seaford, as well as in some rural areas).
Since 2019 the council have focussed on how they can use their advantages to build and strengthen the local economy through business growth and local job creation.
With flooding and coastal erosion a continual threat, the climate crisis is an all-too present reality in Lewes and has provided a focus for the work.
The council has committed to a sustainable approach to procurement as part of meeting the council’s climate objectives and wider environmental ambitions, but it is also about generating local wealth for the economy and providing opportunities for community groups in a way that is interconnected.
Analysis of the council’s spending on goods and services to measure what proportion of spending is within the district. The council has almost doubled its spending with local suppliers from £5.4 million in 2020-21 to 10.1 million in 2023-24, 25% of total spend.
The council owns a significant amount of buildings and land in the district. They are working to maximise community benefit and community wealth building opportunities, and have moved their offices to Newhaven and leased them to a local arts organisation, growing the visitor economy.
In Newhaven, several under-utilised buildings in the Town Centre are currently being developed to create a new health and wellbeing hub for the town.
The council’s housing delivery programme has prioritised building on brownfield sites, which are typically ignored by the private sector due to the additional challenges and costs involved. Opportunities for apprenticeships and work placements are integrated and embedded within these building projects.
69 Community Wealth Building in Lewes, CLES
Case in practice: Active councillors - Barnsley Metropolitan Borough Council70
Barnsley MBC has created a structured approach to reshaping councillors’ relationships with residents. 63 elected members, representing 21 wards, sit across six area councils. These area councils use local intelligence gathered directly from residents – alongside national datasets like the census – to set priorities and allocate localised funding through commissioning and grant-making.
Complementing this are Barnsley’s ward alliances, which bring together councillors and active local citizens to jointly plan and deliver improvements in their neighbourhoods.
Anyone involved in a community group or project can apply to be part of a ward alliance. Each alliance develops its own community plan and manages a Ward Alliance Fund, providing small grants to grassroots initiatives that help deliver local priorities.
This structure is part of a shift that the Council are undertaking in how they work with communities. The council deliberately created a space in every community for people to come together, get involved, and co-produce solutions to local challenges.
70 Your local area and ward, Barnsley Council;
Case in practice: Plymouth Family Hubs71
Plymouth’s family hub programme was launched in 2022 following a consultation with families and practitioners across the city which highlighted how fragmented the system had become, and the challenges people had in navigating it.
Funded through the government, Plymouth’s Family Hubs aim to integrate early help, health, education and community services into a single network that supports families locally. The Family Hub programme seeks to reorient support around each family’s unique context, using trauma-informed, strengths-led and relational approaches, summed up as ‘Right support, right place, right time’.
As part of the programme, Children’s centres across the city are transformed into Family Hubs for children aged 0-19 (0-25 for SEND). Schools, GPs, Job Centres and other community partners become part of a shared network so that parents can access support with a ‘no wrong door’ approach.
Key to the programme is an asset based community development model which aims to connect people together locally, build on strengths and upskill communities. This approach also includes the appointment of a Community Builder for Family Hubs who works alongside the families supported by the Hub.
Between 2023 and 2024, Plymouth’s Family Hubs were in contact with local families more than 29,000 times, covering everything from initial contact and signposting to group activities or 1 to 1 support.
71 Plymouth Family Hubs: A Human Learning Systems Case Study, Human Learning Systems
Case in practice: Adult Social Care in Somerset72
Somerset’s adult social care strategy prioritises prevention, early intervention, and strong connections with neighbourhoods and communities. This approach is grounded in their 2020 business case “One Somerset” which sets out their vision for a new single unitary council for Somerset and the approach is designed to support demand management, enable choice, and reduce long-term care needs.
A key part of Somerset’s approach to adult social care is the support for micro-providers – small, community-based care and support services that are independent of larger organisations. Since 2015, Somerset has supported the development of 1,250 new microproviders, who deliver over 30,000 hours of care weekly to nearly 6,000 people in Somerset. The increased capacity of local, responsive support has enabled:
● Local support: people are supported at home or in their communities by providers from their neighbourhoods, fostering trust, flexibility, and continuity of care.
● Cost-effective services: the cost of care delivered by community enterprises is lower.
● People and families know good support is available. As a result, people come home earlier from hospital and more people access direct payments (where families receive funds to arrange their own care), which similarly have lower costs associated with them than commissioned care.
● People-centred support: people design support together that is more personalised. “Creative people on both sides of the care equation find ways to do things differently”.
“The distinctive contribution of microenterprises appears to be the ability to offer more personalised and valued care without a high price tag.” 73
Somerset’s adult social care strategy is also underpinned by strong partnerships with the voluntary and community sector, NHS, and local provider networks. Their collaborative ethos supports coproduction, shared learning, and system-wide improvement.
72 Get help at home with micro-providers, Somerset Council; One Somerset Business Case: Final Submission, Somerset County Council; Somerset Council
Adult Social Care Preparation for Assurance peer challenge report, Local Government Association
73 Micro-enterprises: Small enough to care? Summary Report, University of Birmingham
Case in practice: Local Area Coordination in Swansea74
Swansea’s Local Area Coordination (LAC) programme is part of the council's Tackling Poverty Service based within Adult Services. The programme covers the whole county and aims to ensure that every community has access to support grounded in trusted relationships and local knowledge.
Local Area Coordinators are embedded within specific neighbourhoods, and they work without referral thresholds, time limits, or rigid service criteria. They ‘walk alongside’ individuals and families to understand their strengths, relationships and hopes for a good life, helping them to make connections, build confidence and resilience, and reduce their reliance on formal services.
In 2023, over 1100 people in Swansea were introduced to a Local Area Coordinator, with 1,172 people supported on an ongoing basis. Nearly a third of these introductions were self-referrals or came through informal, community based routes, such as neighbours, friends, or local councillors, highlighting how these roles are embedded within the community. Local Area Coordinators also helped facilitate 28 new community groups and supported nearly 100 others to access funding – bringing over £85,000 into local communities via the council’s Enabling Communities Fund.
The Local Area Coordination model is explicitly designed to be place-based and relational and it is recognised across Swansea as a key part of the delivery of the Social Services and Well-being Act (Wales). Its effectiveness is reflected in academic evaluations: a Swansea University study found that for every £1 invested, LAC returns
£2–3 of savings to the wider system, and a comparative study funded by the National Institute for Health and Care Research highlighted LAC’s consistency across contexts and its unique ability to connect individuals, communities and services.
Swansea’s Local Area Coordination model has won national awards for inclusion and cohesion and holds strong political and cross-sector support. Local councillors, GPs, social prescribers and community partners praise the model for enabling collaborative, responsive, and compassionate support that is grounded in the realities of people’s lives.
74 Local Area Coordination: Impact Report 2023, Swansea Council
Case in practice: Community Micro-enterprise Programme75, South Lakes, Furness & Eden
The area of Westmorland and Furness is geographically the third largest local authority in England and home to approximately 225,000 people. Some of the county towns are in rural areas, which can limit the choice of local services and support available.
Over 2022-24 Community Catalysts partnered with Westmorland and Furness Council to increase the number of community microenterprises in the area providing care and support.
Outcomes
● Established network of responsive, high-quality, and sustainable community micro-enterprises that provide a wider choice of care and support to older and disabled people in their homes.
● 26 local jobs created - people can work locally, earn an income and make a positive difference.
● Increased the local care and support offer, with 125 people receiving 400 hours of support each week. (25 using direct payments, 100 self-funded).
● Reduced unmet need and - commissioners, local health and social care teams and people seeking care and support know that good support is available. As a result, people can choose from a range of care and support options locally.
● Increased choice and control over the support they choose - there is more choice locally for people who draw on care and support and people can choose to have a Direct Payment to pay for their support from a community micro-enterprise.
● Improved quality of service - personal relationships are at the heart of the community micro-enterprises. They offer support that is flexible and responsive to the person’s needs, and foster rich connection with others, which supports people’s quality of life.
● The money flow stays within the local economy.
A local social worker said:
“I have found the Community Catalyst and the community enterprises really useful, and I’ve used them a lot… there has 100% been a reduction in unmet need”.
75 Community micro-enterprise development in Westmorland and Furness, Community Catalysts
Case in practice: Levenshulme Inspire76
In Levenshulme, located four miles south-east of Manchester city centre, local residents and organisations came together to form Levenshulme Inspire – a not-for-profit community enterprise and place-based partnership dedicated to transforming the area through creativity, community, enterprise, and fun.
At the heart of the initiative is the Inspire Centre, a community hub owned by the people of Levenshulme. Developed from the redevelopment of a former United Reformed Church, the Centre was made possible through a collaborative £3 million investment involving the Homes and Communities Agency, Big Lottery Fund, Manchester City Council, and others. The result is a multi-use space comprising a café, community rooms, a business centre, and affordable apartments – all under one roof.
The Centre is more than a venue; it is a trusted local anchor. It brings together residents, local businesses, and voluntary sector partners to offer everything from warm spaces, food support, and creative projects, to enterprise mentoring and adult learning.
During the Covid-19 pandemic, the Inspire Centre became a lifeline for the community which supported local people in some of the following ways:
● 3,690 emergency meals and 2,000 food boxes were distributed in 14 weeks.
● ~44 tonnes of food were distributed via the centre.
● The Inspired Taskforce, a peer-led group of older people delivered meal buddies, phone support, and wellbeing packs
● New programmes like “Starting Plates” helped new parents learn cooking and nutrition skills in safe, supportive spaces.
● Inspire partnered with the NHS to train and deploy Covid Connectors who built vaccine confidence through peer-led conversations in marginalised communities.
Beyond this, Levenshulme Inspire has continued to drive recovery and local economic inclusion. Through training, mentoring and enterprise activities, they have supported local residents into employment, started micro-businesses, and strengthened digital and social infrastructure. Arts and community heritage projects such as the “Home Is Where the Hope Is” community quilt helped people reconnect and reflect on the emotional toll of the pandemic.
76 COVID Impact Report 2020/2021, Levenshulme Inspire; How to Set Up, Run and Sustain a Community Hub to Transform Local Service Provision, Locality
Case in practice: Community Asset Transfer, Bramley Bath in Leeds77
Community Asset Transfer refers to the transfer of ownership or management of public land and buildings – typically from a local authority to a community organisation – at less than market value. This approach is based on the expectation that the asset will generate long-term local social, economic, or environmental benefits.
Bramley Baths, a Grade II listed Edwardian facility in Leeds, was transferred to community ownership through Community Asset Transfer and reopened in 2013 following threats of closure due to local authority budget cuts.
Since the transfer, Bramley Baths has developed into a sustainable, community-led facility. Opening hours have doubled, and the Baths now operate seven days a week. The organisation employs 38 staff and recorded a £63k surplus in 2016/17. Additionally, the number of children receiving weekly swimming lessons increased from 950 to 1,700.
The Baths also offer inclusive and targeted programming, such as tailored sessions for children with Down syndrome and safe spaces for transgender and non-binary adults. Additionally, a lifeguard training scheme supports skills development and job opportunities for local young people.
In recognition of its performance and sustainability, Leeds City Council granted the organisation a new 50-year lease in 2017.
77 Building Powerful Communities Through Community Asset Transfer, Locality
Plymouth Octopus Project78
Plymouth Octopus Project Plymouth Octopus Project POP is a collective in Plymouth dedicated to supporting communities, citizen action, and grassroots activity. Their work is rooted in a decade of building networks, offering capacity support, experimenting with grant-making, and being a voice of strategic change. POP aims to fulfil two roles in Plymouth. As Grassroots Champion they connect, support, and amplify the voice of communities and the grassroots, so that people can shape and improve the places in which they live. As system stewards, or what they call System Convener, they ‘bring together different sectors, opinions and perspectives into liminal space to find shared ways forward, with an aim for Plymouth to be able to demonstrate more just, fairer, and greener approaches in the work we do.’ Over the last 3.5 years POP say they have been learning how to collaborate and how to go from listening to influencing the ‘system’, which they define as Plymouth, the place.
For example, POP convenes ‘Belong in Plymouth’, which aims to create a movement to make Plymouth a city where no one feels forgotten, a city that is inclusive, welcoming, and supportive of all its residents. The goal is to bring people together to share ideas, resources, and experiences that will help build a stronger, more connected community. ‘Belong in Plymouth’ is a partnership between the health sector, the local authority and the voluntary sector. Its focus is on tackling loneliness and social isolation and creating a city where everybody feels like they belong. The work is very emergent, based around experimentation, building trust, learning and relationships.
78 Plymouth Octopus Project, System Stewardship in Practice: What It Is and How to Get Started, Collaborate CIC
Case in practice: Social Prescribing79
Since it was included as part of the NHS Long Term Plan in 2019, social prescribing has become a key part of the move towards personalised care in England. The social prescribing model enables health professionals to refer people to Social Prescribing Link Workers who support them to access non-clinical services in their own neighbourhoods– such as community groups, financial advice, housing support, physical activity or befriending.
Over 3,500 Link Workers are now embedded within primary care networks across England, receiving more than 2.7 million referrals since 2019. Their role is to listen, build trust, and work with individuals to understand their personal circumstances and goals. Link Workers then connect people with services and social support rooted in their local communities, helping to address the wider determinants of health.
Evaluations across the country show that social prescribing can not only improve wellbeing but also significantly reduce pressure on health services:
● In Tameside and Glossop, an evaluation of 1,751 referrals showed a 42% drop in GP appointments.
● In Kent, A&E visits reduced by up to 23% for the 5,908 people supported.
● In Kirklees, support for frequent service users led to 50% fewer GP appointments and 66% fewer A&E attendances.
● In Rotherham, frequent A&E use reduced by up to 43%, with cost reductions of up to 39%.
Social prescribing has also shown positive economic returns:
● In Newcastle, secondary care costs were 9% lower than in a matched control group.
● A national evaluation of the Green Social Prescribing programme found a social return on investment of £2.42 for every £1 invested, alongside significant improvements in wellbeing based on ONS wellbeing measures.
79 The Impact of Social Prescribing on Health Service Use and Costs: Examples of Local Evaluations in Practice, National Academy for Social Prescribing
Appendix C: References
With thanks to John Hitchin of Place Matters, Lewis Greenwood of Wigan Council, and Rhys Davies of Somerset County Council for taking the time to help us understand their work.
Buck, D., Baylis, A., Dougall, D. and Robertson, R. (2018). A vision for population health: towards a healthier future. The King’s Fund. Available at: https://assets.kingsfund.org.uk/f/256914/x/25fa862dd5/vision_for_population_health_2018. pdf
Naylor, C. and Wellings, D. (2019). A citizen-led approach to health and care: Lessons from the Wigan Deal. The King’s Fund. Available at: https://assets.kingsfund.org.uk/f/256914/x/7f008d393b/wigan_deal_2019.pdf
Dougall, D., Lewis, M. and Ross, S. (2018). Transformational change in health and care: reports from the field. The King’s Fund. Available at: https://assets.kingsfund.org.uk/f/256914/x/aebb004a79/transformational_change_reports_f rom_field_2018.pdf
Greater Manchester Combined Authority. (2018). The Greater Manchester Model: Further, Faster – Reforming Public Services. Greater Manchester Combined Authority. Available at: https://www.greatermanchester-ca.gov.uk/media/1676/greater-manchester-model.pdf
Lowe, T. and Hesselgreaves, H. (2024). Effects of working in a Human Learning Systems way. Human Learning Systems. Available at: https://www.humanlearning.systems/uploads/EffectsofworkinginanHLSway.pdf
Dodd, E. (2025). A vision of the collaborative relationships, partnerships and leadership needed to make the English Devolution White Paper work. Collaborate CIC. Available at: https://collaboratecic.com/insights-and-resources/a-vision-of-the-collaborative-relationships -partnerships-and-leadership-needed-to-make-the-english-devolution-white-paper-work/
Pollard, G., Studdert, J. and Tiratelli, L. (2021). Community Power: The Evidence New Local. Available at: https://localtrust.org.uk/wp-content/uploads/2021/02/Community-Power-The-Evidence-FIN AL.pdf
Downham, N., Malby, B. and Jansen, P. (2024). Developing Integrated Neighbourhood Teams 1: Learning from the Humber and North Yorkshire Health and Care Partnership (HNYHCP) Integrated Neighbourhood Teams Leadership & Development Programme. PCN Academy. Available at: https://www.pcnacademy.org.uk/blogs/int-insights-1
Leeds City Council. (2022). Better Lives Strategy 2022 to 2027. Leeds City Council. Available at: https://www.leeds.gov.uk/plans-andstrategies/better-lives-strategy
Renaisi. (n.d.). Place-based and systems change evaluation Renaisi. Available at: https://renaisi.com/improve-impact/place-basedsystems-change-evaluation/
O’Flynn, L., Jones, N., Jackson-Harman, K. and Chan, J. (2023). Five years of Empowering Places: Evaluation report no. 5. Power to Change. Available at: https://www.powertochange.org.uk/wp-content/uploads/2023/08/Five-years-of-Empowerin g-places-Evaluationreport-no.5.pdf
New Economics Foundation, and People’s Health Trust. (2022). Evaluating the impact of Local Conversations 2016–2021. People’s Health Trust. Available at: https://files.peopleshealthtrust.org.uk/production/documents/Evaluating-the-impact-of-Loc al-Conversations-2016-to2021_2022-06-25-155752_lrps.pdf
Randle, A. and Plimmer, D. (2025). A new era for Wigan Council: From The Deal to Progress with Unity Collaborate CIC. Available at: https://collaboratecic.com/wp-content/uploads/2025/02/2335-Progress-with-Unity_01-5.pdf
Diamond, N. and Murali, M. (2024). Camden Community Champions: Impact and Learning Report. Collaborate CIC. Available at: https://cdn.prod.website-files.com/6135e147ecf1c7c02e7131f4/6752160e24a38c5060224d 1e_Camden%20Community%20Champions%20Impact%20and%20Learning%20Report%20 FINAL%20Collaborate%20CIC%20010524.pdf
DCMS. (2022). Rapid evidence review of community initiatives. DCMS. Available at: https://www.gov.uk/government/publications/rapidevidence-review-of-community-initiative s
South, J., Woodward, J., Coan, S., Bagnall, A.-M. and Rippon, S. (2021). Asset Based Community Development: Evaluation of Leeds ABCD. Leeds Beckett University. Available at: https://eprints.leedsbeckett.ac.uk/id/eprint/7640/1/AssetBasedCommunityDevelopmentEva luationOfLeedsABCDPV-SOUTH.pdf
Independent Commission on Neighbourhoods. (2025). Think Neighbourhoods: A new approach to fixing the country’s biggest policy challenges. Independent Commission on Neighbourhoods. Available at: https://www.neighbourhoodscommission.org.uk/wp-content/uploads/2025/03/Think-Neigh bourhoods-Report-Web-FINAL-1.pdf
Lloyd, J. and Randle, A. (2020). Introducing New Operating Models for Local Government. Nesta and Collaborate CIC. Available at: https://collaboratecic.com/wp-content/uploads/2023/09/Introducing_New_Operating_Mod els.pdf
Neighbourly Lab. (2025). Making Sense of Belonging: CDIC Local Area Belonging Project. Neighbourly Lab. Available at: https://www.neighbourlylab.com/wp-content/uploads/2025/02/Making-Sense-of-Belonging
Social Life and Hawkins\Brown. (2021). Connective Social Infrastructure: How London’s Social Spaces and Networks Help Us Live Well Together. Greater London Authority.
Available at: https://www.social-life.co/media/files/connective_social_infrastructure.pdf
Kaye, S., and Woodward, I. (2025). Local, Actually: Establishing hyperlocal governance in England. Reform. Available at: https://reform.uk/wp-content/uploads/2025/04/Local-actually-final-document-pdf.pdf
Haldane, A. and Halpern, D. (2025). Social Capital 2025: The Hidden Wealth of Nations. Demos. Available at: https://demos.co.uk/wp-content/uploads/2025/01/Social-Capital-2025_The-Hidden-Wealth -of-Nations.pdf
Locality and Power to Change. (2018). Building powerful communities through Community Asset Transfer: A guide for councillors. Locality and Power to Change. Available at: https://www.local.gov.uk/sites/default/files/documents/OPE%20-%20publications%20-%20 Building%20powerful%20communities%20through%20Community%20Asset%20Transfer%2 0%28March%202018%29.pdf
Sinclair, N. (2024). An analysis of 6 stories of Local Area Coordination in Surrey: Positive changes and costs avoided. Community Catalysts. Available at: https://www.communitycatalysts.co.uk/lacnetwork/wp-content/uploads/sites/3/2024/04/An- analysis-of-6-stories-of-Local-AreaCoordination-in-Surrey-positive-changes-and-costs-avoid ed.pdf
Robinson, D. (2023). A world of good relationships: A public lecture as delivered by David Robinson at the LSE on 31 October 2023. London School of Economics and Political Science. Available at: https://docs.google.com/document/d/e/2PACX-1vRd3mUINSQk9MKVRWeEJVQX8IBrm4P SbeGgWZoKyXb1Jq4M0TLL7VVv3CLfVBiZvA/pub
Holt-Lunstad, J., Smith, T.B. and Layton, J.B. (2010). Social relationships and mortality risk: a meta-analytic review. PLoS Medicine, 7(7), e1000316. Available at: https://pubmed.ncbi.nlm.nih.gov/20668659/
Office of the U.S. Surgeon General. (2023). Our Epidemic of Loneliness and Isolation: The U.S. Surgeon General’s Advisory on the Healing Effects of Social Connection and Community. Office of the U.S. Surgeon General. Available at: https://www.hhs.gov/sites/default/files/surgeon-general-social-connection-advisory.pdf
Kroenke, C.H., Kubzansky, L.D., Schernhammer, E.S., Holmes, M.D. and Kawachi, I. (2006). Social networks, social support, and survival after breast cancer diagnosis. Journal of Clinical Oncology, 24(7), pp.1105–1111. Available at: https://pubmed.ncbi.nlm.nih.gov/16505430/
Waldinger, R. (n.d.). Harvard Study of Adult Development. Harvard Medical School and Massachusetts General Hospital. Available at: https://www.adultdevelopmentstudy.org/
Abel, J., Kingston, H., Scally, A., Hartnoll, J., Hannam, G., Thomson-Moore, A., and Kellehear, A. (2018). Reducing emergency hospital admissions: a population health complex intervention of an enhanced model of primary care and compassionate communities. British Journal of General Practice, 68(676), e803–e810. Available at: https://pubmed.ncbi.nlm.nih.gov/30297434/
Aldrich, D.P. (2023). How social infrastructure saves lives: a quantitative analysis of Japan’s 3/11 disasters. Japanese Journal of Political Science, 24(1), pp.30–40. Available at: https://www.cambridge.org/core/services/aop-cambridge-core/content/view/4BD3AA196B 334A23F0B749E85AE4E38F/S1468109922000366a.pdf
Local Government Association. (2024). Supporting the adult social care front door: A community coordinated approach (strategic overview) . Local Government Association. Available at: https://www.local.gov.uk/publications/supporting-adult-social-care-front-door-community-c oordinated-approach-strategic
Hannan, R. and Duffy, S. (2024). Neighbourhoods of Care. Citizen Network. Available at: https://citizennetwork.org/library/neighbourhoods-of-care.html
Leeds City Council. (2022). Asset Based Community Development and supporting the community response to Covid-19. Leeds City Council. Available at: https://news.leeds.gov.uk/leeds-spotlight/asset-based-community-development-and-suppo rting-the-communityresponse-to-covid-19
Appendix 7:
Equalities Impact Assessment (EIA)
Equality Impact Assessment
Local Government Reorganisation Proposal
Executive Summary
This Equality Impact Assessment (EIA) has been written to support the shared vision of 11 unitary, district and borough councils for the future of local government in Hampshire and the Isle of Wight. Local Government Reorganisation (LGR) will be the greatest change in local government in over 50 years, and we are committed to re-thinking how we deliver services and creating new local government structures that are built around our residents. LGR will impact individuals and communities across Hampshire and the Isle of Wight, especially those with protected characteristics under the Equality Act 2010.
This EIA is a high-level assessment, intended to consider and inform the strategic direction of the case for change, and the potential impacts our four new mainland and Isle of Wight unitary model may have on residents. It is intended as the beginning of the consideration of equality, diversity and inclusion. As we progress through LGR, additional, more detailed and targeted EIAs will be developed to support our communities, and our staff through the transition and help us ensure compliance with the Public Sector Equality Duty at every stage of the process. These will incorporate updated data, community insights, and feedback from service users to ensure a deeper understanding of evolving impacts.
Scope
Hampshire and the Isle of Wight is home to a diverse population, across urban, rural and coastal communities, each with unique identities and challenges. To properly assess the impact of our proposed approach may have on the population, this EIA includes all the protected characteristics, as well as the armed forces community, people experiencing socio - economic deprivation, and rural communities.
This assessment draws on data from the 2021 census and the Joint Strategic Needs Assessments for Hampshire and the Isle of Wight, Portsmouth and Southampton, all of which is publicly available.
Key Findings
LGR presents the opportunity to design localised, responsive, inclusive and integrated services. Our four new mainland and Isle of Wight unitary model leans into these opportunities, with services designed around how people live and work. Local governance would be tailored, coordinated and close, enabling improved responsiveness, robust local relationships, more inclusive engagement strategies and stronger partnerships. When designing services, the existing councils, who are already working together, would share good practice and learning , and ensure a balanced approach to rural and urban needs.
Potential risks identified apply to LGR and the period of transition ahead more broadly, such as disruption to service provision, loss of specialist knowledge, digital exclusion and loss of trusted relationships. Fragmentation of services is a risk that pertains to our approach. As the responsibility
of service delivery shifts from county to the unitaries, gaps in service integration may be temporarily exacerbated. To mitigate this risk, the existing council, partners and stakeholders will be co -designing future services, to ensure continuity and embed operational expertise.
This EIA also considers the workforces of the existing councils. LGR will likely bring substantial changes for staff, with potential new working practices, team structures and working environments. Potential risks identified at this stage are around staff wellbeing and support, and retention as well as the possibility of differing practices across the unitaries during the transition period. Clear and timely communication and engagement with staff will be increasingly important as LGR progresses and will help mitigate these risks.
Mitigations and Risks
The table below contains an overview of the risks and mitigations identified. Under each characteristic, risks are recognised, and all of the current mitigations can be found in section 16.
Risk Summaries
Disruption to trusted community relationships (e.g. LGBTQ+, faith groups, rural residents)
Fragmentation of services during transition
Workforce instability and loss of specialist knowledge
Risk of exclusion or inaccessible services (e.g. digital exclusion and cultural sensitivity)
Underrepresentation of groups in service design
Mitigation Summaries
Community engagement: ongoing, inclusive engagement ensures continuity, trust and visibility of diverse community voices in shaping services.
Stakeholder engagement and workshops: co - design with service leads and partners embeds operational expertise and continuity into future models.
Transition planning: builds on existing unitary structures and proven delivery models. Guided by shared principles focused on workforce wellbeing and continuity.
Inclusive service design: embeds local insight and co -production to ensure services are culturally competent, accessible and responsive to diverse needs.
Community engagement: ensures lived experience informs service transformation, particularly for groups at risk of being overlooked in structural change. A key principle of this proposal is that service delivery should align with distinct communities, engaging them upfront in the shaping of future service.
Disruption to characteristic specific or intersectional services
Transition Planning & Inclusive Service Design: maintains continuity of specialist services and ensures intersectional needs are embedded in future service models.
1. Introduction
Hampshire and the Isle of Wight is home to a diverse population of approximately two million people, spread across a mix of urban centres, coastal communities, rural areas, and the Isle of Wight. The area includes major economic hubs such as Southampton, Portsmouth, Winchester, and Basingstoke, each with distinct identities, strengths, and challenges.
Local Government Reorganisation (LGR) presents a significant opportunity to reshape how public services are delivered across this varied landscape, ensuring they are more responsive, resilient, and reflective of the way people live.
Eleven district, borough, and unitary councils across mainland Hampshire and the Isle of Wight have come together to propose a new model for local government: the creation of four new mainland unitary authorities, with the Isle of Wight retaining its existing unitary status.
Communities are at the heart of this proposal, aiming to provide high- quality, prevention focussed, financially sustainable and place-based services which are responsive to local needs. This structure is designed to align council boundaries with established economic areas and population centres, enabling more effective service delivery, stronger local leadership, and improved outcomes for communities.
This high-level Equality Impact Assessment (EIA) has been undertaken to explore how our four new mainland and Isle of Wight unitary authorities may affect individuals and communities, particularly those with protected characteristics under the Equality Act 2010. Given the size and diversity of the region, the assessment will also consider the impact on the Armed Forces community and areas experiencing different types of deprivation.
Any change carries potential risk, this EIA aims to highlight the key opportunities for our communities with a four new mainland and Isle of Wight unitary model, as well as begin to identify and mitigate potential risks. Supporting informed decision making with communities in mind, ensuring that equality, diversity and inclusion are embedded from the outset. This EIA also recognises the importance of the local government workforce in delivering high-quality, inclusive services. As the structure of local authorities change, so too will the working environments, patterns, and relationships that underpin effective service delivery. These high-level workforce factors will be explored further in the assessment to ensure that staff needs are considered alongside those of residents.
As the process to establish new unitary authorities progresses, more detailed and targeted Equality Impact Assessments will b e developed, incorporating additional data and community insights to ensure a deeper understanding of potential impacts.
1.1 Insights and Data
To inform this EIA data has been drawn from the 2021 census, Hampshire’s Joint Needs Assessment, Portsmouth’s Joint Needs Assessment, Southampton’s Joint Needs Assessment, the English Index of Multiple Deprivation. All of the data in this report, except where otherwise specified is from the 2021 census. 1
In this report, the area that currently makes up the county of Hampshire, including the Isle of Wight, Portsmouth and Hampshire is referred to as ‘Hampshire and the Isle of Wight’ and ‘Hampshire’. As such, when data refers to ‘Hampshire’ or ‘Hampshire and the Isle of Wight’, the data is the cumulative figure of the areas covered by the following local authorities:
Basingstoke and Deane Borough Council East Hampshire District Council Eastleigh Borough Council Fareham Borough Council Gosport Borough Council Hart District Council Havant Borough Council
Isle of Wight Council New Forest District Council Portsmouth City Council Rushmoor Borough Council Southampton City Council Test Valley Borough Council Winchester City Council
Alongside quantitative data, the twelve councils have undertaken extensive engagement with stakeholders and communities to ensure the proposals are shaped by local insight, shared priorities, and lived experience. Communication and engagement activities across Hampshire and the Isle of Wight have helped residents understand what local government reorganisation could mean for them and provided valuable perspectives on the options being considered. These conversations, through surveys, workshops, and deliberative sessions, have helped ensure that the voices of communities, particularly those most directly affected, are reflected in the development of the proposals, in this Equality Impact Assessment and future assessments going forward.
1 Information about the 2021 census can be found here: About census - Office for National Statistics
2. Age
2.1 Data Analysis
2.1.1 Hampshire and the Isle of Wight Analysis
According to the 2021 census, the population of Hampshire (including S outhampton, Portsmouth and the Isle of Wight) was 2,185,933. Overall, Hampshire and the Isle of Wight has an ageing population compared to the UK as a whole, with people aged 55 and above making up a larger portion of the population – 34.3% in Hampshire compared to 23.8% in the UK.
Those aged 75-85 and over make up a considerably larger proportion of the population, 7.2% compared 3.6% of the UK population. People aged 75 and over tend to be more reliant on council services than most of their younger counterparts.
Those aged 25-54 are represented relatively similarly in Hampshire and the Isle of Wight compared to the UK, though they make up a smaller portion of the population in Hampshire and the Isle of Wight – 39.3% compared to 43.0% in the UK.
Young people, between birth and aged 24 make up 26.4% of Hampshire and the Isle of Wight’s population, compared to 33.2% of the UK’s population. Those aged 18-24 are particularly underrepresented when compared to the national figures, 6.5% compared to 10.1% in the UK. However, this is similar to other, more rural areas, which consistently see people aged 18-24 leave for more urban settings.
2.1.2 District and Unitary Analysis
Hampshire and the Isle of Wight contains large areas of rurality, alongside smaller towns and more urban areas, so the districts that currently make up Hampshire and the Isle of Wight are very varied in their age profiles. The city unitaries of Southampton and Portsmouth, and the borough of Rushmoor have notably younger populations (aged 34 and under). The coastal borough of Fareham and the Isle of Wight have older populations (aged 55 and over). Winchester and Test Valley have incredibly similar age profiles; the largest difference is between those aged 25-34, 12.7% of the population of Winchester and 11.6% of the population of Test Valley. Basingstoke and Deane and Eastleigh also have similar age profiles, with the largest difference being between those aged 45-54,13.8% in Eastleigh and 14.8% in Basingstoke and Dean.
Age breakdown - Hampshire and the Isle of Wight against the UK (%)
19.9% of Hampshire and the Isle of Wight’s population is aged 17 or under. Using this as a base figure, Eastleigh with a 0-17 population of 19.9%, Hart with 22.2%, Rushmoor with 25.8% and Test Valley at 20.3% have the largest proportion of children and young adults. The boroughs of Basingstoke and Dean 19.5, and Winchester 19.6%, both home to large towns also have a large population of children and young people, at 19.5%
United
and 19.6% respectively. Meanwhile, the populations of the city unitaries of Portsmouth and Southampton consist of 17.6% and 18.1% 0–17-yearolds respectively.
Young adults (aged 18-34)
20.1% of Hampshire and the Isle of Wight’s population is aged 18-34. Young adults tend to leave more rural areas for urban areas in search of job opportunities and appropriate housing. Rushmoor has the largest percentage of young adults at 29.6%, likely in part due to its status as a Garrison town. The populations of Basingstoke and Winchester consist of 20.4% and 21.0% people aged 18-34 respectively. 28.1% of Southampton’s population and 25.8% of Portsmouth’s population are aged 18-34.
Adults (35-54)
25.9% of Hampshire and the Isle of Wight’s population is aged 35-54. In Test Valley, where there is a mix of rural and more urban towns, 26.0% of the population are 35-54, just above the figure for Hampshire and the Isle of Wight. With its continuous urban area, 27.5% of Eastleigh’s population is 35-54. Hart’s population consists of 27.7% people aged 35-44, the figure for Basingstoke is 29.2%. As urban centres, both Southampton and Portsmouth have large 35-54 groups, at 27.7% and 28.0% respectively.
Older adults (aged 55-74)
24.2% of Hampshire and the Isle of Wight’s population is aged 55-64. Six of the districts that currently make up mainland Hampshire have larger proportions of 55-64 than Hampshire and the Isle of Wight as a whole. The populations of the costal boroughs of Gosport and Fareham contain 24.7% and 27.7% people aged 55-64 respectively. 26.9% of Havant’s population, and 26.6% of East Hampshire’s population are within this age bracket. The two areas home to the largest percentage of people aged 55-64 are New Forest at 28.0% and the Isle of Wight at 30.0%.
Elderly Adults (75+) 9.9% of the Isle of Wight’s population is aged 75-85+. New Forest has the largest number of people aged 75+ at 13.8%, followed by the Isle of Wight at 13.4%. The bordering districts of Havant and East Hampshire consist of 11.9% and 11.1% of the population aged 75 and over. Finally, Fareham’s population is 12.5% people aged 75+.
Age by Local Authority
2.2 Community Impact- Age
Across Hampshire and the Isle of Wight, people engage with local authorities across different stages of their lives. This is often shaped by age, circumstances, and community context.
For older adults, key touchpoints include adult social care, housing support, health and wellbeing services, transport, and community safety. This is particularly true for those aged 75–85, who are likely to interact with a wide range of services — from waste management and housing to health and social care — and whose needs must be carefully considered when designing future services and their locations.
Working-age adults engage with services such as employment support, transport and infrastructure, housing, digital access, and family -related services. Those aged 25–54 often use a broad mix of services, including housing provision, business and employment support, highways and transport, and digital services. Many in this group are also parents, guardians, or carers, making children and young people’s services, adult social care, and education particularly relevant.
Young people interact with local authorities through education, youth services, early intervention and safeguarding, and community and leisure activities. For those aged 0–17, education and children’s services are central, while 18–24-year- olds may focus more on housing, employment support, and transitions into adulthood.
In addition to statutory services, access to cultural opportunities and green spaces plays a vital role in supporting wellbeing across all age groups. Hampshire and the Isle of Wight benefit from a rich cultural offer, including museums, heritage sites, and community events, as well as significant natural assets such as Queen Elizabeth Country Park, Itchen Valley Country Park, and many local parks and open spaces. Our proposed four new mainland and Isle of Wight unitary model enables each new authority to draw on a mix of urban and rural environments, helping to promote healthier lives and stronger communities. These assets contribute to physical and mental wellbeing, social connection, and a sense of p lace. All of which are essential to inclusive, age-responsive service delivery.
Our four new mainland and Isle of Wight unitary model offers a strong foundation for tailoring services to these life stages. By aligning governance with real economic and social geographies, the model supports more locally responsive service delivery, enabling authorities to better understand and meet the needs of residents at different ages. This includes supporting preventative approaches in adult social care, improving transitions for young people, and ensuring services are rooted in community identity.
In contrast, fewer or larger unitary authorities risk diluting these connections. Larger geographies may struggle to reflect the lived experiences of residents, particularly where age-related needs vary significantly between communities. Our four new mainland and Isle of Wight unitary model enables a more place-based approach, fostering collaboration between local partners and ensuring services remain accessible, relevant, and responsive across all age groups.
Positive Impacts
Localised Neighbourhood Service Delivery: Our four new mainland and Isle of Wight unitary model ensures that services are designed around how people live and work. Enabling services to be closer to where people live, which is especially important for older adults who may rely more on local networks or connections or struggle with access or transport. As well as enable continuity of care to build on existing community relationships.
Alignment with NHS 10-year plan: The NHS 10-year plan prioritises prevention, integration and community resilience, all of which benefit older adults be reducing hospital admissions and promote independent living. This alignment between NHS, four new unitary authorities and local health systems, means existing well-functioning operation models can be built on. Especially in areas like Mid Hampshire where place-based care is already embedded.
Balanced scale and proximity: Our four new mainland and Isle of Wight unitary model combines strategic capacity with closeness to communities, enabling services to be more person centred and reduces risk of over- centralisation of larger models
Negative Impacts
Transition planning must ensure continuity of care and workforce stability to avoid exacerbating existing gaps. Transitioning to a new structure may disrupt existing arrangements in adult social care and children’s services which could result in delays or inconsistencies in care and service delivery.
Fragmentation: Although our four new mainland and Isle of Wight unitary model aims to reduce fragmentation, the transition from county -district arrangements could temporarily exacerbate gaps in service integration.
Disruption in local relationships and informal networks: Even with place-based interventions, structural change can disrupt long-standing relationships between older residents and local service providers. Which could result in a loss of trust or familiarity which in turn could reduce engagement during transition.
3. Disability
3.1 Data Analysis
3.1.1 Hampshire and the Isle of Wight Analysis
At the time of the 2021 Census, 17.2% of the population of Hampshire and the Isle of Wight identified themselves as disabled under the 2010 Equality Act. The equivalent figure for the UK is 16.90%, and 17.3% for England. While on the surface, these figures are similar, the day-to -day impact people experience, and often the types of support required, varies.
Disability in Hampshire and the Isle of Wight and the UK
Disabled under the Equality Act
Not disabled under the Equality Act
Daily Activities
Of the population in Hampshire and the Isle of Wight who are disabled, 61.4% said that their disability impacts their daily activities a little, the equivalent figure for the UK is 57.3%. Comparatively, across the UK, people who are disabled experience more limitations when going about daily activities – 42.7%, compared to 38.6% in Hampshire and the Isle of Wight. Overall, disabled people in Hampsire and the Solent experience less impact on their daily activities than the disabled population in the UK more widely.
While this data is useful, it should be noted that in the census, there is no description or example, making people’s answers entirely subjective.
Daily Activities - UK and Hampshire and the Isle of Wight
Disabled under the Equality Act: Day-to-day activities limited a little
Disabled under the Equality Act: Day-to-day activities limited a lot
Long-term conditions
Of the population who are not disabled under the Equality Act, some recorded a long term physical or mental health condition which does not limit their daily activities. In Hampshire and the Isle of Wight, this group accounts for 9.9% of the population who aren’t disabled, compared to 8.3% in the UK. While daily activities are not limited, this group may require more assistance from health and wellbeing services.
UK Hampshire & Solent
Long-term physical or mental health condition
Not disabled under the Equality Act: No long term physical or mental health conditions
Not disabled under the Equality Act: Has long term physical or mental health condition but day-to-day activities are not limited
UK Hampshire & the Solent
3.1.2 District and Unitary Analysis
The percentage of people who are disabled in each district varies massively, by over 10.0%. Six of the districts that currently make up Hampshire and the Isle of Wight have larger disabled populations than in Hampshire and the Isle of Wight, and the UK as a whole. Hart’s disabled population is the lowest, at 12.9%, which equates to 12,850 people.
Seven of the districts sit between 14.0-17.0% of the population identifying as disabled. In Rushmoor, 14.3% of the population are disabled, this equates to 14,309 people. 15.0% of Basingstoke’s population are disabled – 27,778 people, and 15.4% of Winchester’s population are disabled –
19,566 people. Test Valley and East Hampshire’s populations consist of 15.6%, or 20,316 and 19,579 disabled people respectfully. In Eastleigh, 16.0% of the population, 21,869 are disabled, and 16.8% of Fareham’s population are disabled – 19,252 people.
Disability by
Areas with slightly higher percentages of disabled people include the city unitaries of Southampton (17.7%) and Portsmouth (17.6%), equating to 43,937 and 36,648 people respectively and the New Forest, where 19.9% of the population, or 32,591 are disabled.
The coastal communities of Gosport and Havant, both of which have older age profiles than the majority of the other districts, have higher percentages of disabled people. 19.9% of Gosport’s population (16,714 people) and 20.4% of Havant’s population (24,718 people) are disabled.
The Isle of Wight has the highest disabled population, at 23.3%, which equates to 32,755. While this raw figure is similar to the number of people with disabilities in the New Forest, Southampton, and Portsmouth, each area is distinct, with its own geographical challenges and community networks.
Daily Activities
The impact disabilities can have on people’s daily lives and activities is, in this case broadly similar to the disabled populations. Hart, which has the lowest population of disabled people, has the lowest percentage of people whose disability impact their daily activities a lot. The Isle of Wight, which has the largest disabled population in the area has the highest percentage of people whose disability impact their daily activities a lot. With the exception of the Isle of Wight, all of Hampshire and the Isle of Wight has a lower percentage of people whose daily activities are limited a lot than the UK as a whole. Meanwhile eight of the districts have a lower percentage of people whose daily activities are limited a lot than Hampshire and the Isle of Wight.
Disability: impact of daily activities by district
Long term conditions
The highest percentage of those who are not disabled but do have a long term physical or mental health condition is in Gosport where the figure is 11.0%. All of Hampshire and the Isle of Wight have a higher percentage of people with a long term physical or mental health condition than the UK (at 8.3%), with the exception of Rushmoor, which has the same percentage of 8.3%.
Not disabled under the Equality Act: Has long term physical or mental health condition but day-to-day activities are not limited
3.2 Community Impact- Disability
Individuals with disabilities may engage with local authorities through a wide range of services, including those that support independence, wellbeing, and inclusion. These touchpoints often include adult social care, housing adaptations, transport and mobility support, education and SEND provision, employment services, and digital accessibility. Local authorities also play a vital role in coordinating with health and voluntary sector partners to ensure joined-up, person- centred support.
Our four new mainland and Isle of Wight unitary model offers an opportunity to strengthen these connections by embedding services within local communities and aligning delivery with the way people live. This approach enables more responsive and inclusive service design, ensuring that the diverse needs of disabled residents are understood and met at a local level. It also supports the development of integrated, community -based delivery models that can better respond to complex needs and reduce reliance on crisis interventions.
In contrast, fewer or larger unitary authorities risk creating more distant and standardised service models, which may overlook local variation in need and reduce opportunities for co -production with disabled residents and their representative groups. This could also reduce opportunities for coproduction and weaken visibility of specific challenges.
Our four new mainland and Isle of Wight unitary model’s emphasis on collaborative working, local representation and community engagement helps mitigate these risks by ensuring services are shaped by those who use them. It also supports investment through transformation, digital inclusion and workforce development. All of which are essential to delivering high-quality, person- centred support for residents with disabilities.
Positive Impacts
More responsive, localised service design: Embedding services within communities allows for better understanding of local needs and lived experiences of disabled residents. Services such as housing adaptions, mobility support and adult social care can be tailored more effectively to localised contexts.
Improved accessibility through place-based planning: Our four new mainland and Isle of Wight unitary model enables authorities to better understand the physical and digital accessibility of local infrastructure and service design. Which in turn enhances inclusion in public life for disabled residents.
Stronger integration with health and voluntary sector partners: Our four new mainland and Isle of Wight unitary model supports joined up, person centred care through closer collaboration between Councils, health partners and community organisations. Reducing duplication and improving continuity of care.
Negative Impacts
Risk of disruption during transition: Reorganisation may temporarily disrupt services which could result in delays or confusion in accessing support for disabled residents.
Loss of specialist expertise and relationships: If not carefully managed, the transition could lead to temporary fragmentation of specialist teams with localised knowledge and relationships. Which could impact the quality of support for individuals with a disability or complex needs.
A digital first approach may exclude some residents who struggle to use or access technology. Without robust offline alternatives and inclusive design, digital self-service could become a barrier for disabled residents.
4. Gender reassignment
4.1 Data Analysis
4.1.1 Hampshire and the Isle of Wight Analysis
The below data on gender identity is taken from the 2021 census. The Office for National Statistics notes that they are ‘statistics in development’, as the first time the census featured questions on gender identity was 2021.
95.0% of Hampshire and the Isle of Wight area’s population gender identity is the same as the sex they were assigned at birth. This is lower than in the UK, where the figure is 93.5%. 4.6% of people in Hampshire and the Isle of Wight did not answer this question, meaning 0.4% of people have a gender identity different to the sex they were assigned at birth, compared to 0.8% in the UK. Of this 0.4%, 0.1% had a gender identity different to the sex they were assigned at birth. 0.2% were transgender (0.1% were trans women, 0.1% were trans men) and 0.1% had other gender identities, such as non-binary.
Area Gender identity the same as sex assigned at birth
Gender identity different from sex assigned at birth but no specific identity given (%)
4.1.2 District and Unitary Analysis
People aged 18-24 are more likely to report that their gender identity is different from the sex they were assigned at birth. Hampshire and the Isle of Wight broadly follows this national trend, as the areas with the youngest age profiles have the highest percentage of people whose gender identity is different from the sex they were assigned at birth. Southampton is the highest, with 0.9% of people having a gender identity different to the sex they were assigned at birth. The figure for Rushmoor is 0.7%, and for Portsmouth, 0.6%. For eleven areas, 0.4% of the population has a different gender identity than sex assigned at birth, and in the New Forest, the figure is 0.3%. Area Gender identity the same as sex assigned at birth
identity different from sex assigned at birth but no specific identity given
4.2 Community Impact- Gender Reassignment
Individuals undergoing or having undergone gender reassignment may engage with local authorities through a range of services where inclusion, privacy, and respectful treatment are essential. These touchpoints may include housing, community safety, health and wellbeing services, and access to inclusive digital platforms. Local authorities also play a vital role in fostering inclusive environments through staff training, service design, and community engagement.
Our four new mainland and Isle of Wight unitary model offers an opportunity to strengthen these approaches by embedding inclusive practices at a local level. More locally connected authorities are better placed to build trusted relationships, respond to community-specific needs and codesign services with trans and non-binary residents and respective organisations. This place-based approach supports visibility, dignity and responsiveness in everyday service delivery.
In contrast, fewer or larger unitary authorities may struggle to maintain visibility and responsiveness, particularly for communities whose needs may be less prominent within broader structures. A place-based approach supports meaningful engagement and ensures that inclusion is not only embedded in policy but reflected in everyday service delivery.
Positive Impacts
More localised and inclusive service design: Our four new mainland and Isle of Wight unitary model means authorities are better positioned to embed inclusive practices in everyday service delivery and designed with greater sensitivity to privacy, dignity and respectful treatment. Stronger relationships and trust: Localised governance fosters closer relationships between authorities and communities, enabling more meaningful engagement with trans and non-binary residents. Building trust may encourage individuals to seek support earlier with less fear of discrimination or misunderstanding.
Enhanced visibility and responsiveness: Our four new mainland and Isle of Wight unitary model allows for more tailored approaches that reflect local demographics and need. Ensuring that the needs of trans individuals are not lost within broader, standardised service models.
Negative Impacts
Transition planning must ensure continuity of care and workforce stability to avoid exacerbating existing gaps. Transitioning to a new structure may disrupt existing arrangements in adult social care and children’s services which could result in delays or inconsistencies in care and service delivery.
Fragmentation: Although our four new mainland and Isle of Wight unitary model aims to reduce fragmentation, the transition from countydistrict arrangements could temporarily exacerbate gaps in service integration.
5. Marriage and Civil Partnership
5.1 Data Analysis
5.1.1 Hampshire and the Isle of Wight Analysis
In Hampshire and the Isle of Wight, 73.5% of the population aged 18 and over are married or in a civil partnership, compared to 44.6% of the UK’s population. In the UK, the proportion of adults who are not married has been rising since 1991 across all age groups, and the percentage of people who are divorced is similar, though divorce is on the rise for older adults.
or Cvil Partnership
Perhaps due to the older age profile of Hampshire and the Isle of Wight as well as the high percentage of marriages, the percentage of divorces or separations is higher than the UK – 17.0% compared to 11.3% in the UK. Additionally, the percentage of people who are widowed, or the surviving partner is higher – 9.5% in Hampshire and the Isle of Wight and 6.1% in the UK.
5.1.2 District and Unitary Analysis
All of the districts that currently make up Hampshire and the Isle of Wight have a higher percentage of people who are married or in a civil partnership than the UK. Hart has the highest percentage at 76.9%, followed by Winchester at 75.7% and the Solent has the lowest percentage at 67.2%.
Portsmouth has the highest percentage of divorced or separated people at 23.3%, followed by Gosport at 22.2% and Hart has the lowest at 14.7%. The Isle of Wight has the highest percentage of widows or surviving partners at 11.9%, followed by the New Forest at 11.4% and Rushmoor has the lowest at 7.7%.
Marriage in Hampshire and the Isle of Wight by district
5.2 Community Impact- Marriage and civil partnership
Individuals who are married or in a civil partnership may engage with local authorities through a range of services that support family life and household stability. These touchpoints can include housing services, council tax and benefits, registration services, and access to family support or mediation. While this characteristic may not always result in distinct service needs, it remains important that services are delivered in a way that recognises and respects diverse family structures.
Our four new mainland and Isle of Wight unitary model offers an opportunity to strengthen this approach by enabling more locally responsive and inclusive service delivery. By aligning governance with established community and economic geographies, councils will be better placed to understand and reflect the needs of residents who are married or in a civil partnership and throughout different stages of life. The model also supports enhanced neighbourhood working, enabling decision-making at the lowest effective level and fostering more personalised engagement with residents. Through tailored governance and leadership, councils can develop strategies that reflect the unique social and economic contexts of their areas, improving outcomes for people in marriages and civil partnerships.
In contrast, fewer or larger authorities may risk standardising services in ways that overlook the nuances of relationship diversity. Larger, less locally connected structures could dilute community identity and reduce opportunities for personalised support, particularly in areas with distinct cultural and demographic profiles. This could impact the visibility of different relationship arrangements and limit the ability of councils to respond to specific needs. Such as housing for older couples, support for same sex partnerships or when navigating complex life events.
Our four new mainland and Isle of Wight unitary model’s emphasis on collaborative working, local representation and community engagement helps mitigate these risks by embedding services within communities and ensuring they are shaped by lived experience.
Positive Impacts
Enhanced neighbourhood working: Decision making at the lowest effective level allows councils to engage more personally with residents in marriage or civil partnerships. Supporting nuanced service design and delivery which may be particularly beneficial for those navigating complex life events that may involve multiple services support.
Tailored governance and leadership: Councils can develop strategies that reflect the unique social and economic contexts of their areas, in ways which are reflective of how people live their lives. Improving outcomes across different life stages e.g. young adults forming households to older couples requiring care or support.
Negative Impacts
Complexity during transition: The shift to new local authorities may temporarily disrupt services that support household stability, such as benefits processing, housing allocation or registration services. Particularly if systems and staff structures are being reorganised.
6. Pregnancy and maternity
6.1 Data Analysis
6.1.1 Hampshire and the Isle of Wight Analysis
The UK census does not directly ask any questions on pregnancy, so for this data analysis, the general fertility rate (GFR) will be used, taken from the Joint Strategic Needs Assessments for Hampshire and Isle of Wight, Portsmouth, and Southampton. The GFR is the number of live births per 1,000 of the female population aged 15-44, as this age bracket is considered to be ‘childbearing age’. In Hampshire and the Isle of Wight, the GFR is 8.7, considerably lower than the GFR for the UK, which is 54.2. This is likely due to the older age profile of Hampshire and the Isle of Wight, as well as national pressures such as the cost of living.
General Fertility Rate
(the number of live births per 1,000 female population aged 15 to 44, which adjusts for women of childbearing age in an area)
6.1.2 District and Unitary Analysis
At the local level, GFR varies greatly. In the cities of Southampton and Portsmouth, the GFR is much closer to the national figure – 48.4 for Southampton and 47.4 for Portsmouth. Rushmoor, with a comparatively younger age profile than Hampshire and the Isle of Wight overall has the GFR of 11.6 and Basingstoke and Dean, with the large town of Basingstoke has the GRF of 11.16. Six of the districts have a GFR between 8.3 and 9.3, they are: Winchester (8.3), Hart (8.6), Gosport (8.7) Havant (9.1), Eastleigh (9.26), and Test Valley (9.3). The four districts with the lowest GFR are East Hampshire (7.71), Fareham (7.1), the Isle of Wight (6.5) and the New Forest with a GFR of 6.2.
General Fertility Rate
(the number of live births per 1,000 female population aged 15 to 44, which adjusts for women of childbearing age in an area)
Pregnancy and maternity represent key life stages where individuals may engage with a range of local authority services. These touchpoints often include access to housing and benefits support, early years and childcare provision, public health services, and community-based support networks. Local authorities also play a role in coordinating with health partners to ensure wraparound care and safeguarding for both parent and child.
Our four new mainland and Isle of Wight unitary model offers an opportunity to strengthen support for pregnant indi viduals and new parents by embedding services within communities and aligning delivery with how people live. This place-based approach enables more responsive and inclusive service design tailored to local demographic. As well as improved coordination across services (such as housing, early years and social care), where current challenges can be exacerbated for those also experiencing deprivation, rural isolation or complex needs. It also created the opportunity for stronger relationships with community organisations, which are often key in supporting families during pregnancy and early parenthood.
In contrast, a model with three or fewer mainland authorities’ risks creating larger, less connected structures that may dilute visibility of local needs. Standardised service models could overlook the nuances of pregnancy and maternity. Particularly in areas with distinct cultural, economic and geographic profiles. Our four new mainland and Isle of Wight unitary model’s emphasis on local representation, neighbourhood working, and collaborative leadership helps ensure that services are shaped by lived experience and delivered in ways that promote dignity, continuity, and inclusion at a critical life stage.
Positive Impacts
Enhanced coordination between services: Our four new mainland and Isle of Wight unitary model allows for closer alignment with local NHS trusts and boundaries, which supports more integrated and wraparound care and support.
Improved responsiveness to local needs: Authorities aligned to the way people live their lives with clearer geographic and demographic focus, may be more agile in responding to local emerging issues. Localised data can inform targeted interventions that may support (for example) young parents, or pregnant people experiencing homelessness.
Stronger community-based support networks: Embedding services within communities enabled councils to strengthen relationships with voluntary and community organisations that support families, improving access to informal and preventative support.
Negative Impacts
Disruption during transition: Structural change may temporarily disrupt existing arrangements in adult social care, children’s services and early years provision. This could result in delays or inconsistencies in care, particularly for families navigating multiple services.
Disruption to informal or trusted relationships: Structural change can disrupt long standing relationships between individuals and service providers which could reduce engagement, particularly among vulnerable or marginalised groups who rely on trusted contacts.
7. Ethnicity
7.1 Data Analysis
7.1.1 Hampshire and the Isle of Wight Analysis
As with the UK, the most common ethnicity for residents in Hampshire and the Isle of Wight is white. In this data analysis, white has been separated into white British and white other. This is because white other includes people who are Gypsy, Roma and/or Traveller, a group which are often disadvantaged. In Hampshire and the Isle of Wight, 85.4% of the population is white British, and 5.3% are white other. The population of the UK is slightly more diverse, with 81.0% identifying as white British, and 7.7% are white other.
Ethnic Origin - Hampshire and the Isle of Wight and the UK (%)
The next most populous group in Hampshire and the Isle of Wight is Asian British, at 4.8% of the population, the same is true for the UK, where the figure is 9.6%. Black British, Caribbean, or African people make up 1.5% of Hampshire and the Isle of Wight’s population and 4.2% of the UK’s population. People who have multiple or mixed ethnic groups makeup 2.1% of the population in Hampshire and the Isle of Wight, compared to 3.0% in the UK, and other ethnic groups make up 1.1% of Hampshire and the Isle of Wight’s population, compared to 2.2% in the UK.
The graph below shows the ethnicities of people in the UK and Hampshire and the Isle of Wight, without white British, for a clearer comparison. In Hampshire and the Isle of Wight, with the exception of white British, the most common ethnicity is white other at 7.7%, in the UK it’s Asian British at 9.6%.
Ethnicity (except white British) in Hampshire and the Isle of Wight and the UK
Ethnic Group
British Black British, Caribbean or African Multiple or mixed ethnic
Hampshire & the Solent
7.1.2 District Analysis
As with Hampshire and the Isle of Wight as a whole, within the districts the most common ethnicity is white British, though the percentage of the population varies. The Isle of Wight has the largest percentage of white British people at 94.4%, followed by the New Forest at 93.7%. The city of Southampton has the lowest percentage of white British people at 68.7%, preceded by Rushmoor with 71.7% white British. Twelve of the districts share white other as their second most populous group, though in Basingstoke and Deane white other makes up the same percentage as Asian or
Asain
Asian British at 5.9%. In Eastleigh and Rushmoor, the second largest ethnic group is Asian or Asian British, accounting for 3.9% of Eastleigh’s population and 14.7% of Rushmoor’s.
Other ethnic groups account for the smallest amount of the population in twelve of the districts, though in East Hampshire, Hart, the Isle of Wight and the New Forest Black, Black British, Caribbean or African people share the same percentage as other ethnic groups. In Rushmoor and Winchester, Black, Black British, Caribbean or African people account for the smallest percentage of the population – 0.6% in Winchester and 2.5% in Rushmoor.
Gypsy, Roma, and Traveller (GRT) people
At the time of the 2021 census, 4,911 GRT people were recorded in Hampshire and the Isle of Wight accounting for 0.25% of the population. The needs and challenges of GRT people are unique. GRT people tend to have poorer health and as a result, lower life expectancies. GRT people are twice as likely to live in social rented accommodation and live in overcrowded conditions. Self- employment is more common among GRT people, as is provision of over 50 hour a week of unpaid care.
Gypsy, Roma, and Traveller people in Hampshire and the Isle of Wight
7.2 Community Impact- Ethnicity
Individuals from racially and ethnically diverse backgrounds engage with local authorities across a broad spectrum of services, including housing, education, health and wellbeing, community safety, and employment support. To ensure equitable outcomes, it is essential that these services are not only accessible but also culturally competent, inclusive, and responsive to the specific needs of diverse communities.
Local authorities have a critical role in fostering community cohesion, addressing racial discrimination, and ensuring meaningful representation in decision-making processes. This includes actively addressing structural inequalities and ensuring that engagement mechanisms are designed to reach and empower underrepresented groups.
Our four new mainland and Isle of Wight unitary model strengthens the ability to meet these responsibilities by enabling more locally informed service design and delivery. By aligning governance with established community and economic geographies, councils can better reflect the lived experiences of residents and tailor services to local demographic profiles. This supports targeted interventions, inclusive planning, and stronger partnerships with community-led organisations, many of which are best placed to build trust and deliver effective support.
The model also enhances local leadership and accountability, allowing each authority to develop bespoke strategies that reflect the cultural diversity and economic potential of their areas. This includes promoting inclusive regeneration, supporting diverse business communities, and ensuring that cultural and community assets are protected and celebrated.
In contrast, a model with three or fewer mainland authorities’ risks diluting the visibility of ethnically diverse communities, particularly in areas where populations are smaller or more dispersed. Larger, less connected structures may lead to standardised service delivery that overlooks cultural nuance, reduces opportunities for co - design, and weakens local representation. This could result in poorer outcomes in areas such as education, health, housing, and economic inclusion.
Our four new mainland and Isle of Wight unitary model helps mitigate these risks by embedding services within communities, supporting inclusive engagement, and ensuring that diversity is recognised as a strength in shaping future governance and service delivery.
Positive Impacts
Greater responsiveness to diverse needs: Place-based authorities can better reflect the demographic makeup of their communities, allowing for more culturally competent service design and delivery. This is particularly beneficial in urban centres like Southampton and Portsmouth, which have higher proportions of racially and ethnically diverse residents.
Improved community engagement and representation: Our four new mainland and Isle of Wight unitary model will enable more targeted and inclusive engagement strategies, increasing visibility and voice of underrepresented groups in decision making. Due to the place-based nature of the authorities, the most appropriate methods can be used to engage with communities, addressing barriers like rurality or isolation.
Stronger partnerships: Authorities which are more connected to their local populations supports collaboration with grassroots and culturally specific organisations that are trusted within communities and can deliver effective, targeted support.
Ability to address inequalities: Our four new mainland and Isle of Wight unitary model means authorities will be better equipped to identify and respond to disparities in service delivery for diverse communities. This includes tailoring interventions to address inequalities and promote equity.
Negative Impacts
Disruption to community relationships: Reorganisation may affect established partnerships between councils and ethnic minority communities, especially if staff or structures change.
Access barriers: Diverse communities may be disproportionately affected by digital exclusion, particularly in areas of deprivation. Transitioning to new digital systems or platforms should be carefully managed to avoid creating new barriers to access.
8. Religion or Belief
8.1 Data Analysis
8.1.1 Hampshire and the Isle of Wight Analysis
According to the 2021 Census, Christianity is the most common religion in Hampshire and the Isle of Wight with 46% of residents identifying as Christian. The second largest group are those who follow no religion, accounting for 43.4% of the population. Out of those who do adhere to a religion, Islam is the next most common religion being followed by 1.9% of Hampshire and the Isle of Wight’s population.
Religion in Hampshire and the Isle of Wight
8.1.2 District and Unitary Analysis
When examining religion throughout Hampshire and the Isle of Wight’s Local Authorities, Christianity is the most common religion in ten out of the fourteen district and unitary councils. In the remaining four council’s, the largest group is those who don’t follow a religion.
Whilst this is reflective of the county level data, it is important to note variations in the second most common religions followed throughout the districts. For example, in Rushmoor 5.7% of the population identify as Hindu, compared with the county average of 1.1%, making it the second most followed religion in the district. This can be linked to the sizable Gurka population that can be found in Aldershot Town. Hinduism was also the second most common religion in Basingstoke and Deane (2.2%) and Hart (1.2%) both of which are higher than the county average. In Eastleigh and Winchester Hinduism was the second most common religion alongside Islam.
Additionally, in both the populations of Portsmouth and Southampton, Islam is the second most followed religion, with 4.9% of Portsmouth’s population and 5.6% of Southampton’s population identifying as Muslim, as opposed to 1.9% of the total Hampshire and the Isle of Wight population. This equates to a Muslim population of 10,147 in Portsmouth and 13,893 in Southampton. In the context of Local Government Reorganisation, this data highlights the benefit of analysing smaller populations as it provides more specific community insights allowing for more inclusive service design that is reflective of local needs.
Relgion by District
Source: Census 2021
8.2 Community Impact- Religion or Belief
Individuals of different religions or beliefs engage with local authorities through a wide variety of services, including education, public health, community safety, and civic participation. Delivering these services in ways that respect religious practices, promote inclusion, and uphold freedom of belief is essential to fostering trust and equity.
Local authorities are uniquely positioned to support interfaith dialogue and ensure that diverse belief systems are represented and able to access decision-making processes. Our four new mainland and Isle of Wight unitary model strengthens this role by embedding service design within communities, enabling councils to build on established relationships with faith groups and community leaders.
This approach supports co - designed, locally relevant services that reflect religious and cultural diversity. In contrast, fewer, larger authorities risk weakening these connections and reducing visibility for smaller or less prominent faith communities, potentially limiting inclusive engagement and representation.
Positive Impacts
Stronger local relationships with faith communities: Smaller, place-based authorities are more likely to maintain and deepen relationships with local faith groups, enabling culturally sensitive service delivery and inclusive civic participation.
Enabling community cohesion: Our four new mainland and Isle of Wight unitary model allows for more tailored interfaith initiatives where needed or aspired to locally. Promoting community cohesion and mutual understanding based on more localised geographies. Councils can support forums and partnerships that reflect the religious diversity of their specific areas.
Improved representation in decision making: Place-based governance may increase opportunities for faith-based organisations and individuals to contribute to policy development and service design. This is particularly important for smaller or minority faith communities that may be overlooked in larger administrative structures.
Culturally competent service design: Embedding services within communities enables councils to better understand and respond to the needs of residents with different beliefs. Building an understanding of barriers in place and actively seeking to improve outcomes in areas of community priority.
Negative Impacts
Weakened local networks: Reorganisation may disrupt established relationships between councils and faith groups, particularly if staff roles or structures change. This loss of continuity could impact trust and collaboration, especially in areas where faith groups pl ay a key role in community support.
9. Sex
9.1 Data Analysis
9.1.1 Hampshire and the Isle of Wight, Unitary and District Analysis
In Hampshire and the Isle of Wight 50.9% of the population is female and the other 49.1% is male. This trend is broadly reflected throughout the unitary and district councils. In twelve of the fourteen unitaries and districts the female population is slightly higher than the male population. Southampton is the only district where the male population, at 50.2%, is higher than the female population at 49.8%. Additionally, in Rushmoor the male and female population is evenly split.
and Isle of Wight
Sex by District
Example – Unpaid Care
Despite the population of Hampshire and the Isle of Wight being split almost evenly by sex, it is important to consider the ways sex impacts an individual’s experience of services. When looking at the provision of unpaid care, the 2021 census shows that more female individuals provide unpaid care compared to male individuals. For example, in Eastleigh 4.1% of female individuals provide 9 hours or less of unpaid care a week as opposed to 2.9% of men. This trend is reflected in the 2021 Census data for all the Hampshire and the Isle of Wight districts and unitaries in each level of unpaid work, ranging from 9 hours to 50 hours. In turn this may lead to increased interactions with services such as Adult Social Care,
Children’s services and Health and Wellbeing Services. Therefore, it important to consider these differences when designing services to ensure they are inclusive and supportive of the varying needs of residents.
Unpaid Care - 9 Hours or Less
Hampshire and Isle of Wight Districts
9.2 Community Impact- Sex
Individuals of different sexes may interact with local authorities in ways shaped by social, economic, and cultural factors. These services may include education, social care, housing, public health, community safety, and employment support, and may be experienced differently depending on gender.
For example, patterns of engagement can be seen in areas such as childcare provision, domestic abuse support and mental health services. Women may be disproportionately represented among unpaid carers or survivors of domestic abuse, while men may face barriers in access mental health support or parenting services. Recognising and responding to these gendered patterns is essential to ensuring services are inclusive, equitable and meet the needs of all residents.
Our four new mainland and Isle of Wight unitary model supports this by enabling more locally informed service delivery. This allows councils to better understand and respond to gendered needs within each community, ensuring that services are shaped by lived experience and local insight.
This enables services to be designed and delivered in ways that reflect the realities of residents’ lives. In contrast, fewer, larger authorities may risk overlooking these nuances, reducing the visibility of gender-specific issues and limiting opportunities for targeted interventions.
Positive Impacts
Improved responsiveness to gendered needs: Place-based authorities are better positioned to understand and respond to gendered patterns of service use. Enabling more tailored interventions to address underlying need and better resource allocation.
Enhanced support for gender-specific services: Our four new mainland and Isle of Wight unitary model allows for more targeted investment in services that may disproportionately affect one sex. Building on local insight based on communities’ geographies and the way they access services can help identify gaps and emerging needs more effectively.
Stronger community engagement: Place-based governance structures may foster better engagement with gender-focused organisations or advocacy groups, supporting co -design and service delivery. This is particularly important for addressing intersectional issues.
Negative Impacts
Disruption to specialist services: Reorganisation may affect continuity of gender-specific services, such as domestic abuse support or gender-based violence prevention programmes. Changes in staffing, funding or commissioning arrangements could impact service quality and accessibility.
10. Sexual orientation
10.1 Hampshire and the Isle of Wight Analysis
At the time of the 2021 Census, 90.2% of Hampshire and the Isle of Wight residents identified as straight. 1.4% of residents identified as gay or lesbian and 1.4% of residents identified as bisexual. 0.3% of Hampshire and the Isle of Wight residents identified as other sexual orientations.
Hampshire and Isle of Wight Residents Sexual Oreintation
Straight or Heterosexual Gay or Lesbian Bisexual All other sexual orientations Not answered
10.1.2 District and Unitary Analysis
The data reflecting the sexual orientation of residents varies across the different Hampshire and the Isle of Wight districts and unitaries. For example, Rushmoor (90.1%), Winchester (90.1%), Isle of Wight (89.5%), Southampton (86.8%), and Portsmouth (87.7%) have a lower percentage of residents that identify as straight in comparison to the county data. The district with the highest percentage of residents who identify as straight is Hart at 92.4%, whilst the lowest is Southampton at 86.8% meaning the percentage of residents who identify as straight across the districts varies by 5.6%.
In comparison to the county average of 1.4%, Southampton (2%), Portsmouth (2%) and Gosport (1.6%) all have a higher percentage of residents who identify as gay or lesbian. In contrast of New Forest is the district with the lowest proportion of residents who identify as gay or lesbian at 1%.
When looking at the data for residents who identify as bisexual, Southampton has the highest proportion of residents at 2.4%, this is closely followed by Portsmouth where 2.1% of residents identify as bisexual, then by Winchester where 1.7% of residents identify as bisexual. Hart and the New Forest have the lowest proportion of residents who identify as bisexual both with 0.8%. This means that there is a variation of 1.6% across the district and unitary councils.
Across the Hampshire and the Isle of Wight districts and unitaries the percentage of residents that identify as other sexual orientation ranges from 0.6% in Southampton and 0.2% in Eastleigh, Test Valley, Havant, East Hampshire, Fareham, New Forest and Hart.
10.2 Community Impact- Sexual Orientation
Individuals of all sexual orientations engage with local authorities through a wide range of services, including housing, health and wellbeing, community safety, and youth or family support. It is essential that these services are inclusive, respectful, and free from discrimination, with staff equipped to understand and respond to the needs of LGBTQ+ residents across all age groups.
Local authorities also play a vital role in promoting equality, tackling prejudice, and creating safe, welcoming spaces for LGBTQ+ individuals. Our four new mainland and Isle of Wight unitary model enhances this by embedding inclusive practices at a more local level, enabling services to be shaped by community insight and lived experience.
Hampshire and Isle of Wight Residents Sexual Orientaion
Place-based authorities are better positioned to engage with LGBTQ+ communities, understand local challenges and co -design services that are trusted and accessible. This approach supports stronger relationships with LGBTQ+ organisations, networks and advocacy groups, fostering collaboration and ensuring services are shared by lived experience and local insight.
In contrast, fewer or larger authorities may risk diluting local insight and reducing visibility of LGBTQ+ experiences, potentially leading to less responsive and inclusive provision. By taking a place-based focus to commissioning and intervention, local authorities are able to respond to unique challenges and opportunities of each area, which can also better address intersectional needs.
Positive Impacts
Stronger local relationships with LGBTQ+ communities: Place-based local authorities are better positioned to build and maintain relationships with LGBTQ+ organisations, support groups and networks. Fostering trust and ensuring services are shaped by local lived experience and community insight.
Inclusive and responsive service design: Localised governance allows authorities to tailor services to the needs of LGBTQ+ organisations and residents, including in areas like housing, mental health support and youth services.
Improved visibility and representation: Our four new mainland and Isle of Wight unitary model will enhance the visibility of LGBTQ+ issues within local decision making, enabling more inclusive civic participation and policy development. Councils can more easily support local events, campaigns or initiatives that support LGBTQ+ communities due to the closer proximity to communities.
Negative Impacts
Disruption to informal or trusted relationships: Structural change can disrupt long standing relationships between individuals and service providers which could reduce engagement, particularly among vulnerable or marginalised groups who rely on trusted contacts.
11. Rurality
11.1 Hampshire and the Isle of Wight Analysis
According to the 2021 Census Rural Urban Classification, 78.6% of the Hampshire and the Isle of Wight district and unitary councils are classified as Urban whilst 21.4% of districts are classified as rural. The local authorities classified as rural include the Isle of Wight, East Hampshire, and Winchester. The Classification defines
Urban areas ‘as settlements with populations of 10,000 or more, based on the 2021 Census’ and Rural areas as ‘everywhere else’ including ‘rural towns, villages, hamlets, isolated dwellings and open countryside’.
Hampshire and Isle of Wight Districts
Area
Portsmouth
Southampton
Isle of Wight
Basingstoke and Deane
East Hampshire
Fareham
Gosport
Hart
Havant
New Forest
Rushmoor
Rural/ Urban Classification
Urban: Majority nearer to a major town or city
Urban: Majority nearer to a major town or city
Intermediate rural: Majority further from a major town or city
Intermediate urban: Majority nearer to a major town or city
Intermediate rural: Majority nearer to a major town or city
Urban: Majority nearer to a major town or city
Urban: Majority nearer to a major town or city
Intermediate urban: Majority nearer to a major town or city
Urban: Majority nearer to a major town or city
Intermediate urban: Majority nearer to a major town or city
Urban: Majority nearer to a major town or city
Urban Rural
Test Valley
Winchester
Intermediate urban: Majority nearer to a major town or city
Intermediate rural: Majority nearer to a major town or city
Eastleigh Urban: Majority nearer to a major town or city
Whilst this data in beneficial in providing an overview of the Hampshire and the Isle of Wight population it does not identify for rural communities within districts classified as Urban. Alternatively, rurality can be viewed through the lens of deprivation. The Barriers to Housing and Services domain of the Index of Multiple Deprivation (IMD) 2019 3 measures the physical and financial accessibility of services, looking at geographical barriers, which relate to the physical proximity of local services, and ‘wider barriers’ which includes access to housing such as affordability.
Barriers to Housing and Services - Rank of proportion of LSOAs in most deprived 10% nationally
Barriers to Housing and Services - Rank of proportion of LSOAs in most deprived 10% nationally
For example, Test Valley despite being classified as an urban district encompasses many rural towns and villages where access to services may be limited. Among all the Hampshire and the Isle of Wight Districts- where rank 1 is the most deprived - Test Valley ranks as the most deprived district when considering the Barries to Housing and Services decile. The maps below illustrate both the overall IMD and the specific decile for Barriers to Housing and Services within Test Valley.
3 More information about the Index of Multiple Depravation can be found here - The English Indices of Deprivation 2019
When assessing the IMD, Test Valley appears relatively less deprived, ranking 262. However, urban areas such as Andover show higher levels of deprivation. Conversely, when looking at Barriers to Housing and Services, rural areas located away from the main towns of Andover and Romsey exhibit higher levels of deprivation. The trend can be identified in other districts such as Basingstoke and Dean and East Hampshire.
Source: Hampshire JSNA
This example highlights that by assessing areas at a more localised level as would be possible under a four new mainland and Isle of Wight unitary model the distinct needs of communities, particularly in rural areas, can be more effectively identified and addressed.
11.2 Community Impact- Rurality
Rural communities across Hampshire and the Isle of Wight face a distinct set of challenges that shape how residents engage with local authorities. In the current two -tier system, key touchpoints include access to transport, health and social care, housing, digital connectivity, and community safety. Geographic isolation limited public transport, and reduced service coverage can create barriers to accessing support—particularly for older adults, young people, and those with additional needs.
Our four new mainland and Isle of Wight unitary model offers a more responsive and locally connected approach. By aligning governance with local geographies and maintaining strong community links, this model enables rural-focused decision-making and service design. This is particularly key in rural areas where local knowledge and resilience is key, supporting more equitable access to services which address specific rural pressures such as social inclusion, digital access and affordable housing.
This model enables decision making that ensures voices of rural residents are heard and reflected in local priorities. It also supports a total place approach, allowing councils to work with communities and partners to design services that are rooted in local assets, needs a nd opportunities, which may be lost in larger more centralised models.
A model with three or fewer mainland authorities in Hampshire may risk diluting the visibility of rural issues within broader strategic planning. Larger authorities covering more diverse geographies may struggle to prioritise rural needs, leading to less responsive service design. This could exacerbate existing inequalities and weaken relationships with rural communities.
Positive Impacts
Balancing urban and rural needs: Our four new mainland and Isle of Wight unitary model enables proportionate, tailored and effective service delivery across different population densities and types of communities. Grouping rural areas together (e.g. Mid Hampshire) ensures services reflect the needs of smaller towns and dispersed populations. While creating urban focused authorities around major centres like Southampton, Portsmouth and Basingstoke allows targeted responses to urban deprivation and need.
Locally responsive decision making: Where governance is aligned with geographies it enables authorities to prioritise rural specific needs. Supporting tailored service design for transport, housing, health and social care.
Opportunity to build on existing good practice: Local authorities with strong rural engagement and service models are better enabled to scale up successful approaches. As such, our four new mainland and Isle of Wight unitary model promotes continuity and innovation in areas of particular importance for rural communities in areas like transport, digital inclusion and preventative health.
Negative Impacts
Digital exclusion risks: Despite ambitions for digital transformation, rural areas may continue to face connectivity challenges. If digital-first service models are not carefully designed, they could inadvertently exclude residents with limited access to reliable broadband or digital skills.
12. Armed forces
12.1 Data Analysis
As a county, Hampshire and the Isle of Wight is unique in that it is home to all three branches of the Armed Forces – the Army, the Royal Air Force, and the Royal Navy. Notable military establishments include HMNB Portsmouth, RAF Odiham, and Army Headquarters in Andover. Out of the fourteen districts and unitaries all but Eastleigh and East Hampshire are home to a military base and/or reserves.
Due to the large military presence in Hampshire and the Isle of Wight, it is unsurprising that many service leavers decide to settle in the county. Out of all Hampshire and the Isle of Wight residents, in both unitary and district councils, 5.8% have previously served in both regular and/or reserve UK Armed Forces, totalling 96,139 individuals. Thirteen of the fourteen districts and unitaries have a higher proportion for service leavers than the English average of 4.2%, Southampton is the only district that falls below this average with 3.1% of the population previously serving.
Notably with 12.5% of their population previously serving in both regular and/or reserve UK Armed Forces, Gosport has the highest proportion of Veterans out of all Local authorities in England and Wales (Census 2021).
Gosport
Fareham
Havant
Rushmoor
Test Valley
Isle of Wight
New Forest
Hampshire
East Hampshire
Portsmouth
Winchester
Hart
Eastleigh
Basingstoke and Deane
England
Southampton
% Total previously served in both regular and/or reserve UK armed forces
12.2 Community Impact- Armed Forces
With there being many military bases with current serving personnel, veterans and military families across Hampshire and the Isle of Wight it is important that this community is considered when moving to new local authorities.
Armed Forces communities, including serving personnel, veterans, and their families, engage with local authorities through a range of serv ices such as housing, health and wellbeing, education, employment support, and community integration. These communities often face distinct challenges, including frequent relocation, access to specialist support, and the need for continuity in services like schooling and healthcare.
For example, according to the Hampshire Joint Strategic Needs Assessment (JSNA 4) (2019), veterans aged 16- 64 are more likely to have long term health problems with their arms, hands, legs, feet back or necks than the general population. Additionally, common mental health issues for both veterans include depression, anxiety, and alcohol misuse, with working age veterans more likely to report suffering with depression than the public.
Our four new mainland and Isle of Wight unitary model offers an opportunity to strengthen support for Armed Forces communities by enabling more locally responsive and coordinated service delivery. By aligning governance with established community and economic geographies, this model allows councils to build on existing relationships with military bases, garrisons, and veteran networks. It ensures services are tailored, accessible, and reflective of local needs. Crucially, it helps maintain visibility and continuity for Armed Forces families. Factors that could be diluted in larger, less locally connected structures.
Positive Impacts
Stronger local coordination with military infrastructure: Aligning governance with established community and economic geographies allows councils to build on existing relationships with military bases, garrisons and networks. Supporting more joined up service delivery and better integration of Armed Forces families into local communities.
Improved continuity of services: Frequent relocation is a common challenge for Armed Forces families. Our four new mainland and Isle of Wight unitary model will offer more consistent and locally responsive services across Hampshire and the Isle of Wight. Authorities can better coordinate across neighbouring areas to support transitions and maintain continuity.
Enhanced visibility and representation: Place-based authorities will be able to build on existing local partnerships and connections to be more aware of the needs of Armed Forces communities. Ensuring they are considered in local decision making and service design. Thi s includes recognising the unique needs of veterans, reservists and families.
Negative Impacts
Disruption to established support networks: Reorganisation may affect existing partnerships and service pathways, particularly if staff roles or commissioning arrangements change. This could impact access to specialist support or areas of work such as Armed Forces Covenant delivery.
4 More information about the Hampshire Joint Strategic Needs assessment can be found here - Joint Strategic Needs Assessment (JSNA) | Health and social care | Hampshire County Council
13. Socio - economic / Deprivation
13.1 Data Analysis
Deprivation can be measured by the Index of Multiple Deprivation (IMD) which is the official measure of relative deprivation in England. It ranks all local authorities from least deprived to most deprived – 1 being the most deprived. The 7 domains of deprivation, which combine to create the Index of Multiple Deprivation involve income, employment, education, health, crime, barriers to housing & services and living environment.
In Hampshire and the Isle of Wight deprivation varies widely across the county. Portsmouth is the most deprived Local Authority in Hampshire and the Isle of Wight ranking 59th out 319 Local Authorities according to the IMD rank of average score. This is closely followed by Southampton which ranks as 61st. Comparatively at a district level Hart ranks as the least deprived area in England as the 317th deprived Local Authority.
IMD - Rank of average score
The data demonstrates the range of deprivation across the county. However, within each Local Authority deprivation varies even further. For example, despite Havant and Gosport being ranked as 119th and 133rd most deprived local authorities they both have communities ranked in the most deprived 10% of LSOAs. Similarly, despite being ranked 193rd most deprived and above, Basingstoke and Deane, Rushmoor, Test Valley, Eastleigh and Rushmoor all have communities in the top 20% most deprived LSOA’s.
What is evidenced here is the value of a localised focus, offering deeper insight into specific community challenges. Given the wide variation in deprivation levels across existing local authorities, it is essential that the creation of new authorities reflects and responds to these local needs. Our four new mainland and Isle of Wight unitary model provides the necessary scope to achieve this.
13.2 Community Impact- Socio - economic/ Deprivation
Individuals living in areas of deprivation may engage with local authorities through a wide range of services aimed at addressing social and economic disadvantage. These touchpoints include housing and homelessness support, employment and skills programmes, public health services, early intervention and family support, and access to benefits and financial assistance. Deprivation is often linked to poorer health outcomes, lower educational attainment, and reduced access to opportunities and intergenerational poverty, making coordinated and targeted service delivery essential.
Our four new mainland and Isle of Wight unitary model offers a unique opportunity to address entrenched deprivation by aligning governance with lived economic geographies. By aligning governance with lived economic geographies, councils can better understand local challenges and build on existing partnerships and good practice. This enables more targeted investment, integrated prevention strategies, and locally tailored services that respond to the specific challenges faced by communities.
Through strong local leadership, tailored to distinct opportunities and challenges of each area, councils can develop bespoke strateg ies to drive inclusive economic growth, improve health outcomes and raise living standards. The model also supports enhanced neighbourhood working, enabling decision making at the lowest effective level and fostering meaningful engagement with communities experiencing deprivation. This is particularly important for ensuring services are accessible, trusted and responsive to local need.
In contrast, a model with three or fewer mainland authorities’ risks creating larger, less connected structures that may dilute the visibility of deprived communities. Broader geographies could lead to standardised service delivery, reducing ability to tailor services and interventions to specific local contexts. Large authorities may also risk uneven resource allocation when balancing urban and rural needs, reducing responsiveness to complex socio - economic challenges.
Our four new mainland and Isle of Wight unitary model’s emphasis on collaborative working, community engagement and local representation helps mitigate these risks by embedding services within communities and ensuring they are shaped by lived experience.
Positive Impacts
Targeted investment and integrated prevention: Aligning governance with lived economic and social footprints can enable more precise targeting of investment in areas of deprivation. Supporting coordinated service delivery and integrated prevention strategies which are rooted in communities to begin to address some of the root causes of socio - economic deprivation.
Building on existing partnerships and good practice: Our four new mainland and Isle of Wight unitary model builds on established local partnership, including those that address inequalities and deprivation. Enabling the scaling of successful local initiatives ensuring good practice is not lost and local challenges are understood and addressed.
Strengthening local economic leadership: Our four new mainland and Isle of Wight unitary model enables bespoke economic strategies to be tailored to the unique challenges and opportunities of each area. Underpinned by local knowledge, context and insight to enhance the ability to coordinate strategies that address the systemic causes of socio - economic exclusion.
Negative Impacts
Potential disruption to existing support networks: Reorganisation may temporarily affect partnerships and programmes that support deprived communities, especially if funding, commissioning, or staffing structures change. This could impact continuity of support for vulnerable residents during transition.
14. Workforce
The implementation of LGR will bring substantial changes for staff with the potential of new working practices, team structures and working environments. Such large-scale transformation has the potential to affect staff wellbeing, service delivery and collaborative working. As the details of the transition become clearer, subsequent EIAs will be undertaken to explore these impacts for staff in greater depth, including detailed analysis of staff demographics. As implementation plans and EIAs are developed, we will ensure that appropriate mitigations are identified and implemented to prevent any disproportionate or detrimental impact on staff with protected characteristics.
The impact on staff terms and conditions arising from LGR implementation will be significant and harmonisation of such will require extensive engagement with recognised trades unions and staff representatives. Central to that engagement will be a focus on ensuring equity, especially in respect of pay, and ensuring that there are no detrimental effects on staff with protected characteristics. Pay equity will be an area where specific EIAs will be undertaken throughout the implementation process. In addition, all of the local authorities in Hampshire and Isle of Wight already have a legislative obligation to publish pay policies, including gender pay gaps and this will soon include ethnicity and disability pay gaps. These data sets
will continue to be produced, and the accompanying analysis will act as a barometer of equitable practice. This will enable each of the four new mainland and Isle of Wight unitaries to monitor both pay and total reward equity, making changes and adjustments as required in the process of harmonisation, as well as taking account of the issues arising from the specific EIA.
From a workforce perspective, our proposed four new mainland and Isle of Wight unitary model offers the opportunity for a more inclusive approach. Smaller, more locally focused organisations are better positioned to understand and respond to the specific needs of their employees. Our four new mainland and Isle of Wight unitary model will offer a more manageable and consistent approach to embedding inclusive practices whereas larger organisations, with multiple locations, teams and services, could have difficulties in maintaining uniformity in how equality, diversity and inclusion is understood and applied. For example, preserving and maintaining a consistent and inclusive approach to reasonable adjustments for staff is more achievable in smaller, more locally focused organisations.
In recognition of the recruitment and retention challenges being faced within the sector, the changes that LGR will bring will have both challenges and opportunities from a change management perspective. Supporting staff through change will be paramount to ensure retention of staff and continuity of service delivery throughout the implementation phase and beyond. In addition to more specific EIAs, change impact assessments will also be used identify and to mitigate the impact of change on the workforce. Our proposed four new mainland and Isle of Wight unitary model will ensure that leadership of the change (a critical success factor) and its impact on the workforce can be more effectively delivered through smaller organisations and a closer and more direct relationship between leaders, managers and staff. A model of three or fewer mainland unitary authorities would create much larger organisations and therefore a greater distance (physically, figuratively and culturally) and lesser connection between leadership and the workforce, making it more challenging to effectively lead and implement change, thus adding risk to service delivery and business continuity.
Our proposed four new mainland and Isle of Wight unitary model will support the development of agile, responsive HR policies that are reflective of workforce profiles and needs, enabling more tailored approaches to aspects such as staff wellbeing, recruitment and retention. This approach will also enable more effective engagement with staff, through staff networks and support groups, ensuring diverse voices from across the organisations are heard and reflected in decision making. With fewer, larger organisations, there is the potential for a lack of connection between leadership and staff which can impact how valued, engaged and supported staff feel.
The LGA Equality Framework emphasises the importance of providing equality of opportunity for all staff and employing a workforce that reflects the diversity of the local population. Our four new mainland and Isle of Wight unitary model would allow for more focused implementation of EDI strategies and initiatives, ensuring that equality considerations are embedded in aspects such as workforce planning and development, enabling more equitable outcomes for staff. Our four new mainland and Isle of Wight unitary model would also provide the opportunity for new authorities to take a more targeted approach to recruitment from the local population. Through a greater understanding of the make-up of the local population,
strong links to local communities and targeted positive action initiatives, authorities could ensure their workforce is representative of the local community and is reflective of their needs in inclusive service delivery.
Positive Impacts
Consistency in implementing EDI: Our four new mainland and Isle of Wight unitary model gives the opportunity to embed inclusive practices and policies across locations and teams with greater consistency, meaning more equitable outcomes for staff cross the organisations.
Representative workforce: There is the potential for the workforce to more closely reflect the local population with our four new mainland and Isle of Wight unitary model. This model would provide clearer understanding of local demographics so that organisations can tailor approaches to recruitment to address underrepresentation. The workforce would be reflective of the communities they serve and have greater understanding of their needs.
Enhanced staff engagement: Our four new mainland and Isle of Wight unitary model offers the opportunity for greater staff engagement, enabling organisations to better understand the experiences of staff and create closer connections between leadership and staff. This offers the opportunity to be more responsive to staff needs and create a culture where staff feel valued and heard.
Negative Impacts
Disruption to staff support: Current support in place, such as individual reasonable adjustments or staff networks and support groups, could be impacted during the transition period of reorganisation which could affect staff morale and wellbeing.
Risk of fragmentation: Our four new mainland and Isle of Wight unitary model aims to reduce fragmentation but in the transition period, without strong co - ordination, there is a risk that policies and practices differ between organisations.
15. Intersectionality
While each of the characteristics provide a lens through which to assess potential impacts of LGR and how our four new mainland and Isle of Wight unitary model may affect individuals and communities, it is essential to recognise that individuals do not experience these characteristics in isolation.
Many residents live at the intersection of multiple identities, for example an older disabled woman living in a rural area may experience the compounded impacts of these overlapping characteristics and this can shape how people engage with local authority services.
This example is supported by existing data. Demographic factors such as age and sex significantly influence individuals lived experiences. The data below, taken from the 2021 Census, highlights a correlation between age, sex, and disability. For example, both the 50–54 and 75–79 age groups, women are more likely to report a disability than men. Furthermore, disability prevalence increases with age across all sexes, meaning older adults particularly older women are disproportionately affected. When this is considered alongside the deprivation faced by rural communities, especially in terms of barriers to housing and services (as outlined in section 11.1), it becomes evident that an older disab led woman living in a rural area may face compounded challenges. These intersecting characteristics can create significant barriers to accessing services barriers that may be overlooked if protected characteristics are considered in isolation.
Percentage of Residents Aged 50 - 54 and Disabled
Percentage of Residents Aged 75 -79 and Disabled
Across Hampshire and the Isle of Wight, intersectionality is particularly relevant given the region’s diverse population and varied geography. Urban centres, coastal communities and rural areas each present distinct challenges and opportunities, and the way services are accessed and experienced can vary significantly depending on a person’s combined characteristics and circumstances.
Our four new mainland and Isle of Wight unitary model offers a more responsive framework for recognising and addressing these complexities. By aligning governance with real economic and social geographies, the model supports place-based service design that is informed by lived experience. This enables councils to better understand how overlapping factors (such as age, disability, ethnicity and socio - economic status) interact to affect access to housing, education, health, transport and cultural opportunities.
The proposal’s emphasis on enhanced neighbourhood working, local representation and community engagement creates space for more inclusive decision making and co -design. It also supports the development of targeted interventions that reflect the realities of residents’ lives.
In contrast, a model with three or fewer mainland authorities’ risks creating larger, less connected structures that may dilute the visibility of marginalised groups and reduce the ability to respond to nuanced, intersectional needs. Standardised service delivery across broader geographies could result in poorer outcomes for those facing multiple barriers, particularly in areas with distinct cultural, demographic, or geographic profiles.
By recognising and responding to intersectionality within communities as well as the workforce, our four new mainland and Isle of Wight unitary model can help create a more inclusive, equitable, and resilient local government system. One that reflects the full diversity of Hampshire and the Isle of Wight and delivers better outcomes for all.
16. Mitigations
We recognise that delivering Local Government Reorganisation (LGR) at this scale brings complexity and risk, particularly in ensuring continuity, equity, and responsiveness during transition. That is why we are taking a proactive and structured approach to mitigation— embedding safeguards across every stage. From planning and ICT integration to workforce engagement and community co - design, our approach is grounded in collaboration, learning from previous LGR programmes, and a shared commitment to protecting and enhancing outcomes for all.
To ensure continuous monitoring, regular reviews and analysis of workforce and community data, and feedback from staff, communities and service users, will take place throughout transition planning and implementation with regular reporting to new authority leadership and community stakeholders to ensure transparency and accountability. A monitoring framework, with key indicators, as well as subsequent EIAs will be used to identify any emerging risks and where negative impacts are identified, mitigating actions will be taken to ensure that equality considerations remain central to decision making.
These mitigations are not standalone measures, they are woven into the fabric of our programme to ensure that the new unitary authorities are not only safe and legal, but also inclusive, resilient, and rooted in the communities they serve. Mitigations taken in developing the Hampshire and the Isle of Wight case for change includes:
Community Engagement
Residents have played a crucial role in shaping the future design of local government across Hampshire and the Isle of Wight. Ensuring that our four new mainland and Isle of Wight unitary model effectively serves communities and delivers improved outcomes is our top priority. To gather public perspectives, a region-wide engagement survey was conducted throughout July, capturing feedback on the proposed options.
Alongside this, workshops were held with key partner organisations, including police, fire and health services, Coastal Partners, National Parks, businesses, town and parish councils and the voluntary and community sector, to explore opportunities and challenges linked to reorganisation.
Further engagement has also taken place within the proposed new unitary areas, involving residents, members of parliament, higher and further education providers, businesses, town and parish councils, and voluntary and community groups to gather more localised views. This comprehensive engagement process helps ensure that the new authorities are shaped by those they serve, mitigating risks of reduced visibility and promoting inclusive, place-based governance.
Community engagement plays a vital role in mitigating the risk of reduced visibility and weakened relationships during any transition. By involving communities’ voices from the onset of proposal development it ensures the voices and needs of those most directly affected are recognised. This also builds trust within different community demographics and the feeling of continuity. Which is particularly important for groups such as LGBTQ+ communities, ethnically diverse communities, faith groups and rural residents who rely on local networks and informal support. Engagement activities ensure that services remain responsive to lived experiences and are designed with these views in mind so as not to be lost in structural changes.
Across Hampshire and the Isle of Wight authorities have a strong, proven track record for meaningful engagement with residents and involving communities in decision making. For example, in Portsmouth a community-centred approach is being taken to digital inclusion with audience groups including Local Authority housing tenants, people with disabilities, low-income households and people who are unemployed and seeking work. This demographic profile for community- centred approaches has been identified via Government’s digital inclusion action plan and through research conducted in Portsmouth by the local authority in conjunction with the VCS. Providing strong foundations to build on throughout the next phases of LGR. Community engagement will remain a central pilar throughout LGR implementation. With a key principle of the proposal being that service delivery should align with distinct communities, engaging them upfront in the shaping of future service.
Stakeholder Engagement and Workshops
We have embedded extensive stakeholder engagement into the LGR process, including focused workshops with service leads, external advisers, and key partners such as police, fire, health, and coastal authorities. These sessions have helped shape service models in high-demand areas and ensure that future delivery is informed by operational expertise and strategic insight. This collaborative approach strengthens the resilience and inclusivity of new service structures.
Focused workshops with service leads, external advisers, and key partners help mitigate risks of fragmentation and service disruption, especially in high- demand areas like adult social care, children’s services, and housing. These sessions support continuity for older adults, disabled residents, pregnant people, and those experiencing socio - economic deprivation by embedding operational expertise into future service models. They also strengthen relationships with specialist providers and advocacy groups, reducing the risk of losing local knowledge and trusted contacts.
Transition Planning
Transition panning for LGR in Hampshire and the Isle of Wight is informed by prior experience of unitarisation within the region, including the establishment of unitary councils in Portsmouth, Southampton and the Solent. The expansion of Portsmouth and Southampton unitaries will make LGR transition easier as both councils already deliver a full range of services with established systems, staff, governance and partnerships in place. Expanding existing unitaries will allow for service continuity, lower transition costs and faster implementation. While also building on proven delivery models and local knowledge.
Our four new mainland and Isle of Wight unitary model aligns with existing economic geographies and patterns of movement, reflecting the way people live, work and travel. Early transformation work has already commenced, with collaboration across 11 councils and key partners. A set of shared implementation principles focused on collaboration continuity, local design, financial sustainability and workforce wellbeing, will guide the transition process and help ensure the new structures are inclusive, resilient and responsive to community need.
Transition planning is essential to managing risks of disruption, fragmentation, and workforce instability. By building on ex isting unitary structures and aligning with economic and social geographies, this mitigation supports continuity in services that a re critical for older adults, disabled people, trans residents, and families. It also helps maintain stability in gender-specific services, Armed Forces support networks, and programmes addressing deprivation. The use of shared implementation principles ensures that transition is guided by collaboration, local design, and workforce wellbeing while building on existing proven delivery models and local knowledge.
Inclusive Service Design
Our four new mainland and Isle of Wight unitary model places emphasis on designing services that are inclusive, locally responsive and informed by evidence. To support this, the 11 councils in the proposal prioritised high- cost, high demand and strategically significant service areas. Including adult social care, children’s services, waste, highways and transport, strategic planning, economic development and regeneration, education, housing and homelessness and customer and digital.
A series of focused workshops were held with council leads and external advisers to examine current service provision, identify challenge, good practice and existing collaboration and explore transformation opportunities.
These sessions contributed to shaping future service models that reflect the distinct needs of communities across Hampshire and the Isle of Wight. This inclusive design approach aims to mitigate risks of exclusion or inequity by embedding local insight, collaboration and innovation into the development of new service structures.
Inclusive service design directly addresses risks of exclusion, digital barriers and loss of specialist expertise. By embedding local insight and evidence into service transformation, this approach ensures services are culturally competent, accessible and tailored to diverse needs. This could include residents with disabilities being supported to share their views on accessibility planning, diverse communities inputting on culturally sensitive design, and LGBTQ+ communities on respectful and inclusive service delivery.
Staff engagement and communications
Keeping staff well-informed and engaged has been a focus throughout the initial stages of LGR to ensure transparency and understanding of the process. Regular updates have been communicated with staff via internal communications, including messages from Chief Execs and dedicated intranet pages. Staff have been encouraged to participate in surveys on the shaping of LGR and have been invited to attend staff briefing sessions to ensure their views are heard and questions are answered, reducing staff anxieties around potential changes as much as possible. This transparent and inclusive approach will continue to build understanding of proposed changes and foster a sense of involvement in LGR.
Transparent and inclusive staff engagement mitigates risks related to workforce disruption, loss of specialist knowledge and reduced service quality. By keeping staff informed and involved this mitigation supports continuity in services for vulnerable groups. It also helps preserve trusted relationships between service providers and communities, which is especially important for the groups discussed throughout this EIA during periods of change.
17. Reflections
Any decision about the future of local government will have real and lasting impacts on the communities it serves. This EIA has explored how our four new mainland and Isle of Wight unitary model may affect individuals and groups across Hampshire and the Isle of Wight, recognising both the opportunities and the risks. What emerges clearly is that our proposed model of the creation of four new mainland unitary authorities with the Isle of Wight remaining independent offers a transformative opportunity to reshape local government in a way that is more responsive, inclusive, and rooted in place.
By aligning governance with real economic and social geographies, our four new mainland and Isle of Wight unitary model enables councils to better understand and respond to the diverse needs of their communities. It supports tailored service design, stronger local leadership, and more meaningful engagement, particularly for groups whose needs may be overlooked in larger, more centralised structures.
The assessment also acknowledges that change brings complexity. Transitioning to new authorities may disrupt existing relationships, services, and systems. However, the mitigations embedded throughout the proposal, including inclusive service design, community and stakeholder engagement, and robust transition planning, are designed to address these risks directly. These measures are not generic; they are targeted responses to the specific challenges faced by different groups, ensuring that equity and inclusion are central to the transformation process.
Importantly, this assessment recognises that individuals do not experience their identities in isolation. Intersectionality shapes how people engage with services and experience public life. Our four new mainland and Isle of Wight unitary model provides a framework for recognising and responding to these complexities, enabling councils to design services that reflect the realities of residents’ lives.
A model with three or fewer mainland authorities presents a risk of reducing the visibility and influence of certain communities, particularly those with distinct geographic, demographic, or socio - economic profiles. Larger administrative areas may struggle to reflect the nuanced needs of smaller towns, rural communities, or marginalised groups, leading to more standardised service delivery that overlooks local variation. This could result in under-resourcing of services in areas with complex or less prominent needs, weakening the ability to deliver targeted interventions and diminishing opportunities for community-led design. In turn, this risks exacerbating existing inequalities and undermining the responsiveness, trust, and inclusivity that are central to effective local governance.
As Local Government Reorganisation progresses, future Equality Impact Assessments will be developed to provide more detailed and targeted analysis. These will incorporate updated data, community insights, and feedback from service users to ensure a deeper understanding of evolving impacts. Monitoring and implementation of this and subsequent EIAs will be embedded into transition planning from day one, with regular reporting to new unitary authority leadership and community stakeholders. This will help ensure accountability, transparency, and that equality, diversity and inclusion remain central to decision-making throughout and beyond the reorganisation process.
The proposal put forward aims to build a future where every community thrives. Where services are designed with and for the p eople they serve. Where councils are close enough to understand local needs, but strong enough to deliver lasting change. By embracing this opportunity, we can create a modern, resilient, and inclusive local government system that reflects the full diversity of Hampshire and the Isle of Wight and delivers better outcomes for all.
EIA writers(s) and authoriser
Name
Imogen Colley Community Engagement Manager EIA Report Writer
Leoni Roberts Policy Officer EIA Report Writer
Ellie Adams Policy Officer EIA Report Writer
Sarah Kay Strategic Lead – Equality, Diversity and Inclusion EIA Report Writer
Valley Borough Council
Valley Borough Council
Valley Borough Council
City Council
Natasha Edmunds Director of Corporate Services EIA Report Writer Portsmouth City Council
Karen Dunn Head of Legal and Democratic Services EIA Authoriser
Appendix 8:
Our Place, Our Future: Shaping council services in Hampshire, Southampton, Portsmouth and the Isle of Wight - local Government Reorganisation engagement report
Our Place, Our Future: Shaping council services in Hampshire, Southampton, Portsmouth and the Isle of Wight
Background and overview of approach
Background to the engagement
In December 2024, the Government announced its intentions for a largescale reorganisation of local government. It has asked two-tier local authorities across England to review how local government is organised. In Hampshire, Southampton, Portsmouth and the Isle of Wight, that means local councils are being asked to consider options for replacing the current county, borough, district and unitary authority arrangements.
A group of 12 of the 15 councils* in the area are collaborating on options for reorganising the council boundaries. They have commissioned Thinks Insight & Strategy to conduct large-scale resident engagement to understand what matters most to residents about their area, to ensure that future councils reflect real places, priorities, and people. This engagement will inform and support these councils’ submissions to the Ministry for Housing, Communities and Local Government (MHCLG).
* Hampshire County Council is working on its own proposal and is consulting on this separately. East Hampshire District Council opted not to participate in commissioning or promoting this engagement, while Gosport Borough Council commissioned a separate survey within this engagement.
Engagement approach
• Working with the 12 commissioning councils, Thinks Insight & Strategy developed a questionnaire including a mix of open-ended and closed (e.g. multiple choice, scale questions) questions, as well as supporting materials such as FAQs and background information for respondents. The survey and information about LGR and the engagement were hosted on specialist engagement platform Commonplace. The engagement was live between 30th June and 27th July.
• The survey was disseminated via social media channels, email, and out-of-home advertising (e.g. posters, flyers, paper tags on domestic waste bins) including QR links.
• The survey was designed to be easily accessible, with options to request a paper copy or telephone interview for greater inclusion.
• Anyone could respond, with no restrictions or quotas. This means the survey is not necessarily representative of the views of the population as a whole. Rather it shows the views of residents who were keen to have their say on the issue of local government reorganisation.
Example social media post
Example bus stop poster
Notes on approach and how to read this report
• Survey dissemination: This survey was publicised and promoted by the commissioning councils via their social media, email, and other channels (including physical posters with QR codes). In East Hampshire, where the District Council did not take part in the engagement, the survey was promoted by Thinks Insight via marketing channels (email and Meta adverts).
• Other engagement activity: Basingstoke, Hart and Rushmoor together promoted a north Hampshire specific self-selection survey alongside this survey. This is likely to have reduced response rates from those areas, especially as all the Hampshire mainland options people were asked for feedback on proposed the same north Hampshire council. Similarly, Portsmouth City Council ran its own, localised survey which closed 29th June (the day before this consultation launched), likely affecting numbers on this survey. In addition, Hampshire County Council launched its own engagement on 21st July (about a week before this engagement closed).
• Sample selection, quantitative representation and weighting: This engagement sought the views of as broad a selection of residents as possible, looking to hear from everyone who has something to say on the question of LGR. However, as with any opt-in or self-selected sample, the data reported here should not be treated as representative of the wider Hampshire population. Most importantly, those who chose to participate in the engagement are likely to be more engaged and more vocal than the average resident. Demographically, the sample skews towards older, white participants compared to census data. This type of data is not suitable for weighting (i.e. making it more representative through statistical manipulation) as it could result in biased and inaccurate data. Proportionally, there is a much a higher response rate from areas such as the New Forest, Test Valley and Winchester. This means these councils have a larger impact on average values than others. We have also reported on each council separately to avoid this bias.
Notes on approach and how to read this report
• Incomplete data/responses: Unlike a representative research survey, almost all questions in this engagement were optional and we included responses from participants who only answered a small number of questions in our analysis. This means the base size for analysis varies between questions.
• Statistical significance: By default, a p-value of 0.05 was used for significance testing, in line with industry standards. Differences by subgroups have been explored throughout the report and those which were statistically significant have been highlighted in red and green. Where statistical significance is mentioned, this refers to a difference within the sample, e.g. where respondents from one council are significantly more or less supportive of an option than the average respondent in the engagement.
• NETs and rounding: NET, or aggregate, scores have been used in this engagement report to group together responses that are similar (e.g. a NET for satisfaction would show very satisfied + fairly satisfied). These NET scores have been calculated based on exact values, while the charts show rounded values for individual scores. Because rounding replaces exact values with approximations, i.e. every number becomes a little higher or a little lower than the exact value, small differences can accumulate when adding or subtracting several rounded numbers. As a result, the total of rounded figures may not exactly match the rounded total of the original values.
Survey overview
Part 1 of the survey introduced LGR, as well as the three options under consideration by the commissioning councils (see next slide)*. Residents were asked to share their views and preferences for the new unitary authorities.
Part 2 of the survey focused on residents’ feelings about their local area – the places they go, the services they use, and what they would like to see from their local council.
In addition, we collected demographic information (e.g. age, gender, ethnicity, occupation, etc.) to support analysis and monitor uptake.
NB. When we initially launched the survey, it was not split into two parts and included a map-based activity which some participants found difficult to use. We removed the map activity after 8th July, and changed the order in which people were directed to the survey (to prioritise the options tile) on 11th July. We received almost twice as many responses to Part 1 (the survey focussed on the options) as we did to Part 2 (with a focus on their local area).
* In the separate survey commissioned by Gosport Borough Council, residents were not shown the three options and instead asked open questions about their preferences for local government more generally.
Respondents were asked about 3 potential options for reorganisation:
Council 1: Basingstoke, Hart, Rushmoor
Council 2: New Forest, Test Valley, Winchester, East Hampshire
Council 3: Eastleigh, Southampton
Council 4: Portsmouth, Havant, Gosport, Fareham
Council 5: Isle of Wight
Council 1: Basingstoke, Hart, Rushmoor
Council 2: Test Valley, Winchester, East Hampshire
Council 3: New Forest, Eastleigh, Southampton
Council 4: Portsmouth, Havant, Gosport, Fareham
Council 5: Isle of Wight
Potential boundary changes, affecting parishes in the New Forest, Test Valley, Winchester and East Hampshire.
Sample overview
Sample observations
• Compared to similar engagements that have been hosted on Commonplace, this is a very high response rate.
• In proportion to their populations, New Forest (1.79%), Test Valley (2.09%) and Winchester (1.34%) achieved the highest response rate.
• In council areas where other engagements were also promoted, or where there is less of a difference between proposed options, the response rate was significantly lower (e.g. 0.07% in Hart, 0.11% in Basingstoke).
• Demographically (see more on the next slide), the sample skews older, when compared with census data.
• Almost half of respondents are retired and the sample leans towards respondents from a higher socioeconomic background.
Demographic sample overview
Executive summary
Overarching reflections
Respondents to this survey are largely highly engaged residents. Only 7% had not heard of LGR before taking part, and most have also taken a range of actions in the past (e.g. signing petitions, writing to their MP) that suggest they are more politically engaged than the average citizen. Older residents were more likely to respond to this survey than younger people.
2
3
Perhaps unsurprisingly, the response rate is highest in areas where the options for new unitary authorities vary significantly or where there are potential boundary changes (in particular the New Forest, Test Valley, and Winchester). For these residents, the stakes can feel higher than for residents of areas where the options do not differ, such as those in North Hampshire.
Across respondents, the case for reorganisation is not clear. Although only 1 in 10 (9%) residents in the engagement strongly opposes all three options for LGR, qualitatively, respondents tend to support an option which they feel is the “best of a bad bunch”. Most feel that the proposed unitary authorities are too big, impacting local decision-making and service delivery. Many doubt that LGR will help to save money or deliver services more efficiently. Almost all assume that they will lose out in some way as a result of reorganisation.
4
When considering the options, respondents are most likely to refer to what they feel makes most sense for a county that includes very rural areas such as the New Forest alongside conurbations such as Southampton or Portsmouth. This urban-rural divide is seen to be about culture and way of life, but also about relatively wealthy rural councils having to ‘subsidise’ indebted city councils. Rural respondents tend to be more worried about losing their voice as a result of LGR, while urban respondents tend to be more open to decisions being made more centrally on behalf of a wider area.
5
Responses to this engagement suggest that there are deeper concerns about urbanisation, overdevelopment, and immigration which underlie these considerations. These combine with a perception of overstretched and underfunded public services and infrastructure – from social care to roads, education and GP surgeries. 300
Key findings on Option 1
• Even if the area feels very large, Option 1 is strongly preferred by respondents from Test Valley and New Forest, based on a sense that rural councils should stick together to preserve their way of life. These respondents also argue that services would be easier to administer as these areas have more similar needs.
• Their preference is also based on a mutual rejection of Southampton, which respondents in this engagement visit regularly but do not feel culturally aligned with.
• Respondents from East Hampshire and Winchester residents do not agree – they feel Council 2 is too large an area to effectively govern under this proposal.
• Those in other areas have less strongly held views on the options overall, but make similar points regarding the urban-rural alignment and worry about the size of the new unitary authorities.
With it covering such a large area I believe we would lose some of identity and as a result an understanding in community needs. Issues in the New Forest are not he same as issues in East Hampshire seeing as the density of population is more.
Winchester, 75-84
It links together the rural communities better than the other options. This is very important for Totton and the New Forest. The South Downs national park and the new forest have much in common.
New Forest, 55-64
Council 1: Basingstoke & Deane, Hart, Rushmoor
Council 2: New Forest, Test Valley, Winchester, East Hampshire
Council 3: Eastleigh, Southampton
Council 4: Portsmouth, Havant, Gosport, Fareham
Council 5: Isle of Wight
Option 1
Test Valley and New Forest have a clear preference for Option 1, which
would see them form a larger, majority rural unitary authority
Support for option 1 % selecting “strongly support” or “support”
Basingstoke
Key findings on Option 2
• Those who responded from the New Forest are strongly opposed to Option 2, and worry about losing their identity and access to services, fearing that the needs of Southampton would be prioritised.
• Respondents from Eastleigh and Southampton also have reservations about being joined in a larger unitary authority they perceive as quite disparate.
• However, this is the preferred option for respondents in East Hampshire and Winchester. While they express concerns about impacts for the New Forest, geographically this is seen to make more sense. While the area still feels very large under this option, to many respondents from those eastern areas, Option 1 is simply too big.
• As with Option 1, In the areas where there is no difference between the two options, opinions are split but less strongly held.
I like that the cities Southampton, Portsmouth and areas such as Havant are separate from EH & Winchester. I prefer that New Forest is in a council closer to it geographically and that council 4 covers more of the area that is local to me (by taking away the New Forest).
East Hampshire, 45-54
Would the New Forest want to be linked with Southampton? Eastleigh, 75-84
Council 1: Basingstoke & Deane, Hart, Rushmoor
Council 2: Test Valley, Winchester, East Hampshire
Council 3: New Forest, Eastleigh, Southampton
Council 4: Portsmouth, Havant, Gosport, Fareham
Council 5: Isle of Wight
Option 2
East Hampshire and Winchester respondents lean towards Option 2,
which they feel is preferably to the larger Option 1. New Forest and Southampton respondents are both sceptical about the proposed union
Key findings on Option 1a – boundary changes
• This option is most disliked and considered controversial by many respondents. It is also the most poorly understood, with respondents wondering whether the affected areas will be split out into smaller separate councils, or joined to the proposed larger councils. This would need to be carefully explained to residents in affected parishes.
• Across all areas, those unaffected, i.e. not living in one of the parishes, are relatively more likely to see benefits to this; however, only very few in the potentially affected parishes agree.
• Across councils, respondents argue against their parishes being absorbed into more urban unitary authorities, which they see as threatening their rural way of life and paving the way to urbanisation, overdevelopment, and deprivation. These respondents also worry about their voice being trumped by those of city residents in decision-making. This is felt more strongly in the New Forest and Test Valley, compared to East Hampshire and Winchester.
• Only a small minority in these parishes agree that this could lead to a better representation of how people already live, work and access services. These views are more common in the southern parishes of East Hampshire and Winchester than New Forest or Test Valley.
Option 1a
Potential boundary changes, affecting parishes in the New Forest, Test Valley, Winchester and East Hampshire:
• Totton & Eling, Marchwood, Hythe & Dibden and Fawley.
• Nursling & Rownhams, Chilworth, Valley Park and North Baddesley.
The Waterside is NOT a suburb of Southampton. We would be peeled away from our longstanding community in the New Forest.
• Horndean, Clanfield and Rowlands Castle. This matches areas to the larger areas they serve. I think it presents a more realistic picture
1a is almost universally disliked, particularly among those potentially affected by boundary changes. However, this rejection is more pronounced in Test Valley and New Forest than in Winchester
and East Hampshire
Support for Option 1a % selecting “strongly support” or “support”
Overarching findings from the engagement
Views of the local area
The majority of residents engaged in this survey enjoy living in their local area and feel connected to their community
My local area is a nice place to spend time
I feel proud to say I live in my local area
I feel connected to my local community
There are plenty of things to do in my local area
My area has a strong local identity
Strongly
At more than 8 in 10 (87%), respondents in New Forest are most likely to say they feel proud of their local area, especially compared to Southampton respondents (52% of whom agree). Respondents in New Forest (81%), Portsmouth (77%), and Winchester (73%) are most likely to say there are plenty of things to do in their local area.
Respondents in this engagement value easy access to green spaces and the seaside, and active local communities
Access to green spaces, with the seafront, New Forest, AONBs and nice landscapes nearby
Active communities, with clubs, groups and things to do and a friendly environment
Access to amenities and nearby towns or cities for shops and things to do
Welcoming community. Easy to get involved and feel part of the village. Really good pubs and great walking. Disused railway line is a real bonus.
Winchester, 65-74
Peaceful and plenty of green outdoor space. Sense of community in the village. Not too far from a few city centres if you want to go out to restaurants or shopping.
Winchester, 35-44
Transport hubs nearby by car, train or plane
Peace and quiet, particularly in rural areas
Good schools for younger people
The road system allows for easy access to all parts of the area. Plenty of nice open spaces and parks which are all well maintained.
Eastleigh, 85+
The countryside, the friendliness of people, good schools, good access to London and major roads to other cities.
East Hampshire, 25-34
Respondents also agree on the negatives: over-development, issues with traffic and transport, high house prices
Overdevelopment, which is causing strain on existing infrastructure
An increase in crime, anti-social behaviour which is making residents feel unsafe
Inaccessible transport, with poor links in rural areas, expensive bus or ferry tickets and expensive parking
Heavy traffic in towns and on main roads (A326, M27), and associated noise and pollution
Unaffordable housing, making it difficult for younger people to find homes
TOO CROWDED. Too many new homes with no supporting infrastructure. Traffic is a nightmare.
Eastleigh, 65-74
The public transport is poor, there is effectively no option to travel any great distance but to drive.
New Forest, 25-34
Few shops or activities, particularly for younger groups
Littering and limited maintenance
I wish there was more to do in town socially, like nice places to eat or drink for my age group.
Test Valley, 35-44
Those who do not treat our surroundings with respect, poor quality of roads and general littering, unsatisfactory police presence.
New Forest, 75-84
Despite these similarities, not everyone has the same experience of life in Hampshire, Portsmouth, Southampton and the Isle of Wight
Urban / rural
Urban residents in the area are usually more satisfied with their ability to access services, activities and entertainment. They are also most likely to be satisfied with their access to public transport. However, even though many can access green spaces relatively easily, they experience challenges around traffic, noise, pollution and crime.
Rural residents are more likely to be satisfied and proud of where they live. However, this group is often older, and are more likely to experience issues getting around the wider Hampshire area and accessing services.
Older / younger
Older residents are more likely to be satisfied with the activities and community life that is available, even when living in villages or rural areas. However, the oldest generations often experience challenges getting around on public transport, and feel that it isn’t always accessible to them or well connected enough.
Younger people express more frustration around the range of activities and events that are available near them – especially those living in rural areas. Those living in cities are more likely to be excited by the range of events, shops and restaurants on offer.
Residents across the sample talk about differences between ‘richer’ and ’poorer’ areas, often raising concerns about how the two might interact when it comes to decision-making and service delivery.
While most name urban areas as more likely to be poorer, have social housing and more people experiencing deprivation, residents also raise concerns around deprived rural communities being forgotten. There is a sense that support and services for this group are largely available in cities, and are inaccessible to those living rurally.
Rich / deprived
Respondents generally feel their area is well located and peaceful, but housing is expensive and work opportunities can be limited
Access to parks and green spaces: Those living in the New Forest (95%), Winchester (92%) East Hampshire and Hart* (both 95%) are most likely to be satisfied.
Access to shopping and services: Those living in the New Forest (75%) and near cities in Winchester (72%) and Portsmouth (71%) are most likely to be satisfied.
Work opportunities: Those living on the Isle of Wight (15%), Gosport (20%) and East Hampshire (25%) are least likely to be satisfied.
Affordability of housing: Those living in Gosport (35%) and Portsmouth (34%) are most likely to be satisfied, while those in Winchester are least satisfied (20%).
Residents in this engagement identify differently with their local area, but many are accessing services in their nearby city
Some see the whole of Hampshire as their local area, often because they travel around the wider area for work or for leisure. These people have often lived in multiple places around Hampshire, or have friends and family spread around the wider area.
City or council
Many mention their town, city or current council area, such as ‘Test Valley’ or ‘Winchester’ as it is the main place they work, access services and spend their leisure time. Even those who don’t see the whole city as their local area tend to say they have to go there to access services.
Other define their local area as specific villages or neighbourhoods, such as ‘Bishops Waltham’ or ‘Waterside’, even if they have to leave regularly to access facilities and services nearby. These are most often people living rurally, who identify strongly with their community.
Working adults are generally more mobile, often commuting to hubs such as Southampton, Winchester, or Portsmouth, but also London. Many are going to urban centres across Hampshire to access services. Retired residents, especially those who make more use of public services, are likely to travel in their immediate local area for most of their needs, but sometimes find they have to go quite far for specific needs (e.g. for hospital appointments, better shopping options, etc.).
Hampshire
Views of the local council
Across the county, respondents agree that their areas are green and safe, though access to services is more variable
Rural respondents tend to be more satisfied with safety and cleanliness, while those in urban areas benefit from better infrastructure and public transport
More satisfied
Safety
Cleanliness
Respondents in rural councils are most satisfied: Hart* (84% satisfied), New Forest (82%) as well as those living in Winchester City Council (82%).
Those more likely to be rural are most satisfied with this: those living in Hart* (82%), New Forest (77%), Test Valley (70%) and East Hampshire* (69%) but also those living in Winchester (73%).
Public transport
Entertainment and things to do
Respondents living in cities such as Portsmouth are most satisfied (72%), followed by Southampton (64%) and Rushmoor (63%).
Those living in Portsmouth are most likely to be satisfied (71%), followed by those living in Basingstoke & Deane (65%) and Fareham (62%).
Many of those living in cities feel more neutrally, with 57% feeling satisfied in Southampton and Winchester.
Less satisfied
Those living in Southampton (48% satisfied), Rushmoor (54%), Gosport (55%) and Portsmouth (60%) are least likely to be satisfied.
On the other hand, those living in Southampton are least likely to be satisfied (26% satisfied), followed by Rushmoor (30%) and Havant (36%).
Those living in Hart* are least satisfied with public transport (16%), followed by East Hampshire* (35%) and Winchester (35%).
Less than a quarter of those living in Gosport are least satisfied (23%), followed by East Hampshire (26%) and Havant (34%).
The vast majority of respondents feel the council should prioritise delivering high-quality services, and representing local voices
Access to care services is a clear priority across the county, reflecting one of the most prominent concerns about service provision after LGR
What councils should prioritise in the future
Showing weighted average score for each option out of 10*
Ensuring people have access to the care services they need
Providing waste and recyling services
Maintaining roads
Providing good quality education and learning services
Keeping the area clean and tidy
Supporting businesses and encouraging economic development
Providing public transport routes
Offering housing services
Providing parks and leisure facilities
Providing planning and building services
Weighted average score
Ensuring access to care services is most important to those who are older (8.1 for those aged 65-74 and 8.5 for those ages 75+).
Providing parks and leisure services is also a higher priority for young people (5.6 for those aged 25-34 and 5.4 for those aged 3544).
Residents express similar priorities and areas for improvement, connected to the negative aspects of their local areas
Overdevelopment
Crime and antisocial behaviour
Inaccessible transport
Heavy traffic
Unaffordable housing
Few shops or activities
Vandalism and littering
Improving infrastructure in areas that are being further developed. Also ensuring that green spaces are cared for and protected, with a focus on biodiversity and making them attractive.
Improving social cohesion and activities for younger people to build a stronger sense of community. Also increasing policing and surveillance, and targeting areas where anti-social behaviour is worst.
Improving and integrating public transport routes, as well as ensuring they are all accessible –particularly on the Isle of Wight, and providing better bus services in the evenings.
Encouraging more public transport and active travel, as well as rethinking major roads to ensure they are able to cope with the volume of traffic.
Improving housing stock, building more social housing, and ensuring that there are options for younger local people (in strong tension with fears and perceptions of overdevelopment).
Supporting businesses (especially independent ones) to make town centres more lively and vibrant, and attractive to all different age groups. Also providing better access to services such as banks.
Providing more proactive maintenance and repairs, and increasing policing or fines for littering and vandalism.
While more than half agree that other areas’ needs should be considered, they strongly feel that decision-making should be local
“It is important that my council reflects the identity of my local community”
“Decisions about my local area should be made near my community”
“Decisions about my local area should be considered alongside other areas”
“Local voices should have the strongest influence in decision making”
Views of local government reorganisation
Most say they had heard of LGR prior to taking part in the engagement, with 6 in 10 claiming to be well informed
Awareness of LGR % selecting
Yes, and understand what it involves
Yes, but not sure what it involves
No, not heard about it before
Those living in areas that are most likely to be affected – so where Options 1 and 2 would involve them being part of differing councils, or those living in parishes affected by Option 1a – are most likely to be well informed about local government reorganisation.
These relatively engaged residents express a high level of concern and scepticism about LGR in principle
Generally, there is a high level of concern around Local Government Reorganisation as a whole. Although only 1 in 10 (9%) of respondents in the engagement say they “strongly oppose” all three options included for consideration, many feel forced to pick the “best of a bad bunch” of options.
Residents struggle to understand why a change is needed and have a strong sense that they will ultimately lose out:
Losing the local touch Losing funding Losing services Losing influence
With councils covering a larger area, many are worried that councils will lose their understanding of the local area, and a ‘local touch’. They raise fears around council staff and councillors becoming too generalised as they will be spread too thin.
Funding allocation may change – which for many suggests that less will be spent on their area. There are also concerns about how this will impact council tax, and how debt held by different councils will be spread.
Why go through all this disruption instead of putting the time and resources into improving public services?
Winchester, 55-64
Services being moved away from them, with many raising issues around ease of access. They worry about the way decisions will be made about where services are provided, and that urban areas will always be prioritised over rural locations.
Concern that they will have less power to influence local decision-making – for example, if local meetings happen further away from their homes, or if a local councillor has a lesser understanding of their needs.
Decision-making and funding will be biased towards wherever the bureaucratic centre of the council is (eg - Winchester for Council 2) as that's where most of the council employees will live. The places on the edge of those councils, or far from the bureaucratic centres will be marginalised.
Test Valley, 45-54
Those living in rural areas tend to be more sensitive to the perceived risk LGR poses to local decision-making
Decisions being made near their community is most important for those living in predominantly rural councils:
• 81% of respondents in the New Forest and Hart* strongly agree this is important
• 73% in Test Valley strongly agree
This is less important to those living in urban and city councils:
• 53% of respondents in Southampton strongly agree
• 61% in Winchester and in Havant strongly agree
Because of the suggested shift of my Parish into a large urban area I believe that decisions will be driven by the urban majority view and we will become just another densely built area of a very large conurbation where decisions will not regard the rural aspects of my area with any sense of importance in the whole new Unitary Council area. Simply put I believe bad decisions are more likely if this option [1a] was to be implemented. East Hampshire, 65-74
Those living in rural areas are more likely to express concerns that they will be forgotten about when it comes to decision-making and service delivery. They worry that more populated urban areas and cities will be prioritised, and that larger numbers of voters will take precedence over relatively smaller rural populations.
However, some recognise that LGR may have some positive effects on service delivery and decision-making
Different councils will be able to learn from each other, challenging each other to make better decisions. For some, this as an opportunity to address specific concerns and frustrations they have around the running of their own council. Efficiencies
Larger authorities may help councils deliver efficiencies of scale, by offering similar services to a larger number of people. It also feels like an opportunity to provide better coverage of services, especially for places which are geographically more distant from the majority of their current council.
Avoiding over-fragmenting
communities in different council boundaries, which feel arbitrary to some, and better recognising the way that people travel and use services in the Hampshire area. Some are keen to see this address some issues about particular villages or neighbourhoods they feel have been in the wrong council all along e.g. Chilworth or Denmead.
Centralisation can bring organisational benefits such as purchasing efficiencies, facilities provision and streamlining of decision-making. Portsmouth, 65-74
Would be both cheaper to run and allow better coordination of transport networks, an increase in job opportunities and collaboration on climate change initiatives. Portsmouth, 75-84
Better decision making - affecting larger areas rather than lots of smaller decisions. Winchester, 25-34
Residents were asked specifically about 3 potential options…
Council 1 (Pink): Basingstoke, Hart, Rushmoor
Council 2 (Green): New Forest, Test Valley, Winchester, East Hampshire
Council 3 (Yellow): Eastleigh, Southampton
Council 4 (Blue): Portsmouth, Havant, Gosport, Fareham
Council 5 (Grey): Isle of Wight
Council 1 (Pink): Basingstoke, Hart, Rushmoor
Council 2 (Green): Test Valley, Winchester, East Hampshire
Council 3 (Yellow): New Forest, Eastleigh, Southampton
Council 4 (Blue): Portsmouth, Havant, Gosport, Fareham
Council 5 (Grey): Isle of Wight
Potential boundary changes, affecting wards highlighted (Orange) in the New Forest, Test Valley, Winchester and East Hampshire
Option 1 is most popular, while Option 1a is considered highly controversial, especially by those in affected parishes
Residents who feel they have more at stake tend to have a stronger preference for an option, but they do not always agree
While Option 1a is almost universally disliked, residents are more split on Options 1 and 2. Most significantly, Test Valley and New Forest have a clear preference for Option 1, while East Hampshire and Winchester lean towards Option 2.
Support for each of the options % selecting “strongly support” or “support”
Basingstoke
Option
1 is seen as making the most sense politically, socially and demographically, though not geographically
This option is strongly preferred by residents in New Forest and Test Valley, who feel most threatened by the proposal to merge New Forest and Southampton.
Support for Option 1
% selecting “strongly support” or “support”
Basingstoke
Residents like that
Option 1 groups
councils that feel similar, but worry about creating overly
large councils
Residents feel there are positives around… But drawbacks around…
• Grouping similar councils, with similar characteristics, who will have experience providing services for similar types of areas.
• Grouping people around cities.
• Preserving the rural identities and focus for areas like the New Forest and Test Valley.
• Keeping urban centres like Southampton and Eastleigh together.
• Leads to councils which feel smaller in terms of population size.
• The large geographic area for council 2, potentially diluting council services, funding and powers.
• Grouping together councils because they are rural, ignoring their identified and differences – with particular concerns around the uniqueness of the New Forest.
• Concern that the new councils are being split between ‘rich’ and ‘poor’ areas.
What council plans would need to address: Residents struggle to picture how a local authority would work in practice across such a large geographical area – council plans would need to show how the needs of different neighbourhoods would be met, and how services will be delivered and spread across a wider geographical area.
Winchester
and
East Hants
are most in support of Option 2, while those most affected, the New Forest, are least supportive
Those supporting Option 2 mostly consider Option 1 too large a geographical area to administer effectively. Across the county, there is also a sense of “solidarity” with the New Forest, which many feel should not be merged with Southampton.
Support for Option 2
% selecting
Basingstoke
Residents
express strong
concerns about linking urban and rural
areas together, but recognise that it makes
geographic sense
Residents feel there are positives around…
• The geographic logic of linking the New Forest with Southampton and Eastleigh, as many are already accessing services there.
• Avoiding creating one very large council.
• Provides balance between rural and urban areas, and may even out population across the five proposed councils.
But drawbacks around…
• Merging areas that are very different to each other, with concerns that either rural or urban areas will be left behind.
• The potential risk of urban areas being prioritised over rural areas, and the way funding will be allocated. Those in rural areas also worry that urban centres will want to develop and urbanise them.
• Concerns around services being centralised in urban areas.
• Concerns around financial strain.
What council plans would need to address: Residents need more reassurance that any model combining historically rural areas with cities will still be able to cater to their needs, and that provision of services will account for differing needs in different areas. They particularly want to know whether services will all be centralised into urban hubs, or whether provision will be spread across the larger unitary authorities.
This looks like it makes more sense for the New Forest.
Closer to those making the decisions. No one in Winchester should be decision making for the New Forest.
Rushmoor, 35-44
Southampton's priorities will absolutely swallow up all the time, energy, focus (and money!) from all our rural areas in the New Forest. We all know local councils are horribly underfunded - there will be "needs of the many outweigh the needs of the few" decisions and we will lose out I'm afraid.
New Forest, 55-64
Support for Option 1a is low overall, and lowest in New Forest and Test Valley, where residents are most concerned about boundary changes
Option 1a is slightly more popular in areas that stand to gain from the inclusion of new parishes (i.e. Southampton, Havant and Fareham), but very unpopular in areas that are directly affected such as the New Forest and Test Valley. Respondents in Winchester and East Hampshire, who would also be affected, do not feel as strongly and can see some benefits.
Support for Option 1a % selecting
Basingstoke and Deane
Residents
are concerned
about boundary changes fragmenting
communities and are unsure what it will mean for
services
Residents feel there are positives around… But drawbacks around…
• Aligning more urban areas with Southampton/Portsmouth, which may mean better service delivery for those areas.
• Better reflecting reality for those who live in those areas, and linking them to where they access services.
• Those living in semi-urban areas being served by a council that better reflects their needs.
• Disruption to those living in the affected areas.
• Fragmenting existing communities. Particularly when it comes to separating the New Forest from the Waterside, which is seen as integral to the identity of the area.
• Residents in affected areas losing local representation and influence in decision-making.
What council plans would need to address: Residents want more information about what the changes will entail – they are looking for more certainty about how the boundaries will change, and how this will impact the services they receive from the council, but also from other providers (schools, GPs). There is also a need for more clarity around affected areas joining a larger council, as some respondent assumed they would remain as a small council area rather than joining a larger unitary authority.
Might be better grouping semiurban dormitary areas with the conurbations they serve. Some (not all) are effectively part of the conurbations now and look towards them for services rather to further away more smaller towns/cities.
Test Valley, not affected, 65-74
I live in the parish of Fawley and strongly dislike splitting the New Forest area - many New Forest commoners live in this area and have a very strong attachment to the New Forest. My own family have been commoners for over 300 years. People who live in the Waterside parishes regard it as part of the New Forest (historically ponies/cattle also roamed in these areas).
New Forest, affected, 45-54
Respondents from potentially affected parishes are most opposed to boundary changes, driven primarily by those in New Forest and Test Valley
Option 1a is more strongly opposed in New Forest and Test Valley than Winchester and East Hampshire:
• Among those respondents whose parishes may be affected in the New Forest, three quarters (75%) strongly oppose Option 1a, rising to 81% among respondents from potentially affected Test Valley parishes.
• In Winchester, meanwhile, just over half (54%) strongly oppose this proposal, and in East Hampshire it is even fewer respondents (46 of 90 potentially affected respondents - 51%).