
19 minute read
Field Journal: Bolivia.


Advertisement
Analyzing and acting on extreme wildfires in Chaco (Bolivia) and Cerrado (Paraguay) ecosystems.
HOW A KNOWLEDGE NETWORK EVOLVED INTO A VIRTUAL INTERNATIONAL TEAM TO SUPPORT OPERATIONS IN THE FIELD.
By a seven-nation team that included … Marc Castellnou, L. Alfaro, M. Miralles, D. Montoya, B. Ruiz, T. Artes, L. Besold, J. Brull, F. Ramirez, M.A. Botella, F. Martins, M. Bachsficher, J. Vendrell, M. A. Botella and S. Purdy.

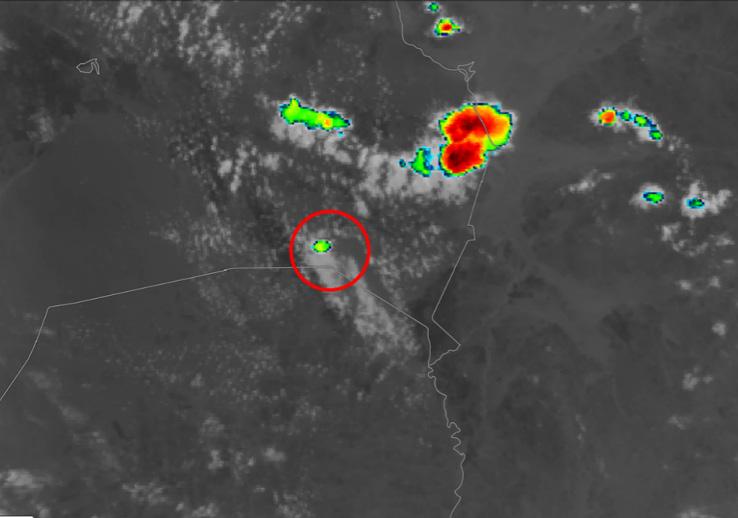
Fig. 1. Fires burning across the South American continenton the afternoon ofAugust8, 2019 (RAMMB /CIRA@CSU)
AUGUST 20, 2019: FIRES IN EL CHACO OBSERVED BY SATELLITE IN THE DRY JUNGLE, A “NORMAL” DRY YEAR sees larger fires. In the middle of August 2019, the news of the fires in the Amazonia, and especially of the fires in Bolivia, caught our attention. There was much discussion about how important they were and how normal the situation was compared with previous years. The analysis of the area’s fire regime clearly shows conflicts linked to socioeconomic dynamics, where deforestation and land use clashes with the interest in preserving vast ecosystems, especially the rainforest.
The Chaco or Cerrado, a dry jungle, has much more historical fire presence than rainforest and GWIS data quickly confirmed this vision. Without entering into a deeper analysis of causality and the socioeconomic phenomenon that pushes it, we understood that we are facing the normal burn season or “chaqueo.” This year, 2019, without being a dry year, has similar numbers as the average when looking at ignition points, but the surface affected is being much higher. Although it is the annual anthropic fire regime, the higher average temperature is creating more intense fires and therefore the size increases as it is more difficult to limit them or that they become extinct during cooler nights. The clear shot of Sentinel 2, with several pyrocumulus (PyroCu), over Chiquitania (Bolivia) on August 18 attracted our attention for extreme events, as well as that of several pyrocumulonimbus (PyroCb) monitoring groups in different social media. (PyroCu: “A cumulus cloud formed by a rising thermal from a fire,” may transition to a PycoCb: “An extreme manifestation of a pyrocumulus cloud, generated by the heat of a wildfire, that often rises to the upper troposphere or lower stratosphere.“ See http:// glossary.ametsoc.org/wiki/Pyrocumulus and http://glossary. ametsoc.org/wiki/Pyrocumulonimbus for definitions.) After the event of Argentina in 2018, this was the second PyroCb seen in modern times in South America, although within the group we consider it is the third, with “Las Maquinas” in Chile (2017) as a PyroCb night phenomenon. We were setting up an observation/ learning agenda for these 2019 fires. We needed to learn more to understand these pyro-atmospheric events in South America.
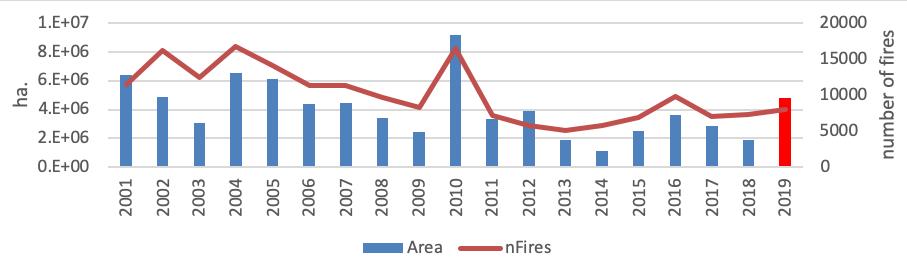
Fig 2. Burned area and number offiresin Bolivia annuallyfrom 2001 to 2018. Initially, 2019 doesnotyetstand outbutmarks a change in the trend -- and with the long season ahead it threatensto looklike 2010 (by GWIS, 1stSeptember2019).
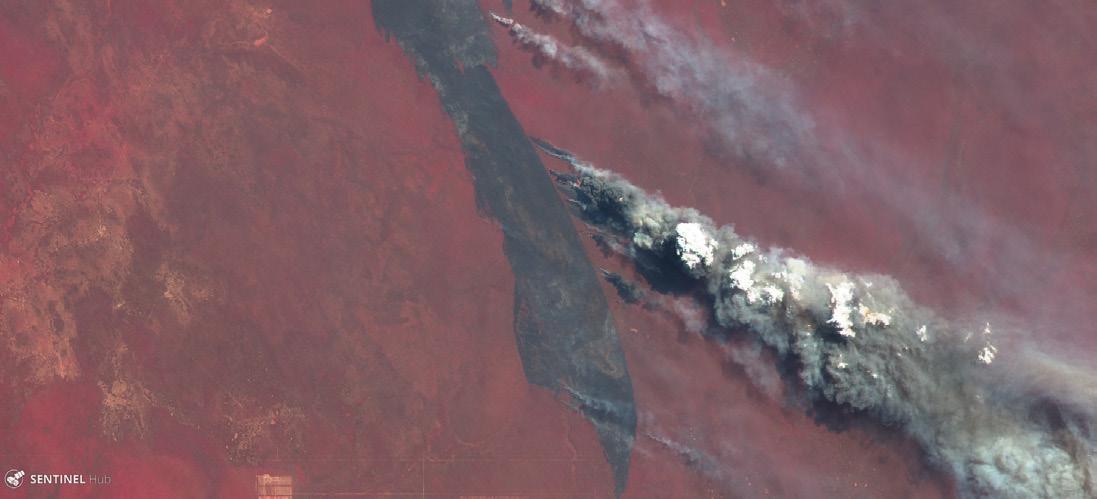
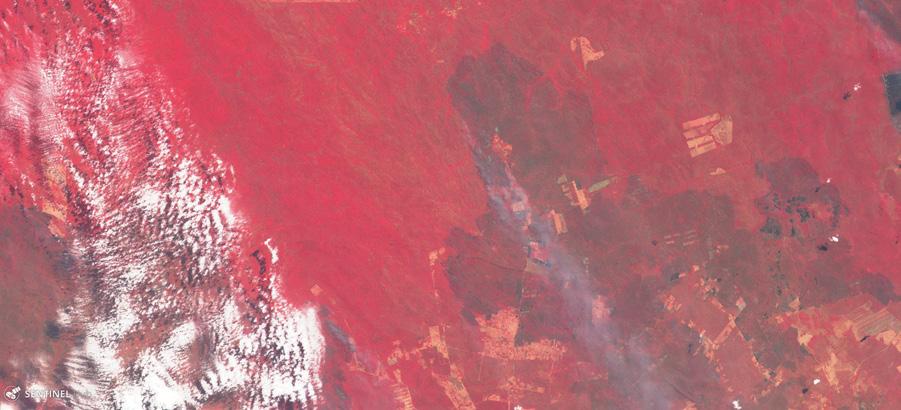
Fig 3. Sentinel 2 image overRoboré Fires on August18, 2019 (Sentinel Playground).

Fig 5a, 5b. Fire in Concepción, lowintensity, burning understory(top). Fire in Roboré, high intensityand severity. (Sentinel Playground, 09/07/2019).
AUGUST 28, 2019: STARTING THE LEARNING PROCESS Webinar link: http://bit.ly/2kDMHd7. After the assessment of what happened on August 18 and 25, a webinar was convened for the fire service in Catalonia, with the participation of some other European areas, in order to explain and clarify, beyond the media noise, what was going on with the big fires in the Chaco area and what we were looking at. The webinar was shared online through Pau Costa Foundation network and served to focus the issue, reduce social alarm and give criteria to the European fire brigades. But especially it served to frame the ability to understand the pyroconvective processes ongoing in Bolivia, testing the skills learned after confronting the episodes of Chile and Portugal in 2017. This is what worried and moved us into this project: to test our skills and go deeper in our understanding.
Beyond the voices of “crisis” from Europe or, on the contrary, data from many observatories demonstrating that we were on a “normal” or “slightly accelerated” trajectory, what was found is that the PyroCb convective capacity of these fires was new in the area (they had not been detected since we have satellite data on the area). Indeed, the huge perimeters created by these firestorms, with a whole dry season ahead, would be ready to repeat the pyroconvective process as soon conditions will allow it.
News coming from the area told us that they were still not aware of these processes taking place. Thus, we moved ahead to get in contact with teams on the ground.
AUGUST 25, 2019: SHAPING A TEAM AND IDENTIFYING TOOLS • Tool for risk, statistics and hotspots https://gwis.jrc.ec.europa.eu/ • Tool for using GOES 16 images https://rammb-slider.cira.colostate. edu/ • Tools to work with GFS model and soundings https://www.tropicaltidbits.com • Tools for Sentinel 2 images https://www.sentinel-hub.com/explore/ sentinel-playground The alarm was flashing red again. It was the second PyroCb in the same area. There was a lot of noise on the subject in social media, since we had gone from seeing two PyroCb in 10 years in South America to seeing two more in a single week. We were in contact with Argentina where Luis Besold shared the reality of the year in the area. Quickly from Chile, Europe and the USA a virtual working community was established to follow and evaluate the situation, with an initial objective of validating knowledge and learning through the observation of the phenomenon. Informal team members who worked the 60 days the fires were active. Member Country Institution Role Action / Eyes on the ground Main source Luisa Alfaro Dany Montoya USA OFDA In the field, real fire monitoring, satellite observations validation and forecasts. Fly daily to validate observation and heights of smoke plumes. Transform forecasts into action in the field. Support Luis Besold, Argentina UN Team in Bolivia Share reality of the area through Argentine teams and join UN team in Bolivia. Eyes in satellite and forecast models Analysis and report Marc Castellnou, Marta Miralles, Borja Ruiz Spain GRAF BombersCAT Reports writing. In contact with UN, EUCP and OFDA team Analysis of PyroCu and PyroCb in the area using GOES 16 compared to GFS skew-t and GWIS index. Information analysis Jordi Brull Jorge Saavedra Fernando Ramirez Chile CONAF Source of observation data. Collaborate in assessing the potential of PyroCu and PyroCb Tomas Artés Italy JRC EU Management of the data in the GWIS database. Development of the experimental index of fire convectivity Scott Purdy USA SJSU Fire Lab Source of meteorological observation data. Share the assessment of PyroCu and PyroCb phenomena Support info Camille StevensRumann USA CSU Aridity data analysis in the area Mercedes Bachfscher Argentina Work on fire severity mapping in GIS with Sentinel2 data Miguel A. Botella Spain UT 602 Generalitat Valenciana Share assessment of PyroCu and PyroCb phenomena Jordi Vendrell Spain Pau Costa Foundation Network host supporting the team
Fig 7 (left).Analysis ofthe situation on August25, 2019 (tropicaltidbits and RAMMB /CIRA@CSU)

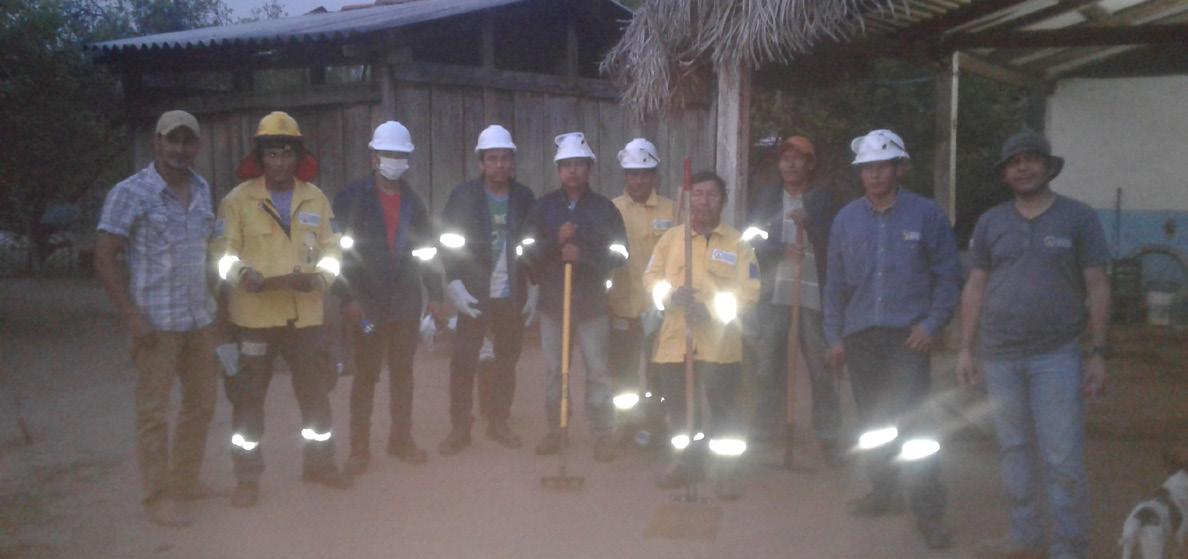
Fig 8a.. Images ofprofessionals and volunteers working the fires during the firstdays ofSeptember in the Roboré area (Alfaro, L. OFDA-USAID).


Fig 9.Analysis ofpotential transition from PyroCu to PyroCb on September 7, 2019. On September6 itwas possible, butitwas on the 7th when it was mostlikely. Figures extracted from the reports. (tropicaltidbits)
SEPTEMBER 3, 2019: GETTING INTO AN ASSESSMENT PROCESS At that moment different teams were being deployed to meet the demand for international help. UN and EUCP were the closest ones, all of them with known people. All of them demanded increased situational awareness and intelligence of the fires and advice on the convective phenomena. According to those needs we intended to start making forecasts, using the tools available, to inform teams deployed about extreme fire behavior in case events like those of 08/18 or 08/25 could be repeated.
In this process of informing Luis Besold (already with the UN team in the field) and preparing support for EUCP teams, we contacted Luisa Alfaro and Joaquin Montoya of the OFDA, also deployed in the site. This allowed us to receive good feedback from the field, of what was really happening, so our forecast could be confronted with reality and adjusted. They become our eyes on the ground to validate forecasts and observations of convective processes; meanwhile we became their eyes on the models and the satellite monitoring of the events. Being on a fireline makes it difficult to specify column height and observe the “overshootings” of the PyroCb. Nevertheless, satellite evaluation without field observation makes understanding the real phenomenon difficult. Joining efforts creates a win-win situation between two teams, with both needing to monitor, learn and predict the processes on an operational scale, beyond the scientific study. The information we were providing was initially under discussion due to the believe that this PyroCb type event was not happening there. To locals it seemed the situation was just a combination of several number of ignitions and hot weather. They insisted that fires were “normal,” and Bolivia had a long history of extensive fires in campaigns such as 1999 or 2010, with 3 million of hectares burned and PyroCu phenomena observed. Deployed teams did not yet believe the fire storm would happen again and doubted if it really was the driving force changing the intensity of the fire.
SEPTEMBER 4, 2019: 1ST REPORT FOR POSSIBLE SEVERE EVENT AND PYROCB LIKELY First situation forecast reports were issued on September 3-4 for September 6-7. The situation of dry north wind and high temperatures was repeated, like on August 17 and 18. The sounding showed, among other data, high instability on the surface as well as inversion over condensation level. It was a clear situation that allows PyroCu processes to happen abnd we warned that on September 7 a more-than-probable PyroCb would again occur.
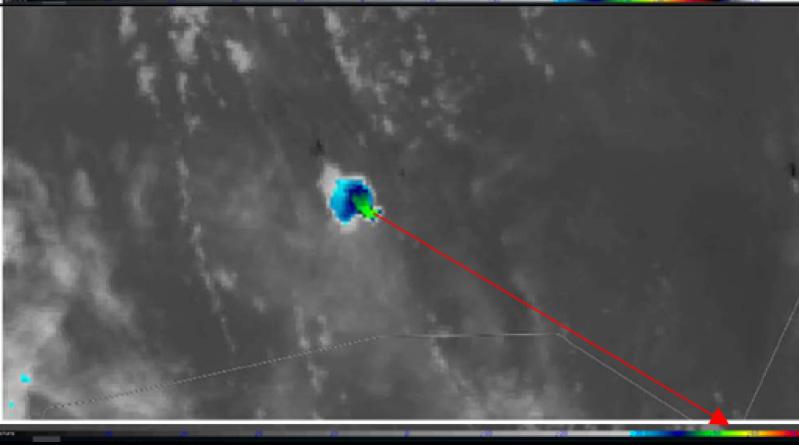
Fig 10. PyroCb on September7, 2019 -- bigger and more powerful (RAMMB /CIRA@CSU).
SEPTEMBER 7, 2019: TRUST ESTABLISHED; WE WERE DEEP INTO OPERATIONS! The PyroCb was big and intense. We were all in shock; it was predicted, but it was happening in front of us and we could monitor it step by step. Fire fronts were delivering a sustained rate of spread (ROS) of 7 Km/h under the third PyroCb of the month, much more powerful than that of August 18. It was a giant PyroCb without extra moisture, but strong winds and in the top it’s temperature drops to -53 Celsius according to the Goes16 image. Suddenly a team that monitored and reported from far away the situation, based on models and satellite data, was integrated with and vital for those who actually were in the field and needed analysis to understand what was happening, how it was happening and what to expect. We became a team with a difficult reality since some of us were looking at what could happen to inform those who were really going to live what would happen, but without being able to observe it in its entirety. However, it was also a special moment, being 9000 km far from the fire and feeling a part of the operational effort. They had overcome the reluctance to claim this was more than a fire campaign as usual and it was understood that we were in a campaign where climate change was altering the type of fires through firestorms or PyroCb. Then a clear explanation of what was going on was shared with locals and officials, and a work methodology was established to keep monitoring from the distance adjusted to real events. We mixed real observation, with satellite observation and with model forecast interpretation.

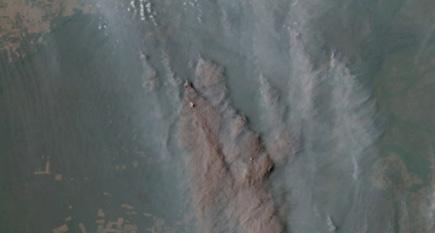
Fig 11a, 11b. (middle)Fire fronts with high instabilityand the beginning ofthe PyroCb growth on September7 (Alfaro, L. OFDA-USAID).
A new report on September 7 confirmed the window of operations for the next days. Due to the situation, firefighting could move a step ahead and heavy machinery, technical fire use teams, ICS implementation and international assistance was ordered. The main decision was to move ahead from direct attack and plan tactics with a 2-3 day time frame. The ability to forecast and the inability to follow the fire directly was accepted. It was too extensive and intense a fire – not a classical fire any more, burning slowly as it extended into the forest in the Chaco. Now we faced a fire with hundreds of kilometer-wide fronts that had already gone through three PyroCb events creating extreme behavior. Only long-term planning and work would be effective in minimizing the effects of a fire that could only be extinguished with the rainy season. Being able to show what was going on and show credibility allowed teams to move on and into long-term ICS planning.


Fig 12A. Planning meeting underthe ICS structure in Roboré. (Alfaro, L. OFDA-USAID).
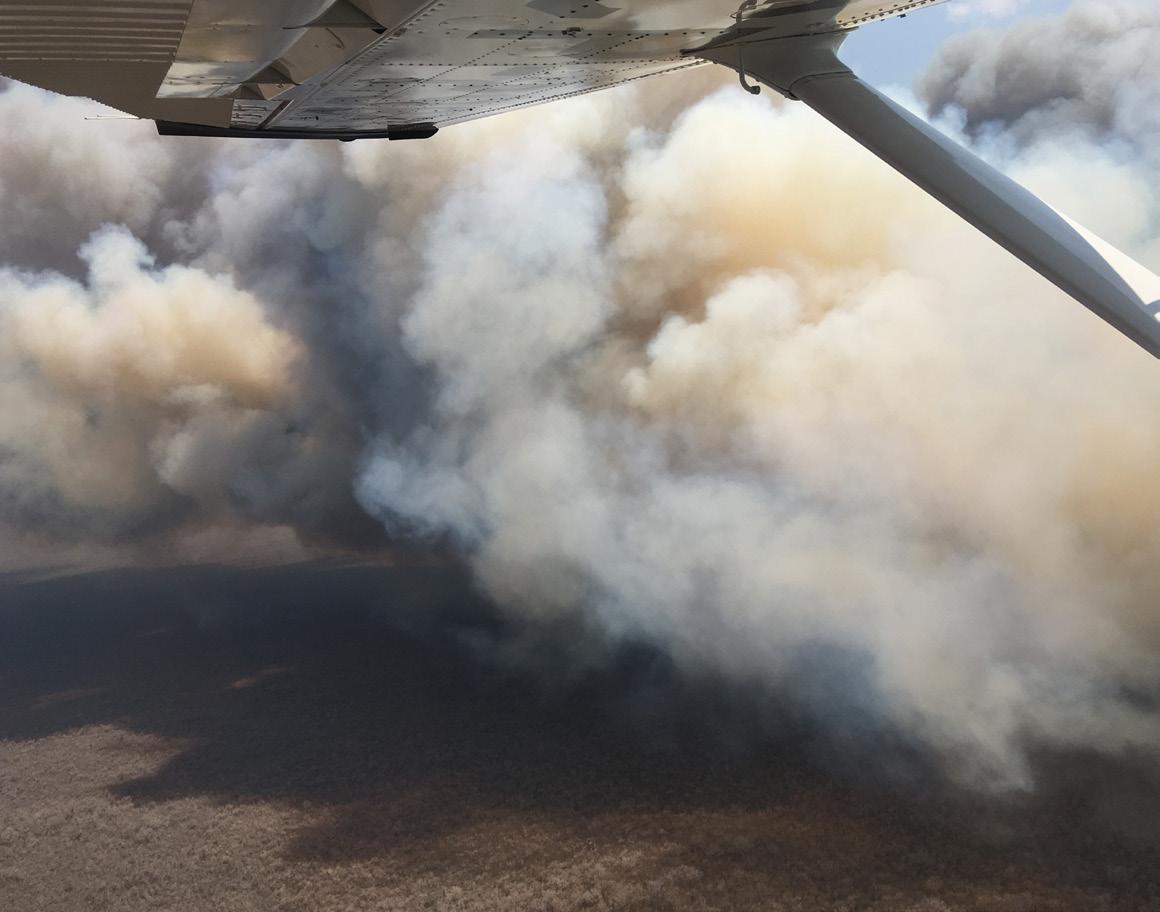
SEPT. 10, 2019: PYROCU TRACKING DYNAMICS A workflow (Fig 13 above) was established to mark in advance the possibility of extreme phenomena and allowed teams to plan in the long term, working with tactics and large-scale maneuvers in advance. At the same time a routine of validation and adjustment of forecasts was established to maintain the observed reality as an element of adjustment of the entire forecasting process (Fig. 13). This routine was based on observing the satellite for validity of column heights and fire extension, while that information was certified with observation flights of the columns, thus adjusting the validity of the forecast and satellite information. Real-time field observation added robustness to the process.
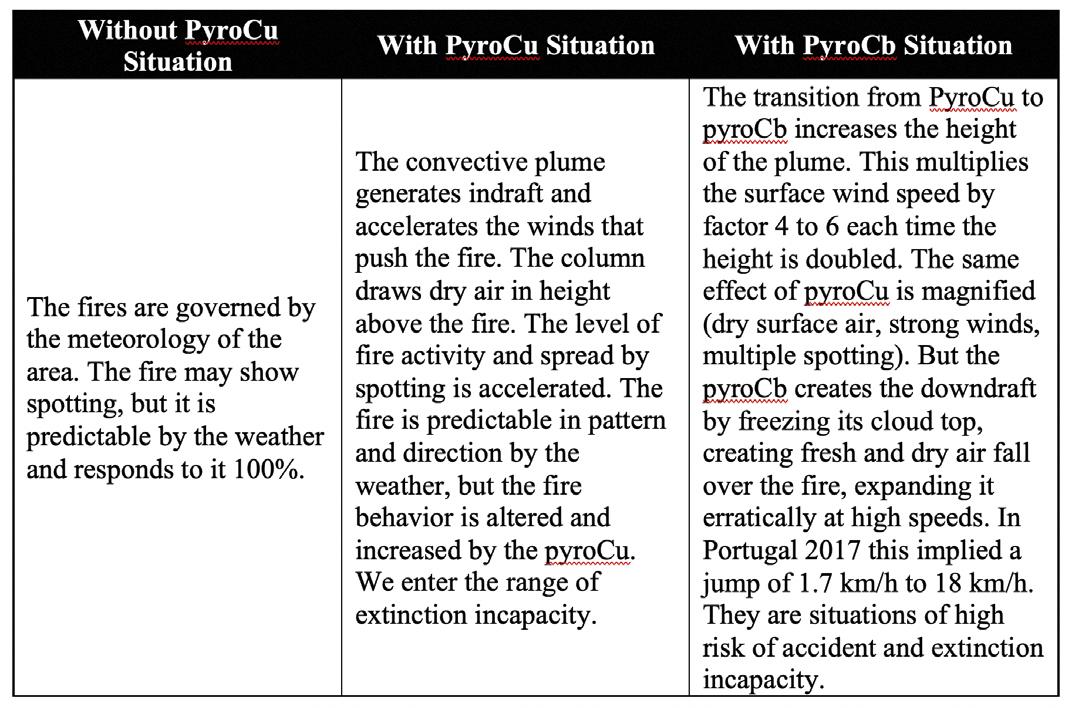
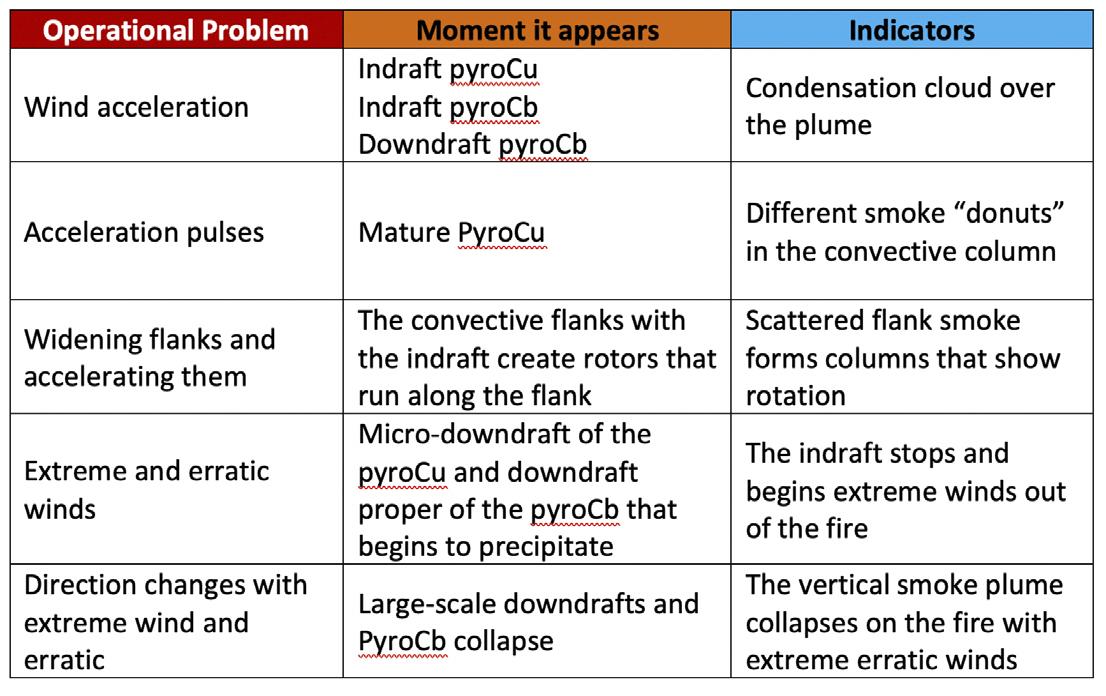
There was a need to translate this information about PyroCu and PyroCb processes to operational decisions. We worked on differentiating the days based on extreme typology of convective process (Fig 14) and the series of indicators that allowed us to understand what each of these three situations meant (Fig 15). It was a simple scheme but more than enough for a process of monitoring and strategic advice. It was about translating complex processes to verifiable information of reality, making it available in order to guarantee operational decisions for teams in truly remote places and without the ability to relay in their observation and monitoring efforts. They had to feel a measure of the pyroconvective forces and the resulting efforts that would be needed. Operational implications ofthe types ofconnectivity.

SEPT. 12, 2019: NEW REPORT, GOOD WINDOW TO WORK There was a good weather window to work on September 12 and ahead. The tactical opportunity was identified out until September 15-16, when a dry north wind would bring back extreme conditions. A comprehensive follow-up of the evolution of the previous days began and we recommended investing efforts to contain the current queue fronts, since those were the ones that would become head fronts later, especially heading to Paraguay. Fig. 16a, 16b. PyroCu on the extensive fronts approaching the borderofParaguayon September16 and the same momentobserved bythe GOES 16 satellite (source Alfaro, L. OFDA-USAID and RAMMB /CIRA@CSU).

Operational problems from growth ofPyroCu to PyroCb, linked with indicators.
SEPT. 16-19, 2019: WINDOW CLOSING, ONLY MORNING AND NIGHT WORK, PYROCU AND ROTORS As forecast, the different fires re-created extreme behavior. The growth of the predicted PyroCb stopped halfway to the top due to wind shear. Even so, these were days of extreme fire activity moving south, and extreme tension. From a distance we were glued to the satellite image by monitoring the Cloud top and the Tª of the cloud, as well as the actual surveys and their updates. It was recommended to remove people from the fire zone, as fire behavior was erratic with important observable downdraft. The fire was maintained with unstable behavior, with PyroCu and gusty winds due to the mixing (entrainment) of the PyroCu with extremely dry air with a large DCAPE. September 16 and 19 were the worst days, with a break in between. It was still only possible to flank the fire.
SEPTEMBER 22-24, 2019: AFTER A TWO-DAY BREAK, A NEW RED ALERT After two days break, situation was becoming conditionally unstable and therefore with potential to repeat the jump from PyroCu to PyroCb that had not occurred since September 7. From September 22-24, a trend appeared for more and more PyroCb likely atmospheres (Fig 17). The surface layer was highly unstable, allowing rotors on the flanks, and the condensation height had the necessary humidity. To this we must add that the inversion above condensation level was diminishing every day. September 23 was an intense day but the dispersion by high-level again inhibited the jump to PyroCb, like it did on the 16th. The evolution was followed closely, and it was recommended to stop operations in those late hours. At night, stability set up until the following noon, which made the work safe, but not between 1400 to 2200. The units were already building large lines with bulldozers to compartmentalize the entrance to Paraguay and to widen the flanks.
Fig 18. Summaryofthe evolution ofcommented factors forthe possibilityoftransition to PyroCu and PyroCb. Everydaywe have worsened, although the initial forecastwas that22th would be the worstday. Reports were issued on the 19th, 22nd, 23rd and 24th, adjusting the forecast.
Fig 19. Latentfire perimeters from September 7-8 supported fire growth bysunsetin the borderarea ofBolivia and Paraguay.The wind tookthe column and turned itas itrose, leading to firewwith superficial instabilityand extreme behavior.The PyroCu formed veryfarfrom the flames and fires with superficial instabilityand extreme behavior(Alfaro, L. OFDA-USAID).
SEPTEMBER 24, 2019: FOURTH PYROCB … OVERSHOOTING WITH THE HUMIDITY, LIKE AUGUST 25 Finally, on September 24, a mid-afternoon process was observed again. A new PyroCb “boiled” and popped-up. We observed it simultaneously from Italy, USA and Spain in real time. As on August 25, the increase of humidity triggered the transition from PyroCu to PyroCb. There was no one on the ground and the rain that came after gave everyone a rest -- the ones operating on the field and those who, from the distance, followed the events and tried to predict.
Fig 20. Satellite image ofthe PyroCb growth process of24th.This reading confirmed the cloud Tª and the height, which coincide with the forecast ofthe skew-t(source RAMMB /CIRA@CSU).
DAY EXPECTED SITUATION SEPT 21 Surface instability Several layers stability, more powerful above condensation level Air in height very dry but above entrainment with PyroCu
SEPT 22
SEPT 23
SEPT 24
Surface instability Multiple layers inversion Inversionlayer above weaker, but significant condensation Dry air at height very available for entrainment with PyroCu Less moisture in the middle and surface layers
Surface instability Multiple weaker inversionlayers Inversionlayer above weaker, but significant condensation Dry air at height very available for entrainment with PyroCu More moisture in middle layers Surface instability There are no multiple inversion, only neutral moments Inversionlayer above weaker, almost insignificant condensation More moisture in middle layers
SEPTEMBER 25-28, 2019: RAIN, A BREAK AND BACK TO PYROCU The rains had served to give a rest of two days. But the heat continued, and the north wind returns. The fires once again overcome the extinction capacity and we prepare for the episode from September 29 through October 2. Looked like it could be the last. A new report was issued on the 28th.
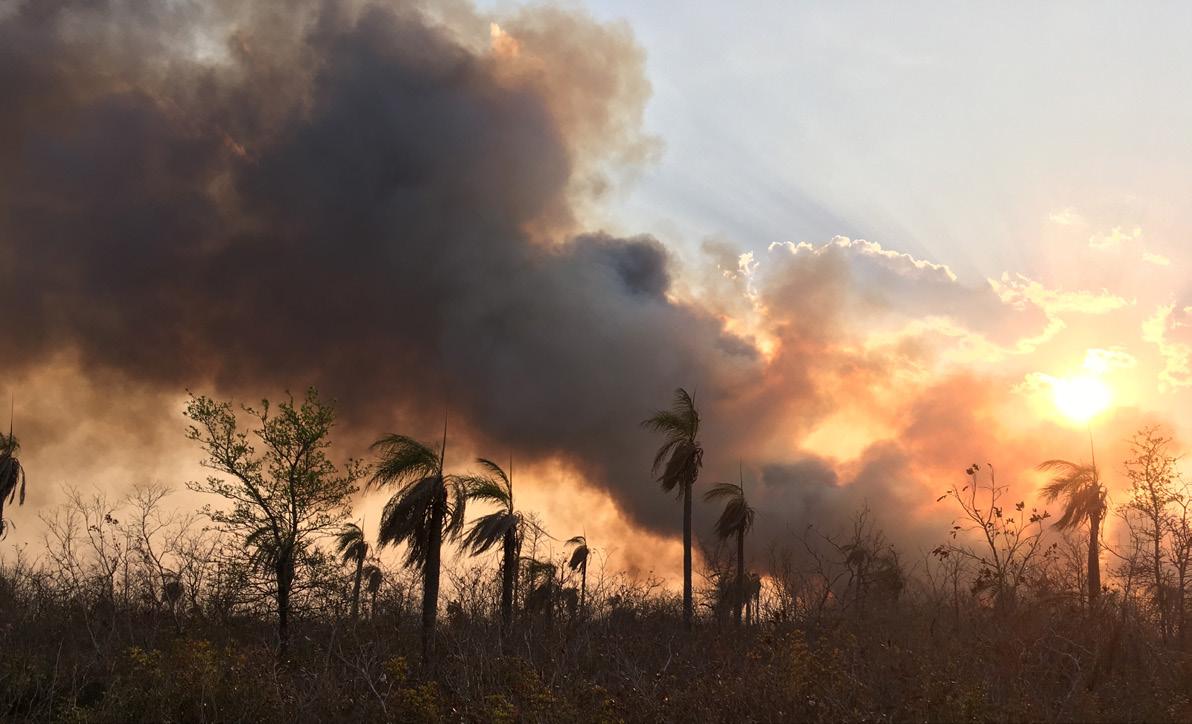
Fig 21.Afterthe rain episode ofSeptember25, there was little activity, buton September28 the fires burntacross the landscape again with intensityand raised columns that reached the level ofcondensation (Alfaro, L. OFDA-USAID).
SEPTEMBER 29, 2019: WHAT WE LEARNED AND FUTURE CHALLENGES

Marc Castellnou, Marta Miralles and Borja Ruizare with Bombersde la Generalitat de Catalunya, Spain, FASTFire analysisModule EUCP. mcastellnou@gencat.cat. Miguel A. Botella iswith UT-602, GeneralitatValenciana, Spain. FASTFire analysisModule EUCP. Jordi Vendrell is with Pau Costa Foundation (the platform thatsupported the team). Mercedes Bachsficher,Argentina, working with Sentinel hub. Luisa Alfaro and Dany Montoya are with OFDA-USAID, USA. lalfaro@ofda.gov. Tomas Artesiswith GWIS, CopernicusJRCEU, Italy. tomas.artes-vivancos@ec.europa.eu. Luis Besold iswith the UN Team in Bolivia. luisbesold@yahoo.com.ar. Jordi Brull and Fernando Ramirez are with CONAF, Chile. fernando.ramirez@conaf.cl. Fabio Martinsiswith UnidadesGAUF, PC., Portugal. fabio.silva@prociv.pt. Scott Purdy is with Fire Lab, San José University, USA. scott.purdy@sjsu.edu. Fig 22. Final perimeterofthe fire on September25, 2019. Mercedes Bachsfischer, Sentinel hub. The reality of the fires in the Chaco ecosystem has changed. We have seen a month of extreme intensities and extreme behavior not seen before in the area, which have been repeated up to five times. This reality, in a non-dry year, is attributed to the constantly higher temperature, dry periods and climate change. In the following months, we will have to understand what it means for these ecosystems and for the protection of the Chiquitania forests. The tools to face this change are based on knowledge, and it is necessary to put knowledge in all the units that face the fires, because these fires have arrived as the new normal. The useful tools we use for remote detection and observation of fire events and burned surface calculation, such as EFFIS or GFMC, are still good to maintain monitoring activity but are at a superficial level for these new events. We have to evolve tools that allow a network analysis, to build a “global brain” that will help us assess and guide operational planning in the immediate and long-term time frames. We have learned that willingly coordinated and verified monitoring -- eyes in the field and eyes in the data -- allows robust advice to those in the field making decisions while catalyzing accelerated learning for everybody. The tools and the teams available today allow us to make the leap to this global collective brain – where “the more we feed it, the more it brings back to all.”
