

As we enter 2026, the year-end data across our markets reflects a clear shift toward balance without a loss of value. Inventory improved across nearly every region we track, easing pressure that had built up over several years of constrained supply. Pricing remained resilient, but the market increasingly rewarded accuracy. Homes that were positioned correctly continued to sell, while those that were not faced longer timelines and greater negotiation.
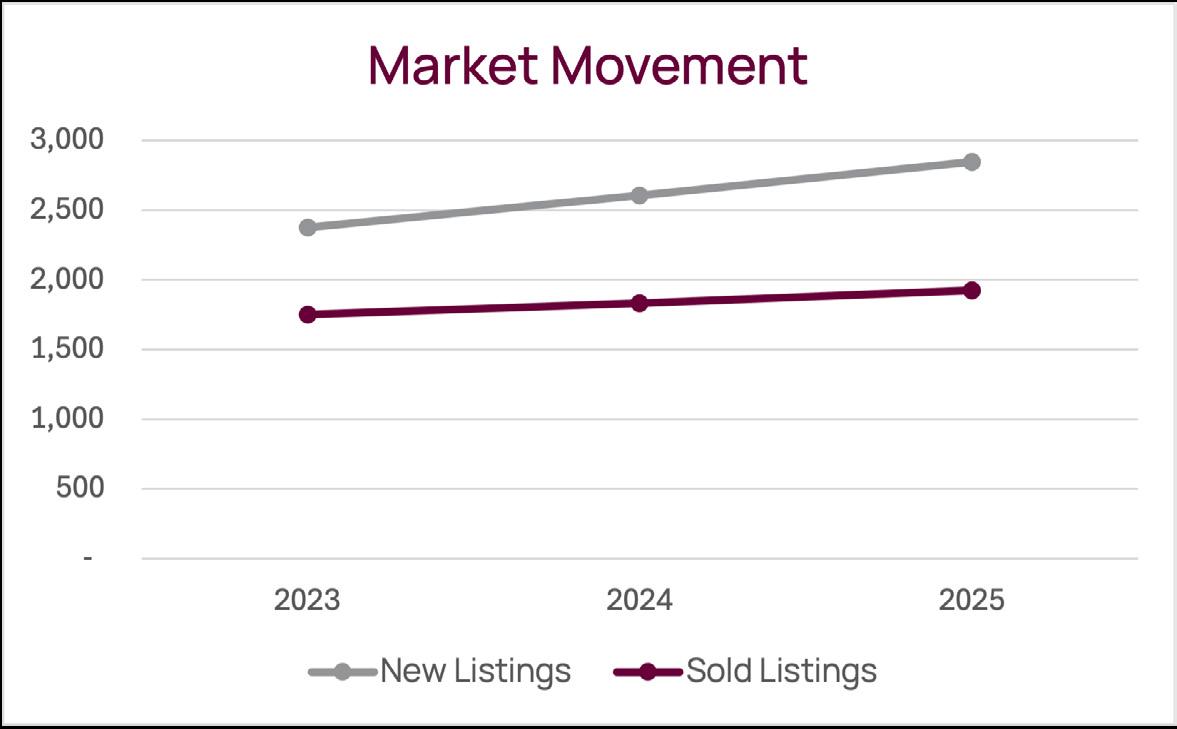
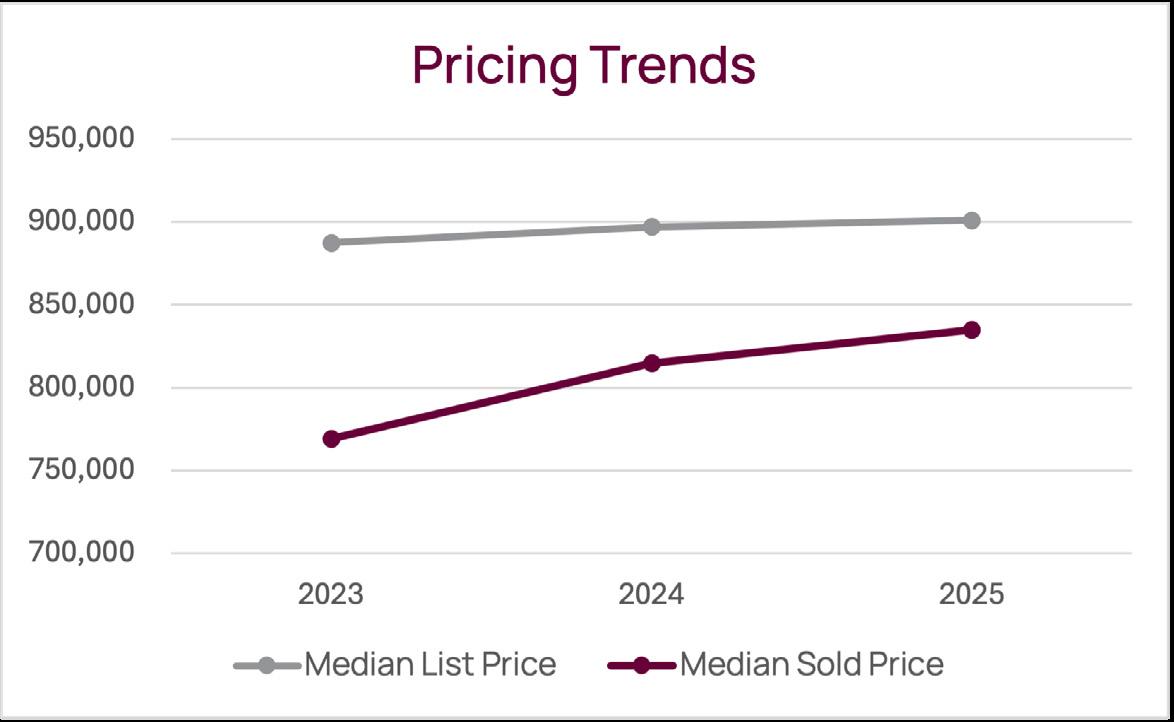
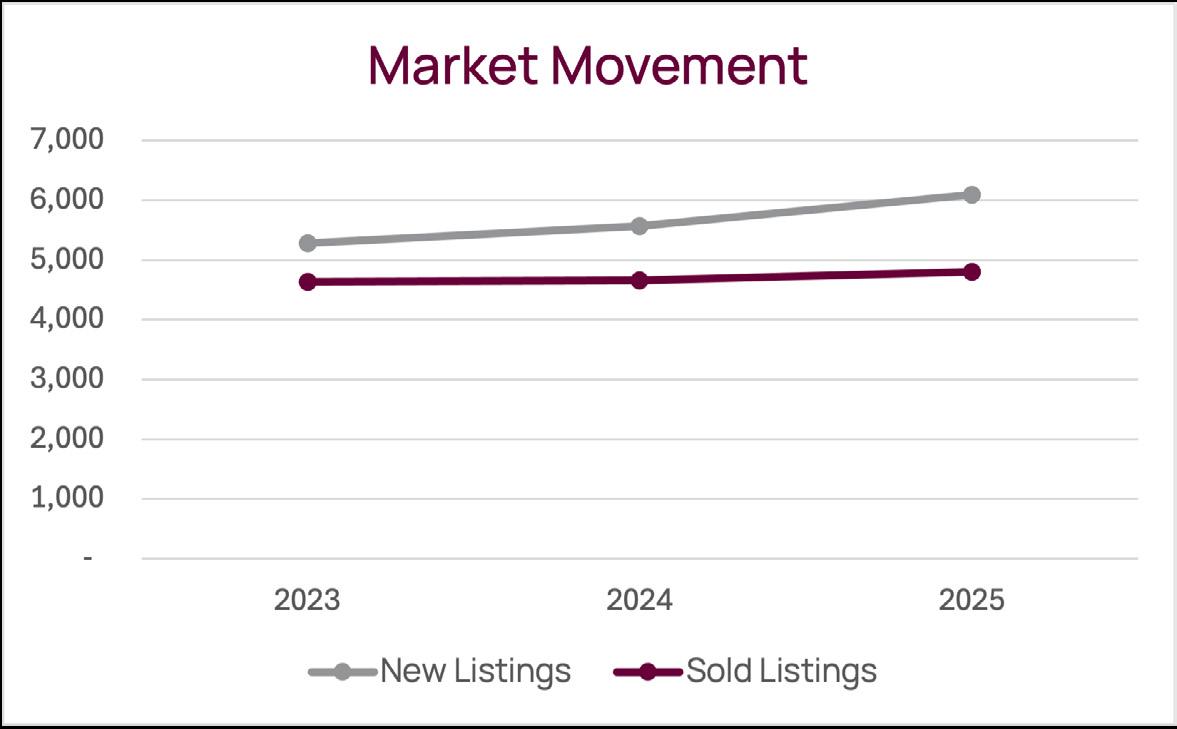
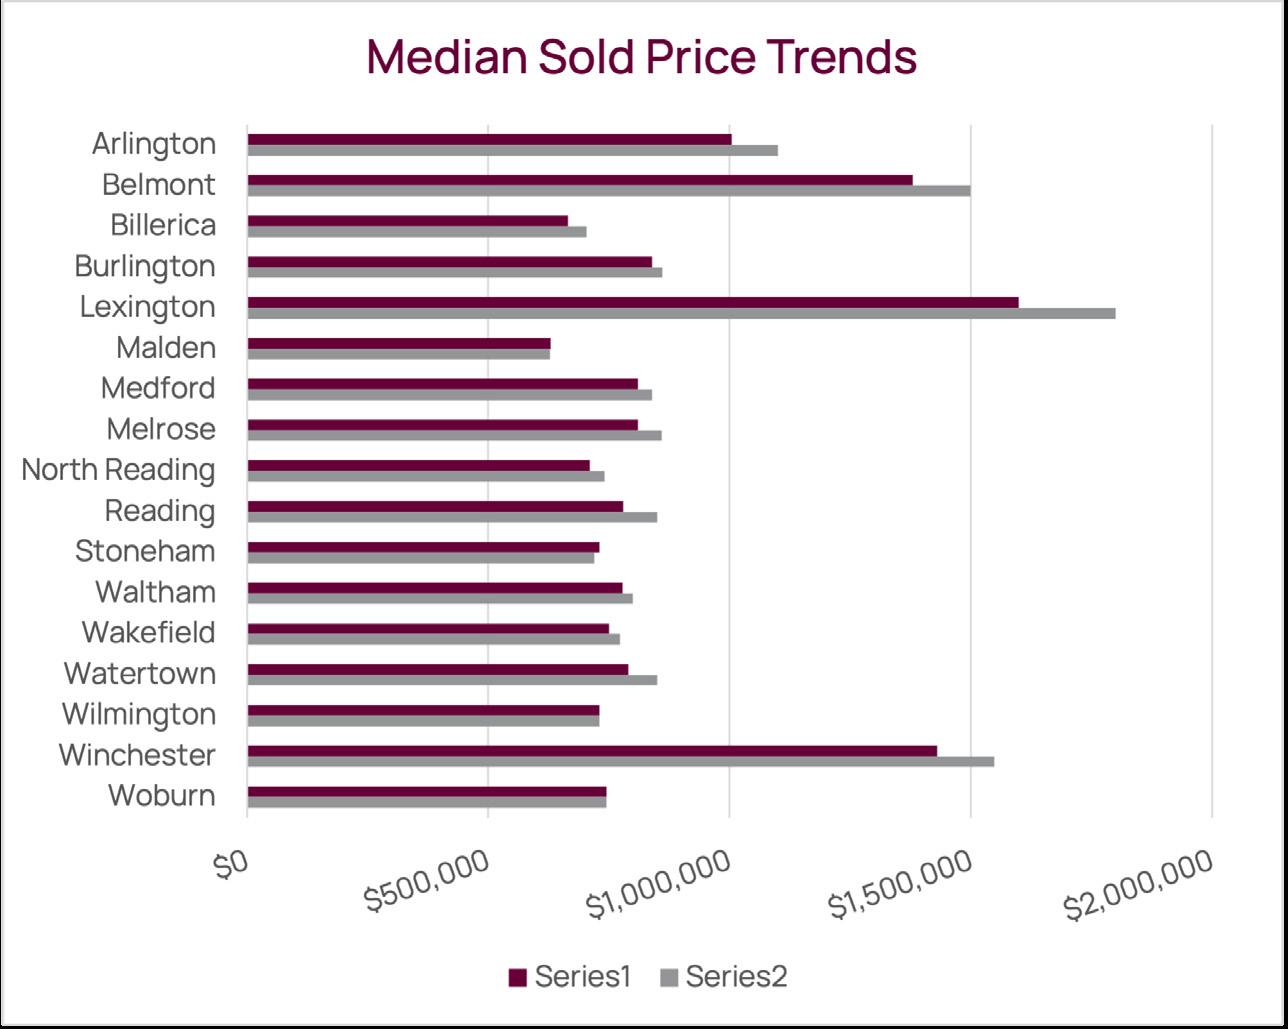
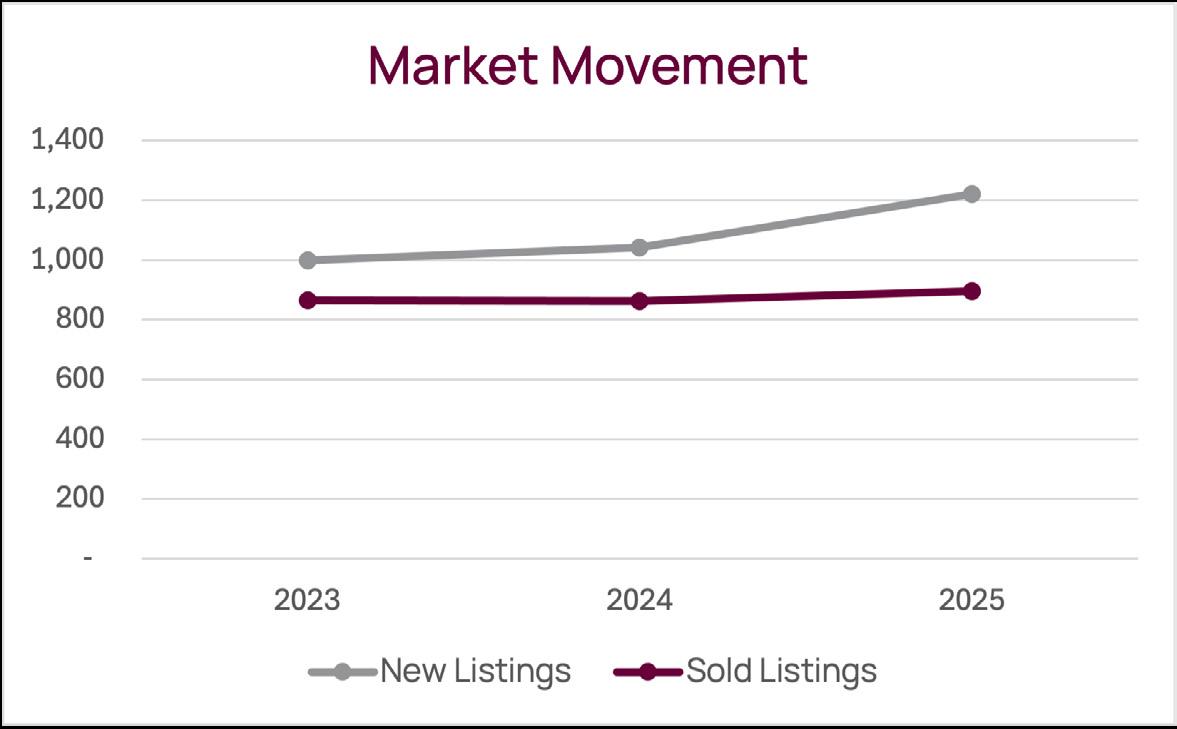
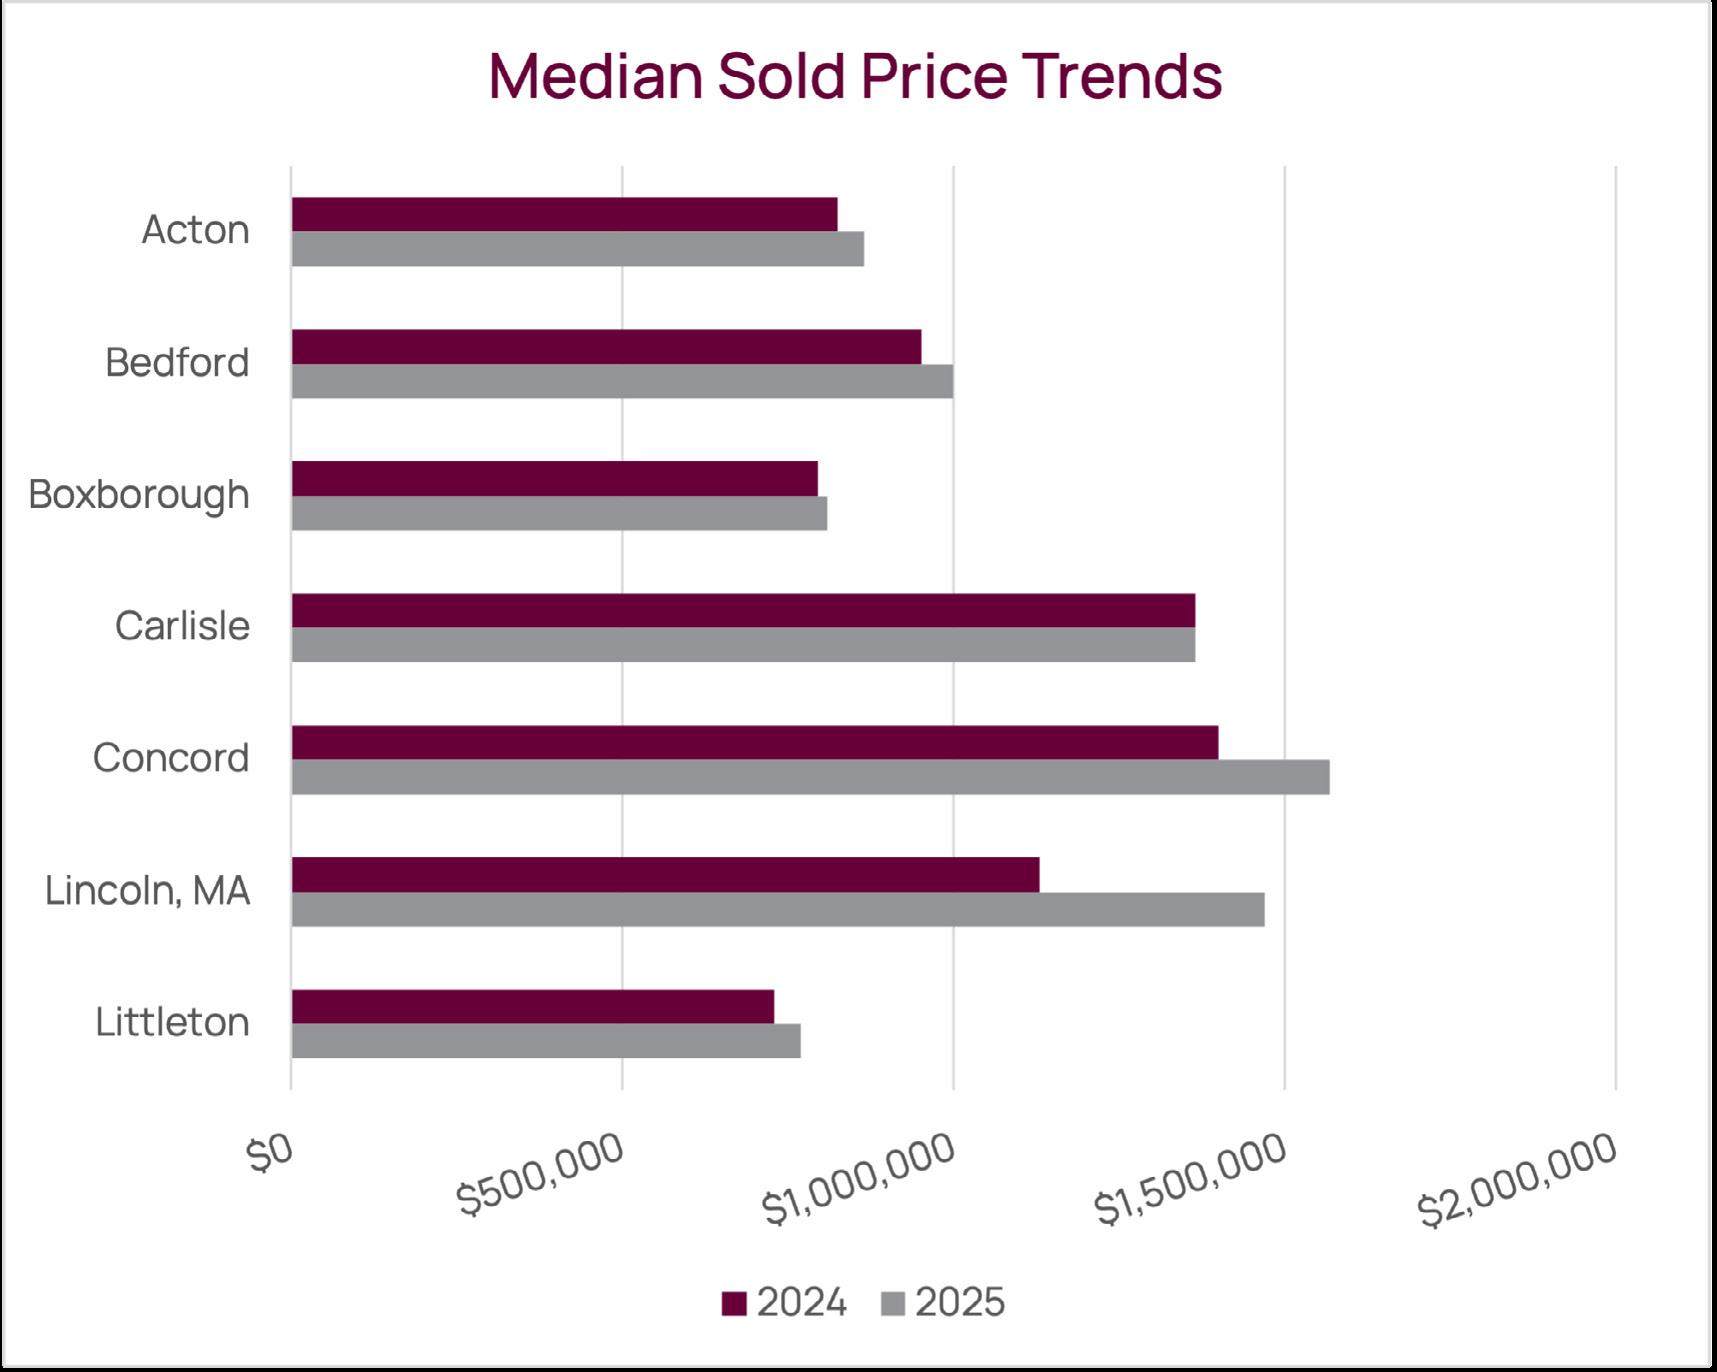
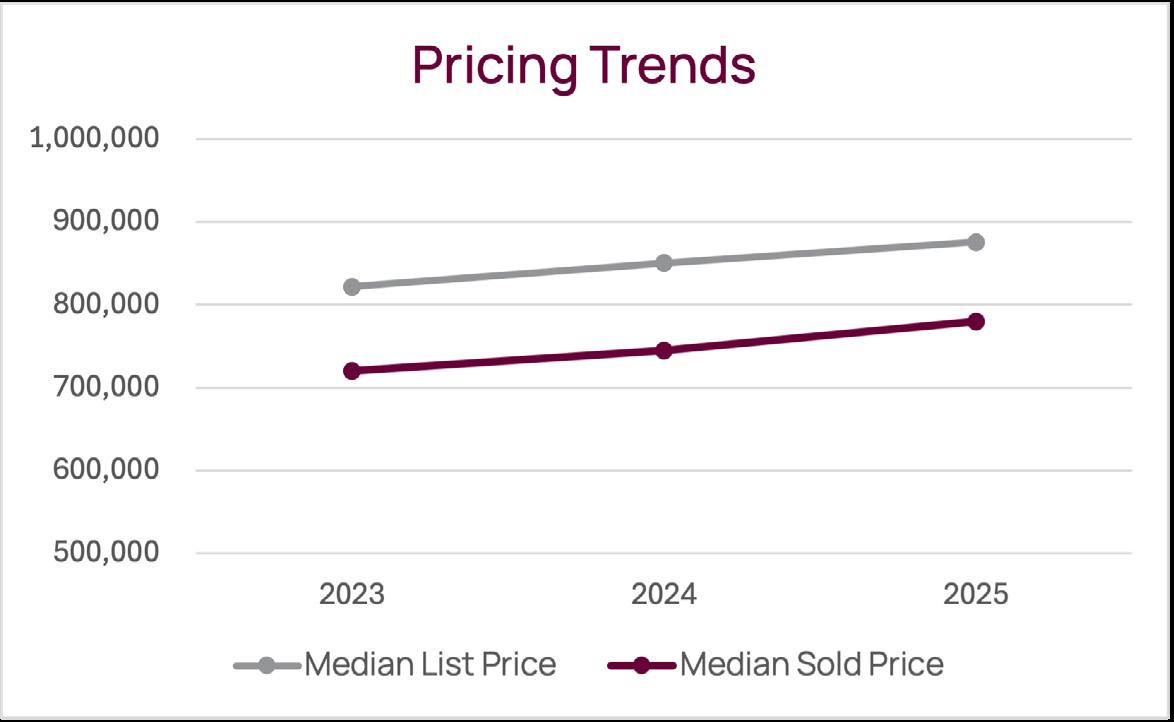
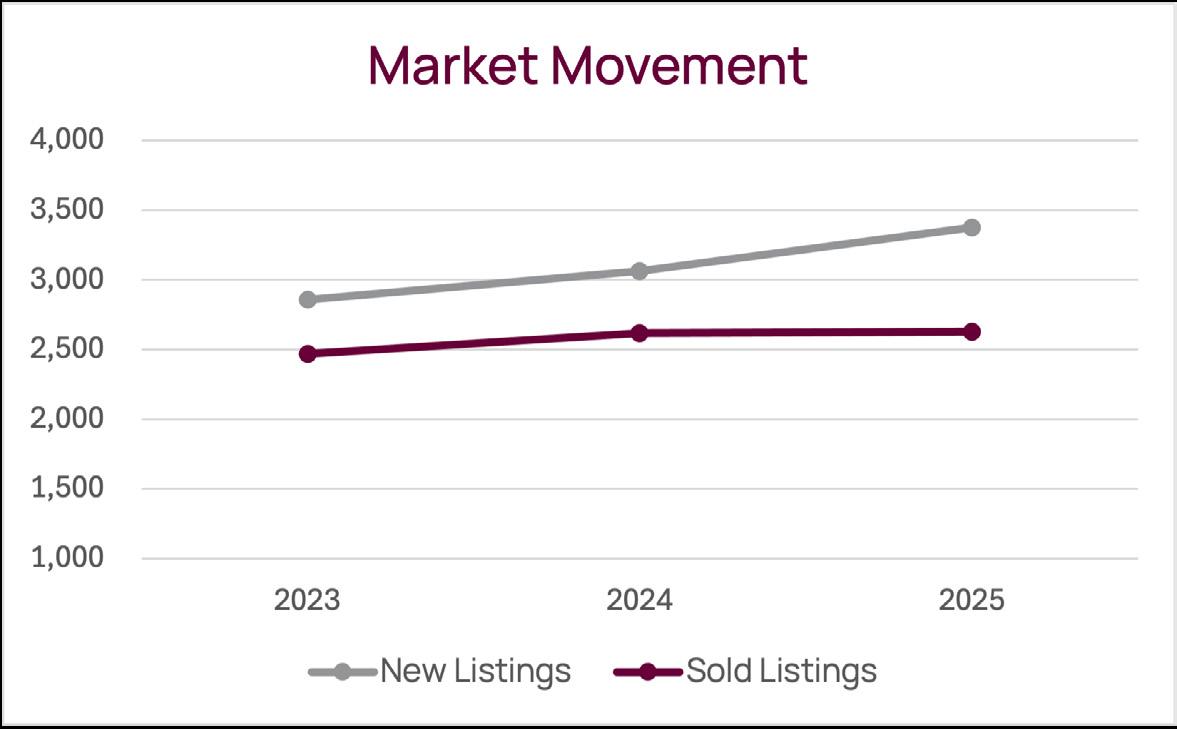
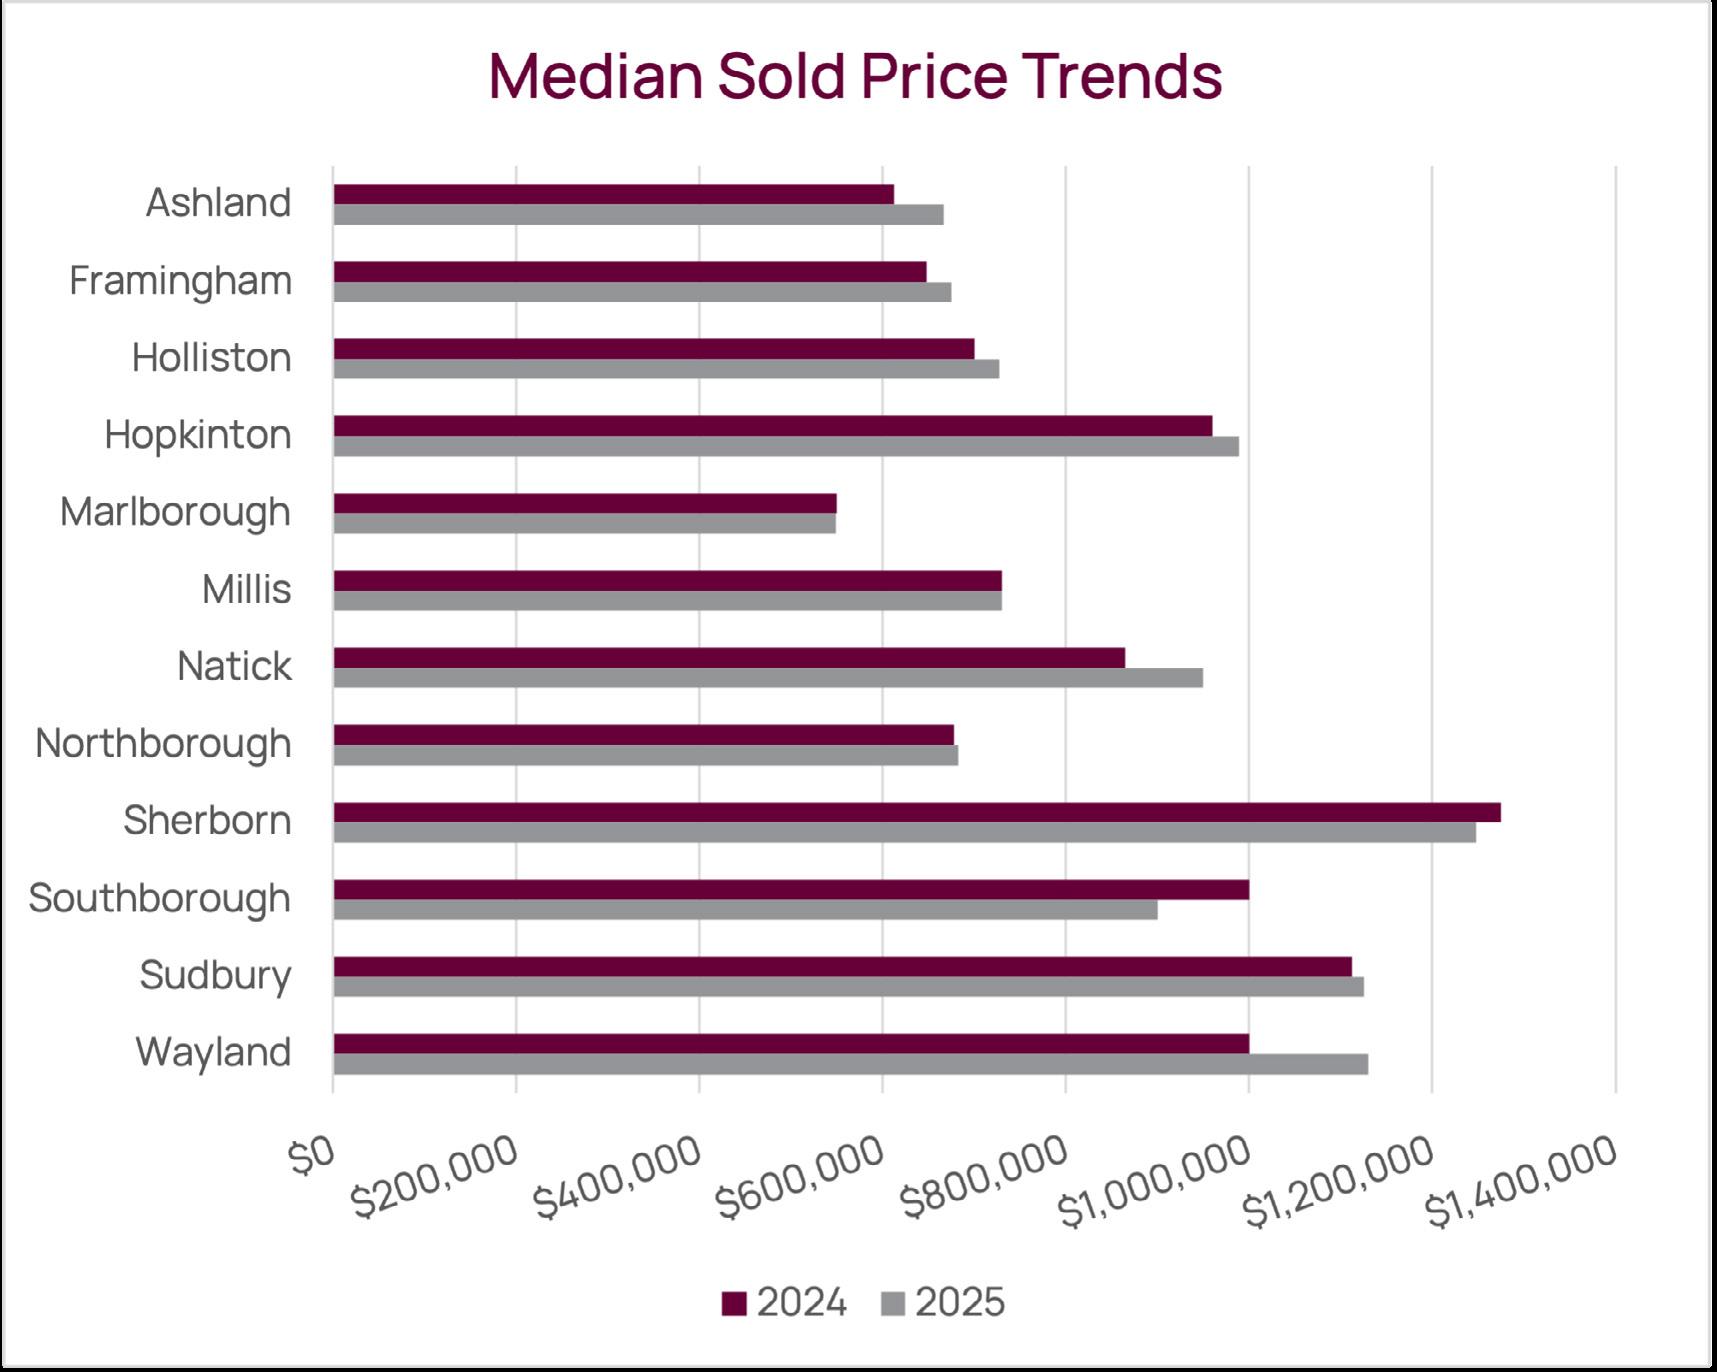
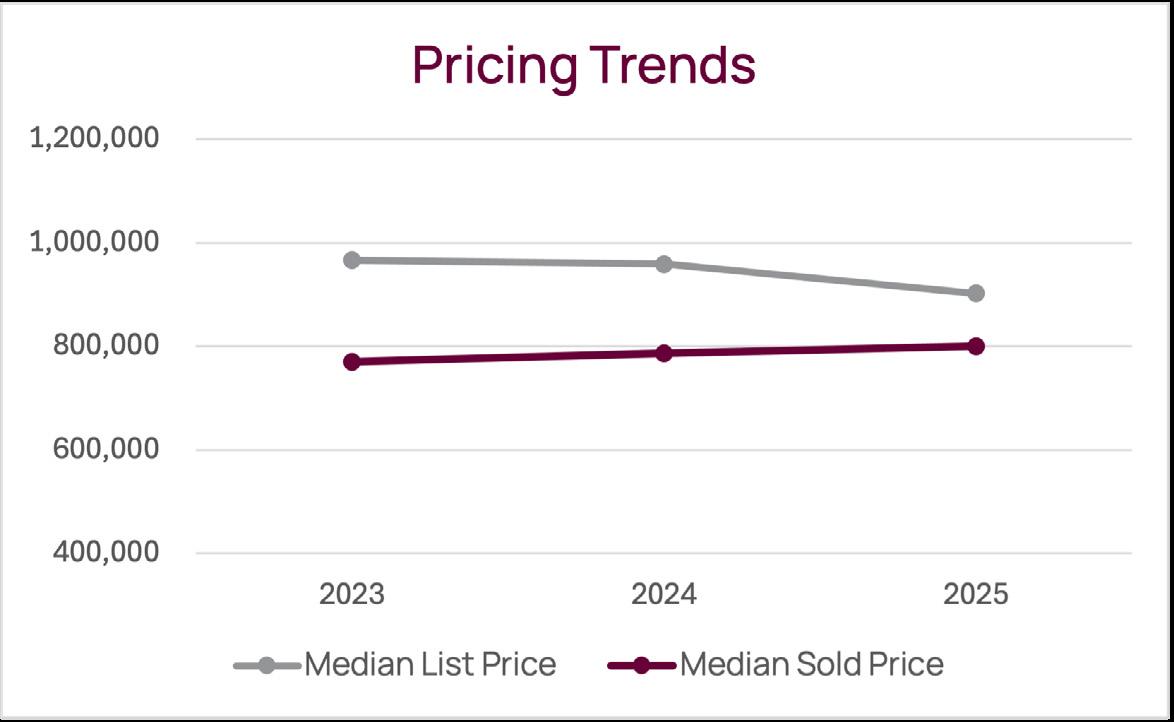
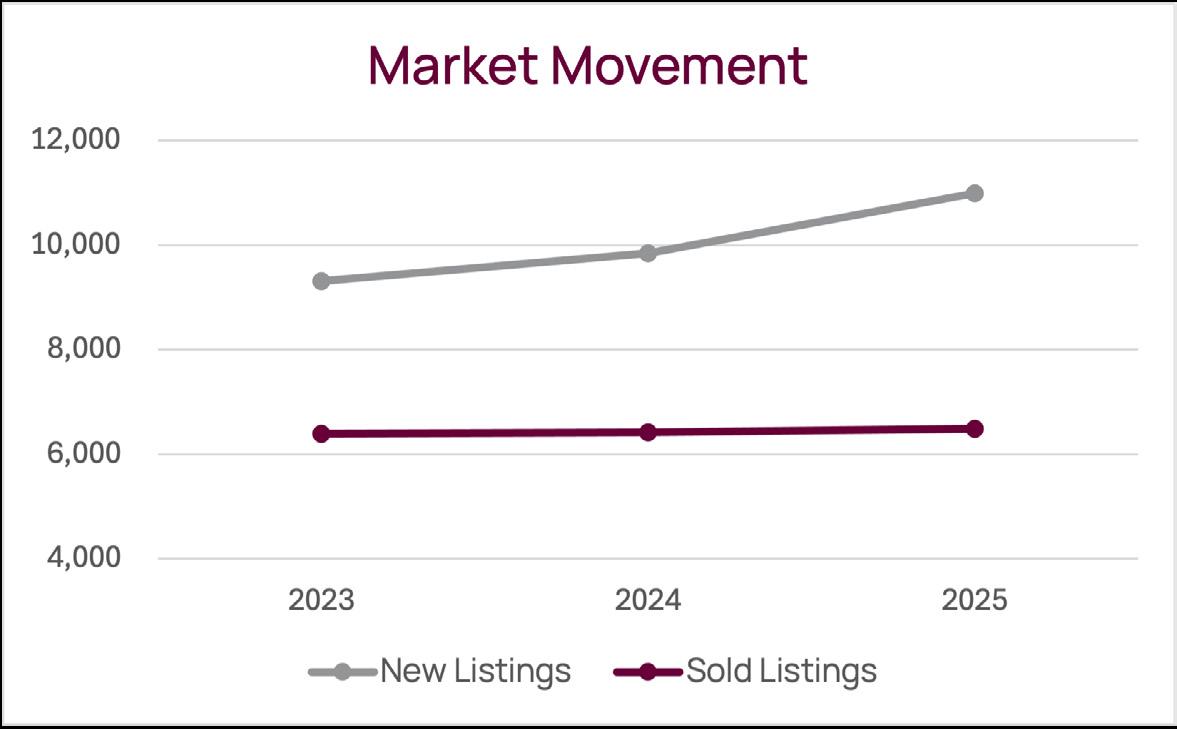
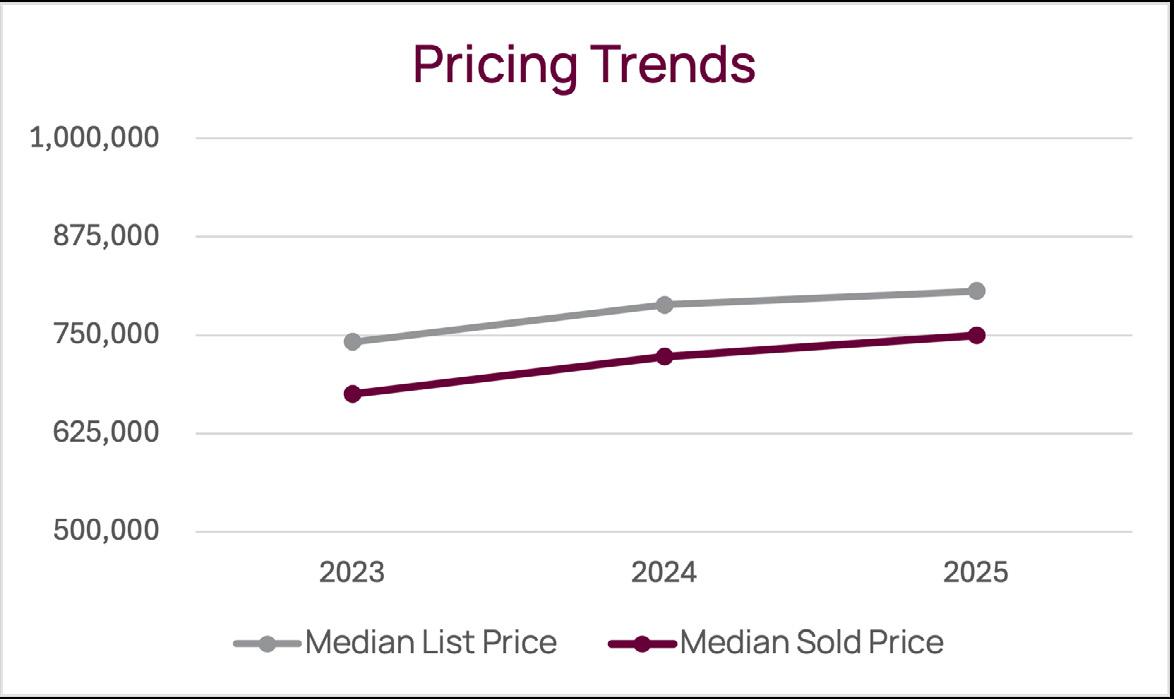
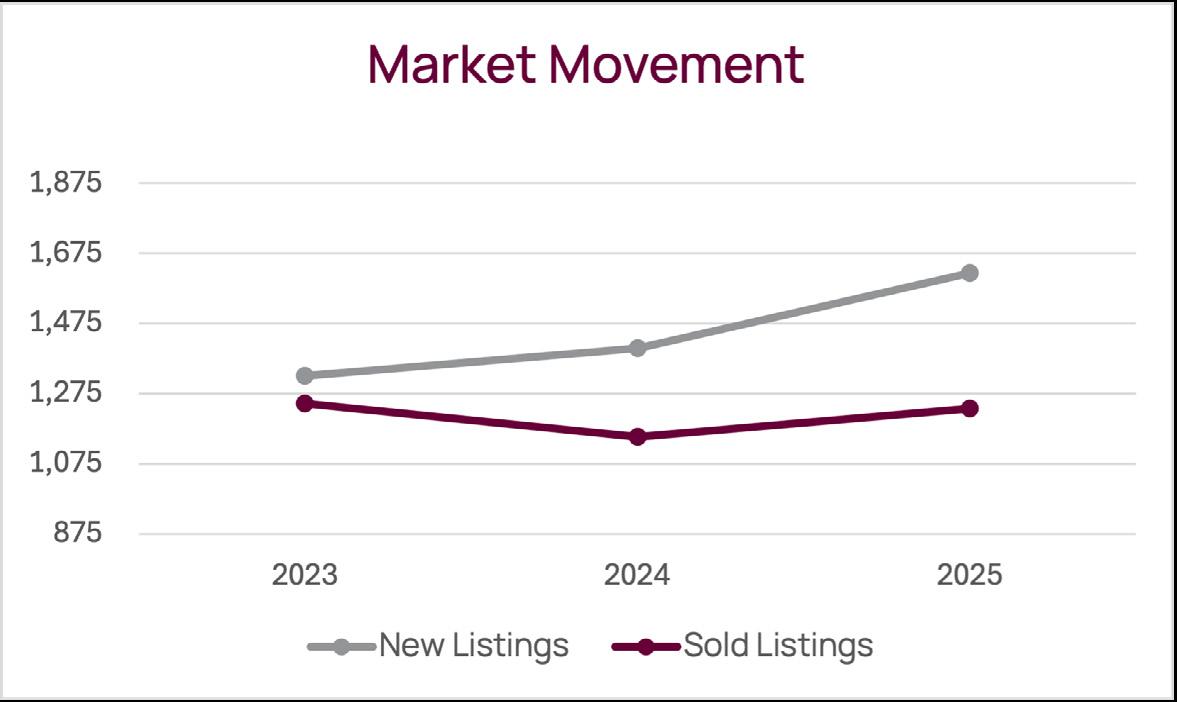
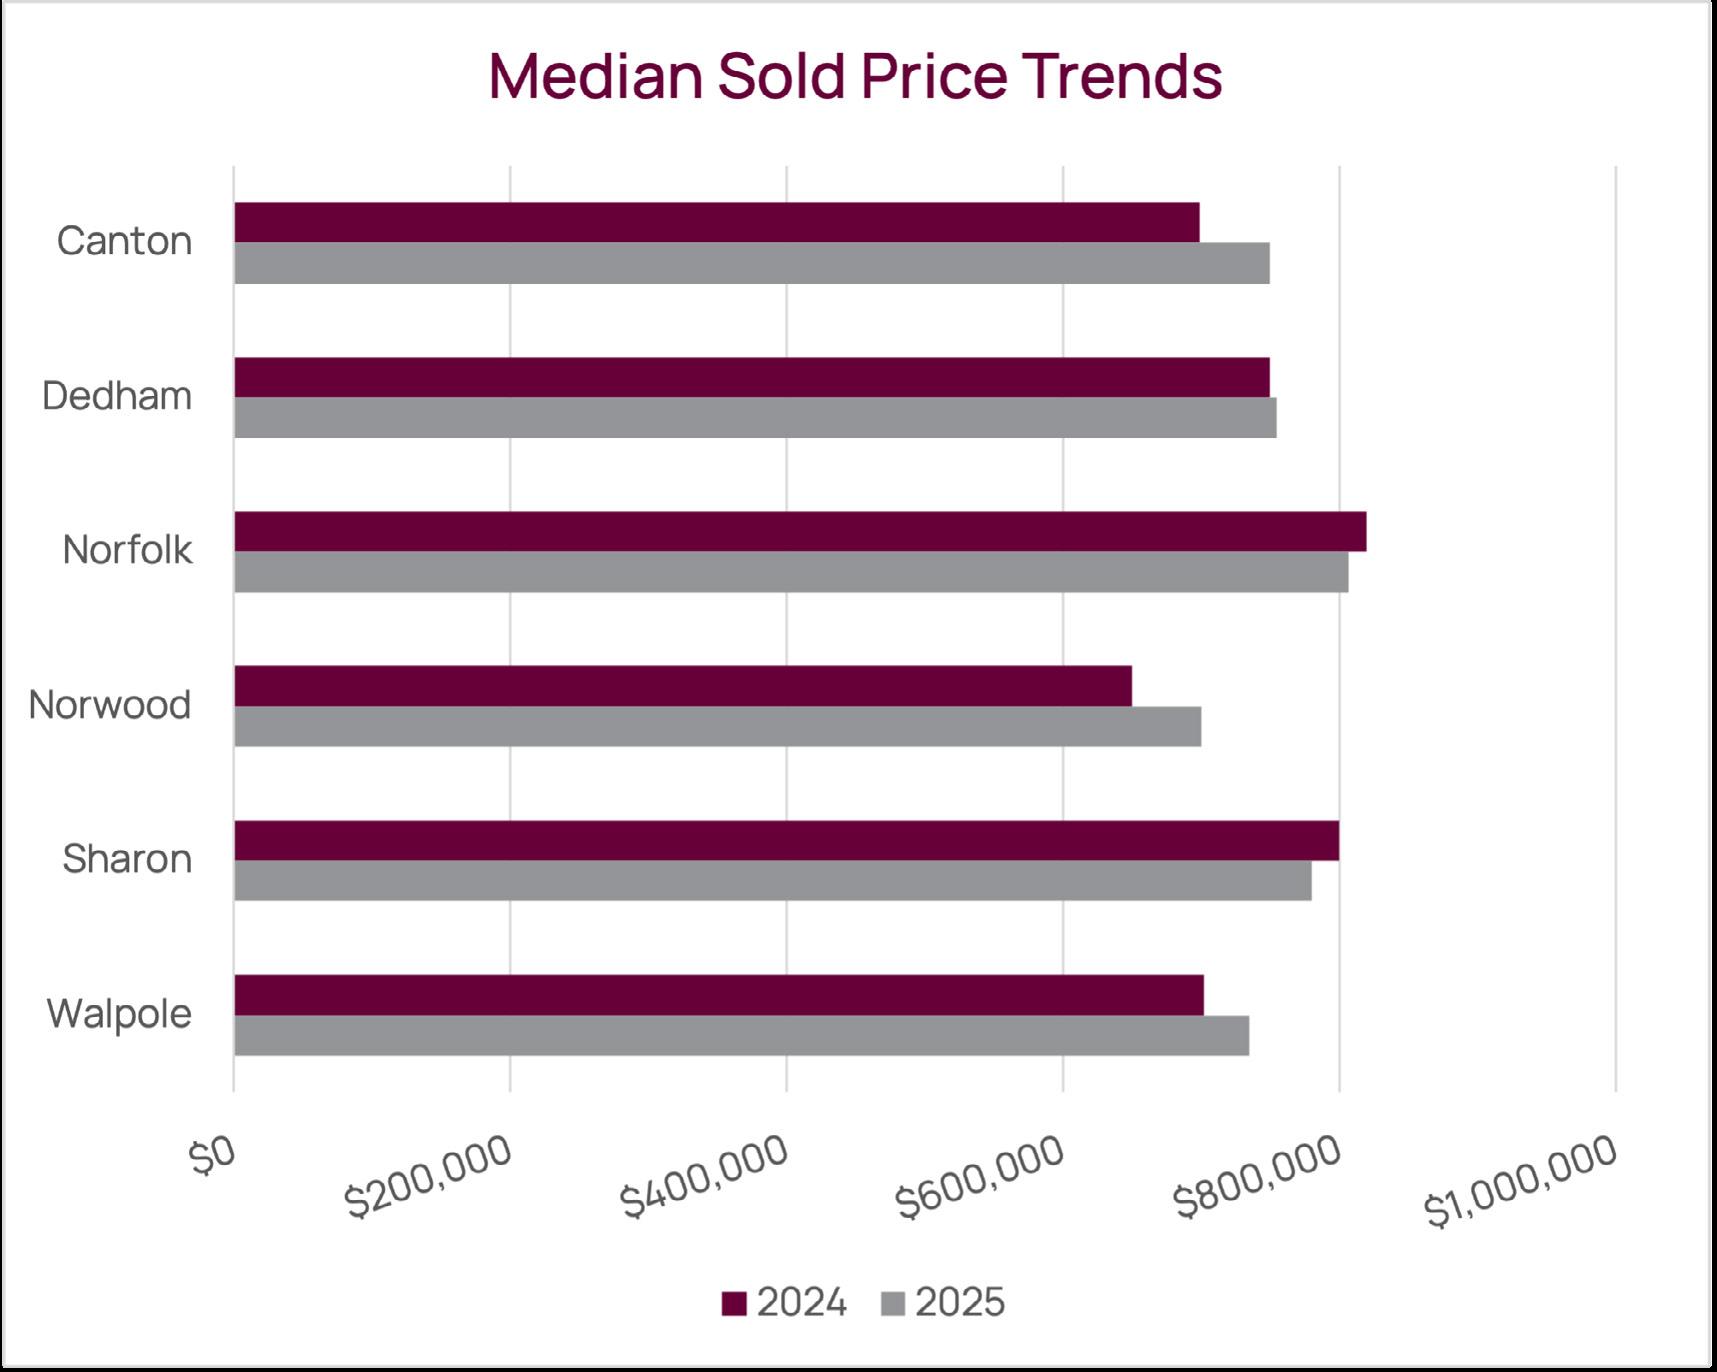
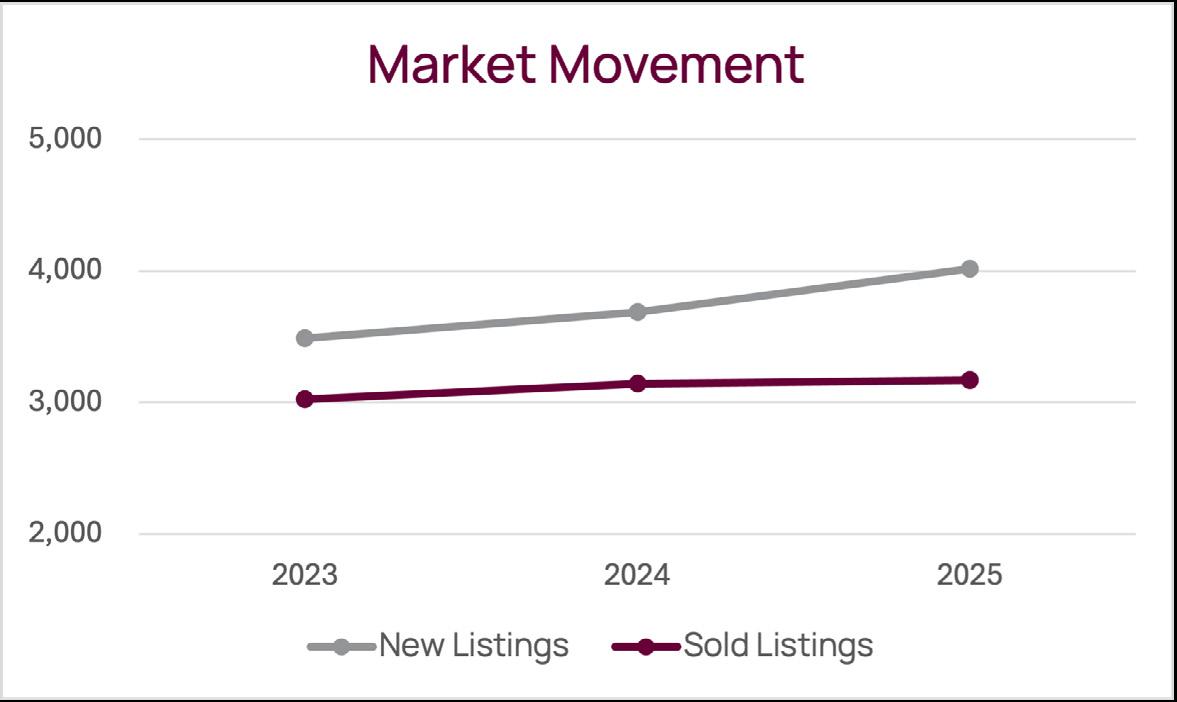
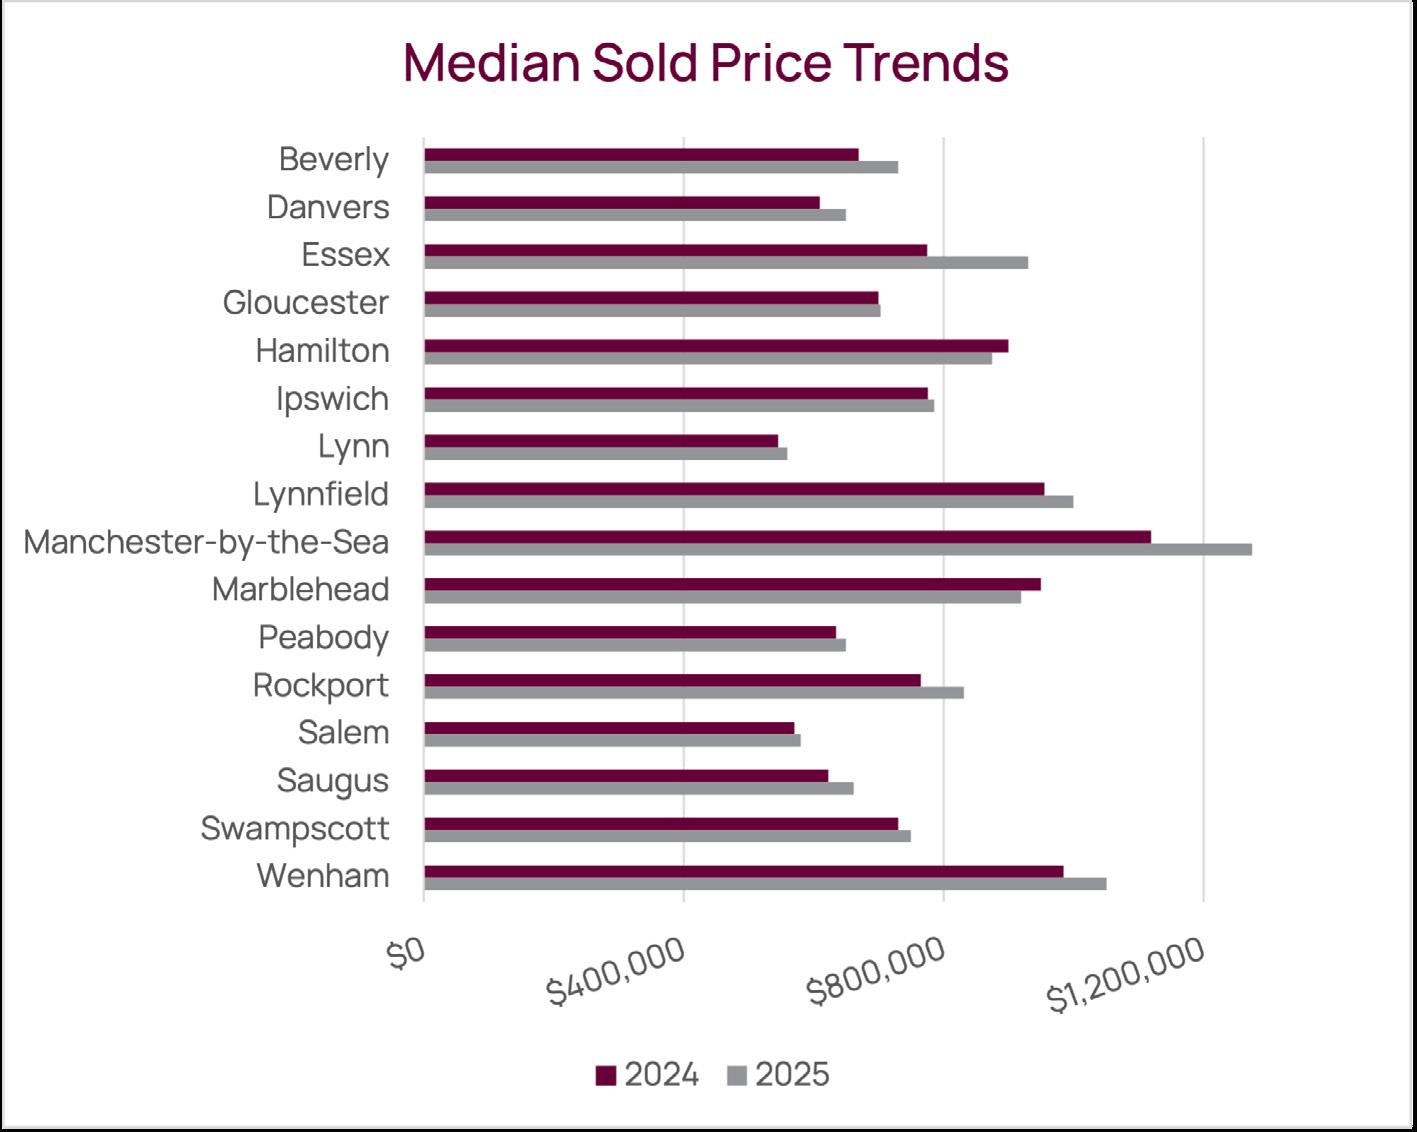
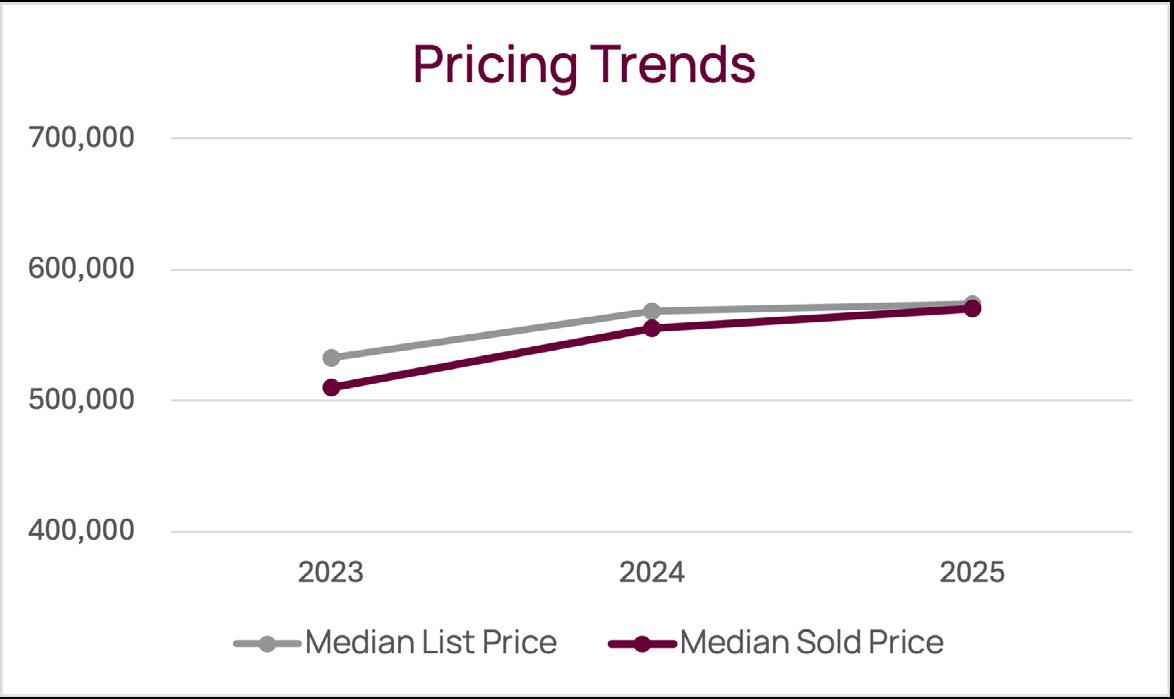
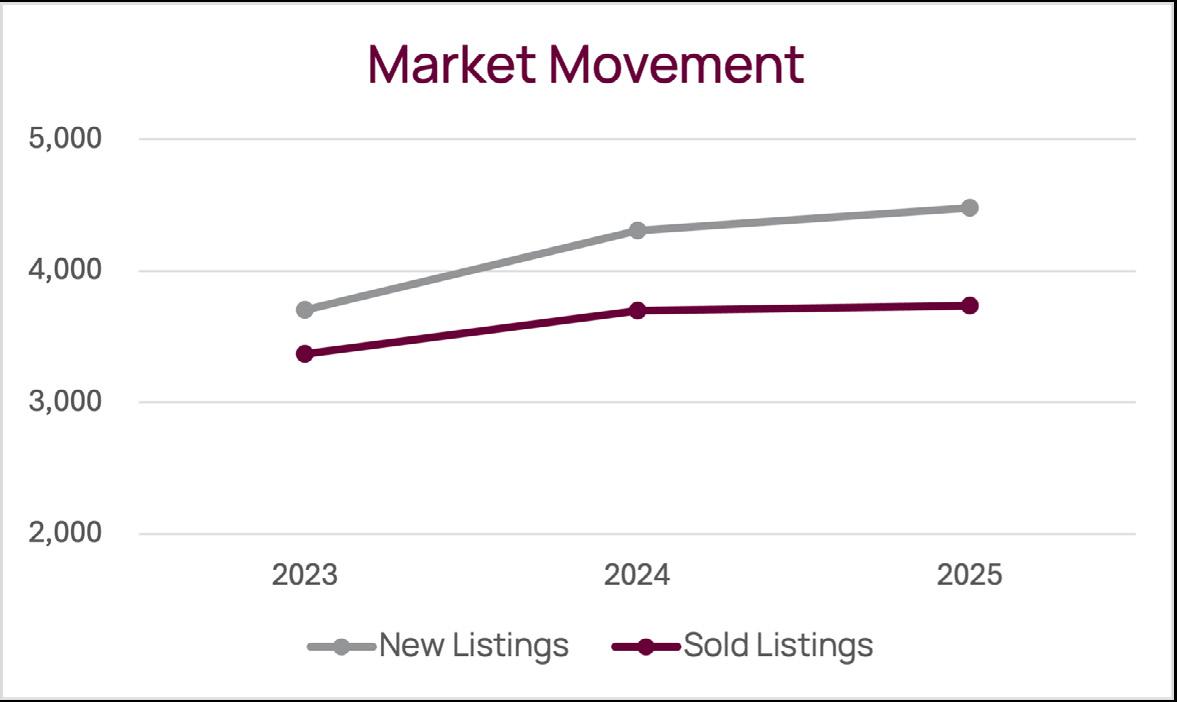
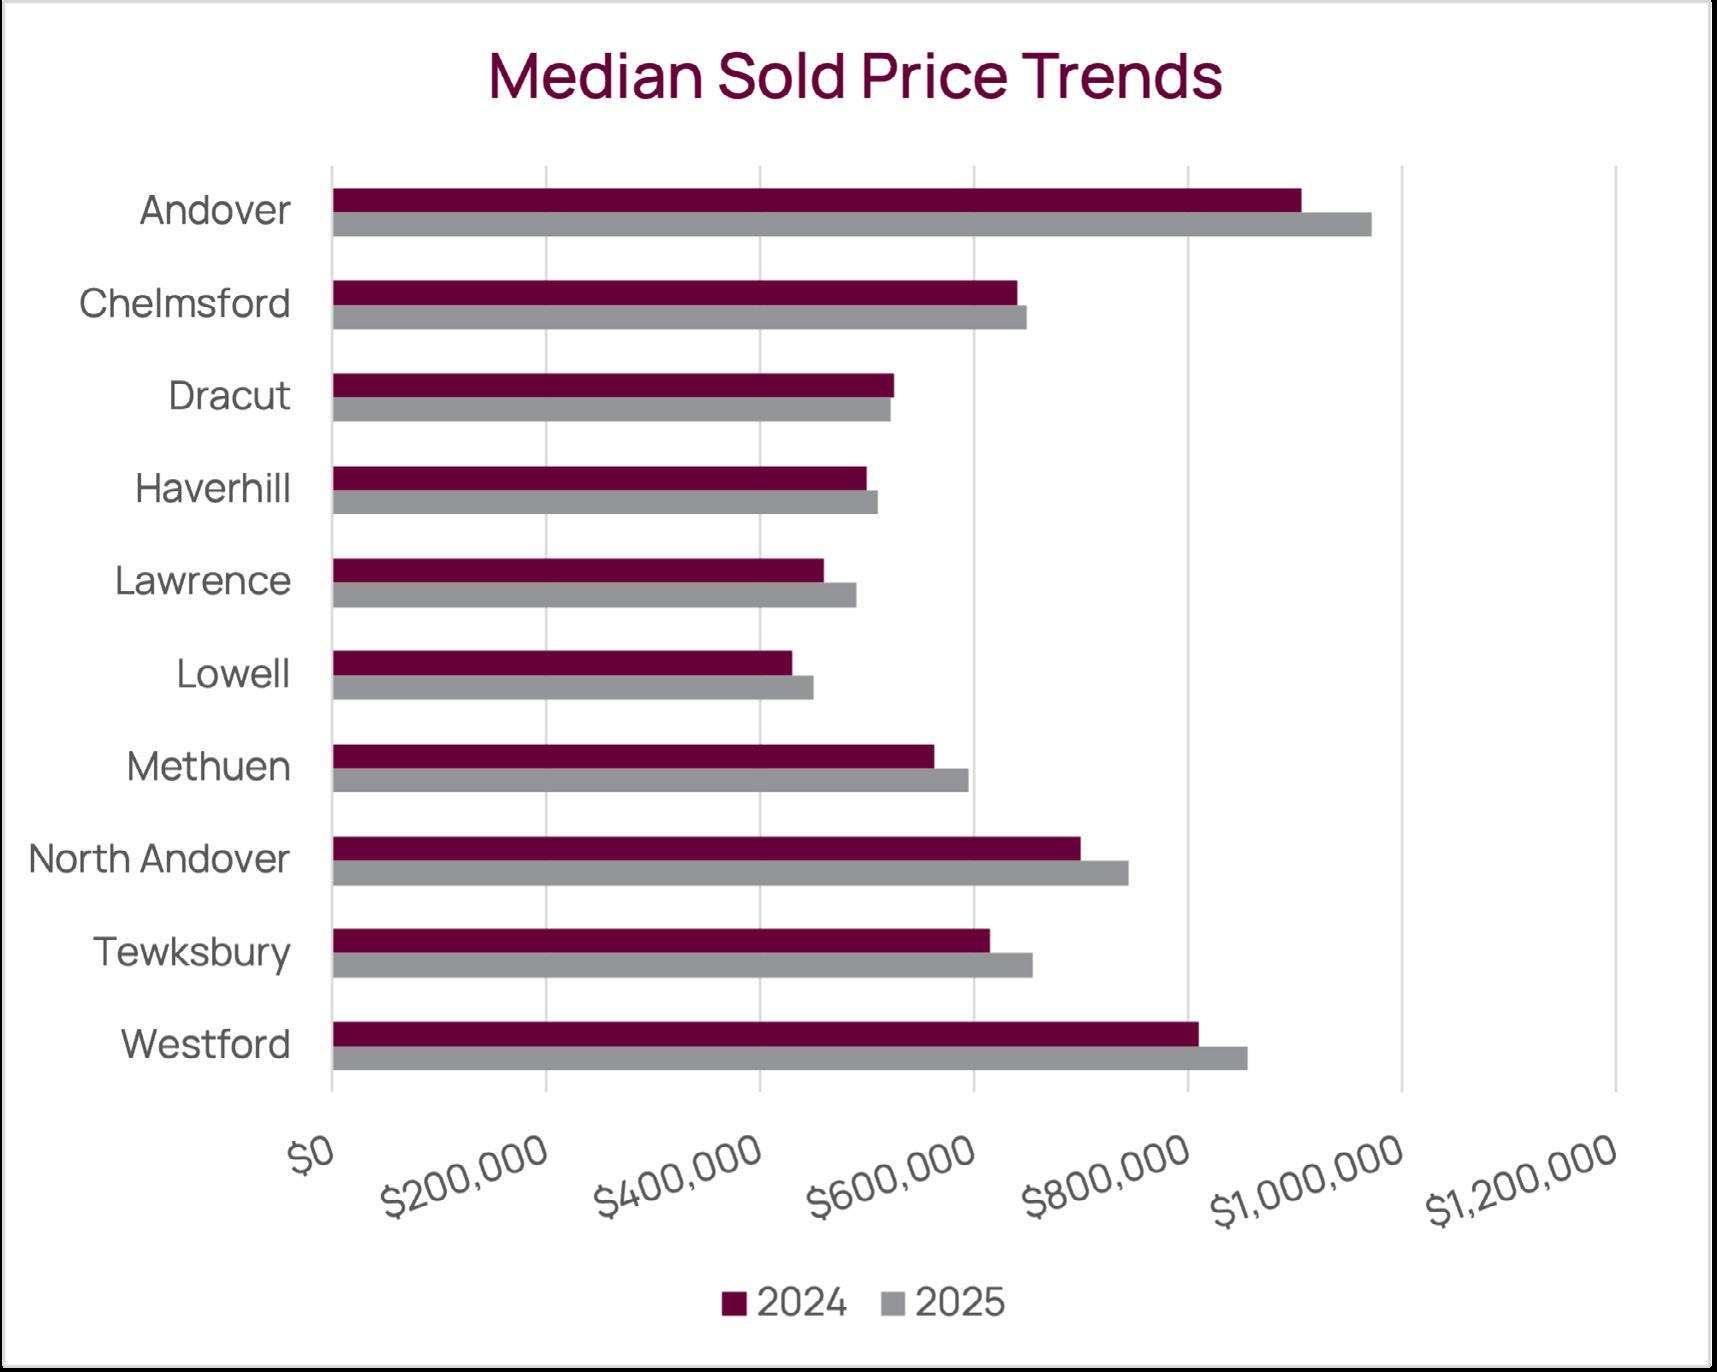
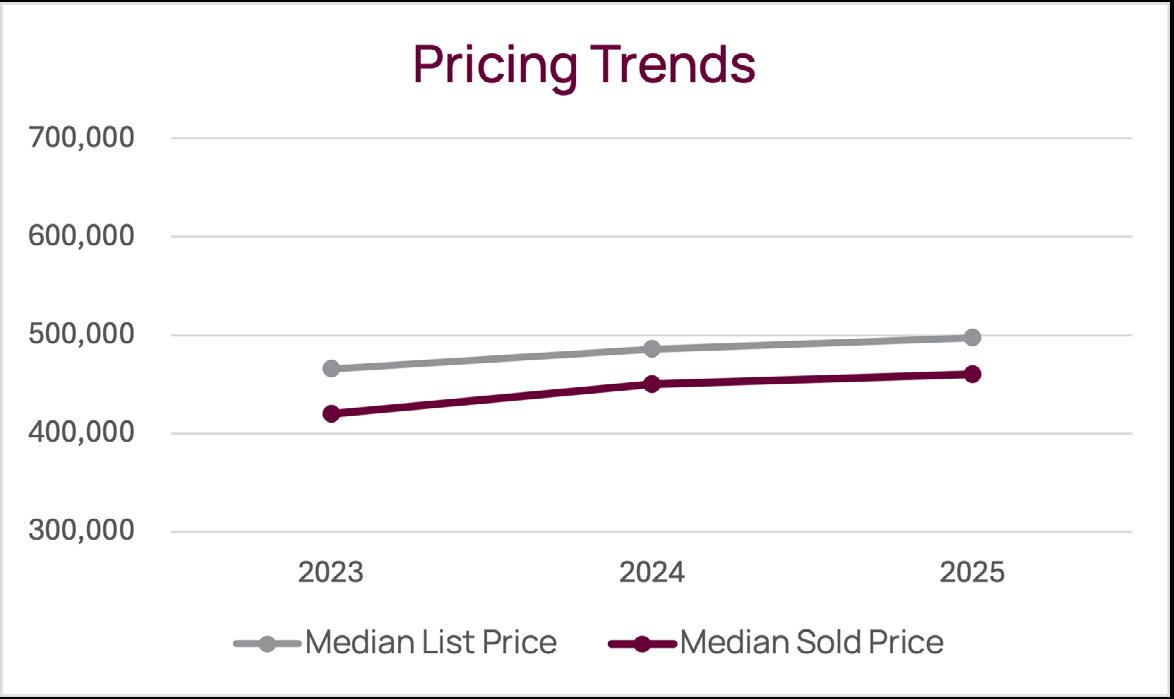
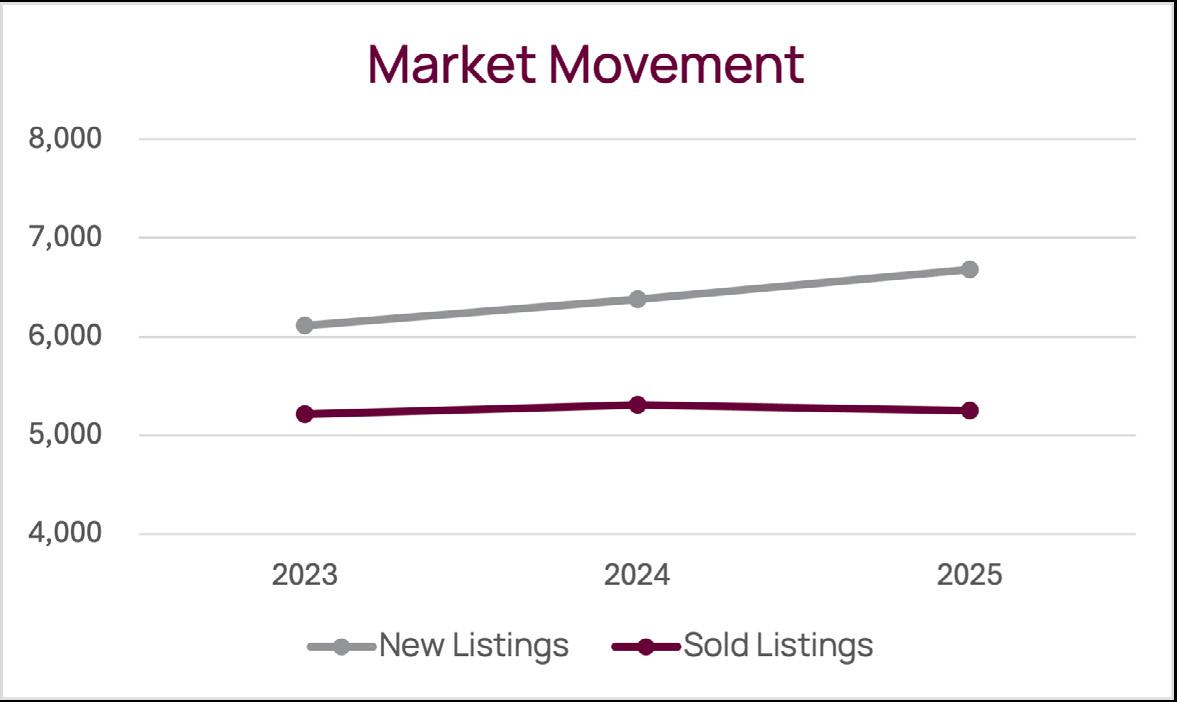
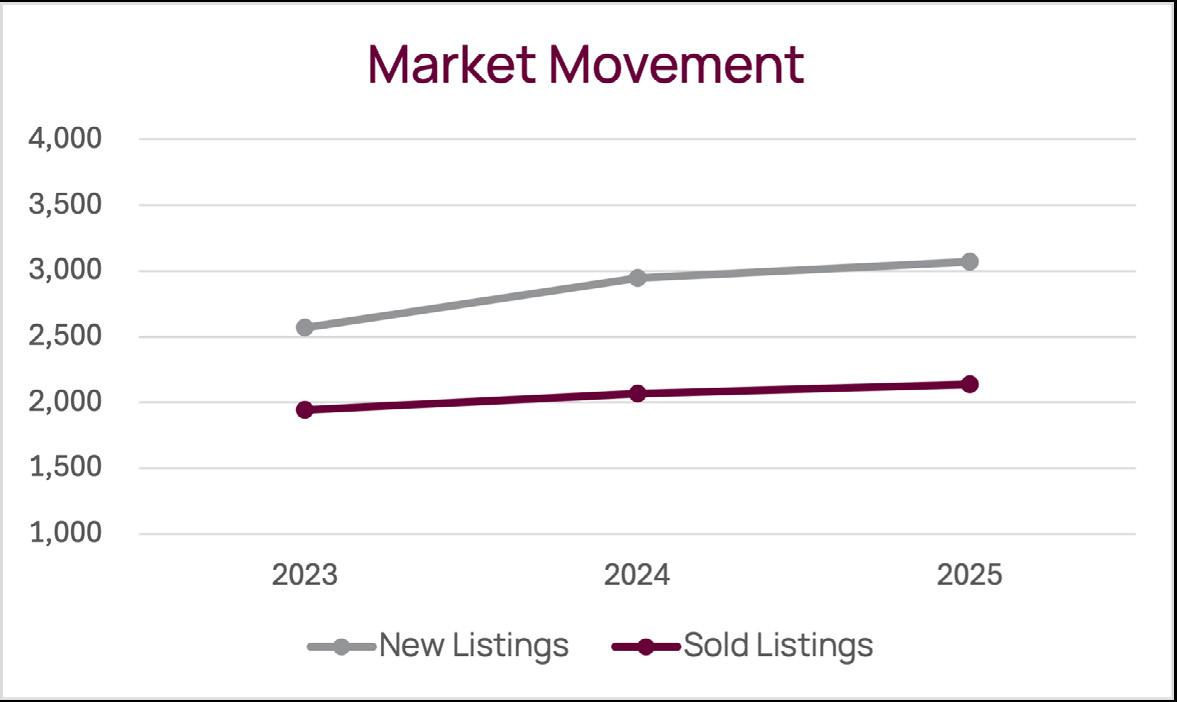
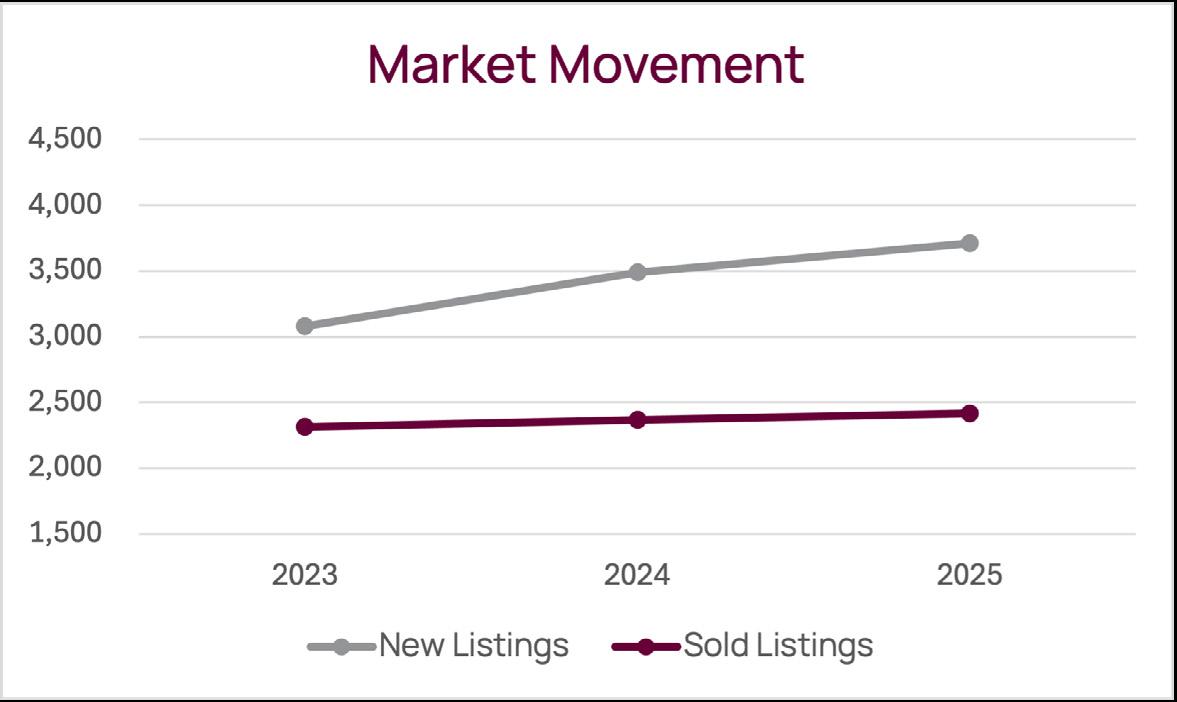
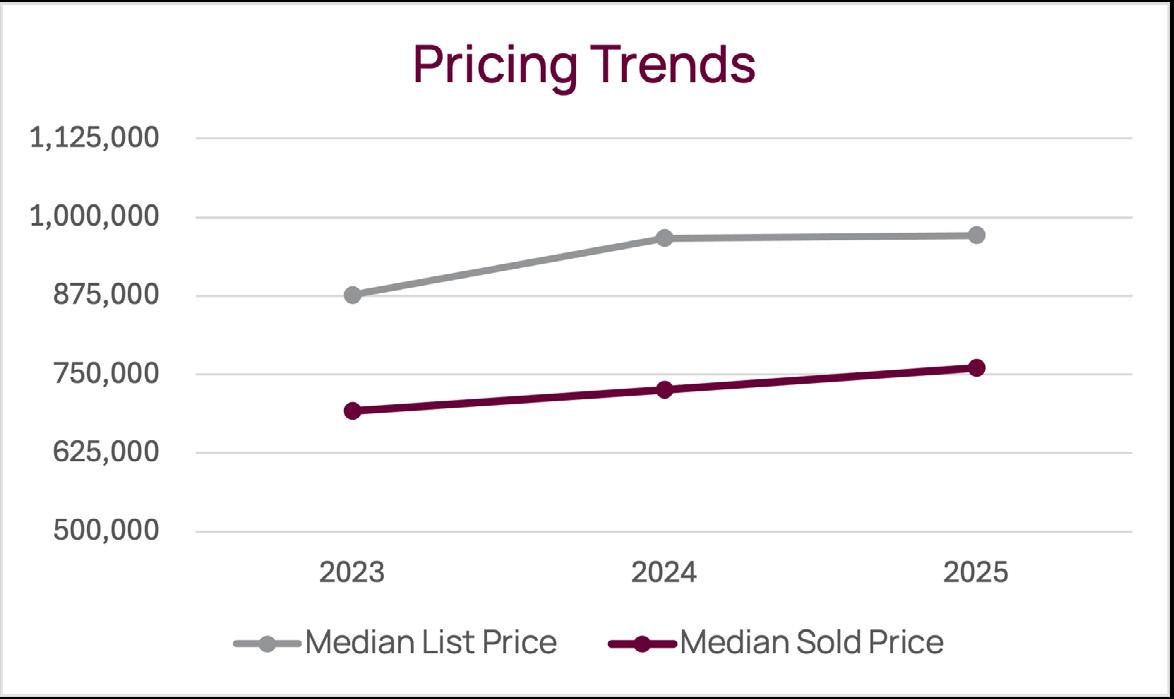
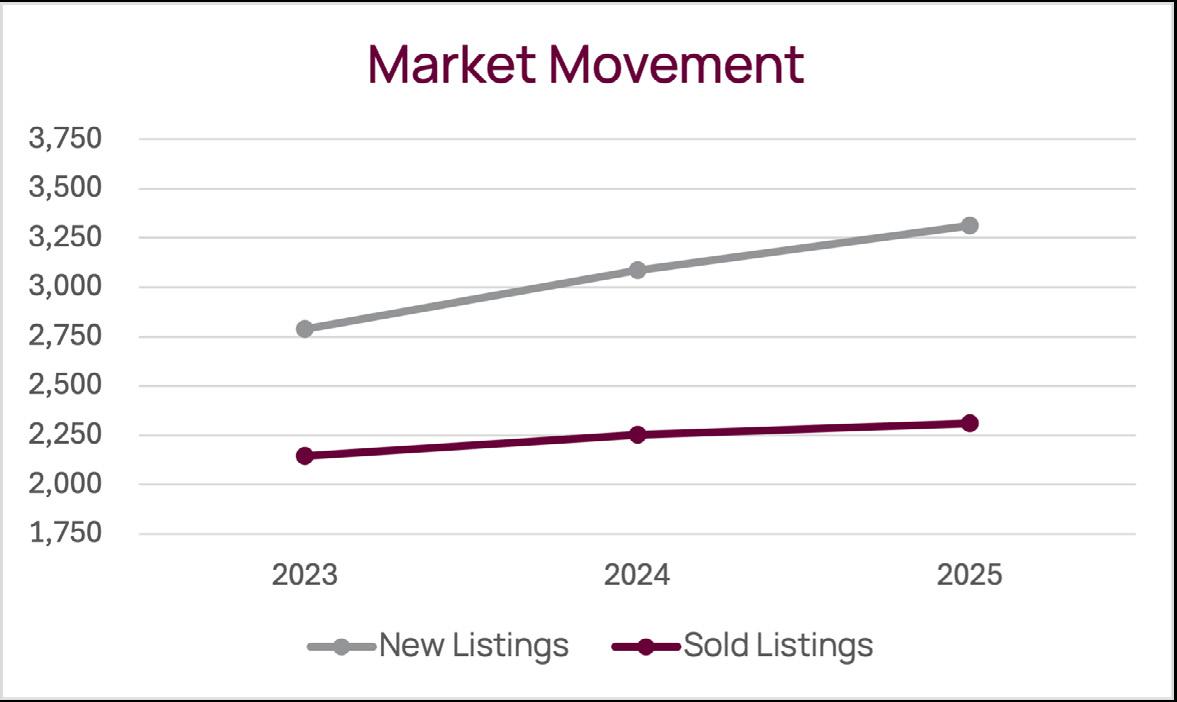
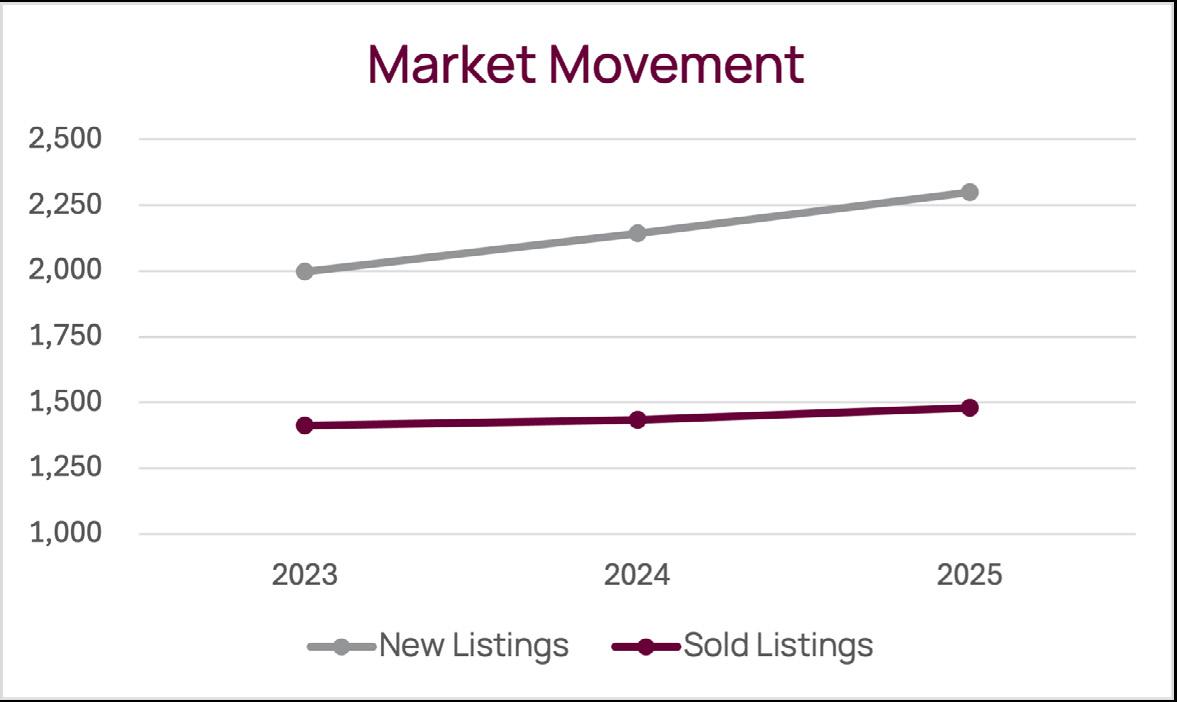
Across our Massachusetts markets, new listing activity increased noticeably in 2025, marking a clear shift after an extended period of tight inventory. In MetroWest, new listings rose more than 10 percent year over year, while median sale prices increased nearly 5 percent to approximately $780,000. The North Shore reflected a similar dynamic, with listings up close to 9 percent and median pricing rising more than 5 percent to roughly $675,000. Greater Worcester remained steady and accessible, with new listings up about 5 percent and median prices rising just over 2 percent to approximately $460,000. Taken together, these results show a market that absorbed additional supply without weakening.
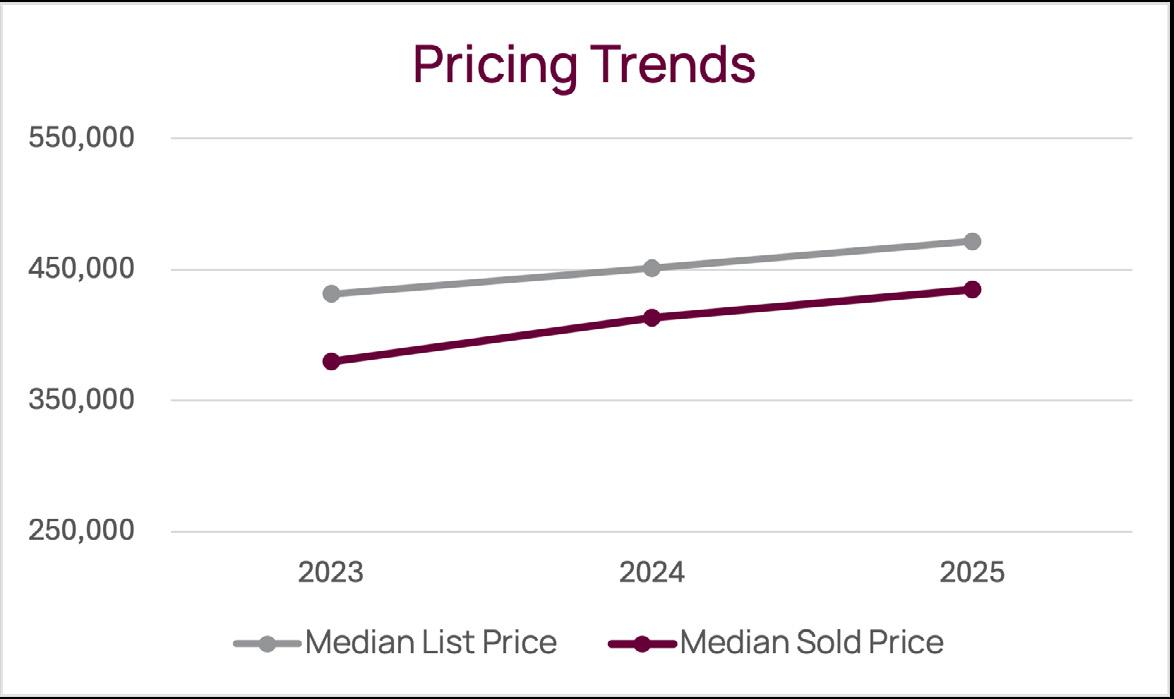
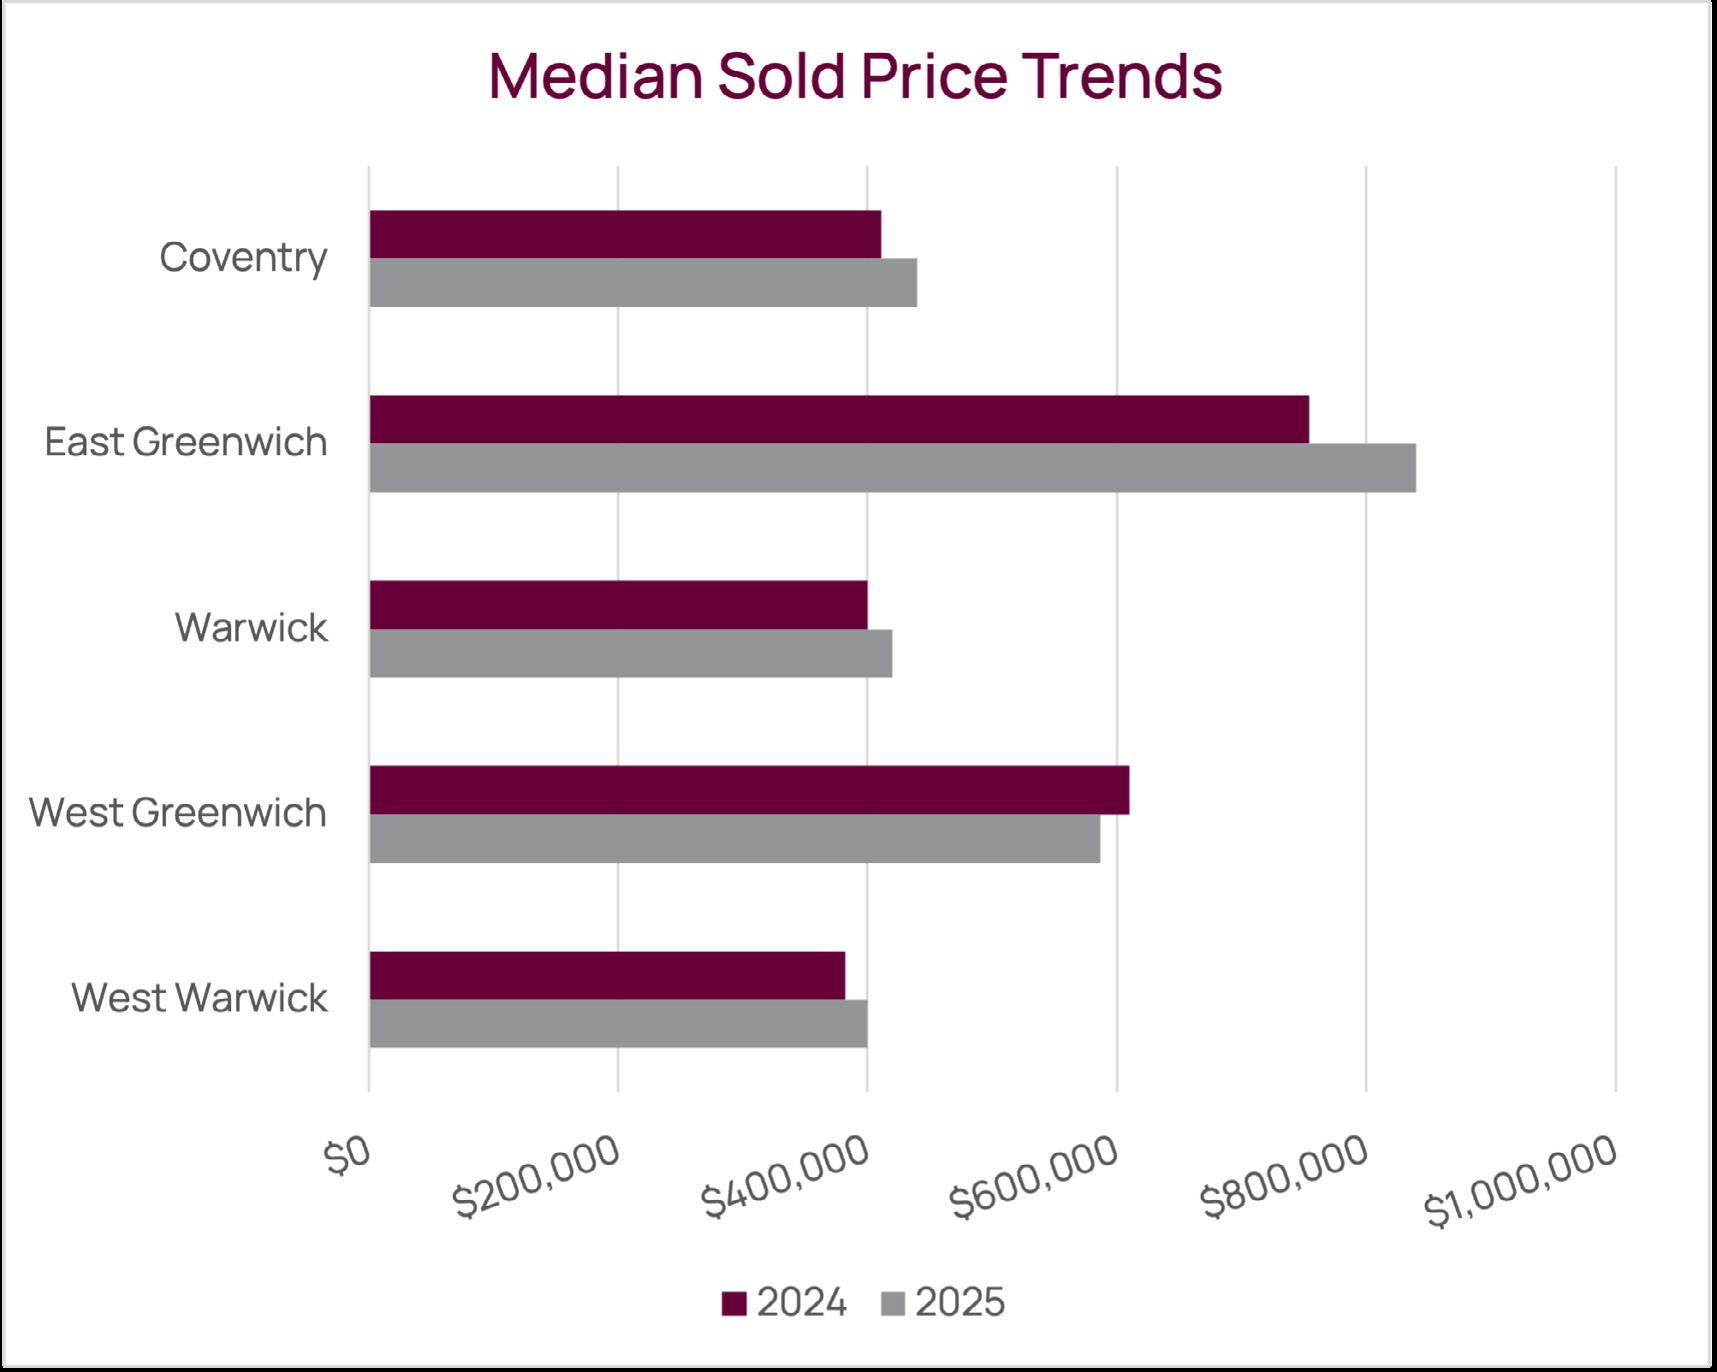
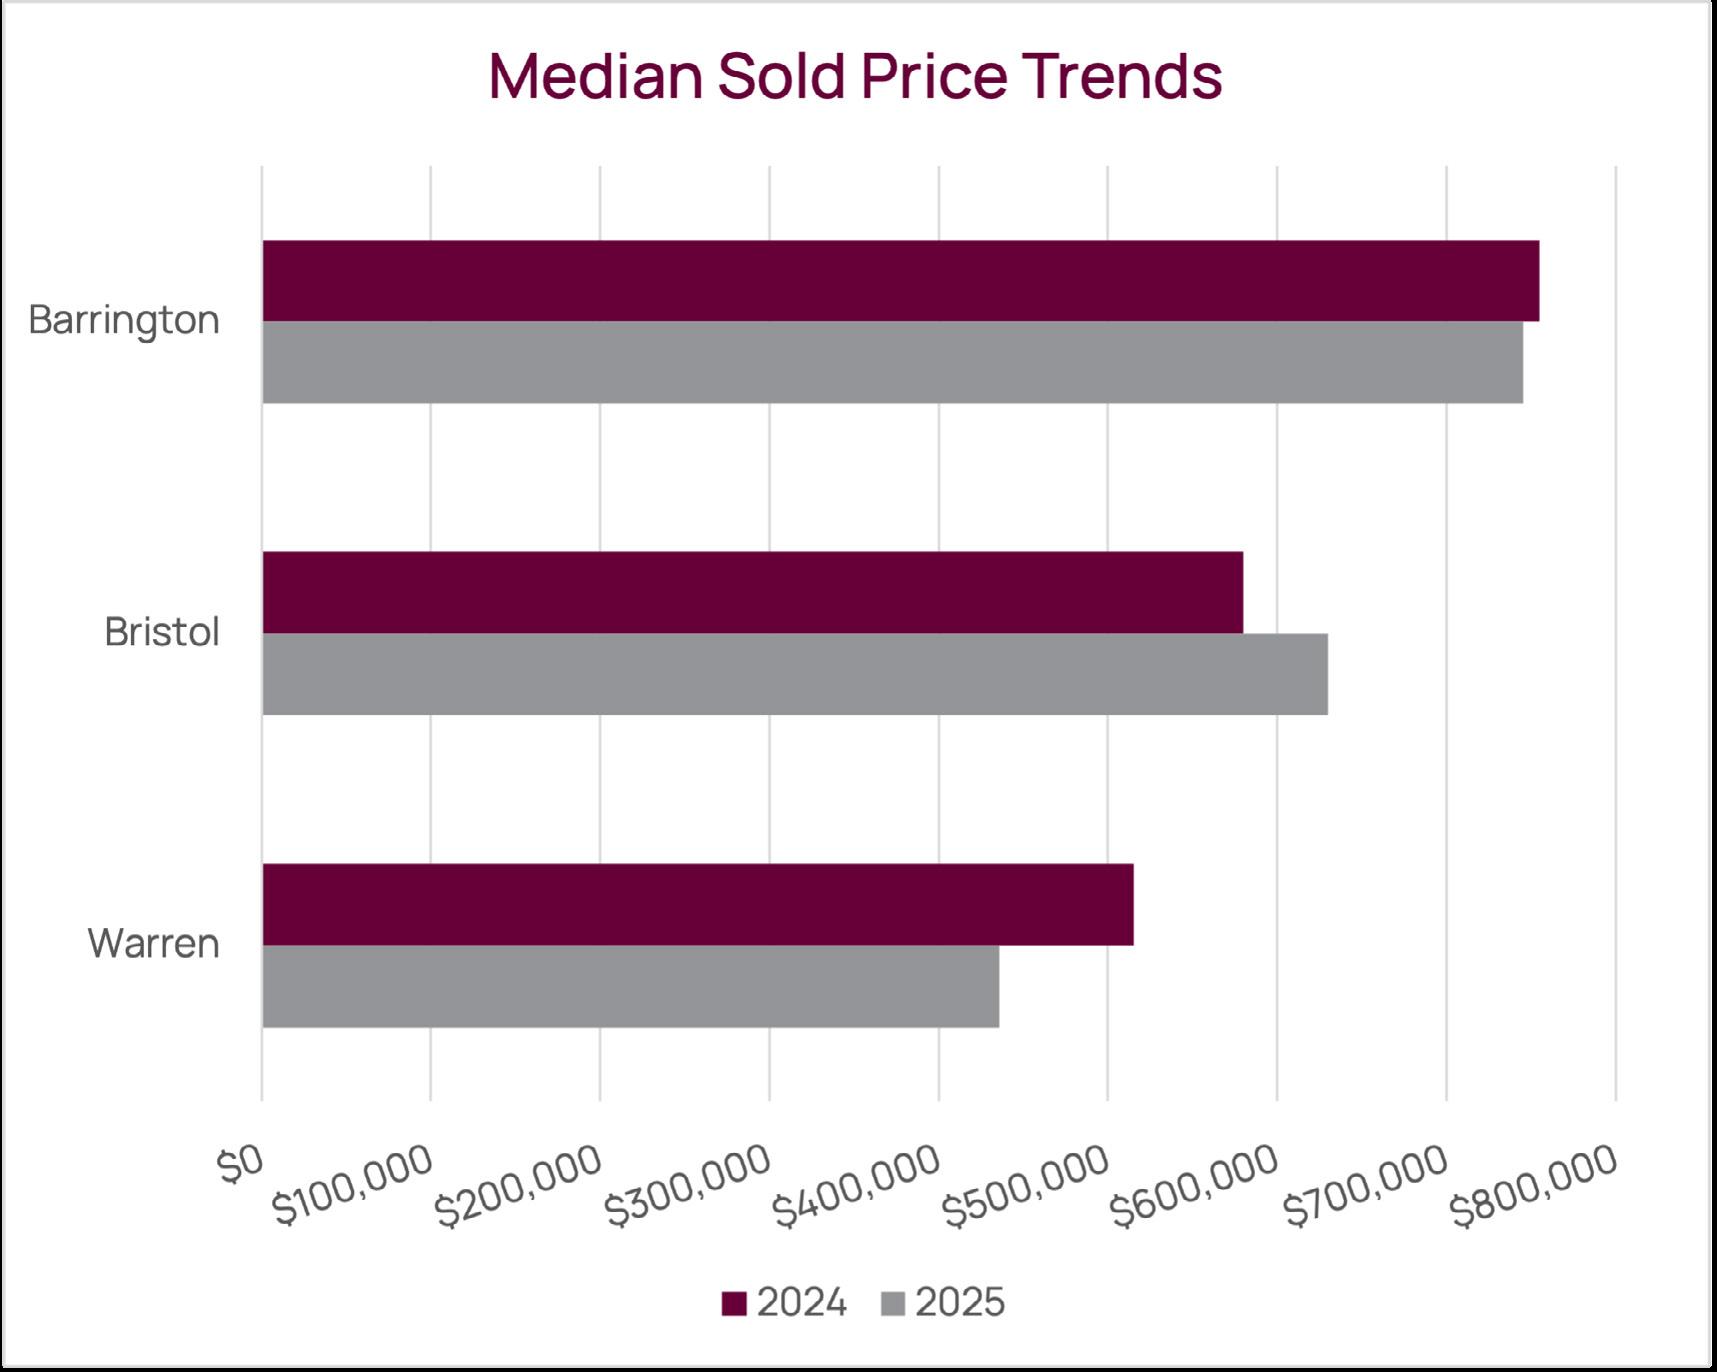
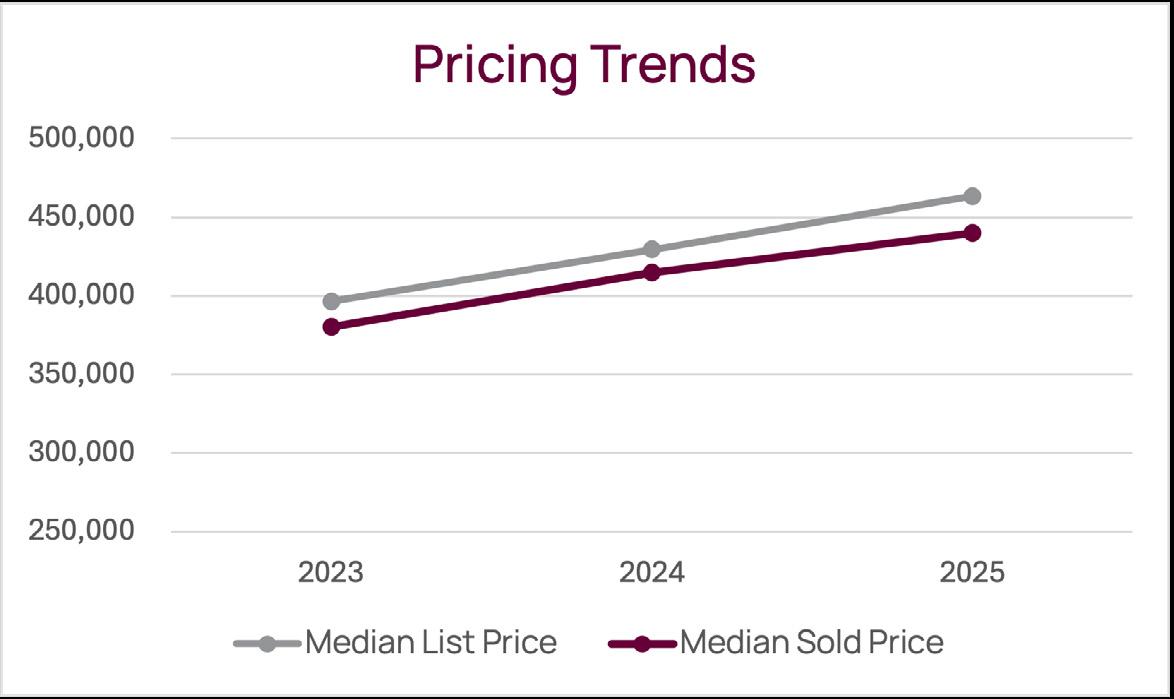
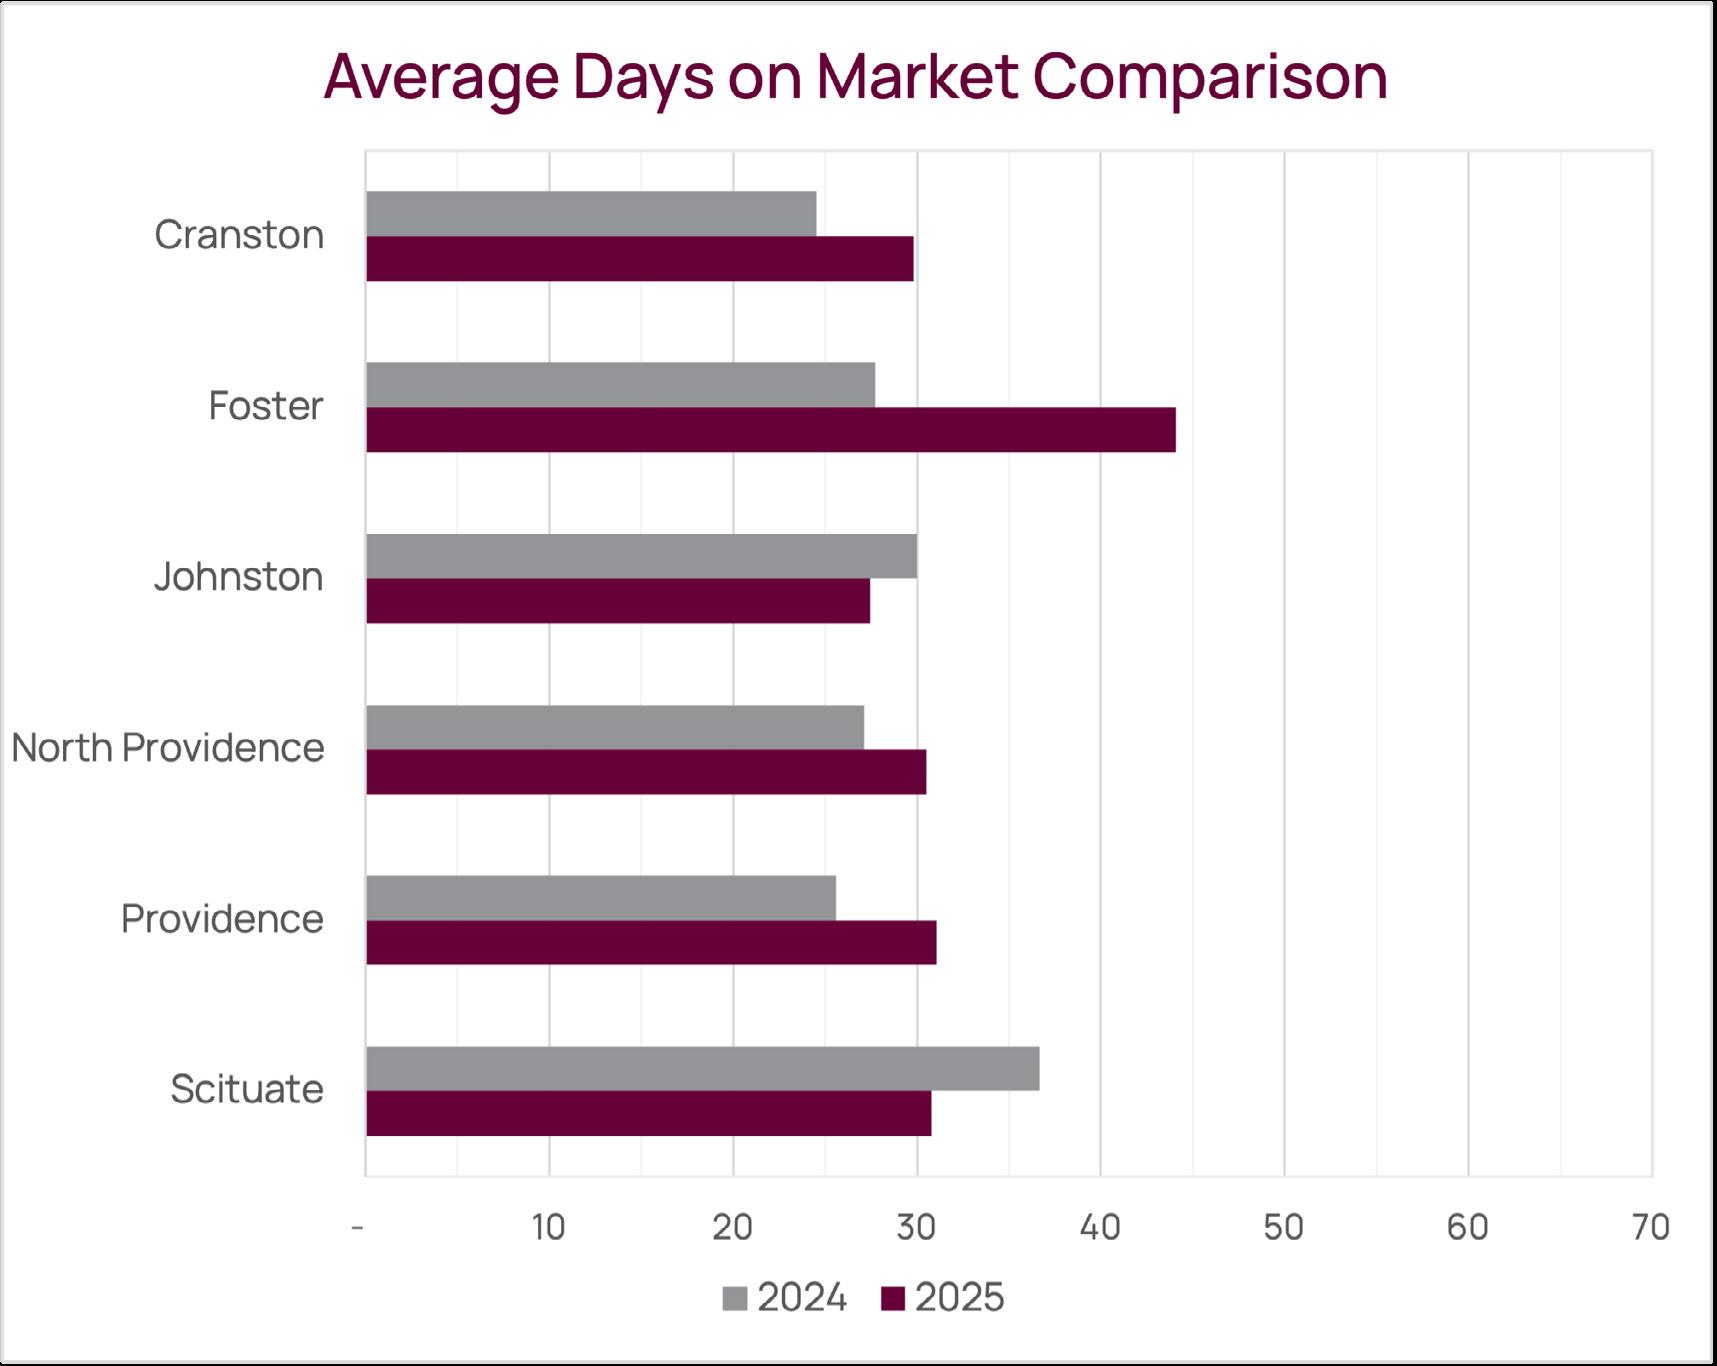
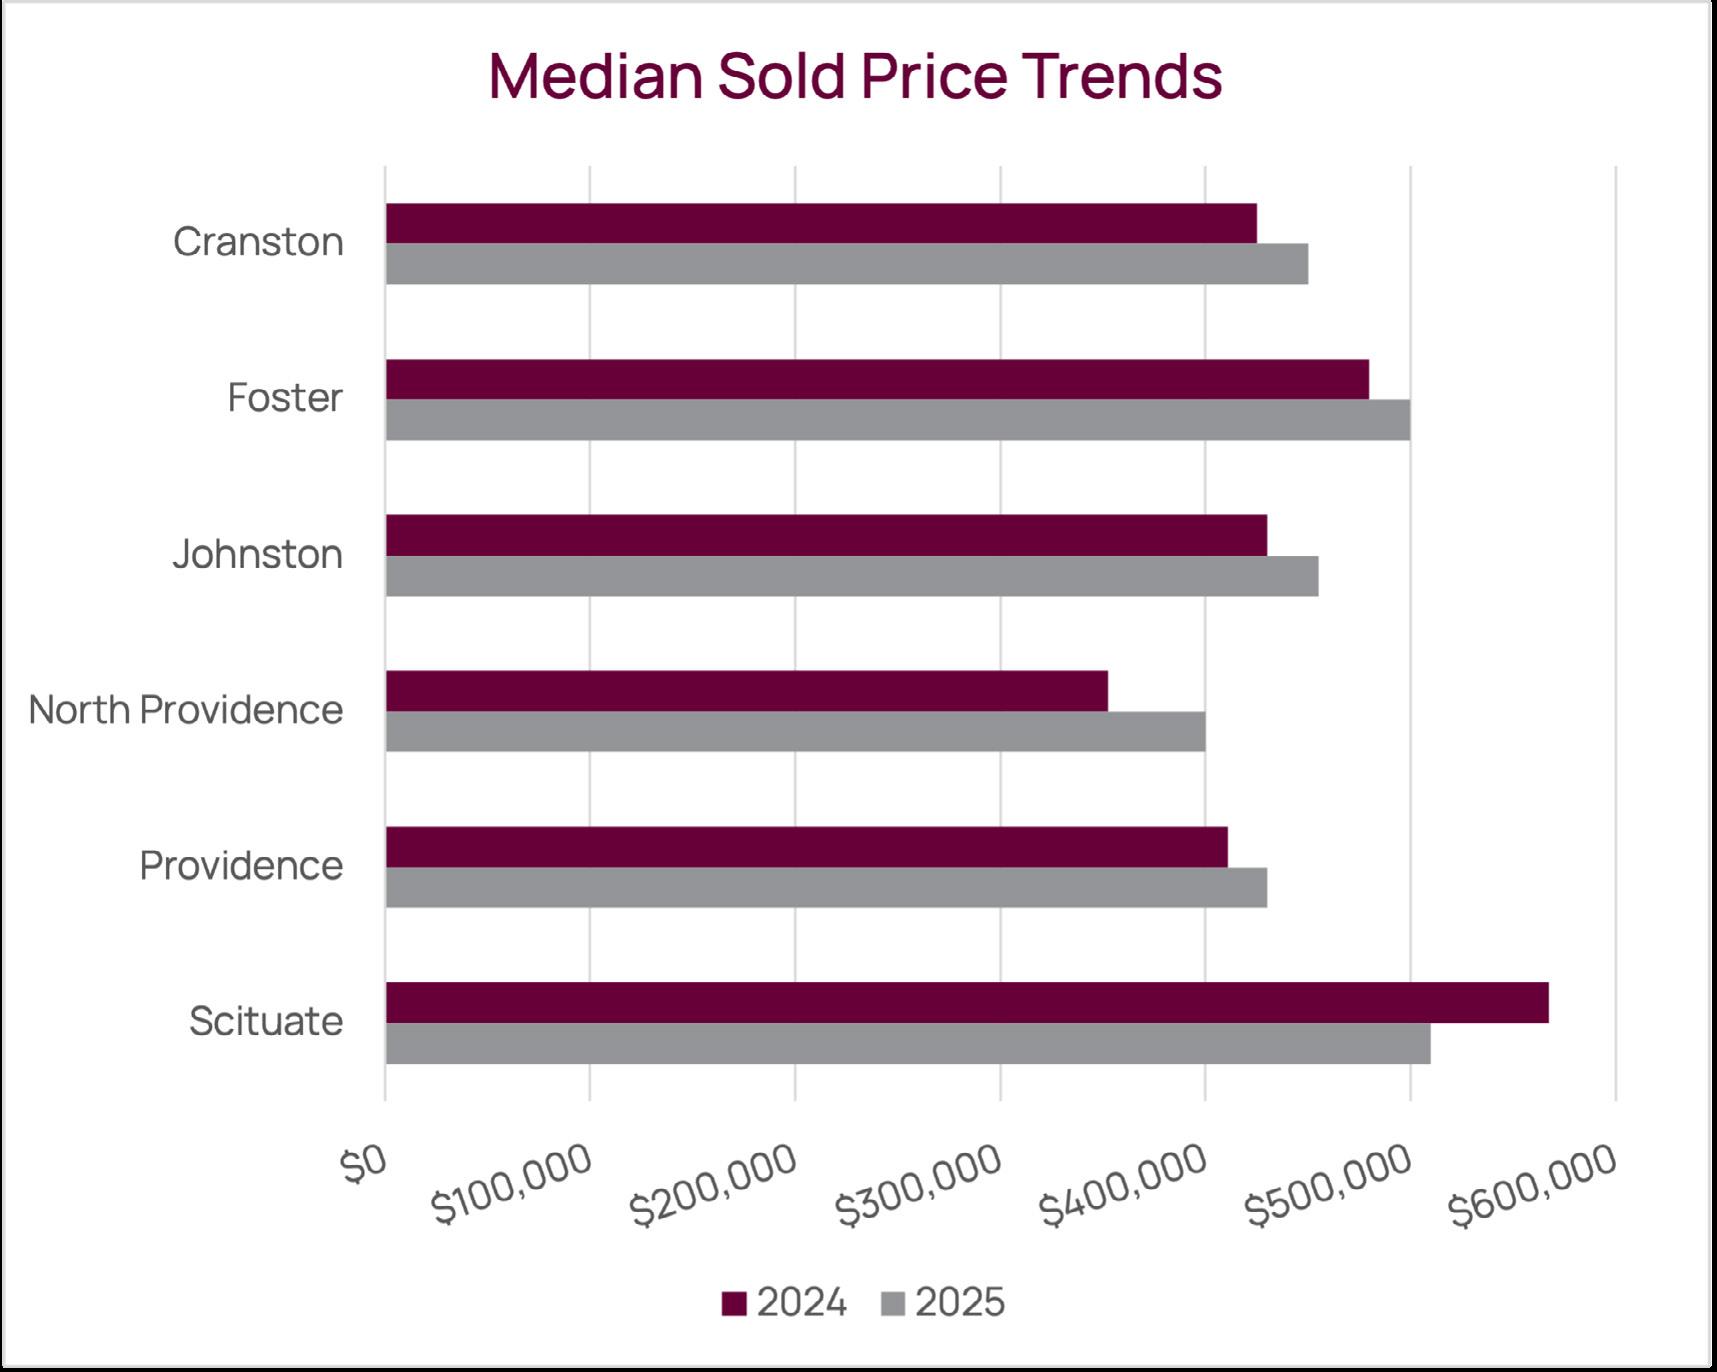
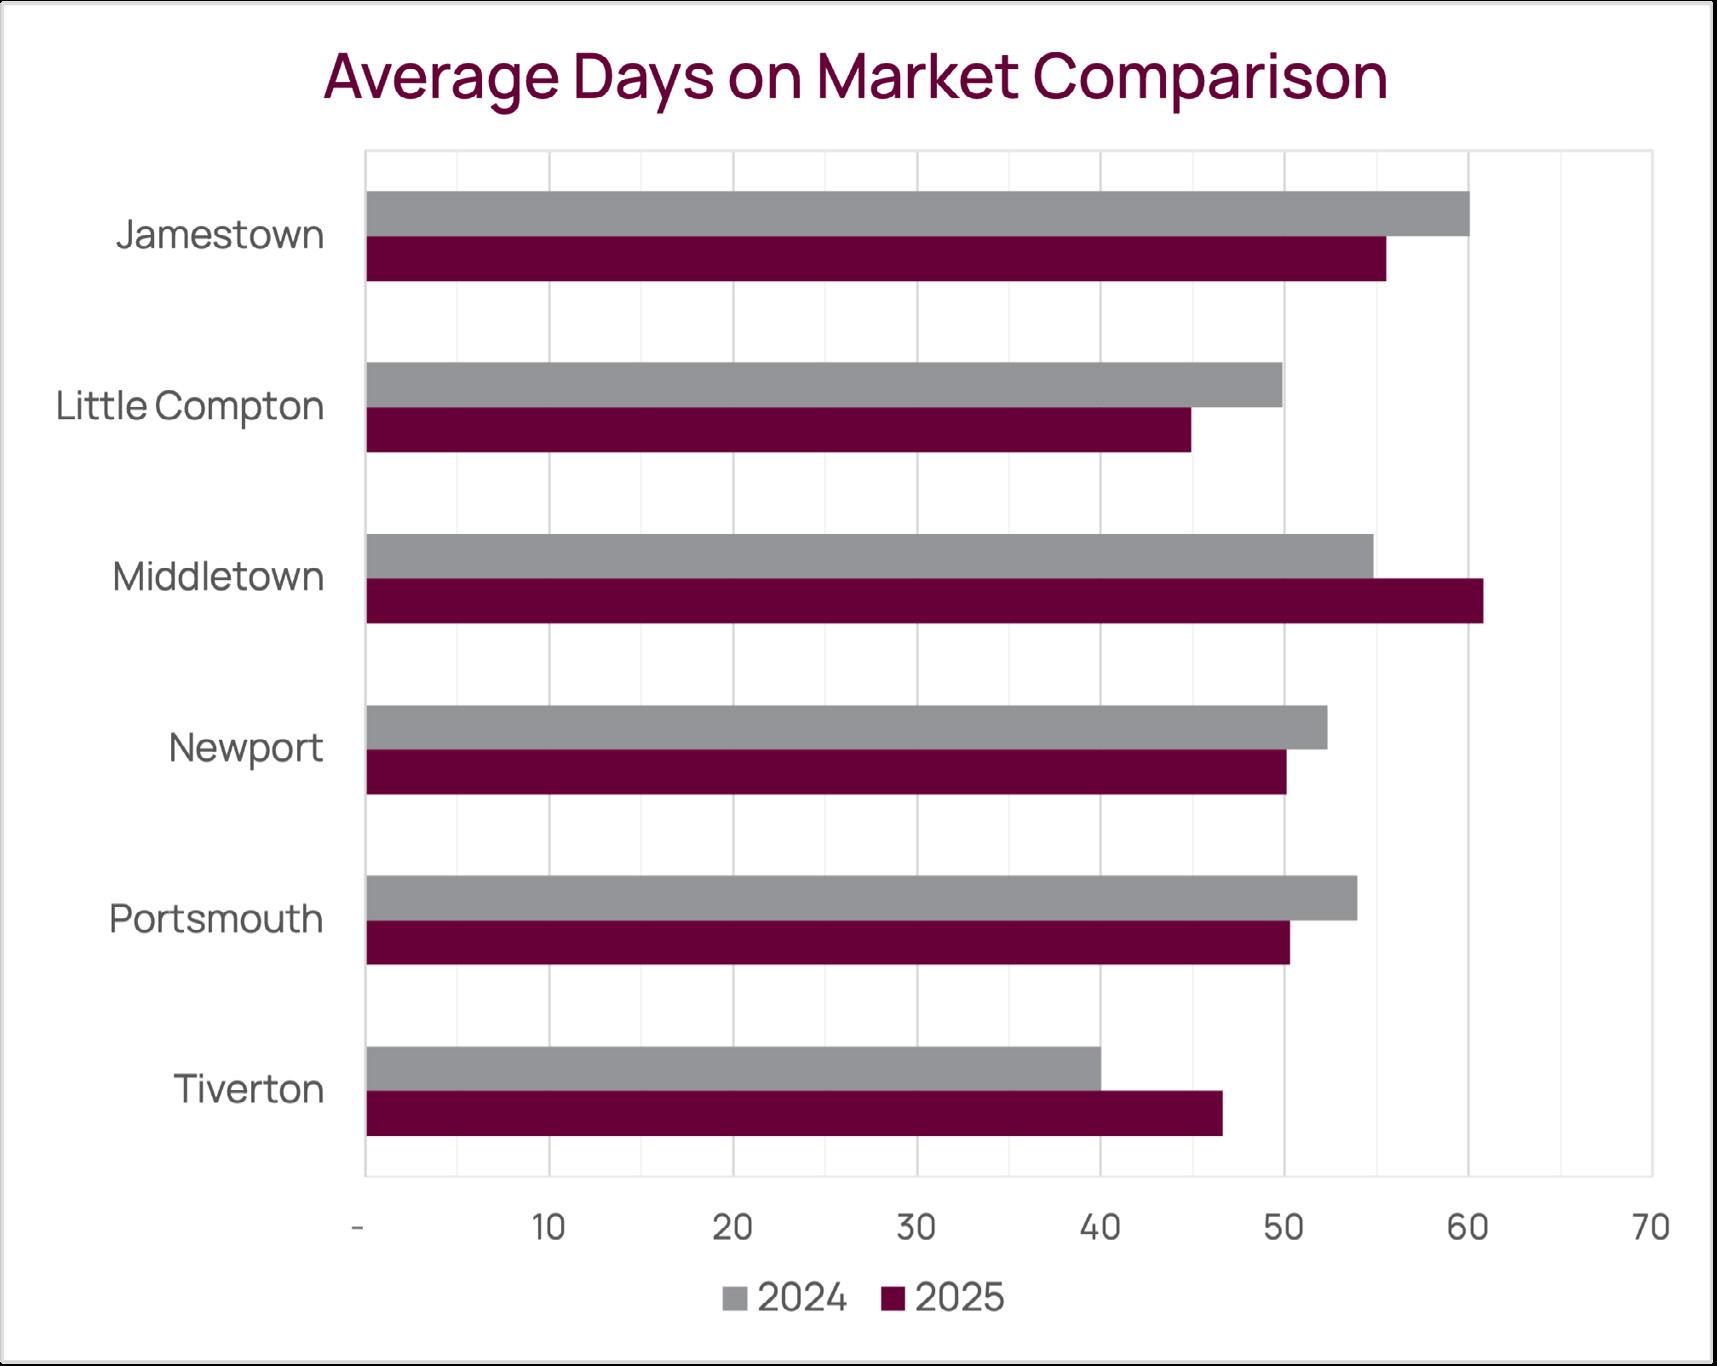
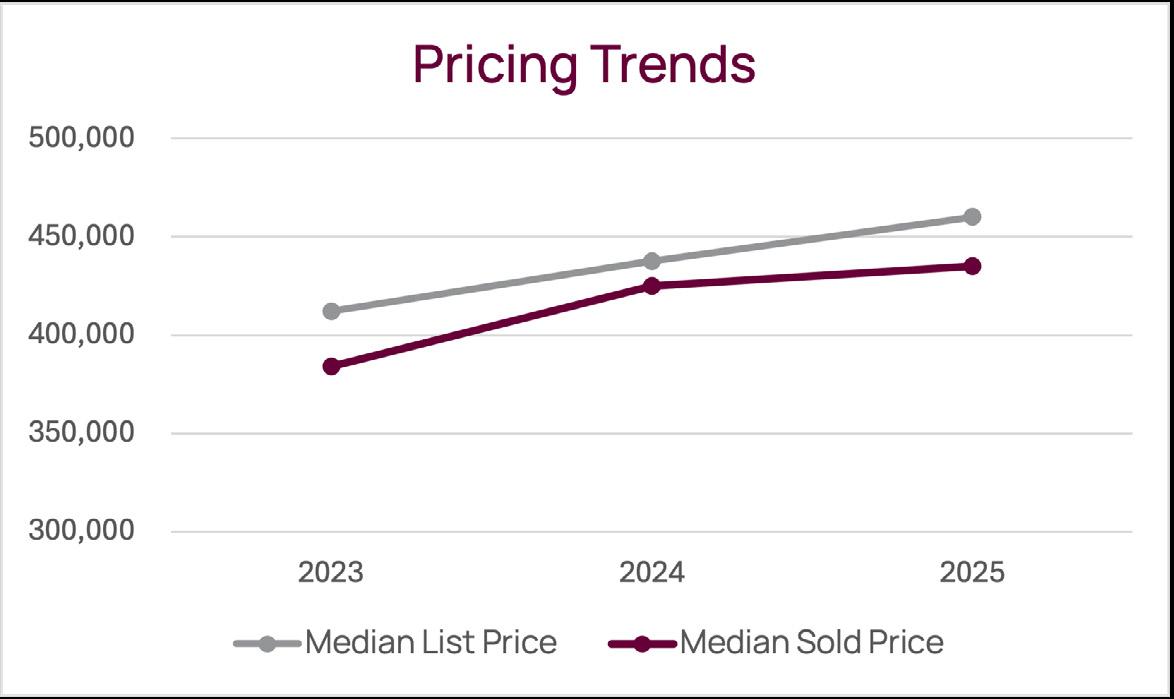
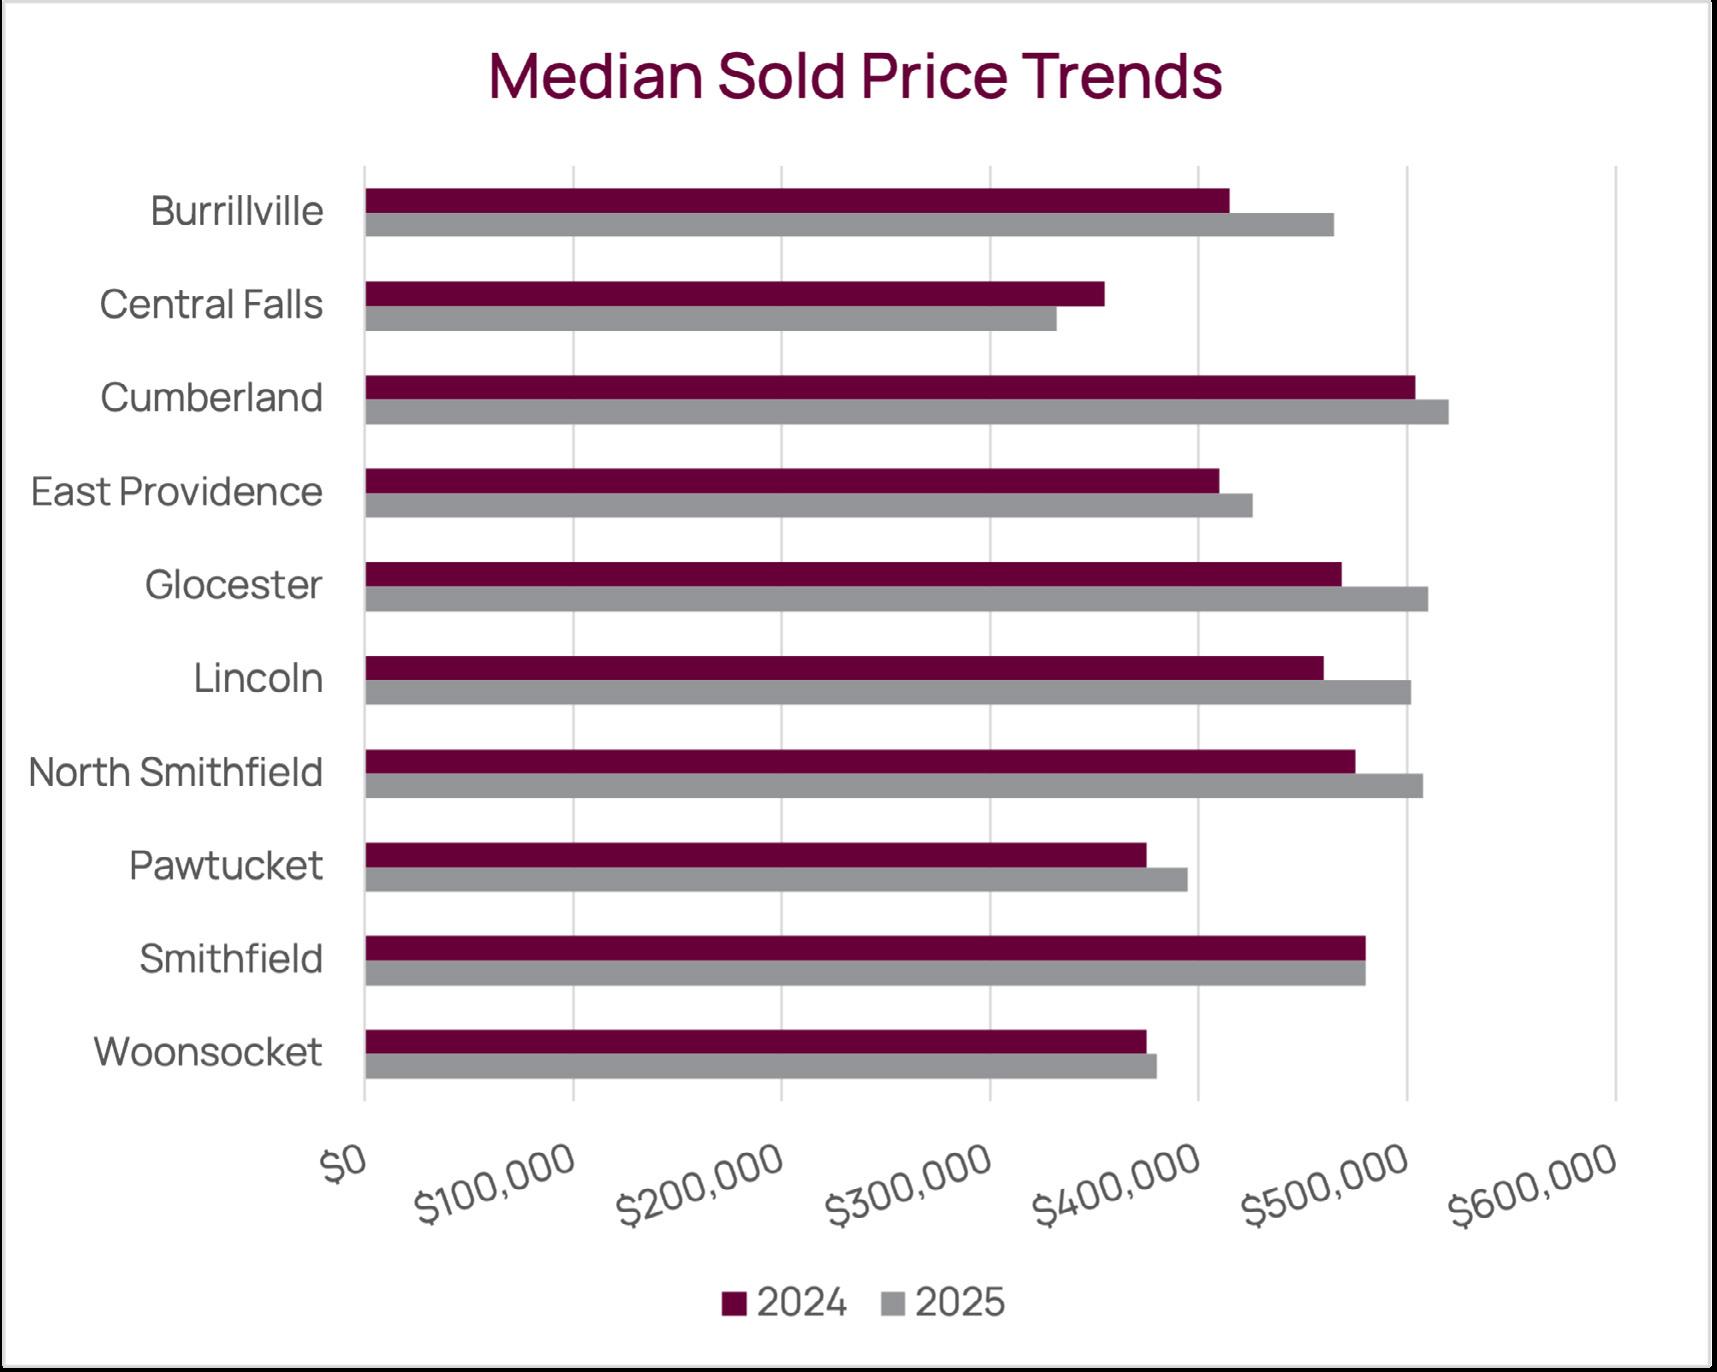
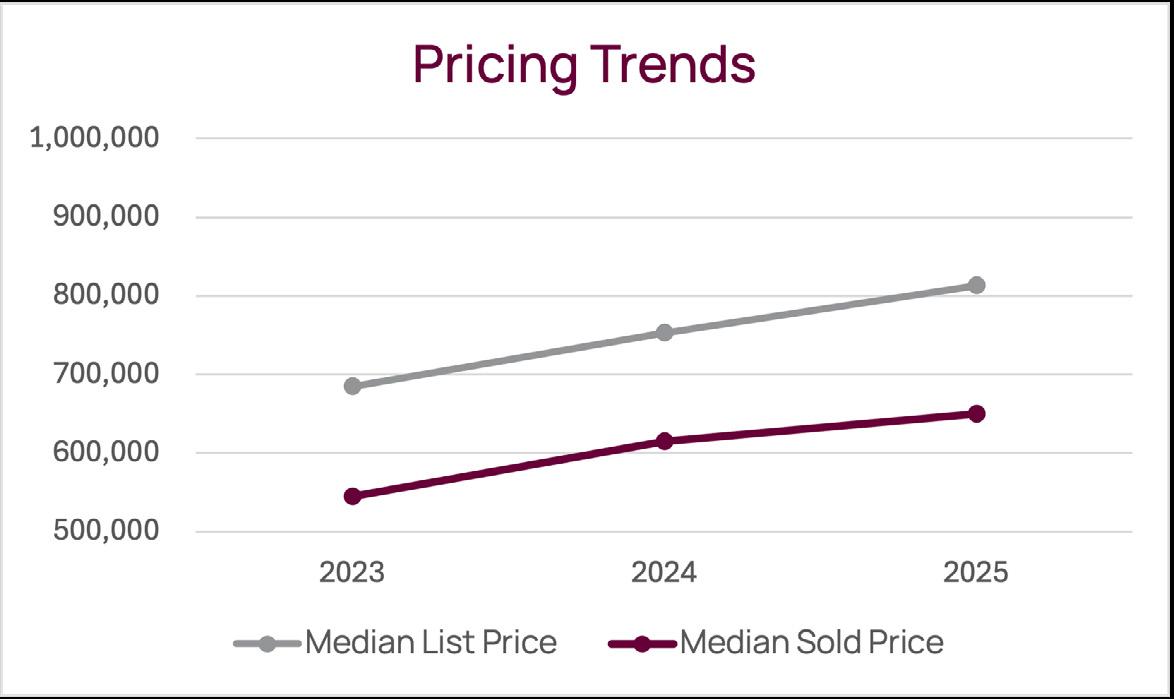
Rhode Island reflected the same underlying shift toward balance, with market performance shaped by distinct local dynamics. In Greater Providence, median sale prices increased about 6 percent to approximately $440,000, supported by steady demand across price points. Bristol County delivered one of the strongest gains in activity across our footprint, with closed sales up more than 15 percent and median pricing rising just over 5 percent to roughly $650,000. Newport County continued to move at a more deliberate pace, with homes spending about 50 days on market and inventory approaching

five months, reinforcing a market defined by selectivity rather than urgency.
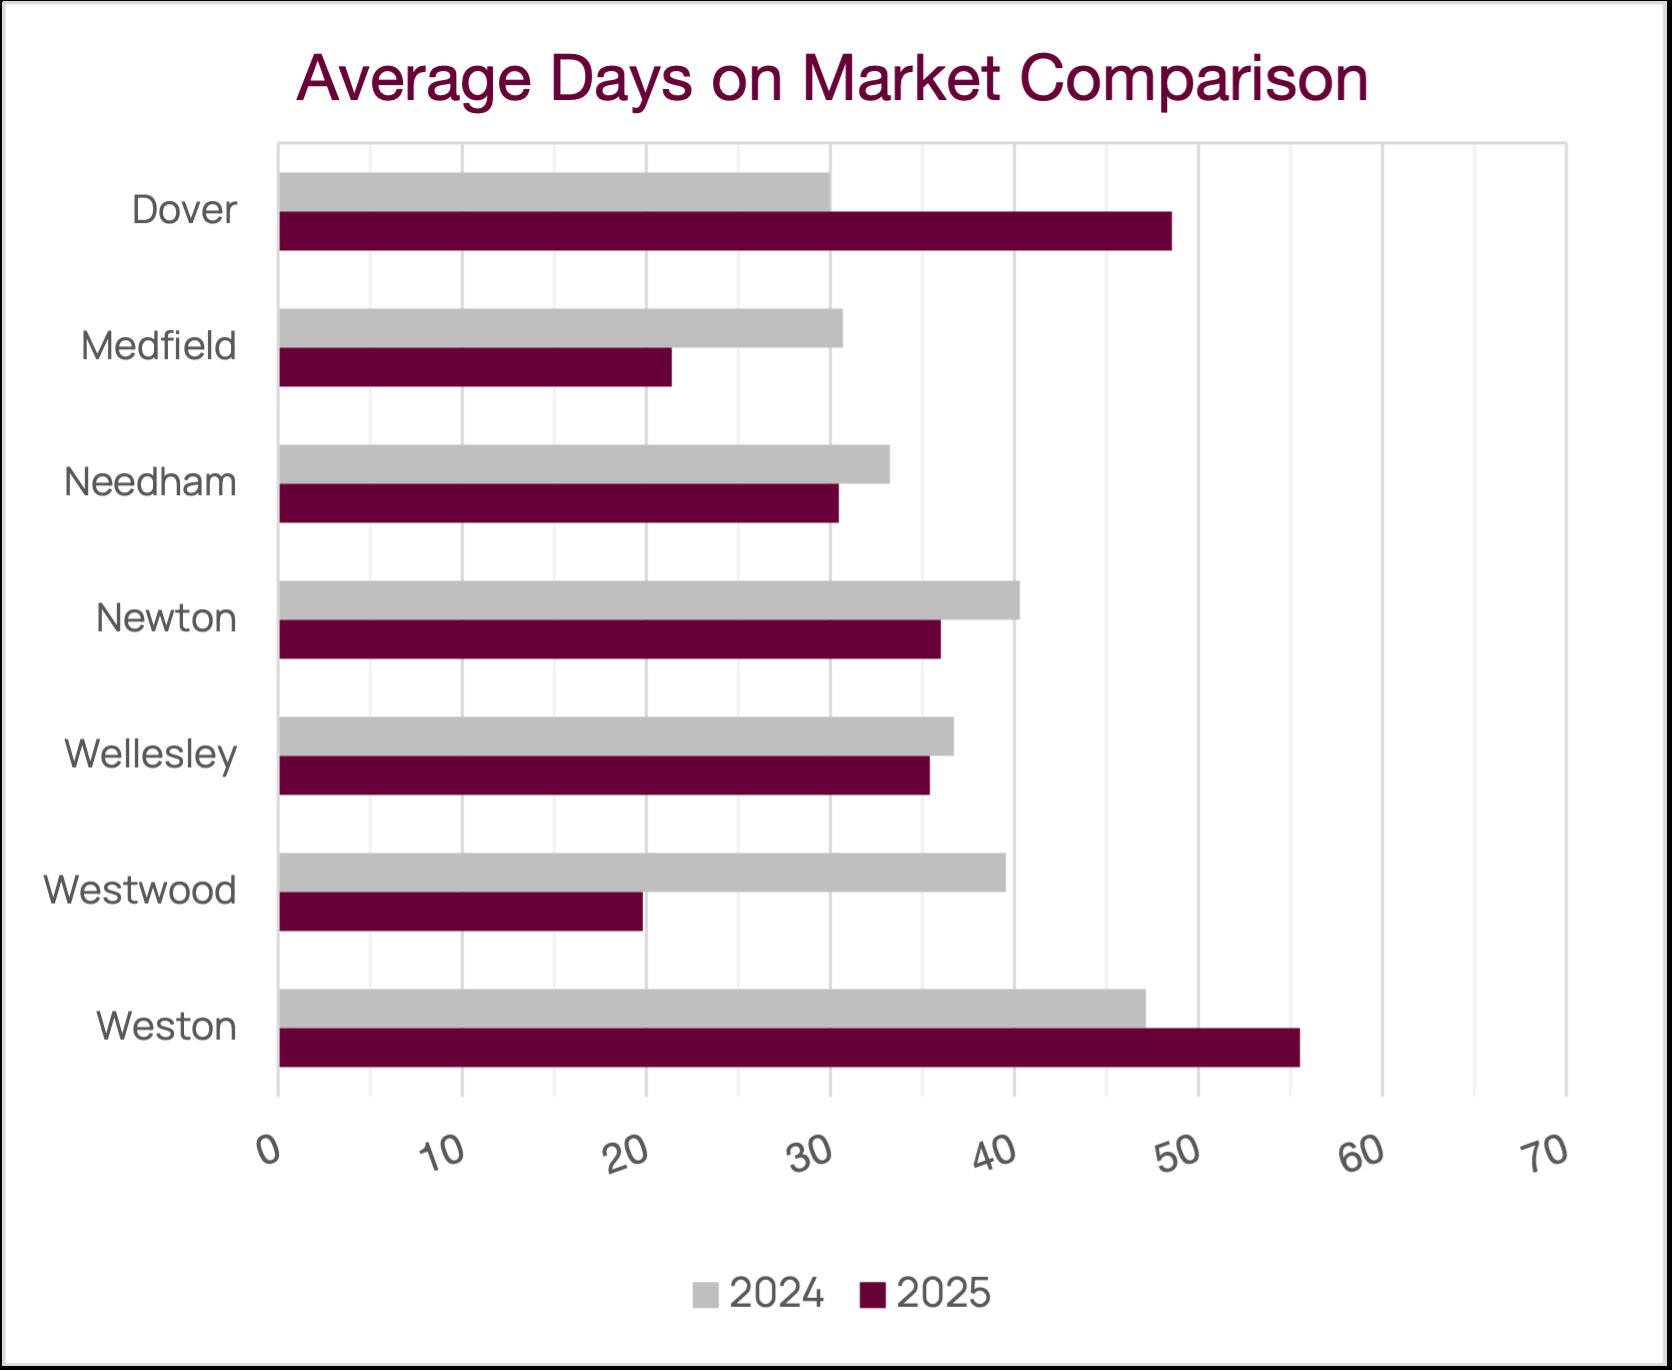
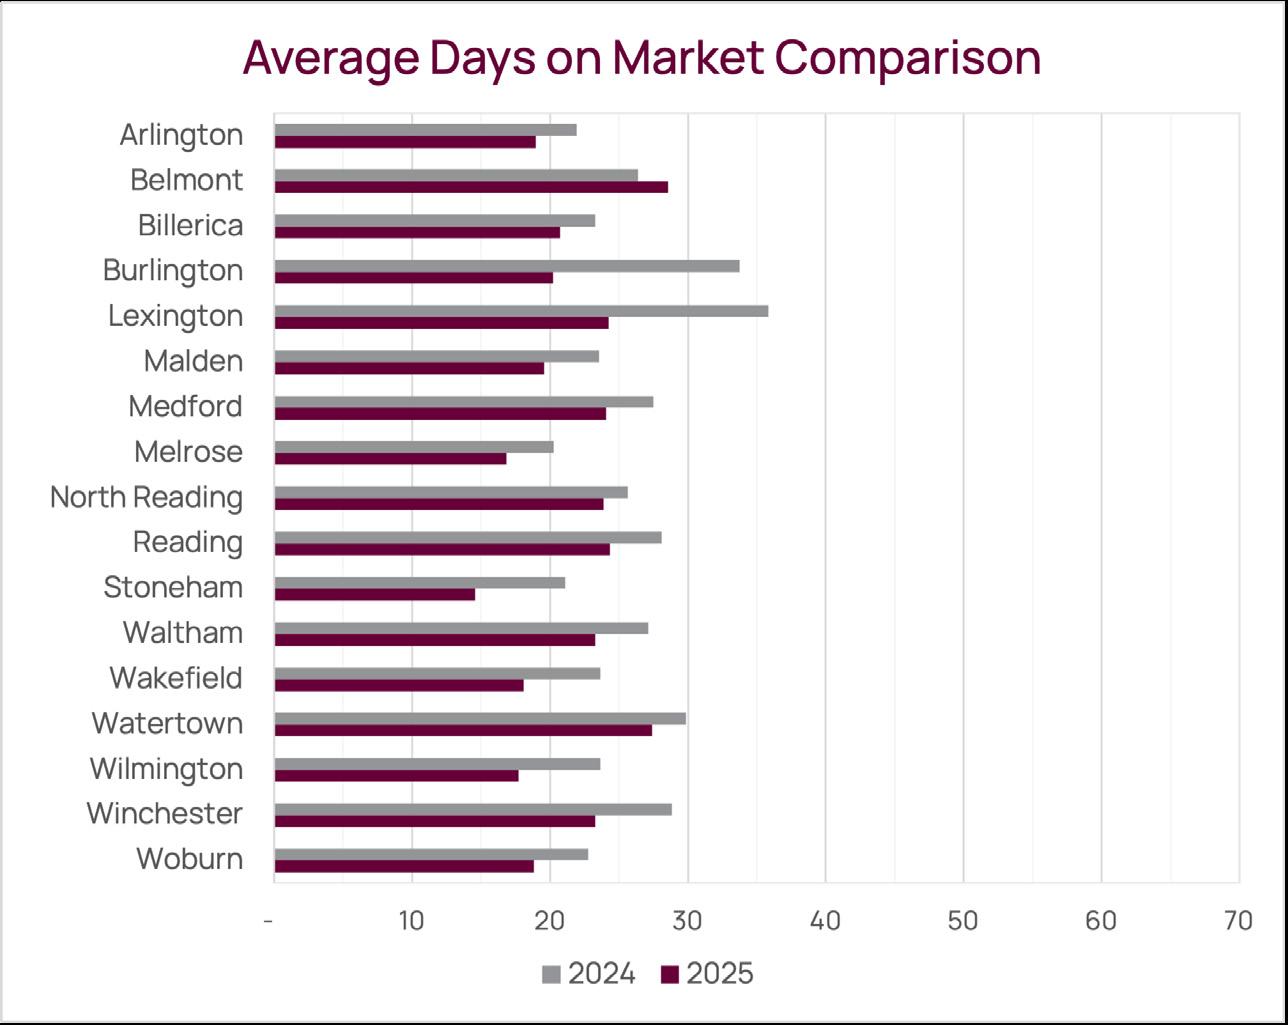
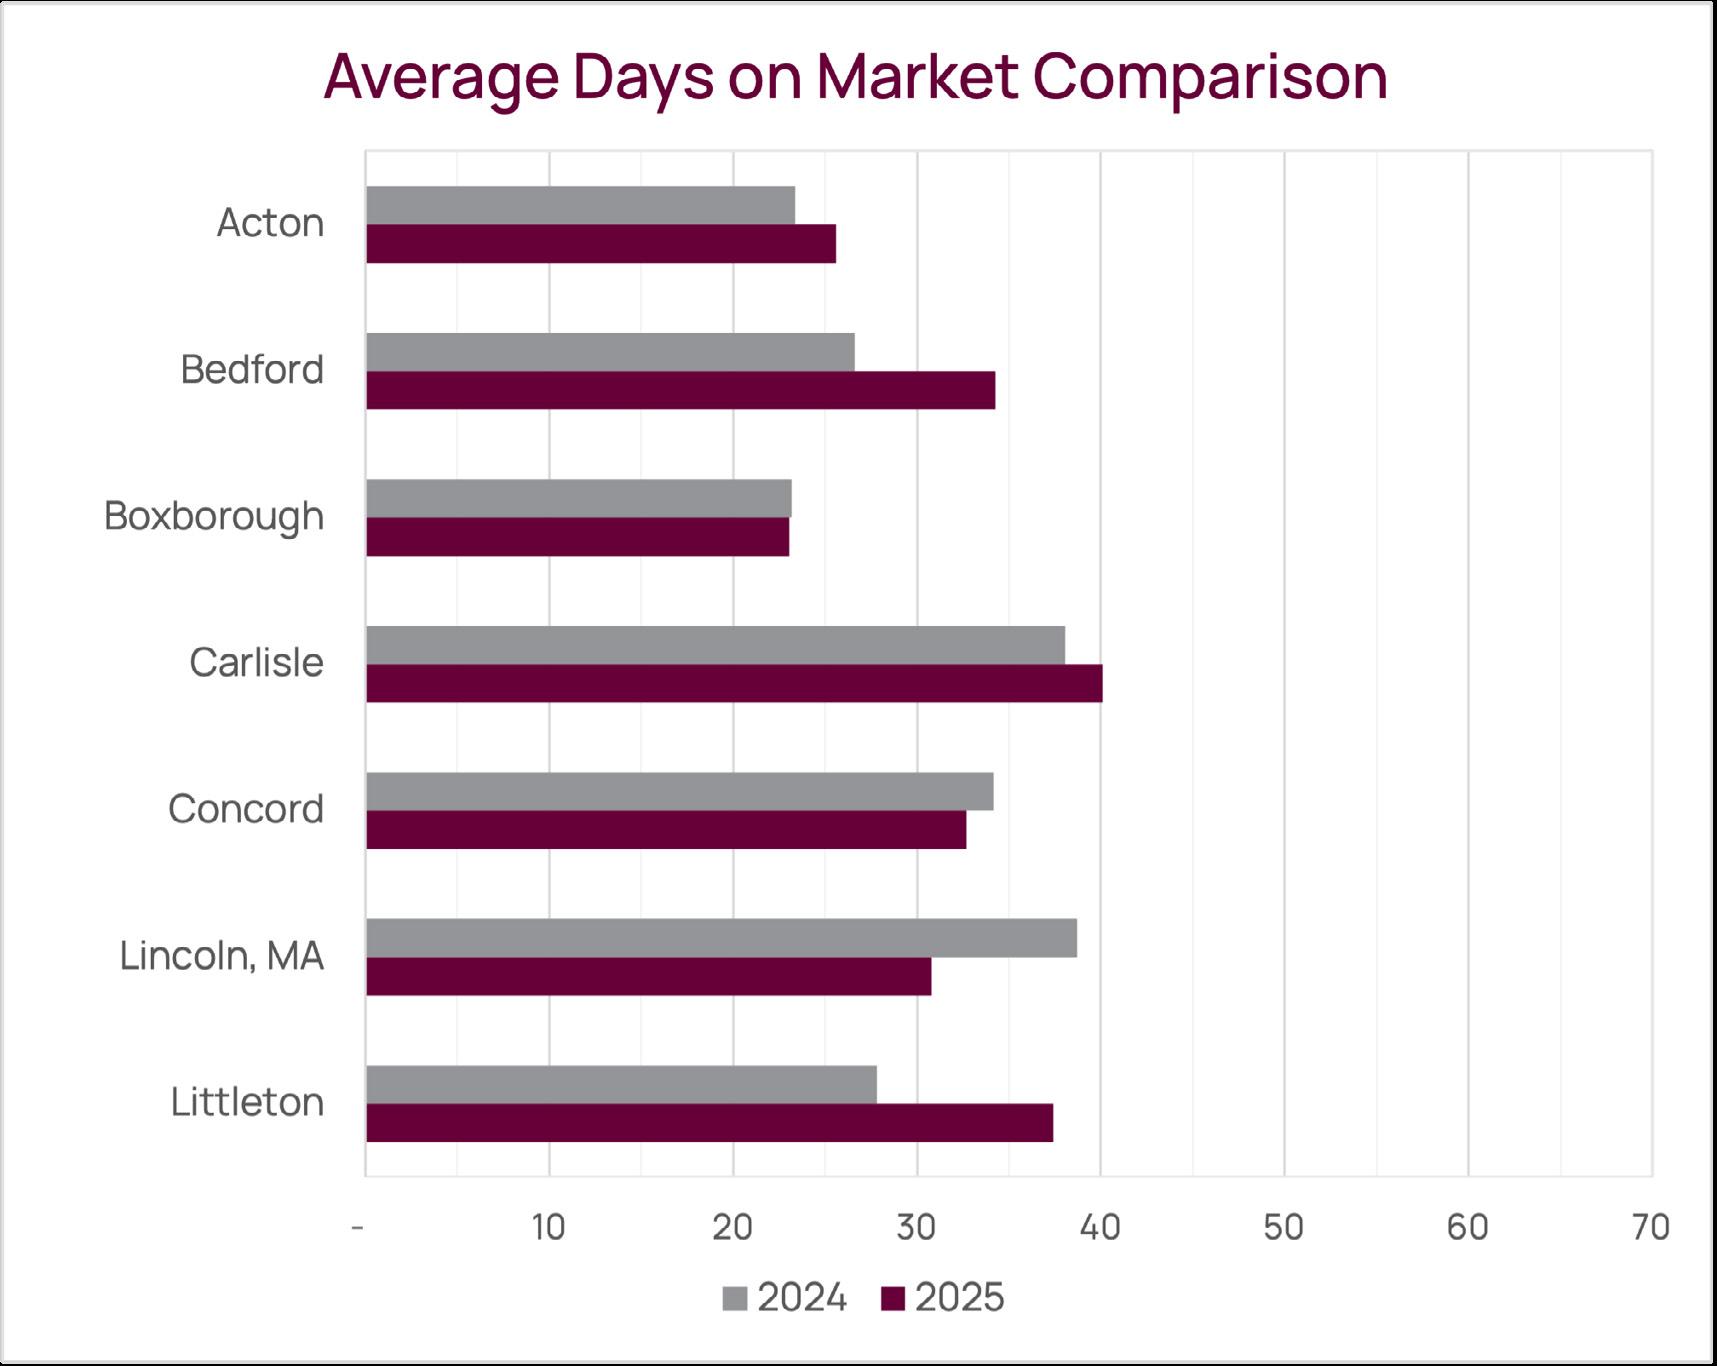
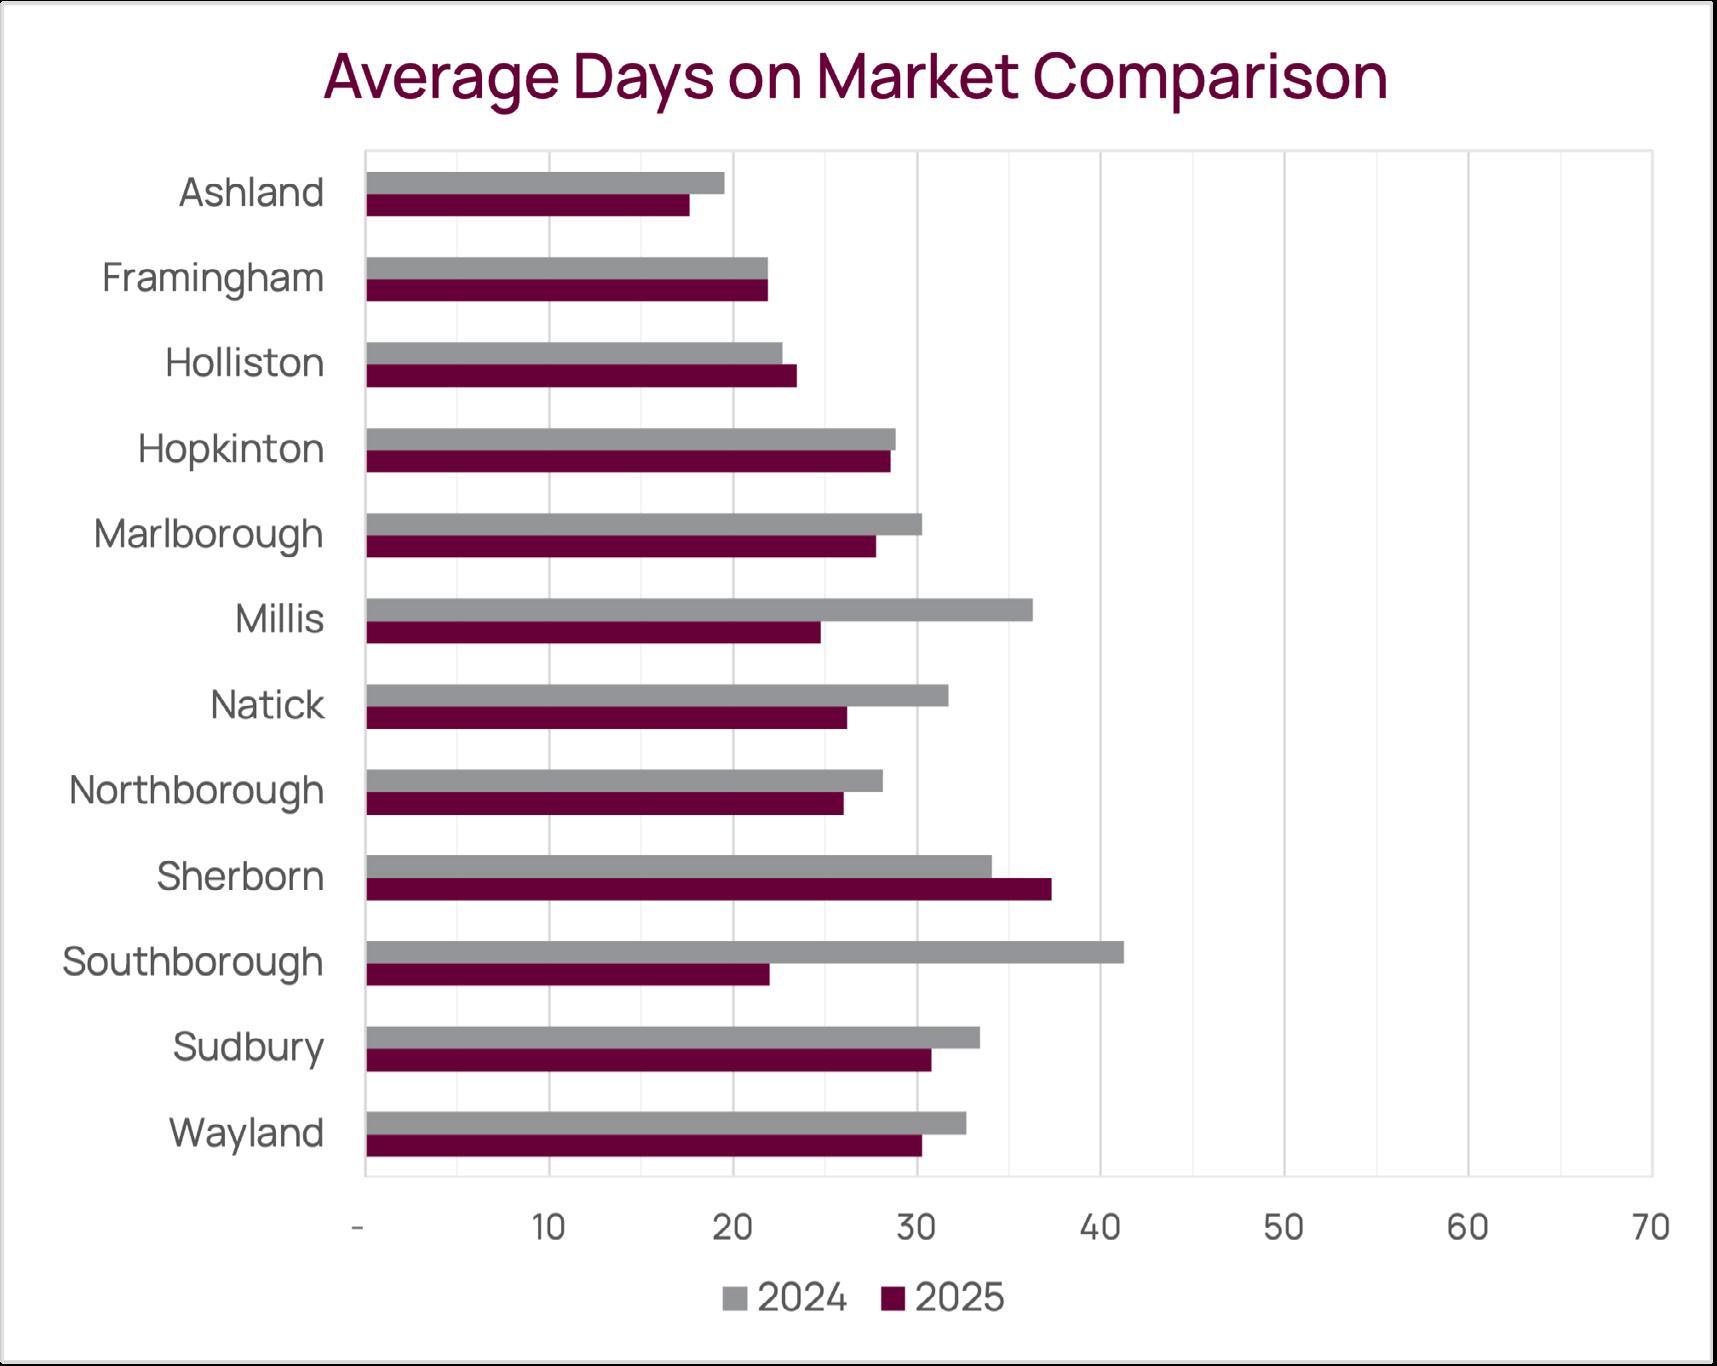
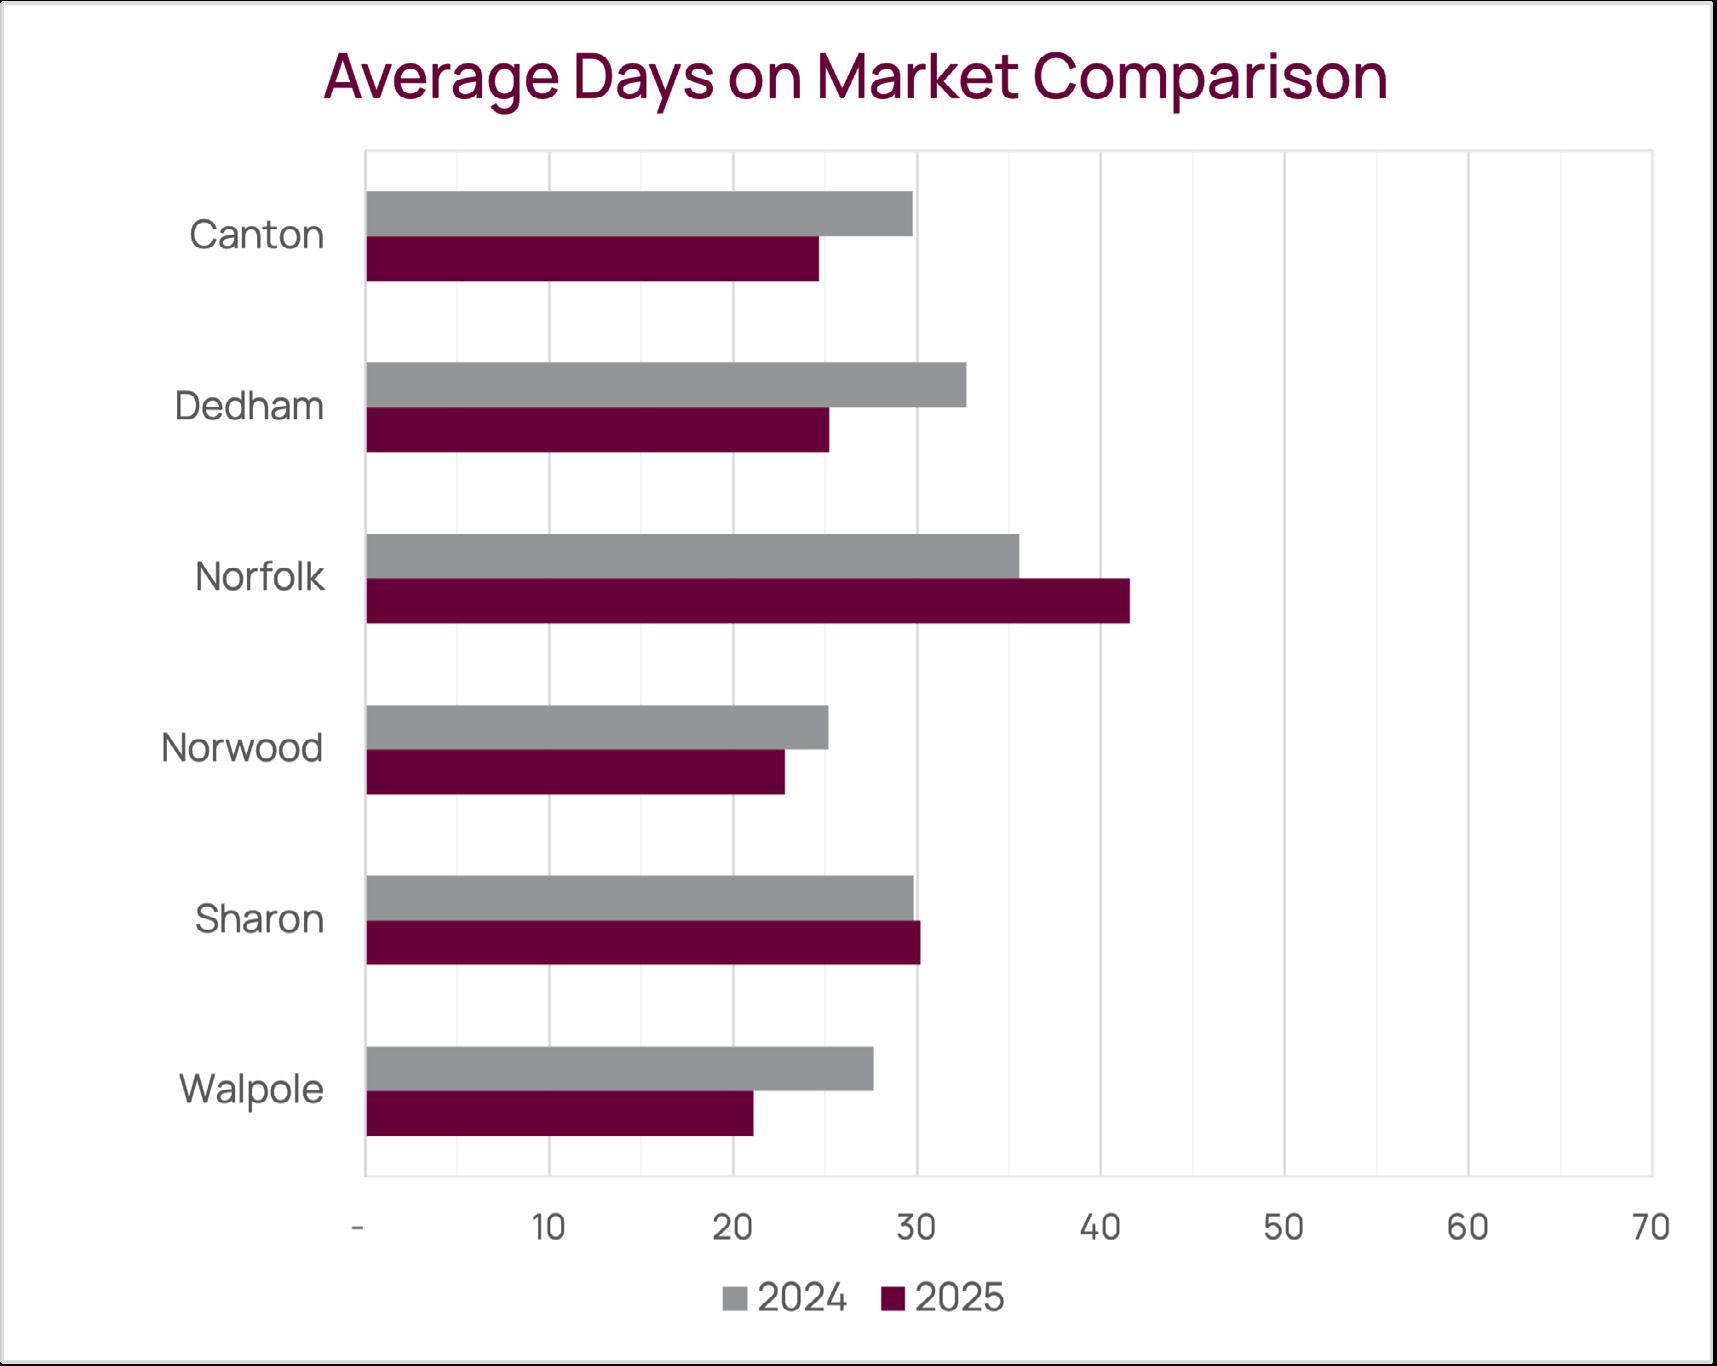
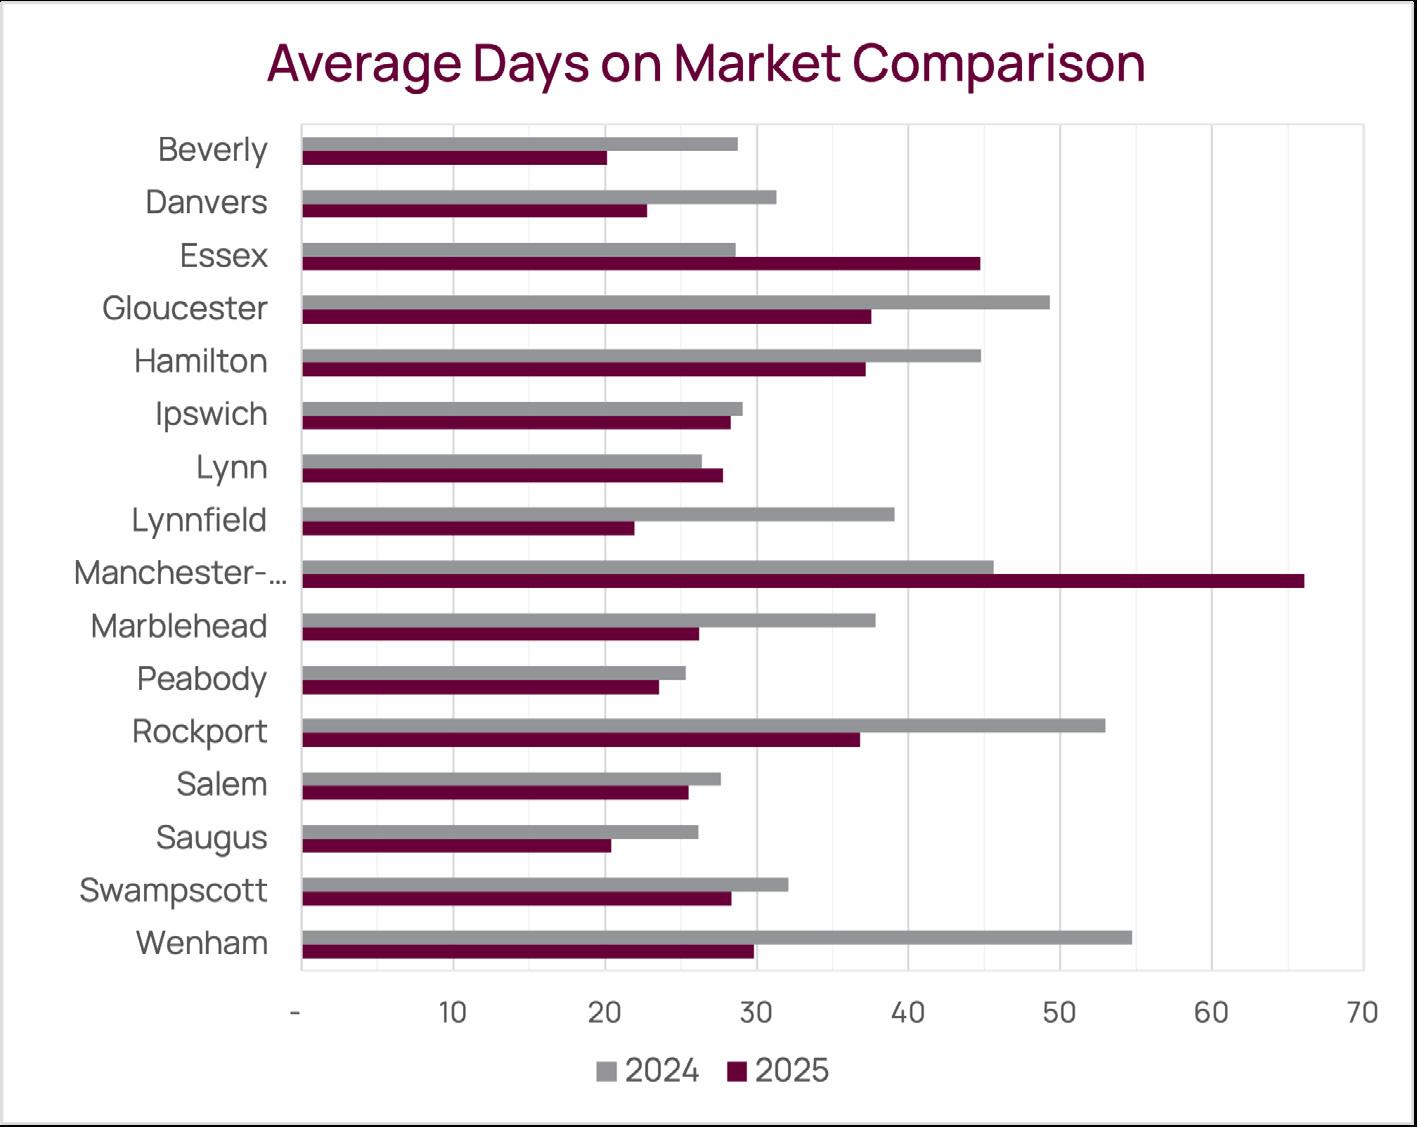
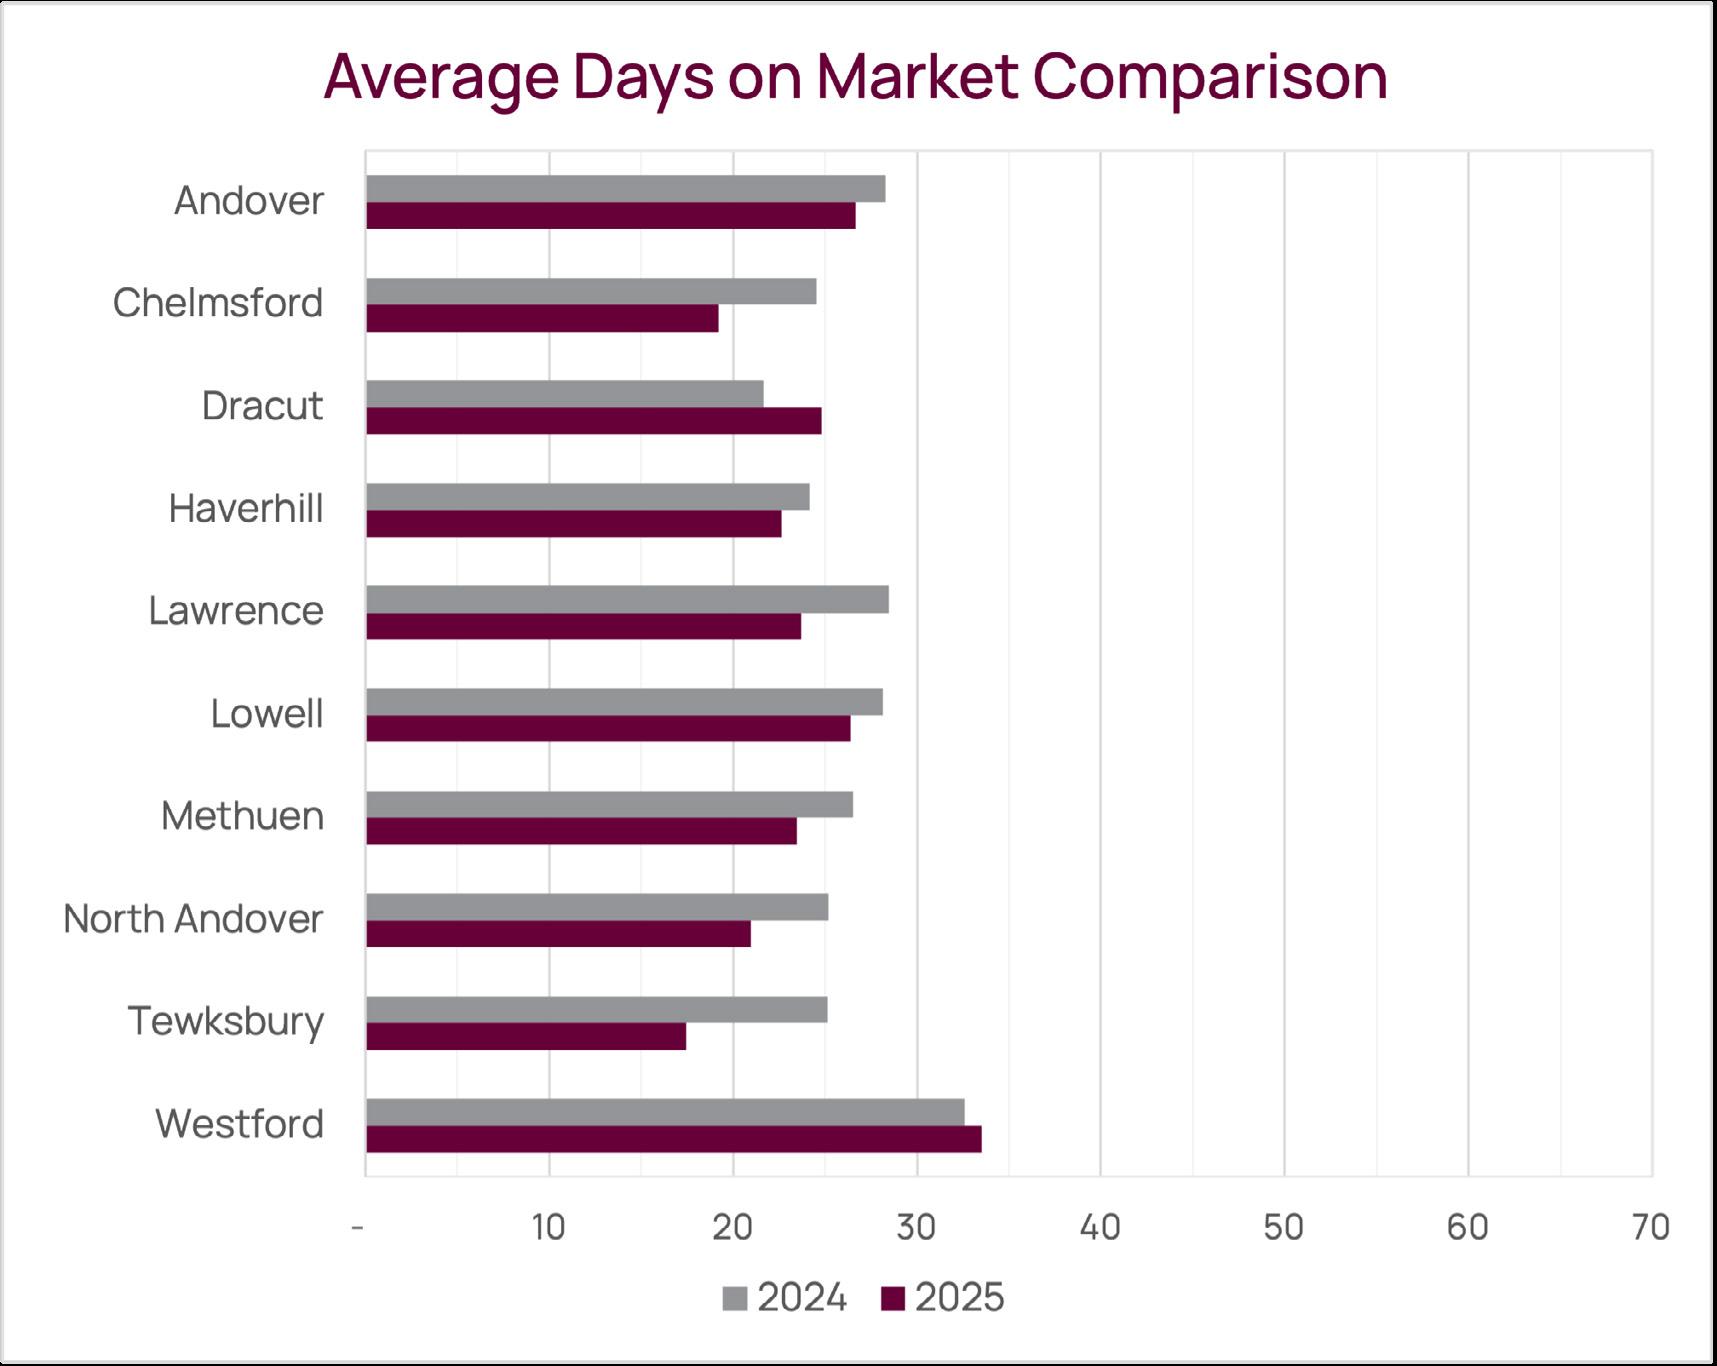
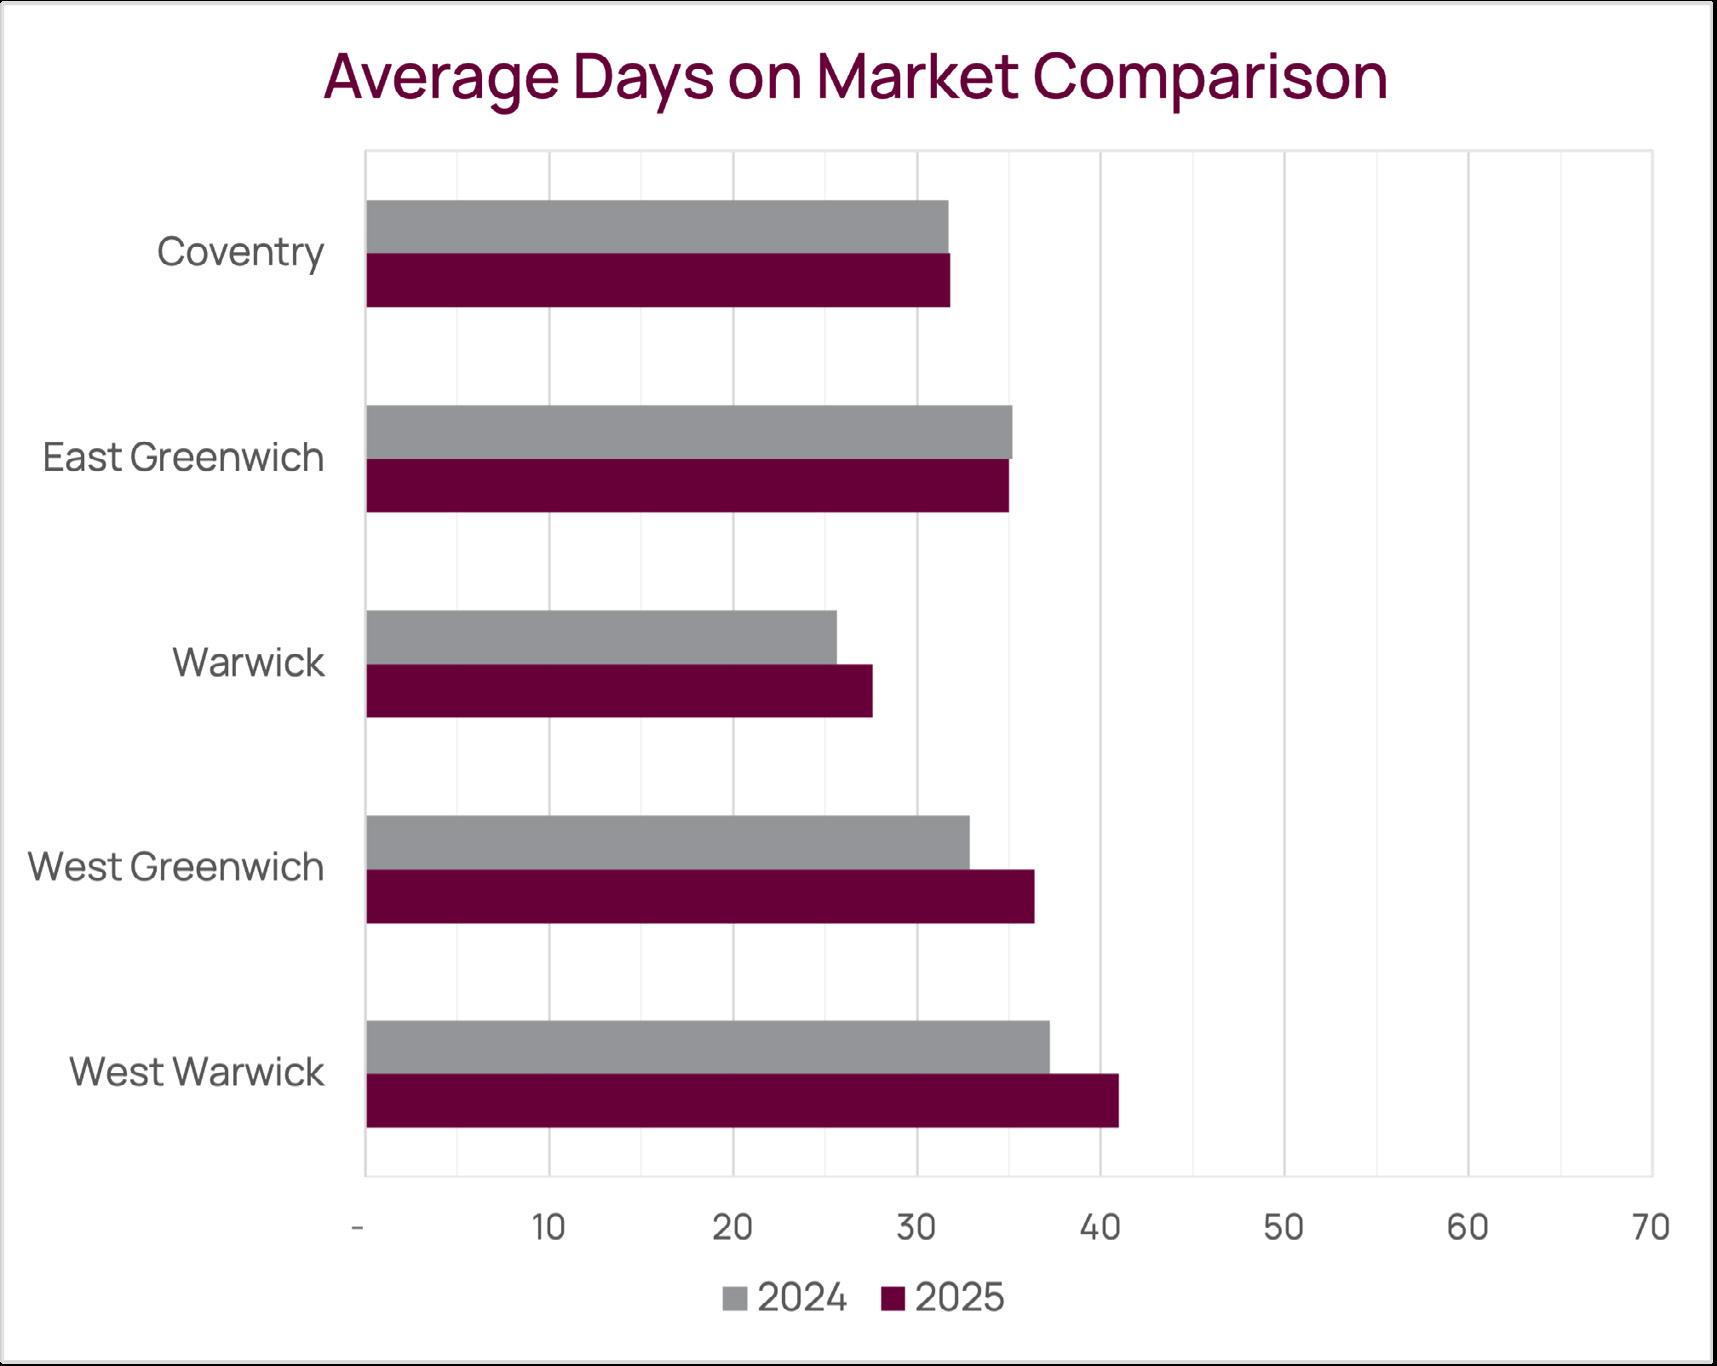
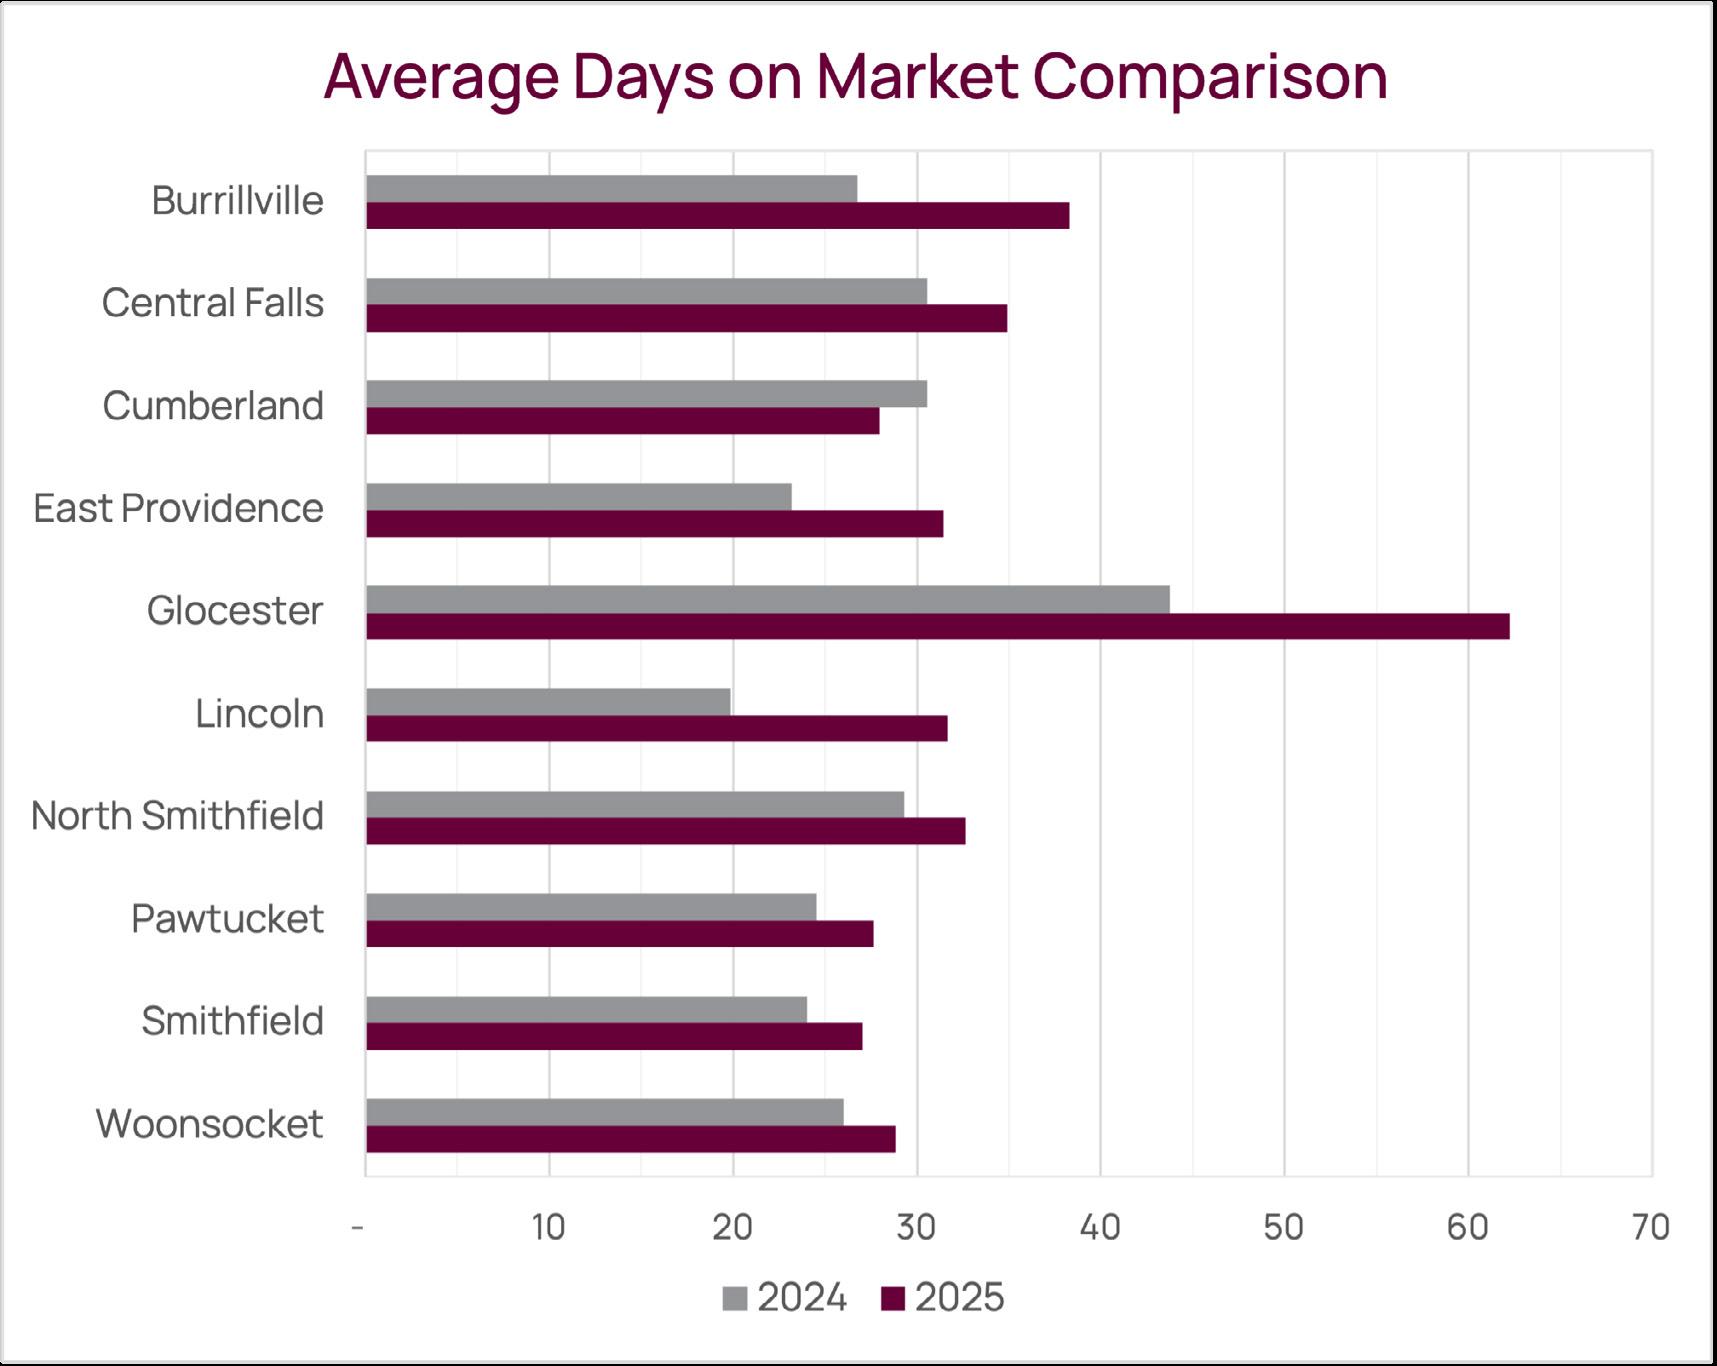
The most consequential change in 2025 was pace and leverage. Months of inventory moved higher across most regions, signaling a healthier market structure and more balanced negotiations. In MetroWest, inventory increased to just under two months, with average days on market ending the year at approximately 26 days. Boston and the Inner Suburbs offered a clear example of this same shift, with new listings rising by 12 percent and inventory approaching four months, giving buyers more choice while pricing remained broadly stable. 2025 closed as a year of normalization rather than decline. Entering 2026, the direction is clear. This market is defined less by speed and more by preparation, pricing accuracy, and realistic expectations. Demand remains present, but it is more selective, and results increasingly reflect how well a property aligns with today’s Buyers.
This is the kind of market that rewards experience, local insight, and disciplined guidance, values that continue to shape how we advise clients and serve our communities across every market we operate.

George Patsio Managing Partner
The number of homes that were listed for sale during the reporting period. A good indicator of inventory coming onto the market.
The number of homes that sold and completed the closing process during the reporting period.
The average number of days it took for sold homes to go under contract. A shorter DOM typically signals higher buyer demand.
The number of months it would take to sell all active listings at the current pace of sales.
• 6+ months typically signals a buyer’s market
• Less than 6 months typically signals a seller’s market
Absorption Rate
The rate at which homes are selling, expressed as a percentage of available inventory sold in a given time period. A higher rate means homes are selling quickly.
The number of homes currently for sale, along with the median asking price of those listings. This helps indicate current seller expectations.
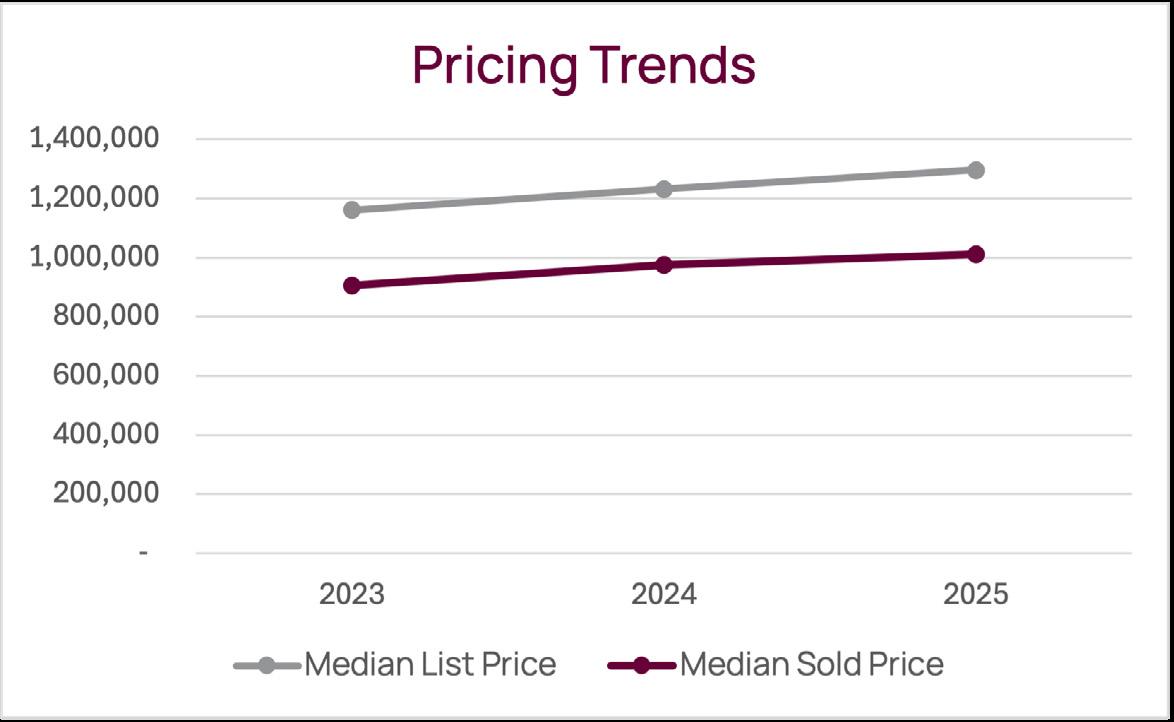
The middle price of all homes sold. Half of the homes sold above this price, and half sold below. This helps indicate overall market trends.
The final sale price compared to the original list price, shown as a percentage.
• 100% means homes are selling at asking price
• Above 100% means over-asking
• Below 100% means buyers are negotiating price reductions
The median sale price divided by the square footage of each property. It shows how much buyers are paying per square foot of living space.


Single Family Homes, Condominiums
$1,008,521
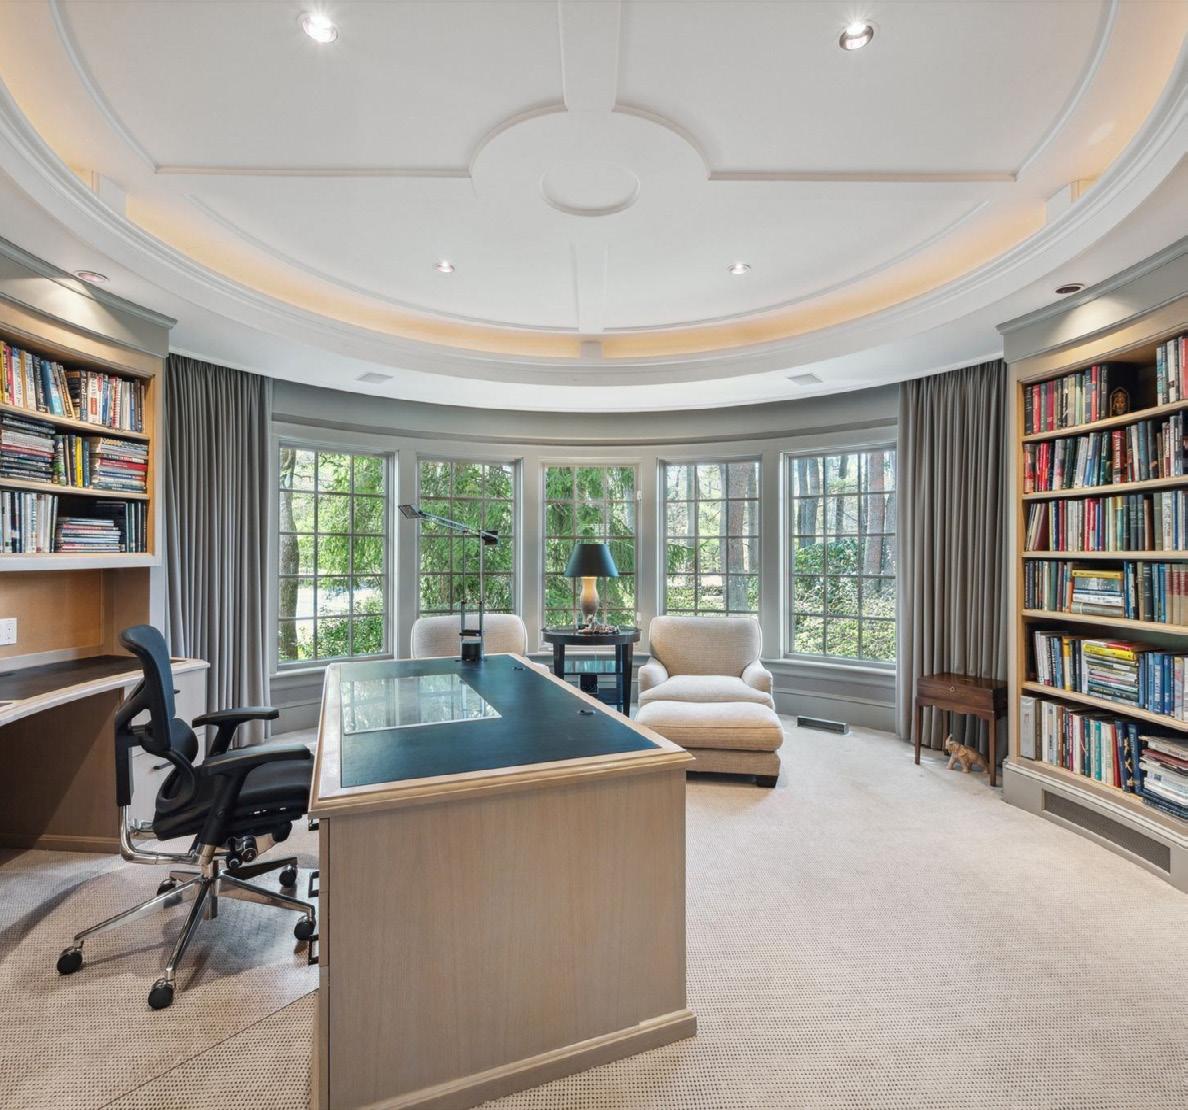
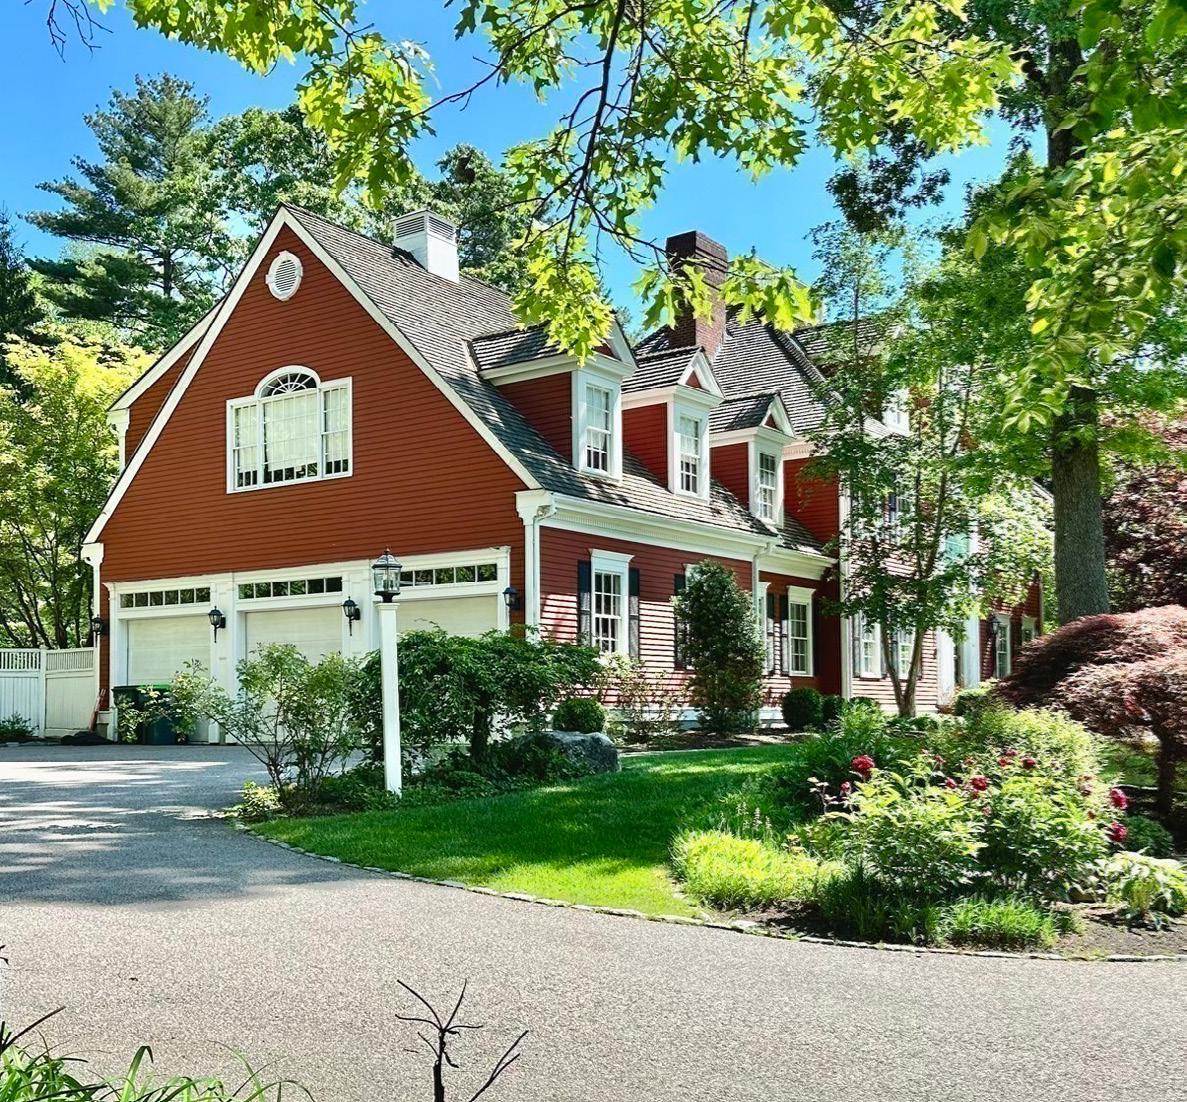
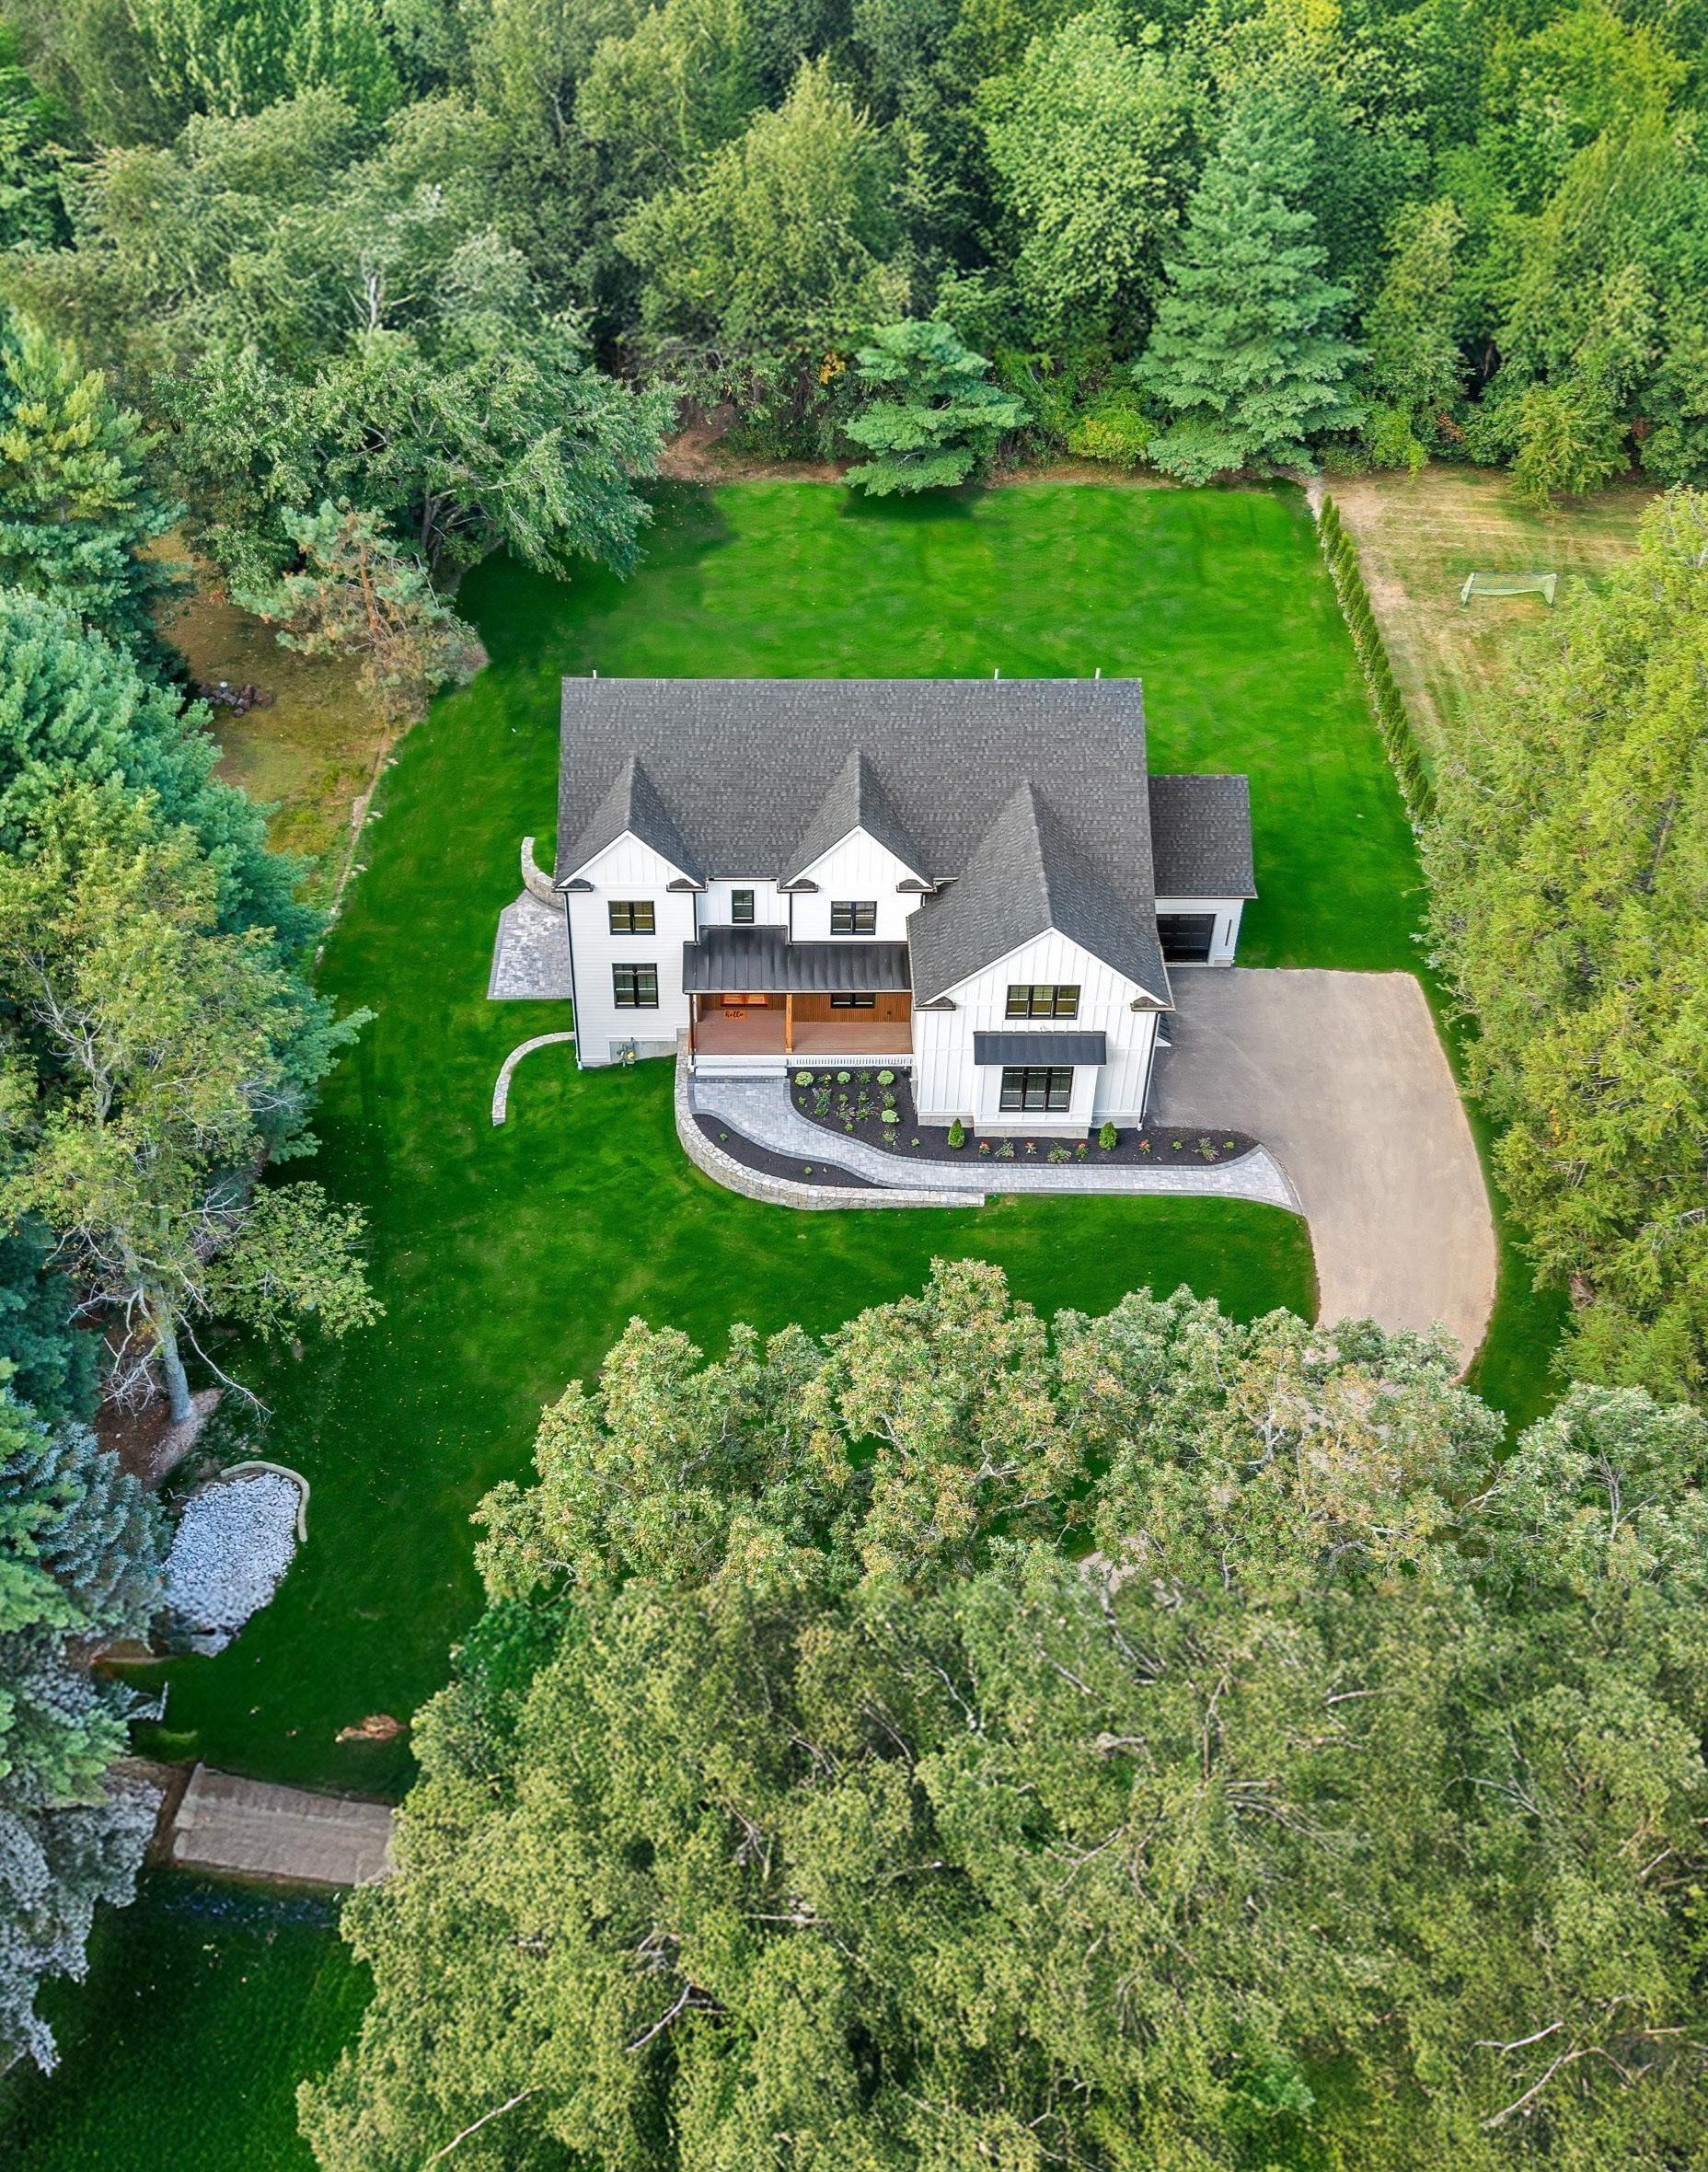
86 BUTTERNUT CIR, CONCORD See similar listings
Single Family Homes, Condominiums
Single Family Homes, Condominiums
23 EVERETT ST, NATICK See similar listings
Single Family Homes, Condominiums
$1,712,125
$1,166,820 $1,120,542 $1,000,000 $1,130,000
See similar listings
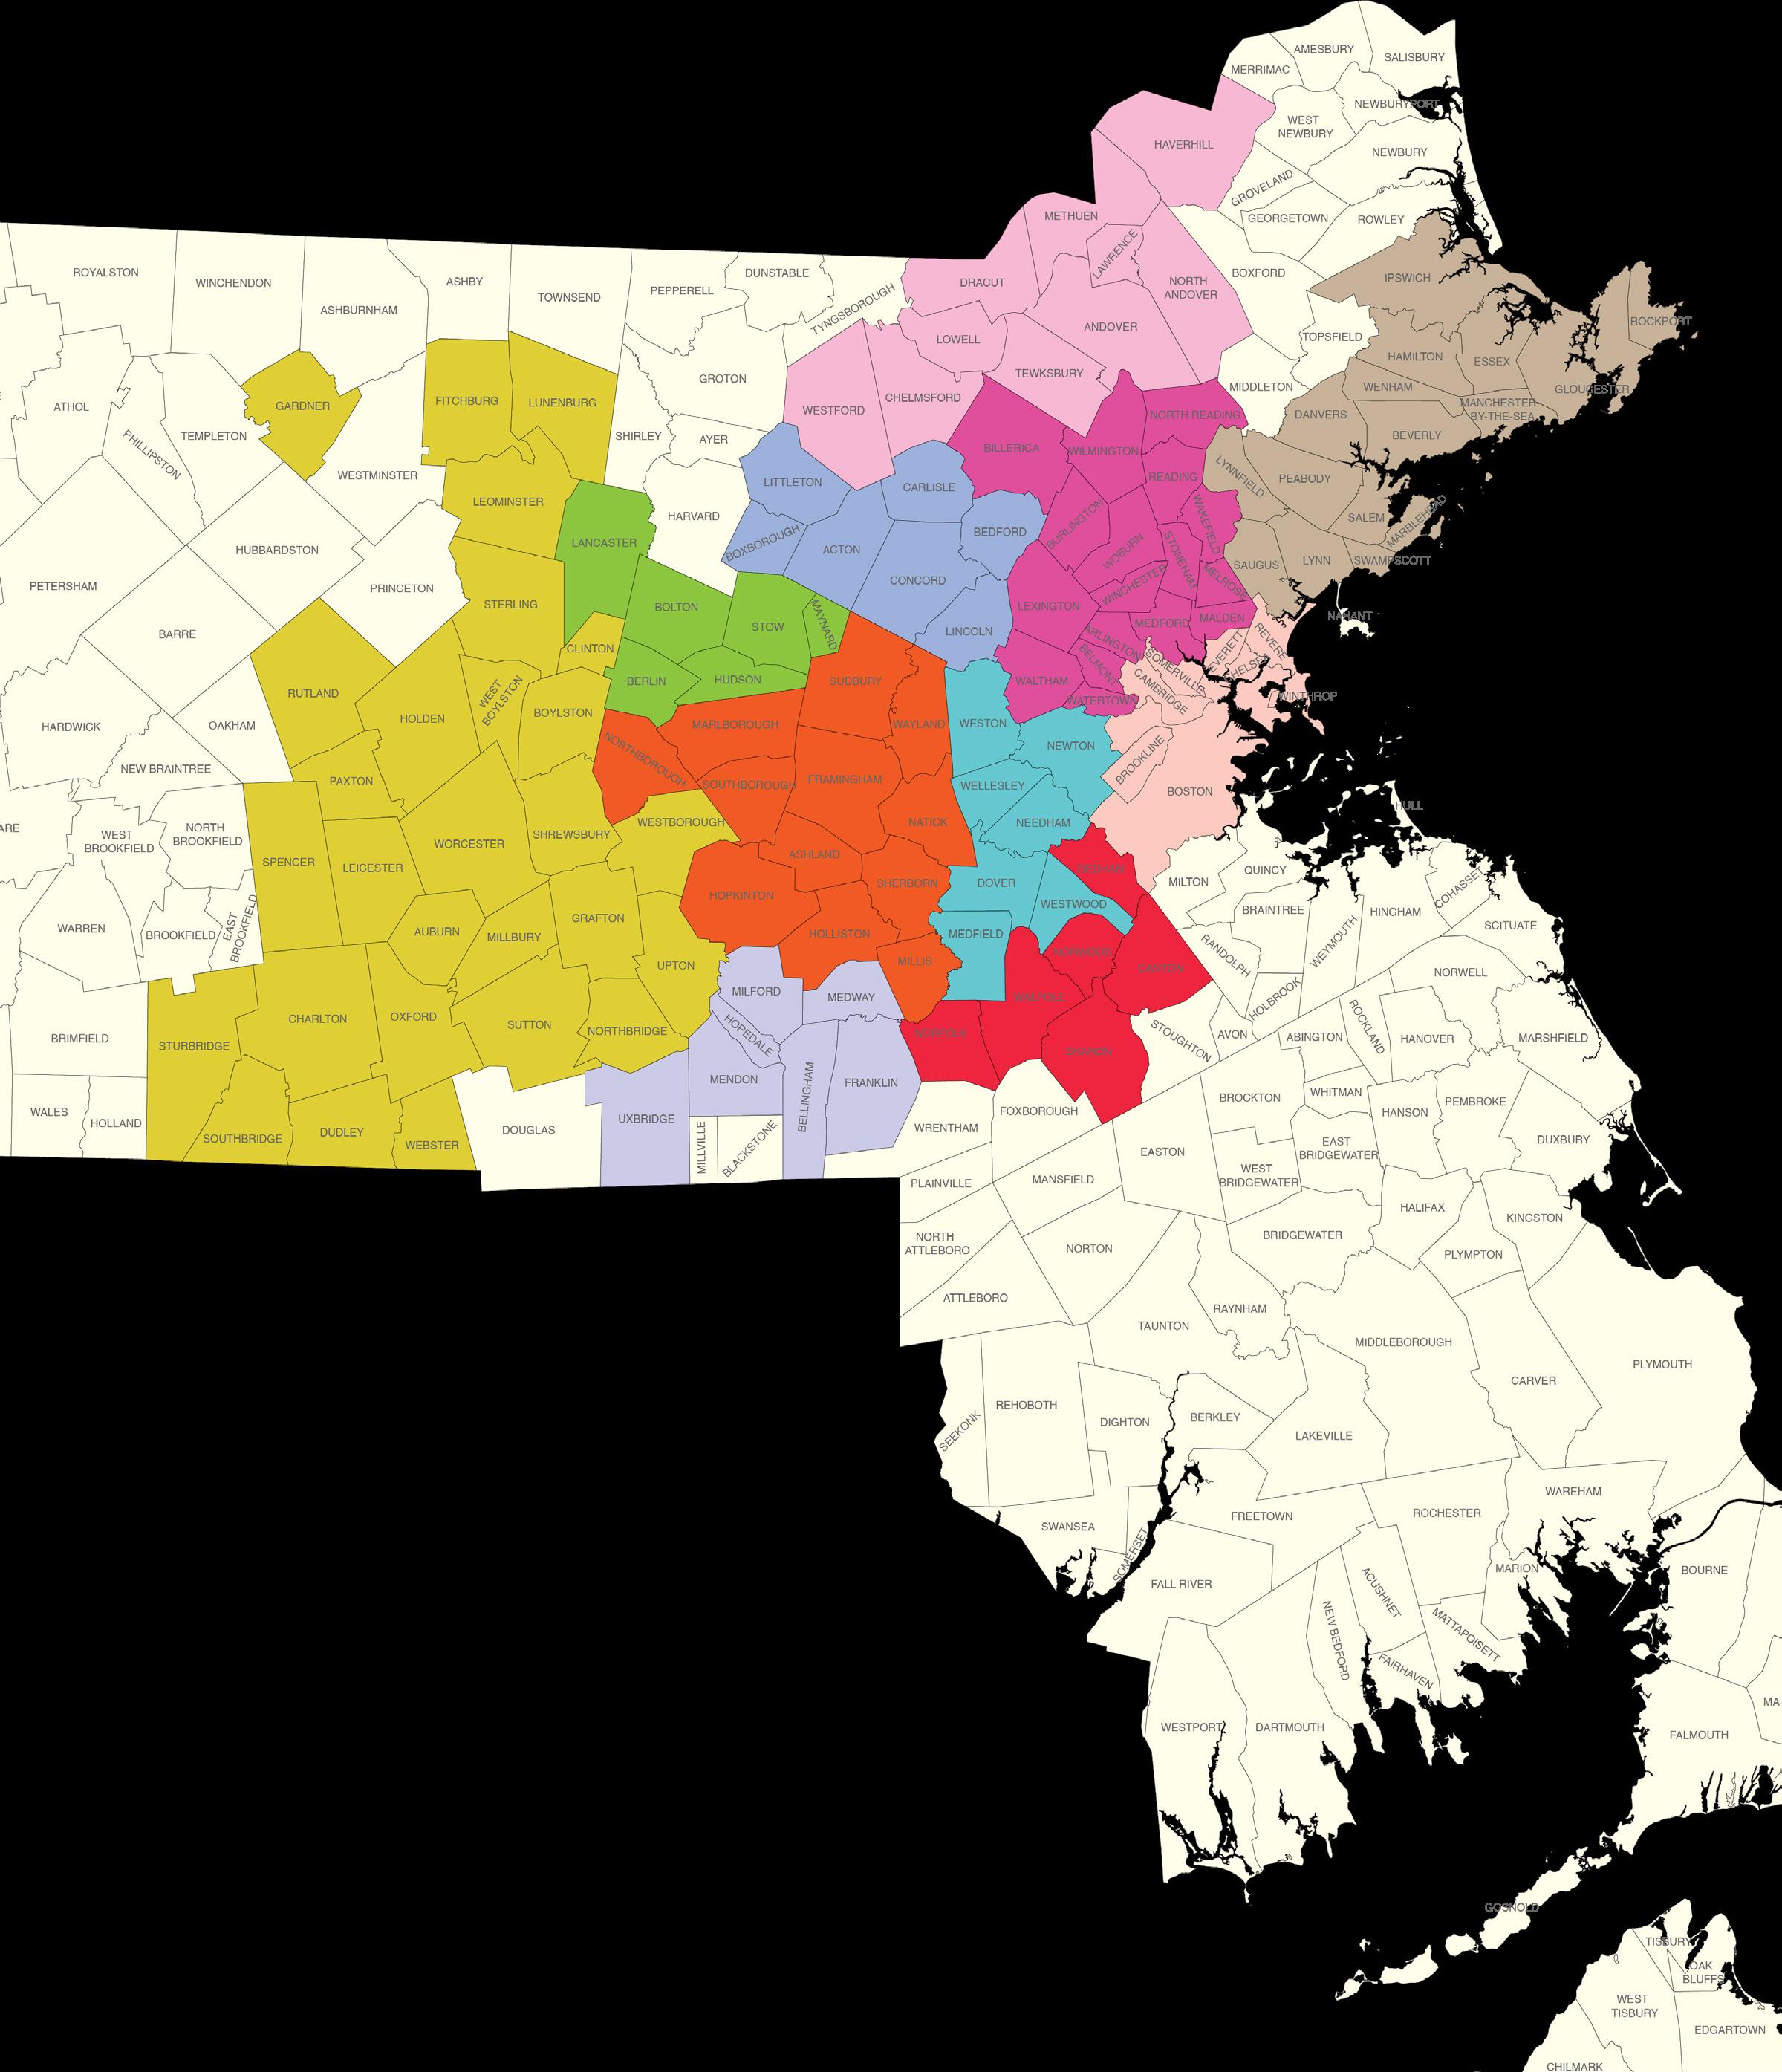
Towns and neighborhoods included in the Boston & Inner Suburbs region: Allston, Back Bay, Bay Village, Beacon Hill, Boston, Brighton, Brookline, Cambridge, Charlestown, Chelsea, Dorchester, East Boston, Everett, Fenway, Jamaica Plain, Mission Hill, North End, Revere, Roslindale, Roxbury, Seaport, Somerville, South Boston, South End, Waterfront, West Roxbury, Winthrop
Single Family Homes, Condominiums
Single Family Homes, Condominiums
Single Family Homes, Condominiums
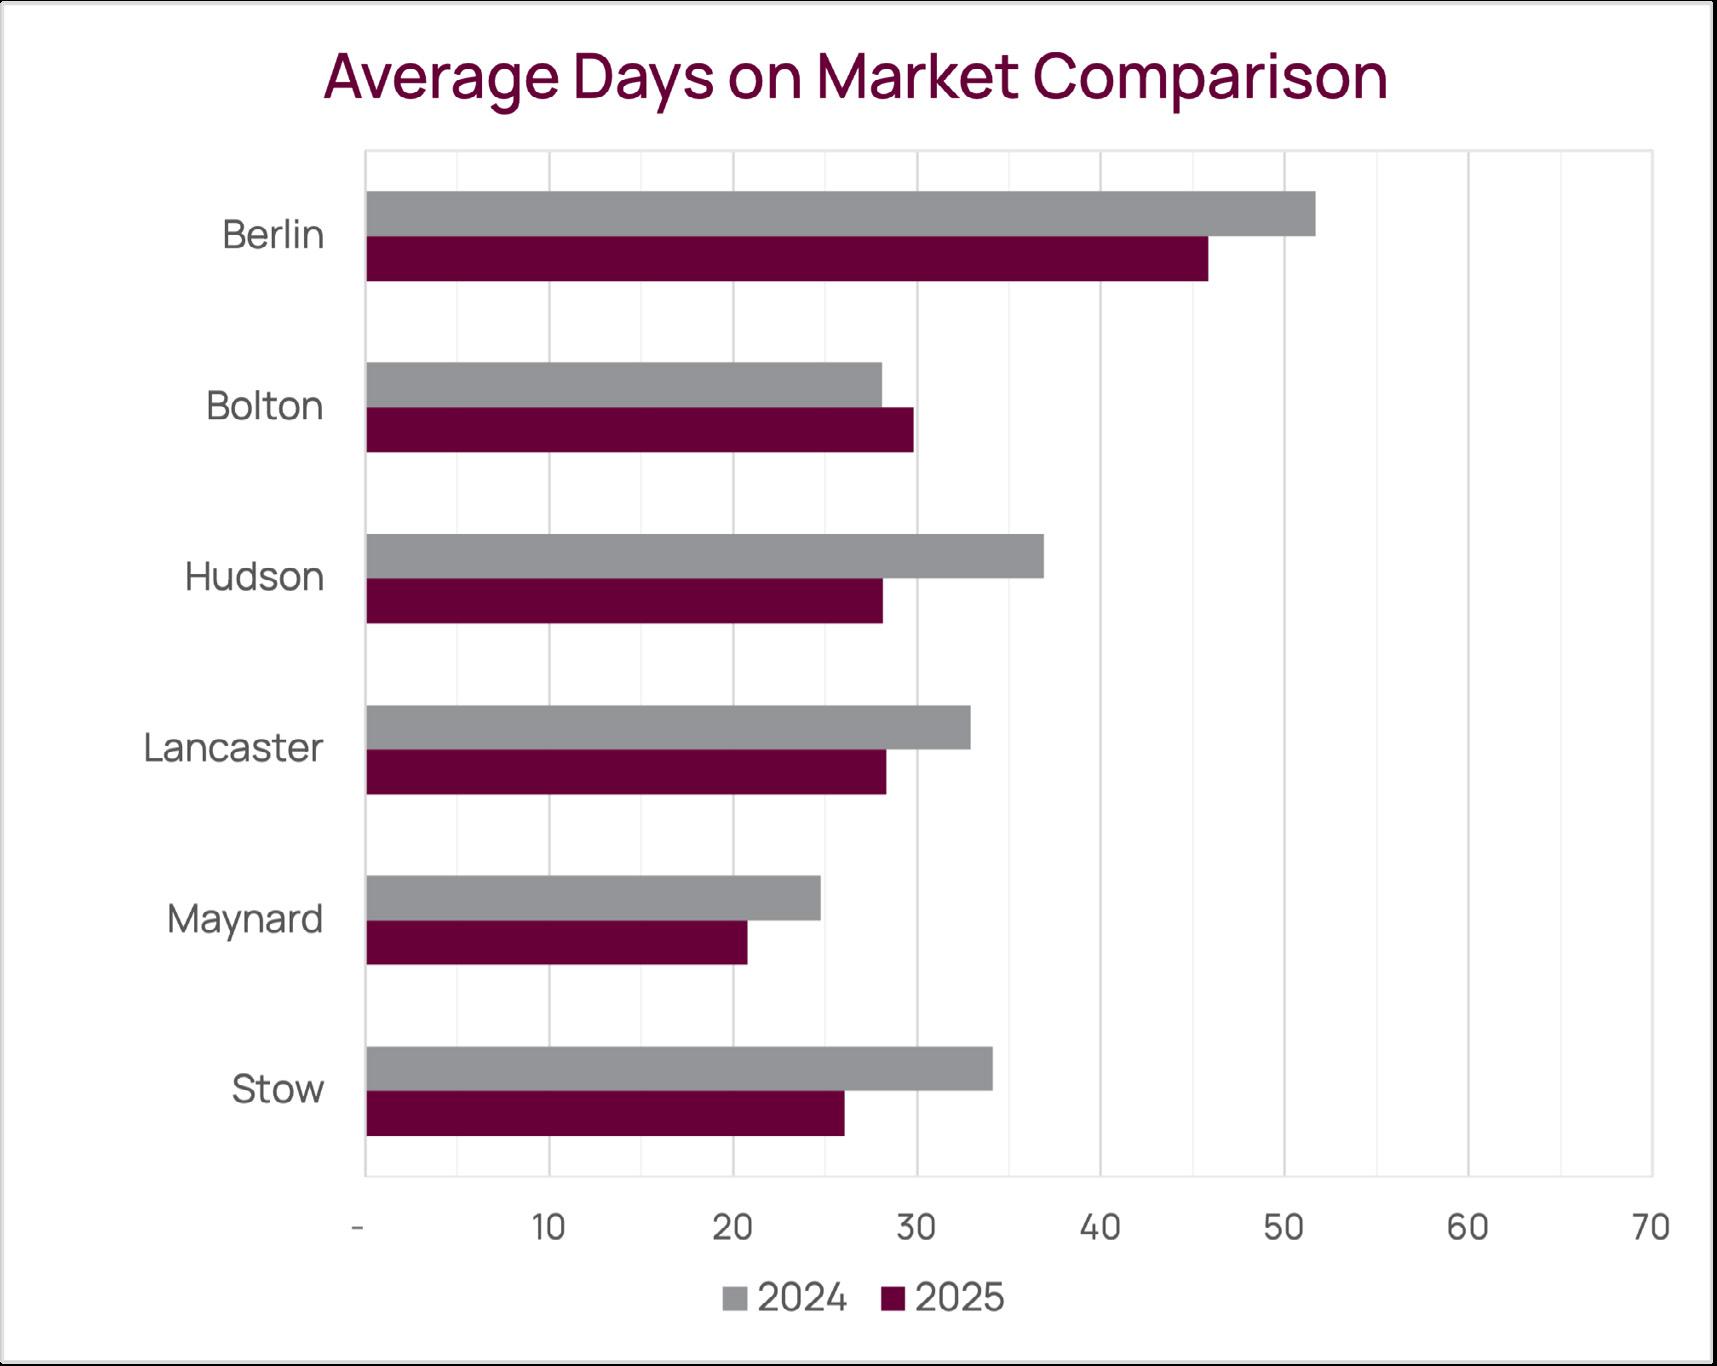
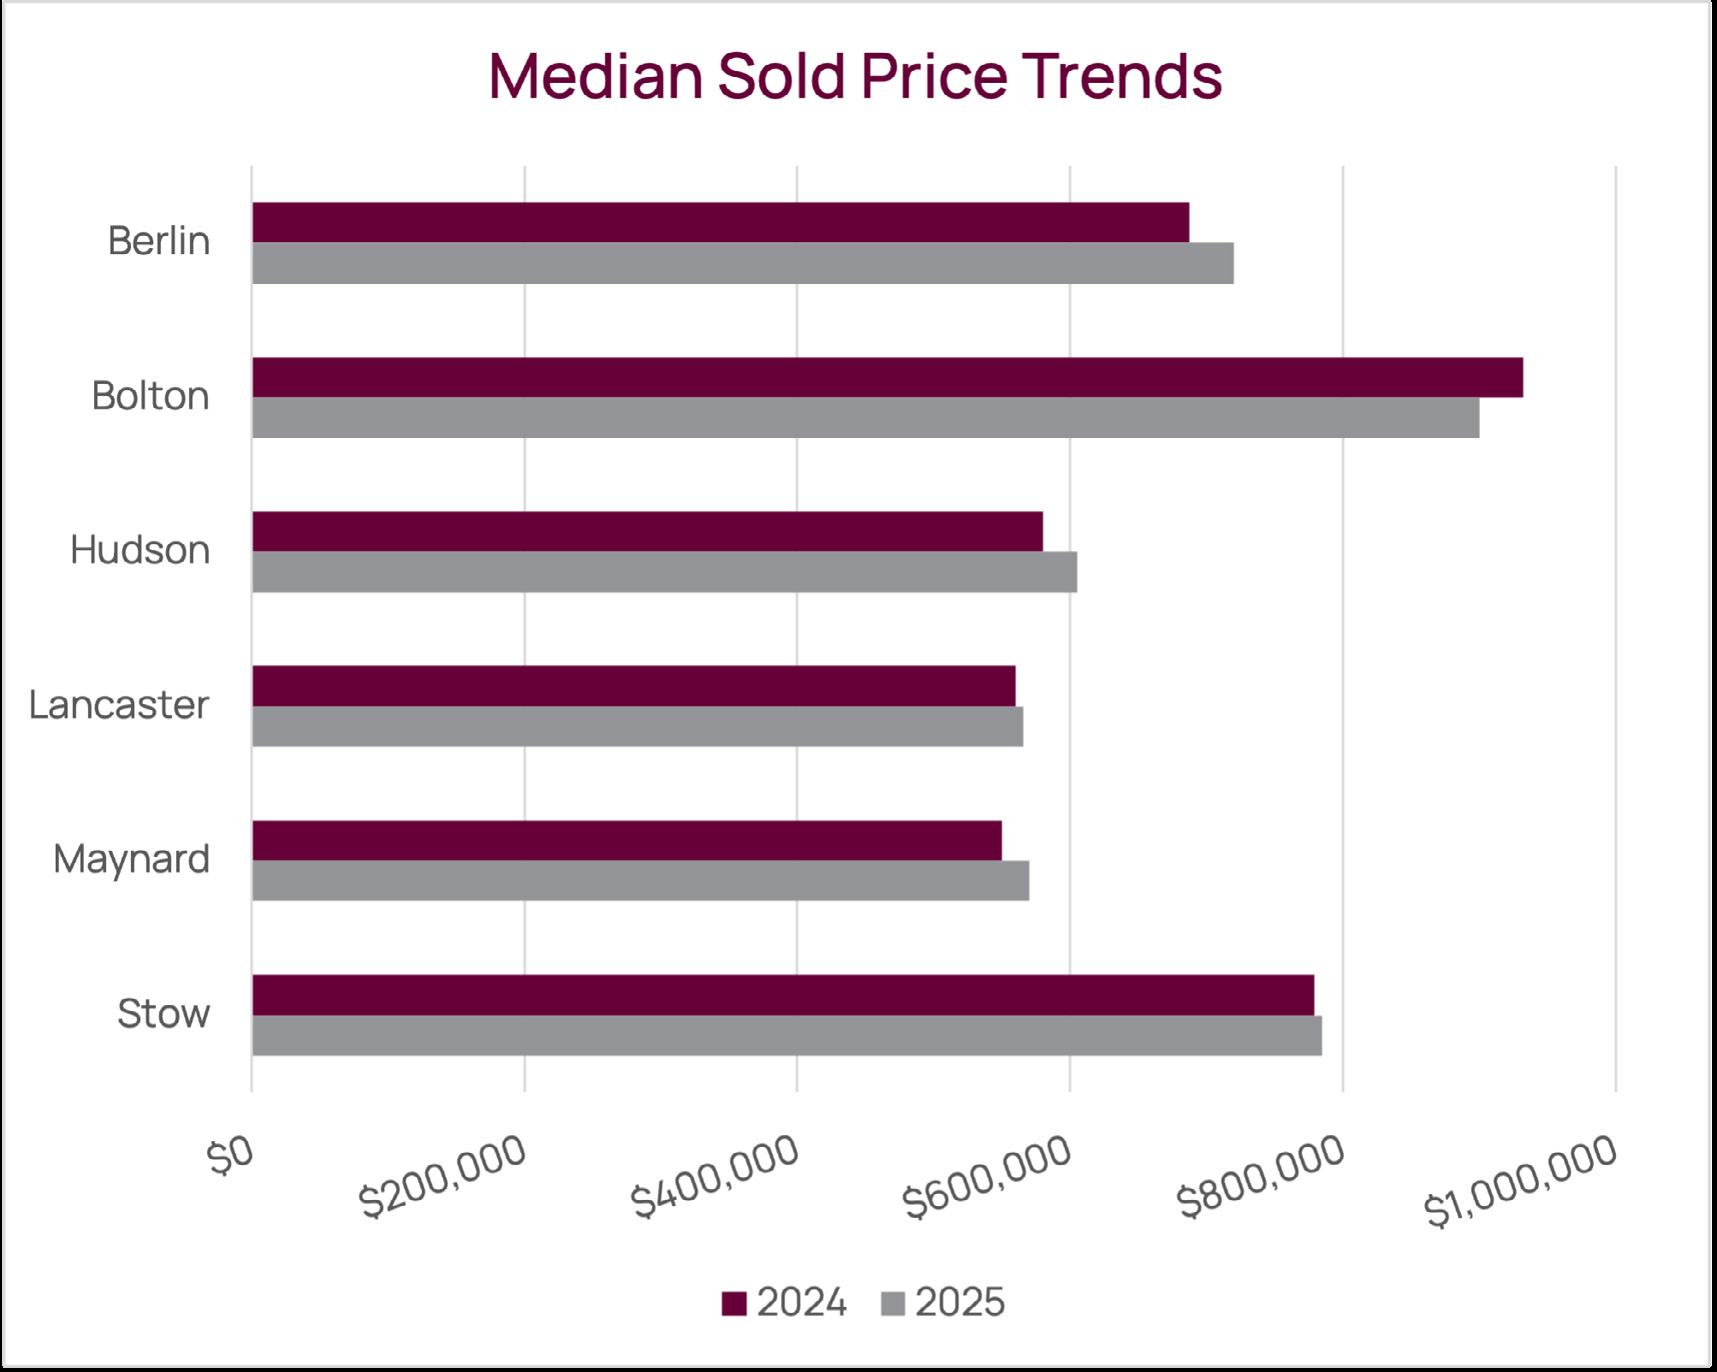
Towns included in the Assabet Valley region: Berlin, Bolton, Hudson, Lancaster, Maynard, Stow
Single Family Homes, Condominiums
Single Family Homes, Condominiums
Single Family Homes, Condominiums
Single Family Homes, Condominiums
Single Family Homes, Condominiums
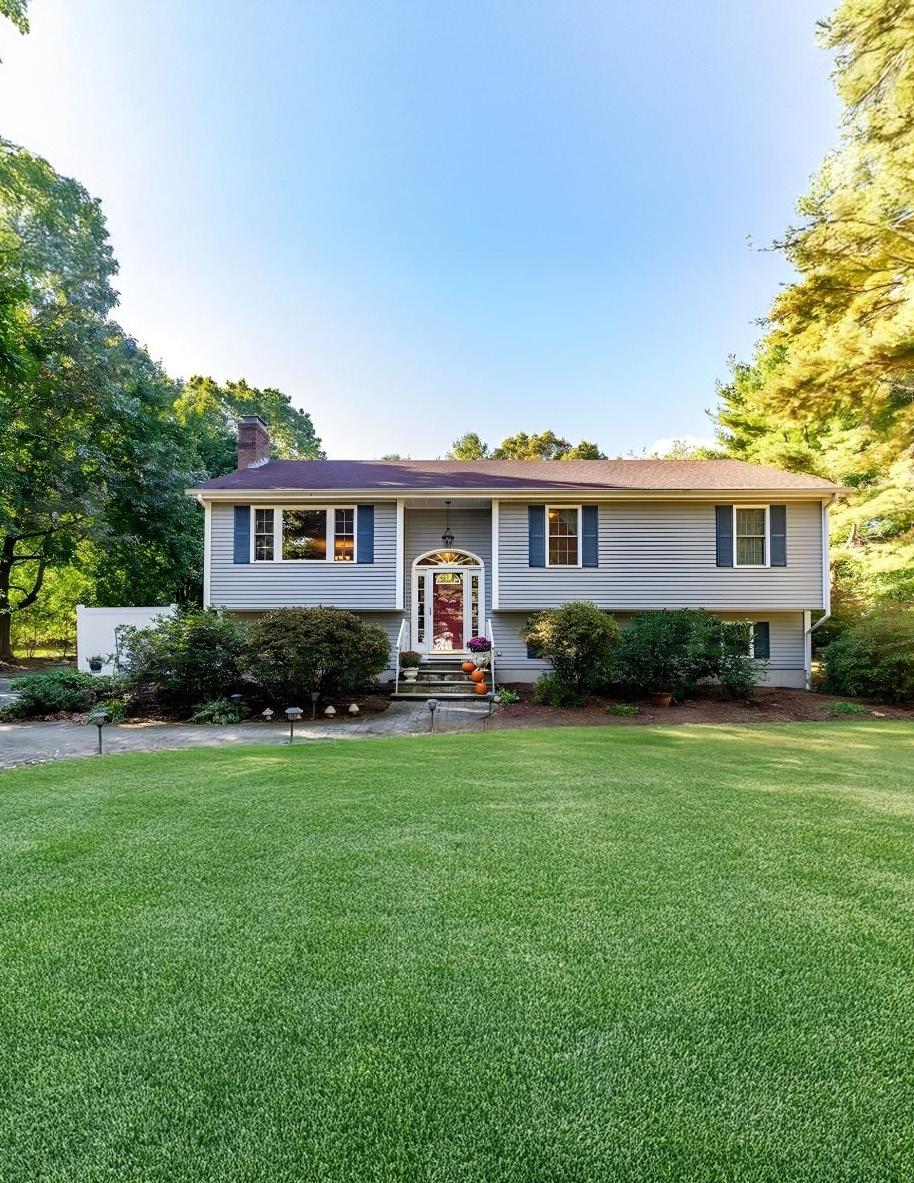
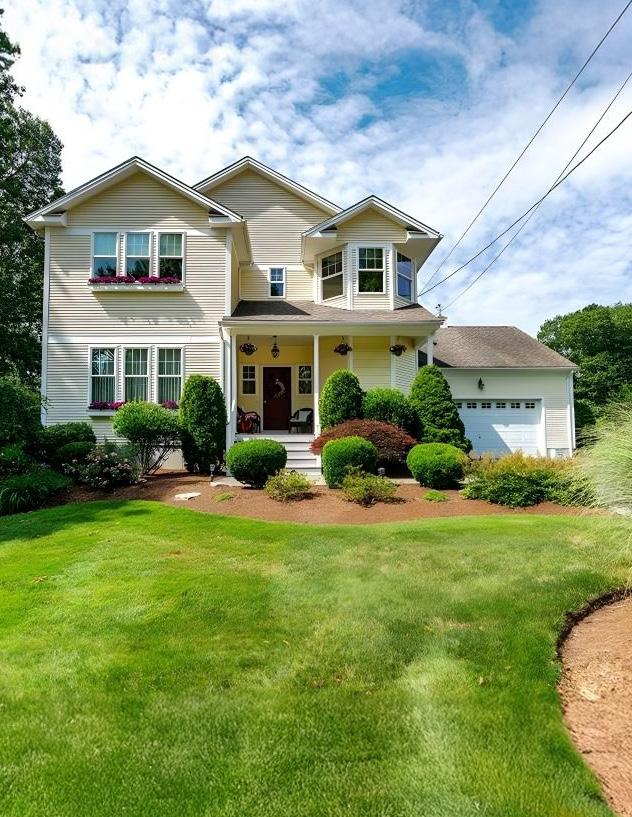
490 SOWAMS RD, BARRINGTON
See similar listings
Single Family Homes, Condominiums
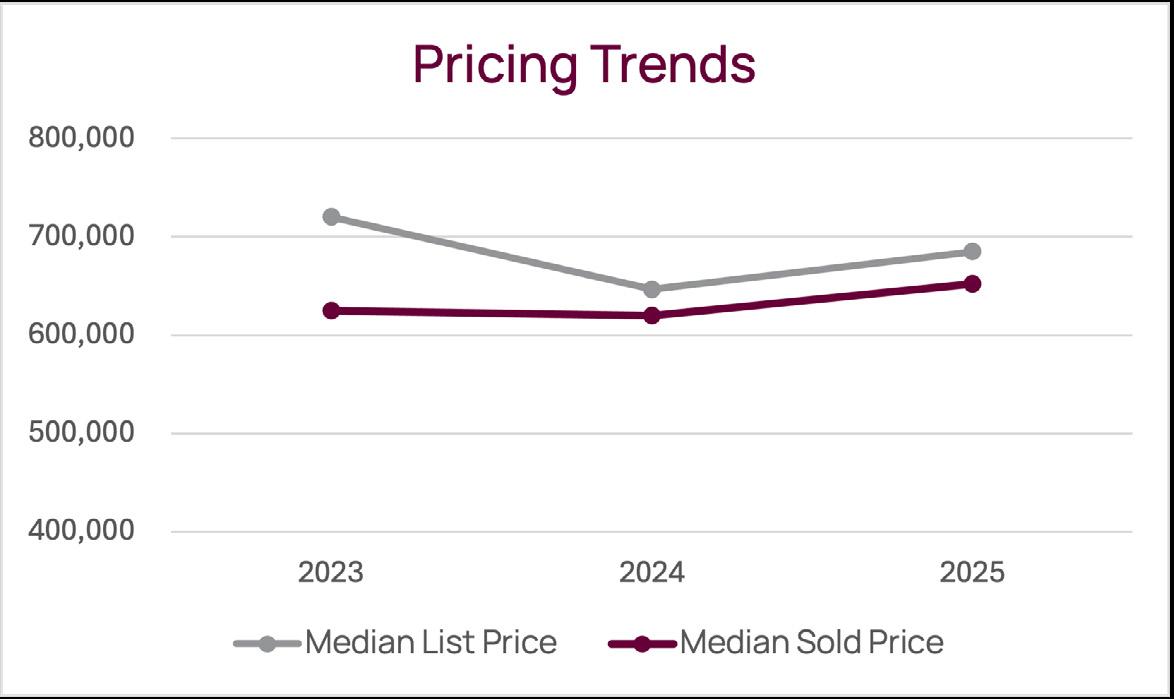
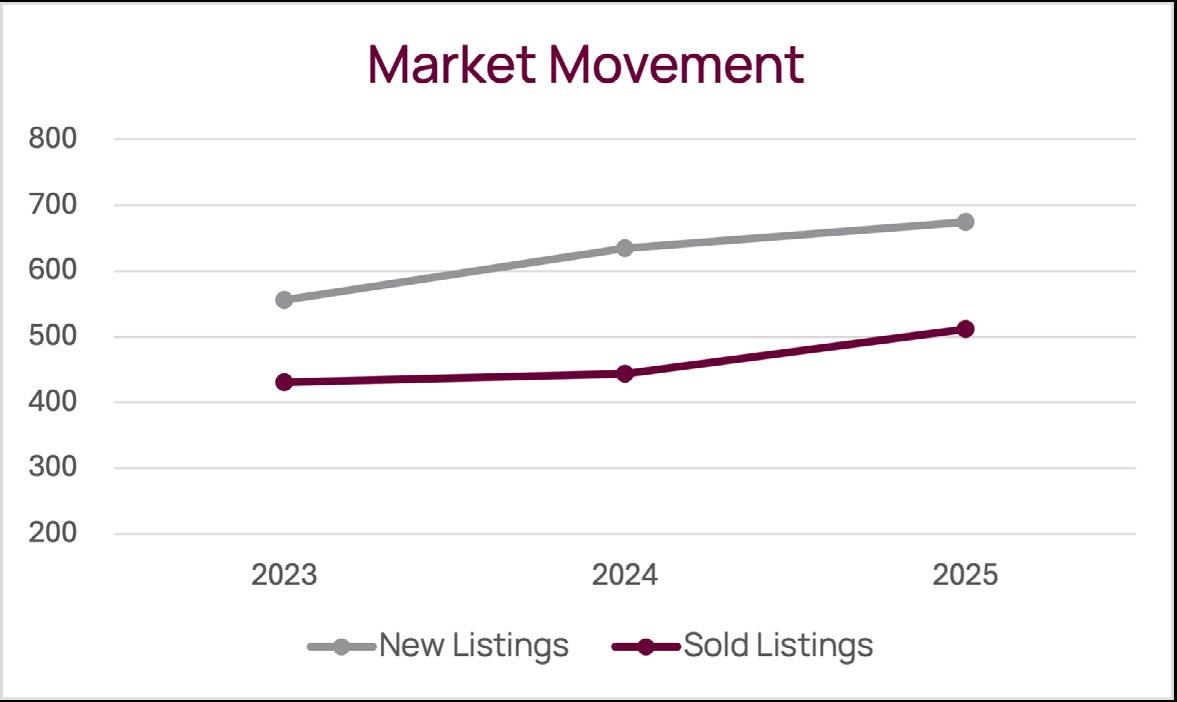
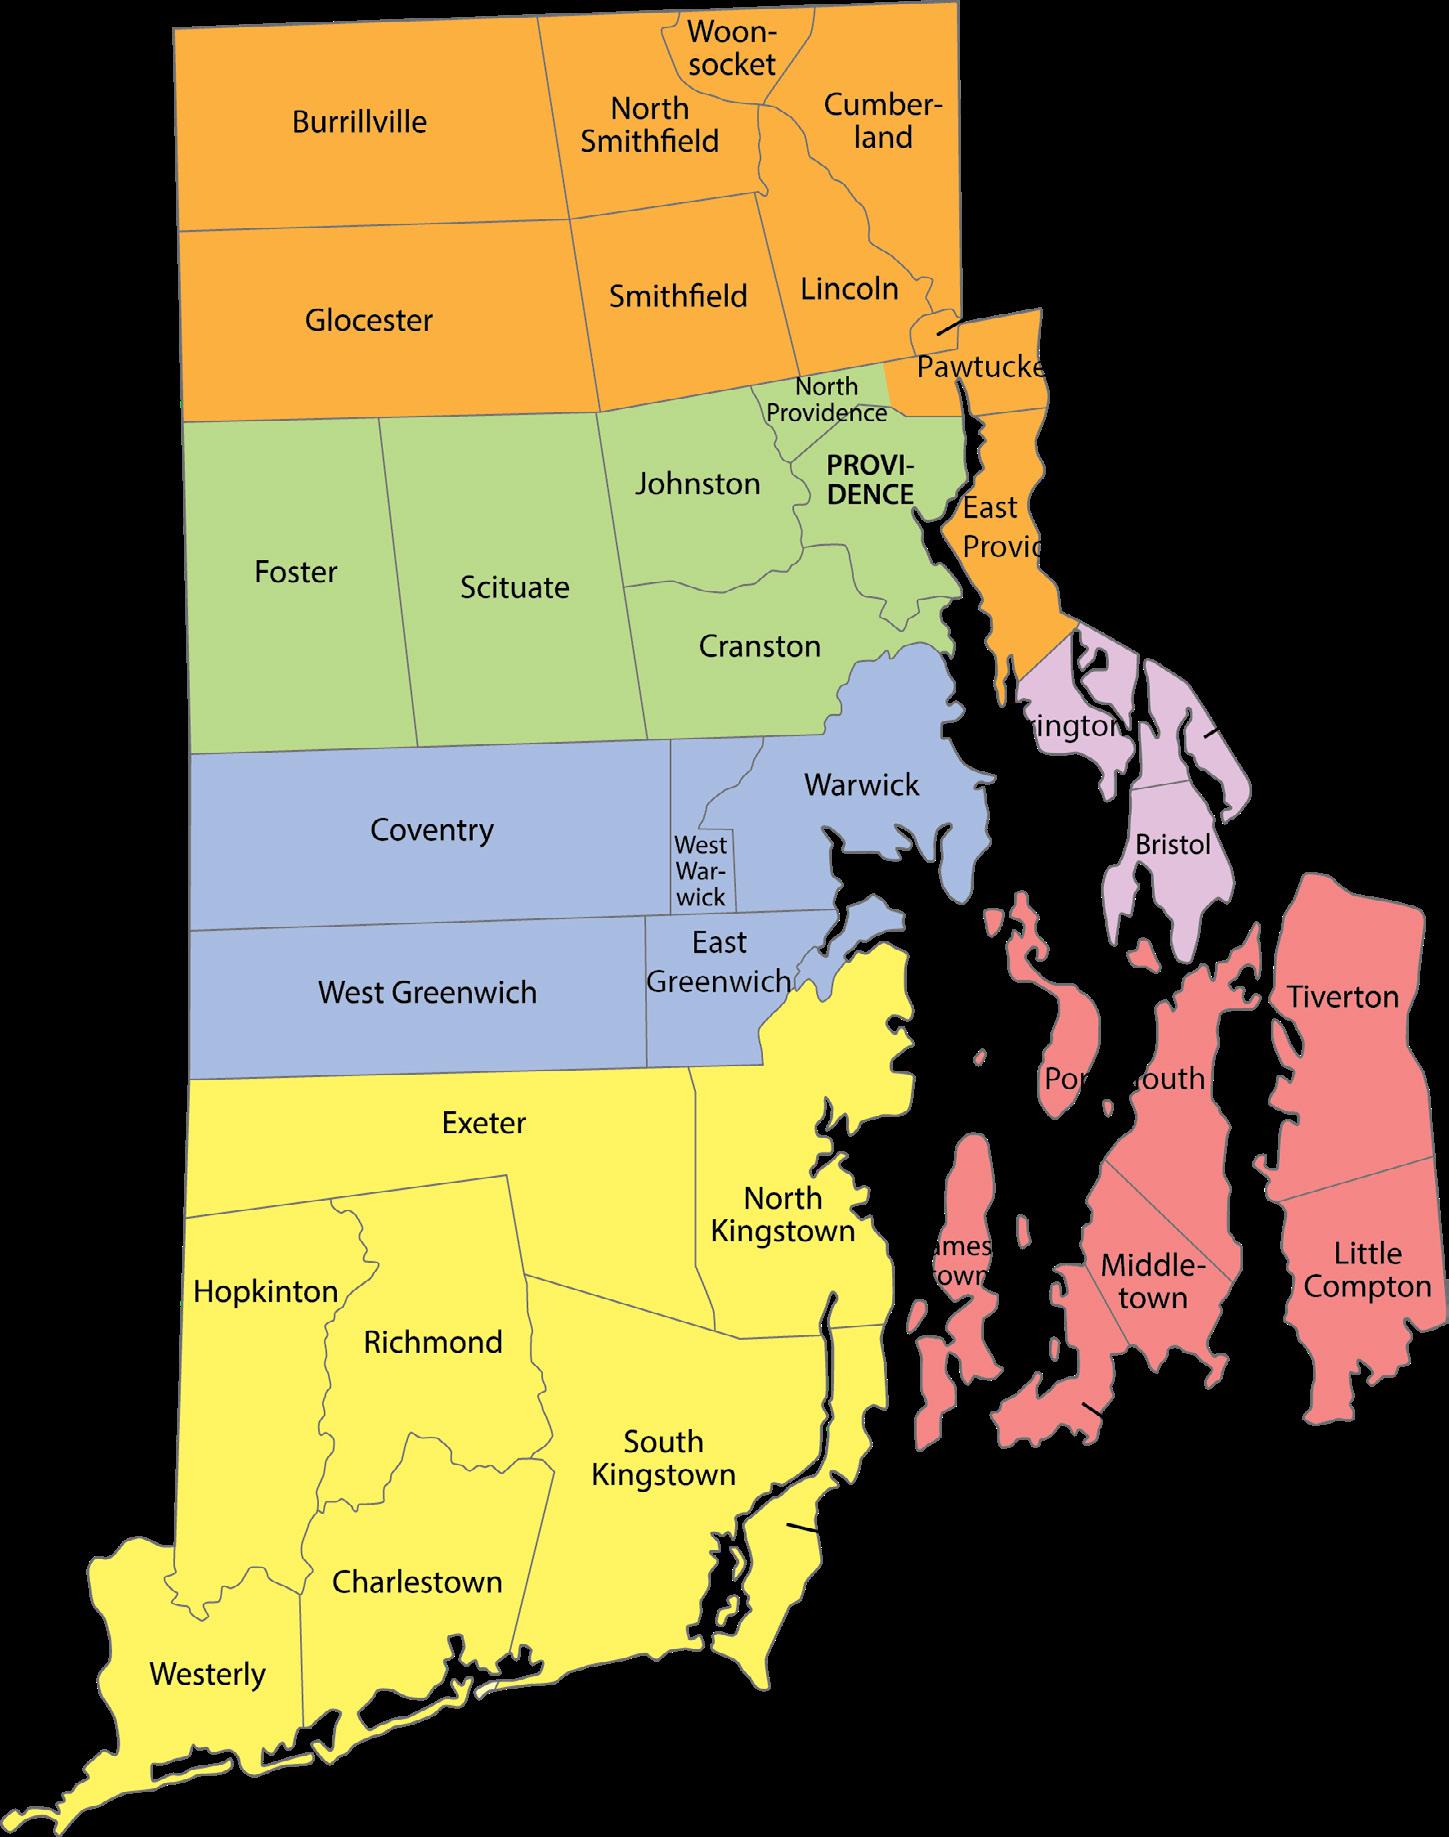
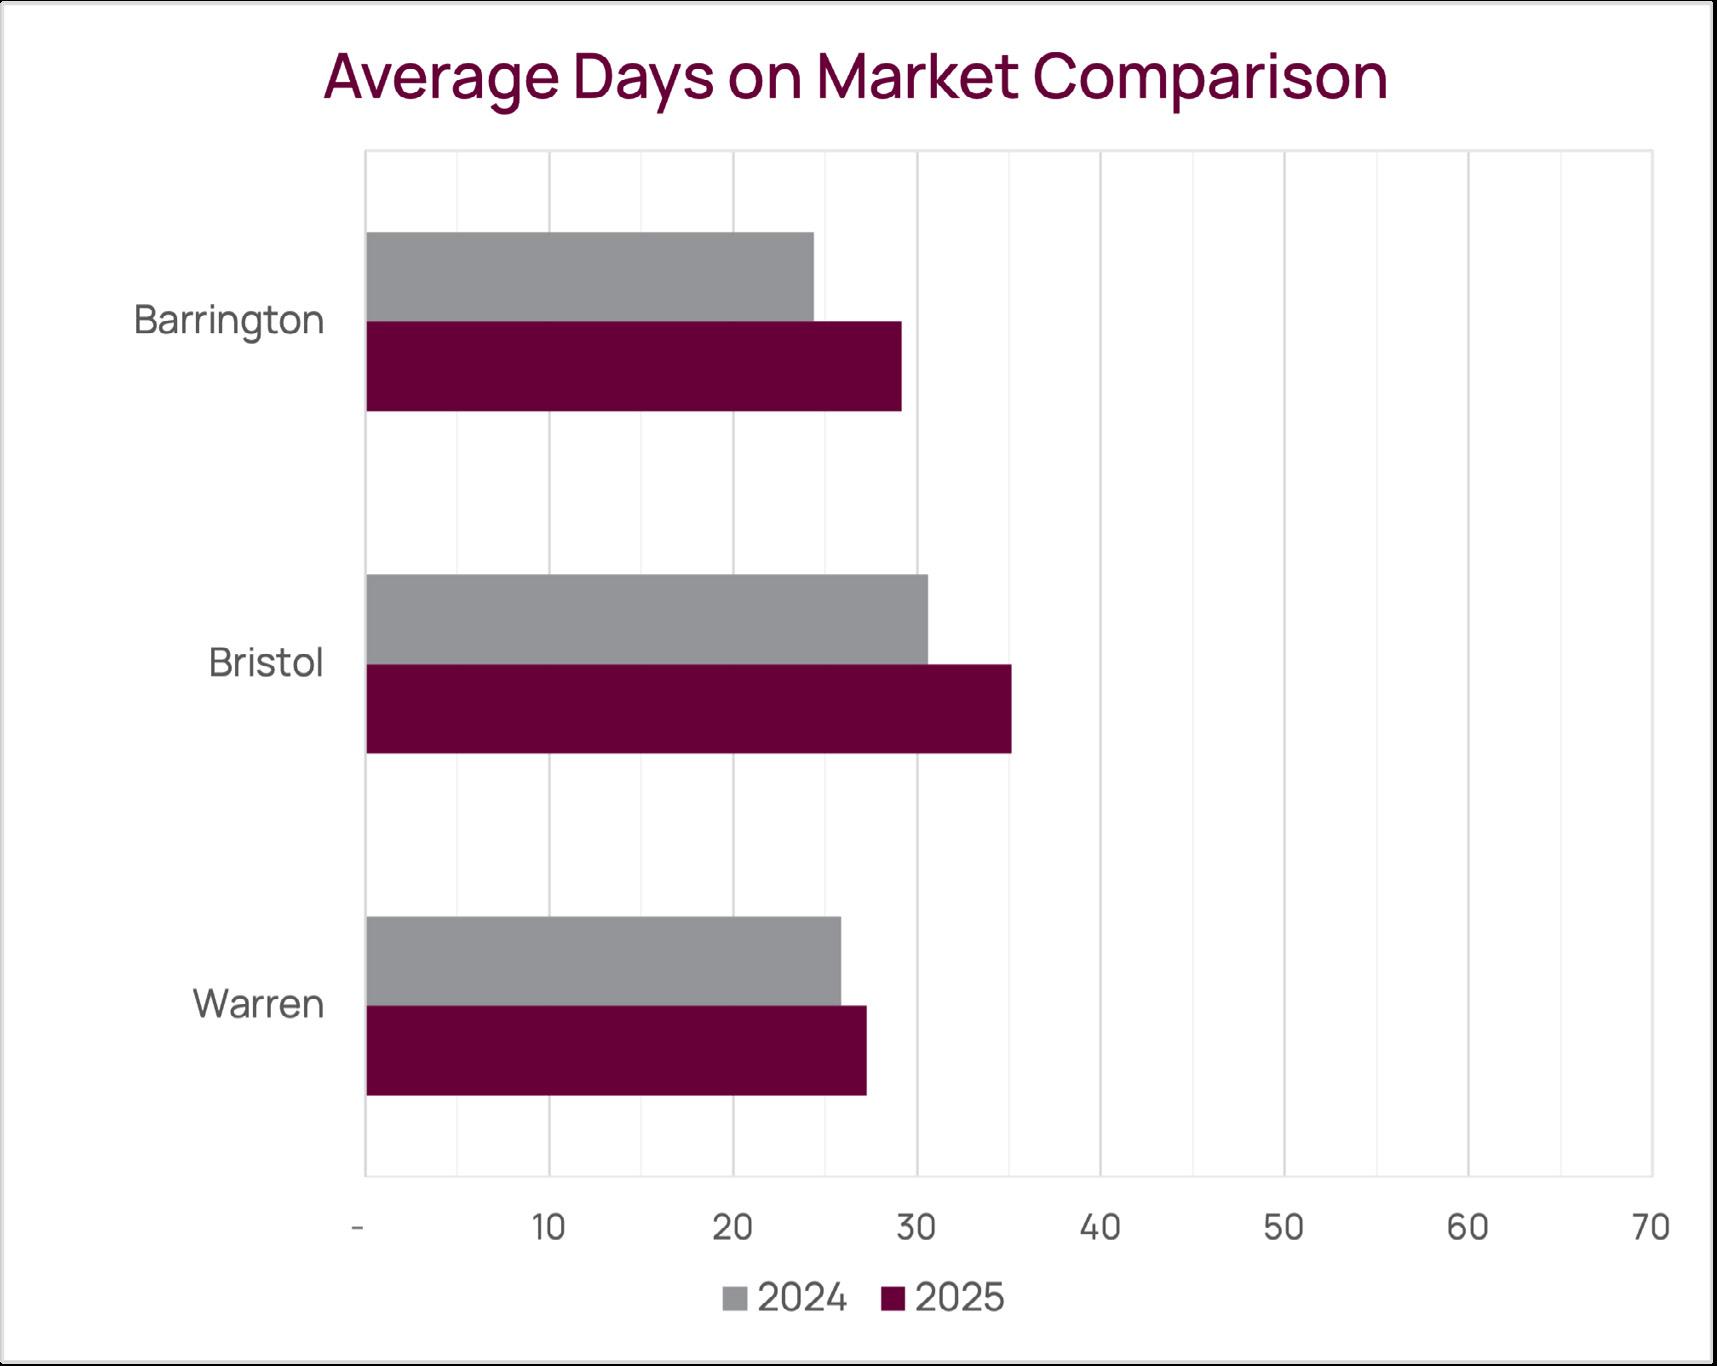
Towns included in the Bristol County region: Barrington, Bristol, Warren
Single Family Homes, Condominiums
Single Family Homes, Condominiums
Single Family Homes, Condominiums
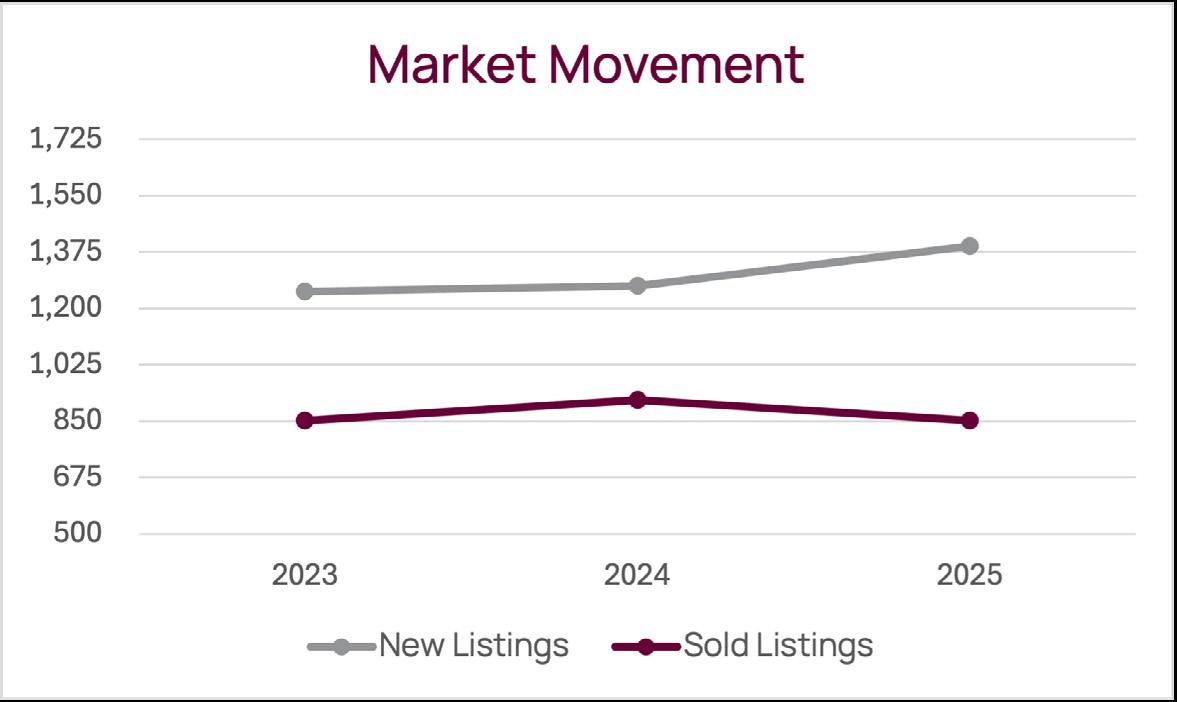
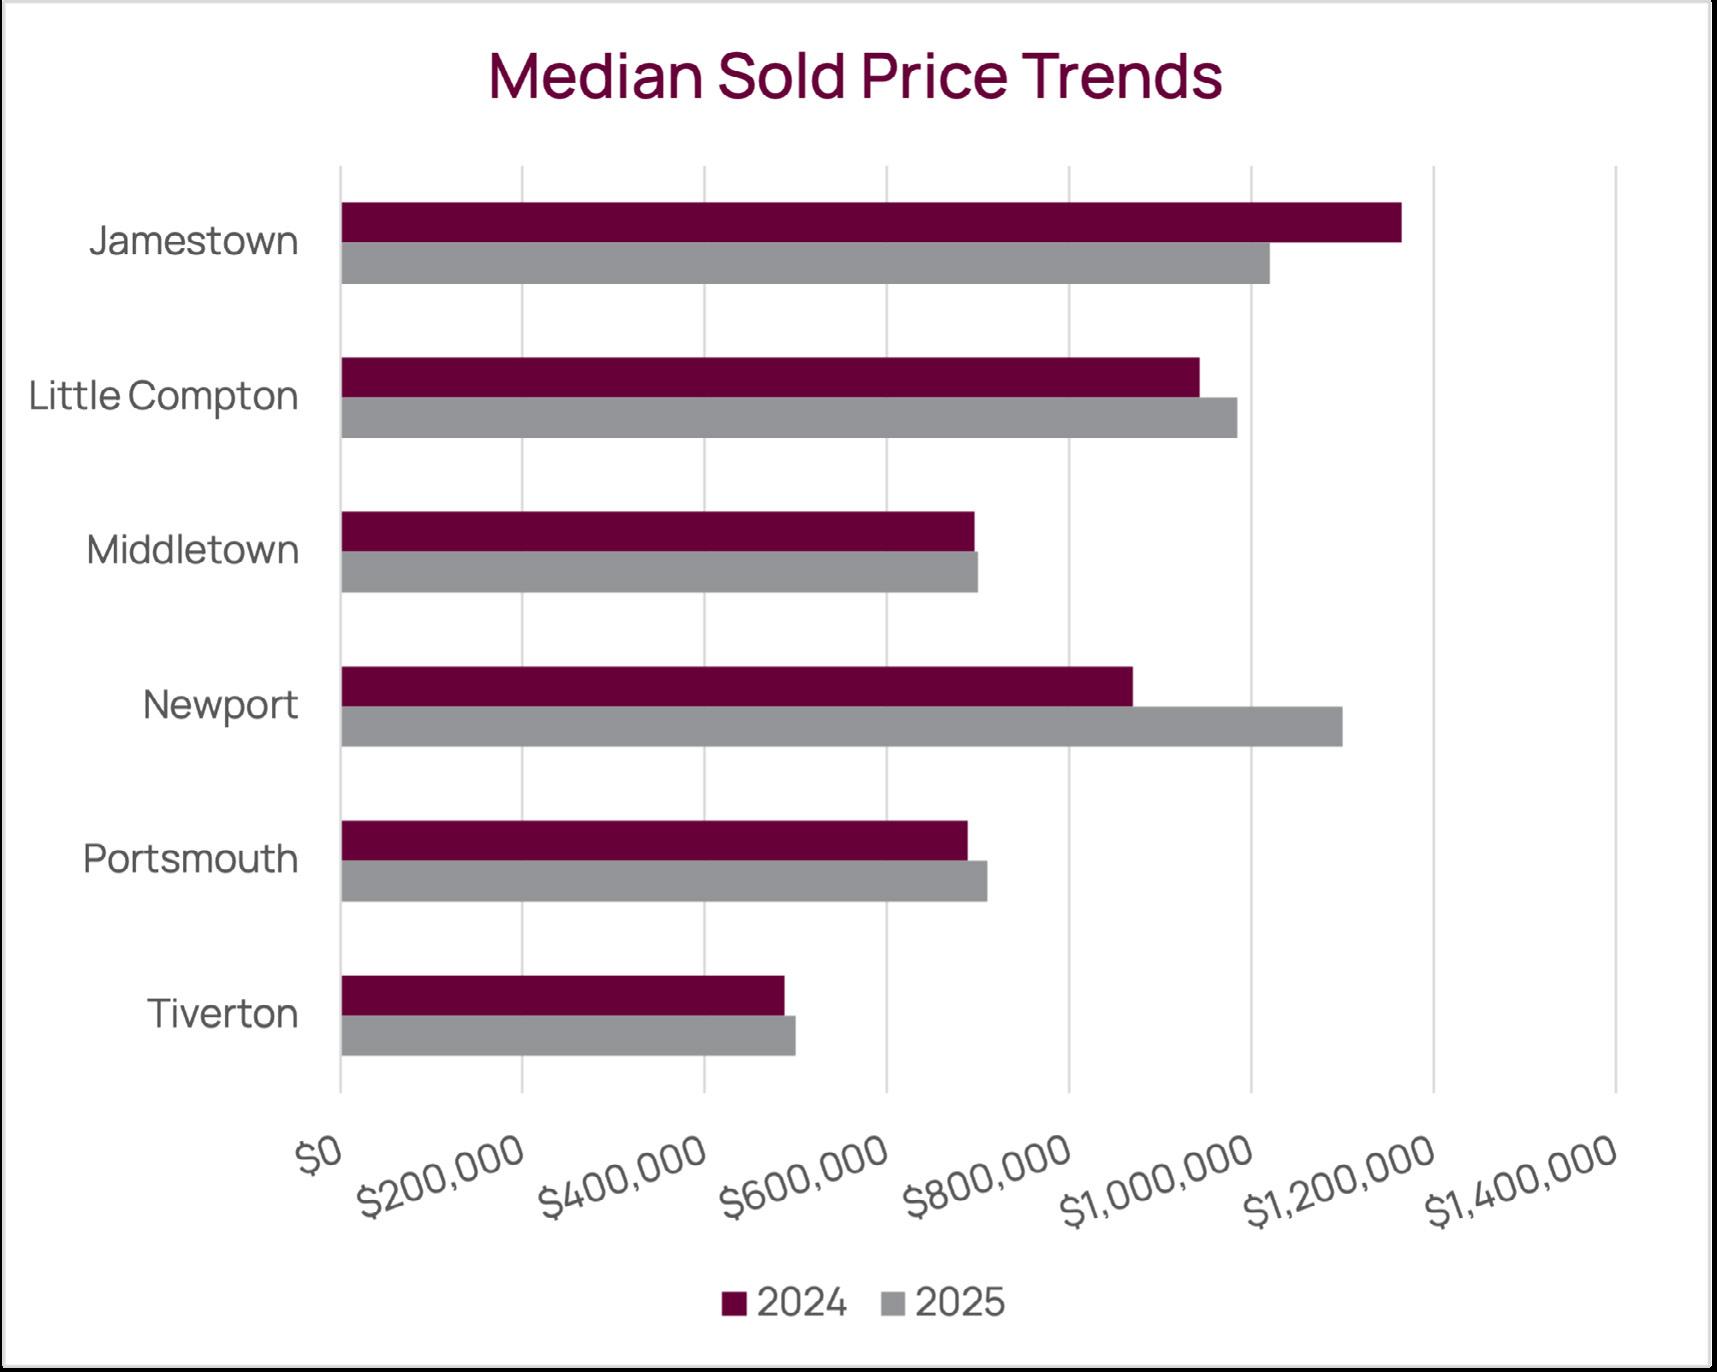
Towns included in the Newport County region: Jamestown, Little Compton, Middletown, Newport, Portsmouth,
Single Family Homes, Condominiums
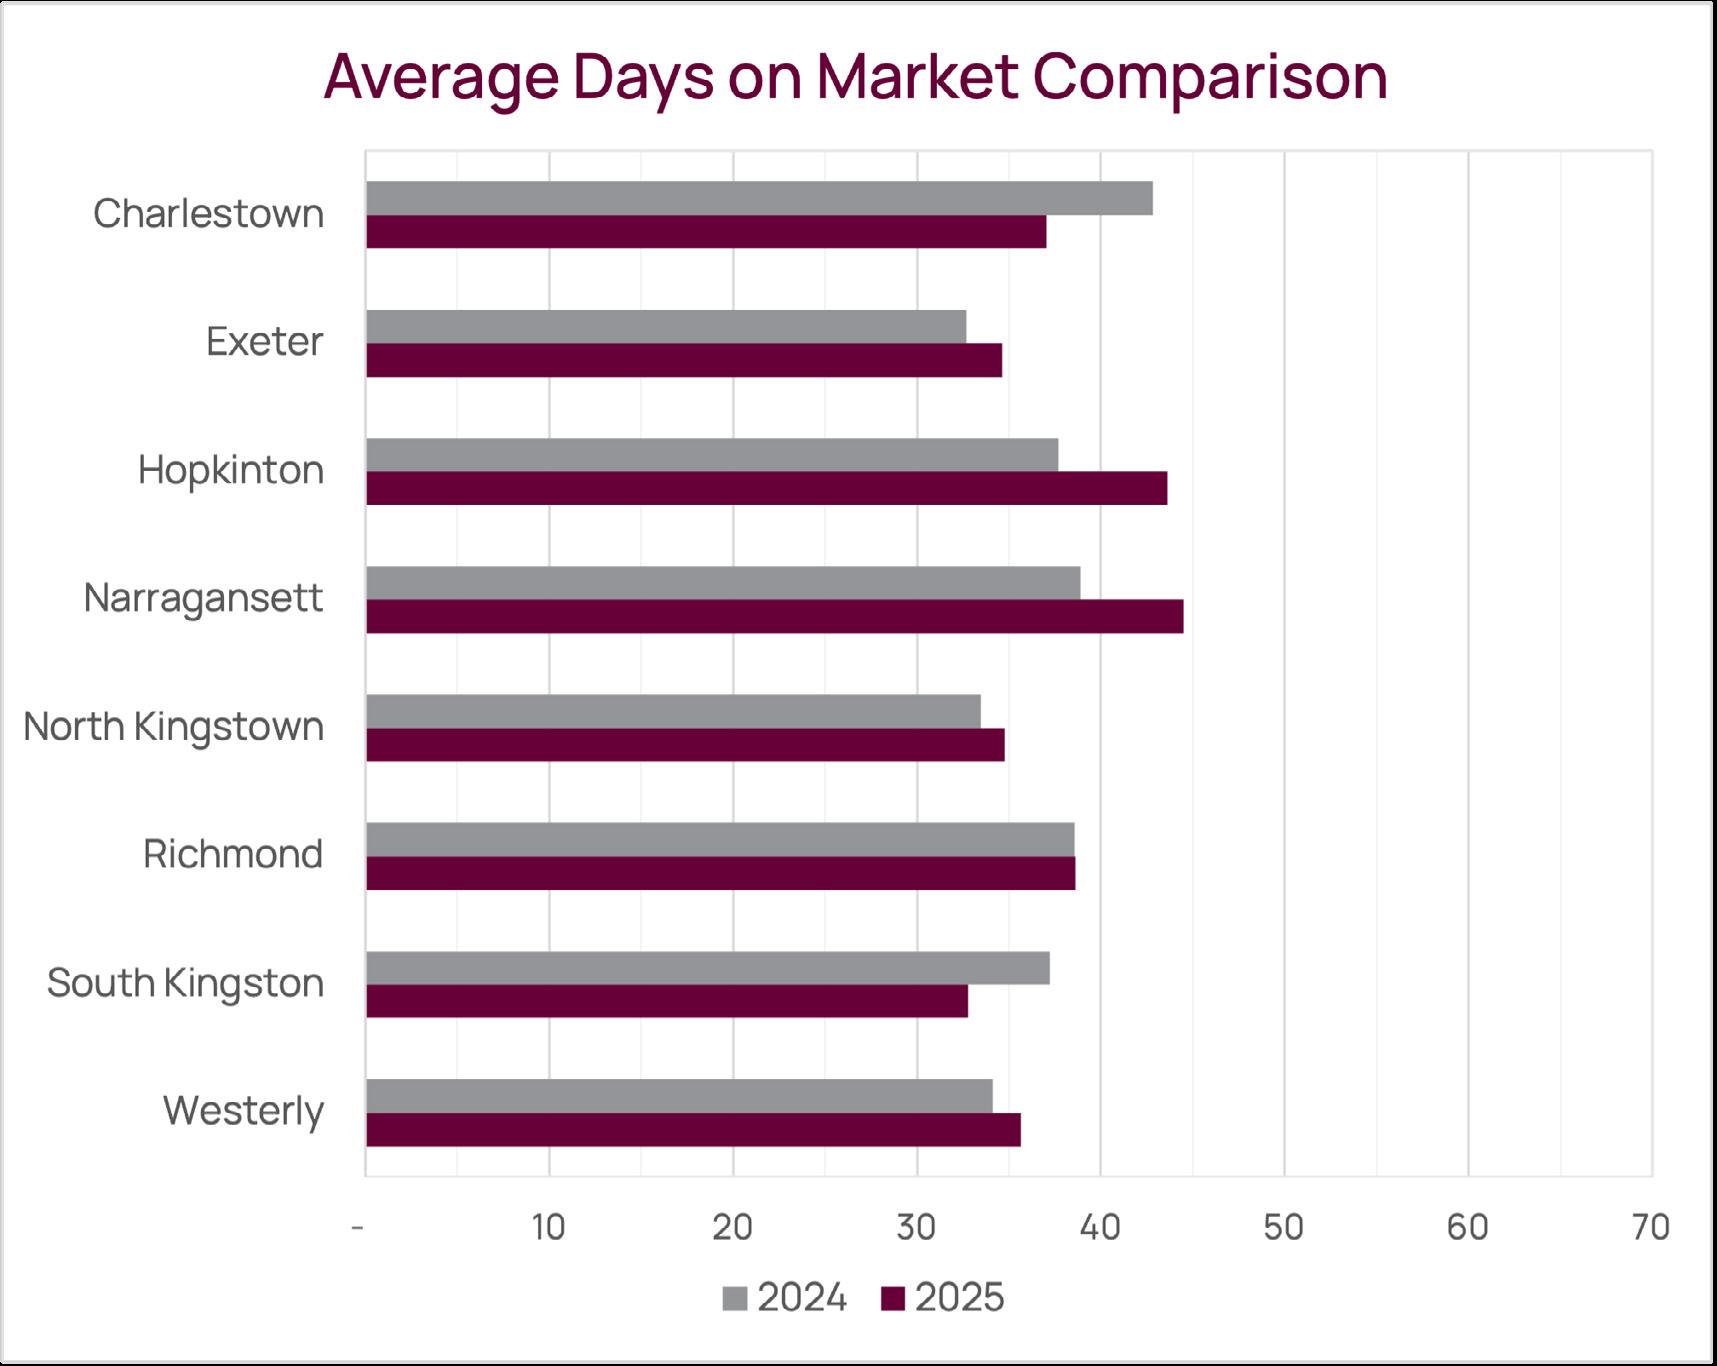
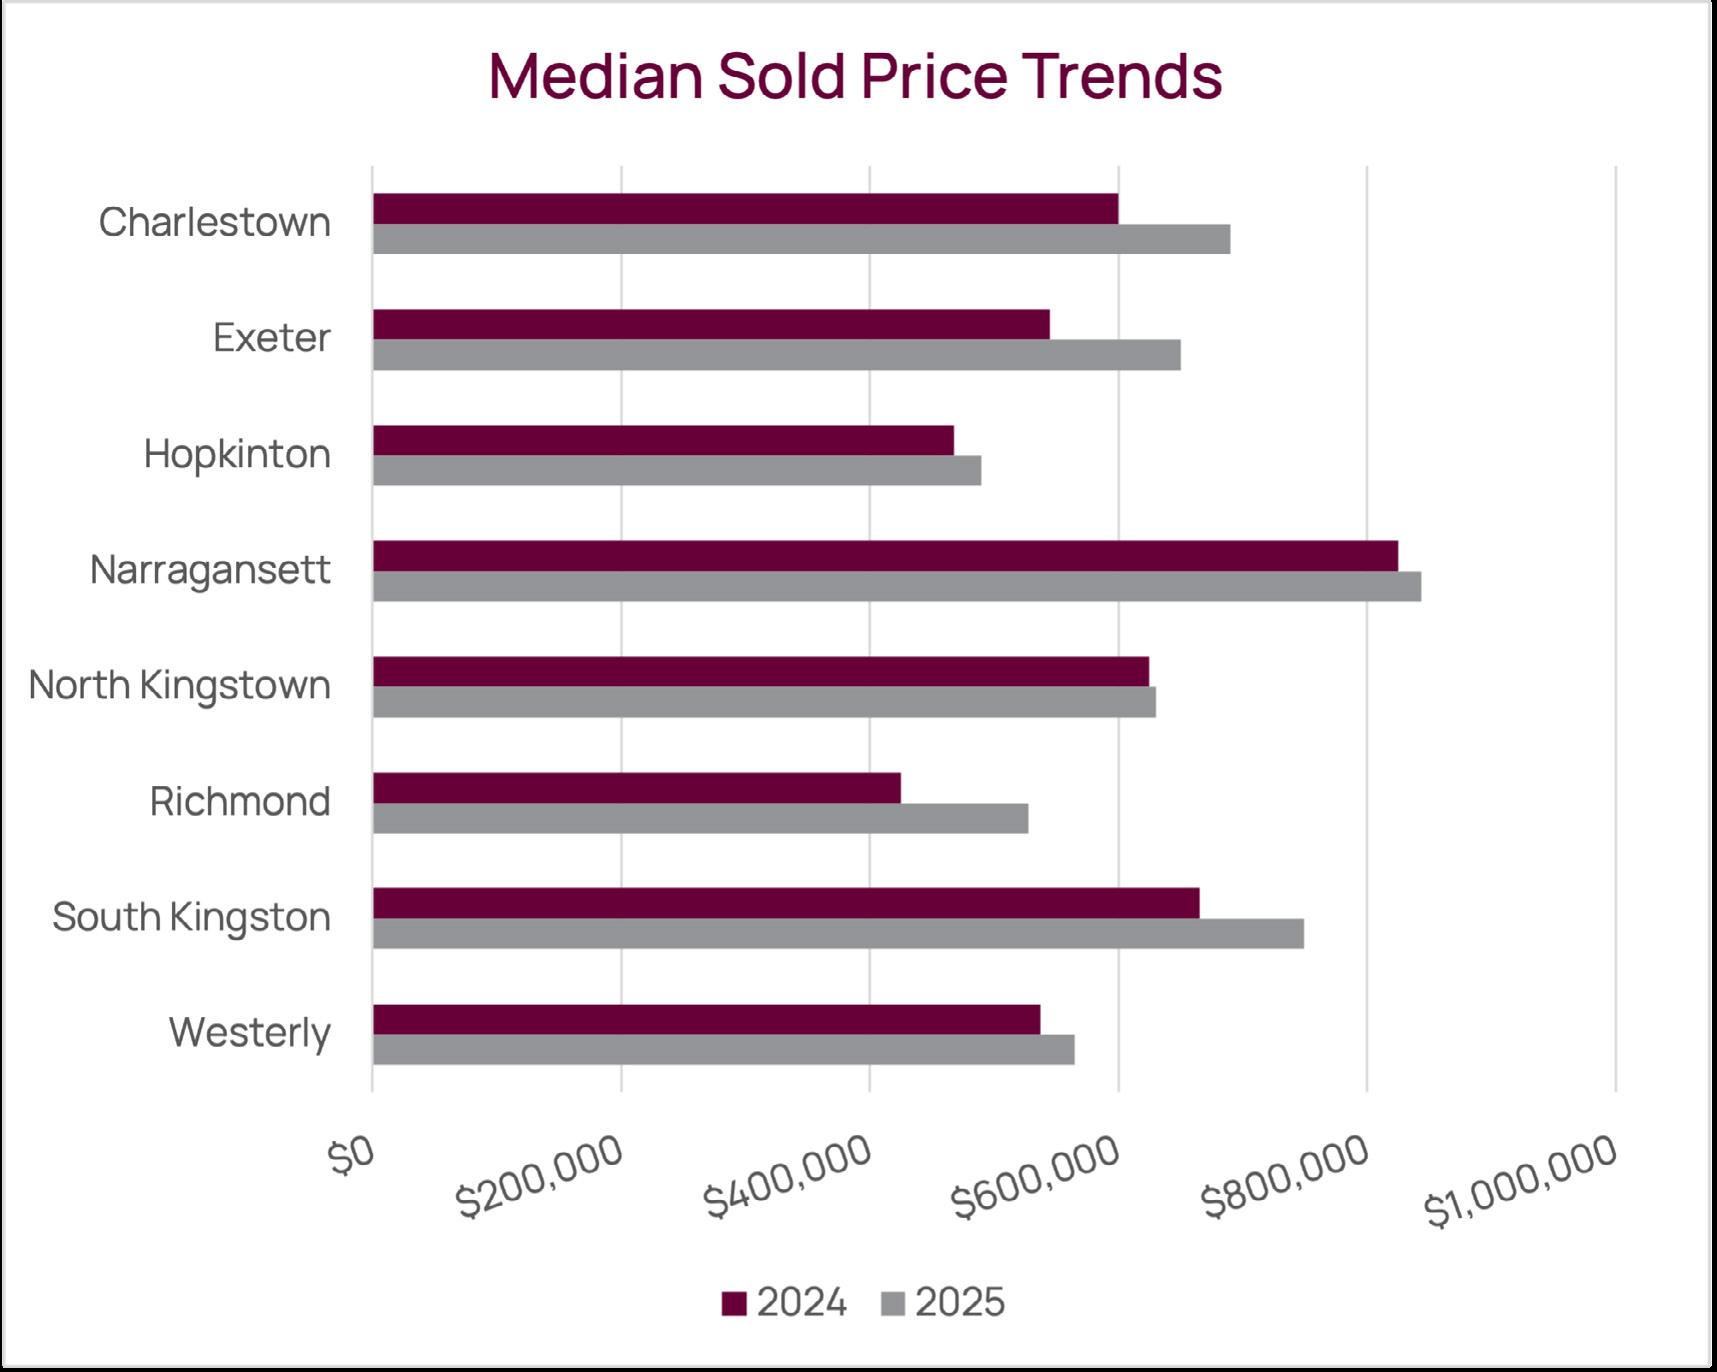
Towns included in the South County region: Charlestown, Exeter, Hopkinton, Narragansett, North Kingstown, Richmond, South Kingstown, Westerly