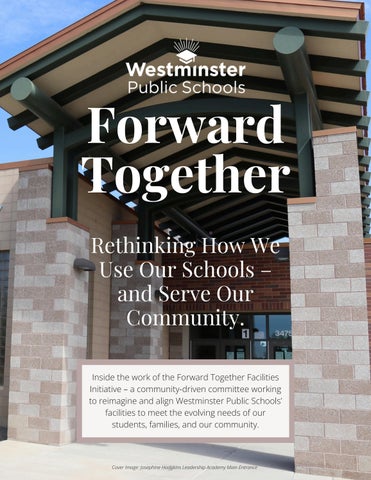
Forward Together Rethinking How We Use Our Schools – and Serve Our Community. Inside the work of the Forward Together Facilities Initiative – a community-driven committee working to reimagine and align Westminster Public Schools’ facilities to meet the evolving needs of our students, families, and our community.
Cover Image: Josephine Hodgkins Leadership Academy Main Entrance
Intro
Forward Together. Rethinking How We Use Our Schools – and Serve Our Community. Budgets are tightening, enrollment is declining, and our communities are changing. This is a pivotal moment for Westminster Public Schools to rethink how we use our facilities – and how our buildings can continue to serve students, families, and neighborhoods in new and meaningful ways. At the heart of this work is a clear challenge: our district has more school buildings than our current and projected enrollment can sustain, and many of these facilities are aging and increasingly costly to maintain.
Page 02
For more than 15 years, Westminster Public Schools has led the way in competency-based learning and community-centered education. Now, through the Forward Together Facilities Initiative (FTFI), we are taking the next step – identifying how our existing spaces can work smarter, uncovering opportunities for adaptive reuse, and aligning resources to meet the needs of today’s learners and
and tomorrow’s community. Across our district, we see how interconnected issues – housing affordability, workforce shortages, demographic shifts, school choice and the advent of Artificial Intelligence – shape the future of public education. These shifts influence not only how students learn, but also how we design, staff, and utilize our buildings in sustainable and flexible ways. As financial pressures increase, we must look beyond traditional models and explore creative ways to share, repurpose, and reinvest in facilities that continue to serve families for generations to come. This is not just about buildings – it is about reimagining how schools anchor and strengthen our community. 2025 marks a turning point for Westminster Public Schools – a year defined by collaboration, thoughtful planning, and community connection. Through the Forward Together Facilities Initiative, we are aligning data with lived experience to ensure our schools and facilities continue to meet the needs of students and families in a changing world. Across every meeting, a common theme has emerged:
Our buildings tell the story of our community – and the people inside them shape the next chapter.
John E. Flynn A Marzano Academy
Index
Page 04
Index
Table of Contents Forward Together
Intro
02
Index
05
Meet the Team
06
Understanding the Issue
08
Community Voice
10
Enrollment
14
Our Changing Community
16
Our Facilities
22
A Changing Educational Landscape
26
The State of School Funding
30
Student Achievement
34
Developing A Rubric
38
From Insight to Action
46
Final Thoughts
54
Page 05
Meet the Team
Bringing Our Community’s Expertise Together The Uplands Development Site & City of Westminster Clock Tower
As our work began, we brought together a diverse team of educators, parents, community members, and district leaders – each bringing unique perspectives, lived experiences, and deep commitment to Westminster’s future. Many were called upon, the net was cast wide, and a hardy, brave group responded – ready to lean in, ask hard questions, and imagine what’s possible. Together, we explored how to make the most of our schools and facilities in a time of change – thinking creatively, approaching challenges from new angles, and keeping students and families at the center of every decision. Meet our Forward Together Team – the partners, collaborators, and community voices helping shape the next chapter for Westminster Public Schools.
NAME
TITLE
SCHOOL/DEPT/ORG
Brian Kosena
Chief Learning Officer
Westminster Public Schools
Brisa Montgomery
Chief Financial Officer
Westminster Public Schools
Carolee Jackson
Vice President, Strategy & Information
Maiker Housing Partners
Christine Martinez
Board of Education President
Westminster Public Schools
Courtney Decker
Parent and Local Realtor
Colorado STEM Academy
Dayne Allbrandt
Science Teacher
Westminster High School
Don Ciancio
Executive Director
Westminster Public Schools
Emily Jennings
Dean of Students
Orchard Park Academy
Eric DeCourcey
Educational Support Professional
WEA Representative
Eric Gardner
Vice Chair
Westminster Chamber of Commerce
Heidi Weekley
Executive Director of Integrated Services
Westminster Public Schools
James Duffy
Chief Operating Officer
Westminster Public Schools
Jeni Gotto
Superintendent
Westminster Public Schools
John McConnell
Planning Manager
City of Westminster
Josh White
Principal
Orchard Park Academy
Kale Eaton
Assistant Principal
Westminster High School
Kristen Hernandez
Executive Assistant
Westminster Public Schools
Lindsey Kimball
Community Services Director
City of Westminster
Melissa Duran
WEA President
WEA Representative
Neal Wolcott
Instructional Coach
Westminster High School
Nick McCoy
Director, Auxiliary Services
Westminster Public Schools
Sara Ceja
Parent
Metropolitan Arts Academy
Steve Saunders
Chief Communications Officer
Westminster Public Schools
Page 07
Understanding the Issue
Understanding the Issue For years, Westminster Public Schools has experienced a steady decline in student enrollment – a challenge shared by many districts across Colorado and the nation. There are many theories about why this is happening: families moving out of the area, declining birth rates, the rise of school choice options, or shifting community demographics. But before we can take action, it is essential that we separate fact from fiction.
Page 08
Enrollment trends are rarely caused by a single factor. Like an ecosystem, our school district is made up of interconnected parts – neighborhoods, families, teachers, and local economies – all influencing one another. When one element changes, the effects ripple throughout the entire system. A new housing development, an economic downturn, or a policy shift can each play a role in shaping where families live and where children go to school.
As enrollment has declined, Westminster has seen more schools operating with smaller student populations. School size influences how staffing, programming, and resources are organized, and each configuration presents different strengths and challenges. Smaller schools may feel more intimate simply because of their scale, while larger schools cultivate strong relationships through intentional systems, team structures, and schoolwide culture work. Across Westminster Public Schools, the commitment to belonging, safety, and meaningful relationships remains consistent regardless of building size.
school size, facilities, and programming interact to shape the educational experience. By studying past trends and examining present realities, we aimed to anticipate what lies ahead. Our goal was not only to understand why enrollment has declined but also to identify opportunities to strengthen our schools and ensure that Westminster Public Schools remains a vibrant, thriving community for generations to come. In other words, the committee was charged with bringing clarity to the chaos that is data.
At the same time, the limitations of small-scale operations have become increasingly apparent. With fewer students, schools have fewer resources to offer a full range of programs and extracurriculars. Advanced coursework, arts opportunities, and specialized electives become harder to sustain when enrollment numbers are low. Teachers and staff often take on multiple roles to cover gaps, stretching already limited capacity. As a result, while small schools can offer a sense of familiarity due to their size, they may lack the breadth of experiences and opportunities that families seek when choosing schools for their children. Recognizing these realities is central to the work of the Forward Together Facilities Initiative (FTFI). The committee has been charged with examining not just where students are, but how school
Orchard Park Academy
Page 09
Community Voice
Grounding Our Work in Community Voice At the very beginning of this process, before data was analyzed or models were built, we began with the most important question of all:
What matters most to our community? We knew that any recommendations about the future of Westminster Public Schools had to be rooted not only in data, but in the lived experiences, values, and priorities of the people we serve. To do that, we engaged the community through a structured conversation built around six key areas – Vision & Values, Criteria for Decision Making, Timeline & Communication, Community Impact & Support, Ideas for Repurposing, and Feedback & Engagement. Each area included a series of open-ended prompts designed to help people reflect on what they believed a school m
Page 10
means to a neighborhood, how decisions should be made, and what principles should guide our work. The responses we received – hundreds of thoughtful, heartfelt comments – provided the foundation for everything that followed. While perspectives varied, several consistent themes emerged across groups. Parents, staff, students, and community members spoke about the importance of schools as neighborhood anchors, places that build identity and connection. They emphasized the need for transparency a
and fairness in decision making, clear communication long before decisions are made, and genuine opportunities for feedback along the way. Many shared creative ideas for how buildings might be repurposed to continue serving the community, even if their role changed. Those early insights became our north star throughout this process. They directly informed the development of our decision-making rubric, shaped our thinking around timelines, and guided conversations about repurposing possibilities. They reminded us that this work is not just about numbers or facilities – it is about people, relationships, and shared values. The community’s input shaped how we approached our analysis, what questions we asked of the data, and how we framed our conversations about the future.
“...this work is not just about numbers or facilities – it is about people, relationships, and shared values.”
Community Voice
Community Engagement
May 8, 2025 – FTFI Community Engagement Event
Page 12
Enrollment
Enrollment Starts With Kids When we look at the root of enrollment trends, one of the most fundamental indicators is birth rates – because fewer births today mean fewer schoolage children in the years ahead. And what the data shows – globally, nationally, and locally – is a clear, sustained pattern: birth rates are declining. On a global scale, many countries are experiencing what demographers call a “demographic transition,” in which higher standards of living, access to education, and improved health care lead to significantly lower fertility rates. Broadly speaking, as societies develop, the number of children per family tends to decline, and that shift has been unfolding almost everywhere in the world. This global pattern is also reflected in the demographic shifts we see close to home. In the United States, the trend is well documented. The national fertility rate recently dipped to historic lows, hovering around 1.6 children per woman, well beneath the 2.1 “replacement level” needed to maintain
Page 14
a stable population absent migration. Births in 2023 dropped about 2% from the prior year, reinforcing a longerterm slide that’s been in motion for more than a decade. Even accounting for minor annual fluctuations, the pattern is unmistakable: the U.S. is having fewer children per family, and that shapes the pipeline of future students.
Turning to Colorado, we see that the state is following the national trajectory – and in fact, declining birth rates here have been especially pronounced in recent years. Colorado’s fertility rate has been falling for some time, and it is among the states with more rapid declines. In Denver County alone, births dropped 6.3% in a single year – a stark example of how quickly change can take hold. The state’s numbers increasingly reflect fewer children being born per woman, mirroring the national picture. At the local level, the same trend is visible within Westminster Public Schools. Data from the Colorado Department of Public Health and Environment (CDPHE) shows that births within the district boundary peaked in the early 2000s at over 1,250 births per year. Since then, the numbers have gradually but consistently declined. By 2022, annual births had fallen below 900, with only a slight uptick to 943 births in 2023. This pattern mirrors what we see globally, nationally, and statewide – and its effects are already visible in Westminster. Lower birth rates today translate into smaller kindergarten classes tomorrow and ripple effects throughout the district for years to come. Understanding these long-term demographic shifts allows us to better anticipate changes in enrollment, plan for sustainable staffing and facilities, and continue providing high-quality educational opportunities for every child in our community.
Page 15
Our Changing Community
Our Changing Community: Affordability and Housing Options
Page 16
City of Westminster, CO
The Denver metro area, like much of Colorado, continues to grapple with serious housing affordability challenges that directly affect families, communities, and in turn, school enrollment. Over the past decade, home prices and rents have risen much faster than household incomes, creating a widening gap between what families earn and what it costs to live in the region. As the cost of living outpaces what many families can afford, fewer school-age children are entering and remaining in districts like Westminster.
Demographic data show another important shift: Colorado’s population is aging. According to the Colorado State Demography Office, the share of residents aged 65 and older is projected to grow from 13.3% in 2023 to nearly 19.5% by 2050. As older Coloradans “age in place,” fewer homes are being put on the market, reducing turnover and limiting opportunities to younger families to purchase homes in established neighborhoods. A University of Michigan study cited in the data notes that 88% of adults aged 5
50-80 want to remain in their homes. This combination of rising costs and limited housing availability has broad implications for Westminster and neighboring districts. Younger families – those most likely to have school-aged children – are increasingly priced out of homeownership and, in many cases, moving to more affordable communities outside the metro area. Meanwhile, aging homeowners are staying put, constraining the natural housing cycle that brings new families into the district. These housing and affordability pressures are key factors influencing local enrollment trends and must be considered alongside birth rates, mobility patterns, and broader economic shifts as the district plans for the future. In addition to affordability and aging-in-place trends, redevelopment patterns across the Denver metro area are also reshaping who is able to live, and remain, in our communities.
Gentrification, Infill Development, and Their Impact on Families Across the Denver metro area, gentrification has become an increasingly visible force shaping both housing and community life. As older neighborhoods are redeveloped and new amenities attract higher-income residents, housing prices often rise sharply
Page 17
sharply – sometimes outpacing the ability of long-time residents to remain in their homes. This process can bring new investment, improved infrastructure, and revitalized public spaces, but it also tends to displace lower-income families and renters, many of whom are raising young children. Development within the boundaries of Westminster Public Schools represents a subtle but steady renewal of Westminster’s oldest neighborhoods. Once characterized by 1950s subdivisions, low-slung industrial parcels, and limited new investment, this area is now defined by a wave of small-scale infill, townhome communities, and flex-commercial redevelopment that is methodically modernizing the landscape.
In Westminster and surrounding communities, infill development – the practice of building new housing or mixed-use projects within existing urban areas – plays a central role in this transformation. While infill can make efficient use of land and support sustainability goals by concentrating growth where infrastructure already exists, it also changes the social and eco
Page 18
economic fabric of neighborhoods. New developments often feature higher-priced homes, luxury apartments, or townhomes, which may be out of reach for many working families. As a result, the population mix shifts: older, more affordable housing stock disappears, and families with children move farther out in search of attainable housing. For schools, the ripple effects are significant. Gentrification and infill development can lead to declining enrollment in historically familycentered neighborhoods, even as new buildings and amenities rise nearby. The children most affected are those from lower-income households and communities of color – students who lose not only their homes but also the continuity of neighborhood schools, friendships, and support networks. At the same time, areas experiencing new development may not immediately see an influx of school-age children, as many new residents tend to be young pr
professionals or retirees without children. This creates a paradox: neighborhoods can appear vibrant and growing while local school enrollment continues to fall. Currently, despite the growth, our neighborhoods remain recognizably local. The pace and scale of change allow for continuity – existing residents adapt, new families move in, and the physical rhythm of the streets remains intact. Over time, the cumulative effect will be a rebalanced housing ecosystem – one that supports seniors aging in place, young professionals seeking attainable ownership, and small businesses operating within walking distance of homes. Taken together, rising housing costs, limited turnover from aging-in-place, and redevelopment patterns all contribute to fewer school-age children living within the Westminster Public Schools boundary. These pressures have reduced the number of young families entering established neighborhoods and have accelerated out-migration to more affordable areas. The population drop between 2019 and 2021 reflects this combination of reduced mobility and affordability challenges. Looking ahead, Westminster’s ability to stabilize enrollment will depend on the availability of attainable housing for families with children and on policies that balance redevelopment with longterm community stability.
A Deep Dive Into Our Neighborhoods Understanding our community begins with seeing the big picture – but true insight emerges when we look closer. District-wide trends show that Westminster, like the broader Denver metro region, is experiencing shifts that affect school enrollment. These macrolevel patterns establish the context, but to understand how they impact families and schools on a day-to-day basis, we must examine what is happening within individual neighborhoods. However, macro-level data can only take us so far. To truly understand the people and neighborhoods that make up our community, we must also look at the micro level – the individual census tracts that reveal how these broader forces play out block by block, street by street. By reviewing detailed census tract data on educational attainment
Page 19
attainment, household composition, income, employment, housing type, school enrollment, age, and poverty, we can see the nuanced story behind district-wide averages. This deeper look shows how district-wide trends impact schools differently depending on the neighborhood.
Page 20
For example, while district-level data may show stable median incomes or homeownership rates, the tract-level data reveal that some neighborhoods are thriving economically while others face deep financial strain. In certain areas, the majority of residents rent rather than own, which often correlates with higher mobility and more frequent s
student turnover in schools. In other tracts, differences in age distribution, employment opportunities, and educational backgrounds shape how families connect with schools and the kinds of supports communities need to thrive. This micro-level view allows us to pinpoint where supports are most needed and where opportunities exist to strengthen community partnerships. It helps us recognize that Westminster is not one uniform district, but rather a collection of distinct neighborhoods – each with its own identity, assets, and challenges. By combining macro-level understanding with micro-level analysis, we can move beyond generalizations to build more targeted, equitable, and responsive strategies for the future of our schools and families. These differences directly inform which schools may face sustained enrollment decline and which neighborhoods may require different facility configurations or services. In essence, big data helps us see the forest, but small data helps us understand each tree. Both perspectives are vital as we work to ensure that every child, in every neighborhood, has the opportunity to thrive within Westminster Public Schools.
Overlook of the Hyland Greens Neighborhood, Westminster, CO
Page 21
Our Facilities
Taking a Closer Look at Our Facilities
Page 22
Westminster High School
Page 23
Now that we have a clearer picture of our neighborhoods, it is important to take the same thoughtful approach with our schools. Just as our neighborhoods vary, our facilities do too, and understanding both is essential to thoughtful long-term planning. Westminster’s school buildings differ in age, design, and the type of learning environments they offer. Some were built decades ago and have been updated over time, while others are newer and reflect modern standards of construction and technology. Each school tells part of the district’s story – its growth, its priorities, and its commitment to serving students well. To better understand the condition of our facilities, Westminster Public Schools uses a Facility Condition Index (FCI) – a standardized tool that helps assess
assess and compare the physical state of school buildings. The FCI measures the cost of needed repairs and upgrades against the replacement value of the facility. In simple terms, it is a ratio that helps us see how much investment a building may need to remain functional and safe over time. A lower FCI score indicates a building that is generally in good condition, with relatively minor maintenance needs. In contrast, a higher FCI score suggests that a school may require more significant repairs, renovations, or modernization to meet educational and operational standards. Facility conditions directly influence students’ daily experiences – from reliable heating and cooling for classroom comfort, to systems that promote a sense of safety, and classroom configurations that promote optimal learning
FCI RATING
DEFINITION OF FCI CONDITION
Excellent
The facility is in like-new condition. There are minimal to no repairs required beyond routine maintenance. Building systems are fully functional, efficient, and up to date with current codes and standards.
Good
The facility is in good working order with only minor repairs or maintenance needed. Most systems are functional and serviceable. No major building deficiencies affect operations or safety.
Fair
The facility shows signs of wear and aging. Several systems may need attention, and moderate repairs are necessary. Functionality is acceptable but may not meet current performance standards in all areas.
Poor
The facility is deteriorating, with multiple systems in need of major repair or partial replacement. Operational challenges are present, and building conditions may hinder performance or occupant satisfaction.
Critical
The facility is in failing condition, with significant structural or system issues. It may be unsafe, non-functional, or unsuitable for continued use without substantial investment. Full replacement may be more costeffective than repair.
Page 24
learning conditions. The strength of the FCI is that it allows us to look at schools individually and collectively. We can examine a single building to understand its specific needs – like roof replacement, mechanical systems, or accessibility improvements – or we can compare multiple schools across the district to identify trends and prioritize resources. This data-driven approach ensures that decisions about facilities are made fairly, transparently, and with a longterm view of sustainability. This helps the SCHOOL/BUILDING
REPLACEMENT COSTS
the district prioritize investments in ways that maximize long-term value, reduce costly reactive repairs, and ensure resources are used sustainably. Ultimately, the Facility Condition Index gives us more than just numbers – it provides a framework for stewardship. It helps us balance immediate maintenance needs with future planning, ensuring that every student learns in a space that is safe, functional, and conducive to high-quality education.
REPAIR COSTS
CALCULATED FCI (%)
FCI CONDITION RATING
Auxiliary Services
$38,039,950
$9,936,220
26.12
Fair
CSLA
$52,124,800
$5,193,648
9.96
Good
DeSpain
$5,200,650
$4,175,310
80.28
Critical
ECC FM Day
$22,262,500
$1,801,750
8.09
Good
ECC Gregory Hill
$15,546,700
$1,358,770
8.74
Good
England Park
$1,000,000
$28,000
2.80
Excellent
Fairview
$21,222,500
$4,123,650
19.43
Fair
Flynn
$19,228,300
$2,975,370
15.47
Fair
Harris Park
$22,746,100
$2,764,778
12.15
Fair
Hidden Lake Secondary School
$74,750,000
$69,515,000
93.00
Critical
Hodgkins
$52,000,000
$5,030,000
9.67
Good
Landgraf Center
$3,725,800
$57,320
1.54
Excellent
Mesa
$23,795,850
$183,045
14.16
Fair
Metropolitan Arts Academy
$20,566,650
$1,209,692
5.88
Good
Orchard Court
$2,318,550
$420,937
18.16
Fair
Orchard Park Academy
$39,000,000
-
0.00
Excellent
Ranum Innovation Campus
$118,720,550
$71,007,335
59.81
Poor
Shaw Heights Middle School
$53,842,100
$6,810,951
12.65
Fair
Sherrelwood
$20,577,700
$5,358,856
26.04
Fair
Stadium
$6,123,000
$5,326,000
86.98
Critical
STEM Elementary
$17,309,500
$9,696,400
56.02
Poor
STEM Middle (Union)
$16,762,850
$17,190,785
102.55
Critical
Shaw Primary
$2,575,300
$2,221,812
86.27
Critical
Sunset Ridge
$20,058,350
$1,492,026
7.44
Good
Technology Services
$8,582,600
$4,260,356
49.64
Poor
Tennyson Knolls
$21,752,250
$6,182,335
28.42
Fair
Vallez Center
$13,000,000
$1,150,000
8.85
Good
WAIS
$15,748,850
$4,557,854
28.94
Fair
Westminster High School
$232,700,000
$9,889,000
4.25
Excellent
A Changing Educational Landscape
A Changing Educational Landscape Education today is evolving faster than ever, shaped by a mix of demographic, technological, and societal forces. Families now have more choices than at any point in history – charter schools, online programs, homeschooling, and open enrollment policies allow students to cross district boundaries with ease. For Westminster Public Schools, this has created a dynamic “import and export” pattern: each year, some families choose to attend schools outside the district while others transfer in. The data show that student export has consistently exceeded import, meaning more students leave the district than enter. However, recent years reveal signs of stabilization, with both imports and exports increasing slightly in 2023, narrowing the gap. This suggests that while competition for students remains strong, Westminster continues to attract families who value its programs, innovation, and community-centered approach.
Page 26
Choice is not the only disruptive force shaping today’s educational landscape. At the same time, education is being reshaped by the rise of artificial intelligence and technology integration. Students today are learning in ways that extend beyond the traditional classroom, and schools must continually adapt to ensure relevance and engagement. These new learning modalities create exciting opportunities but also demand new skill sets from educators – further emphasizing the importance
importance of a strong and stable teaching workforce. These shifts also influence the kinds of spaces, technologies, and staffing models schools must plan for, making them directly relevant to long-term facilities decisions. Yet, across the nation, school districts face an unprecedented teacher shortage. This challenge isn’t solely a result of working conditions or compensation; it is also driven by a sharp decline in the number of individuals entering the teaching profession. Over the past decade, enrollment in teacher-preparation programs has dropped dramatically – from more than 650,000 students in 2008-09 to roughly 400,000 in 2020-21. Fewer people entering the field means a shrinking pipeline of qualified teachers just as schools face increasing complexity in instruction, technology, and student needs. This decline also mir mirrors national trends in higher education, where overall college enrollment has fallen and many young people are re-evaluating the cost, relevance, and return on investment of a four-year degree – factors that further constrain the pool of future educators.
For Westminster Public Schools, the challenge ahead is not simply to respond to these changes but to lead through them: to continue offering innovative, personalized learning experiences that attract and retain families while supporting the teachers who make that mission possible. Page 27
Together, these forces – greater school choice, shifting demographics, advances in technology, and a shrinking pipeline of new educators – paint a picture of an educational system in transition. At the same time, WPS must navigate the same economic headwinds confronting districts across Colorado. Staffing shortages in high-need areas persist, as the district works to recruit and retain bilingual educators and support staff amid high housing and childcare costs. Inflationary pressures strain budgets, especially in communities where property valuations vary widely, and labor shortages continue to affect critical services such as special education, transportation, and student support. Given Westminster’s demographics – 88% low-income and 33% English Learners – these challenges underscore the urgency of developing innovative compensation models, grow-your-own educator pipelines, and community partnerships that strengthen the local workforce. In an era defined by choice and change, adaptability, creativity, and deep community connection will be Westminster’s greatest strengths as it continues to chart a path forward for its students, families, and educators. These dynamics also influence the district’s ability to sustain programs and staffing across multiple sites, making strategic facility planning even more essential.
Page 28
WPS New Teacher Welcome Reception
Page 29
The State of School Funding
From Colorado’s Big Picture to Westminster’s Reality Over the past decade, Colorado’s story of school funding has been one of gradual recovery from deep cuts, cautious optimism, and persistent challenges. Following the Great Recession, the state implemented what became known as the Budget Stabilization Factor (BSF) – a mechanism that allowed lawmakers to withhold a portion of constitutionally required education funding each year in order to balance the broader state budget. For more than a decade, that factor created a gap of billions of dollars between what districts were owed under the law and what they actually received. The impact of those reductions rippled across Colorado’s 178 school districts. Many struggled to keep up with inflation and the growing costs of salaries, benefits, and maintenance, whh
Page 30
while also addressing the diverse academic and social needs of students. Over time, districts learned to stretch every dollar, often deferring building improvements or limiting program expansion in order to maintain basic operations. After years of advocacy and incremental progress, the 2024-25 fiscal year marked a long-awaited turning point: Colorado officially eliminated the Budget Stabilization Factor, fully restoring funding to the level required under the state’s Public sc
School Finance Act for the first time since 2009. The statewide base perpupil amount rose to $8,496, and total “program funding” for K-12 schools reached nearly $9.74 billion. While this milestone represents an important step forward, many educators caution that the state is still playing catch-up after more than a decade of underfunding. Inflation, enrollment declines, and growing student needs continue to challenge the system’s financial balance. Adding complexity, the source of revenue for schools is shifting. As property values in many areas have surged, the local share of education funding has increased while the state share has declined. This shift is not uniform – districts with lower property wealth or limited mill-levy capacity continue to face inequities compared to wealthier counterparts. To help close that gap, lawmakers have introduced efforts such as mill-levy equalization and matching programs, though these reforms are still in their early stages. For Westminster Public Schools (WPS), these statewide developments bring both relief and new realities. Like many districts, Westminster benefited from the temporary boost of federal ESSER funds, which provided critical support during and after the pandemic. However, as those one-time dollars expired in 2024, the district had to adjust to operating once again on its ongoing state and local revenues. The restoration of baseline funding also provides
provides more predictability for longterm facility planning, even as other pressures remain. The district’s most recent Annual Comprehensive Financial Report reflects this transition. While WPS maintains a healthy overall financial position, the report shows a $2.5 million decrease in net position from the prior year, largely due to the winddown of federal relief funds and major investments in capital improvements, such as the “Ranum Reimagined” project. The general fund balance also declined slightly as the district balanced ongoing needs with one-time expenditures aimed at long-term benefit. On a per-student basis, Westminster’s spending – approximately $18,400 per pupil – places it above the statewide average, reflecting the district’s commitment to maintaining small class sizes, supporting high-needs learners, and investing in its facilities. Yet even with these investments, financial stability remains closely tied to enrollment trends, property values, and the overall health of the state budget. Looking ahead, the end of the Budget Stabilization Factor and the increase in the statewide per-pupil rate provide a more stable foundation for planning. But stability does not mean certainty. The district must continue to navigate an evolving financial landscape where economic shifts, enrollment changes, and state policy decisions all influence the
Page 31
feel known as individuals. These qualities are not exclusive to small campuses, but they often emerge naturally when school size is limited. For Westminster Public Schools and districts like it, these schools play a vital role in meeting the diverse needs of students and families who thrive in more personalized settings.
the resources available to students. While restored funding improves predictability, enrollment declines still directly affect the resources available to the district, making long-term sustainability closely tied to thoughtful facilities planning. In short, the past decade in Colorado school finance has been a story of slow restoration – of climbing back toward adequacy after years of shortfall. For Westminster Public Schools, that story now turns toward stewardship: ensuring that renewed funding and local resources are used strategically to strengthen instruction, modernize facilities, and sustain the promise of a high-quality education for every learner in the community.
The Challenge of Small Schools and Budgeting Operating small schools presents both a philosophical commitment and a financial challenge. Small schools can offer close-knit environments where relationships are strong and students feel
Page 32
Yet, small schools also magnify the financial pressures inherent in Colorado’s funding model. Because school budgets are largely driven by per-pupil funding, enrollment size directly influences the resources available to operate a campus. Fixed costs – such as building maintenance, utilities, and administrative staffing – do not scale down proportionately when enrollment declines. As a result, smaller schools often face higher per-pupil expenditures than larger campuses, even when operating efficiently. These cost dynamics directly influence how the district evaluates the long-term sustainability of its school configurations and overall facility utilization. Evaluating a school solely by its perpupil expenditure, however, provides an incomplete and sometimes misleading picture of effectiveness. On one hand, this metric can illuminate inefficiencies or inequities across schools and serve as a valuable tool for fiscal accountability. On the other hand, it fails to capture the context behind the numbers – such as the additional costs of serving higher proportions of Eng
2024-2025
PUPIL HEAD COUNT
TOTAL EXPENDITURES & ENCUMBRANCES
COST PER PUPIL
Early Childhood Center: Gregory Hill
137
$2,815,127.93
$20,548.38
Early Childhood Center: FM Day
-
-
-
Harris Park Elementary
234
$2,738,519.94
$11,703.08
Mesa Elementary
317
$4,138,846.34
$13,056.30
Sherrelwood Elementary
204
$2,965,731.20
$14,537.90
Ranum Innovation Campus
-
$8,483.01
-
Shaw Heights Middle School
321
$14,106,756.98
$43,946.28
Westminster High School
2,010
$21,519,043.24
$10,705.99
Hidden Lake Secondary School
340
$5,416,853.16
$15,931.92
Colorado STEM Academy
415
$3,808,848.85
$9,177.95
Westminster Academy for International Studies
258
$3,391,950.52
$13,147.10
John E. Flynn A Marzano Academy
354
$3,673,847.50
$10,378.10
Hodgkins Leadership Academy PK-8
597
$7,300,499.09
$12,228.64
Metropolitan Arts Academy
302
$3,776,285.91
$12,504.26
Colorado Sports Leadership Academy
425
$5,171,427.22
$12,168.06
Orchard Park Academy
531
$6,322,493.71
$11,906.77
Tennyson Knolls Preparatory School
364
$4,894,603.62
$13,446.71
Fairview K-8
397
$4,283,220.75
$10,788.97
Sunset Ridge K-8
449
$4,870,112.51
$10,846.58
English Learners, students with disabilities, or families facing poverty. It also overlooks the qualitative benefits small schools provide: stronger relationships, safer environments, and more responsive support systems. In other words, cost per pupil is not the same as value per pupil. A small school with higher per-student costs may be delivering deeper impact for the students it serves, particularly when those students require more intensive supports. At the same time, sustaining multiple small campuses with limited state funding can strain district resources and limit flexibility for innovation elsewhere.
For Westminster Public Schools, this means asking not just how much is spent per student, but what those dollars achieve in terms of growth, belonging, and opportunity. True fiscal stewardship demands more than efficiency; it requires clarity about purpose and equity in the outcomes we pursue.
The challenge, then, lies in finding the balance – aligning financial sustainability with educational quality. For Colorado STEM Academy
Student Achievement
What the Numbers Mean – and What They Don’t
Page 34
A Child Learning in a WPS Classroom
When we talk about “achievement,” we are usually pointing to test scores – useful snapshots of how students performed on a particular set of standards on a particular day. These scores help us see trends and ask better questions. But two cautions are essential. First, schools with lower enrollment swing more: a change of just a few students in a small grade or program can move achievement scores up or down by several points, even when instruction hasn’t meaningfully changed.
1990s levels, while math scores, though above the 1990s, are still below their 2013 peak. Younger students (age 9) saw the largest recorded drop in reading since 1990 and the first-ever drop in math between 2020 and 2022; more recent reporting continues to show uneven progress and widening gaps for lower-performing students. These cautions apply at every level, from national assessments to state measures to our own district data.
Large-scale testing programs like the National Assessment of Educational Progress (NAEP) explicitly warn that sample size affects how stable year-toyear changes are. Second, scores are one measure – they should be read alongside growth data, coursework, attendance, course-taking patterns, and the supports students receive. More broadly, academic achievement reflects just one dimension of a school’s performance. Schools also cultivate social and emotional development, ensure safety and nourishment, connect families to community resources, and build belonging and civic responsibility, equally vital functions in defining a school’s true quality and impact.
Colorado‘s state assessments (CMAS) tell a similar story. Statewide, math has shown gradual improvement from post-pandemic lows, while ELA/literacy gains are smaller and not yet back to pre-2020 levels in several grades. The Colorado Department of Education’s 2024 release and State Board materials describe this slow climb and note persistent subgroup gaps.
The National Picture National results show a long recovery arc. After pandemic-era declines, the Nation’s Report Card (NAEP) indicates that reading scores remain near early19
Colorado Trends
Westminster Public Schools Trends Accountability looks at multiple measures. Colorado’s District and School Performance Frameworks combine achievement, growth, and postsecondary/workforce readiness; they are designed to inform improvement planning and supports, not to prescribe facility actions. At the district level, Westminster’s results reflect both the statewide context
Page 35
context and our community’s unique demographics. In 2023-24, 22.8% of WPS students met or exceeded expectations in ELA, and 15.7% met or exceeded in math. These figures come with very high participation, which is important for interpreting results. One additional point matters when reading Westminster’s results: cohort size and makeup differ across schools and grade levels. In smaller cohorts – particularly within specific programs or grade bands – even a few students moving between performance levels can cause large percentage shifts from year to year (this is a known measurement effect in assessment reporting). This volatility makes achievement trends especially unreliable as a basis for facility decisions.
So, What Should Scores Be Used For? Scores are powerful for program evaluation – for example, to check whether
Page 36
whether a new literacy adoption is moving early-grade reading in the right direction, or whether a tutoring model is improving math outcomes at certain schools. They can help target supports (professional learning, intervention time, scheduling, materials) and surface bright spots to scale. Achievement data is essential for program improvement, but not for determining how facilities are configured or which schools should remain open.
...And What They Should Not Decide On Their Own Test scores, by themselves, are not a sound basis for closing a school building. Closure decisions – when they are on the table at all – are typically driven by enrollment trajectories, facility condition and capacity, safety, long-term operating costs, geographic access, and equity. Achievement data can and should inform how we support students within a building or whether a program is effective, but it should not be the deciding factor in whether a facility stays open. That approach aligns
“Achievement data can and should inform how we support students within a building or whether a program is effective, but it should not be the deciding factor in whether a facility stays open.” with how Colorado‘s accountability system is built – to diagnose and support schools, not to mandate facilities outcomes.
Bottom Line Nationwide and statewide, achievement is recovering unevenly; in Westminster, results mirror those challenges while also reflecting our local context. Use scores to learn and adjust – to strengthen curriculum, expand effective practices, and direct resources where they matter most. But when the conversation turns to facilities, keep achievement in its proper role: a program and support lens, not a closure lever. In the FTFI process, achievement helps us understand student needs, but not determine which buildings should close.
Metropolitan Arts Academy
Page 37
Developing A Rubric
Building a Framework for Fair, Transparent Decisions After months of study and discussion, the committee now faces the critical task of translating data into direction. We’ve explored every dimension of the district’s landscape – birth rates, housing trends, community demographics, enrollment shifts, facility conditions, per-pupil spending, and student achievement. Each dataset tells part of the story, but together they must inform clear, balanced, and defensible decisions about the future of our schools. The tool that allows us to do that systematically is a rubric. A well-designed rubric provides the foundation for trust and transparency. It clearly defines what factors will be considered, how they will be measured, and how much weight each will carry. This ensures that decisions about potential school closures, consolidations, or repurposings are not
Page 38
“A well defined rubric provides the foundation for trust and transparency” driven by emotion, assumptions, or anecdotes – but by a structured, evidence-based framework. By making the criteria public and consistent, the rubric allows every stakeholder to see how conclusions are reached, even if they may not agree with the outcomes.
Weighting the individual components – such as facility condition, enrollment trends, or educational outcomes – is a vital part of this process. Not every factor carries the same importance, and assigning weights helps reflect the district’s values and strategic priorities. For instance, facility safety and longterm viability may be considered foundational, while per-pupil spending and achievement trends help indicate sustainability and effectiveness. Weighting makes the rubric both rigorous and realistic, acknowledging that decisions must balance fiscal responsibility with educational opportunity. To ensure that this framework reflects the priorities of our community, the committee invited public participation through a forced-choice activity – an opportunity for families, staff, and residents to share what matters most to them. By asking participants to make choices between competing priorities (for example, “Which is more important – condition of the facility or enrollment stability?”), we can better understand the collective values of our community a
and incorporate them into the final rubric design. Ultimately, the goal of the rubric is not just to produce a score – it is to guide a sound, defensible decision-making process. When complete, it will help the committee and the Board of Education evaluate each school on consistent criteria, see patterns across the district, and make recommendations that are equitable, data-informed, and forwardlooking. In the end, the rubric represents something larger than a decision tool – it embodies a commitment to fairness, transparency, and integrity. It ensures that when difficult choices must be made, they will rest not on sentiment or pressure, but on shared values, clear evidence, and the collective wisdom of our community.
Page 39
In reviewing the community input, academics was by far the most important data point in deciding whether or not to close, consolidate, or repurpose a school when compared to the other data points. Academics
Facility Condition
Academics
Census Data
Census Data 16.9%
Facility Condition 20.3%
Academics 79.7% Academics
Academics 83.1%
Budget
Academics
Enrollment
Enrollment 25.4% Budget 35.6%
Academics 64.4% Academics 74.6%
Facility Condition was more important than the cost to operate a school and significantly outweighed neighborhood level data (census data). Facility Condition Facility Condition
Budget
Census Data
Census Data 13.6%
Budget 39%
Facility Condition 61%
Page 40
Facility Condition 86.4%
Enrollment was more important than the condition of the facility and, like facility condition above, outweighed neighborhood level data (census data). Enrollment
Facility Condition
Enrollment
Census Data
Census Data 35.6% Facility Condition 45.8% Enrollment 54.2% Enrollment 64.4%
And finally, Budget out performed enrollment and neighborhood level data (census data). Budget
Budget
Enrollment
Census Data
Census Data 18.6%
Enrollment 42.4%
Budget 57.6%
Budget 81.4%
While the community’s overall prioritization of data aligned with the committee’s, there were two notable differences. First, the community rated academics as the most important factor when considering school closures or repurposing. We understand this instinct – schools exist to teach children, and families naturally look to ac
academic performance as a key sign of success. However, for this task, we are making a facilities decision, not evaluating the quality of a school’s program, teachers or students. To build a responsible long-term plan, we must rely on the data that best predicts whether a building can sustainably serve students for many years.
Page 41
Academic performance tells us about the program – not the building. A simple analogy helps: if your car has engine trouble, that doesn’t automatically mean the garage it sits in is faulty. Likewise: A school with strong academics might be in a building that is aging, costly to operate, or under-filled. A school with weak academics might be in a building that functions perfectly well. Why academic scores are not reliable indicators for facilities decisions: Many of our schools are small, so test scores can swing dramatically from year-to-year with only a few students. Building condition does not determine academic performance – strong academics can occur in old facilities, and weak academics can appear in newer ones. To be clear, academic performance is essential for student learning, but it does not tell us whether a facility should remain open. This is why the committee rated academic data lower for this specific decision about longterm building sustainability. Second, the community rated census data as the least important factor, while the committee considered it equally important to enrollment and budget. When deciding whether a school building should stay open, close, or be repurposed, one of the most critical questions is: “will this building have enough children living nearby in the coming years to remain viable?”
Page 42
Census data helps answer that. It is not a single number, but a collection of indicators about the neighborhood, including: Number of children living in the area Families with young children moving in Homeownership vs. rentals (stability of population) Median age of adults Household size Income levels (which correlate with mobility and birth patterns) Together, these clues help us understand if a neighborhood is: Child-focused (many school-aged children today) Entering the child-rearing phase (younger adults likely to have children soon) Exiting the child-rearing phase (fewer children expected in the future) Facilities decisions last 10-30 years, so we must look ahead – not only at current enrollment. A school may appear full today but be located in a neighborhood where the number of children is likely to decline. This longterm view is why the committee rated census data highly. It helps prevent repeated cycles of closing a school, shifting students, and then facing the same issue again a few years later. After extensive discussion, careful review of community input, and thoughtful debate among committee members, the committee adopted the following final rubric:
Page 43
Page 44
Orchard Park Academy
Page 45
From Insight to Action
Translating Our Learning Into Clear Recommendations To bring clarity and consistency to its work, the FTFI committee applied the adopted rubric scoring to each school across five key categories: facility condition, enrollment trends, budget efficiency, neighborhood demographics, and academic context. The table below reflects the results of that process, showing how each school performed within the rubric and how those scores translate into viability categories. This analysis provided the foundation for the committee’s final recommendations, ensuring that decisions were grounded in data, aligned with community values, and mindful of long-term sustainability. FCI
ENROLLMENT
BUDGET
CENSUS
ACADEMICS
TOTAL SCORE
Harris Park
SCHOOL
15
4
20
12
6
57
Mesa
15
8
12
8
6
49
Sherrelwood
15
8
12
12
8
55
CSLA
20
4
20
12
8
64
Fairview
15
12
20
12
10
69
Hodgkins
20
12
12
16
4
64
Orchard Park
25
20
12
12
6
75
Sunset Ridge
20
16
20
12
6
74
Tennyson Knolls
15
8
20
12
4
59
Colorado STEM Academy
10
20
12
12
4
58
Flynn
15
12
12
12
8
59
Metropolitan Arts Academy
20
4
12
8
10
54
WAIS
15
12
12
12
8
59
Shaw Heights
15
4
8
12
8
47
Hidden Lake
5
20
8
12
6
51
Westminster High School
25
8
16
12
8
69
Page 46
SCORE RANGE
COLOR
CATEGORY
RECOMMENDED ACTION
65-75
Green
High Viability
Keep open and invest. These schools are stable, efficient, and well-supported by community demographics.
58-64
Green/Yellow
Moderate Viability
Keep open, but monitor closely. Explore efficiency measures or boundary adjustments.
53-57
Yellow
Borderline
Candidate for consolidation or repurposing. School has assets but may not sustain viability on its own.
47-52
Red
Low Viability
Candidate for closure within 1-3 years. Prepare community engagement and transition plans.
Three schools were rated as Low Viability in the rubric and identified as candidates for closure. These schools fell into the lowest score band due to a combination of facility challenges, enrollment decline, budget inefficiencies, and neighborhood demographic trends. Hidden Lake Secondary School received one of the lowest overall scores, driven primarily by significant facility condition concerns. The building requires extensive repairs, and the estimated cost to bring it to current standards approaches the cost of constructing a new school of similar size. These substantial maintenance needs, combined with structural limitations, have contributed to rising per-pupil operating costs. The committee agrees that the facility should be retired, but recommends that the program itself – valued by students and families – be relocated to a more suitable site within the district. Shaw Heights Middle School was rated Low Viability largely due to a severe and sustained decline in enrollment. The district’s shift toward PK-8 models at most schools unintentionally reduced Shaw Heights’ fe
feeder patterns, leading to a dramatic drop in student numbers. This decline increased per-pupil costs, as the fixed expenses of running the building are now spread across far fewer students. The committee acknowledges that the Board of Education has already voted to retire the middle school program at Shaw Heights and to consolidate it with Flynn into an expanded PK-8 campus. The rubric results reinforce and support that decision. Mesa Elementary also scored in the Low Viability range. Enrollment has been gradually decreasing, and neighborhood census indicators – such as a higher median age and fewer young children – suggest that this trend will likely continue. These demographic patterns, combined with academic challenges reflected in the rubric, contributed to Mesa’s overall score. The committee also considered Mesa’s proximity – less than half a mile – to the evolving Flynn/Shaw unified campus, where significant renovation and expansion are already underway. This geographic overlap further supports the need to evaluate the long-term sustainability of maintaining Mesa as a separate facility.
Page 47
Of the four schools rated High Viability, the committee recommends no changes to two of them. These schools scored in the top range of the rubric due to strong facility condition, stable or sustainable enrollment patterns, sound budget efficiency, and supportive neighborhood demographics. Westminster High School, the district’s only comprehensive 9-12 high school, should remain as is. The facility is in good condition, and despite some enrollment decline, the school continues to serve the vast majority of students transitioning from grade 8 to grade 9. As a result, its cost per pupil remains within acceptable and efficient parameters. Given its central role in the district’s secondary education system, the committee sees no need for structural or programmatic changes at this time. Orchard Park Academy, the district’s newest school, has maintained stable enrollment since opening in August 2021. The building is in excellent condition, and while the surrounding neighborhoods show mixed indicators regarding future family growth, Orchard Park continues to serve as a strong draw for families in the area. Its performance across all rubric factors supports maintaining current operations without adjustment. Schools rated Borderline in the rubric – and therefore identified as potential candidates
Page 48
candidates for consolidation or repurposing – included the Metropolitan Arts Academy (MET) and Sherrelwood. After reviewing the data and discussing program strengths, the committee recommends no changes for MET at this time. The Metropolitan Arts Academy (MET) operates in a well-maintained facility following major 2020 renovations, performs strong academically, and is financially efficient. Its distinctive arts program – offering dedicated courses in visual arts, music, theater, and integrated arts not available elsewhere in the district – meaningfully elevates its overall rubric score and provides a clear rationale to maintain MET in its current form. The only other school the committee recommends making no changes to at this time is Colorado STEM Academy (CSA). As the district’s first innovation school, CSA has maintained strong and consistent demand, attracting not only Westminster families but also a substantial number of students from outside the district. While the committee recognizes the challenges pre
presented by CSA’s two-building configuration, it also acknowledges that the school has developed effective structures and processes to manage its unique setup successfully. When reviewed in the context of all recommendations – and considering the districtwide picture – the committee determined that CSA should continue operating at its current location. As the committee reviewed the remaining schools, it examined in depth the unintended consequences that the PK-8 model has had on students’ educational opportunities. While families have consistently voiced strong support for PK-8 school – particularly appreciating the social benefits and convenience of keeping siblings together in a smaller setting – these advantages are often accompanied by trade-offs that are less viable. Smaller PK-8 schools typically offer fewer enrichment and elective options than larger schools, especially comprehensive middle schools that can staff a wider range of programs. The committee also discussed the staffing challenges inherent in small PK8 environments. Middle-level teachers are frequently required to assume additional classes to cover the full range of content needed to prepare students for high school and to provide meaningful elective choices. This increased workload can contribute to teacher burnout and turnover. In a time
time of nationwide teacher shortages, the district must be mindful not to create structures that unintentionally push educators away. After weighing these considerations, the committee has proposed a restructuring plan that seeks to balance parent preferences for the PK8 model with the need to expand academic and enrichment opportunities for students, while also reducing unnecessary strain on the district’s workforce. The recommendations made to the remaining schools and programs are as follows:
2026-2027 School Year Sherrelwood will transition to a PK-6 model. Sixth grade will be added beginning in August 2026. As students complete sixth grade, they will matriculate to the Colorado Summit Leadership Academy (CSLA) PK-8 program for grades 7 and 8.
Colorado Summit Leadership Academy
Page 49
2027-2028 School Year Fairview PK-8 will also shift to a PK-6 model. Students in grades 7 and 8 will be reassigned to the Colorado Summit Leadership Academy PK-8 program beginning in August 2027. Westminster Academy for International Studies (WAIS) will relocate programmatically to the Harris Park building, and the two schools will merge to form a unified PK6 program. The school’s international focus will continue as part of the combined program. Students in grades 7 and 8 currently attending WAIS will transition to the Falcon/Uplands PK-8 program. Tennyson Knolls Preparatory School will convert to a PK-6 program with seventh and eighth grade students being reassigned to Hodgkins Leadership Academy.
2028-2029 School Year The Falcon/Uplands PK-8 program will expand from its temporary location in the old Shaw Heights building to encompass both buildings on campus (the former Shaw Heights and Flynn buildings). Mesa Elementary will close and the students reassigned based on redesigned school boundaries. Sunset Ridge PK-8 will convert to a PK-6 program and the seventh and eighth grade
Page 50
graders reassigned to Falcon/Uplands PK-8 program.
the
Mesa Elementary will close (see above). Sunset Ridge PK-8 will convert to a PK-6 model (see above). Hidden Lake Secondary School will move into the former location of Mesa Elementary in the 2029-2030 school year.
How the Committee Chose the School Pairings: Why Two Feeders into a PK-8 Strengthen Transition & Student Experience While “right-sizing” for long-term sustainability is our goal, the FTFI Committee kept one guiding question at the center of its work: how will our recommendations improve and enhance learning, social development, and the overall experience for current and future students? As part of this plan, the FTFI Committee recommends reconfiguring several PK8 programs to PK-6 schools and consolidating grades 7-8 into a smaller s
set of stronger, well-resourced middlegrade programs housed within PK-8 buildings. Creating larger middle-grade cohorts – by combining two or more PK-6 feeders – supports both student experience and instructional quality. This change is designed to: Enhance student experience. Larger, same-grade cohorts create more opportunities for building friendships, social connection and collaborative, age-appropriate learning. Strengthen academic and enrichment programming. Adequate cohort size allows schools to offer more specialized teachers (STEM, arts, world language), expanded elective options, daily advisory/SEL, and flexible, competency-based groupings that are difficult to sustain in small PK-8 schools. Support stable and efficient operations. A concentrated 7-8 model allows for improved scheduling, predictable staffing/FTE, transportation, budget use, and facility utilization – all of which help maintain program quality and longterm sustainability.
Addressing the
struggle to integrate into the receiving school’s culture or bonds. In practice, students transition successfully when we pair the move with intentional, welldesigned supports – much like traditional transitions from elementaryto-middle and middle-to-high school. What matters most is not how long students have been in the building, but the first 90-120 days of structures and supports we put in place. These include: A consistent advisory/SEL model designed for early adolescence. Culture onboarding experiences and shared expectations. Cross-school peer mentoring and team-building. Bridge academics that ease students into middle-grade routines. When two or more PK-6 feeders transition together, students enter 7th grade with a larger group of peers, reducing isolation and strengthening the social fabric of the receiving PK-8 campus.
Why Two Feeders Generally Work Better for Transition &
“Midstream Transition” Concern th
Some families worry that 7 graders entering an already established PK-8 school may feel like outsiders or struggle
Socialization When multiple PK-6 schools converge into a single 7-8 program, students benefit socially, emotionally, and developmentally. Larger, mixed cohorts g
Page 51
give students the peer diversity and opportunity they need to thrive. This structure supports: Immediate peer variety. More incoming students increase the odds each learner finds peers with shared interests, identities or “people like me” and expands friendship circles. A reason to build a shared culture. Two distinct feeder cultures prompt adults to teach a unified middle-grade identity. This prevents one legacy culture from dominating and gives all students equal ownership in the new community. Healthier status dynamics. No single cohort enters as “the group that already knows everyone.” Advisory and house structures can intentionally mix students from both feeders, creating more balanced social dynamics. This is critical for early-adolescent confidence and belonging. Clubs, teams, and leadership at scale. Larger cohorts sustain a richer set of activities, electives, and leadership opportunities. Students have more on-ramps to belonging, more teams to join, and more roles to step into – all of which are essential for middle-grade engagement.
How We Apply This Locally Page 52
To ensure students experience the benefits of larger, well-supported middle-grade cohorts, the district will organize PK-6 schools into two-feeder groupings for 7th - 8th grade. Based on enrollment, geography, capacity, and program design, the recommended two-feeder pairings are: Sherrelwood and Fairview ⟶ Colorado Summit Leadership Academy. Harris Park /WAIS and Sunset Ridge ⟶ Flynn/Shaw. A unique case: Tennyson Knolls Preparatory School (TKP). Presently, TKP 6th graders would transition to Josephine Hodgkins Leadership Academy, primarily due to proximity. As we refine options, TKP could instead pair with Colorado Summit Leadership Academy, which has room to grow and the capacity to support a larger, more diverse 7th grade cohort. This would align the site with the two-feeder benefits above and further strengthen programming and peer networks. Two feeders into a receiving PK-8 typically improve socialization, support healthier culture-building, while enabling a higher-quality middle-grade academic program. In situations where proximity requires a single-feeder arrangement, we will engineer intentional structures to ensure transitioning students are fully integrated into their new school and community and experience the same sense of belonging as their peers.
Our Commitment These feeder recommendations reflect a simple commitment: students deserve middle-grade experiences that help them grow socially, academically, and developmentally. Two-feeder structures give students larger peer groups, richer programming, and more consistent supports. Where a single feeder is the right fit, we will design the transition with care so students feel welcomed, connected, and prepared. Ultimately, this work is about building middle schools that are sustainable, future-ready, and centered on the needs of young adolescents.
Page 53
Final Thoughts
The Thinking Behind the Thinking The Forward Together Facilities Initiative was not just an exercise in identifying which schools stay open or close – it was a deep, values-driven conversation about what Westminster Public Schools must look like in the next 10-20 years in order to serve students well. The recommendations emerged from this central belief:
Students deserve learning environments that are sustainable, equitable, and capable of offering the full range of opportunities needed to prepare them for the future. Page 54
To get there, the committee had to think beyond today’s comfort and consider tomorrow’s reality.
Sustainability Must Guide Every Decision The question we asked repeatedly was: “can this building and this program still serve students a decade from now?” Sustainability is not just about finances – it’s about stability. Schools that struggle with enrollment, staffing, or facility condition create turbulence for students and families. We want fewer surprises, fewer emergency decisions, and fewer sudden changes. Stable schools create stable learning. That is why buildings with declining student populations, aging infrastructure, or rising per-pupil costs could not be recommended for longterm operation – even if the school community
Hidden Lake Secondary School
community is deeply connected and highly supportive.
is a way withdraw.
We Must Be Stewards
We Need to Balance
of Both Money and
What Families Prefer
Opportunity
With What Students
The committee recognized something simple but often overlooked: every dollar spent maintaining an aging, under-enrolled facility is a dollar not spent on instruction, electives, enrichment, counselors, mental health, or staff supports. It isn’t about cutting – it’s about redirecting. Operating too many small schools means spreading resources too thin. When we do that, neither the schools nor the students get what they deserve. The thinking behind the recommendation is that consolidation is
to
invest
forward,
not
Need Families have consistently said they love PK-8 schools. The continuity, relationships, and sense of safety are real benefits. But the committee also had to face the reality beneath the preference: small PK-8s simply cannot offer the breadth of middle school opportunities that students need. We asked ourselves: “what academic and developmental experience do 7th and 8th graders need to be successful in high school and beyond?”
Page 55
The honest answer is: More electives More advanced coursework More consistent staffing More specialized teachers More peer opportunities Mores extracurricular activities Small PK-8s can’t sustain all of that. The recommendation to shift most schools to a PK-6 model while concentrating grades 7-8 in fewer, stronger PK-8 hubs is rooted in this principle: we honor what families prefer, but we choose what students need.
We Must Plan For The
The thinking behind the thinking: we cannot repeat the cycle of opening, closing, and reopening schools every few years. We must right-size now so we avoid instability later.
Students Who Will Be
Stewardship Requires
Here, Not Just The
Us to Differentiate
Ones Here Now
Between Programs
The committee spent significant time looking at birth rates, housing turnover, demographic forecasts, and census patterns. The data was unambiguous: Fewer young families live within district boundaries Birth rates have dropped sharply Housing turnover is slowing Many neighborhoods have fewer – and older – children than before
and Buildings
This means that even if enrollment looks acceptable today, the future pipeline is shrinking.
Page 56
The committee separated two questions that often get tangled together: 1.Is the program strong and valued? 2.Is the building sustainable? These are not the same. A strong, beloved program can be in an unsustainable building. A solid building can house a program that is struggling or too small to continue. By separating these questions, the committee could protect what works – like MET, CSA, and
and Hidden Lake – while still recommending facility changes where needed. The thinking behind this approach is simple:
We preserve the heart of a school even if we cannot preserve its walls. We Must Build a System That Supports Teachers, Not Stretches Them Thin A core insight surfaced early: small PK8s overextend teachers, especially in middle grades.
We Need a Long-Term Vision, Not a One-Year Fix All recommendations were made through the lens of the next generation – not the next budget cycle. The committee asked: What will Westminster’s enrollment look like in 2030? Which buildings will still be financially viable in 2035? How do we ensure stable middleschool programming for the long haul? How do we avoid future school closures by acting responsibly now? The thinking behind the thinking is that short-term comfort can lead to long-term instability, but thoughtful restructuring today creates decades of stability tomorrow.
Teachers often take on multiple subjects, electives, or additional duties simply because a small staff must cover a large range of content. In a time of teacher shortages, this is not sustainable. The thinking behind the recommendation is that strong, healthy schools require strong, supported teachers. Restructuring allows us to rebuild staffing models that are realistic and sustainable.
Mesa Elementary
Page 57
In Summary The recommendations reflect a simple, guiding belief:
Every student deserves access to strong, stable schools that are designed for the future – not the past. By adjusting grade configurations, consolidating where necessary, and investing where it matters, Westminster Public Schools can: Expand opportunities for students Protect unique and valued programs Use resources wisely Keep schools as anchors in their neighborhoods Create long-term stability for families and staff Build a modern school system that reflects the realities of our community This is the thinking – a plan grounded in values, shaped by data, and built for the next decade of Westminster’s story.
Page 58
Page 59
Westminster High School
Page 59