BOUN DARY
Balancingprioritiestocreateequitable, sustainableschoolcommunities

Balancingprioritiestocreateequitable, sustainableschoolcommunities
We engaged in an exercise that explored howgeographyandthebuiltenvironment, neighborhood and community history, and enrollment work together to shape boundarydecisions.
We reviewed a survey designed to bring communityvoiceintotheprocessearlyby identifying what matters most to our community.
We reviewed and priortized criteria to guideourwork.


EnrollmentTrendsbyschool
EnrollmentProjections
StudentLocationScatterPlots
Whatpatternsareemergingacrossalldata? Whatdoyounotice? Whatconcernsyou? Whatquestionsdoyouhave? Wheredoyouseethebiggestchallenges?
Census/NeighborhoodData
Foreachschool,graphthefollowing:
HistoricEnrollmentTrend
HighlightPeakEnrollmentYear
IdentifyCurrentEnrollment
Censustractleveldataisprovidedto helpprovidedeeperinsightsinto individualneighborhoods
Whattrend(s)doyousee?
Whendidthingschange?
Is this a steady increase or decrease? Volatile change?
Are changes uniform across all schools? Where dowehaveoutliers?
Whatsurprisesyou?

Foreachschool,graphthefollowing:
Censustractleveldataisprovidedto helpprovidedeeperinsightsinto individualneighborhoods
Whichschoolsareprojectedtogrow?
Whichschoolsareprojectedtodecline?
Whichschoolsareprojectedtoremainstable?
How do these trends align with the school’s historicenrollmenttrend?
For each school, review the current enrollmentscatterplots
Census tract level data is provided to help provide deeper insights into individualneighborhoods
Are students clustered around the school or spreadoutacrossthedistrict?
Are there “pockets” of students far from the school?
Arestudentsclusteredaroundanotherschool?
Doesitappearasignificantnumberofstudents comefromotherattendanceareas?

A structured process to identify, compare, and make sense of competingperspectivesorexplanationsaroundaproblemorissue,so thatbothcanbeunderstoodandleveragedratherthanchoosingone overtheother.
Benefit:Itreducesblameanddefensivenesswhile revealing deeper root causes, helping groups move from disagreement to clearer thinking and moreeffectivebalancedsolutions.
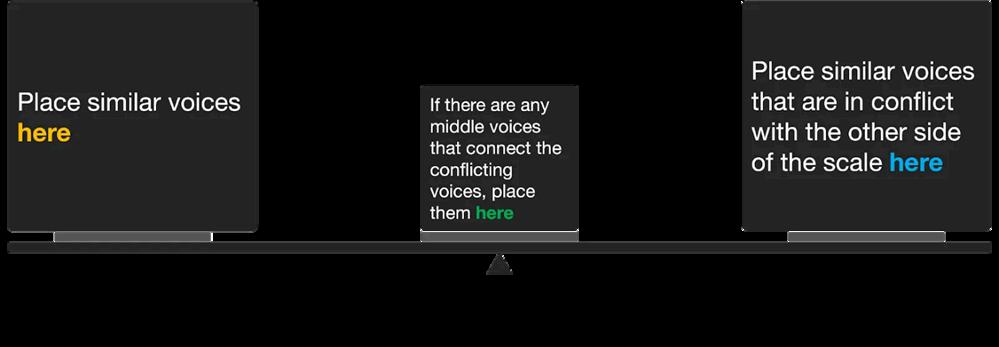
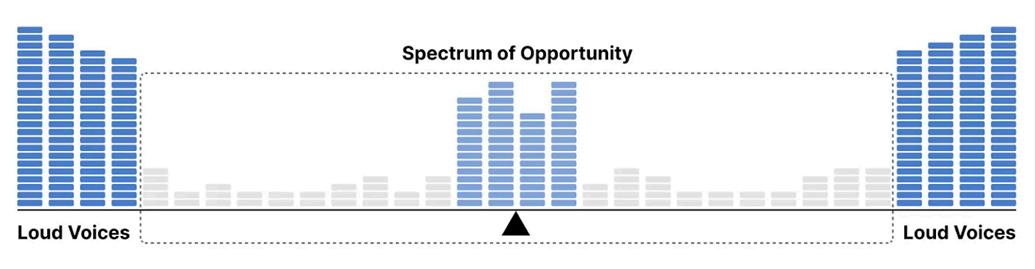
Imagineascalewherewe’veplacedourmostpolarizingdata/voicesat eachend.Lookatthebehaviorsandpainpointsandthinkabouthowto movethosevoicestowardconsensus,thespectrumofopportunity.
It is our nature as humans to be drawn to the mostextremepointsofviewortheloudestvoices.
SystemPerspective:
Ourenrollmentisdecliningdueinlargeparttodeclining birthratesandaffordability.
CommunityPerspective:
Our district is not what it used to be...schools are closing..thedistrictblamesbirthrates...parentsare leaving due to the quality of schools and leadership.
Whatfeelstrueineachstatement?
Whatfeelsincompleteormissing?
Whatemotionsmightbeunderneatheachperspective?
What’sTrue
SystemView
Birth Rates are declining (databacked)
CommunityView
Families are choosing alternatives (observablebehavior)
What’sMissing
Perceptionofquality,trust, identityloss
Demographic trends beyond districtcontrol.
UnderlyingFears
We are being unfairly blamed.
The schools I trusted are disappearing.
Assumptions
This is mostly external (birthrates).
This is mostly internal (leadershipquality).
Isenrollmentdeclineprimarilydrivenbyexternaldemographicshiftsorinternallossoftrustandperceivedquality?
ReframetheProblem
Shiftfromeither/ortoboth/and
From:It’sbirthratesvs.It’sleadershipfailure
To: Birth rates reduce the number of students available, AND trust/quality determineswhetherfamilieschooseus.
External (Can’tControl, MustAdaptTo)
DecliningBirthRates HousingTrends Populationshifts
Internal (CanInfluence)
SchoolIdentityandPride Communicationand Transparency ProgramQualityand Differentiation
FamilyTrustandBelonging
Iffewerstudentsexistoverall,whatwouldmakefamilieschooseusanyway?
TensionMappinghelpsus:
Validatebothdataandemotion
Reduceddefensiveness
Surfaceshiddennarratives
Movestheconverstationtowardagencyandstrategy
Fromthedatareviewedearlier(enrollmenttrends/projections,scatterplots,census data),identifypossibletensions.Forexample:
Overcrowdedschoolsvs.underutilizedschools
Neighborhoodproximityvs.programaccess
Stablecommunitiesvs.shiftingdemographics
Transportationeffiencyvs.equity
FromyournotesinActivity1-3createachartandidentifypotentialtensions:
DataSource WhatweNoticed(Ah-hahs) Concerns WhatmightbeinTension?
HistoricTrends
ProjectedEnrollment
StudentLocation
Inreviewingyouridentifiedtensionsreflecton:
Whatarethecompetingpriorities? Whatmakesthishardtosolve? Whoisimpactedbyeachside?
NametheTension
Wearetryingtobalance:_______________and_________________
What’strueoneachside
Whatfeelstrue?Whatdatasupportsthis?
What’sdrivingeachside
Reframe
Insteadofchoosingbetweenthesides,howmightwethinkaboutboth?
Example: Tension: Wearetryingtobalance:
NeighborhoodproximityANDprogramaccess
Reframe:
StudentsshouldattendnearbyschoolsAND haveaccesstohigh-qualityprograms.
Ofthetensionsidentifiedanddiscussedtoday: Whichofthesetensionswillboundarychangesactuallyhelpsolve? Whichofthesetensionswillnotbeaddressedbyboundarychanges?
Ifwedonothing,wherearewein5years?
Whereareinequitiesbeingamplifiedby currentschoolboundaries?
BoundaryCommittee
TypesofSchoolBoundaries Decision-MakingUnderConstraints
Nextmeeting: IdentifyingandManagingTradeoffs