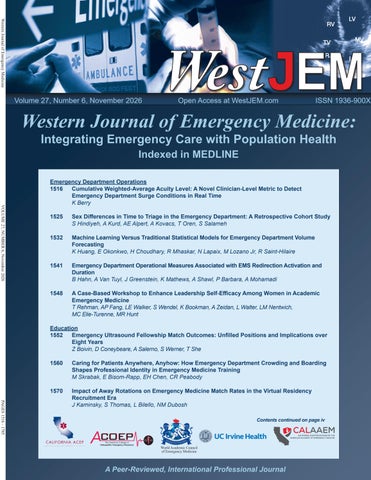
Western Journal of Emergency Medicine
Volume 27, Number 6, November 2026
West
Open Access at WestJEM.com
ISSN 1936-900X
Western Journal of Emergency Medicine: Integrating Emergency Care with Population Health Indexed in MEDLINE
VOLUME 27, NUMBER 6, November 2026
Emergency Department Operations 1516 Cumulative Weighted-Average Acuity Level: A Novel Clinician-Level Metric to Detect Emergency Department Surge Conditions in Real Time K Berry
1525
Sex Differences in Time to Triage in the Emergency Department: A Retrospective Cohort Study S Hindiyeh, A Kurd, AE Alpert, A Kovacs, T Oren, S Salameh
1532
Machine Learning Versus Traditional Statistical Models for Emergency Department Volume Forecasting K Huang, E Okonkwo, H Choudhary, R Mhaskar, N Lapaix, M Lozano Jr, R Saint-Hilaire
1541
Emergency Department Operational Measures Associated with EMS Redirection Activation and Duration B Hahn, A Van Tuyl, J Greenstein, K Mathews, A Shawl, P Barbara, A Mohamadi
1548
A Case-Based Workshop to Enhance Leadership Self-Efficacy Among Women in Academic Emergency Medicine T Rehman, AP Fang, LE Walker, S Wendel, K Bookman, A Zeidan, L Walter, LM Nentwich, MC Elie-Turenne, MR Hunt
Education 1552 Emergency Ultrasound Fellowship Match Outcomes: Unfilled Positions and Implications over Eight Years Z Boivin, D Coneybeare, A Salerno, S Werner, T She
PAGES 1516 - 1785
1560
Caring for Patients Anywhere, Anyhow: How Emergency Department Crowding and Boarding Shapes Professional Identity in Emergency Medicine Training M Skrabak, E Bisom-Rapp, EH Chen, CR Peabody
1570
Impact of Away Rotations on Emergency Medicine Match Rates in the Virtual Residency Recruitment Era J Kaminsky, S Thomas, L Bilello, NM Dubosh Contents continued on page iv
World Academic Council of Emergency Medicine
A Peer-Reviewed, International Professional Journal
Penn State Health Emergency Medicine
JOIN OUR TEAM
EMERGENCY MEDICINE OPPORTUNITIES AVAILABLE
About Us: Penn State Health is a multi-hospital health system serving patients and communities across central Pennsylvania. We are the only medical facility in Pennsylvania to be accredited as a Level I pediatric trauma center and Level I adult trauma center. The system includes Penn State Health Milton S. Hershey Medical Center, Penn State Health Children’s Hospital and Penn State Cancer Institute based in Hershey, Pa.; Penn State Health Hampden Medical Center in Enola, Pa.; Penn State Health Holy Spirit Medical Center in Camp Hill, Pa.; Penn State Health Lancaster Medical Center in Lancaster, Pa.; Penn State Health St. Joseph Medical Center in Reading, Pa.; Pennsylvania Psychiatric Institute, a specialty provider of inpatient and outpatient behavioral health services, in Harrisburg, Pa.; and 2,450+ physicians and direct care providers at 225 outpatient practices. Additionally, the system jointly operates various healthcare providers, including Penn State Health Rehabilitation Hospital, Hershey Outpatient Surgery Center and Hershey Endoscopy Center. We foster a collaborative environment rich with diversity, share a passion for patient care, and have a space for those who share our spark of innovative research interests. Our health system is expanding and we have opportunities in both academic hospital as well community hospital settings.
Benefit highlights include: • Competitive salary with sign-on bonus • Comprehensive benefits and retirement package • Relocation assistance & CME allowance • Attractive neighborhoods in scenic central Pennsylvania
FOR MORE INFORMATION PLEASE CONTACT: Amber Winters, MBA Penn State Health Physician Recruiter awinters@pennstatehealth.psu.edu
Penn State Health is fundamentally committed to the diversity of our faculty and staff. We believe diversity is unapologetically expressing itself through every person’s perspectives and lived experiences. We are an equal opportunity and affirmative action employer. All qualified applicants will receive consideration for employment without regard to age, color, disability, gender identity or expression, marital status, national or ethnic origin, political affiliation, race, religion, sex (including pregnancy), sexual orientation, veteran status, and family medical or genetic information.
Western Journal of Emergency Medicine: Integrating Emergency Care with Population Health
Indexed in MEDLINE, PubMed, and Clarivate Web of Science, Science Citation Index Expanded Quincy Tran, MD, Deputy Editor University of Maryland School of Medicine- Baltimore, Maryland Andrew W. Phillips, MD, Associate Editor DHR Health-Edinburg, Texas Edward Michelson, MD, Associate Editor Texas Tech University- El Paso, Texas Dan Mayer, MD, Associate Editor Retired from Albany Medical College- Niskayuna, New York Gayle Galletta, MD, Associate Editor University of Massachusetts Medical SchoolWorcester, Massachusetts Yanina Purim-Shem-Tov, MD, MS, Associate Editor Rush University Medical Center-Chicago, Illinois
Mark I. Langdorf, MD, MHPE, Editor-in-Chief University of California, Irvine School of MedicineIrvine, California
Soheil Saadat, MD, MPH, PhD University of California, Irvine, School of Medicine, Irvine, California
Shahram Lotfipour, MD, MPH, Managing Editor University of California, Irvine School of MedicineIrvine, California
Brian Yun, MD, MPH, MBA, Associate Editor Boston Medical Center-Boston, Massachusetts
Gary Gaddis, MD, PhD, Associate Editor University of California, Irvine School of Medicine- Irvine, California
Michael Pulia, MD, PhD, Associate Editor University of Wisconsins Hospitals and Clinics- Madison, Wisconsin Patrick Joseph Maher, MD, MS, Associate Editor Ichan School of Medicine at Mount Sinai- New York, New York
Rick A. McPheeters, DO, Associate Editor Kern Medical- Bakersfield, California
Donna Mendez, MD, EdD, Associate Editor University of Texas-Houston/McGovern Medical School- Houston Texas
R. Gentry Wilkerson, MD, Associate Editor University of Maryland
Danya Khoujah, MBBS, Associate Editor University of Maryland School of Medicine- Baltimore, Maryland
Section Editors
Dell Simmons, MD Geisinger Health
Julian Mapp, MD University of Texas, San Antonio
Taylor Burkholder, MD, MPH Keck School of Medicine of USC
Bradford Brobin, MD, MBA Chicago Medical School
Disaster Medicine
Shira A. Schlesinger, MD, MPH Harbor-UCLA Medical Center
Christopher Greene, MD, MPH University of Alabama
Tiffany Abramson, MD University of Southern California
Chris Mills, MD, MPH Santa Clara Valley Medical Center
Jason Pickett, MD University of Utah Health
Shada Rouhani, MD Brigham and Women’s Hospital
Geriatrics
Legal Medicine
Luna Ragsdale, MD, MPH Duke University
Statistics and Methodology
Behavioral Emergencies Marc L. Martel, MD Hennepin County Medical Center Ryan Ley, MD, MBA Hennepin County Medical Center
Cardiac Care
Andrew Milsten, MD, MS UMass Chan Medical Center John Broach, MD, MPH, MBA, FACEP University of Massachusetts Medical School Christopher Kang, MD Madigan Army Medical Center
Sam S. Torbati, MD Cedars-Sinai Medical Center
Scott Goldstein, MD Temple Health
Rohit Menon, MD University of Maryland
Education
Elif Yucebay, MD Rush University Medical Center Mary McLean, MD AdventHealth
Stephen Meldon, MD Cleveland Clinic
Danya Khoujah, MBBS University of Maryland School of Medicine Jeffrey Druck, MD University of Colorado
Gary Gaddis, MD, PhD University of California, Irvine School of Medicine- Irvine, California
Cameron Hanson, MD The University of Kansas Medical Center
Clinical Practice
Casey Clements, MD, PhD Mayo Clinic Murat Cetin, MD Behçet Uz Child Disease and Pediatric Surgery Training and Research Hospital Carmine Nasta, MD Università degli Studi della Campania “Luigi Vanvitelli” David Thompson, MD University of California, San Francisco Tom Benzoni, DO Des Moines University of Medicine and Health Sciences
Shu B. Chan, MD, MS Resurrection Medical Center
Health Equity
Asit Misra, MD University of Miami
Climate Change
Melanie S. Heniff, MD, JD Indiana University School of Medicine
Cortlyn W. Brown, MD Carolinas Medical Center
Soheil Saadat, MD, MPH, PhD University of California, Irvine
Faith Quenzer, DO, MPH Temecula Valley Hospital San Ysidro Health Center
James A. Meltzer, MD, MS Albert Einstein College of Medicine
Victor Cisneros, MD, MPH Eisenhower Health
Monica Gaddis, PhD University of Missouri, Kansas City School of Medicine
Gary Johnson, MD Upstate Medical University
Sara Heinert, PhD, MPH Rutgers University
Emad Awad, PhD University of Utah Health
Brian J. Yun, MD, MBA, MPH Harvard Medical School
Naomi George, MD, MPH University of Mexico
Musculoskeletal
Laura Walker, MD Mayo Clinic
Sarah Aly, DO Yale School of Medicine
León D. Sánchez, MD, MPH Beth Israel Deaconess Medical Center
Lauren Walter, MD University of Alabama
Robert Derlet, MD Founding Editor, California Journal of Emergency Medicine University of California, Davis
Infectious Disease
ED Administration, Quality, Safety
Juan F. Acosta, DO, MS NYU Langone Hospital
Neurosciences
Rick Lucarelli, MD Medical City Dallas Hospital William D. Whetstone, MD University of California, San Francisco
Elissa Schechter-Perkins, MD, MPH Boston University School of Medicine
Tehreem Rehman, MD, MPH, MBA Beth Israel Deaconess Medical Center
Ioannis Koutroulis, MD, MBA, PhD George Washington University School of Medicine and Health Sciences
Anthony Rosania, MD, MHA, MSHI Rutgers University
Stephen Liang, MD, MPHS Washington University School of Medicine
Joseph Shiber, MD University of Florida-College of Medicine
Neil Dasgupta, MD, FACEP, FAAEM Nassau University Medical Center
Injury Prevention
David Page, MD University of Alabama
Emergency Medical Services
Critical Care
Christopher “Kit” Tainter, MD University of California, San Diego
Antonio Esquinas, MD, PhD, FCCP, FNIV Hospital Morales Meseguer
Mark Faul, PhD, MA Centers for Disease Control and Prevention
Daniel Joseph, MD Yale University
Wirachin Hoonpongsimanont, MD, MSBATS Eisenhower Medical Center
Joshua B. Gaither, MD University of Arizona, Tuscon
International Medicine
Heather A. Brown, MD, MPH Prisma Health Richland
Antonio Siniscalchi, MD Annunziata Hospital, Cosenza, Italy
Pediatric Emergency Medicine
Muhammad Waseem, MD Lincoln Medical & Mental Health Center Cristina M. Zeretzke-Bien, MD University of Florida Jabeen Fayyaz, MD The Hospital for Sick Children Reshvinder Dhillon, MD University of Southern Alabama Kathleen Stephanos, MD University of Mississippi Medical Center
Official Journal of the California Chapter of the American College of Emergency Physicians, the American College of Osteopathic Emergency Physicians, the California Chapter of the American Academy of Emergency Medicine, and Official International Journal of the World Academic Council of Emergency Medicine (WACEM)
World Academic Council of Emergency Medicine
Available in MEDLINE, PubMed, PubMed Central, CINAHL, SCOPUS, Google Scholar, eScholarship, Melvyl, DOAJ, EBSCO, EMBASE, Medscape, HINARI, and MDLinx Emergency Med. Members of OASPA. Editorial and Publishing Office: WestJEM/Depatment of Emergency Medicine, UC Irvine Health, 3800 W. Chapman Ave. Suite 3200, Orange, CA 92868, USA Office: 1-714-456-6389; Email: Editor@westjem.org
Volume 27, No. 6: November 2026
i
Western Journal of Emergency Medicine
Western Journal of Emergency Medicine: Integrating Emergency Care with Population Health
Indexed in MEDLINE, PubMed, and Clarivate Web of Science, Science Citation Index Expanded Section Editors (Continued) Public Health
John Ashurst, DO, MSc, EdD Lehigh Valley Health Network Tony Zitek, MD Kendall Regional Medical Center
Howard Greller, MD Rutgers University
Chris Baker, MD University of California, San Francisco
Robert Allen, MD Keck Medicine of USC
Trauma
Shane Summers, MD Brooke Army Medical Center
Women’s Health
Pierre Borczuk, MD Massachusetts General Hospital/Havard Medical School
Erik S. Anderson, MD Alameda Health System-Highland Hospital
Lesley Osborn, MD University of Colorado Anschutz Medical Campus
Toxicology
Ultrasound
Jeffrey R. Suchard, MD University of California, Irvine
Robert R. Ehrman, MD, MS Wayne State University Ryan C. Gibbons, MD Temple Health
J. Matthew Fields, MD Thomas Jefferson University
Elisabeth Calhoun, MD, MPH Trinity Health Marianne Haughtey, MD Zucker School of Medicne at Hofstra/Northwell
Official Journal of the California Chapter of the American College of Emergency Physicians, the American College of Osteopathic Emergency Physicians, the California Chapter of the American Academy of Emergency Medicine, and Official International Journal of the World Academic Council of Emergency Medicine (WACEM)
World Academic Council of Emergency Medicine
Available in MEDLINE, PubMed, PubMed Central, CINAHL, SCOPUS, Google Scholar, eScholarship, Melvyl, DOAJ, EBSCO, EMBASE, Medscape, HINARI, and MDLinx Emergency Med. Members of OASPA. Editorial and Publishing Office: WestJEM/Depatment of Emergency Medicine, UC Irvine Health, 3800 W. Chapman Ave. Suite 3200, Orange, CA 92868, USA Office: 1-714-456-6389; Email: Editor@westjem.org
Western Journal of Emergency Medicine
ii
Volume 27, No. 6: November 2026
Western Journal of Emergency Medicine: Integrating Emergency Care with Population Health
Indexed in MEDLINE, PubMed, and Clarivate Web of Science, Science Citation Index Expanded
Editorial Board Amin A. Kazzi, MD, MAAEM The American University of Beirut, Beirut, Lebanon Anwar Al-Awadhi, MD Mubarak Al-Kabeer Hospital, Jabriya, Kuwait Arif A. Cevik, MD United Arab Emirates University College of Medicine and Health Sciences, Al Ain, United Arab Emirates Brent King, MD, MMM University of Texas, Houston Daniel J. Dire, MD University of Texas Health Sciences Center San Antonio
Edward Panacek, MD, MPH University of South Alabama
Leslie Zun, MD, MBA Chicago Medical School
Scott Rudkin, MD, MBA University of California, Irvine
Hoon Chin Steven Lim, MBBS, MRCSEd Changi General Hospital
Linda S. Murphy, MLIS University of California, Irvine School of Medicine Librarian
Scott Zeller, MD University of California, Riverside
Gayle Galleta, MD Sørlandet Sykehus HF, Akershus Universitetssykehus, Lorenskog, Norway
Pablo Aguilera Fuenzalida, MD Pontificia Universidad Catolica de Chile, Región Metropolitana, Chile
Jaqueline Le, MD Desert Regional Medical Center
Peter A. Bell, DO, MBA Baptist Health Sciences University
Jeffrey Love, MD The George Washington University School of Medicine and Health Sciences
Peter Sokolove, MD University of California, San Francisco
Jonathan Olshaker, MD Boston University
Rachel A. Lindor, MD, JD Mayo Clinic
David F.M. Brown, MD Massachusetts General Hospital/ Harvard Medical School
Katsuhiro Kanemaru, MD University of Miyazaki Hospital, Miyazaki, Japan
Robert M. Rodriguez, MD University of California, Riverside
Douglas Ander, MD Emory University
Kenneth V. Iserson, MD, MBA University of Arizona, Tucson
Edward Michelson, MD Texas Tech University
Khrongwong Musikatavorn, MD King Chulalongkorn Memorial Hospital, Chulalongkorn University, Bangkok, Thailand
Elena Lopez-Gusman, JD California ACEP American College of Emergency Physicians Amanda Mahan, Executive Director American College of Osteopathic Emergency Physicians John B. Christensen, MD California Chapter Division of AAEM Randy Young, MD California ACEP American College of Emergency Physicians
Wirachin Hoonpongsimanont, MD, MSBATS Siriraj Hospital, Mahidol University, Bangkok, Thailand
Robert Suter, DO, MHA UT Southwestern Medical Center Robert W. Derlet, MD University of California, Davis Samuel J. Stratton, MD, MPH Orange County, CA, EMS Agency
Editorial Staff
Advisory Board Kimberly Ang, MBA UC Irvine Health School of Medicine
Terry Mulligan, DO, MPH, FIFEM ACEP Ambassador to the Netherlands Society of Emergency Physicians
Peter A. Bell, DO, MBA American College of Osteopathic Emergency Physicians Baptist Health Science University Robert Suter, DO, MHA American College of Osteopathic Emergency Physicians UT Southwestern Medical Center Shahram Lotfipour, MD, MPH UC Irvine Health School of Medicine Brian Potts, MD, MBA California Chapter Division of AAEM Alta Bates Summit-Berkeley Campus
Luke Garcia, BS Executive Editorial Director
Cassandra Saucedo, MS Executive Publishing Director
Acacia Jang, BS WestJEM Editorial Director
Isabella Choi, BS WestJEM Publishing Director
Isabella Cao, BS CPC-EM Editorial Director
Annie Zhang, BS WestJEM Associate Publishing Director
Stephanie Burmeister, MLIS WestJEM Staff Liaison
Omid Haghkhah, BS CPC-EM Publishing Director June Casey, BA Copy Editor
Mark I. Langdorf, MD, MHPE UC Irvine Health School of Medicine Jorge Fernandez, MD California ACEP American College of Emergency Physicians University of California, San Diego
Official Journal of the California Chapter of the American College of Emergency Physicians, the American College of Osteopathic Emergency Physicians, the California Chapter of the American Academy of Emergency Medicine, and Official International Journal of the World Academic Council of Emergency Medicine (WACEM)
World Academic Council of Emergency Medicine
Available in MEDLINE, PubMed, PubMed Central, Europe PubMed Central, PubMed Central Canada, CINAHL, SCOPUS, Google Scholar, eScholarship, Melvyl, DOAJ, EBSCO, EMBASE, Medscape, HINARI, and MDLinx Emergency Med. Members of OASPA. Editorial and Publishing Office: WestJEM/Depatment of Emergency Medicine, UC Irvine Health, 3800 W. Chapman Ave. Suite 3200, Orange, CA 92868, USA Email: Editor@westjem.org
Western Journal of Emergency Medicine
iii
Volume 27, No. 6: November 2026
Western Journal of Emergency Medicine: Integrating Emergency Care with Population Health
Indexed in MEDLINE, PubMed, and Clarivate Web of Science, Science Citation Index Expanded
JOURNAL FOCUS Emergency medicine is a specialty which closely reflects societal challenges and consequences of public policy decisions. The emergency department specifically deals with social injustice, health and economic disparities, violence, substance abuse, and disaster preparedness and response. This journal focuses on how emergency care affects the health of the community and population, and conversely, how these societal challenges affect the composition of the patient population who seek care in the emergency department. The development of better systems to provide emergency care, including technology solutions, is critical to enhancing population health.
Table of Contents 1578
Off Service, with Purpose: Creating Learner-Centered Experiences for Off-Service Residents I Zvonar, M Griffith, A Garrett
Behavioral Health 1583 Prehospital Buprenorphine: A National Cross-Sectional Analysis K Chandran, SG Weiner, SA Goldberg, VL Holstein, JM Hayes, RE Cash 1591
Factors Associated with Early ED Return Among Patients Discharged After Treatment for Alcohol Withdrawal Syndrome B Briggs, L SMith, R Green, A Nikbakht, D Cline
1599
Machine Learning Algorithms for Predicting Psychostimulant Intoxication in Emergency Department Patients: A Multicenter Study J-H Yu, Y-P Chen, Y-J Su, H-Y Chen, C-C Lin, T-I Weng, C-C Fang, S-W Liu, Y-C CHen, Y-C Pei, K-F Chen
Clinical Practice 1611 High-efficiency Nebulizers Reduce Albuterol Administration Time in the Emergency Department J McCue, D Craft, W Veneman, R Ruegner, B Chinnock, J Castaneda, J Broadhurst, A Chan-Golston, Y Yan, D Campagne 1617
Shoulder Dislocation Reduction Using Inhaled Nitrous Oxide in the Emergency Department: Retrospective Case Series K Vlasica, SM Hochman, E Steinberg, AD Russo, J Carlo, BK Patel
Endemic Infections 1623 Sex Differences in Outcome and Mortality in Urinary Tract Infections in the Emergency Department: The UTILY Study C Nasta, L Onorato, E Allegorico, F Palumbo, B Migliaccio, A Mariniello, F Esposito, A Manzoni, A Vosa, M Macera, C Monari, R Giordano, FG Numis, G Guiotto, R Raucci, FD Vicario, R Nasti, M Giordano, N Coppola, UTILY Study Group 1631
Perspectives on Influenza Vaccination Among COVID-19 Unvaccinated Patients in US Emergency Departments: A Qualitative Study C Li, J White, A Tupetz, A Pauley, RE Geyer, KN O’Laughlin, HC Duber, K Rising, AT Gentsch, RM Rodriguez, SA Eucker
Emergency Medical Services 1642 Acceptability of a Novel Prehospital Emergency Care System Evaluation Tool Among Southeast Asian Stakeholders: A Cross-Sectional Survey JT Bokman, A Haedar, A Joiner, L Hart, SBSA Karim, FJ Mesa-Gaerlan, PP Pek, S Riyapan, MEH Ong, AL Blewer, GD Nadarajan
Policies for peer review, author instructions, conflicts of interest and human and animal subjects protections can be found online at www.westjem.com. Volume 27, No. 6: November 2026
iv
Western Journal of Emergency Medicine
Western Journal of Emergency Medicine: Integrating Emergency Care with Population Health
Indexed in MEDLINE, PubMed, and Clarivate Web of Science, Science Citation Index Expanded
Table of Contents continued 1652
Prehospital Facial Recognition Technology: Randomized Controlled Simulation Study A Misra, R Cabeceiras, A Sehgal, JL Montero, R Cambo, RD Rodriguez, AA Brotons, SL Syms, T Koru-Sengul, E Tiozzo, I Motola
Pediatrics 1660 English versus Non-English Language Preference and Computed Tomography Use in Pediatric Minor Head Trauma DR Nelson, ZT Sheff, AJ Kinstedt, JR Barker, CA Kelly 1671
Pediatric Unspecified Headache in the Emergency Department: Can We Do Better? SR Martin, TQ Heyming, EC Sun, J Zhu, H Zaveri, ZN Kain
Health Equity 1678 Effects of Racial Concordance and Perceived Racism on Emergency Department Patient Satisfaction R Gonzales, M Wang, C Sagan, S Nijim, A Agarwal 1684
Assessment of Combined Food and Nutrition Insecurity Screening in the Emergency Department: A Brief Report M Santos Esteban, JM-T Nguyen, IDC Olliffe, B Chakravarthy, V Cisneros
Technology in Emergency Medicine 1689 Emergency Department-Centered Digital Health Transformation: Narrative Review and Three-Pillar Implementation Framework S Sossong, A Kalaydjian, S Pletcher, C Ziebell, N-AA Nguyen 1703
Identification of Regional Wall Motion Abnormalities by Emergency Physicians in Acute Coronary Syndromes: Systematic Review and Meta-Analysis ES Neto, M Scapin, PA Verdun, F Lazaro-Paulina, D Gerberi, DF Molinari, RL Campbell, T Kummer
Ethical and Legal Medicine 1714 Ethics of Medical Students as Embedded Simulation Participants in Ultrasound Education SK Chao, CW Kropf, LR Hopson, C Boulger, R Liu, M Feeney, RD Huang, N Theyyunni, J Koehler, DA Haidar Toxicology 1720 Trends in Mushroom Exposures Reported to the Florida Poison Information Center Network, 2014–2024 S Chen, R Lipscomb, R Mhaskar, D Dean Research Methodology 1727 Impact of a Mentored Peer-Review Program on the Sponsoring Journal: Program Evaluation at Five Years JN Love, DP Way, WC Coates, AM Messman, C Merritt, DS Ander Injury Prevention 1735 Cannabis Use versus Cigarette Smoking in Emergency Department Patients: Comparative Outcomes V Yang, AV Xavier, K Devulapally, KK Paul, B Wilson, D Gaalema, H Jneid, O Akinwande, MK Peek, D von Kuenssberg Health Outcomes 1744 Anticipating Change: Local Attitudes Toward a New Community Emergency Medicine Residency Program JA Lee, B Johnson, JT Cornelius
Volume 27, No. 6: November 2026
v
Western Journal of Emergency Medicine
Western Journal of Emergency Medicine: Integrating Emergency Care with Population Health
Indexed in MEDLINE, PubMed, and Clarivate Web of Science, Science Citation Index Expanded
Table of Contents continued Geriatrics 1751 Impact of an Overnight Stay in the Emergency Department Hallway on Admitted Geriatric Patients SE Perelman, MA Meeker, M Kennedy, JW Joseph, SW Liu Emergency Medicine Workforce 1758 Dedicated Vertical Physician Pilot in a Rotational Patient Assignment Emergency Department NR Hodgson, J Monas, A Levy, C VanLandschoot, M Dollar, B Phelps, A Urumov Population Health 1763 Emergency Medicine Reimagined: Development of the Patient Rights Index for Emergency Medicine M Ryan Letters to the Editor 1777 Numerical Inconsistencies in “Physician-Staffed Ambulance Deployment: Comparative Response Time Analysis from a Slovak Pilot Project” A Fabiny, D Sysel, T Bachleda 1779
Reply to Letter to the Editor “Numerical Inconsistencies in ‘Physician-Staffed Ambulance Deployment: Comparative Response Time Analysis from a Slovak Pilot Project’” M Sedlák,T Petra, I Berta, G Ivanov, J Karas
1781
The Ethics of Night Shift Allocation I Agarwal, F Chessa
1783
Reply to Letter to the Editor for “Two-year Results of an Emergency Department Night Shift Buyout Program” CW Croteau, JN Goldstein, L Nentwich, AS Raja, M VanRooyen, JJ Baugh
Erratum 1785 This Article Corrects: “The Bullets He Carried” S Hargarten
Volume 27, No. 6: November 2026
vi
Western Journal of Emergency Medicine
Western Journal of Emergency Medicine: Integrating Emergency Care with Population Health
Indexed in MEDLINE, PubMed, and Clarivate Web of Science, Science Citation Index Expanded This open access publication would not be possible without the generous and continual financial support of our society sponsors, department and chapter subscribers.
Professional Society Sponsors American College of Osteopathic Emergency Physicians California American College of Emergency Physicians Academic Department of Emergency Medicine Subscriber
California Chapter Division of American Academy of Emergency Medicine
Alameda Health System-Highland Hospital Oakland, CA
George Washing University Washington, DC
North Shore University Hospital Manhasset, NY
University of Alabama Medical Center Birmingham, AL
Ascension Resurrection Chicago, IL
HealthPartners - Regions Hospital St Paul, MN
University of Alberta Edmonton, AB
Atrium Health Wake Forest Baptist Winston-Salem, NC
Hennepin County Medical Center Minneapolis, MN
Baylor College of Medicine Houson, TX
Henry Ford Hospital Detroit, MI
Northwestern University Feinberg School of Medicine Chicago, IL NYU Langone Health - Bellevue Hospital New York, NY
Baystate Medical Center Springfield, MA
Henry Ford Wyandotte Hospital Wyandotte, MI
Ohio State University Wexner Medical Center Columbus, oH
Beth Israel Deaconess Medical Center Boston, MA
INTEGRIS Health Oklahoma City, OK
University of California, Davis Medical Center Sacramento, CA University of California, San Francisco Fresno Fresno, CA
Brigham and Women’s Hospital Boston, MA
Kaweah Delta Health Care District Visalia, CA
Brown University Providence, RI
Kern Medical Bakersfield, CA
Capital Health Regional Medical Center Trenton, NJ
Lehigh Valley Hospital and Health Network Allentown, PA
Carilion Clinica-Virginia Tech Carilion School of Medicine Roanoke, VA
Loma Linda University Medical Center (Adult) Loma Linda, CA
Carolinas Medical Center Charlotte, NC Cedars-Sinai Medical Center Los Angeles. CA Cleveland Clinic Cleveland, OH Corewell Health William Beaumont University Hospital Los Angeles, CA Denver Health Medical Center Denver, CO Desert Regional Medical Center Palm Springs, CA Detroit Medical Center/Wayne State University Detroit, MI Duke University Hospital Durham, NC Eisenhower Health Rancho Mirage, CA Emory University Atlanta, GA Florida International University of Herbert Westchester, FL Franciscan Health Olympia Fields Olympia Fields, IL Geisinger Health System Danville, PA
Oregon Health and Science University Portland, OR Orlando College of Osteopathic Medicine Orlando, FL
Riverside Regional Medical Center Newport News, VA Rutgers Robert Wood Johnson Medical School New Brunswick, NJ Saint Louis University School of Medicine St Louis, MO
Southern Illinois University School of Medicine Springfield, IL
Maimonides Medical Center Brooklyn, NY
Summa Health System Akron, OH
Massachusetts General Hospital Boston, MA
Medical College of Wisconsin Affiliated Hospitals Milwaukee, WI Morristown Medical Center Morristown, NJ Mount Sinai Medical Center Miami Beach Miami Beach, FL Mount Sinai Morningside (West) New York, NY
Niagara Health - South Niagara Group Niagara Falls, ON
International Society Partners
Emergency Medicine Association of Turkey Lebanese Academy of Emergency Medicine Mediterranean Academy of Emergency Medicine
Texas Tech University Health Sciences Center El Paso, TX The University of Texas Medical Branch Galveston, TX Thomas Jefferson University Philadelphia, PA Trinity Health Muskegon Hospital Muskegon, MI UMass Memorial Health Worcester, MA
New York - Presbyterian Queens Queens, NY
Arizona Chapter Division of the American Academy of Emergency Medicine California Chapter Division of the American Academy of Emergency Medicine Florida Chapter Division of the American Academy of Emergency Medicine
University of Missouri Columbia Columbia, MO
Temple University Philadelphia, PA
Mayo Clinic College in Florida Jacksonville, FL
University Services University of the Health Sciences Bethesda, MD
Great Lakes Chapter Division of the American Academy of Emergency Medicine Tennessee Chapter Division of the American Academy of Emergency Medicine Norwegian Society for Emergency Medicine Sociedad Argentina de Emergencias
University of Louisville Louisville, KY
University of Michigan Ann Arbor, MI
Swedish Hospital Part of NorthShore Chicago, IL
Mayo Clinic College in Arizona Phoenix, AZ
University of Kansas Health System Kansas City, KS
University of Maryland School of Medicine Baltimore, MD
SUNY Upstate Medical University Syracuse, NY
Mayo Clinic College of Medicine Rochester Rochester, MN
University of Florida, Jacksonville Jacksonville, FL
University of Iowa Hospitals and Clinics Iowa City, IA
Seattle Children’s Hospital Seattle, WA
Loyola University Medical Center Cook County, IL
University of Chicago, Chicago, IL
University of Illinois at Chicago Chicago, IL
Sarasota Memorial Hospital Sarasota, FL
Louisiana State University Shreveport Shreveport, LA
State Chapter Subscriber
University of California, San Francisco General Hospital San Francisco, CA
Penn State Milton S. Hershey Medical Center Hershey, PA
Loma Linda University Medical Center (Peds) Loma Linda, CA
University of Arizona College of MedicineTuscon Tucson, AZ
University of Nebraska Lincoln, NE University of North Dakota School of Medicine and Health Sciences Grand Forks, ND University of Ottawa Ottawa, ON University of Pennsylvania Health System Philadelphia, PA University of South Alabama Mobile, AL University of South Florida Tampa, FL University of Southern California - Los Angeles General Medical Center Los Angeles, CA
Uniformed Services Chapter Division of the American Academy of Emergency Medicine Virginia Chapter Division of the American Academy of Emergency Medicine
Sociedad Chileno Medicina Urgencia Thai Association for Emergency Medicine
To become a WestJEM departmental sponsor, waive article processing fee, receive electronic copies for all faculty and residents, and free CME and faculty/fellow position advertisement space, please go to http://westjem.com/subscribe or contact: Stephanie Burmeister WestJEM Staff Liaison Phone: 1-800-884-2236 Email: sales@westjem.org
Western Journal of Emergency Medicine
viii
Volume 27, No. 6: November 2026
Western Journal of Emergency Medicine: Integrating Emergency Care with Population Health
Indexed in MEDLINE, PubMed, and Clarivate Web of Science, Science Citation Index Expanded This open access publication would not be possible without the generous and continual financial support of our society sponsors, department and chapter subscribers.
Academic Department of Emergency Medicine Subscriber (Continued) University of Tennessee Knoxville, TN University of Utah School of Medicine Salt Lake City, UT University of Vermont Medical Center Burlington, VT
University of Washington - Harborview Medical Center Seattle, WA
Valleywise Health Medical Center Phoenix, AZ Valleywise Health Medical Center Pediatrics Phoenix, AZ
University of Wisconsin Hospitals and Clinics Madison, WI
State Chapter Subscriber
Arizona Chapter Division of the American Academy of Emergency Medicine California Chapter Division of the American Academy of Emergency Medicine Florida Chapter Division of the American Academy of Emergency Medicine
International Society Partners
Emergency Medicine Association of Turkey Lebanese Academy of Emergency Medicine Mediterranean Academy of Emergency Medicine
Wright State University Boonshoft School of Medicine Dayton, OH Yale School of Medicine New Haven, CT
Wellspan York Hospital York, PA
Great Lakes Chapter Division of the American Academy of Emergency Medicine Tennessee Chapter Division of the American Academy of Emergency Medicine Norwegian Society for Emergency Medicine Sociedad Argentina de Emergencias
Uniformed Services Chapter Division of the American Academy of Emergency Medicine Virginia Chapter Division of the American Academy of Emergency Medicine
Sociedad Chileno Medicina Urgencia Thai Association for Emergency Medicine
To become a WestJEM departmental sponsor, waive article processing fee, receive electronic copies for all faculty and residents, and free CME and faculty/fellow position advertisement space, please go to http://westjem.com/subscribe or contact: Stephanie Burmeister WestJEM Staff Liaison Phone: 1-800-884-2236 Email: sales@westjem.org
Western Journal of Emergency Medicine
ix
Volume 27, No. 6: November 2026
Emergency Physician
Whanganui Hospital | Clinical Leadership Opportunity
Whanganui Hospital Emergency Department is seeking an experienced emergency physician to join a department with active clinical leadership, quality improvement, and teaching functions. The department is pursuing FACEM training accreditation and building an Emergency Medicine Training Network with regional partners. This is an opportunity to help shape an emerging academic programme in a high-autonomy environment, without the administrative burden of large tertiary institutions. ABEM certification recognised. Relocation support available. New Zealand’s publicly funded system offers a quality of professional life increasingly rare in North American practice — true consultancy, collegial culture, and sustainable hours.
How to Apply Please send your application to Honey Pillai, Senior Recruitment & Operations - SMOs at Honey.Pillai@wdhb.org.nz Alternatively, you can apply via the company online portal here.
Original Research
Cumulative Weighted-Average Acuity Level: A Novel Clinician-Level Metric to Detect Emergency Department Surge Conditions in Real Time Kenneth Berry, MD
Lewis County General Hospital, Department of Emergency Medicine, Lowville, New York
Section Editor: Laura Walker, MD Submission history: Submitted June 12, 2026; Revision received June 17, 2026; Accepted June 28, 2026 Electronically published October 13, 2026 Full text available through open access at http://escholarship.org/uc/uciem_westjem DOI 10.5811/westjem.66241
Introduction: Emergency department (ED) surge events, defined as the episodic clustering of highacuity patients that transiently overwhelms available clinician capacity, are associated with delays in care and potential patient harm. Existing crowding metrics do not quantify real-time clinician-level workload. This paper describes the development and preliminary feasibility evaluation of a novel acuity-weighted metric—the cumulative weighted-average acuity level (CWAAL)—to detect physicianlevel surge conditions in real time. Methods: This multiphase observational feasibility study was conducted at two rural community EDs. The CWAAL is defined as the sum of weighted acuity scores for all active patients under a single clinician’s management: it incorporates a feasibility threshold derived by combinatorial enumeration. The primary outcome was door-to-doctor time (DDT); secondary outcomes included length of stay (LOS) and CWAAL distribution. The DDT comparisons at Hospital B (n = 4 surge events per condition) used the Mann-Whitney U test. All data were obtained from the practice of a single physician. Results: We evaluated a single emergency physician across 354 patients on 10 study dates at two rural community EDs, tracking 11 surge events and one proof of concept. A CWAAL feasibility threshold of ≤ 12 (±1)—equivalent to four simultaneous Level 3 patients (~120 minute demand within a 60-minute window)—emerged consistently across both sites. At Hospital B, surge-period DDTs were substantially lower with advanced practice clinician (APC) coverage than without (median, 31.5 minutes [interquartile range {IQR}, 24.7–38.0] vs 107.7 minutes [IQR, 85.7–133.5]); Mann-Whitney U = 0, P = .03, 2-tailed exact; rank-biserial r = 1.0), with complete distributional separation across eight surge events. All APC-supported events occurred at CWAAL ≤ 12; all unsupported events at CWAAL > 12. A proof-of-concept application on May 28, 2024, demonstrated operational feasibility; supplemental staffing reduced the physician’s weighted acuity burden by 31 points and normalized DDT and LOS. Conclusion: In this development cohort, the physician reached functional care capacity at cumulative weighted average acuity level = 12 (four simultaneous Level 3 patients; ~120 minutes demand within a 60-minute physician-hour). Complete separation of APC-supported and unsupported outcomes across eight events supports this novel acuity-weighted metric as a meaningful operational signal. Formal prospective validation across independent datasets is required before generalizing. [West J Emerg Med. 2026;27(6)1516–1524.]
INTRODUCTION Emergency department (ED) crowding is a wellestablished threat to patient safety, associated with increased Western Journal of Emergency Medicine
mortality, delays in care, and decreased quality of outcomes.1-3 Validated department-level crowding metrics—including the National ED Overcrowding Score (NEDOCS) and the Real1516
Volume 27, No. 6: November 2026
Berry
Novel Individual Physician Acuity Level to Detect ED Surge Conditions
time Emergency Analysis of Demand Indicators (READI)— assess aggregate census, admission holds, and resource use.4 These tools are insensitive to a distinct and clinically important phenomenon: the episodic clustering of high-acuity patients that transiently overwhelms the capacity of a single available clinician, even when overall department census appears manageable. In rural and community EDs operating under singlephysician coverage models, this scenario is both common and dangerous. A physician managing three simultaneous Level 2 patients faces a fundamentally different operational reality than one managing the same census of lower-acuity patients, yet no existing metric captures this distinction in real time. Traditional downstream metrics such as door-to-doctor time (DDT) reflect surge impact only after care has already been compromised. The conceptual foundation of this paper rests on the input-throughput-output model of ED crowding described by Asplin et al,5 which frames ED dysfunction as the product of mismatches between patient input rates, care throughput capacity, and output constraints. Queuing theory further suggests that when patient arrival rates transiently exceed service capacity, wait times increase nonlinearly and disproportionately to the degree of overload.6 A clinician-level acuity-weighted metric operationalizes this capacity constraint at the individual physician level. This paper describes the development and preliminary feasibility evaluation of the cumulative weighted-average acuity level (CWAAL), a novel metric for real-time clinicianlevel surge detection. We report a multiphase observational study at two rural community EDs encompassing retrospective surge identification, analytical threshold derivation, and a prospective proof-of-concept application, intended to support formal prospective validation. METHODS This study followed established methodological standards for medical record review in emergency medicine as described by Worster et al., including predefined variables, explicit outcome measures, and structured data abstraction.7 The SQUIRE 2.0 reporting checklist for quality improvement studies was followed where applicable. Data were obtained from the clinical practice of a single emergency physician at each study site, who is also the corresponding author of this paper. This relationship constitutes a potential source of observer and ascertainment bias, which is explicitly acknowledged in the Limitations section. Independent multiphysician replication remains the most important next step. Study Design and Setting This feasibility study was conducted in three sequential phases across two rural community EDs: (1) Hospital A—a community ED with approximately 22,000–24,000 annual visits, 18–22 beds, and Meditech electronic health record Volume 27, No. 6: November 2026
Population Health Research Capsule What do we already know about this issue? Emergency department (ED) crowding harms patients, but no metric quantifies real-time workload for an individual clinician. What was the research question? Can a clinician-level acuity-weighted metric detect physician-level surge conditions in real time? What was the major finding of the study? Advanced practice clinician (APC)-supported surges had lower door-to-doctor time (DDT) than unsupported surges (31.5 vs 107.7 min; P = .03; r = 1.0). How does this improve population health? This novel acuity-weighted metric could enable earlier staffing response to surges, reducing delays and improving rural ED capacity.
(EHR); and (2) Hospital B—a smaller rural ED with approximately 11,000–12,000 annual visits, 10–14 beds, and Meditech EHR. Neither facility employed physician scribes during the study period. This study was determined to constitute quality improvement activity and to be exempt from formal review pursuant to 45 CFR 46.104(d). In compliance with the Health Insurance Portability and Accountability Act, we de-identified all data prior to analysis. De-identified data from Hospital A were provided by the hospital director of medical records with institutional authorization. Metric Development The CWAAL metric was developed through a sequential, three-phase process. In Phase 1, retrospective review of Hospital A surge events identified a recurring pattern: clustered arrivals of high-acuity patients within discrete time windows consistently produced marked DDT elevations despite adequate overall staffing, motivating development of a clinician-level workload measure. We adapted a five-level acuity classification already in clinical use for triage by inverting and weighting the levels to reflect approximate physician time demands per encounter: Level 1 (Critical) = weight 5 (50 min); Level 2 (Emergent) = 4 (40 min); Level 3 (Urgent) = 3 (30 min); Level 4 (Nonurgent) = 2 (20 min); Level 5 (Minor) = 1 (10 min). These time estimates are heuristic, derived from clinical experience, and should be
1517
Western Journal of Emergency Medicine
Novel Individual Physician Acuity Level to Detect ED Surge Conditions
Berry
considered working approximations pending formal timemotion validation. Levels 1/2 and 4/5 were combined for analytical tractability given small cell sizes at the extremes. We then defined CWAAL as the sum of weighted acuity scores for all patients under a clinician’s active management within a defined time window. (“Average” in the acronym reflects the acuity-weighting concept rather than arithmetic averaging; CWAAL is a cumulative sum, not a mean). Patients partially managed prior to the surge interval were assigned a 0.5 × reduced weight to account for completed work. In Phase 2, the Hospital B dataset provided natural comparisons across varying staffing configurations. To derive a formal feasibility threshold, all possible patient acuity combinations for Levels 2, 3, and 4 were systematically enumerated: 81 four-patient combinations (categories 8-16) for Hospital A and 27 three-patient combinations (categories 6–12) for Hospital B. Each combination was evaluated against single-physician capacity within a one-hour window. The critical inflection point emerged at CWAAL = 12: combinations at ≤ 11 were consistently feasible within 60 minutes while combinations at ≥ 12 exceeded single-physician capacity (eg, four simultaneous Level 3 patients (4 × 3 = 12) represent approximately 120 minutes of care demand, exceeding the 60-minute window). Full combinatorial tables appear in Supplementary Appendix A, which also contains a generalized mathematical formalization of the CWAAL framework applicable to multizone, multiclinician EDs. Importantly, this threshold was derived from and evaluated against the same dataset—a recognized limitation of exploratory metric development. The CWAAL = 12 threshold represents a hypothesis generated from preliminary data, rather than a validated cut-point. The 0.8 physician-equivalent weighting assigned to APC clinicians (yielding a physicianAPC team threshold of ≤ 18) reflects retrospective modeling of the DDT data and is an empirical estimate requiring prospective calibration.
Requirement column represents the heuristic time demand per encounter, derived using a 10-min base unit (weight × 10 min), pending formal time-motion validation.
Patient Acuity Framework Table 1 summarizes the five-level acuity classification and associated weighted scores. The Approximate Time
Statistical Analysis We used nonparametric methods throughout given small sample sizes. The DDT comparisons between APC-supported
Surge Event Definition We defined a surge event operationally as the sudden arrival of more than three patients of acuity level 3 or higher within any 60-minute period per available emergency physician. This definition was developed pragmatically from observed clustering patterns and is an operational working definition; its sensitivity and specificity relative to alternative definitions have not been formally evaluated. Phase 1: Hospital A Data (January–June 2019) The DDT data from Hospital A were retrieved and de-identified by the hospital director of medical records. Records from a single emergency physician were analyzed chronologically. Surge events were identified on February 2, March 11, and May 20, 2019; June 2, 2019—a nonsurge day with comparable volume but lower acuity and adequate staffing—served as the descriptive control. All four shifts operated under a staffing formula of one emergency physician (7 am to 7 pm), one advanced practice clinician (APC) (9 am to 11 pm), and a second APC beginning at 2 pm or 4 pm. Phase 1 data are reported descriptively. Phase 2: Hospital B Data (July–November 2021) A secondary dataset was obtained from Hospital B covering the same physician across multiple surge and control dates. Hospital B staffing included a single emergency physician (7 am to 7 pm) and one APC daily (9 am to 8 pm). Key comparisons were drawn between surge dates with APC coverage (August 1, October 3, 2021), without APC coverage (September 15, September 29, 2021), and a within-shift control date (August 25, 2021) on which both an APCsupported and an unsupported surge occurred.
Table 1. Patient acuity classification and associated weighting used to calculate a novel acuity-weighted metric to detect physician-level surge conditions in real time in a study of rural emergency departments. Acuity Level
Clinical status
Weighted score
Approx. time requirement (min)
Time basis
1 (Critical)
Immediate threat to life and/or limb
5
~50
Weight × 10 min (heuristic)
2 (Emergent)
Impending threat to life and/or limb
4
40
Weight × 10 min (heuristic)
3 (Urgent)
Urgent illness requiring immediate care
3
30
Weight × 10 min (heuristic)
4 (Non-urgent)
Medical need without immediate life threat
2
20
Weight × 10 min (heuristic)
5 (Minor)
Could be treated elsewhere at another time
1
10
Weight × 10 min (heuristic)
Weight assignments reflect estimated time demands derived from clinical experience and should be considered heuristic pending formal time-motion validation. Levels 1/2 and 4/5 were combined for analytical tractability.
Western Journal of Emergency Medicine
1518
Volume 27, No. 6: November 2026
Berry
Novel Individual Physician Acuity Level to Detect ED Surge Conditions
and unsupported surge conditions used the Mann-Whitney U test. Two complementary analyses were conducted: (1) a surge-level analysis (Hospital B only; n = 4 with APC, n = 4 without APC); and (2) a patient-level analysis using individual DDTs from the EHR throughput reports (n = 14 with APC, n = 11 without). The patient-level analysis carries a nonindependence caveat—patients within a shared surge share common conditions—and is reported as corroborating evidence. Effect size was quantified using the rank-biserial correlation coefficient (r), where |r| = 1.0 indicates complete separation and |r| ≥ .5 is conventionally large. With n = 4 per group, P (two-tailed exact) represents the minimum achievable P value for this test; the clinical magnitude of the effect is therefore the primary evidentiary basis. Data are reported as median [IQR]. We conducted all analyses in Python (scipy.stats, version 1.13). No inferential statistics were applied to Phase 1 or Phase 3 data, which are reported descriptively. Phase 3: Prospective Proof-of-Concept Application (May 28, 2024—Hospital B) The Tuesday following Memorial Day 2024 was selected prospectively as a high-probability surge day based on historical census patterns. A precoordinated surge response bundle was implemented: advance staff briefing, preactivation of additional information technology workstations, float nursing augmentation, commitment of a supplemental physician to respond by noon if CWAAL-defined surge criteria were met, prenotification of hospital administration and emergency medical services (EMS), and real-time CWAAL calculation. The surge response bundle was precoordinated rather than triggered reactively by CWAAL; CWAAL therefore functioned as a monitoring and communication tool within an already activated framework, not as an independent trigger. This phase demonstrates operational feasibility of real-time CWAAL calculation, rather than whether CWAAL-triggered responses improve outcomes versus unmanaged surge. We used a pre-post comparative design, matching the surge period (approximately 10 am to 2 pm) against the non-surge period (after 7 pm). All Phase 3 analysis was descriptive. RESULTS Patient Characteristics Across both study sites, a total of 354 patients were evaluated over 10 shifts by a single emergency physician (140 at Hospital A across 4 shifts, January–June 2019; 214 at Hospital B across 6 shifts, July 2021–May 2024). Patient characteristics by study date are summarized in Table 2. Across all Hospital B surge dates, total shift volume ranged from 32 to 36 patients per 24-hour period. Surge-window patients were predominantly Acuity Level 2-3 (100% across all dates). Age ranged from infant to 93 years; sex distribution was mixed. Dispositions included home discharge, admission, Volume 27, No. 6: November 2026
transfer, and—particularly during unsupported surges—leftwithout-being-seen and against-medical-advice departure, consistent with the throughput delays documented below. Hospital A (Phase 1) individual patient records (age, sex, LOS) were not recoverable after relocation; however, aggregate shift data including patient volumes, acuity distributions, peak DDT values, and CWAAL threshold confirmation were subsequently recovered from structured data abstraction worksheets (Exhibits C1–C4; Supplementary Appendix B) and are presented in Table 2. Phase 1: Hospital A Surge Events Across three Hospital A surge events (February 2, March 11, and May 20, 2019), clustered arrivals of high-acuity patients (≥ 7 patients of Level 2–3 within approximately 2–3 hours) were consistently associated with DDT increases ranging from 82 to 162 minutes. Shift volumes of approximately 30–40 patients per shift were identified from recovered data abstraction worksheets (Exhibits C1–C4; Supplementary Appendix B); individual patient age, sex, and LOS data were not recoverable. On February 2 and March 11, DDTs normalized with the scheduled arrival of the second APC; on May 20, normalization required call-in of an additional clinician, as scheduled staffing was insufficient given concurrent nursing throughput and bed availability constraints. This finding illustrates that clinician availability alone is insufficient when nursing and bed capacity are simultaneously constrained. The June 2, 2019, control date (30 patients: 0 Level 1, 2 Level 2, 16 Level 3, 12 Level 4, 0 Level 5) demonstrated DDTs within acceptable limits throughout, consistent with a well-staffed nonsurge shift. Phase 2: Hospital B Surge Events Table 3 summarizes surge metrics for all Hospital B dates. With APC coverage (August 1 Surges 1 and 2, October 3, August 25 Surge 1), average surge-period DDTs ranged from 18.7 to 43.5 minutes; all four APC-supported events had CWAAL ≤ 12. Without APC coverage (September 15, September 29 Surges 1 and 2, August 25 Surge 2), average surge-period DDTs ranged from 71.7 to 159 minutes—a 3- to 6-fold increase; all four unsupported events had CWAAL > 12. Across all 8 Hospital B surge events, DDTs were lower with APC coverage (median, 31.5 min; IQR, 24.7–38.0 min), than without (median, 107.7 min; 107.7 min; IQR, 85.7– 133.5 min; Mann-Whitney U = 0; P = .03, two-tailed exact; rank-biserial r = 1.0). Complete separation was observed within this limited dataset: every APC-supported surge DDT was lower than every unsupported surge DDT. At the individual patient level, the difference remained robust (Mann-Whitney U = 19.5; P < .001; rank-biserial r = 0.75; n = 14 with APC; n = 11 without), with a median DDT of 22 min versus 128 min. These patient-level metrics are reported as corroborating evidence given patient nonindependence
1519
Western Journal of Emergency Medicine
Novel Individual Physician Acuity Level to Detect ED Surge Conditions
Berry
Table 2. Patient characteristics by study date in a multiphase observational feasibility study evaluating a novel acuity-weighted metric to detect physician-level surge conditions in real time in a study of rural emergency departments.
Date / surge
APC present
Shift total pts
Shift avg LOS (min)
Surge pts (N)
Surge age range
Surge sex (M:F)
Surge Acuity Levels
Surge dispositions
Surge Avg DDT (min)
CWAAL category
HOSPITAL A — PHASE 1 RETROSPECTIVE DATA (January-June 2019) 2/2/19 Surge
Yes (2nd ~40* APC arrived scheduled)
N/A†
~10–15 (surge window)
N/A†
N/A†
L1:0|L2:2|L3:17|L4:17|L5:4 (shift); surge: L2–3 clustered
DDTs normalized w/ scheduled 2nd APC arrival
Peak DDT 162 > 12 min; pre-surge confirmed 8-37 min (see Methods)
3/11/19 Yes (2nd Surge APC arrived scheduled)
36
N/A†
~16 (surge window)
N/A†
N/A†
L1:0|L2:5|L3:22|L4:9|L5:0 (shift); surge: L2–3 clustered
DDTs normalized w/ scheduled 2nd APC arrival
Peak DDT ~102 min; CWAAL 15→16->19
> 12 confirmed (CWAAL 15-19)
5/20/19 Yes Surge (additional clinician called in)
~37*
N/A†
~15 (surge window)
N/A†
N/A†
L1:0|L2:6|L3:13|L4:14|L5: ~4 (shift); surge: L2-3 + nursing constraint
Req. extra clinician call-in; nursing & bed capacity limited
Peak DDT 159 min despite MD+APC (nursing/bed constraint)
> 12 confirmed; nursing constraint
6/2/19 Yes 30 N/A† 30 (full N/A† N/A† 0 L1 | 2 L2 16 L3 | 12 L4 All home/ Within normal N/A (nonControl (standard shift) 0 L5 acceptable; limits surge) (Nonformula) 1 registration surge) delay only † Hospital A (Phase 1) individual patient records (age, sex, LOS) were not recoverable after relocation. Aggregate shift data (patient volumes, acuity distributions, peak DDT, and CWAAL threshold confirmation) were subsequently recovered from structured data abstraction worksheets (Exhibits C1–C4) and are reported here. *Shift totals are approximate counts from recovered worksheets. Age, sex, and shift LOS remain unavailable. CWAAL was not calculated prospectively during Phase 1; values shown reflect retrospective confirmation of threshold exceedance (see Methods). Control date DDT excludes one outlier (186 min) attributable to a documented registration delay. Shift volume: 30–40 patients across Phase 1 dates (Exhibits C1–C4). CWAAL was not calculated prospectively during Phase 1; threshold derivation used Hospital A data retrospectively to establish combinatorial feasibility categories (see Methods). Staffing formula: 1 emergency physician (7 am-7 pm) + 1 APC (9 am-9 pm) + 2nd APC beginning at 2 pm or 4 pm on all four dates.
within surge events. Arrival-to-discharge times followed the same pattern: 147–196 minutes with APC versus 270–325 minutes without. The August 25 within-shift comparison is of particular note: Surge 1 (APC present, 3:34 pm to 4:24 pm) produced median DDT of 18.7 minutes; Surge 2 (APC absent, 7:01 pm to 8:01 pm) produced 71.7 minutes—a 3.8-fold difference on the same date, same facility, same physician, providing the most internally controlled evidence in this dataset for the independent contribution of APC staffing. Threshold Analysis Retrospective application of the CWAAL model produced consistent results: CWAAL ≤ 12 (±1) corresponded to all feasible single-physician scenarios; 13–17 represented a margin zone; ≥ 18 (±2) corresponded to all scenarios with significantly elevated DDTs. With a physician-APC team, the feasibility threshold rose to ≤ 18 (±2). These thresholds are summarized in Table 4. They were derived from and evaluated on the same dataset and represent preliminary working thresholds, not validated cut-points. Western Journal of Emergency Medicine
Phase 3: Proof-of-Concept Application—May 28, 2024 The surge commenced at approximately 10 am with nine patients arriving by 10:59 am and four more by 11:59 am. The physician in charge began with baseline CWAAL of 3.5; six patients assumed from 9 am to 10:38 am yielded CWAAL of 20.5, well above the ≥ 18 alarm threshold. Including two additional high-acuity arrivals at 11:11 am and 11:47 am, the CWAAL of the physician in charge reached 27.5 over the three-hour surge window. Table 5 summarizes clinician contributions; precoordinated supplemental staffing arriving 12 pm to 2 pm provided 31 CWAAL units of assistance. The EMS diversion at 2 pm further decompressed census. The DDTs for the first 7 patients ranged from 1 to 54 minutes; patients 8–14 experienced escalating DDTs peaking at 349 minutes before normalizing following supplemental staffing. The LOS mirrored this pattern: patients arriving 10:00 am to 10:59 am averaged 5 hours 23 minutes versus 2 hours 38 minutes to 2 hours 57 minutes for patients arriving after 1 pm. After 7 pm data confirmed normalization. Two inpatient admissions and two transfers occurred during the surge. The throughput improvement reflects the
1520
Volume 27, No. 6: November 2026
Novel Individual Physician Acuity Level to Detect ED Surge Conditions
Berry Table 2. Continued Date / surge
APC present
Shift total pts
Shift avg LOS (min)
Surge pts (N)
Surge Age range
Surge sex (M:F)
Surge Acuity Levels
Surge dispositions
Surge avg DDT (min)
CWAAL category
WITH APC COVERAGE (Hospital B, 2021) 8/1/21 S1
Yes
36
245
5
20–82
3M:4F
Level 2: 2 Level 3: 3
3 admitted 2 home
36.2
≤ 12
8/1/21 S2*
Yes
36
245
3*
20–82
0M:3F
Level 2: 2 Level 3: 1
1 admitted 1 home 1 unknown
43.5*
≤ 12
10/3/21 Yes
35
179
3
67–93
0M:3F
Level 3: 3
1 home 1 VA transfer 1 NH return
26.7
≤ 12
8/25/21 Yes S1+
32
202
4
15–43
3M:1F
Level 2: 1 Level 3: 3
1 transfer 3 home
18.7
≤ 12
WITHOUT APC COVERAGE (Hospital B, 2021) 8/25/21 No S2+
32
202
3
Infant –28
2M:1F
Level 3: 3
2 home 1 unknown
71.7
> 12
9/15/21 No
34
309
3
37–81
2M:1F
Level 2: 1 Level 3: 2
1 transfer 1 AMA 1 home
125.0
> 12
9/29/21 No S1
35
325
3
26–74
1M:2F
Level 3: 3
1 LWBS 1 AMA 1 home
159.0
> 12
9/29/21 No S2
35
325
3
2y–70
2M:1F
Level 3: 3
1 home 1 elopement 1 admitted
90.3
> 12
PHASE 3: PROOF-OF-CONCEPT APPLICATION (Hospital B, 5/28/24) 5/28/24 Yes Surge (arr. noon)
42
271
13 surge window
5–76 (n = 20)
2 admitted Peak 349; Peak 2 transfer normalized CWAAL 1 AMA post27.5 1 LWBS response Remainder home * 8/1/21 Surge 2: DDT average based on 2 patients with complete data; sex for remaining patient indeterminate. + 8/25/21: Surge 1 (with APC) and Surge 2 (without APC) occurred same date, same physician, same facility; shift totals and LOS therefore identical. 5/28/24 age/sex from registration clerk log (first 20–21 of 38 patients). Hospital A age/sex/LOS not recoverable; aggregate shift data from Exhibits C1–C4. AMA, against medical advice; APC, advanced practice clinician; CWAAL, cumulative weighted-average acuity level; DDT, door-todoctor time; LOS, length of stay; LWBS, left without being seen; NH, nursing home; VA, Veterans Affairs.
precoordinated response bundle as a whole—including nursing augmentation, physician backup, and EMS diversion—rather than CWAAL-triggered intervention alone; CWAAL served as the quantitative workload framework enabling coordination and documentation of surge severity. DISCUSSION Interpretation and Summary of Main Findings This study presents the development and preliminary feasibility evaluation of CWAAL, a clinician-level, acuityweighted tool for real-time ED surge detection, evaluated across 354 patients on 10 study dates at two rural community EDs. The central finding—that a CWAAL threshold of ≤ 12 Volume 27, No. 6: November 2026
~12M:9F (n = 21)
L2: ~5 L3: ~6 L4: ~2 (surge window)
(±1) emerged consistently across two rural community EDs and corresponded with observed complete separation of APC-supported and unsupported surge outcomes within this limited dataset—is consistent with the hypothesis that CWAAL captures a meaningful operational signal. These results are preliminary; they establish a foundation for formal prospective validation rather than providing definitive evidence of generalizability. The most striking feature of the Phase 2 data is not statistical significance—which represents the minimum achievable P value for this sample size—but the clinical magnitude and completeness of the separation. A 3.4-fold median DDT difference and zero distributional overlap across 1521
Western Journal of Emergency Medicine
Novel Individual Physician Acuity Level to Detect ED Surge Conditions
Berry
Table 3. Door-to-doctor times during emergency department surge events with and without advanced practice clinician support in a study of rural emergency departments evaluating the cumulative weighted-average acuity level metric. APC Mean DDT Mean AtD Pts in CWAAL Date Surge window present (min) (min) ED category Note WITH APC COVERAGE 8/1 S1 5:02 pm – 5:49 pm Yes 36.2 298.2 9 ≤ 12 8/1 S2 10:11 pm – 11:12 pm Yes 43.5 -10 ≤ 12 *2 pts w/ complete data 10/3 1:36 pm – 2:43 pm Yes 26.7 350.3 8 ≤ 12 8/25 S1 13:34 pm – 4:24 pm Yes 18.7 282.0 9 ≤ 12 +Within-shift control WITHOUT APC COVERAGE 9/15 3:49 pm – 4:56 pm No 125.0 662.3 16 > 12 9/29 S1 1:06 pm – 2:14 pm No 159.0 270.7 15 > 12 9/29 S2 5:18 pm – 6:03 pm No 90.3 241.7 12 > 12 8/25 S2 7:01 pm – 8:01 pm No 71.7 162.3 13 > 12 +Within-shift control Median DDT: 31.5 min (with APC) vs 107.7 min (without APC); Mann-Whitney U = 0, P = .03, 2-tailed exact; rank-biserial r = 1.0. + 8/25/21 Surge 1 (with APC) and Surge 2 (without APC) occurred same date, same physician, same facility — providing within-shift internal control for clinician, facility, and patient population factors. APC, advanced practice clinician; AtD, arrival-to-discharge time; CWAAL, cumulative weighted-average acuity level; DDT, door-todoctor time.
eight heterogeneous surge events constitutes a robust preliminary signal. The within-shift August 25 comparison is particularly compelling: the same physician, facility, and date produced a 3.8-fold DDT difference based solely on APC presence during the surge window, providing the closest approximation to an internal control available in this dataset. Comparison to Previous Studies Prior literature has demonstrated that team-based staffing models improve ED throughput efficiency.8 The CWAAL extends this finding by providing the first quantified, clinician-level estimate of the workload threshold at which a single physician’s DDT performance degrades during surge conditions in a rural community ED. The feasibility ceiling of ≤ 18 for a physician-APC team reflects the additive capacity conferred by APC support and may offer a specific operational target for staffing calculations, pending independent validation. Existing ED crowding metrics—including NEDOCS and
READI—assess department-level crowding using aggregate metrics such as total census, admission holds, and ventilator patients.4 The CWAAL is complementary but operationally distinct: a department with 12 patients and one physician managing four simultaneous Level 2 patients may appear unremarkable on NEDOCS, while that physician’s CWAAL is well above the alarm threshold. The CWAAL is not a replacement for these tools but operates at a different level of resolution—the individual clinician rather than the department. Strengths The primary strength of this novel metric is a clinically intuitive operational signal that demonstrated consistent behavior across two independent rural community EDs, multiple staffing configurations, varying patient volumes, and four calendar months of heterogeneous clinical conditions. The within-shift August 25 comparison provides an internal control for clinician, facility, and date factors unavailable in
Table 4. Proposed cumulative weighted-average acuity level thresholds for clinician feasibility and surge response in a study of rural emergency departments. CWAAL
Feasibility assessment
Clinical implication
≤ 12 (±1)
Feasible
A single emergency physician can manage patient load safely
13–17
Marginal / Alert Zone
Surge alert warranted; additional clinician support (eg, APC or physician) should be considered
≥ 18 (±2)
Not Feasible
Surge alarm; immediate supplemental staffing required
≤ 18 (with APC)
Feasible (team)
Combined physician and APC team can manage surge load
These thresholds were derived from and evaluated on the same retrospective dataset and should not be interpreted as externally validated cut-points. APC, advanced practice clinician; CWAAL, cumulative weighted-average acuity level.
Western Journal of Emergency Medicine
1522
Volume 27, No. 6: November 2026
Novel Individual Physician Acuity Level to Detect ED Surge Conditions
Berry
Table 5. Clinician contributions during a prospective proof-of-concept emergency department surge event on May 28, 2024, in a rural community emergency department study evaluating the cumulative weighted-average acuity level metric. CWAAL units
Arrival time
Physician in Charge
Clinician
Primary emergency physician 8 (full); 4 assigned to APC
Role during surge
Patients seen
27.5
On duty 7:00 am
APC
Advanced practice clinician
4 (surge); 3 (post-surge)
11.5
Noon
Additional emergency physician #1
Surge responder
1
3.0
1:00 pm
Additional emergency physician #2
Replacement clinician
2 (including 1 partial)
4.5 (1.5 shared)
1:50 pm
Surgeon
Surge responder
1
3.0
~1:00 pm
Total assistance to physician in charge
31.0
APC, advanced practice clinician; CWAAL, cumulative weighted-average acuity level.
most observational designs. Phase 3 demonstrated that real-time CWAAL calculation is operationally feasible using existing EHR data with no additional technology infrastructure. This study fills a specific gap: No prior tool has attempted to quantify individual clinician acuity burden in real time as a prospective surge detection mechanism in rural emergency medicine. Clinical Implications The May 20, 2019, Hospital A surge illustrates a critical boundary condition: Prolonged DDTs occurred despite concurrent physician and APC availability because nursing throughput and bed capacity were simultaneously constrained. The CWAAL measures physician acuity burden only; it does not incorporate nursing staffing, bed availability, ancillary response times, or output constraints, all of which independently contribute to surge severity. Surge response protocols built on CWAAL should treat physician workload as one component of a multidimensional operational assessment, rather than a sufficient summary measure. In practice, CWAAL could be automatically calculated from triage data in standard EHR systems and displayed within the ED tracking board, enabling tiered surge response activation without physician distraction. The conceptual architecture—watch at CWAAL ≥10, alert at CWAAL ≥12, alarm at CWAAL ≥18 — maps naturally onto existing hospital incident command infrastructure. Research Implications and Future Directions This study establishes CWAAL as a quantitative, clinician-level framework with demonstrated preliminary feasibility. Priority next steps are as follows: (1) formal prospective validation on independent datasets across multiple physicians, sites, and staffing configurations with preregistered hypotheses; (2) time-motion studies to calibrate acuity-weight assignments empirically; (3) EHR integration pilot studies with automated CWAAL calculation and tiered alert protocols; (4) outcomes studies linking CWAALtriggered interventions to measurable patient safety Volume 27, No. 6: November 2026
endpoints; and (5) formal cost-effectiveness analysis. Regulatory and institutional policy applications should follow, not precede, completion of these steps. If prospectively validated, CWAAL applied retrospectively to EHR-derived DDT and acuity data could provide an objective characterization of clinician workload patterns over time, informing institutional staffing decisions and quality improvement programs. Understaffing of EDs has been documented as a contributor to crowding-related patient harm and clinician burnout.1-3,9,10 These regulatory applications are speculative at this stage and require formal validation before any institutional or regulatory use. LIMITATIONS This study has several limitations. First and most fundamentally, all data were obtained from the clinical practice of a single physician who is also the study’s corresponding author. Every subjective judgment in the methodology—surge event identification, acuity-weight assignments, feasibility determinations, partial-weight discounting—was made by this individual, representing a significant potential source of observer, confirmation, and ascertainment bias. Independent replication by other physicians at other sites is the most important next step. Independent adjudication of surge events was not performed. Surge identification and threshold exploration were conducted using prospectively recorded workload data from a single clinician. Future studies should evaluate interrater reliability and external validation across multiple clinicians and institutions. Additionally, the CWAAL threshold of ≤ 12 was derived from and evaluated on the same dataset. This circular derivation is a recognized limitation of exploratory metric development; the threshold’s apparent predictive validity may partly reflect overfitting to the development data. Prospective evaluation on independent datasets is required before the threshold can be considered validated. We did not perform multivariable analysis given sample sizes of n = 4 surge events per condition; such analyses would
1523
Western Journal of Emergency Medicine
Novel Individual Physician Acuity Level to Detect ED Surge Conditions be statistically underpowered. The between-condition comparisons cannot control for differences in patient population characteristics, time of day, or seasonal variation. The within-shift August 25 comparison provides partial internal control but does not eliminate all confounding. The Phase 3 proof-of-concept application involved precoordinated staffing and heightened situational awareness. It does not constitute an independent test of the CWAAL threshold and cannot isolate CWAAL’s contribution from other response bundle components. Multiple prospective surge days across varied settings with independent adjudication will be required to establish threshold robustness. Acuity-weight assignments are derived from clinical experience rather than formal time-motion studies, and CWAAL measures physician acuity burden only—not nursing capacity, bed availability, ancillary response times, or output constraints, all of which independently contribute to surge severity. Sixth, the conceptual framework may not generalize across different patient populations or time periods without recalibration; both study sites share characteristics—modest annual volume, single-physician coverage, limited bed capacity, no scribes—that may not apply to academic or high-volume urban EDs. Finally, downstream patient safety outcomes—including adverse events, patient satisfaction,11 and formal quality metrics—were not measured and represent the ultimate measure of this framework’s clinical value. CONCLUSION Surge events in the emergency department are quantifiable at the individual clinician level using the cumulative weighted-average acuity level metric. Preliminary data from two rural community EDs demonstrate a striking and consistent association between CWAAL threshold exceedance and door-to-doctor degradation across eight heterogeneous surge events, with observed complete separation of advance practice clinician-supported and unsupported surge outcomes within this limited dataset. A prospective proof-of-concept application confirmed operational feasibility of real-time CWAAL calculation using existing EHR data. These findings are explicitly preliminary and hypothesisgenerating. The proposed CWAAL threshold of ≤ 12 (±1) for a single emergency physician and ≤ 18 (±2) for a physicianAPC team represents an analytically consistent working hypothesis from a limited single-physician dataset, not a validated universal standard. Formal prospective validation across independent data, multiple physicians, and diverse ED settings is required before these thresholds can be adopted operationally. Subject to that validation, CWAAL has potential as a practical early-warning tool for surge detection complementing existing department-level crowding metrics— with longer-term potential for staffing quality improvement contingent on the validation work that must come first.
Western Journal of Emergency Medicine
Berry
Address for Correspondence: Kenneth Berry, MD, Lewis County General Hospital, Department of Emergency Medicine, 7785 N State St, Lowville, NY 13367. Email: kberrymd@gmail.com. Conflicts of Interest: By the WestJEM article submission agreement, all authors are required to disclose all affiliations, funding sources and financial or management relationships that could be perceived as potential sources of bias. No author has professional or financial relationships with any companies that are relevant to this study. There are no conflicts of interest or sources of funding to declare. Copyright: © 2026 Berry. This is an open access article distributed in accordance with the terms of the Creative Commons Attribution (CC BY 4.0) License. See: http://creativecommons.org/licenses/ by/4.0/
REFERENCES 1. Pines JM, Pilgrim RL, Schneider SM, et al. Practical implications of implementing emergency department crowding interventions: a systematic review. Ann Emerg Med. 2011;58(2):162-169. 2. Bernstein SL, Aronsky D, Duseja R, et al. The effect of emergency department crowding on clinically oriented outcomes. Acad Emerg Med. 2009;16(1):1-10. 3. Hoot NR, Aronsky D. Systematic review of emergency department crowding: Causes, effects, and solutions. Ann Emerg Med. 2008;52(2):126-136. 4. Weiss SJ, Derlet R, Arndahl J, et al. Estimating the degree of emergency department overcrowding in academic medical centers: Results of the National ED Overcrowding Study (NEDOCS). Acad Emerg Med. 2004;11(1):38-50. 5. Asplin BR, Magid DJ, Rhodes KV, et al. A conceptual model of emergency department crowding. Ann Emerg Med. 2003;42(2):173-180. 6. Green LV. Queueing analysis in healthcare. In: Hall RW, ed. Patient Flow: Reducing Delay in Healthcare Delivery. Springer; 2006:281-307. 7. Worster A, Bledsoe RD, Cleve P, et al. Reassessing the methods of medical record review studies in emergency medicine research. Ann Emerg Med. 2005;45(4):448-451. 8. Rowe BH, Guo X, Villa-Roel C, et al. The role of triage liaison physicians on mitigating crowding in emergency departments: a systematic review. Acad Emerg Med. 2011;18(2):111-120. 9. Kellermann AL. Crisis in the emergency department. N Engl J Med. 2006;355(13):1300-1303. 10. Pines JM, Garson C, Baxt WG, et al. ED crowding is associated with variable perceptions of care compromise. Acad Emerg Med. 2007;14(12):1176-1181. 11. Welch SJ. Twenty years of patient satisfaction research applied to the
1524
emergency department: a qualitative review. Am J Med Qual. 2010;25(1):64-72.
Volume 27, No. 6: November 2026
Original Research
Sex Differences in Time to Triage in the Emergency Department: A Retrospective Cohort Study Siveen Hindiyeh, MD* Abdallah Kurd, MD* Avraham E. Alpert, MD†‡ Ariella Kovacs, BA‡ Tehila Oren, BSN, MHA* Shaden Salameh, MD, MHA*†
*Hadassah-Hebrew University Medical Center, Department of Emergency Medicine, Mount Scopus, Jerusalem, Israel † The Hebrew University, Faculty of Medicine, Jerusalem, Israel ‡ Hadassah-Hebrew University Medical Center, Department of Emergency Medicine, Ein Kerem, Jerusalem, Israel
Section Editor: Brian Yun, MD, MPH, MBA Submission history: Submitted January 3, 2026; Revision received June 13, 2026; Accepted June 13, 2026 Electronically published October 14, 2026 Full text available through open access at http://escholarship.org/uc/uciem_westjem DOI 10.5811/westjem.61906
Introduction: Efficient triage in emergency departments (ED) is crucial for timely patient care, as evidence indicates that time to triage could affect treatment outcomes. Sex differences have been observed in different healthcare areas. The objective of this study was to determine whether sex differences exist in a patient’s time to triage and the magnitude of any observed differences at presentation to the ED of a Jerusalem hospital. Methods: This retrospective study used anonymized data from adult ED visits between January 1 to September 30, 2024, at an ED in Jerusalem. Our primary outcome measure was the mean time to triage, defined as the interval between documented patient arrival and the first encounter with a triage nurse. Our secondary outcome measures included the proportion of patients triaged within 15 minutes, stratified by sex, ED division, and Emergency Severity Index (ESI) level. Results: The study analyzed 30,447 adult ED visits over nine months. Mean time to triage was 10.9 minutes for women versus 10.3 minutes for men (absolute difference, 0.6 minutes; P < .001). Women were less likely to be triaged within 15 minutes (75.2% versus 76.9%; absolute difference, 1.7%; P < .001). Median time to triage was 6.0 minutes (interquartile range [IQR]) for men, 1.015.0 vs 7.0 minutes (IQR, 1.0-15.0) for women. Among patients with ESI levels 3-5, women had lower odds of triage within 15 minutes (odds ratio [OR], 0.78; 95% CI, 0.73–0.84; P < .001), while no significant sex differences were observed for ESI levels 1-2 (OR 1.30; 0.90–1.88; P = .17). Differences were most pronounced in ED triage to the ambulatory care area (absolute difference, 1.8%; OR, 0.95) and minimal in acute care (absolute difference, 0.5%; OR, 0.84), with no significant difference in the shock-trauma unit. Both sexes had similar triage rates within 60 minutes (99.2%). Conclusion: Although we found statistically significant sex differences in time to triage, the absolute difference of 0.6 minutes is not clinically meaningful. The near-universal triage within 60 minutes suggests that early triage prioritization differences do not translate into clinically significant delays. Within this ED, triage processes function similarly for men and women. Future research should evaluate downstream processes (eg, time to physician evaluation) to determine aspects of ED care that may demonstrate clinically important sex-based disparities. [West J Emerg Med. 2026;27(6)1525–1531.]
INTRODUCTION Sex differences exist in multiple areas of healthcare. It is critical to examine whether there are differences between Volume 27, No. 6: November 2026
sexes in the timing of triage initiation in the emergency department (ED). For instance, the evaluations of door to room and door to clinician showed that men were more likely 1525
Western Journal of Emergency Medicine
Sex Differences in Time to Triage in the ED: A Retrospective Cohort Study than women to be seen by the clinician and admitted to the hospital.1 Another study recognized that men have more severe initial symptoms, which could affect their faster processing and care provision.2 There are also documented differences between sexes in cardiovascular and stroke care, and for time to physician evaluation and proportion of hospital admission, as well as overdose treatment. There are significant cardiovascular health differences between men and women due to sex differences, including menopause and pregnancy, and gender differences, such as socialization, which contribute to the inequality risk.3 Coronary artery disease (CAD) is the leading cause of mortality in women.4 Women are more likely than men to develop nonobstructive CAD or microvascular dysfunction, where damage and thinning of the inner walls of blood vessels reduce blood flow and oxygen supply to the heart, causing chest pain.5 In general, perfusion problems, affecting blood flow to tissues and organs, are more common in women. Recent data from a registry on ST-elevation myocardial infarction (STEMI) highlights that women experience significant delays in receiving reperfusion treatment, contributing to higher mortality rates in this population.6 Among more than 60,000 patients with STEMI, women have a significantly higher risk of in-hospital mortality.7 One study showed that by instituting a four-step protocol including ED catheterization lab activation, a STEMI handoff checklist, immediate transfer to the catheterization lab, and using the radial-first approach, the absolute sex difference in 30-day mortality could be reduced from 6.1% to 3.2% higher in women than men.8 Sex differences also exist in the treatment of acute stroke, as it was revealed that women manifest poorer functional recovery and lower quality of life after stroke compared to men.9 One study from Denmark showed that there was a median delay of 20 minutes from symptom onset to hospital arrival time for women compared to men, which may be one barrier to timely treatment.10 In a study based on data from the Houston metropolitan area, women were 9% less likely to be transported to a comprehensive stroke center even though they presented with a higher National Institutes of Health Stroke Scale score.11 In other areas of emergency medicine, delays in the ED assessment of poisonings (other than opioids) were documented in women.12 Research demonstrates that ED nurses perceive the middle-aged male patient to be more in need of urgent triage, admission to an intensive care unit (ICU) bed, and cardiac diagnosis than the age-matched female.13 The ED is the gateway to the hospital, and delays in identifying critical patients and starting care promptly can affect downstream outcomes. There is limited research that analyzes healthcare differences that occur in the initial processes in the ED. The objective of this study was to determine whether there are sex differences in the door-to-triage time of patients presenting to the ED of a Jerusalem hospital, and to examine the magnitude of any observed differences. Western Journal of Emergency Medicine
Hindiyeh et al. Population Health Research Capsule
What do we already know about this issue? Sex disparities exist in emergency department (ED) care, but differences in time to triage and their magnitude remain poorly defined. What was the research question? Do sex-based differences exist in time to triage and what is the magnitude of any observed differences? What was the major finding of the study? Women had a mean time to triage of 10.9 minutes vs 10.3 minutes for men (mean difference, 0.6 minutes; 95% CI, 0.30–0.90; P < .001). How does this improve population health? Identifying sex-related differences in time to triage may guide quality improvement and promote equitable emergency care.
METHODS Design and Settings This was a quantitative retrospective study on sex differences in patients’ time-to-triage. The setting was an urban academic hospital ED in Jerusalem affiliated with the Hadassah Medical Center, with an annual census of 65,000. The methods of medical record review included choosing the criteria for case selection, identifying medical records, sampling the cases, forming the abstractions, and monitoring performance.14 We extracted anonymized patient demographics, site of triage (ambulatory care, acute care, shock-trauma unit), and Emergency Severity Index (ESI) category D from the institutional Business Intelligence electronic health record system. We excluded patients with incomplete or missing components. Study Participants The study collected patient data from this ED on their visits throughout nine months, from January 1 to September 30, 2024. Our primary outcome measure was time to triage. The criteria for inclusion in the study were adult patients, patients admitted within the research period, and availability of information in the case studies (sex, age, ED division, ESI, and time to triage). Exclusion criteria were pregnant patients and women in advanced stages of pregnancy who were evaluated directly in the obstetric ED.
1526
Volume 27, No. 6: November 2026
Hindiyeh et al.
Sex Differences in Time to Triage in the ED: A Retrospective Cohort Study
Data Sources and Measurement The 15-minute threshold was used as an operational benchmark for workflow assessment, consistent with ED performance metrics defined by the Ministry of Health, although this represents an administrative rather than clinical threshold. Time to triage was operationally defined as the interval between the patient’s recorded arrival in the ED and the initial encounter with the triage nurse. Our secondary outcomes were comparative results on time to triage in relation to sex, age, and ethnicity. Time to triage was subdivided among the ED’s three clinical divisions of the ED based on acuity and level of care: Ambulatory care for lower-acuity patients who can ambulate independently; acute care for patients with higher-acuity conditions requiring more intensive evaluation; and the shock-trauma unit for the most critically ill or injured patients requiring immediate resuscitation. All patients in the three divisions undergo standardized nurse-led triage using the ESI upon arrival, a five-point categorization where levels 1–2 are emergent/ urgent, and levels 3–5 are lower acuity and depend on the number of resources anticipated. Arrival time was measured by the patient’s registration (administrative) arrival timestamp in the ED system. Statistical Analysis We performed statistical analysis using the SPSS, version 27.0 (IBM Corp, Armonk, NY) and R statistical software version 3.5.0 (R Foundation for Statistical Computing, Vienna, Austria). Descriptive statistics are presented as means and standard deviations (SD) or as frequency (n) and percentage (%). Associations between time to triage, patient sex, ED clinical division, and ESI levels were assessed by simple linear and logistic regression, and were summarized by measures of associations, odds ratio (OR), and regression coefficient (β) together with 95% confidence intervals and P values. All significant variables at α = 0.2 were entered into a multivariable logistic regression model. A P value < .05 was considered statistically significant. All reported P values are two-tailed. The study was approved by the institutional review board (0035-25-HMO). RESULTS Descriptive Analysis The study included a sample of 30,447 adult ED visits (15,584 men and 14,863 women). The analysis of the sample and descriptive data showed that women were older than men (mean age, 47.5 vs 43.7; P < .001). The data also showed that the mean time to triage for women was longer (10.9 minutes vs 10.3 minutes; P < .001) and that 76.9% of men (11,637/15,584) compared with 75.2% of women (10,952/14,863) underwent triage within 15 minutes (P < .001). Also, women were less represented in lower urgency levels (ESI 4–5: 5.6% of women vs 10.1% of men) (Table 1). The mean time to triage was 10.3 minutes for men and 10.9 Volume 27, No. 6: November 2026
minutes for women (Table 1). Median time to triage was 6 minutes for men and 7 minutes for women (Table 2). There was no meaningful difference between men and women in the proportion triaged within 60 minutes, with both groups at approximately 99.2% (Table 1). These differences were observed across most age groups, although effect sizes remained small. When we further explored these findings according to the ESI level and the ED division, it was revealed that the time to triage in sex differences were significantly affected by ESI levels, with a notable difference in ESI 3–5 compared to ESI 1–2, where sex differences were less pronounced. Men were more likely than women (73.9% vs 72.1%; P < .001) to be triaged into the ambulatory care department. It is important to note that there is no universally established evidence-based threshold for clinically significant door-to-triage delay across all ED patients, because significance depends on acuity and clinical context. While some experts may consider delays greater than approximately five minutes potentially meaningful in patients with higher-acuity conditions, this remains largely based on expert opinion rather than validated evidence. Meanwhile, in most patients triaged within 15 minutes, men were more likely to be triaged within 15 minutes compared to women (76.9% vs 75.2%, Table 1). These findings complement the raw data and confirm that the observed sex differences in time to triage persist even after adjusting for ESI level, age, and ED division. In data on median time-to-triage, women were triaged within 7 minutes, while men were triaged within 6 minutes (Table 2). Meanwhile, longer triage times were more frequently observed among men than women (Figure 1). The plot suggests that males tend to be triaged more speedily than females. Overall, the results of the analysis show that men and women have similar but significant likelihood (OR, 0.93; 95% CI, 0.86–0.96; P < .01) of receiving triage within 15 minutes, independent of other variables (Table 3). In the shock-trauma unit, the results are significant (OR, 1.85; 95% CI, 1.35–2.60; P < .001). There were lower levels of age-related differences in younger age groups, where OR values approached 1.0. The association between sex and time to triage did not differ by ethnicity (Arabs vs Jews; interaction = .56; Table 3). Figure 2 illustrates how odds of being triaged within 15 minutes varied by sex when stratified by key demographic and clinical subgroups. In terms of age group, women ≥ 85 years of age (OR, 0.79; P < .001) were most at risk for delays. In terms of ESI level 3–5 (OR; 0.78 for women [P < .001], the strongest effect was observed. Among patients with ESI levels 1–2, these differences were nonsignificant. In acute care (OR, 0.84), women showed more pronounced delay, while in ambulatory care (OR, 0.95), the delay was less pronounced. DISCUSSION In this single-center retrospective study of approximately 30,000 ED visits, we identified statistically significant sex-
1527
Western Journal of Emergency Medicine
Sex Differences in Time to Triage in the ED: A Retrospective Cohort Study
Hindiyeh et al.
Table 1. Descriptive characteristics of emergency department patients by sex in a study of sex-based differences in mean time to triage at a Jerusalem hospital. Characteristic
Overall, N = 30,4471
Males, n = 15,5841
Females, n = 14,8631
Ambulatory Care
22,207 (73%)
11,230 (72.1%)
10,977 (73.9%)
Acute Care
7,839 (25.7%)
4,045 (26.0%)
3,794 (25.5%)
Shock-Trauma Unit
401 (1.3%)
309 (2%)
92 (0.6%)
217 (0.7%)
144 (0.9%)
73 (0.5%)
ED Division
< .001
ESI 1
< .001
2
2,473 (8.3%)
1,466 (9.6%)
1,007 (6.9%)
3
24,813 (83.1%)
12,077 (79.4%)
12,736 (87.1%)
4
2,061 (6.9%)
1,364 (9.0%)
697 (4.8%)
5
282 (0.9%)
168 (1.1%)
114 (0.8%)
Age (years)
45.6 (21.3)
43.7 (20.7)
47.5 (21.7)
18-44
16,240 (53.3%)
8,663 (55.6%)
7,577 (51.0%)
45-64
6,974 (22.9%)
3,648 (23.4%)
3,326 (22.4%)
65-84
5,505 (18.1%)
2,647 (17.0%)
2,858 (19.2%)
85+
1,728 (5.7%)
626 (4.0%)
1,102 (7.4%)
Age Category
Time to Triage
P value2
< .001 < .001
10.6 (13.4)
10.3 (13.6)
10.9 (13.0)
< .001
Time to Triage < 15 minutes
22,589 (76.1%)
11,637 (76.9%)
10,952 (75.2%)
< .001
Time to Triage < 60 minutes
29,463 (99.2%)
15,015 (99.2%)
14,448 (99.2%)
.77
N (%); Mean (SD). 2 Pearson Chi-squared test; Welch two-sample t-test Descriptive statistics results for the main variables and demographic data of the sample. 1
based differences in time to triage across multiple patient subgroups. Across all age categories, females had lower odds of being triaged within the 15-minute benchmark compared to males. Despite reaching statistical significance, the absolute difference in mean time to triage between sexes was small—10.9 minutes for women compared to 10.3 minutes for men—suggesting that the observed differences are unlikely to represent clinically meaningful delays in most ED settings. Importantly, triage within 60 minutes was nearly universal and did not differ between sexes, with approximately 99.2% of both women and men triaged within this timeframe. This finding indicates that the detected differences were limited to early triage prioritization rather than resulting in delayed overall access to triage. Together, these results suggest that while early ordering of triage may differ slightly by sex, such variation does not translate into prolonged delays in evaluation at the population level. Several studies evaluating the factors affecting time to triage reported limited results. One study found that men and women experienced 6 and 7 minutes, respectively, in door-totriage time.15 Another study showed an 11-minute difference in the same category, yet women and men were not differentiated within the sample.16 In door-to-room and door-to-healthcare Western Journal of Emergency Medicine
time analyzed in another study, this measure differed from time-to-triage or door-to-triage time; significant sex-based differences were observed in length of stay and door-tohealthcare measures, where males were treated faster, and females remained longer in waiting areas.12 Another study examining ED triage found that female patients were less likely than male patients to be assigned the highest-acuity ESI categories, with disparities also observed by race and ethnicity.17 Compared with these studies, the current research remains unique in terms of the focus on sex differences in time-to-triage and their magnitude. Subgroup analyses demonstrated that the magnitude of sex-based differences varied by age and care setting. The largest difference was observed among patients ≥ 85 years of age, in whom females had lower odds of being triaged within 15 minutes compared to males. However, this effect diminished progressively in younger age groups, with odds ratios approaching one. Differences were also more pronounced in acute care settings, while minimal differences were observed in ambulatory care. These findings suggest that higher-acuity or more protocol-driven environments may attenuate variation in early triage timing. Women were more frequently classified into lower
1528
Volume 27, No. 6: November 2026
Sex Differences in Time to Triage in the ED: A Retrospective Cohort Study
Hindiyeh et al.
Table 2. Comparison of median time to triage between male and female emergency department patients in a study of sex-based triage disparities. Time to Triage (Median, Q1–Q3) Sex Time to triage
Males, n = 15,5841
Females, n = 14,8631
6.0 (1.0-15.0)
7.0 (1.0-15.0)
Unknown 453 299 Triage Time 1 Median (25%-75%). The data show the means and standard deviation results.
urgency categories than men, with 92.7% of women assigned to ESI levels 4–5 compared to 89.5% of men. Among patients triaged as ESI levels 3–5, females had lower odds of being triaged within 15 minutes than males. This pattern may reflect differences in presenting acuity, symptom profiles, or triage classification processes. Given the observational design of this study, it is not possible to determine whether these differences represent true variation in clinical presentation or differences in triage assessment. Women were older than men in the study, which could have affected the results. Older women could have visited the ED more often, and their health issues might have been seen as less urgent. The bias toward patients might be mediated by the familiarity with some of the female patients and their age. Older adults tend to present to the ED more frequently, which might affect the intention of healthcare clinicians to hospitalize them. Sex-based differences in early triage timing were consistent across ethnic groups, with similar patterns observed regardless of ethnicity. This consistency suggests that the observed differences were not confined to a specific demographic subgroup within the studied population and may
Figure 1. Boxplot visually comparing the distribution of time to triage time (in minutes) by sex among adult patients in an emergency department in Jerusalem.
reflect broader workflow or prioritization patterns within the ED rather than culturally or ethnically specific factors. Taken together, these findings highlight the important distinction between statistical significance and clinical relevance in large datasets. While sex-based differences in time to triage were consistently detectable, their small absolute magnitude and the absence of downstream delay in triage within 60 minutes suggest limited clinical impact at the individual patient level. Nonetheless, even small and consistent differences may be relevant from a systems perspective, as they can reflect underlying patterns in triage workflows and prioritization mechanisms. These results underscore the importance of cautious interpretation of statistically significant findings in large
Table 3. Multivariable logistic regression analysis of categories associated with triage within 15 minutes in a study of sex-based triage disparities in a Jerusalem emergency department. Males: Triage ≤ 15 minutes Categories
Females: Triage ≤ 15 minutes
OR
CI
P
OR
CI
P
Age Category 45-64
1.05
0.98–1.12
.196
1.00
0.94–1.08
.90
65-84
1.02
0.95–1.10
.548
0.93
0.86–1.01
.06
[≥ 85]
0.85
0.76–0.96
.007
0.73
0.64–0.82
< .001
Jewish
1.02
0.96–1.07
.596
1.02
0.96–1.07
.56
Shock-trauma unit
1.85
1.35–2.60
< .001
ESI (1 and 2)
1.30
1.17–1.45
< .001
1.22
1.09–1.36
< .001
0.77
0.71–0.82
< .001
Ambulatory care Observations ESI, Emergency Severity Index; OR, odds ratio.
Volume 27, No. 6: November 2026
29,647
1529
29,647
Western Journal of Emergency Medicine
Sex Differences in Time to Triage in the ED: A Retrospective Cohort Study
Figure 2. Odds ratios for timely triage (within 15 minutes) by sex across subgroups of age, emergency department division, and Emergency Severity Index level in a study of triage disparities. ESI, Emergency Severity Index.
cohorts. The attenuation of differences in higher-acuity settings supports the potential role of standardized protocols in minimizing variability during triage. Rather than attributing observed differences solely to individual-level bias, future research should focus on system-level factors that may influence early triage prioritization, including ED crowding, staffing levels, clinician workload, and the use of decisionsupport tools. Future studies should employ multicenter designs to assess the generalizability of these findings across different institutional settings and healthcare systems. Additional analyses incorporating downstream process and outcome measures—such as time to physician evaluation, diagnostic testing, disposition decisions, and clinical outcomes—are needed to determine whether early triage differences have meaningful clinical implications and to inform targeted, evidence-based system improvements where appropriate. LIMITATIONS There are several limitations to this study. We used a Western Journal of Emergency Medicine
Hindiyeh et al.
retrospective design, which essentially limits causal inference. Even though statistical associations were determined between patient sex and time to triage, it is challenging to detect whether sex affects the delays or if there are unmeasured confounding variables that mediate this relationship. Nor was there a formal operational definition of gender, which does not include triage time differences for those with a different biological sex versus gender identity. Furthermore, the study was not inclusive of a full year of data. The analysis was conducted at one hospital in Jerusalem, which limits the generalizability of the data. While the hospital serves a diverse urban population and includes both Jewish and Arab patients, other geographical regions could be under-represented. The sex of the triage nurse was not documented, which is a limitation; the study focused on differences in time to. triage by patient sex, while not accounting for nurse sex. However, it is worth noting that most nurses are female and of Jewish descent. Consequently, the lack of multimodal data decreases the chances of generating broader conclusions regarding the national or international trends in triage. It is also important to note that while the ESI is a widely accepted triage tool, it is still subject to clinical judgment. Therefore, nurses can interpret ESI differently and acknowledge the urgency level based on their experience, biases, or subjective judgment, especially in cases with lower ESI levels. This triage approach may introduce unmeasured variability that is difficult to quantify. In addition, this research did not include inter-rater reliability assessments, which could have affected decision-making processes. We did not collect patient-level clinical data beyond basic demographic information and triage classification. The mediating impact of data, including chief complaint, comorbid conditions, pain scores, and initial symptoms, was not included in the analysis, even though they are important in triage priorities. Therefore, it is unclear whether observed delays could be attributed to clinical presentation differences between men and women. Neither did we. report subgroup analysis for patients requiring an interpreter. Finally, the study assessed the time to triage as the variable of interest. Delays in triage represent a single component of a broader aspect of care. For instance, the analysis of variables such as time to medical evaluation, time for diagnosis, intervention, or clinical outcomes could provide a wider picture of sex- or age-related differences. CONCLUSION This single-center study of over 30,000 ED visits found no clinically meaningful sex-based difference in time to triage. Although statistically significant differences were detected, the absolute magnitude of these differences is too small to plausibly affect patient care. While the observed differences in time to triage appear to be clinically negligible, their impact on downstream care processes and patient outcomes remains
1530
Volume 27, No. 6: November 2026
Hindiyeh et al.
Sex Differences in Time to Triage in the ED: A Retrospective Cohort Study
uncertain and requires further evaluation. Future research should focus on downstream ED processes—including time to physician evaluation, diagnostic testing, disposition decisions, and clinical outcomes—to determine whether any aspect of emergency care demonstrates clinically meaningful sex-based disparities that warrant intervention. Additionally, multicenter studies are needed to determine whether the equitable triage processes observed here are generalizable to other institutions and healthcare systems.
women. Can Fam Physician. 1998;44:2709-2717. 5. Gausi S, Cartledge S, Redfern J, et al. Biology, bias, or both? The contribution of sex and gender to the disparity in cardiovascular outcomes between women and men. Curr Atheroscler Rep. 2022;22(4):19-70. 6. Mauvais-Jarvis F, Bairey Merz N, Barnes PJ, et al. Sex and gender: modifiers of health, disease, and medicine. Lancet. 2020;395(10231):565-582. 7. Pancholy SB, Shantha GP, Patel T, et al. Sex differences in shortterm and long-term all-cause mortality among patients with STsegment elevation myocardial infarction treated by primary percutaneous intervention: a meta-analysis. JAMA Intern Med.
Address for Correspondence: Shaden Salameh, MD, MHA, Hadassah University Medical Center – Mount Scopus, Department of Emergency Medicine, Churchill Ave. 8, P.O. Box 14035, Jerusalem 91240, Israel. Email: shaden.md@gmail.com.
2014;174(11):1822-1830. 8. Huded CP, Johnson MK, Kravitz K, et al. Step protocol for disparities in STEMI care and outcomes in women. JAMA Cardiol.
Conflicts of Interest: By the WestJEM article submission agreement, all authors are required to disclose all affiliations, funding sources and financial or management relationships that could be perceived as potential sources of bias. No other author has professional or financial relationships with any companies that are relevant to this study. There are no other conflicts of interest or sources of funding to declare. Copyright: © 2026 Hindiyeh et al. This is an open access article distributed in accordance with the terms of the Creative Commons Attribution (CC BY 4.0) License. See: http://creativecommons.org/ licenses/by/4.0/
2018;3(3):212-213. 9. Rezkdo KM, Madsen TE, Yu AYX, et al. The impact of sex and gender on stroke. Circ Res. 2022;130:512-528. 10. Maniz J, Andersen G, Valentin JB, et al. Disentangling sex differences in use of reperfusion therapy in patients with acute ischemic stroke. Stroke. 2020;51:2332-2338. 11. Tariq MB, Ali I, Salazar-Marioni S, et al. Women with large vessel occlusion acute ischemic stroke are less likely to be routed to comprehensive stroke centers. J Am Heart Assoc. 2021;10(24):e029830. 12. Lopez R, Snair M, Arrigan S, et al. Sex-based differences in timely emergency department evaluations for patients with drug poisoning. Public Health. 2021;201:95-104.
REFERENCES
13. Arslanian-Engoren C. Sex and age differences in nurses’ triage
1. O’Neal EG, Krier K, Hunt AW, et al. Comparison of emergency department throughput and process times between male and female
decisions using vignette patients. Nurs Res. 2001;50(1):61-66. 14. Woster A, Bledsoe R, Cleve P, et al. Reassessing the methods of
patients: A retrospective cohort investigation by the reducing
medical record review studies in emergency medicine research. Ann
disparities increasing equity in emergency medicine study group. J Am Coll Emerg Physicians Open. 2022;3(5):e12792.
Emerg Med. 2005;45(4):448-451. 15. Kirchbacher G, Steinacher A, Fuhrmann V, et al. Factors influencing
2. Chen KC, Wen SS. Sex differences in clinical characteristics,
door-to-triage- and triage-to-patient administration time. Australas
timeliness of care, and in-hospital outcomes of adult non-trauma patients in the emergency department. PLoS One.
Emerg Care. 2022;25(3):239-242. 16. Houston C, Sánchez L, Fischer C, et al. Waiting for triage: unmeasured
2025;20(9):e0332468. 3. Suman S, Pravallika J, Manjula P, et al. Gender and CVD—Does it
time in patient flow. West J Emerg Med. 2016;17(6):739-742. 17. Patel MD, Lin P, Cheng Q, et al. Patient sex, racial, and ethnic
really matter? Curr Probl Cardiol. 2023;48(5):101604.
disparities in emergency department triage: a multi-site retrospective
4. Chiamivimonvat V, Sternberg L. Coronary artery disease in
Volume 27, No. 6: November 2026
study. Ann Emerg Med. 2024;84:26-35.
1531
Western Journal of Emergency Medicine
Original Research
Machine Learning Versus Traditional Statistical Models for Emergency Department Volume Forecasting Kian Huang, BS* Enola Okonkwo, MD† Haris Choudhary, BS* Rahul Mhaskar, PhD‡ Authors continued at end of article
*University of South Florida, Morsani College of Medicine, Tampa, Florida † University of South Florida, Morsani College of Medicine, Tampa General Hospital, Department of Emergency Medicine, Tampa, Florida ‡ University of South Florida, Morsani College of Medicine, Division of Evidencebased Medicine and Outcomes Research, Tampa, Florida
Section Editor: Kraftin Schreyer, MD, MBA Submission history: Submitted February 4, 2026; Revision received July 27, 2026; Accepted July 27, 2026 Electronically published October 14, 2026 Full text available through open access at http://escholarship.org/uc/uciem_westjem DOI 10.5811/westjem.62266
Introduction: Emergency department (ED) crowding harms patient care and strains hospital operations. Forecasting daily patient arrivals can help ED medical directors, department chairs, and hospital administrators plan staffing and bed capacity in advance, rather than reacting after a surge has already occurred. This study compared five computer-based forecasting methods, including three machine learning models (eXtreme gradient boosting [XGBoost], light gradient boosting machine [LGBM], and long short-term memory [LSTM]) and two traditional statistical models (autoregressive integrated moving average [ARIMA] and seasonal ARIMA [SARIMA]), to determine which most accurately predicts ED patient volume seven days in advance, using eight years of daily visit data from an academic freestanding ED. Methods: This retrospective study analyzed 3,202 consecutive days of daily patient volume (March 27, 2017, to December 31, 2025) from an academic freestanding ED with approximately 31,102 annual visits. Each model used the preceding 365 days of data to forecast the subsequent 7 days, repeated across the study period to reflect the weekly cycle by which most EDs plan staffing. Our primary measure of accuracy was mean absolute error (MAE), defined as the average number of patients per day by which a forecast missed the actual volume. Secondary measures included root mean squared error (RMSE), mean absolute percentage error (MAPE), the coefficient of determination (R², a score from 0 to 1 reflecting how well predictions tracked actual day-to-day volume), and the percentage of forecasts accurate within 5, 10, 15, and 20 patients, thresholds selected for their relevance to staffing decisions. The best-performing model on initial metrics, XGBoost, served as the reference model for statistical comparison using the Diebold-Mariano (DM) test, which determines whether an observed difference in accuracy between two models is statistically meaningful or attributable to chance. Results: Among 453 rolling weekly forecast windows, SARIMA, XGBoost, and LGBM demonstrated the lowest absolute errors and best forecasting of patient volume, with MAE values of 9.60 (95% CI, 9.29–9.91), 9.61 (95% CI, 9.31–9.91), and 9.64 (95% CI, 9.33–9.94) patients/day, respectively; these three models therefore missed the actual daily patient count by approximately 9 to 10 patients, on average. Models ARIMA and LSTM were less accurate, with mean MAE values of 10.54 (95% CI, 10.21–10.87) and 12.01 (95% CI, 11.63–12.39) patients per day. Relative to the XGBoost reference (MAPE 13.82%), ARIMA (MAPE 14.93%) and LSTM (MAPE 17.27%) showed a marked decrease in predictive accuracy. For operational planning, the top-performing models (SARIMA, XGBoost, and LGBM) correctly predicted daily volume within a margin of 20 patients in 90.3% to 90.6% of instances, while LSTM performed less well and reached this threshold in only 83.3% of forecasts. Statistical testing confirmed these differences were unlikely due to chance, with XGBoost significantly outperforming ARIMA (DM = −6.09, P < .001) and LSTM (DM = −6.96, P < .001). Conclusion: Models SARIMA, XGBoost, and LGBM performed comparably well, and all three would provide reliable, operationally useful forecasts for ED staffing and resource allocation decisions. A traditional statistical method, SARIMA, which is simpler and less resource-intensive to implement, performed as well as the newer machine learning methods evaluated in this study. This finding suggests that hospitals do not necessarily need to invest in more complex artificial intelligence tools to obtain accurate ED volume forecasts. [West J Emerg Med. 2026;27(6)1532–1540.]
Western Journal of Emergency Medicine
1532
Volume 27, No. 6: November 2026
Huang et al.
Machine Learning Versus Traditional Statistical Models for ED Volume Forecasting
INTRODUCTION Emergency departments (EDs) are essential access points for acute medical care, with over 150 million visits in the US in 2022 driven by both acute and chronic needs.1 Rising utilization strains ED resources and exacerbates crowding, leading to prolonged waits, delays in care, higher rates of patients leaving without being seen, and increased short-term mortality.2 Crowding also affects staff morale, operational efficiency, and healthcare costs.2 For ED medical directors, department chairs, and hospital administrators, these problems often translate into a practical question addressed on a weekly basis: how many physicians, nurses, and beds will be needed on a given day, and how can that number be predicted with sufficient lead time to act on it? Hospitals traditionally rely on retrospective averages, calendar-based scheduling, and managerial judgment to align staffing with demand.3,4 These methods often fail to accommodate short-term surges influenced by seasonal illness, weather, or emergent events, leading to resource misallocation.5 Data-driven forecasting, in which a hospital’s own historical volume data are used to mathematically predict future patient counts, has therefore become increasingly important, although it remains unclear whether simpler, established statistical methods or newer, more computationally intensive methods perform best for this task. One category of forecasting tool, known as time series models, learns from a hospital’s own historical patterns (eg, recognizing that Mondays are consistently busier than Tuesdays, or that volume rises predictably each winter) and projects these patterns forward. Two long-established time series methods are autoregressive integrated moving average (ARIMA) and its seasonal counterpart, seasonal ARIMA (SARIMA). Both are traditional statistical techniques, similar in principle to methods long used in economic and business forecasting; neither requires artificial intelligence (AI) or specialized computing infrastructure, and both can typically be implemented with standard statistical software. Schweigler et al showed SARIMA outperformed historical averages in forecasting ED occupancy across multiple hospitals.4 Gul et al reviewed ED forecasting methods and noted that while traditional statistical models, including linear regression and ARIMA, achieve mean absolute percentage errors (MAPE— the average forecast error expressed as a percentage of actual volume) under 15%, they often struggle with sudden, irregular fluctuations, suggesting a possible role for more complex approaches.3 More recently, Al Yarubi et al compared SARIMA with two additional statistical forecasting methods (Holt-Winters and Prophet) for predicting hourly ED crowding and found that each offered distinct strengths depending on the forecasting horizon, reinforcing that no single traditional method is universally superior.6 More recently, investigators have applied machine learning, a branch of AI in which a computer program identifies complex, often nonlinear patterns in data rather than Volume 27, No. 6: November 2026
Population Health Research Capsule What do we already know about this issue? Both traditional statistics and machine learning can forecast emergency department (ED) volume, but which approach performs best for staffing remains unclear. What was the research question? Do machine learning models forecast 7-day ED volume more accurately than autoregressive integrated moving and seasonal average? What was the major finding of the study? XGBoost had mean absolute error (MAE). 9.61 (95% CI, 9.31–9.91) vs LSTM MAE 12.01 (95% CI, 11.63–12.39) patients/day; DieboldMariano = −6.96, P < .001. How does this improve population health? A simple, low-cost statistical model forecasts ED volume as well as machine learning, expanding access to accurate staffing tools.
following prespecified statistical rules, to ED forecasting. Three such methods evaluated in this study were eXtreme gradient boosting (XGBoost), light gradient boosting machine (LGBM), and long short-term memory (LSTM) networks. eXtreme gradient boosting and LGBM are gradient boosting algorithms, meaning they construct many simple decision rules in sequence, with each successive rule correcting the errors of those preceding it; this allows them to capture complex relationships between calendar patterns and patient volume that simpler statistical models may not detect.7 The XGBoost method is known for its computational efficiency, ability to handle missing data, and strong performance in modeling these complex, nonlinear relationships.8 The LGBM method is a faster, more memoryefficient variant of the same gradient boosting approach that can accelerate training while maintaining comparable predictive accuracy.8 In prior ED forecasting studies, XGBoost models incorporating calendar and recent-history features have achieved error rates of approximately 5–14% (MAPE) and R² values up to 0.81.8,9 Hu et al similarly demonstrated that incorporating real-time information improved short-term forecasts of ED arrivals compared with methods relying on historical averages alone.10 The LGBM method has also shown competitive results when paired with extensive feature engineering, which is the process of constructing informative
1533
Western Journal of Emergency Medicine
Machine Learning Versus Traditional Statistical Models for ED Volume Forecasting input variables from raw data (described further in the methods section).8 The LSTM networks are a more computationally intensive form of deep learning, a subset of machine learning loosely modeled on neural connections in the brain, that processes sequential data by selectively retaining and discarding information over time through internal gating mechanisms, allowing the model to learn long-range dependencies such as multiweek trends.11 Cheng and Kuo demonstrated that LSTM reduced mean absolute error (MAE—the average forecast error in raw units) in predicting ED wait time by 9.7% compared with linear regression.12 Ming et al reported strong LSTM performance in daily ED arrival forecasting, achieving a MAPE of 4.87%.13 Given the persistent challenges of ED resource allocation and the growing promise of machine learning, this study evaluates XGBoost, LGBM, and LSTM, three machine learning approaches, against ARIMA and SARIMA, two established statistical benchmarks, in forecasting daily patient volume at an academic freestanding ED. None of these five methods are proprietary commercial products; all are publicly available, open-source statistical and machine learning techniques that can be implemented by a hospital’s data analytics team, biomedical informatics group, or a contracted data scientist with access to the ED’s own historical volume data and standard statistical programming skills; we used Python (Python Software Foundation). An ED medical director does not require personal expertise in AI to benefit from this work; rather, our objective is to inform decisions such as whether investment in more advanced, and typically more resource-intensive and expertise-intensive, forecasting tools is warranted, or whether simpler, well-established statistical methods already perform comparably well for operational planning. By systematically comparing these approaches on identical data, we aim to provide ED leaders and hospital administrators with evidence to guide such decisions. METHODS Study Design and Data This retrospective modeling study used daily patient volume data from a 20-bed academic ED affiliated with a tertiary-care university hospital. The ED serves approximately 31,102 patients annually, with a diverse urban and suburban population and a typical acuity mix, making findings potentially generalizable to similar freestanding or hospitalbased EDs. The dataset spanned March 27, 2017, to December 31, 2025, totaling 3,202 consecutive days. Because staffing and resource allocation decisions at most EDs, including ours, are typically made on a weekly basis, we designed our forecasting approach around 7-day (weekly) prediction windows to mirror this real-world planning cycle. The calendar date served as the temporal index from which all predictor variables (described below) were calculated. The Western Journal of Emergency Medicine
Huang et al.
outcome measure was daily ED census, defined as the total number of registered ED visits per calendar day. Daily ED census data were imported and processed in Python 3.10. Data quality checks identified no missing dates or duplicate entries requiring correction. Interpolation and imputation procedures were prespecified but ultimately not applied, as the dataset was complete. No automated outlier removal was performed. The dataset encompasses the COVID-19 pandemic period (March 2020 onward), during which ED volumes experienced unprecedented disruptions.14 These fluctuations were retained to assess model performance under real-world operational conditions with external shocks, rather than presenting an artificially “clean” picture that would not reflect a real ED’s experience. A 365-day rolling training window was implemented to capture complete seasonal cycles. Specifically, at each step the models were provided a full year of recent history before being asked to forecast the following week, ensuring that annual patterns, such as winter respiratory illness surges, were consistently represented in the training data. At each iteration, models were trained using the preceding 365 days of data and generated a single 7-day forecast for the subsequent week, mimicking a weekly operational planning cycle. Weekly 7-day forecasts were selected to balance computational feasibility with prediction accuracy. Feature Engineering Feature engineering refers to the process of transforming a raw calendar date into structured variables that a forecasting model can use to learn patterns in ED utilization. We constructed several categories of these input variables, informed by prior ED forecasting literature and domain expertise. No patient-level demographic or clinical variables were included; all predictors were derived from the date index and historical volume values. Calendar-based categorical features (year, month, day of month, day of week, week of year, and calendar quarter) captured seasonal trends, operational cycles, and known weekday clustering in ED utilization, allowing the model to learn that Mondays or December differ systematically from other days or months. To prevent the model from incorrectly treating time as a simple linear trend, we applied sine and cosine transformations, a standard mathematical technique for representing repeating, cyclical phenomena (eg, December is calendrically proximate to January despite occupying opposite ends of a yearly count) to represent repeating monthly and weekly seasonality. Behavioral patterns were encoded through binary (yes/no) indicators for weekends and major US federal holidays. Historical utilization patterns were captured through multiple lagged values, that is, the actual patient volume from 1, 3, 7, 14, 28, and 30 days earlier, allowing the models to learn short-term recency effects, weekly repetition, and longer seasonal recovery patterns. We also added smoothed trend
1534
Volume 27, No. 6: November 2026
Huang et al.
Machine Learning Versus Traditional Statistical Models for ED Volume Forecasting
variables using rolling (moving) averages over 3-, 7-, 14-, and 30-day windows, along with rolling standard deviations, rolling minimum/maximum values, and percentile-based features; each was calculated using only prior information to avoid temporal leakage, defined as inadvertently allowing a model to see future data it would not have had access to in real time. Additional variables captured momentum, such as 1-day and 7-day changes in volume, percentage-change ratios, exponentially weighted moving averages, and same-weekday memory variables (eg, volume on the same weekday in the prior week). Standardized (z-score–like) features quantified how far current volume deviated from recent rolling averages, helping models, particularly LSTM, learn to recognize unusual surges or unusually quiet days. Forecasting Framework and Model Training The technical configuration details below are reported to allow other investigators to reproduce this study; readers primarily interested in the clinical and operational implications may wish to proceed to Evaluation Metrics and Results. We evaluated five forecasting models: XGBoost, LGBM, LSTM, ARIMA, and SARIMA. For the gradient boosting models, XGBoost was configured with 75 estimators, learning rate 0.05, maximum depth 6, column subsample fraction 0.9, row subsample fraction 0.8, and L1/L2 regularization (α = 0.1, λ = 0.1). The LGBM was configured with 31 leaves per tree, learning rate 0.05, feature fraction 0.9, and bagging fraction 0.8 applied every five iterations. Both models used a fixed random seed for reproducibility. Hyperparameters were tuned once using an initial calibration period restricted to the earliest portion of the time series, preserving strict temporal ordering. No data from the rolling evaluation period were used during hyperparameter selection. Selected hyperparameters were fixed prior to walkforward validation to prevent information leakage. The LSTM model employed a two-layer recurrent neural network architecture consisting of a 64-unit LSTM layer followed by a 32-unit LSTM layer, both using dropout regularization of 0.2. The input sequence window was 30 days, with the model trained to forecast a 7-day horizon. Training was performed using a batch size of 64, with early stopping triggered after five consecutive epochs without improvement in validation loss. The model was implemented in TensorFlow/ Keras version 2.20 (Google LLC) using the Adam optimizer and Huber loss with δ = 10.0 as the objective function. Evaluation Metrics Model performance was assessed using two complementary approaches: aggregate metrics summarizing accuracy across all forecasts combined, and weekly-level metrics capturing how much a model’s accuracy varied from week to week, a measure of consistency referred to as error dispersion, meaning how spread out or variable a model’s daily errors are, rather than simply their average. Volume 27, No. 6: November 2026
For aggregate performance, we calculated four accuracy measures across all rolling 7-day forecast windows. The MAE is the average number of patients per day a forecast missed by, regardless of whether the model over-predicted or underpredicted; this was our primary outcome measure. Root mean squared error (RMSE) is similar to MAE but gives additional weight to large misses, making it more sensitive to occasional large forecasting errors. The MAPE expresses the average error as a percentage of actual patient volume rather than as a raw patient count, which allows comparison of forecast accuracy across EDs of different sizes. Coefficient of determination (R²) is a score, typically between 0 and 1, describing how well a model’s predictions tracked the actual day-to-day fluctuations in volume: an R² of 1.0 would indicate that the model perfectly explained all observed variation in volume, while an R² of 0 would indicate that the model explained none of it, performing no better than simply predicting the historical average each day. We also calculated two operational accuracy measures directly relevant to staffing decisions: the proportion of daily forecasts falling within a pre-specified allowable error tolerance, defined as a margin (five, 10, 15, or 20 patients) that an ED might reasonably absorb without meaningfully understaffing or overstaffing for the day. To assess model stability and temporal variability (error dispersion, as described above), we calculated weekly-level error metrics. For each rolling 7-day forecast window, we computed the MAE across those 7 days, generating a distribution of weekly MAE values across the study period. We summarized this distribution using median values, interquartile ranges ([IQR], defined as the range covering the middle 50% of weekly errors and used here as a measure of week-to-week consistency), mean values, and 95% CIs. This dual approach distinguishes between overall cumulative accuracy (aggregate metrics) and week-to-week reliability (weekly metrics): A model could have a favorable average error while still being unpredictable, alternating between very accurate and very inaccurate weeks, and this second analysis was designed to detect that possibility. Forecast accuracy differences between modeling approaches were assessed using the Diebold-Mariano (DM) test, a statistical test that determines whether one forecasting method is meaningfully more accurate than another, or whether an observed difference is likely attributable to chance. The XGBoost was designated as the reference model for these comparisons because it achieved the lowest MAPE and RMSE and the highest R² among the five models. The DM test compares the loss differential, or difference in forecast errors, between two models using a modified t-statistic that accounts for the tendency of forecast errors on nearby days to be correlated with one another. A significance threshold of α = .05 was applied, such that a P value < .05 was considered statistically significant; negative DM statistics indicate that the reference model (XGBoost) had smaller errors than the comparison model.
1535
Western Journal of Emergency Medicine
Machine Learning Versus Traditional Statistical Models for ED Volume Forecasting RESULTS Table 1 compares two traditional statistical models (SARIMA, ARIMA) with three machine learning models (XGBoost, LGBM, LSTM). As shown in Table 1, median MAE ranged from 7.77 to 8.60 patients per day across SARIMA (7.86), ARIMA (8.60), XGBoost (7.87), and LGBM (7.77), whereas LSTM demonstrated a higher median MAE of 9.59. This indicates that on a typical day, four of the five models missed the actual patient count by approximately 8 patients, while LSTM’s typical miss was closer to 10 patients. Error dispersion, the spread, or variability, of daily errors around that typical value, followed a similar pattern: IQRs of 9.48–10.49 for SARIMA, ARIMA, XGBoost, and LGBM, compared with 11.84 for LSTM. This indicates that LSTM’s errors were both larger on average and more variable from day to day than those of the other four models. Mean MAE, the average error across all forecasts as opposed to the typical, or median, error above, was lowest for SARIMA (9.60; 95% CI, 9.29–9.91), LGBM (9.64; 95% CI, 9.33–9.94), and XGBoost (9.61; 95% CI, 9.31-9.91). This indicates that these three models missed actual daily volume by approximately 9 to 10 patients per day, on average, and because their CIs overlap substantially, we cannot conclude with confidence that any one of the three clearly outperformed the other two. Mean MAE was higher for ARIMA (10.54; 95% CI, 10.21–10.87) and highest for LSTM (12.01; 95% CI, 11.63–12.39). This same pattern held across every additional metric examined. The RMSE, which penalizes large misses more heavily than MAE, was lowest for XGBoost (12.63), LGBM (12.68), and SARIMA (12.76), followed by ARIMA (13.85) and LSTM (15.83); this indicates that ARIMA, and particularly LSTM, were more prone to occasional large forecasting errors than the other models. The MAPE (error expressed as a percentage of actual volume, allowing comparison independent of ED size) showed a similar ordering, with XGBoost (13.82%), SARIMA (13.82%), and LGBM (13.88%) yielding the lowest relative error, compared
Huang et al.
with ARIMA (14.93%) and LSTM (17.27%). Model fit, as assessed by R² (how well a model’s predictions tracked actual day-to-day changes in volume, on a 0 to 1 scale), was highest for XGBoost (0.5176) and LGBM (0.5144), followed by SARIMA (0.5077); ARIMA showed lower fit (0.4208), and LSTM demonstrated the lowest explanatory performance (0.2404). This indicates that LSTM captured meaningfully less of the true day-to-day variation in ED volume than the other four models. Table 2 translates these error metrics into a more directly operational question for ED staffing: On what percentage of days would a given model have kept a department’s actual census within a specific, predefined margin (the allowable error tolerance, defined in the methods section) of its forecast? Operational accuracy improved as this allowable error tolerance widened across all approaches. Within 5 patients, SARIMA, ARIMA, XGBoost, and LGBM demonstrated similar performance (31.3–33.3%), whereas LSTM achieved 27.1%. Within 10 patients, SARIMA (60.4%), XGBoost (61.3%), and LGBM (60.4%) exceeded ARIMA (56.9%) and LSTM (51.6%). At 15 patients, coverage increased for XGBoost (79.5%) and LGBM (79.8%), with SARIMA at 80.6%, ARIMA at 75.7%, and LSTM at 70.4%. At 20 patients, a margin most EDs could likely absorb operationally without a major staffing disruption, all non–deep learning models exceeded 87% accuracy (SARIMA 90.3%, ARIMA 87.4%, XGBoost 90.4%, LGBM 90.6%), while LSTM reached 83.3%. Pairwise comparisons of forecast accuracy using DM testing with XGBoost as the reference are summarized in Table 3. XGBoost demonstrated significantly superior predictive performance compared with both ARIMA (DM = -6.09, P < .001) and LSTM (DM = -6.96, P < .001). This indicates that XGBoost’s forecasting errors were significantly and meaningfully smaller than those of ARIMA and LSTM, and that this difference is very unlikely to be due to chance. In contrast, no statistically significant difference in predictive accuracy was observed between XGBoost and SARIMA (DM
Table 1. Summary of predictive performance metrics for models forecasting daily emergency department (ED) arrival volume, grouped by model type (traditional statistical vs machine learning) in a study of five forecasting approaches using an 8-year dataset from an academic freestanding EDs. Median MAE
Mean MAE
Model
Model Type
IQR
SARIMA
Traditional statistical
7.86
9.48
9.60
ARIMA
Traditional statistical
8.60
10.49
10.54
XGBoost
Machine learning
7.87
9.74
9.61
LGBM
Machine learning
7.77
9.89
9.64
LSTM
Machine learning
9.59
11.84
12.01
95% CI Lower
95% CI Upper
RMSE
MAPE (%)
R²
9.29
9.91
12.76
13.82
0.5077
10.21
10.87
13.85
14.93
0.4208
9.31
9.91
12.63
13.82
0.5176
9.33
9.94
12.68
13.88
0.5144
11.63
12.39
15.83
17.27
0.2404
ARIMA, autoregressive integrated moving average; IQR, interquartile range; LGBM, Light Gradient Boosting Machine; LSTM, long short-term memory; MAE, mean absolute error; MAPE, mean absolute percentage error; RMSE, root mean squared error; SARIMA, seasonal autoregressive integrated moving average; XGBoost, eXtreme Gradient Boosting.
Western Journal of Emergency Medicine
1536
Volume 27, No. 6: November 2026
Machine Learning Versus Traditional Statistical Models for ED Volume Forecasting
Huang et al.
Table 2. Operational accuracy of forecasting models in a study of five forecasting approaches using an 8-year dataset from an academic freestanding emergency department. Model
Model Type
Within 5 Patients (%) Within 10 Patients (%) Within 15 Patients (%)
Within 20 Patients (%)
SARIMA
Traditional statistical
33.3
60.4
80.6
90.3
ARIMA
Traditional statistical
31.3
56.9
75.7
87.4
XGBoost
Machine learning
33.3
61.3
79.5
90.4
LGBM
Machine learning
33.1
60.4
79.8
90.6
LSTM
Machine learning
27.1
51.6
70.4
83.3
ARIMA, autoregressive integrated moving average; LGBM, Light Gradient Boosting Machine; LSTM, long short-term memory; SARIMA, seasonal autoregressive integrated moving average; XGBoost, eXtreme Gradient Boosting.
= 0.07, P = .94) or between XGBoost and LGBM (DM = -0.52, P = .60). This indicates that XGBoost’s errors were statistically indistinguishable from, and not clearly better than, those of SARIMA and LGBM. Visual inspection of rolling forecasts and residuals supported the quantitative performance metrics. As shown in Figure 1, all models captured long-term trends and seasonal variation in daily ED volumes, including the pronounced decline in early 2020 and subsequent recovery. Tree-based machine learning models (XGBoost and LGBM) and SARIMA demonstrated close alignment with observed volumes across most of the study period, with predictions generally tracking day-to-day variability. The ARIMA and LSTM exhibited greater divergence during periods of abrupt change and high variability. Scatterplots of predicted vs observed volumes (Figure 2) demonstrated the strongest agreement for XGBoost and LGBM, with dense clustering along the identity (diagonal) line across a broad range of daily volumes. The SARIMA model showed comparable alignment, while ARIMA exhibited increased dispersion at higher volumes. The LSTM
Table 3. Pairwise Diebold-Mariano test results with eXtreme gradient boosting as reference in a study of five forecasting approaches using an 8-year dataset from an academic freestanding emergency department. Comparison (vs XGBoost reference)
DM Statistic P Value
XGBoost vs SARIMA (traditional statistical)
0.07
.94
XGBoost vs ARIMA (traditional statistical)
-6.09
< .001
XGBoost vs LGBM (machine learning)
-0.52
.60
XGBoost vs LSTM (machine learning)
-6.96
< .001
ARIMA, autoregressive integrated moving average; DM, DieboldMariano; LGBM, Light Gradient Boosting Machine; LSTM, long short-term memory; SARIMA, seasonal autoregressive integrated moving average; XGBoost, eXtreme Gradient Boosting.
Volume 27, No. 6: November 2026
predictions were more tightly clustered within a narrower range, reflecting reduced correspondence with observed extremes. These patterns were consistent with the observed differences in R² across models. Residual analyses over time (Figure 3) demonstrated that prediction errors were generally centered around zero for all models, indicating minimal systematic bias. Tree-based models and SARIMA showed relatively stable residual distributions with most errors contained within narrow bounds. The ARIMA and LSTM displayed greater residual dispersion, with more frequent large deviations during periods of heightened variability. Across all approaches, residual magnitude increased during periods of extreme fluctuation in ED volume. DISCUSSION This study compared modern machine learning models against classical time-series approaches for forecasting daily patient volumes in an academic freestanding ED. The SARIMA, XGBoost, and LGBM achieved comparable performance, with absolute mean MAE of 9.60–9.64 patients per day and relative MAPE of 13.82–13.88%. DieboldMariano testing revealed that XGBoost significantly outperformed (predicted patient volume better) ARIMA (DM = -6.09, P < .001) and LSTM (DM = -6.96, P < .001), while showing no significant difference from SARIMA (DM = 0.07, P = .94) or LGBM (DM = -0.52, P = .60). Weekly error analysis demonstrated overlapping IQR (9.48–10.49) across top-performing models, indicating that performance differences were statistically detectable but operationally modest. In practical terms, all three of these models would have supported similarly reliable weekly staffing decisions over the study period. At clinically relevant thresholds, leading models achieved approximately 80% accuracy within 15 patients and 90% accuracy within 20 patients, supporting practical utility for capacity planning decisions. The comparable performance of XGBoost and LGBM aligns with previous research demonstrating the effectiveness of gradient boosting methods in healthcare forecasting. Porto and
1537
Western Journal of Emergency Medicine
Machine Learning Versus Traditional Statistical Models for ED Volume Forecasting
Figure 1. Rolling predictions vs actual emergency department volumes over time. The x-axis represents calendar year, and the y-axis represents daily patient count. In each panel, the blue line represents actual (observed) daily emergency department (ED) patient volume, and the red line represents the model’s forecasted (predicted) volume for that same day. The lightly shaded red region surrounding the red line represents a 20-patient band around the prediction, a visual reference for the operational accuracy threshold reported in Table 2. Where the blue line extends above the red, the model under-predicted patient volume for that day; where the blue line falls below the red, the model over-predicted volume. Panels show model-specific predictions versus actual volumes: (A) eXtreme gradient boosting, (B) light gradient boosting machine (C) long short-term memory (D) autoregressive integrated moving average, and (E) seasonal autoregressive integrated moving average, in a study comparing five forecasting approaches using an 8-year dataset from an academic freestanding ED.
Fogliatto reported XGBoost error rates of 5–14% MAPE in ED forecasting, while our results (13.82% MAPE) reflect inherent variability across different hospital systems and patient populations.8 The SARIMA’s competitive performance (13.82% MAPE, identical to XGBoost) underscores that classical statistical methods remain highly effective for ED forecasting, particularly when data exhibit strong seasonal structure.3 This finding is consistent with Al Yarubi et al, who similarly found SARIMA to be a strong, interpretable performer relative to other statistical forecasting approaches for ED crowding.6 The relatively lower performance of LSTM (MAPE: 17.27%, R²: 0.24) contrasts with the study by Ming et al, which reported MAPE of 4.87% for LSTM in daily ED arrival forecasting.13 This discrepancy may reflect dataset size limitations for deep learning applications or the effectiveness of tree-based methods for capturing temporal patterns in ED volumes.8 A key strength of this study is its use of continuous Western Journal of Emergency Medicine
Huang et al.
Figure 2. Scatterplots of rolling predicted versus observed daily emergency department (ED) patient volumes across modeling approaches in a study of five forecasting approaches using an 8-year dataset from an academic freestanding ED. The x-axis represents actual patient volume, and the y-axis represents predicted patient volume. The diagonal line in each panel represents perfect prediction: if a model predicted patient volume perfectly, every blue dot would fall exactly on this line. Each blue dot represents one day’s forecast; the vertical distance of a dot from the diagonal line reflects how much that model’s prediction missed the actual patient volume for that day. Although the five panels appear visually similar at first glance, the coefficient of determination (R²) reported for each panel, which reflects how tightly the dots cluster around the diagonal line overall, shows that XGBoost (A) and LGBM (B) achieved the closest agreement with actual volumes, followed by SARIMA (E) and ARIMA (D), while LSTM (C) showed the most scatter away from the diagonal, consistent with its higher error metrics in Table 1. (A) eXtreme gradient boosting (R² = 0.5176), (B) light gradient boosting machine (R² = 0.5144), (-) long short-term memory (R² = 0.2404), (D) autoregressive integrated moving average (R² = 0.4208), and (E) seasonal autoregressive integrated moving average (R² = 0.5077).
operational data from an ED spanning eight years. Unlike studies that exclude pandemic-related disruptions, retaining these real-world volume fluctuations demonstrates model robustness to external shocks and fills a gap in forecasting research that typically relies on stable, pre-pandemic data. The narrow 95% CIs around mean weekly MAE for top-performing models (9.29–9.91 patients per day) indicate stable forecasting performance throughout this period, enhancing the practical relevance of our findings for EDs that must maintain forecasting capabilities despite unforeseen operational disruptions. It is also worth clarifying, for ED leaders less familiar
1538
Volume 27, No. 6: November 2026
Huang et al.
Machine Learning Versus Traditional Statistical Models for ED Volume Forecasting biostatistics or quality improvement staff, reserving investment in more complex machine learning infrastructure for settings with additional specific needs (eg, incorporating multiple additional real-time data feeds beyond historical volume alone). For high-volume EDs where consistent forecast reliability matters for staffing decisions, SARIMA, XGBoost, and LGBM all provide suitable options with comparable week-toweek performance (mean MAE differences of < 0.10 patients per day). Model selection should balance statistical performance with operational priorities: SARIMA offers strong accuracy with high interpretability and low computational burden, while XGBoost and LGBM provide statistically validated but modest performance gains for settings in which incremental improvements justify additional complexity. Although precise point forecasting remains challenging, these models provide high reliability for broader capacity planning decisions such as staffing bands, surge preparedness, and bed allocation. Future research should focus on external validation across multiple EDs with diverse patient populations and operational characteristics, incorporation of real-time external variables such as weather, local events, and disease surveillance data (an approach for which Hu et al demonstrated meaningful gains over methods relying on historical averages alone10), and prospective evaluation of downstream operational outcomes following implementation. Studies should also assess whether operational decisions based on these models equitably affect different patient subgroups.
Figure 3. Temporal distribution of rolling forecast residuals over time across predictive models for daily emergency department patient volumes. Residuals are defined as the difference between predicted and observed values. A residual near zero indicates an accurate day’s forecast, while a residual farther from zero indicates a day the model missed by a larger margin, with the sign of the residual indicating the direction of the error (over-prediction or under-prediction). The x-axis represents calendar year, and the y-axis represents patient prediction error. Panels correspond to (A) eXtreme gradient boosting, (B) light gradient boosting machine (C) long short-term memory (D) autoregressive integrated moving average, and (E) seasonal autoregressive integrated moving average.
with these tools, what would be required to put any of these methods into practice. All five methods evaluated in this study, including the machine learning models, are implemented using free, open-source software rather than proprietary commercial forecasting products; there is no vendor licensing cost inherent to the underlying method itself. In practice, an ED interested in adopting one of these approaches would typically require either an in-house data analytics or biomedical informatics team, or a contracted data scientist or statistician, with access to the department’s own historical daily volume data; this is not a task most ED medical directors would be expected to perform themselves. However, our results suggest that departments without ready access to machine learning expertise need not be at a disadvantage: SARIMA, a decades-old statistical method that requires substantially less computational infrastructure and specialized expertise than XGBoost, LGBM, or LSTM, performed as well as the best machine learning model in this study. This finding suggests that many EDs could achieve accurate 7-day volume forecasts using simpler, more accessible statistical tools already familiar to hospital Volume 27, No. 6: November 2026
LIMITATIONS This study was conducted using data from a single academic freestanding ED, which may limit generalizability. In accordance with transparent reporting of a multivariable prediction model for individual prognosis or diagnosis, plus (TRIPOD+) AI guidance, a published reporting standard for studies developing prediction models that use AI or machine learning, our analyses represent model development and internal validation without external validation in other hospitals or health systems. Model performance estimates may be optimistic for settings that differ in referral patterns or operational constraints. CONCLUSION Models SARIMA, XGBoost, and LGBM achieved comparable daily emergency department patient volume forecasting performance, demonstrating strong operational reliability for ED capacity planning. Classical time-series methods such as ARIMA and SARIMA remain highly competitive with modern machine learning approaches, offering similar accuracy with greater interpretability. Deep learning (LSTM) performed worse than traditional statistical methods (ARIMA and SARIMA) in this context. For ED medical directors and hospital administrators without dedicated machine
1539
Western Journal of Emergency Medicine
Machine Learning Versus Traditional Statistical Models for ED Volume Forecasting learning resources, this finding suggests that adopting a wellestablished, simpler statistical forecasting method such as SARIMA may represent a practical and sufficient first step toward data-driven staffing decisions. Prospective validation across multiple sites and evaluation of real-world implementation outcomes represent important next steps.
Huang et al.
3. Cheng N, Kuo A. Using long short-term memory neural networks to predict emergency department wait time. Stud Health Technol Inform. 2020;272:199-202. 4. Chinn C, Shaikh S, Ranasinghe L. A review of the impact of COVID-19 on emergency departments: decrease in emergency department visits throughout the pandemic. Am J Biomed Sci Res. 2020;10(1).
AUTHORS CONTINUED Nathan Lapaix, BS* Michael Lozano Jr, MD, MSHI† Reginald Saint-Hilaire, MD†
5. Choudhury A, Urena E. Forecasting hourly emergency department arrival using time series analysis. Br J Healthc Manag. 2020;26(1):34-43. 6. Gul M, Celik E. An exhaustive review and analysis on applications of statistical forecasting in hospital emergency departments. Health Syst. 2020;9(4):263-284.
Address for Correspondence: Kian Huang, BS, University of South Florida, Morsani College of Medicine, 560 Channelside Drive, Tampa, FL 33602. Email: Kianhuang@usf.edu.
7. Hochreiter S, Schmidhuber J. Long short-term memory. Neural Comput. 1997;9(8):1735-1780. 8. Hu Y, Cato KD, Chan CW, et al. Use of real-time information to predict future arrivals in the emergency department. Ann Emerg Med.
Conflicts of Interest: By the WestJEM article submission agreement, all authors are required to disclose all affiliations, funding sources and financial or management relationships that could be perceived as potential sources of bias. No other author has professional or financial relationships with any companies that are relevant to this study. There are no other conflicts of interest or sources of funding to declare. Copyright: © 2026 Huang et al. This is an open access article distributed in accordance with the terms of the Creative Commons Attribution (CC BY 4.0) License. See: http://creativecommons.org/ licenses/by/4.0/
2023;81(6):728-737. 9. Huang KA, Hardin WM, Prakash NS. Forecasting emergency room patient volumes using extreme gradient boosting with temporal and seasonal feature engineering: a comparative study across hospitals. Cureus. 2025;17(6):e86276. 10. Lee YC, Ng CJ, Hsu CC, et al. Machine learning models for predicting unscheduled return visits to an emergency department: a scoping review. BMC Emerg Med. 2024;24(1):20. 11. Ming C, Lee GJ, Teo YN, et al. Deep learning modelling to forecast emergency department visits using calendar, meteorological, internet search data and stock market price. Comput Methods Programs Biomed. 2025;267:108808.
REFERENCES
12. Porto BM, Fogliatto FS. Enhanced forecasting of emergency
1. Al Yarubi M, Kamisan NAB, Norrulashikin SM. Modeling and
department patient arrivals using feature engineering approach and
forecasting emergency department crowding using SARIMA, Holt
machine learning. BMC Med Inform Decis Mak. 2024;24(1):377.
Winter method, and Prophet models. Int J Health Sci. 2025;9(1):230-
13. Sartini M, Carbone A, Demartini A, et al. Overcrowding in emergency
243.
department: causes, consequences, and solutions—a narrative
2. Centers for Disease Control and Prevention. FastStats—Emergency department visits. National Center for Health Statistics. Available at:
review. Healthcare (Basel). 2022;10(9):1625. 14. Schweigler LM, Desmond JS, McCarthy ML, et al. Forecasting
https://www.cdc.gov/nchs/fastats/emergency-department.htm.
models of emergency department crowding. Acad Emerg Med.
Accessed July 20, 2025.
2009;16(4):301-308.
Western Journal of Emergency Medicine
1540
Volume 27, No. 6: November 2026
Original Research
Emergency Department Operational Measures Associated with EMS Redirection Activation and Duration Barry Hahn, MD*†‡ Anna Van Tuyl, MD*† Josh Greenstein, MD*† Kurien Mathews, DO*† Arsalan Shawl, DO*† Paul Barbara, MD*† Amin Mohamadi, MD, MPH*†
*Northwell Health, New Hyde Park, New York † Staten Island University Hospital, Northwell Health, Department of Emergency Medicine, Staten Island, New York ‡ Hadassah University Medical Center - Ein Kerem, Department of Emergency Medicine, Jerusalem, Israel
Section Editor: Shira Schlesinger, MD, MPH Submission history: Submitted April 24, 2026; Revision received August 5, 2026; Accepted August 9, 2026 Electronically published October 14, 2026 Full text available through open access at http://escholarship.org/uc/uciem_westjem DOI 10.5811/westjem.20766
Introduction: Emergency medical services (EMS) redirection is used to manage emergency department (ED) strain, but whether it reflects operational conditions is unclear. We compared associations of prespecified ED operational measures, including visit volume, patient flow times, admissions, boarding, and left-early measures, with redirection activation and total daily redirection minutes. Methods: We performed a retrospective study at a single urban tertiary care center over 392 consecutive days from April 7, 2021 through May 3, 2022. Redirection temporarily routed ambulances away from the study hospital and was activated centrally by EMS. New York City’s 9-1-1 system included about 500 ambulance units and over 60 hospitals. The primary outcome was activation, defined as any redirection during a calendar day. The secondary outcome was total redirection minutes among days with redirection. Multivariable logistic regression evaluated activation, and negative binomial regression evaluated duration. Results: Redirection occurred on 250 of 392 days (63.8%). Median daily duration was 47 minutes (interquartile range 23-78). Higher ED visit volume was associated with activation (odds ratio [OR] 1.14 per 10 patients; 95% CI, 1.02-1.27). Longer door-to-room time was associated with activation (OR 1.42 per 5 min; 95% CI, 1.04-1.92) and duration (incidence rate ratio 1.022 per min; 95% CI, 1.002-1.042). Boarding time and admission count were not associated with either outcome. Conclusion: Emergency department visit volume was associated with activation but not duration, while door-to-room time was associated with both. Evaluating redirection as a single outcome may obscure differences between activation and cumulative duration. [West J Emerg Med. 2026;27(6)1541–1547.]
INTRODUCTION Emergency medical services (EMS) diversion and redirection alter ambulance destination in response to operational strain. In this study, redirection refers to the temporary rerouting of ambulances away from the study hospital to other receiving hospitals. Prior studies have associated ambulance diversion with delays in care and worse outcomes in acute myocardial infarction.1,2 Reviews Volume 27, No. 6: November 2026
have found mixed evidence regarding broader EMS and patient outcomes and limited guidance on how diversion should be operationalized.3,4 Ambulance diversion policies vary across EMS systems. In the more commonly described model, individual hospitals request diversion when emergency department (ED) or hospital capacity is limited, although regional EMS authorities may coordinate, restrict, or override these requests. 1541
Western Journal of Emergency Medicine
ED Operational Measures Associated with EMS Bypass
Hahn et al.
Centralized destination-management programs have also been described.4-6 Fully centralized systems in which EMS activates and discontinues redirection without hospital input are less frequently described in the literature. However, the relative prevalence of these governance models has not been systematically quantified. In New York City, the Fire Department of New York (FDNY) operates a centralized EMS system with a coordinated redirection process that differs from traditional hospital-initiated diversion. Individual EDs do not initiate or discontinue redirection. Redirection is activated when EMS operational criteria related to ambulance availability and hospital turnaround are met and remains active until those conditions resolve. While redirection is active, ambulances initiating patient transport generally bypass the affected hospital and are directed to another receiving facility.7 The New York City 9-1-1 EMS system includes approximately 500 ambulance units and more than 60 hospitals in its network.8 Most studies of ED crowding and ambulance diversion have evaluated ambulance destination restriction as a single outcome and examined its association with measures of input, throughput, and output, including patient volume, length of stay (LOS), and boarding.3,9 However, EMS redirection may represent two distinct processes: activation and duration. Activation indicates whether redirection is initiated, while duration reflects the total time spent on redirection once it is initiated. Activation and duration likely reflect different aspects of system function, with activation more closely aligned with system-level demand and duration more closely aligned with ED throughput. Prior studies have not clearly examined these components separately. Separating operational measures associated with redirection activation from those associated with redirection duration may clarify whether current redirection practices align with ED conditions and may help refine activation criteria. Evaluating redirection as a single outcome may conceal differences between activation and cumulative duration and limit efforts to improve system performance. In this study, we compared prespecified ED operational measures associated with EMS redirection activation and total daily redirection minutes at a single urban tertiary care center. We hypothesized that the operational measures associated with activation would differ from those associated with duration, reflecting distinct processes underlying redirection activation and cumulative duration. METHODS Study Design and Setting We performed a retrospective observational study of EMS redirection and ED operational metrics at a single urban tertiary care hospital in New York City. This was a single-site study and did not evaluate redirection across the broader EMS system. The study period extended from April 7, 2021, through May 3, 2022, and included all consecutive calendar days (N = 392). The Western Journal of Emergency Medicine
Population Health Research Capsule What do we already know about this issue? Ambulance diversion is used to manage crowding, but the emergency department (ED) operational conditions associated with redirection activation and duration are unclear. What was the research question? Which ED operational measures are associated with emergency medical services (EMS) redirection activation versus duration? What was the major finding of the study? Each 5-minute longer door-to-room time increased activation odds: OR 1.42 (95% CI, 1.04-1.92), P = .03. How does this improve population health? Identifying ED flow measures aligned with EMS redirection may help systems recognize strain and improve ambulance destination and flow decisions.
hospital is an academic center with approximately 97,000 annual ED visits and is one of three 9-1-1 receiving hospitals in the borough. The institutional review board approved the study with a waiver of informed consent under the original study protocol (Protocol# 23-0329). This secondary analysis was conducted under the same protocol. Data Sources We obtained EMS redirection status and timestamps from automated notifications generated by the FDNY. Redirection was determined centrally by the FDNY and was not initiated by the ED. Under the threshold assigned to the study hospital during the study period, redirection was activated when units from three incidents had remained at the hospital for at least 30 minutes and was discontinued when units from no more than one incident remained beyond the 30-minute turnaround threshold.7 The FDNY threshold reflected the time that an ambulance unit remained at the hospital rather than a direct measure of the interval from ambulance arrival to transfer of patient care.10 The daily hospital operational measures evaluated in this study, including visit volume, admission count, LOS measures, boarding time, door-to-triage time, door-to-room time, and left-early measures, were not explicit components of the formal FDNY activation or discontinuation rule. All study variables were obtained from existing electronic data sources. A study investigator exported EMS redirection
1542
Volume 27, No. 6: November 2026
ED Operational Measures Associated with EMS Bypass
Hahn et al. status and timestamps from the FDNY automated email notification log into a structured dataset. Emergency department operational measures were extracted from the institutional emergency medicine service line data repository by the departmental analytics team using standardized queries. Thus, the two data sources were extracted independently by different personnel and subsequently merged by calendar date. For each study day, we calculated total redirection duration by summing all intervals between activation and discontinuation. Redirection activation and discontinuation timestamps were available at the episode level. For the primary analysis, episode-level redirection intervals were aggregated to derive daily redirection activation and total daily redirection minutes. Emergency department operational measures were available only as daily summary values. No manual chart abstraction or patient-level research extraction was performed. The analytic dataset was reviewed for duplicate dates, missing values, and values outside expected ranges. To verify extraction accuracy, a simple random sample of 20 study days, representing 5% of the study period, was independently compared by a study investigator with the corresponding FDNY notification logs and institutional operational reports. No discrepancies were identified. All 392 consecutive study days were represented, and no ED operational measures included in the analyses had missing values. Redirection duration was not defined on days without redirection because duration was analyzed only among redirection days. No imputation was performed. Although selected aggregate values were verified, the underlying operational systems were not independently validated for this study. This analysis used the same underlying dataset as a prior study examining associations between ED operational measures and EMS redirection.7 The present study addresses a distinct question by evaluating redirection activation separately and comparing the operational measures associated with activation and duration. Outcomes We evaluated two related outcomes. The first was redirection activation, defined as any EMS redirection during a calendar day. The second was redirection duration, defined as the total number of redirection minutes per day. Activation was evaluated across all study days, whereas duration was evaluated among days with redirection. Emergency Department Operational Measures We prespecified ED operational measures based on operational relevance and prior literature on ED crowding.9 Daily ED visit volume, admission count, and counts of patients who left without being seen, left against medical advice, or eloped were obtained from the institutional emergency medicine service line data repository. Total ED LOS, discharge LOS, boarding time, door-to-triage time, and door-to-room time were obtained from the same repository as Volume 27, No. 6: November 2026
daily average values in minutes. We defined total ED LOS as the interval from ED registration to departure for all encounters. Discharge LOS was defined as the interval from ED registration to departure among encounters with a final disposition of discharge. Boarding time was defined as the interval from the decision to admit until physical departure from the ED to an inpatient location. We defined door-to-triage time as the interval from registration to completion of triage. Door-to-room time was defined as the interval from completion of triage to placement in an emergency department treatment location. We. calculated each time-based measure as a daily average. A composite left-early measure was calculated as the sum of patients who left without being seen, left against medical advice, or eloped during each calendar day. Statistical Analysis We summarized continuous variables using medians and interquartile ranges (IQR) or means and standard deviations (SD), as appropriate. Categorical variables were summarized using frequencies and percentages. We compared operational measures between days with and without redirection using absolute standardized mean differences. Among days with redirection, unadjusted associations between operational measures and redirection duration were assessed using Spearman rank correlation coefficients. We evaluated associations between the prespecified operational measures and redirection activation and duration separately. To evaluate associations with redirection activation, we used multivariable logistic regression across all study days. Results are reported as odds ratios (OR) with 95% CIs. To evaluate associations with redirection duration, we used negative binomial regression among days with redirection. This model was selected because the outcome demonstrated overdispersion, as indicated by comparisons of the variance to the mean and model fit diagnostics. Results are reported as incidence rate ratios (IRR) with 95% CIs. The activation model included daily ED visit volume, admission count, boarding time, door-to-room time, and day of week. The duration model included daily ED visit volume, admission count, discharge LOS, boarding time, door-to-room time, and day of week. Covariates included in the multivariable models were selected a priori based on clinical and operational relevance. We limited the number of variables included in multivariable models to maintain an appropriate ratio of observations to model covariates. Correlation among covariates was assessed using variance inflation factors. When collinearity was present, defined as a variance inflation factor greater than 5, one variable from the correlated pair was excluded based on interpretability and prior evidence. For example, total ED LOS and boarding time were highly correlated, and only boarding time was retained in multivariable models. We performed a prespecified sensitivity analysis excluding days with door-to-room time in the top 5% to assess
1543
Western Journal of Emergency Medicine
ED Operational Measures Associated with EMS Bypass
Hahn et al. Comparison of Days with and Without Redirection Descriptive characteristics by redirection status are shown in Table 1. Days with redirection had a higher median daily ED visit volume, longer door-to-room time, and longer door-to-triage time than days without redirection. Median daily ED visit volume was 245 (IQR 224-265) on redirection days versus 227 (IQR 208-242) on no-redirection days. Median door-to-room time was 18 minutes (IQR 15-22 minutes) versus 15 minutes (IQR 14-17 minutes), and boarding time was 510 minutes (IQR 379-647 minutes) versus 475 minutes (IQR 343-631 minutes). Admission count, total ED LOS, discharge length of stay, and left-early measures were higher on redirection days. Absolute standardized mean differences are presented in Table 1.
the influence of extreme values. Results were compared with the primary model to assess robustness. In a post hoc sensitivity analysis, we calculated the average redirection episode duration for each redirection day by dividing total daily redirection minutes by the number of redirection activations. We modeled average episode duration using generalized linear regression with a gamma distribution and log link, adjusting for the same covariates as the primary duration model. Robust standard errors were used. In additional post hoc sensitivity analyses, we repeated the activation, total-duration, and average-episode-duration models with continuous calendar time, scaled per 100 study days, included as an additional covariate to assess potential secular trends during the study period. Model fit was assessed using standard goodness-of-fit diagnostics. All tests were two-sided, and P values < .05 were considered statistically significant. We performed analyses using StataNow SE, version 19.5 (StataCorp). This study is reported in accordance with the Strengthening the Reporting of Observational Studies in Epidemiology guidelines. RESULTS The study period included 392 calendar days. Emergency medical services redirection occurred on 250 days (63.8%), while 142 days (36.2%) had no redirection. Among days with redirection, the median daily redirection duration was 47 minutes (IQR 23-78 minutes), and the mean duration was 58.2 minutes (SD 44.6 minutes). There were 433 redirection activations and 14,544 total redirection minutes (242.4 hours) during the study period. The median number of activations per redirection day was 1 (IQR 1-2; range 1-5), and 116 of 250 redirection days (46.4%) had more than one activation.
Operational Measures Associated with Redirection Activation Multivariable logistic regression results for redirection activation (N = 392 days) are shown in Table 2. Higher daily ED visit volume and longer door-to-room time were independently associated with redirection activation. For every 10-patient increase in daily ED visit volume, the odds of redirection activation were higher (OR 1.14; 95% CI, 1.021.27; P = .02). For every 5-minute increase in door-to-room time, the odds of redirection activation were higher (OR 1.42; 95% CI, 1.04-1.92; P = .03). Boarding time, admission count, and day of the week were not independently associated with redirection activation. Operational Measures Associated with Redirection Duration Unadjusted associations with redirection duration are presented in Supplemental Table 1. In multivariable negative binomial regression among redirection days (n = 250),
Table 1. Emergency department operational characteristics by emergency medical services (EMS) redirection status (N = 392 calendar days) in a study of EMS redirection activation versus duration at a single urban emergency department. No redirection days (n = 142), median (IQR)
Redirection Days (n = 250), median (IQR)
Absolute SMD
Missing n (%)
Daily ED volume
227 (208-242)
245 (224-265)
0.656
0 (0.0)
Admission count
Variable
53 (48-59)
59 (53-65)
0.513
0 (0.0)
LWBS
1 (0-2)
1 (0-3)
0.252
0 (0.0)
AMA
3 (2-4)
3 (2-5)
0.148
0 (0.0)
Eloped
3 (2-4)
3 (2-5)
0.225
0 (0.0)
Left early
8 (5-9)
9 (6-11)
0.331
0 (0.0)
Total ED LOS, minutes
380 (340-417)
396 (356-439)
0.333
0 (0.0)
Discharge LOS, minutes
224 (209-240)
228 (214-248)
0.308
0 (0.0)
Boarding time, minutes
475 (343-631)
510 (379-647)
0.194
0 (0.0)
Door-to-room time, minutes
15 (14-17)
18 (15-22)
0.595
0 (0.0)
Door-to-triage time, minutes
7 (6-8)
8 (6-9)
0.380
0 (0.0)
Left early = sum of patients who left without being seen, left against medical advice, or eloped. AMA, against medical advice; ED, emergency department; IQR, interquartile range; LOS, length of stay; LWBS, left without being seen; SMD, standardized mean difference.
Western Journal of Emergency Medicine
1544
Volume 27, No. 6: November 2026
ED Operational Measures Associated with EMS Bypass
Hahn et al.
Table 2. Multivariable logistic regression analysis of operational measures associated with emergency medical services (EMS) redirection activation (N = 392 days) in a study of EMS redirection activation versus duration at a single urban emergency department. OR
Lower 95% CI
Upper 95% CI
P value
Daily ED volume (per 10 patients)
Variable
1.14
1.02
1.27
.02
Door-to-room time (per 5 min)
1.42
1.04
1.92
.03
Boarding time (per 100 min)
0.96
0.85
1.09
.56
Admission count (per 10)
1.12
0.81
1.54
.48
Friday vs Saturday
1.65
0.73
3.73
.23
Monday vs Saturday
1.58
0.59
4.21
.36
Sunday vs Saturday
1.58
0.70
3.53
.27
Thursday vs Saturday
1.90
0.81
4.43
.14
Tuesday vs Saturday
1.71
0.73
4.04
.22
Wednesday vs Saturday
1.71
0.71
4.14
.23
ED, emergency department; OR, odds ratio.
door-to-room time was independently associated with duration (Table 3). Each 1-minute increase in door-to-room time was associated with a 2.2% increase in duration (IRR 1.022; 95% CI, 1.002-1.042; P = .04). Daily ED visit volume, admission count, discharge LO0S, boarding time, and day of week were not independently associated with duration. In a sensitivity analysis excluding days in the highest 5% of door-to-room time, effect estimates and statistical significance were unchanged. In a post hoc sensitivity analysis evaluating average redirection episode duration, door-to-room time remained independently associated with longer episodes (ratio 1.020 per minute; 95% CI, 1.005-1.036; P = .009). The principal associations were also unchanged after adjustment for continuous calendar time. Emergency department visit volume and door-to-room time remained associated with redirection activation, and door-to-room time remained associated with both total daily redirection duration and average episode duration. Calendar time was not independently associated with any of the three outcomes. DISCUSSION In this single-center analysis of 392 calendar days, EMS redirection occurred on most days. It was more likely on days with higher ED visit volume and longer door-to-room time. Door-to-room time was the only variable independently associated with both the occurrence and duration of redirection. Daily ED visit volume was associated with redirection activation but not with redirection duration. Other operational measures, including boarding time and admission count, were not independently associated with either outcome after adjustment. These findings suggest that door-to-room time is associated with both the activation and duration of EMS redirection. Emergency medical services redirection is often described Volume 27, No. 6: November 2026
as a response to ED crowding, but the specific operational signals associated with its use are not well defined. Evaluating redirection as a single outcome may obscure differences between activation and cumulative duration, which appear to reflect distinct operational processes. Door-to-room time likely reflects multiple overlapping operational factors, including triage throughput, room availability, staffing, and patient intake flow, rather than a single modifiable factor. Its association with both activation and duration is consistent, with a role for early intake constraints in the conditions under which redirection occurs. Redirection in this setting was triggered by EMS operational metrics rather than hospital request. The FDNY threshold was based on ambulance-unit turnaround and did not directly include the daily hospital operational measures examined. Door-to-room time nevertheless remained associated with redirection activation, total daily duration, and average episode duration. These findings suggest alignment between EMS-facing ambulance turnaround conditions and ED intake performance, but the findings do not establish that hospital measures caused FDNY redirection decisions. Most published diversion models involve hospital-initiated requests, sometimes coordinated or restricted by regional EMS authorities, while centralized destination-management programs have also been described.3-6 Because ambulance destination policies differ across EMS systems, the findings may not generalize directly to systems in which individual hospitals control diversion status. Prior work has examined hospital contributors to ambulance diversion duration using shorter operational intervals. Schull et al found that boarded patients, admissions, assessment time, and boarding time were associated with diversion minutes measured during consecutive eight-hour intervals.11 In contrast, boarding time and admission count
1545
Western Journal of Emergency Medicine
ED Operational Measures Associated with EMS Bypass
Hahn et al.
Table 3. Multivariable negative binomial regression analysis of operational measures associated with emergency medical services (EMS) redirection duration among days with redirection (n = 250 days) in a study of EMS redirection activation versus duration at a single urban emergency department. Variable
IRR
Lower 95% CI
Upper 95% CI
P value
Sunday vs Saturday
0.811
0.556
1.183
.28
Monday vs Saturday
1.349
0.920
1.977
.13
Tuesday vs Saturday
1.169
0.823
1.661
.38
Wednesday vs Saturday
1.326
0.931
1.889
.12
Thursday vs Saturday
1.108
0.782
1.569
.56
Friday vs Saturday
1.414
0.992
2.015
.06
Daily ED volume, per 10 patients
1.033
0.996
1.072
.08
Admission count, per patient
0.996
0.985
1.007
.49
Discharge LOS, per hour
1.039
0.793
1.361
.78
Boarding time, per hour
1.024
0.996
1.052
.09
Door-to-room time (per 1 minute)
1.022
1.002
1.042
.04
IRR represents the relative change in redirection duration per unit increase. Saturday was the reference day for day-of-week comparisons. ED, emergency department; IRR, incidence rate ratio; LOS, length of stay.
were not independently associated with redirection in our study, while door-to-room time was associated with both occurrence and duration. This pattern suggests that redirection was more closely aligned with early intake conditions than with downstream congestion or admission volume. These differences may reflect the centralized EMS-controlled decision rule, differences in temporal aggregation, or variation in the operational processes underlying hospital-initiated diversion and EMS-initiated redirection. Prior studies have linked ED crowding and ambulance diversion to delays in care and adverse outcomes.1-4,9,12 A recent scoping review found that evidence regarding the effects of ambulance diversion on EMS and patient outcomes remains inconclusive and noted a lack of operational guidance for its use.4 In a prior analysis of the same dataset, daily ED visit volume had only a small association with redirection occurrence, while other operational measures were not significantly associated.7 The present analysis extends that work by evaluating activation and duration separately and identifying door-to-room time as the only measure associated with both outcomes. Related studies suggest that the operational measures associated with restricting patient inflow depend on the type of decision being made. Greenwood-Ericksen et al found that greater ED boarding and inpatient census were associated with lower interhospital transfer acceptance.13 In contrast, boarding time was not independently associated with either redirection activation or duration in our study. This difference may reflect the influence of downstream hospital capacity on transfer acceptance, whereas ambulance turnaround conditions triggered Western Journal of Emergency Medicine
FDNY redirection. Feral-Pierssens et al found that redirecting low-acuity ED patients to nearby clinics was associated with shorter time to initial assessment and fewer patients leaving without being seen, but not with improved overall ED LOS.14 Although this represents a different form of redirection, the findings similarly suggest that strategies affecting patient input or early flow do not necessarily resolve downstream congestion. In our study, redirection appeared more closely associated with early intake strain than with boarding or admission volume. LIMITATIONS This was a single-site study conducted at one hospital within the New York City EMS system and did not evaluate systemwide redirection patterns. The centralized EMScontrolled process may limit external validity because ambulance destination policies vary across jurisdictions, and the findings may not generalize to systems in which individual hospitals initiate and discontinue diversion. The study period occurred during the COVID-19 pandemic, when ED utilization and case mix differed from prepandemic patterns. National ED volumes remained below 2019 levels through early 2022.15 Therefore, the magnitude and pattern of the observed associations may not reflect current operational conditions. The study used day-level aggregation and did not include patient-level outcomes or direct measures of EMS performance. Although redirection timestamps were available at the episode level, ED operational measures were available only as daily summary values. The analysis therefore could not establish temporal ordering or assess within-day variation.
1546
Volume 27, No. 6: November 2026
ED Operational Measures Associated with EMS Bypass
Hahn et al. Short periods of severe crowding or prolonged door-to-room time may have been diluted by lower values during other portions of the day, potentially attenuating associations with redirection episodes. Selected aggregate values were verified against source records; however, the underlying operational systems were not independently validated, and undetected source-system or aggregation errors remain possible. Although redirection was frequent, the median total daily duration on redirection days was 47 minutes. The study was not designed to determine whether redirection totaling this duration affected ED function, EMS performance, or patient outcomes. Neither did the analysis include patient acuity, staffing levels, or real-time ED capacity. Door-to-room time likely represents a composite operational signal rather than a direct mechanistic driver of redirection. Future multicenter studies using time-matched EMS and hospital data should evaluate whether interventions targeting door-to-room time affect redirection, EMS performance, or patient outcomes.
survival among patients with acute myocardial infarction. JAMA. 2011;305(23):2440-2447 2. Yankovic N, Glied S, Green LV, et al. The impact of ambulance diversion on heart attack deaths. Inquiry. 2010;47(1):81-91. 3. Pham JC, Patel R, Millin MG, et al. The effects of ambulance diversion: a comprehensive review. Acad Emerg Med. 2006;13(11):1220-1227. 4. Ong JHM, Lim BJW, Zahrin MABM, et al. Ambulance diversion and its use as an ED overcrowding mitigation strategy: Does it work? A scoping review. Int J Emerg Med. 2025;18(1):125. 5. Bains G, Breyre A, Seymour R, et al. Centralized ambulance destination determination: a retrospective data analysis to determine impact on EMS system distribution, surge events, and diversion status. West J Emerg Med. 2021;22(6):1311-1316. 6. Felice J, Coughlin RF, Burns K, et al. Effects of real-time EMS direction on optimizing EMS turnaround and load-balancing between neighboring hospital campuses. Prehosp Emerg Care. 2019;23(6):788-794. 7. Mathews K, Mohan M, Barbara P, et al. Is there an association
CONCLUSION In this single-center analysis, EMS redirection was most consistently associated with door-to-room time, which was independently associated with both activation and duration. In contrast, emergency department visit volume was associated with activation but not duration. Evaluating redirection as a single outcome may obscure differences between activation and cumulative duration. Door-to-room time may be a practical indicator of operational strain relevant to both hospital flow and EMS coordination.
between emergency department overcrowding and emergency medical services redirection? J Emerg Med. 2025;70:80-86. 8. Lelo de Larrea E, Lam H, Sanabria E, et al. Simulating New York City hospital load balancing during COVID-19. 2021 Winter Simulation Conference (WSC). IEEE; 2021:1-12. doi:10.1109/ WSC52266.2021.9715419 9. Pearce S, Marchand T, Shannon T, et al. Emergency department crowding: an overview of reviews describing measures, causes, and harms. Intern Emerg Med. 2023;18(4):1137-1158. 10. Carter AJE, Overton J, Terashima M, et al. Can emergency medical services use turnaround time as a proxy for measuring ambulance offload time? J Emerg Med. 2014;47(1):30-35.
Address for Correspondence: Barry Hahn, MD, Staten Island University Hospital, Department of Emergency Medicine, 475 Seaview Avenue, Staten Island, NY 10305. Email: bhahn@ northwell.edu.
11. Schull MJ, Lazier K, Vermeulen M, et al. Emergency department contributors to ambulance diversion: a quantitative analysis. Ann Emerg Med. 2003;41(4):467-476. 12. Sun BC, Hsia RY, Weiss RE, et al. Effect of emergency department
Conflicts of Interest: By the WestJEM article submission agreement, all authors are required to disclose all affiliations, funding sources and financial or management relationships that could be perceived as potential sources of bias. No author has professional or financial relationships with any companies that are relevant to this study. There are no conflicts of interest or sources of funding to declare.
crowding on outcomes of admitted patients. Ann Emerg Med. 2013;61(6):605-611.e6. 13. Greenwood-Ericksen M, Kamdar N, Swenson K, et al. Emergency department boarding, inpatient census, and interhospital transfer acceptances. JAMA Netw Open. 2025;8(5):e2512299.
Copyright: © 2026 Hahn et al. This is an open access article distributed in accordance with the terms of the Creative Commons Attribution (CC BY 4.0) License. See: http://creativecommons.org/ licenses/by/4.0/
14. Feral-Pierssens AL, Gaboury I, Carbonnier C, et al. Redirection of low-acuity emergency department patients to nearby medical clinics using an electronic medical support system: effects on emergency department performance indicators. BMC Emerg Med. 2024;24(1):166. 15. Melnick G, O’Leary JF, Zaniello BA, et al. COVID-19 driven decline in
REFERENCES
emergency visits: Has it continued, is it permanent, and what does it
1. Shen YC, Hsia RY. Association between ambulance diversion and
mean for emergency physicians? Am J Emerg Med. 2022;61:64-67.
Volume 27, No. 6: November 2026
1547
Western Journal of Emergency Medicine
Brief Educational Advances
A Case-Based Workshop to Enhance Leadership Self-Efficacy Among Women in Academic Emergency Medicine Tehreem Rehman, MD, MPH, MBA* Anna P. Fang, MD† Laura E. Walker, MD, MBA‡ Sarah K. Wendel, MD, MBA§ Kelly Bookman, MD|| Amy Zeidan, MD# Lauren Walter, MD, MSPH¶ Lauren M. Nentwich, MD† Marie-Carmelle Elie-Turenne, MD¶**†† Meagan R. Hunt, MD‡‡
*Icahn School of Medicine at Mount Sinai, Department of Emergency Medicine, New York, New York † Mass General Brigham, Department of Emergency Medicine, Boston, Massachusetts ‡ Mayo Clinic, Department of Emergency Medicine, Rochester, Minnesota § University of Virginia, Department of Emergency Medicine, Charlottesville, Virginia || University of Colorado School of Medicine, Department of Emergency Medicine, Aurora, Colorado # Emory University School of Medicine, Department of Emergency Medicine, Atlanta, Georgia ¶ The University of Alabama at Birmingham, Heersink School of Medicine, Department of Emergency Medicine, Birmingham, Alabama **The University of Alabama at Birmingham, Department of Anesthesiology and Perioperative Medicine, Division of Critical Care Medicine, Birmingham, Alabama †† The University of Alabama at Birmingham, Department of Medicine, Division of Palliative Medicine, Birmingham, Alabama ‡‡ Wake Forest University School of Medicine, Department of Emergency Medicine, Winston-Salem, North Carolina
Section Editor: Sarah Aly, DO Submission history: Submitted April 27, 2026; Revision received August 31, 2026; Accepted August 22, 2026 Electronically published November 2, 2026 Full text available through open access at http://escholarship.org/uc/uciem_westjem DOI 10.5811/westjem.64686
Introduction: Women remain underrepresented in emergency medicine leadership roles, in part due to sex-based stereotypes that undervalue leadership traits traditionally associated with women, such as collaboration and empathy. Agentic traits like assertiveness are often perceived as requisite for leadership, while communal skills are overlooked. Leadership self-efficacy, an individual’s belief in their ability to successfully perform leadership roles, is a key predictor of leadership emergence. Methods: Our team developed a 90-minute didactic session featuring a panel of diverse women leaders followed by an interactive case-based exercise, delivered at the Society for Academic Emergency Medicine 35th Annual Meeting in 2024. The intervention was evaluated using a preand postsurvey based on an adapted Leadership Self-Efficacy Scale measuring six domains of leadership self-efficacy. Eighteen participants completed both the pre- and postsession surveys, providing 18 matched pre–post pairs for analysis. Participants rated their confidence on a sevenpoint Likert scale. Our outcome of interest was the change in mean self-efficacy score for each domain on this seven-point scale, assessed with paired t-tests. Results: All six leadership domains showed increased mean scores postintervention. Dimension 1 (Leading Change) increased significantly (mean change +0.72/7, P = .001), as did Dimension 2 (Choosing team/Delegating) (mean change +0.61/7, P = .004). Dimensions 3–6 showed positive but nonsignificant trends. Conclusion: This single-session intervention was associated with increased leadership selfefficacy, particularly in the domains of leading change and team-building. The combination of role model exposure and interactive case practice may be a useful approach for empowering women physicians. This innovation can be adapted for implementation at other academic institutions. [West J Emerg Med. 2026;27(6)1548–1551.]
Western Journal of Emergency Medicine
1548
Volume 27, No. 6: November 2026
Rehman et al.
A Case-Based Workshop to Enhance Leadership Self-Efficacy Among Women in Academic EM
INTRODUCTION Women remain persistently underrepresented in emergency medicine (EM) leadership: In academic EM, women represent only 15.0% of department chairs (20 of 133) despite comprising 38.8% of academic EM faculty (2,845 of 7,330).1 Sex-based stereotypes often create a double bind for women: When they exhibit agentic behaviors (assertive, competitive, and achievement-oriented behaviors traditionally associated with men), they may face backlash for violating sex-based expectations, yet communal behaviors (collaborative, empathetic, and relationshiporiented) are often overlooked or undervalued in leadership contexts.2,3 These dynamics may undermine women’s leadership self-efficacy by limiting visible role models and discouraging pursuit of leadership opportunities.4 Few interventions in academic EM are explicitly designed to counter sex-based leadership stereotypes. Women-only leadership development programs suggest such interventions can facilitate leadership role identity construction through validation and belonging.5 Leadership self-efficacy, defined as an individual’s belief in her ability to successfully fulfill leadership roles, is a key predictor of leadership emergence and effectiveness.6 Selfefficacy beliefs influence motivation, goal-setting, and persistence,7,8 and higher self-efficacy is associated with greater willingness to assume leadership roles.9 Women often report lower leadership self-efficacy than men, particularly in domains involving assertiveness and change initiation,4,10 a gap partially explained by fear of backlash, limited role models, and internalized societal messages about leadership.2,11 Interventions that provide role model exposure, skill validation, and opportunities for practice have shown promise.12 Consistent with social cognitive theory, which identifies vicarious learning and mastery experiences as primary sources of self-efficacy,8 the intervention paired role model exposure with case-based practice. Objectives The Academy for Diversity and Inclusion in Emergency Medicine Operations Committee and the Academy for Women in Academic Emergency Medicine collaboratively designed a didactic intervention to counter sex-based leadership stereotypes, elevate undervalued communal traits, and strengthen participants’ internal validation of their leadership abilities. Our objective was to evaluate whether this single 90-minute workshop measurably improved leadership selfefficacy among women in academic EM. METHODS Curricular Design The intervention was based on the premise that effective leadership requires both consideration (employee-oriented, communal) and structuring (task-oriented, agentic) behaviors, yet consideration behaviors are often perceived as feminine Volume 27, No. 6: November 2026
and undervalued.13 The design paired role model exposure with interactive skill practice. The 90-minute didactic session, implemented at the Society for Academic Emergency Medicine Annual Meeting in 2024, was open to all registered attendees and specifically promoted to women in academic EM. After an introduction and administration of the preintervention survey (5 minutes), a moderated panel of three senior women leaders shared how traditionally undervalued traits, such as collaboration, empathy, and relationship-building, contributed to their leadership success, followed by a brief question-and-answer session (30 minutes). Each panelist came from a different academic institution and held a different type of senior leadership role, spanning departmental leadership (chair or vice chair) and national specialty society leadership. Their areas of focus included informatics, operations, quality, and research, so that participants encountered more than one route to advancement and more than one leadership style. Participants then worked in facilitated small groups (five to eight participants) through an interactive case exercise (40 minutes) that required active participation from every group member, assuming the role of a newly appointed emergency department director tasked with improving length of stay by addressing radiology turnaround times. Discussion questions addressed stakeholder resistance, team selection, conflict management, building buy-in, and measuring success. The full case and facilitator guide are provided as eAppendix B. The session closed with administration of the postintervention survey (10 minutes) and a summary of key takeaways (5 minutes). Each group was facilitated by a leadership team member or experienced volunteer using a standardized guide. Outcomes were measured with a pre- and postintervention survey based on the Leadership SelfEfficacy Scale, a validated multidimensional instrument developed by Bobbio and Manganelli that measures six core domains: (1) starting and leading change processes in groups; (2) choosing effective followers and delegating responsibilities; (3) building and managing interpersonal relationships; (4) showing self-awareness and selfconfidence; (5) motivating people; and (6) gaining consensus of group members.14 Domains 1 and 2 align most closely with agentic traits, whereas Domains 3, 5, and 6 reflect communal, relationship-oriented traits. For feasibility in a conference setting, one representative item was selected per domain (eAppendix A), scored on a seven-point Likert scale from “strongly disagree” (1) to “strongly agree” (7). Surveys were administered electronically through REDCap (Research Electronic Data Capture). Participants completed the surveys on their personal devices via a survey link at the beginning and end of the session, and responses were exported from REDCap for analysis. No demographic data were collected to protect anonymity given the small
1549
Western Journal of Emergency Medicine
A Case-Based Workshop to Enhance Leadership Self-Efficacy Among Women in Academic EM number of attendees. The outcome of interest was the change in mean self-efficacy score for each domain from pre- to immediately postintervention, assessed with paired t-tests. The institutional review board (IRB) determined that this evaluation did not require IRB review (45 CFR 46.102). Participants provided informed consent and used randomly generated codes allowing anonymous pre-post pairing. Total session attendance was not formally recorded; session organizers estimated approximately 40 attendees. RESULTS Impact/Effectiveness A total of 51 survey submissions were collected. Based on randomly generated participant codes, 18 participants completed both pre- and postsurveys, forming matched pairs for analysis; the first chronological REDCap entry for each code was considered the pretest and the second the posttest. Total attendance was not formally recorded, but session organizers estimated approximately 40 attendees; thus, the 18 matched pairs represent an estimated 45% of those present. Pre- and postintervention mean scores for all six dimensions are reported in Table. All six dimensions showed increased mean scores from pre- to postintervention. Dimension 1 (Leading Change) increased from 4.83/7 to 5.56/7 (mean change +0.72/7, P = .001), and Dimension 2 (Choosing Team/Delegating) improved from 5.11/7 to 5.72/7 (mean change +0.61/7, P = .004). Changes in Dimensions 3–6 were positive but did not reach statistical significance. DISCUSSION Lessons Learned Improvements were concentrated in Dimensions 1 and 2, the more agentic domains, in which internalized stereotypes may most undermine women’s confidence.15,16 These were also the domains most directly targeted by the case exercise, which emphasized change management and team selection. High baseline scores in several domains, particularly Dimension 4 (Self-Confidence, baseline mean 5.78/7),
Rehman et al.
suggest possible ceiling effects; however, ceiling effects alone cannot explain the nonsignificant findings, because the baseline mean for Dimension 5 (Motivating Others, 5.11/7) was identical to that of Dimension 2, which did improve significantly. The alignment between the session’s content emphasis and the domains that improved may therefore also have contributed to this pattern. Several design features may have contributed to these gains: The panel of senior women leaders provided vicarious learning and validation of leadership identity; the case exercise created mastery experiences; and the session explicitly validated communal leadership traits. These mechanisms are consistent with social cognitive theory8 and with prior literature on women’s leadership development programs, leadership self-efficacy interventions, and professional identity formation.5,12,17 However, because the intervention was evaluated as a whole, this evaluation cannot determine which components drove the observed improvements. LIMITATIONS This evaluation has several limitations. First, the sample size (N = 18 matched pairs) is relatively small, limiting statistical power to detect changes in domains with high baseline scores. Second, because the total workshop attendance was not formally recorded, the response rate is based on an organizer estimate rather than a count, and the possibility of response bias cannot be excluded. Third, this was a single-session intervention at a national conference; longer-term follow-up is needed to assess sustainability. Fourth, participants were self-selected and motivated conference attendees, which may limit generalizability to other contexts. Fifth, the evaluation relied on self-reported measures rather than objective measures of leadership behavior, and the study design did not permit assessment of which individual program components were effective. Lastly, because no demographic data were collected by design, respondents could not be characterized, we could not test whether completers differed from noncompleters, and the sex of participants in this open session was not documented. We
Table. Pre- and postintervention leadership self-efficacy scores in a study of women in academic emergency medicine attending a Society for Academic Emergency Medicine 2024 case-based leadership workshop. Leadership Domain
Pretest Mean
Posttest Mean
Mean Change
P value
Leading Change
4.83
5.56
+0.72
.001
Choosing Team
5.11
5.72
+0.61
.004
Relationships
5.44
5.94
+0.50
.07
Self-Confidence
5.78
6.06
+0.28
.17
Motivating Others
5.11
5.67
+0.56
.09
Consensus 5.28 5.39 Paired t-tests assess change in mean scores. Bold indicates P < .05.
+0.11
.79
Western Journal of Emergency Medicine
1550
Volume 27, No. 6: November 2026
Rehman et al.
A Case-Based Workshop to Enhance Leadership Self-Efficacy Among Women in Academic EM
use the term “sex-based” throughout per journal convention while recognizing that this dimension was not measured.
REFERENCES 1. Association of American Medical Colleges. US medical school faculty, 2024. 2024. Available at: https://www.aamc.org/data-reports/
Exportability and Next Steps This innovation requires minimal resources and can be delivered in a 90-minute session. Key export elements include recruiting diverse women leaders, adapting the case locally, training facilitators, and ensuring a supportive environment. The model can be adapted for department retreats, faculty development programs, residency curricula, or other groups underrepresented in leadership, and it is best integrated into ongoing programming rather than being delivered once. Because structural barriers remain, future work should couple individual-level development with institutional reforms and include longer-term follow-up, objective measures of leadership behavior, and assessment of whether increased self-efficacy translates into pursuit and attainment of leadership roles. CONCLUSION This innovation offers a practical, low-resource approach to leadership development for women in academic EM. By validating diverse leadership styles and providing opportunities for skill practice, such interventions may empower women physicians to recognize and leverage their leadership strengths in specific domains. As a single-session intervention evaluated in a small sample, it is a promising starting point rather than a solution to sex-based disparities in academic EM leadership, and it is best paired with sustained programming and institutional change.
faculty-institutions/report/faculty-roster-us-medical-school-faculty. Accessed February 11, 2026. 2. Eagly AH, Karau SJ. Role congruity theory of prejudice toward female leaders. Psychol Rev. 2002;109:573-598. 3. Tremmel M, Wahl I. Gender stereotypes in leadership: analyzing the content and evaluation of stereotypes about typical, male, and female leaders. Front Psychol. 2023;14:1034258. 4. McCormick MJ, Tanguma J, López-Forment AS. Gender differences in beliefs about leadership capabilities: exploring the glass ceiling phenomenon with self-efficacy theory. Kravis Leadership Institute Leadership Review. 2003;Spring. 5. Brue KL, Brue SA. Leadership role identity construction in women’s leadership development programs. J Leadersh Educ. 2018;17(1):7-25. 6. Paglis LL, Green SG. Leadership self-efficacy and managers’ motivation for leading change. J Organ Behav. 2002;23:215-235. 7. Bandura A. Social Foundations of Thought and Action: A Social Cognitive Theory. Prentice Hall; 1986. 8. Bandura A. Self-Efficacy: The Exercise of Control. Freeman; 1997. 9. McCormick MJ, Tanguma J, López-Forment AS. Extending selfefficacy theory to leadership: a review and empirical test. J Leadersh Educ. 2002;1(2):34-49. 10. Eagly AH, Karau SJ. Gender and the emergence of leaders: a meta-analysis. J Pers Soc Psychol. 1991;60:685-710. 11. Rink F, Stoker JI, Ryan MK, et al. Gender differences in how leaders determine succession potential: the role of interpersonal fit with followers. Front Psychol. 2019;10:752. 12. Ng KY, Ang S, Chan KY. Personality and leader effectiveness: a moderated mediation model of leadership self-efficacy, job demands,
Address for Correspondence: Tehreem Rehman, MD, MPH, MBA, Icahn School of Medicine at Mount Sinai, Department of Emergency Medicine, 1 Gustave L. Levy Place, New York, NY 10029. Email: tehreem.rehman@mountsinai.org.
and job autonomy. J Appl Psychol. 2008;93:733-743. 13. Cann A, Siegfried WD. Gender stereotypes and dimensions of effective leader behavior. Sex Roles. 1990;23:413-419.
Conflicts of Interest: By the WestJEM article submission agreement, all authors are required to disclose all affiliations, funding sources and financial or management relationships that could be perceived as potential sources of bias. No author has professional or financial relationships with any companies that are relevant to this study. There are no conflicts of interest or sources of funding to declare. Copyright: © 2026 Rehman et al. This is an open access article distributed in accordance with the terms of the Creative Commons Attribution (CC BY 4.0) License. See: http://creativecommons.org/ licenses/by/4.0/
Volume 27, No. 6: November 2026
14. Bobbio A, Manganelli AM. Leadership self-efficacy scale: a new multidimensional instrument. TPM Test Psychom Methodol Appl Psychol. 2009;16(1):3-24. 15. Steele CM. A threat in the air: how stereotypes shape intellectual identity and performance. Am Psychol. 1997;52:613-629. 16. Logel C, Walton GM, Spencer SJ, et al. Interacting with sexist men triggers social identity threat among female engineers. J Pers Soc Psychol. 2009;96:1089-1103. 17. Coneybeare D, Truong J, Runde D, et al. Professional identity
1551
formation: Who am I? Where am I going? AEM Educ Train. 2025;9(suppl 1):S73-S79.
Western Journal of Emergency Medicine
Original Research
Emergency Ultrasound Fellowship Match Outcomes: Unfilled Positions and Implications over Eight Years Zachary Boivin, MD* Di Coneybeare, MD† Alexis Salerno, MD‡ Sandra Werner, MD§ Trent She, MD||
*Yale School of Medicine, Department of Emergency Medicine, New Haven, Connecticut † Columbia University Medical Center, Vagelos School of Physicians and Surgeons, Department of Emergency Medicine, New York, New York ‡ University of Maryland School of Medicine, Department of Emergency Medicine, Baltimore, Maryland § Case Western Reserve University, MetroHealth Medical Center, Department of Emergency Medicine, Cleveland, Ohio || Hartford Hospital, Department of Emergency Medicine, Hartford, Connecticut
Section Editor: Robert Allen, MD Submission history: Submitted March 3, 2026; Revision received June 22, 2026; Accepted June 28, 2026 Electronically published October 18, 2026 Full text available through open access at http://escholarship.org/uc/uciem_westjem DOI 10.5811/westjem.64010
Introduction: Advanced emergency ultrasound (AEMUS) fellowships recently experienced an unexpected decrease in the number of positions filled in the match. Our study aimed to characterize this trend over an eight-year period. Methods: We performed a cross-sectional observational study of AEMUS fellowships participating in the National Resident Matching Program (NRMP) from the 2019–2026 match cycles, crossreferencing the publicly available database from the Society of Clinical Ultrasound Fellowships. The primary outcome was both the proportion of AEMUS fellowship positions filled and a program complement fill percentage. Secondary outcomes included stratification by geography and duration since program establishment. Results: We included a total of 138 of the 141 programs listed in the NRMP Match. From 2019 to 2026, there was a 28.2% increase in the number of programs and a 34.5% increase in available positions. There was a general increase in the percentage of positions filled from 2019 to 2022, with 53.7% (87/162) of positions filled to 74.4% (145/195), peaking at 81.1% (137/169) in 2021. This upward trend reversed in 2023 with a decrease to 65.1% (142/218). The percentage of positions filled has continued to decrease through 2026, with a fill rate of only 56.0% (122/218). In the eight years of NRMP data, 97 of the 138 programs (70.3%) went unfilled at least once. Programs participating in the Match for a longer period had a statistically significant higher fill percentage, with 27 programs in the 1- to 4-year group with a total fill percentage of 46.0%, 32 programs in the 5- to 7-year group with a fill percentage of 59.0%, and 79 programs in the ≥ 8-year group with a fill percentage of 72.8% (P < .01) using a Kruskal-Wallis test. Spearman correlation analysis found no association between geographic proximity and likelihood of a program being fully filled. Conclusion: This cross-sectional study of NRMP data showed a decrease in the percentage of positions filled for adult AEMUS fellowships starting in 2023, which continued through 2026. Programs with greater longevity exhibited higher fill percentages, showing resilience in the face of this pattern. [West J Emerg Med. 2026;27(6)1552–1559.]
Western Journal of Emergency Medicine
1552
Volume 27, No. 6: November 2026
Boivin et al.
Emergency Ultrasound Fellowship Match Outcomes: Unfilled Positions
INTRODUCTION Since the first advanced emergency ultrasound fellowship (AEMUS) started in 1993, there has been widespread proliferation and acceptance of point-of-care ultrasound (POCUS) in emergency medicine (EM) and undergraduate medical education.1-6 The clinical utility of POCUS and its increasing popularity led to the implementation of POCUS training guidelines for EM postgraduate training by the Accreditation Council for Graduate Medical Education (ACGME) in 2009.2,7,8 In response to the growing body of AEMUS fellowship programs, the Society of Clinical Ultrasound Fellowships (SCUF) was formed to centralize the application process and provide a common virtual location where fellowships could recruit potential fellows. The AEMUS fellowships started to participate in the Match through the National Resident Matching Program (NRMP) in 2019. Subsequently, an independent fellowship accreditation body, the Emergency Ultrasound Fellowship Accreditation Council was established in 2020 to standardize the AEMUS fellowship experience. As of the 2026 AEMUS application season, there are 118 AEMUS programs actively accepting applications for new EM-trained fellows. From 2019 to 2023, there was steady growth in the percentage of AEMUS positions filled. However, from 2023 to 2026, a high percentage of AEMUS fellowship positions went unfilled. This finding mirrors both the EM residency Match in recent years with a high rate of unfilled programs, and decreased EM job opportunities during the COVID-19 pandemic.9,10 In contrast, other EM fellowships such as toxicology, emergency medical services, and global health did not demonstrate the same pattern within this period.11 Limited research exists to examine the underlying etiology of this phenomenon. The NRMP provides data on combined fill percentages (for AEMUS this includes programs accepting internal medicine, pediatrics, and family medicine residents), applicant numbers, and program-level data of positions filled compared to available positions. We sought to characterize both the proportion of AEMUS fellowship positions filled and the program complement fill percentage for EM AEMUS fellowships, along with identifying specific programs elements (geography, years participating in the NRMP Match) that correlate with fellowship position fill rate. Understanding the relationship between specific programs and their fill percentage can provide insight into the fellowship Match for both AEMUS fellowship directors and fellow applicants beyond the data provided by the NRMP. METHODS Study Design We performed a cross-sectional observational study of AEMUS fellowships participating in the NRMP from the 2019–2026 Match cycles. This represents the total duration AEMUS fellowships used the NRMP process to match Volume 27, No. 6: November 2026
Population Health Research Capsule What do we already know about this issue? The number of emergency ultrasound fellowship programs and positions has expanded in recent years, but data suggest declining fill rates in recent Match cycles. What was the research question? How have advanced emergency medicine ultrasound fellowship fill rates and program complement fill percentages changed over 8 years? What was the major finding of the study? More established programs in the Match had higher fill rates than newer programs (72.8% vs 46.0%, P < .01) How does this improve population health? Recruitment trends may help programs align fellowship positions with changing applicant demand and future emergency ultrasound workforce needs.
fellows. Prior cycles, which involved direct offers to candidates either on a rolling basis or on an agreed-upon offer date, were not included given changes in fellowship directors and anticipated large data gaps from incomplete records. We used the publicly available NRMP dataset to identify AEMUS programs participating in the match process, and cross-reference it with the publicly available database from the SCUF (https://www.eusfellowships.com/programs) to ensure accuracy. To accept new fellows, an AEMUS program must use both the SCUF and the NRMP: The SCUF manages the application process to AEMUS fellowships, and the NRMP manages the Match process. Any program that primarily accepted non-EM fellowship applicants was excluded. Program location was sorted into four regions (Northeast, Midwest, South, West) based on US census classification.12 The number of years programs participated in the Match was based on NRMP data from 2019 to 2026, and sorted a priori into three groups, 1–4 years, 5–7 years, and ≥ 8 years of total program existence at the time of the study. These groups were selected to compare fill percentage based on years of program existence, with ≥ 8 years representing the most established programs in the NRMP dataset, and 1–4 years being considered a newer program. Because there is evidence that geographic factors play a
1553
Western Journal of Emergency Medicine
Emergency Ultrasound Fellowship Match Outcomes: Unfilled Positions factor in the NRMP residency Match, we assessed whether geographic factors would be a factor in AEMUS fellowship fill rates.13,14 We chose specifically to assess geographic proximity to other fellowships, theorizing that programs located closer together would have lower fill rates due to competition for applicants. The geographic driving distance between AEMUS fellowships was determined by using a program’s ZIP code and the open-source mapping software OpenStreetMap (https://www.openstreetmap.org). We grouped programs into academic or community-based categories based on self-identification on the program website or its SCUF website profile. Manual review of the NRMP dataset was undertaken by study investigators (ZB, TS) who underwent a one-hour training session and were not blinded to the study question; there was a 10% random overlap in reviews of program fill percentages. No discrepancies were noted within the random overlap. This study was reviewed and deemed exempt by the institutional review board at Hartford Hospital.
Outcomes The primary outcome was both the proportion of AEMUS fellowship positions filled and a program complement fill percentage. The proportion of AEMUS fellowship positions filled was the proportion of available positions filled in the NRMP Match, whereas the program complement fill percentage was the proportion of individual programs that completely (all spots matched), partially (at least one spot matched), or failed (no spots matched) to fill in the NRMP Match. Secondary outcomes included fill percentage stratified by geography, total duration of program existence, and number of fellows (at least 1 fellow). Additional analyses were undertaken to compare Match data (unfilled, fully filled, partially filled) to program type (academic or community) and proximity to other AEMUS fellowship programs. Data Analyses We used descriptive statistics to describe the Match outcomes, with fill percentage calculated as number of spots filled divided by available spots. A Shapiro-Wilk test of
Boivin et al.
normality was applied to data for years participating in the NRMP Match and region of program location. We used a Kruskal-Wallis test with a post hoc Dunn test to compare the non-normal data of region of program location and years participating in the NRMP Match. A Spearman correlation test and multinomial logistic regression were conducted to examine the relationship between program type (academic or community), program proximity, and program complement fill percentage. We performed statistics using Microsoft Excel (Microsoft Corporation) and IBM SPSS (International Business Machines). The analyses were conducted at the level of program year; we did not model for repeated observations from the same programs.
RESULTS Within the NRMP dataset, 141 programs were listed; data were available for 138 programs. Three programs in the NRMP Match were not listed on the SCUF website database. Of the 138 programs, 43 were in the Northeast, 26 in the Midwest, 43 in the South, and 26 in the West. A summary of program statistics can be found in Table 1. The overall fill percentage was 61.4% across eight years. The 2019 ultrasound fellowship Match included 92 programs with 162 available positions, and 87 positions filled (53.7%). By the 2026 Match, there were 118 programs with 218 available positions, and 122 positions filled (56.0%). This represented a 28.2% increase in the number of programs and a 34.5% increase in the number of available positions. There was a general upward trend in fill percentage from 2019 (87/162) to 2022 (145/195) (53.7% to 74.4%, respectively), peaking at 81.1% (137/169) in 2021. This trend changed in 2023 with a drop to 65.1% (142/218), which has continued to decrease in the most recent 2026 Match to 56.0% (122/218) (Figure 1). The number of positions filled in 2019 was 87, reaching a peak of 145 in 2022; in 2026 the number was 122. This represents an increase of 40.2% of positions filled over the study duration, larger than the percentage increase in both programs and available positions. Analysis of program complement fill percentage
Table 1. Summary of program statistics in a study of fill percentages in the advanced emergency ultrasound fellowship match. 2019
2020
2021
2022
2023
2024
2025
2026
Positions Filled
87
101
137
145
142
128
130
122
Positions Available
162
189
169
195
218
232
233
218
Fill Percentage (%)
53.7
53.4
81.1
74.4
65.1
55.2
55.8
56.0
Program Number
92
106
101
98
124
127
127
118
Fully Filled, n (%)
40 (43.5)
43 (40.6)
81 (80.1)
78 (79.6)
61 (49.2)
49 (38.6)
53 (41.7)
51 (43.2)
Partially Filled, n (%)
17 (18.5)
29 (27.4)
8 (7.9)
11 (11.2)
31 (25.0)
41 (32.3)
43 (33.9)
30 (25.4)
Unfilled n (%)
35 (38.0)
34 (32.0)
14 (13.9)
9 (9.2)
32 (25.8)
37 (29.1)
31 (24.4)
37 (31.4)
Western Journal of Emergency Medicine
1554
Volume 27, No. 6: November 2026
Emergency Ultrasound Fellowship Match Outcomes: Unfilled Positions
Boivin et al.
50
250
45 40
200
35 30
150
25 20
100
15 50
10 5
0 2019
2020
2021
Positions Matched
2022
2023
Positions Available
2024
2025
0
2026
2019
Programs
2020
2021
2022 Unfilled
2023
2024
2025
2026
Partially Filled
Figure 1. Trend of positions matched, positions available, and program number during the eight years of National Residency Matching Program data for the advanced emergency ultrasoumd fellowship Match.
Figure 2. Number of advanced emergency ultrasound (AEMUS) fellowship programs unfilled or partially filled by year in a study of eight years of fill percentages in the AEMUS fellowship Match.
demonstrated variability in recruitment success. In the eight years of NRMP data, 97 of the 138 programs (70.2%) with available data have gone unfilled, meaning no fellows matched, at least once; 59 programs (42.8%) have gone unfilled two separate years. A total of 130 of the 138 programs (94.2%) have gone partially filled or failed to fill in at least one year. Only 8 programs (5.8%) have filled all positions every year. There was a large increase in the number of programs that went unfilled, from 9 in 2022 (9/98, 9.2% of programs) to 32 (32/124, 25.8% of programs) in 2023 (Figure 2). This coincided with an increase in available positions from 195 to 218, and in the number of programs from 98 to 124, while there was a stable number of applicants matching fellowship positions in 2022 and 2023 (145 versus 142, respectively). When stratifying the NRMP aggregate Match data by region, the percentage of filled positions were as follows: 63.5% (Northeast); 60.8% (Midwest); 57.1% (South); and 66.0% (West); there was no significant difference in match rates based on geographic region in any of the pairings (P = .07). We evaluated the relationship between fill percentage and years participating in the NRMP Match by dividing programs into three groups based on program longevity (ie, how long the program has existed), divided into three groups: 1–4 years; 5–7 years; and ≥ 8 years, with the longevity determined by the total number of years a program participated in the NRMP Match from 2019–2026 match cycles. This grouping was determined a priori by investigators. There were similar group sizes for the 1–4-year (27 programs) and 5–7-year groups (32 programs), with a larger ≥ 8-year group (79 programs) given the number of established programs in the NRMP dataset. The 1–4-year group had a total fill percentage of 46.0%, the 5–7-year group had a fill percentage of 59.0%, and the ≥ 8-year group had a fill percentage of 72.8%. The fill percentage finding was statistically significant in aggregate data (P < .01). There were no overall trends when comparing fill
percentage (combined proportion of filled positions to available positions) for programs accepting one fellow compared to multiple fellows (Figure 3), with significance noted favoring programs accepting one fellow in 2025 (P = .04) but no significance found in other years. Spearman correlation analysis indicated that the type of primary affiliated hospital for a fellowship was not associated with program complement fill percentage (ρ = –0.006, P = .87). A multinomial logistic regression was further performed to examine the relationship between program type (academic versus community) and program complement fill percentage (fully filled, partially filled, or unfilled), and indicated that the type of primary affiliated hospital did not predict the odds of being unmatched (OR, 1.06; P = .64) or fully matched (OR, 1.19; P = .08) when compared with partially matched (Table 2). We conducted a Spearman correlation analysis to assess whether geographic proximity and program type were associated with the likelihood of a program being fully filled. The model included the number of nearby AEMUS fellowships within 5, 10, and 25 miles, the driving distance to the closest adjacent fellowship, and program type. There was no statistical significance that other programs within a 5-mile (ρ = -0.001, P = .99), 10-mile (ρ = 0.02, P = .56), or 25-mile (ρ = 0.03, P = .44) radius were associated with a fully filled program complement (Table 2).
Volume 27, No. 6: November 2026
DISCUSSION In this cross-sectional study of an eight-year period of the AEMUS fellowship Match data, we identified four main findings that expand upon the publicly available NRMP data. There was a spike in the fill percentage during 2021 (137/169, 81.1%) and 2022 (145/195, 74.4%) followed by a downward trend from 2023 to 2026 that returned the fill percentage to pre-2021 levels (Figure 1). An overall fill percentage of 61.4% across all years is below the fill percentage of other EM fellowships participating in the NRMP Match.11 There has
1555
Western Journal of Emergency Medicine
Emergency Ultrasound Fellowship Match Outcomes: Unfilled Positions 100 90
Fill Percentage (%)
80 70 60 50
40 30 20 10 0 2019
2020
2021
2022 1 position
2023 > 1 positions
2024
2025
2026
Figure 3. Combined fill percentage for programs with 1 position compared to > 1 position in a study of eight years of fill percentages in the advanced emergency ultrasound fellowship Match, with statistical significance in 2025.
been a rise in the percentage of unfilled programs from 9.2% (9/98) of programs in 2022 to 31.4% (37/118) in 2026, but this is below the levels seen in 2019 and 2020 at 38.0% (35/92) and 32.1% (34/106), respectively. Neither program type nor proximity to other programs played a significant role in program complement fill percentage. Finally, newer programs in the 1–4-year range filled at a lower rate compared to programs of both the 5–7-year and ≥ 8-year groups over the last eight match cycles, but this result was not statistically significant when considering whether a program was unfilled, partially filled, or fully filled. The publicly available NRMP data represents a combination of EM, internal medicine, family medicine, and pediatric ultrasound fellowships, which differs from our EM-focused study in that we excluded programs that accepted non-EM applicants. We expanded upon the NRMP data by providing fill percentages categorized by region and program length, along with specific data on the number of unfilled and partially filled programs, and assessing for relationships between program type and geography. These additional findings, while not significant, suggest that other factors likely influence both a program’s fill percentage and program complement fill percentage. Despite the increase in AEMUS fellowships, the fill rate has had the opposite trend in recent years. There was a large increase in the number of programs that were unfilled compared to 2022 despite a stable number of matched applicants. This finding mirrors the EM residency Match in 2023, which saw a high rate of unfilled programs attributed to specialty burnout, the projected workforce surplus by 2030, and an increase in residency positions.9 However, the data also demonstrate a high percentage of unfilled programs in the 2019 and 2020 Matches. The highest percentage match occurred in 2021, with 81.1% of positions filled and 13.9% of Western Journal of Emergency Medicine
Boivin et al.
programs unfilled, which may have been related to the weakened EM job market. While there has still been a general decline in fill percentage from 2022 through 2026, the number of matched fellowship positions has remained relatively stable. The 30% rise in the number of programs during the eight-year study period, mostly occurring between 2022 and 2025, outpaced fellowship applicants over the same period. The lower fill percentage for more recently established programs compared to long-standing programs was possibly due to factors such as program reputation, existing program structure, and alumni network. However, the resilience of programs participating in the Match for a longer period may reflect a broader trend seen in other fellowship disciplines with longer histories than AEMUS. As a relatively newer subspecialty, AEMUS may be more susceptible to fluctuations in job prospects, global health crises, and shifts within the healthcare system. There are several potential reasons for the proliferation of ultrasound fellowship programs and positions. There has been an increase in ultrasound education in both undergraduate medical education and residency as the use of POCUS increases, leading to an increased need for ultrasound fellowship-trained faculty.2 The ACGME recognized this growth and designated POCUS as a core competency for EM in 2012, mandating POCUS training with a minimum of 150 POCUS examinations before graduation.15,16 The AEMUS fellowships were seen as highly desirable for both residents pursuing fellowships and for chairs hiring fellowship graduates.17,18 Graduates of AEMUS fellowships reported high satisfaction with their fellowship training, with 93% of surveyed graduates reporting that they would recommend POCUS fellowships to trainees, and 94% of trainees stating that they would pursue an AEMUS fellowship if offered the opportunity.19 As POCUS became more integrated into EM residencies, medical schools and other fields started building POCUS curricula and certifications.20-26 Given this increased popularity of POCUS, there was a natural and expected increase in the demand and, consequently, the supply of AEMUS fellowships. The concern, however, is the continued high prevalence of unfilled programs. Although our data do not point to any causative reasoning for these findings, we suggest a few hypotheses. First, the static growth of new AEMUS fellowships starting in 2023 was likely related to accreditation standards for these training programs. Despite standardized POCUS training in EM residencies,27,28 AEMUS fellowships largely operated without significant oversight, which led to variation in education. This lack of oversight was addressed by the creation of the Emergency Ultrasound Fellowship Accreditation Council to accredit AEMUS fellowships based on a set of core guidelines and content.29,30 The American Board of Emergency Medicine (ABEM) subsequently developed the Focused Practice Designation (FPD) for AEMUS providing certification for graduates of
1556
Volume 27, No. 6: November 2026
Emergency Ultrasound Fellowship Match Outcomes: Unfilled Positions
Boivin et al.
Table 2. Summary table of statistical comparisons for geographic region, program longevity, program type, and program proximity. Characteristic Geographic region
Program longevity
Groups Compared
Fill Percentage / Outcome
Northeast
63.5%
Midwest
60.8%
South
57.1%
West
66.0%
1–4 years
46.0%
5–7 years
59.0%
P value
.07
≥ 8 years
72.8%
< .01
Number of positions
1 position vs > 1 positions
Significant difference observed only in 2025
.04
Program type
Academic vs Community
No association (ρ = −0.006)
.87
Proximity to other programs
Programs within 5 miles
No association (ρ = −0.001)
.99
Programs within 10 miles
No association (ρ = 0.019)
.56
Programs within 25 miles P values are bolded if statistical significance was found. ρ = Spearman correlation coefficient.
No association (ρ = 0.026)
.44
Emergency Ultrasound Fellowship Accreditation Council programs.30 The need for AEMUS fellowships to meet accreditation requirements potentially limited fellowship growth as preexisting programs had to remain compliant with the accreditation council’s guidelines and new fellowships underwent the rigorous accreditation process. The increase in unfilled programs and falling Match rate in 2023 could relate to COVID-19, as the EM job market during the early pandemic was strained.10,31 The 2021 fellowship Match had the highest percentage of positions filled over the eight-year period, as residents may have pursued an AEMUS fellowship hoping to become more attractive candidates for positions in a strained job market. The subsequent decrease in Match rate over the coming years, approaching the pre-2021 fill percentage, could reflect a return to normal for the EM job market and AEMUS fellowships. Pursuing an additional year of training, at a lower salary compared to attending physicians, combined with substantial educational debt and repayment obligations may reduce residents’ interest in fellowship. Another consideration is that the increase in AEMUS fellowships may have resulted in a saturation of academic job opportunities for graduates.32 Since the adoption of POCUS as a core curriculum of EM residencies, more POCUS examinations with increasingly complex POCUS topics are taught earlier in a physician’s training.2,33 Overall, the rise in the number of AEMUS fellowship positions available, along with data showing that almost 95% of programs have gone unfilled or partially filled in the last eight years, suggests that the competition for programs to match applicants has increased. To attract fellows, a program may need to distinguish itself through various means including salary, number of shifts, educational and research Volume 27, No. 6: November 2026
opportunities, continuing medical education stipend, availability of advanced ultrasound procedures such as transesophageal echocardiography and nerve blocks, national and international teaching opportunities, or other factors. It also means that AEMUS fellowships that solely employ board-certified or board-eligible emergency physicians via ABEM may consider extending their draw to other boarded specialties such as pediatrics, family medicine or internal medicine. Internal medicine graduates of AEMUS fellowships may now take the FPD examination, and other specialties may follow, increasing the value in AEMUS fellowships offering non-EM positions. These findings may also be useful to organizations considering starting an AEMUS fellowship and helping existing fellowships determine number of positions. LIMITATIONS This study used a cross-sectional design based on reviewing publicly available data. One limitation is that the list of fellowship programs generated may not have included those that closed during the eight-year period, affecting the fill percentage and number of positions matched by applicants. Additionally, there were repeated observations within our study across years, as programs appeared across multiple NRMP Matches. This was not statistically accounted for in our modeling and could have affected the results. We showed the effect of more years participating in the Match and its relationship to fill percentage in our results. Neither were there data on how many fellowship applicants did not match, resulting in an underestimation of the number of residents pursuing an ultrasound fellowship. Some programs were listed with dashed lines on the NRMP sheet for years, indicating they did not participate in the Match, despite being fully accredited. These programs could
1557
Western Journal of Emergency Medicine
Emergency Ultrasound Fellowship Match Outcomes: Unfilled Positions have lost funding or decided not to participate in the Match. Finally, this dataset does not include candidates who filled an AEMUS fellowship position after the NRMP Match period. This would not be reflected in the fill percentage we calculated from the NRMP data and would have resulted in a higher fill percentage along with fewer unfilled programs. CONCLUSION This cross-sectional study of publicly available NRMP data showed growth in available AEMUS fellowship positions from 2019 to 2026, with fill percentages peaking in 2021 and 2022 before declining from 2023 through 2026 to levels comparable to the pre-2021 baseline. Programs participating in the NRMP Match for more years showed resilience in the face of this pattern. Continued attention to these trends can help fellowship directors, leadership, and faculty focus on the changing needs and demands of the aspiring AEMUS fellow.
Boivin et al.
5. Russell FM, Zakeri B, Herbert A, et al. The state of point-of-care ultrasound training in undergraduate medical education: findings from a national survey. Acad Med. 2022;97(5):723-727. 6. Boivin Z, Venkatesh AK, Moore CL. Variation in point-of-care ultrasound privileges in academic emergency departments. Acad Emerg Med. 2023;30(9):1033-1035. 7. Moore CL, Gregg S, Lambert M. Performance, training, quality assurance, and reimbursement of emergency physician-performed ultrasonography at academic medical centers. J Ultrasound Med. 2024;43(4):459-466. 8. Wilson MP, Mayo PH. Ultrasonography in the emergency department. Crit Care. 2016;20(1):227. 9. Gettel CJ, Bennett CL, Rothenberg C, et al. Fulfilled in emergency medicine: an analysis of the 2022 and 2024 Match for program coordination, ownership, and geography. AEM Educ Train. 2023;7(4):e10902. 10. Kelly MT. Why crisis for emergency physicians: a new report suggests that the field will see a surplus of 9,400 emergency physicians by 2030. Leaders are trying to address the problem. Ann Emerg Med. 2022;80(2):192-236.
Address for Correspondence: Alexis Salerno, MD, University of Maryland School of Medicine, Department of Emergency Medicine, 110 S. Paca St, 6th Floor Suite 201, Baltimore, MD 21201. Email: alexis.salerno@som.umaryland.edu.
11. National Resident Matching Program. Specialties Matching Service: 2025 Appointment Year Results and Data. National Resident Matching Program; 2025. 12. National Center for Health Statistics. Geographic Division of
Conflicts of Interest: By the WestJEM article submission agreement, all authors are required to disclose all affiliations, funding sources and financial or management relationships that could be perceived as potential sources of bias. No other author has professional or financial relationships with any companies that are relevant to this study. There are no other conflicts of interest or sources of funding to declare.
Region. U.S. Centers for Disease Control and Prevention; 2024. 13. Shappell CN, Farran JM, McConville JF, et al. Geographic trends for United States allopathic seniors participating in the residency Match: a descriptive analysis. J Gen Intern Med. 2019;34(2):179-181. 14. Hassnain U, Hussain A, Prada-Nascimento L, et al. Mapping the road:
Copyright: © 2026 Boivin et al. This is an open access article distributed in accordance with the terms of the Creative Commons Attribution (CC BY 4.0) License. See: http://creativecommons.org/ licenses/by/4.0/
Medical school and specialty characteristics affect residency Match geography in the United States. Acad Med. 2022;97(9):1368-1373. 15. Accreditation Council for Graduate Medical Education. Program Requirements for Graduate Medical Education in Emergency Medicine. Accreditation Council for Graduate Medical Education. Accessed July 30, 2026. 16. Accreditation Council for Graduate Medical Education. Emergency
REFERENCES
Medicine Defined Key Index Procedure Minimums.Accreditation
1. Von Kuenssberg Jehle D, Wilson S. Some recollections of early work with bedside ultrasound in emergency medicine: the first 10 years. J
Council for Graduate Medical Education; 2017. 17. Adhikari S, Rai D, Morrison D, et al. Do emergency ultrasound
Am Coll Emerg Physicians Open. 2020;1(6):1871-1875.
fellowship programs impact emergency medicine residents’
2. Gottlieb M, Cooney R, King A, et al. Trends in point-of-care
ultrasound education? J Ultrasound Med. 2014;33(6):999-1004.
ultrasound use among emergency medicine residency programs over
18. Aycock RD, Weiszberg M, Hahn B, et al. A survey of academic
a 10-year period. AEM Educ Train. 2023;7(5):e10853.
emergency medicine department chairs on hiring new attending
3. Mokae MM, Klekowski N, Kusulas MP, et al. The current state of advanced pediatric emergency medicine point-of-care ultrasound
physicians. J Emerg Med. 2014;47(1):92-98. 19. Goldflam K, Papapanou L, Lewis PR. Emergency ultrasound: a
training: exploring recent point-of-care ultrasound fellowship
survey study of fellowship graduate characteristics and career
application trends and alternate training models. Pediatr Emerg Care. 2024;40(9):e221-e226.
paths. J Ultrasound Med. 2018;37(2):487-492. 20. Diaz-Gómez JL, Sharif S, Abdelmegid E, et al. Society of Critical
4. Boivin Z, Carpenter S, Lee G, et al. Evaluation of a required vertical
Care Medicine guidelines on adult critical care ultrasonography:
point-of-care ultrasound curriculum for undergraduate medical
focused update 2024. Crit Care Med. 2024;52(2):e447-e458.
students. Cureus. 2022;14(3):e30002.
Western Journal of Emergency Medicine
21. Ramgobin D, Gupta V, Mittal R, et al. Point-of-care ultrasound in
1558
Volume 27, No. 6: November 2026
Boivin et al.
Emergency Ultrasound Fellowship Match Outcomes: Unfilled Positions
internal medicine curriculum: quest for the holy grail of modern
ultrasound competencies for graduating emergency medicine
medicine. J Community Hosp Intern Med Perspect. 2022;12(2):15-42.
residents. AEM Educ Train. 2022;6(6):e10817.
22. Bornemann P, Barreto P. Point-of-care ultrasonography in family
29. Emergency Ultrasound Fellowship Accreditation Council. Emergency
medicine. Am Fam Physician. 2018;98(4):200-202.
Ultrasound Fellowship Accreditation Council. Accessed July 30, 2026.
23. Kotagal M, Quiroga E, Ruffato BJ, et al. Impact of point-of-care
30. Adhikari S, Leo V, Liu R, et al. The 2023 core content of advanced
ultrasound training on surgical residents’ confidence. J Surg
emergency medicine ultrasonography. J Am Coll Emerg Physicians
Educ. 2015;72(4):e82-e87.
Open. 2023;4(4):e13015.
24. Recker F, Weber E, Strizek B, et al. Point-of-care ultrasound in
31. Kiemeney M, Morris J, Lamparter L, et al. Push and pull: what factors
obstetrics and gynecology. Arch Gynecol Obstet. 2021;304(3):871-
attracted applicants to emergency medicine and what factors pushed
876.
them away following the 2023 Match. West J Emerg
25. Flores S, Su E, Molnar M, et al. Point-of-care ultrasound in pediatrics: a review and update. Semin Ultrasound CT MR.2024;45(1):3-10.
Med. 2025;26(2):261-270. 32. Huffman A. Emergency medicine at a crossroads: financial viability
26. Gilbertson EA, Hatton ND, Ryan JJ. Point-of-care ultrasound: the
and workforce dynamics post-COVID-19. Ann Emerg
next evolution of medical education. Ann Transl Med. 2020;8(14):846. 27. Lewis RE, Pearl M, Nomura J, et al. EDE4US: consensus document
Med. 2023;82:A17-A20. 33. Martin R, Lau HA, Morrison R, et al. The rising tide of point-of-care
for the emergency ultrasound milestone project. Acad Emerg
ultrasound in medical education: an essential skillset for
Med. 2013;20(7):740-745.
undergraduate and graduate medical education. Curr Probl Diagn
28. Haidar DA, Peterson WJ, Minges PG, et al. A consensus list of
Volume 27, No. 6: November 2026
Radiol. 2023;52(6):482-484.
1559
Western Journal of Emergency Medicine
Original Research
Caring for Patients Anywhere, Anyhow: How Emergency Department Crowding and Boarding Shapes Professional Identity in Emergency Medicine Training Marlena Skrabak, BA* Ezra Bisom-Rapp, BS* Esther H. Chen, MD† Christopher R. Peabody, MD, MPH†
*University of California, San Francisco, School of Medicine, San Francisco, California † University of California, San Francisco, Zuckerberg San Francisco General Hospital, Department of Emergency Medicine, San Francisco, California
Section Editor: Jeffrey Druck, MD Submission history: Submitted April 27, 2026; Revision received August 7, 2026; Accepted August 9, 2026 Electronically published November 2, 2026 Full text available through open access at http://escholarship.org/uc/uciem_westjem DOI 10.5811/westjem.64726
Introduction: Emergency department (ED) boarding is a well-documented crisis associated with adverse patient outcomes, healthcare worker burnout, and moral injury. Although prior work has documented operational and educational impacts, including reductions in resident productivity and procedural exposure, less is known about how sustained boarding shapes professional identity formation. We sought to explore how sustained ED boarding shapes the learning experiences and professional identity formation of emergency medicine (EM) residents, as perceived by both residents and the attending physicians who train them. Methods: Using a constructivist paradigm, we conducted a qualitative study using semi-structured interviews with residents and attending physicians from a 4-year EM residency program with rotations across 5 clinical sites, between July and August 2025. Two researchers independently coded transcripts and iteratively refined a shared codebook, continuing until additional interviews were unlikely to add new insight, guided by the concept of information power. We used reflexive thematic analysis, treating researchers’ clinical and analytic judgment as a resource for identifying patterns of meaning, and prioritized participants’ own construction of meaning over the frequency of any single idea, consistent with an interpretive phenomenological approach. Results: We interviewed 13 emergency physicians: 6 residents and 7 attending physicians (range: 1–30+ years after residency). Three overarching themes emerged: (1) Educational challenges and opportunities—boarding fragments diagnostic ownership, narrows the acuity spectrum, and limits authentic undifferentiated encounters, although attending physicians adapt through structured hypotheticals and micro-teaching); (2) Shifts in the clinical environment—operational and structural adaptations create educational dead space, constrain the therapeutic alliance, and generate role ambiguity around boarded patients); and (3) Moral strain and suffering—moral injury and combined suffering is not peripheral to training but embedded within it, shaping how residents interpret professional responsibility and integrity. The three themes exist in a triangular relationship, with suffering at the foundation. Conclusion: Boarding appeared to function as a formative context for professional identity formation, not merely a disruptive one. Residents described learning systems-level practice, advocacy, and emotional regulation, often through loss and moral injury, alongside attending physicians navigating the same. These findings suggest that recognizing boarding as a structural condition of training may reorient the responsibility of graduate medical education: formalizing adaptive teaching strategies, creating structured opportunities to process moral strain, and committing to advocacy that treats boarding as the educational crisis it is. [West J Emerg Med. 2026;27(6)1560–1569.]
Western Journal of Emergency Medicine
1560
Volume 27, No. 6: November 2026
Skrabak et al.
ED Crowding and Boarding Shapes Professional Identity for EM Residents
INTRODUCTION Boarding of admitted patients in an emergency department (ED) remains one of the most pressing operational health system challenges.1 Boarding is associated with adverse patient outcomes, including increased mortality, higher readmission rates, prolonged hospital length of stay, decreased patient satisfaction, and increased healthcare costs.2–5 Further, ED boarding contributes to healthcare worker burnout, workplace violence, and moral injury, defined as distress stemming from knowing what care should look like but being unable to provide it.6–8 Less is known about the educational impact of boarding on emergency medicine (EM) residency training.9,10 Some studies show a negative impact on EM training, including lower resident productivity (ie, patients seen per hour), less exposure to undifferentiated patients when workups are initiated in triage, limited exposure to critically ill patients who might be diverted elsewhere, and decreased physician wellbeing.11–13 Other studies show that boarding has limited impact on EM training as measured by number of procedures performed or potential impact on EM milestones.14,15 Moreover, faculty adapt their approach to bedside teaching, such as by changing teaching locations or modifying supervision patterns.6,11,16,17 Others looked at crowding’s effect on the Accreditation Council for Graduate Medical Education (ACGME) core competencies.18 However, residents’ or attending physicians’ perspectives regarding the effect of significant ED boarding on achieving these milestones remains unknown.13,19,20 Building on this foundation, we sought to explore how sustained ED boarding conditions shape an EM trainee’s professional identity formation. Professional identity formation theory describes the process by which socialization, experiential learning, and the learning environment together forge a person’s sense of self and role.21 Rather than being acquired as a discrete skill or body of knowledge, professional identity develops iteratively through repeated participation in the authentic work of a profession, shaped not only by formal teaching but by what is modeled and normalized within an environment.22 Under this framework, the conditions in which trainees practice are not incidental to their training but constitutive of it. By gaining a deeper understanding of how boarding may fundamentally change the clinical experience of EM residents, this study sought to inform programmatic strategies to support residents in becoming independent practitioners who can care for patients in complex clinical environments. METHODS Study Design and Setting We conducted a series of individual interviews with faculty and residents from a 4-year EM residency training program with clinical rotations in multiple practice settings: a quaternary academic medical center; an urban safety-net hospital and Level I trauma center; a quaternary children’s Volume 27, No. 6: November 2026
Population Health Research Capsule What do we already know about this issue? Emergency department (ED) boarding is linked to worse patient outcomes, burnout, and moral injury; its educational effects on emergency medicine (EM) residents remains poorly understood. What was the research question? How does sustained ED boarding shape the professional identity formation of EM residents? What was the major finding of the study? Boarding shaped EM residents’ professional identity through interconnected educational and environmental changes, with suffering as the foundational theme. How does this improve population health? Recognizing boarding as an educational crisis may guide training reforms that prepare physicians to provide care and advocate for patients under systemic strain. hospital; a Veterans Affairs medical center; and a safety-net children’s hospital and Level I trauma center. Residents were eligible to participate if they had rotated in at least two different clinical sites. Our organization’s institutional review board determined this study was exempt (#23-38734). This study is reported in accordance with the Standards for Reporting Qualitative Research.23 Study Participants Author CP recruited participants using the department’s email listserv, reaching 152 attending physicians, fellows and residents, in June 2025 over a 3-week period to complete a 30-minute interview. Author MS scheduled and conducted all the interviews and continued until additional interviews were unlikely to add additional insights, such that, per the concept of information power, saturation depended on the specificity of the sample, the depth of dialogue, and the analytic approach, rather than a fixed number.24,25 All participants provided verbal consent to participate in the study. Each interview lasted approximately 30 minutes and was conducted between July and August 2025. Participants received a $25 gift card for their time. Interview Guide Development Authors MS, EB, CP, and EC developed two interview guides, one for resident physicians and another for attending physicians. Interview guides focused on clinical education and
1561
Western Journal of Emergency Medicine
ED Crowding and Boarding Shapes Professional Identity for EM Residents skill development related to ACGME milestones, exploring perspectives on what it means to learn and teach in boarding environments.26 Questions addressed adaptations, teaching practices, and values-based work to elicit how the boarding crisis shapes the experience of becoming an emergency physician and the experience of teaching future emergency physicians (see Appendix). MS, who conducted all interviews, had no supervisory, evaluative, or authoritative role over the people interviewed. Interviews were conducted, recorded, and transcribed using HIPAA-compliant Zoom videoconferencing software version 7.0.6 (Zoom Communications, Inc). MS de-identified all interview transcripts, and MS and EB reviewed the transcripts for accuracy. Analysis MS and EB coded the interview transcripts using ATLAS.ti (Scientific Software Development GmgH), a qualitative data analysis software to organize, label (ie, code) and compare text excerpts across interviews. We used reflexive thematic analysis—identifying and developing patterns of meaning (ie, themes)—because it treats researchers’ clinical and disciplinary knowledge as an analytic resource rather than a source of bias to be minimized.27 MS and EB were medical students with an interest in EM who had rotated at the study sites without prior personal relationships with participants, while CP and EC were EM faculty whose clinical and educational experience informed the interpretive process. To develop a preliminary codebook, MS and EB collaboratively reviewed and discussed one transcript, generating descriptive codes grounded in participants’ language, then iteratively refined the codebook throughout the analytical process, reviewing each other’s codes and reconciling discrepancies to full consensus, with CP resolving disagreements. CP and EC independently reviewed the codes and met multiple times with MS and EB to discuss thematic patterns, synthesize codes into higher-order themes, and examine their relationships. Furthermore, our analytic approach was informed by interpretive phenomenological analysis, which is concerned with how individuals make sense of their lived experience.28 This approach prioritizes participants’ construction of meaning over the frequency with which any idea occurred to develop a nuanced narrative of how their experiences learning and teaching in a boarded ED.29 RESULTS We interviewed 13 emergency physicians: 6 residents and 7 attending physicians with varying years of practice. All residents had completed rotations at multiple ED sites. No postgraduate year one residents participated because they did not have time to rotate through multiple ED sites during the study period. Attending physicians’ primary clinical work sites were the quaternary academic medical center or urban safety-net hospital. Additional demographic information is included in Table 1. Participants described boarding as fundamentally Western Journal of Emergency Medicine
Skrabak et al.
restructuring the experience of EM graduate medical education. Boarding alters what residents are able to learn, how they learn it, and how they come to understand their role as emergency physicians. Our analysis yielded three overarching themes: (1) educational challenges and opportunities; (2) physical and conceptual shifts in the clinical environment; and (3) moral strain and suffering (see Table 2). Changes to clinical workflow reshape educational exposure, environmental restructuring creates new gaps and unexpected opportunities, and repeated exposure to constrained care shapes how residents interpret their professional responsibilities and values. The three higherorder themes, developed through reflective thematic analysis and interpreted through interpretive phenomenological analysis, exist in a triangular relationship. Suffering recurred within participants’ accounts of education and the environment, and the two latter themes were deeply intertwined. Therefore, to represent thematic relationships accurately, suffering belonged at the base as a foundational, underlying theme rather than a parallel one, with the two other themes in a reciprocal, rather than hierarchical, relationship (see Figure). Theme 1: Educational Challenges and Opportunities Boarding changes not only the volume of patients that residents see but the type of ownership, reasoning, and decisionmaking they practice. Educational challenges and opportunities emerge directly from boarding’s restructuring of clinical work. 1.1 Learning in a constrained clinical system Residents frequently assume care of patients whose workup has already been initiated, or whose diagnostic trajectories have largely been determined. They inherit partially completed plans: …then you get signed out all these patients that are pending workups, and […] you’re following someone else’s plan, who’s kind of like giving you instructions on what to do. (Resident #2)
Residents describe fewer opportunities to construct differential diagnoses and more time managing throughput. In response, some residents describe how they intentionally sought lower-acuity patients they believed they could discharge efficiently: I’ll pick up people that I’m like, oh, I could discharge you with some Tylenol […] I’m almost looking for those low-hanging fruit, because this patient that I know needs to be admitted is going [to] sit in the waiting room, and they’re not going to get the medicine they need. (Resident #5)
1562
Volume 27, No. 6: November 2026
Skrabak et al.
ED Crowding and Boarding Shapes Professional Identity for EM Residents
Table 1. Demographic characteristics of 13 emergency physicians (6 residents and 7 attending physicians) interviewed in a qualitative study of the impact of emergency department boarding on graduate medical education and professional identity formation. Resident physicians (n = 6)
Attending physicians (n = 7)
Man
2
3
Woman
4
4
Sex
†
Year in training (resident physicians) PGY 2
1
PGY 3
2
PGY 4
1
Fellow
2
Years in practice following residency (attending physicians) 1-4 yrs
1
5-9 yrs
1
10-19 yrs
1
20-29 yrs
3
≥30 yrs
1
Sites of practice* Quaternary care hospital
6
Quaternary care pediatric hospital
5
Urban safety net hospital
5
Urban pediatric safety net hospital
2
Urban safety net hospital + Urban pediatric safety net hospital
2 4 1
Veterans’ Affairs hospital 4 Sex was self-identified by participants. *For resident physicians, counts indicate the number of individuals who have completed rotations at each site, out of n = 6 participants. PGY, post-graduate year; yrs, years. †
Additionally, residents describe wanting to see more patients but are limited by system capacity. They identify constraints on not only educational opportunity but also the development of clinical confidence and autonomy. 1.2 Adaptive teaching strategies within constraint Attending physicians describe deliberate attempts to reconstruct educational value within constrained conditions. One common strategy is the use of structured hypotheticals that function as compensatory tools to preserve clinical reasoning when authentic undifferentiated encounters are limited: Okay, we didn’t get to do this before we found the diagnosis for this patient. Let’s talk about what we would have thought about and why we would have gone down this route. […] What you can’t do is let the resident evaluate a patient without knowing what they already have. (Attending #6)
These scenarios also become opportunities to teach Volume 27, No. 6: November 2026
residents how to reimagine a system that prioritizes patientcentered care: “What would we prioritize if we didn’t have the limitations brought by boarding?” (Attending #6). A reliance on hypotheticals reframes and builds creative solutions. Further, attending physicians, through micro-teaching moments, share interesting cases across teams, teach during and after sign-out, and message residents about patient outcomes left unfinished during shifts. What is being transmitted extends beyond clinical reasoning: The learners are not getting the medical knowledge […] if they had the patient on their own. But they are learning about systems-level practice and also about internal management of emotions and processing of emotions, which is an important skill too. (Attending #3)
These strategies mitigate educational loss, but residents note how the burden of curricular preservation is dependent on each attending and their bandwidth rather than standardized curricular components. 1563
Western Journal of Emergency Medicine
ED Crowding and Boarding Shapes Professional Identity for EM Residents
Skrabak et al.
Theme 2: Shifts in the Clinical Environment Boarding restructures not only what residents learn, but the physical and conceptual environment in which they learn. Participants describe how the environment of the ED (its operational flow, spatial constraints, and structural adaptations) creates conditions that also reshape clinical exposure and resident identity. 2.1 Operational flow and structural adaptations When evaluating the environment of the ED, the flow of patients through the system is a metric of capacity, and capacity determines when residents are learning and who they are learning from. When only the highest-acuity patients are brought to monitored beds due to reduced ED capacity, residents’ exposure to the full acuity spectrum narrows: Figure. Triangular relationship among three themes emergent from interviews with 13 emergency physicians, in a qualitative study of the impact of emergency department boarding on graduate medical education and professional identity formation.
Part of the education for residents is to prepare them to work up and manage a wide variety of diagnoses and chief complaints. By limiting what comes to the back, you truncate what they’re exposed to. (Attending #5)
Consequently, patients with noncritical presentations are seen in waiting rooms, hallways, or triage cubicles without the same privacy or monitoring as ED beds. The spatial fragmentation of care limits the quality and consistency of clinical learning. Furthermore, structural adaptations, such as nurse practitioners or attending physicians in triage, expedite discharge pathways and alter room allocation patterns.
1.3 Communication, ownership, and systems-based practice Residents describe learning how to articulate system constraints while maintaining professionalism: One of our core requirements in EM training is the ability to communicate with consultants, other services and admitting teams. And something I’ve taken away is, how do I translate my strong emotions around boarding […] into something productive [for patients]? (Resident #4)
Boarding heightens residents’ communication skills, as they learn to describe the effects of boarding to teams not on the frontlines, in hopes of improving patient care and flow. Communication with patients is conversely impacted. The lack of privacy and space compromise the therapeutic alliance, which harms not only patient care but also how trainees feel they learn during and from patient encounters: …when we don’t have a good rapport with our patients, then learning in that relationship really takes a hit. (Resident #2)
Residents also experience role ambiguity when it is unclear which interdisciplinary team—inpatient or ED—is caring for patients boarded in the ED. The “limbo of responsibility” (Resident #3) complicates the ownership of patient care and requires residents to negotiate boundaries in real time, intensifying systems-based learning, often in ways that are reactive rather than structured. Western Journal of Emergency Medicine
The residents are never working in the triage area. That’s just not part of their workflow ever. And yet, rapid assessment, interview, and evaluation as a first point of contact is a really important skill to learn in emergency medicine. (Attending #3)
Attending physicians in this study noted that these structural responses, while addressing throughput, create educational dead space in which residents are absent from key components of emergency care. And they recognize that these environmental shifts alter the informal curriculum of residency. 2.2 Capacity, constraint, and the interrupted feedback loop Attending physicians described clinical exposure and the ability to manage high patient volumes as critical components of becoming a competent emergency physician, and they contrast this with how boarding affects a physician’s ability to manage a high load: I find, when we are open, [the residents] don’t own all the patients. They’re not picking them
1564
Volume 27, No. 6: November 2026
ED Crowding and Boarding Shapes Professional Identity for EM Residents
Skrabak et al.
Table 2. Overarching themes and representative quotes identified through reflexive thematic analysis of interviews with 13 emergency physicians, in a qualitative study of the impact of emergency department boarding on graduate medical education and professional identity formation. Theme 1: Educational challenges and opportunities Learning in a constrained clinical system
“…then you get signed out all these patients that are pending workups, and […] you’re following someone else’s plan, who’s kind of like giving you instructions on what to do…” (Resident #2) “I’ll pick up people that I’m like, oh, I could discharge you…” (Resident #5)
Adaptive teaching strategies “‘Okay, we didn’t get to do this before we found the diagnosis… Let’s talk about what we would have within constraint thought about…’ What you can’t do is let the resident evaluate a patient without knowing what they already have.” (Attending #6) “…if I see somebody who’s really interesting… I’ll try to share that information with the other residents. Even if that’s a patient I’m seeing in triage.” (Attending #2) Communication, ownership, and systems-based practice
“…how do I translate my really strong emotions around boarding… into something productive? … ‘I have 10 patients with my name on them, but I also have 70 in the waiting room…’” (Resident #4) “…when we don’t have a good rapport with our patients, that part of learning… really takes a hit.” (Resident #2) “The positive takeaway… is that I’m much more familiar with inpatient care… I can articulate more clearly why a patient needs to be admitted.” (Resident #3)
Theme 2: Shifts in the clinical environment Operational flow and structural adaptations
“Part of the education for residents is to prepare them to work up and manage a wide variety of diagnoses and chief complaints. By limiting what comes to the back, you truncate what they’re exposed to.” (Attending #5) “…almost everyone else, who has anything from just less than a true emergency […] gets seen in the waiting room, or in a hallway, or in a little cubicle off to the side of the triage and vitals area.” (Resident #3) “The residents are never working in the triage area… And yet, rapid assessment… is a really important skill to learn in emergency medicine.” (Attending #3)
Capacity, constraint, and the “Those patients never get back to the ED and are never seen by the residents… they’ve mentioned feeling interrupted feedback loop deficient in urgent care.” (Attending #9) “I’ve had the bandwidth to see more patients… The department doesn’t have the capacity for me to do that.” (Resident #5) “If you’re not seeing the breadth of clinical presentations… you’re missing out on learning about a huge swath of patients…” (Attending #5) Role diffusion in a conceptual environment
“Who’s taking care of [the boarders]? And are the trained to do that? …” (Resident #3) “The positive takeaway from my residency experience in a boarding environment is that I’m much more familiar with inpatient care. Because of that, I can better advocate for my patients when they need admission.” (Resident #4)
Theme 3: Moral strain and suffering Shared moral injury as part of training
“[A patient with a broken pelvis] got CTs, an ortho consult, and all this stuff—and never left the waiting room. At the end of the day, the patient said, “Thank you so much. This place is wonderful.” I had to stop them there for a second and say, “You never left the waiting room, and you’re telling me this was a great experience?” […] That person didn’t deserve that.” (Attending #4) “These start to become problems that I have less and less control over.” (Resident #4)
Distrust and identity tension
“I hate not being able to do anything for [complex patients who are suffering] in the waiting room… [Patients who should receive thoracenteses] have to sit there, not being able to breathe, for longer.” (Resident #1) “I feel like I add to the distrust of these people…” (Resident #2)
Modeling integrity under constraint
I’d stepped over [a patient] numerous times to see other people that were ahead of him. […] he clearly needs to be admitted to the hospital, [but he] was going to have to go lie back out on the floor until we could find a bed for him [after triage]. And I said no, “I’m keeping him in the triage room on this gurney.” (Attending #3) “This is not right… What we’re going to do to mitigate the potential harm on our patient but still care for them within the system is to do this thing… […] when I leave, I know that I have been practicing with integrity.” (Attending #3)
Learning medicine through suffering
“[The learners are] not getting the medical knowledge teaching or learning that they would have gotten if they had the patient on their own. But they are learning […] about internal management of emotions and processing of emotions” (Attending #3) “The focus isn’t on learning, it’s on getting through the shift without crying…” (Resident #1) “…to keep putting yourself out there and keep seeing the patients… then you’re also just feeling so down and burnt out…” (Resident #2)
CT, computed tomography.
Volume 27, No. 6: November 2026
1565
Western Journal of Emergency Medicine
ED Crowding and Boarding Shapes Professional Identity for EM Residents
Physicians find themselves acting as mediators between a malfunctioning system and the care their patients need.
all up, they’re not seeing them all, they’re overwhelmed. […] They’re capable of it—they just haven’t had to flex that muscle. (Attending #3)
While the resident narratives echo this feeling, they also express feeling limited by the stagnated capacity of a boarding system: I’ve had the bandwidth to see more patients, or to do more learning essentially. The department doesn’t have the capacity for me to do that. And I feel like that really shouldn’t be the case. (Resident #5)
Attending physicians and residents describe a mismatch between a resident’s capacity and the system’s capacity to use it. Several attending physicians note how residents may not learn where their ceiling is and instead calibrate their ability to an over-filled system. 2.3 Role diffusion in a conceptual environment Boarding not only reshapes the physical environment of the ED but also reshapes residents’ roles and sense of responsibility within the system. Boarded patients have inpatient teams nominally managing their care, yet they remain in the emergency space. Residents describe uncertainty about who is responsible for a boarding patient, particularly if an ED nurse calls them about a boarded patient care issue: Who’s taking care of [boarded patients]? And are they trained to do that? And how do you handle task-switching between, “This is a patient who should have been in the ICU 6 hours ago and is getting maximum BiPAP therapy for severe asthma…,” and then over here is a new patient that I need to start from scratch. (Resident #3)
Residents are also learning to redefine what their role in a challenging system looks like. Benefits of this environmental shift were also noted: One resident reflected that increased exposure to boarded inpatients made them more fluent in inpatient communication and better able to articulate clinical reasoning to consulting teams. Furthermore, attending physicians described that figuring out how to acknowledge environmental changes is itself a part of their patient-care workflow and therefore the workflow they model for residents: How do you have that kind of a conversation with patients [about the broken system] without disparaging your leadership, disparaging the hospital, disparaging the system—because that leaves the patient with significant mistrust? (Attending #3) Western Journal of Emergency Medicine
Skrabak et al.
Theme 3: Moral Strain and Suffering Beyond educational and environmental shifts, participants describe how boarding shapes the emotional conditions under which professional identity formation occurs. While learning clinical skills, residents also learn what it means to practice in a system that routinely constrains care. The theme of suffering permeated each interview—the suffering of patients, the suffering of peers, their own suffering, and the system suffering. 3.1 Shared moral injury as part of training Resident and attending physicians illustrate morally injurious cases: I had a patient who had a broken pelvis. I cared for them entirely in the waiting room. […] At the end of the day, the patient said, ‘Thank you so much. This place is wonderful.’ I had to stop them there for a second and say, ‘You never left the waiting room, and you’re telling me this was a great experience?’ […] So despite me feeling really ashamed that they were being cared for this way, some patients still have the perception that they’re getting good care. (Attending #4)
These experiences are visible to learners. Attending physicians’ moral strain (and shame) becomes part of the emotional curriculum residents witness and absorb. Residents similarly describe situations in which resource scarcity limits their ability to act: I have a really sick asthma patient, and I don’t have a room to put them in, and I don’t have a nurse to administer medications to treat them. These start to become problems that I have less and less control over. (Resident #4)
Training occurs within repeated exposure to constrained care, shaping how residents interpret responsibility, agency, and professional standards. 3.2 Distrust and identity tension Residents describe tension between their expectations of practicing at a quaternary care center and the reality of delayed care. They worry about eroding patient trust and their own sense of integrity: And we’re just telling [patients in pain] to sit in this chair for however many hours [until] we think we could get a room. I feel like I add to the distrust of these people… (Resident #2)
1566
Volume 27, No. 6: November 2026
Skrabak et al.
ED Crowding and Boarding Shapes Professional Identity for EM Residents
Boarding introduces identity tension: residents learn to practice emergency medicine while simultaneously confronting conditions that contradict their ideals of what emergency care should be and how it should be provided. They lose “curiosity or a fresh perspective because a lot of the work has already been done… [and] feel more like a cog in a wheel” (Attending #3). And they see their attending physicians experience the same. 3.3 Modeling integrity under constraint Attending physicians describe explicitly naming injustice with both patients and learners: ‘Look, I’m really sad that this is what I have to tell you. I’m really angry that this is the way that this has to be right now. This is why I can’t put you in a room, and I have to discharge you. And I agree it’s not fair.’ (Attending #3)
Such modeling reframes emotional acknowledgment as professional practice rather than weakness. Residents observe how faculty maintain integrity while adapting workflow to mitigate harm. Coping strategies, emotional processing, and advocacy become part of boarding’s hidden curriculum: We call [boarding] part of the “hidden curriculum.” …while we shouldn’t validate the healthcare system in the US by saying boarding is okay…we’d say, I can become a better emergency medicine doctor by caring for these patients for longer. (Resident #4)
3.4 Learning medicine through suffering Residents describe shifts as if being in “survival mode”: You go into your shift thinking, “I’m just going to survive.” The focus isn’t on learning; it’s on getting through the shift without crying and making sure nobody codes in the waiting room. (Resident #1)
Sustained exposure to suffering—of patients, of peers, of teachers, of themselves—affects motivation and engagement. Attending physicians in this study acknowledge how emotional processing is an essential component of emergency medicine. Yet learning under persistent moral strain requires residents to integrate ideals of patient-centered care with the realities of systemic constraint. Participants questioned what is being transmitted: resilience, adaptability, normalization of dysfunction, desensitization: I don’t know that anyone can really teach to this non-ideal scenario—but what they’re doing is just trying to adapt and encouraging us to adapt with it, to the extent that’s possible” (Resident #1) Volume 27, No. 6: November 2026
“I think [boarding] is pretty demoralizing a lot of days because you’re like, I’m not doing anything. (Resident #6)
DISCUSSION To our knowledge, this is the first study to examine the relationship between ED boarding and a trainee’s professional identity formation as an emergency physician. This study reframes ED boarding as more than an operational stressor or educational inconvenience but rather as a structural condition of training that shapes how residents interpret clinical responsibility, system constraints, and professional integrity. The moral distress of learning to care for patients under boarding conditions was echoed in every interview. Prior research has linked boarding to clinical burnout and stress.12 Our findings suggest that moral strain is embedded within current emergency medical education. Professional identity formation theory emphasizes that identity develops through social participation in an authentic space.21 Each of the three themes maps onto a core mechanism of professional identity formation: Theme 1 reflects socialization through altered clinical participation; theme 2 reflects how the learning environment itself is restructured; and theme 3 reflects values-based, relational work of internalizing a professional identity under strain. In our study, that authentic space is characterized by repeated ethical tension—moral strain (theme 3) infiltrates and feeds into education and the practice environment (themes 1 and 2). Residents’ thinking about diagnostics is shaped by their experiences of fragmented diagnostic ownership. It colors how they interpret the physical and conceptual constraints of the ED. It impacts their relationship with patients and other clinicians. Moreover, our data suggest that boarding can lead to resignation and desensitization. Theme 3 explores how this process is linked to the presence of and residents’ reactions to suffering, either collectively (when an attending chooses to model integrity and name injustice openly) or individually (when a resident enters a shift oriented toward survival). The data highlight how the documented structural shifts of boarding (reduction of productivity and altered supervision/ exposure patterns) are internalized by trainees. When diagnostic ownership is fragmented, when triage decisions are displaced, when patient flow is constrained, residents are not just practicing less, they are practicing differently. Similar adaptations in bedside teaching are described by faculty, such as the use of structured hypotheticals and micro-teaching within workflows, mirror principles found in simulation and case-based learning. During the COVID-19 pandemic, EM programs reported similar compensatory strategies to maintain competency development amid reduced clinical exposure.30 In our setting, these adaptations have emerged organically and variably, rather than through deliberate curricular reform. As boarding persists, reliance on informal faculty innovation may produce uneven educational experiences unless these
1567
Western Journal of Emergency Medicine
ED Crowding and Boarding Shapes Professional Identity for EM Residents
Skrabak et al.
strategies are formalized. Furthermore, if simulation and hypotheticals as modes of learning procedural skills supplement resident education, long-term retention will need to be studied.31,32 Our learners also highlight the hidden curriculum of learning emergency care in a boarded ED. Research describes how ED wait times socialize trainees into norms of coping with dysfunction.33 Similarly, boarding appears to communicate implicit lessons about what constitutes acceptable care, how to manage institutional limitations, and how to reconcile ideals with practice. Without explicit reflection, prolonged exposure to constrained care environments may normalize clinical compromise. When faculty name injustice and model ethical discomfort, they can interrupt that normalization and convert moral tension into reflective teaching. These findings suggest several implications for graduate medical education. First, operational decisions should be evaluated for educational impact, particularly when workflow restructuring alters diagnostic ownership.34 Because education remains a key mission of academic EDs, education leaders could collaborate with operational leaders to assess the educational impact of operational decisions. Second, compensatory teaching strategies, such as hypothetical-based reasoning exercises, may require formal integration to ensure consistency across learners. Programs may help residents set their individual learning goals by providing dashboards with aggregate data about diversity of cases and procedure logs so that they may work with their supervising faculty to mitigate their knowledge gaps. Third, programs may benefit from creating structured opportunities to address moral strain directly and preventing it from functioning solely as a hidden curriculum.35 Residents and faculty may share experiences and support one another through restorative justice community circles, case discussions, and narrative medicine reflective exercises.36–39 Finally, if boarding reflects a durable feature of contemporary emergency care, residency training must explicitly define which competencies require protection (such as diagnostic reasoning from undifferentiated presentations) and which new competencies should be deliberately cultivated (such as systems-based advocacy), while tracking progression through these milestones to update each resident’s learning plan.
boarding. Future multisite studies would help establish the transferability of these themes across institutions with differing boarding severity, resource constraints, and training structures.
LIMITATIONS This study reflects the perspectives of 13 physicians and was conducted at a single academic site with a specific configuration of training sites and boarding patterns. Findings are not intended to be statistically generalizable and should be interpreted as context-specific, analytic insights.40 Participants self-selected, which may introduce bias toward those with strong views or experiences regarding boarding; however, this self-selection may also have allowed us to capture the voices of those most affected and most reflective about the impact of
boarding: a descriptive analysis and measurement of impact on
Western Journal of Emergency Medicine
CONCLUSION Boarding appeared to function as a powerful context for professional identity formation, shaping how residents develop core competencies in emergency care in a constrained clinical environment. These lessons are learned within the undercurrent of moral distress and co-constructed with faculty who can intentionally fill in knowledge gaps and model how to practice within these realities. These findings suggest that recognizing boarding as an educational crisis rather than simply an operational may warrant intentional curricular support and institutional advocacy to sustain trainees, educators, and patients, and merits testing across broader training contexts. Address for Correspondence: Marlena Skrabak, University of California, San Francisco, School of Medicine, 533 Parnassus Ave, San Francisco, CA 94143. Email: marlena.skrabak@ucsf.edu. Conflicts of Interest: By the WestJEM article submission agreement, all authors are required to disclose all affiliations, funding sources and financial or management relationships that could be perceived as potential sources of bias. No author has professional or financial relationships with any companies that are relevant to this study. There are no conflicts of interest or sources of funding to declare. Copyright: © 2026 Skrabak et al. This is an open access article distributed in accordance with the terms of the Creative Commons Attribution (CC BY 4.0) License. See: http://creativecommons.org/ licenses/by/4.0/
REFERENCES
1568
1. Janke AT, Burke LG, Haimovich A. Hospital ‘boarding’ of patients in the emergency department increasingly common, 2017-24. Health Aff (Millwood). 2025;44(6):739-744. 2. Singer AJ, Thode HC Jr, Viccellio P, et al. The association between length of emergency department boarding and mortality. Acad Emerg Med. 2011;18(12):1324-1329. 3. Salehi L, Phalpher P, Valani R, et al. Emergency department outcomes. CJEM. 2018;20(6):929-937. 4. do Nascimento Rocha HM, da Costa Farre AGM, de Santana Filho VJ. Adverse events in emergency department boarding: a systematic review. J Nurs Scholarsh. 2021;53(4):458-467. 5. Johnson KD, Winkelman C. The effect of emergency department crowding on patient outcomes: a literature review. Adv Emerg Nurs J. 2011;33(1):39-54. 6. Hill J, Hickam G, Shaw J, et al. The effects of overcrowding, boarding, and physician-in-triage on resident education: a scoping
Volume 27, No. 6: November 2026
Skrabak et al.
ED Crowding and Boarding Shapes Professional Identity for EM Residents
review. AEM Educ Train. 2025;9(3):e70040.
2014;89(9):1245-1251.
7. Norton V, Schreyer KE, Kuhn D. Workforce impact of emergency
24. LaDonna KA, Artino AR Jr, Balmer DF. Beyond the guise of
department boarding. Health Aff Sch. 2025;3(8):qxaf134.
saturation: rigor and qualitative interview data. J Grad Med Educ.
8. Dean W, Morris D, Manzur MK, et al. Moral injury in health care: a
2021;13(5):607-611.
unified definition and its relationship to burnout. Fed Pract.
25. Malterud K, Siersma VD, Guassora AD. Sample size in qualitative
2024;41(4):104-107.
interview studies: guided by information power. Qual Health Res.
9. Kelen GD, Wolfe R, D’Onofrio G, et al. Emergency department
2016;26(13):1753-1760.
crowding: the canary in the health care system. NEJM Catalyst.
26. ACGME International. Emergency Medicine Milestones. 2023.
2021;2(5).
Available at: https://www.acgme-i.org/globalassets/acgme-
10. Schor S, Baez J, Hill J. Boarding and crowding are facts of life. It’s
international/milestones-2.0/emergencymedicinemilestones2.0int.
time we adapt resident education to them. Ann Emerg Med.
pdf?utm_source=chatgpt.com. Accessed July 7, 2025.
2026;87(6):757-762.
27. Braun V, Clarke V. Reflecting on reflexive thematic analysis. Qual
11. Goldflam K, Bradby C, Coughlin RF, et al. Is boarding compromising
Res Sport Exerc Health. 2019;11(4):589-597.
our residents’ education? A national survey of emergency medicine
28. Smith JA, Flowers P, Larkin M. Chapter 2: The theoretical
program directors. AEM Educ Train. 2024;8(2):e10973.
foundations of IPA. In: Interpretative Phenomenological Analysis:
12. Loke DE, Green KA, Wessling EG, et al. Clinicians’ insights on
Theory, Method and Research. SAGE; 2012:7-33.
emergency department boarding: an explanatory mixed methods
29. Saunders CH, Sierpe A, von Plessen C, et al. Practical thematic
study evaluating patient care and clinician well-being. Jt Comm J
analysis: a guide for multidisciplinary health services research teams
Qual Patient Saf. 2023;49(12):663-670.
engaging in qualitative analysis. BMJ. 2023;381:e074256.
13. Moffett P, Best A, Lewis N, et al. The effect of hospital boarding on
30. Fults E, Gerwin JN, Boyce MW, et al. Educational and personal
emergency medicine residency productivity. West J Emerg Med.
impacts of the COVID-19 pandemic on emergency medicine resident
2025;26(1):53-61.
physicians: a qualitative study. BMC Med Educ. 2024;24(1):1055.
14. Atzema CL, Stefan RA, Saskin R, et al. Does ED crowding decrease
31. Legoux C, Gerein R, Boutis K, Barrowman N, Plint A. Retention of
the number of procedures a physician in training performs? A
critical procedural skills after simulation training: a systematic review.
prospective observational study. Am J Emerg Med. 2012;30(9):17431748.
AEM Educ Train. 2020;5(3):e10536. 32. Nadir NA, Hart D, Cassara M, et al. Simulation-based remediation in
15. Mahler SA, McCartney JR, Swoboda TK, et al. The impact of
emergency medicine residency training: a consensus study. West J
emergency department overcrowding on resident education. J Emerg Med. 2012;42(1):69-73.
Emerg Med. 2019;20(1):145-156. 33. Webster F, Rice K, Dainty KN, et al. Failure to cope: the hidden
16. Hill J, Frederick M, Santen SA, et al. Turning lemons into lemonade:
curriculum of emergency department wait times and the implications
teaching strategies in boarded emergency departments. AEM Educ
for clinical training. Acad Med. 2015;90(1):56-62.
Train. 2023;7(5):e10914.
34. Cumbermack M, Reich D, Lynch M, et al. 280 ‘What are we waiting
17. Hill J, Nagle J, Stark B, et al. Development and implementation of
for?’ Conflicting perspectives on the emergency department boarding
just-in-time curricula for on-shift teaching during times of boarding.
crisis: a qualitative analysis of interviews with patients, frontline
AEM Educ Train. 2024;8(5):e11014.
providers and hospital leaders. Ann Emerg Med. 2024;84(4):S130.
18. Crowding. Ann Emerg Med. 2006;47(6):585.
35. Murray E, Krahé C, Goodsman D. Are medical students in prehospital
19. Shayne P, Lin M, Ufberg JW, et al. The effect of emergency
care at risk of moral injury? Emerg Med J. 2018;35(10):590-594.
department crowding on education: blessing or curse? Acad Emerg
36. Amin D, Bajaj K, Giuntoli A. A need to embrace restorative justice at
Med. 2009;16(1):76-82.
the heart of the patient safety movement. J Med Toxicol.
20. Atzema C, Bandiera G, Schull MJ. Emergency department crowding:
2022;18(3):183-184.
the effect on resident education. Ann Emerg Med. 2005;45(3):276-281.
37. Klasson CL, Shibli-Rahhal A, Ortiz E, et al. Restorative justice
21. Cruess RL, Cruess SR, Boudreau JD, et al. A schematic
practices as a foundation for medical education innovation. Clin
representation of the professional identity formation and socialization of medical students and residents: a guide for medical educators.
Teach. 2025;22(1):e13852. 38. Malik Z, Ahn J, Schwartz A, et al. Narrative medicine workshops for
Acad Med. 2015;90(6):718-725.
emergency medicine residents: effects on empathy and burnout.
22. Yamamoto I, Obara H, Verstegen D. How do mandatory emergency medicine rotations contribute to the junior residents’ professional
AEM Educ Train. 2023;7(4):e10895. 39. Charon R, Hermann N, Devlin MJ. Close reading and creative writing
identity formation: a qualitative study. BMC Med Educ.
in clinical education: teaching attention, representation, and affiliation.
2024;24(1):1054. 23. O’Brien BC, Harris IB, Beckman TJ, et al. Standards for reporting
Acad Med. 2016;91(3):345-350. 40. Polit DF, Beck CT. Generalization in quantitative and qualitative
qualitative research: a synthesis of recommendations. Acad Med.
Volume 27, No. 6: November 2026
research: myths and strategies. Int J Nurs Stud. 2010;47(11):1451-1458.
1569
Western Journal of Emergency Medicine
Original Research
Impact of Away Rotations on Emergency Medicine Match Rates in the Virtual Residency Recruitment Era Jennifer Kaminsky, MD, EdM Stephen Thomas, MD, MPH Leslie Bilello, MD Nicole M. Dubosh, MD
Beth Israel Deaconess Medical Center/Harvard Medical School, Department of Emergency Medicine, Boston, Massachusetts
Section Editor: Jeffrey Druck, MD Submission history: Submitted February 2, 2026; Revision received May 27, 2026; Accepted August 10, 2026 Electronically published October 18, 2026 Full text available through open access at http://escholarship.org/uc/uciem_westjem DOI 10.5811/westjem.62267
Introduction: Since the COVID-19 pandemic, many emergency medicine (EM) residencies have transitioned to virtual interviews, providing less in-person exposure for applicants. Away rotations offer applicants the opportunity to gain in-person exposure to residency programs beyond the virtual interview environment. Whether the away rotation is more important now and leads to higher rotator match rates in the virtual recruitment era remains unclear and warrants investigation. Our objective was to determine the percentage of EM interns who completed an in-person rotation at the residency program in which they matched and compare this to pre-COVID-19 match rates. Methods: This was a multicenter pilot study of EM residency programs. We recruited a convenience sample of academic programs from the eight Society for Academic Emergency Medicine (SAEM) US geographic regions. Inclusion criteria included academic EM programs that conducted virtualonly interviews post-COVID-19. We collected data via a survey form for the 2017-2024 application years regarding the number of matched interns who completed an in-person rotation at the program and the number of matched interns who were “home” versus “away” rotators. The first three years were defined as pre-COVID and the last three as post-COVID. The 2020-2021 academic year was excluded given the elimination of most away rotations during this cycle. We compared proportions of matched interns before and after COVID-19. Results: Eleven of 13 invited programs (representing seven of eight SAEM regions) participated in our analysis. Pre-COVID, 95 of 384 interns (24.7%; 95% CI, 20.5-29.4%) completed a rotation at their respective residency program. Post-COVID, this decreased by 2.86% (absolute risk difference; 95% CI, –6.13% to 4.02%; McNemar’s P = .06) to 84 of 384 (21.9%; 95% CI, 17.8-26.3%). Focusing solely on “away” rotators, 48 of the matched interns (12.5%; 95% CI, 9.4-16.2%) completed a rotation at their residency program pre-COVID compared to 47 interns (12.2%; 95% CI, 9.1-15.9%) post-COVID (P = .82). The absolute risk difference for the away rotators was 0.7% (95% CI, -10.6% to 9.1%, P = .82). Conclusion: In this pilot study, we found no statistically significant difference in the proportion of matched interns who completed an in-person rotation in the pre- versus post-COVID-19 era. [West J Emerg Med. 2026;27(6)1570–1577.]
INTRODUCTION Before the onset of the COVID-19 pandemic, residency interviews were nearly universally held in-person. This allowed applicants to visit prospective programs and interact
Western Journal of Emergency Medicine
with program leadership, faculty, and current residents face-to-face. However, the pandemic prompted a shift in this traditional in-person format, posing an unprecedented and unique set of challenges for both applicants and training
1570
Volume 27, No. 6: November 2026
Kaminsky et al.
Impact of Away Rotations on EM Match Rates in the Virtual Residency Recruitment Era
programs across all specialties.1,2 Previous studies have found that interview day environment, including format, structure, and on-site experiences have an impact on applicants’ ranking of programs.3-5 Organizations and working groups including the Association of American Medical Colleges, Council of Residency Directors in Emergency Medicine, Clerkship Directors in Emergency Medicine, and Coalition for Physician Accountability recommend that interviews continue to be held in a virtual format for cost, safety, and equity reasons.6-10 Residency programs may offer optional in-person visits and second looks later in the interview season, which allow applicants to see the program beyond the virtual format.6 In this era of virtual interviews, we consider the impact that on-site exposure, specifically away rotations, will have on applicants’ and EM (emergency medicine) residency programs’ rank list decisions. Away rotations provide residency applicants with the opportunity to gain in-person exposure to programs beyond the virtual interview environment. While other specialties have examined the impact of visiting rotations on match outcomes, there is a paucity of such data in EM.11-15 A survey study in orthopedic surgery found that medical students applying to the specialty are now completing more away rotations than previously reported, with many matching at either a program where they completed an away rotation or at their home institution.14 Similarly, a recent study in plastic surgery found that completion of an away rotation was strongly associated with increased odds of receiving an interview and matching at that specific program.15 Whether or not the away rotation is more important now, in the virtual recruitment era, and leads to higher rotator match rates in EM remains unclear and warrants investigation. Our objective in this study was to determine the percentage of EM interns who completed an in-person rotation with the residency program in which they matched and compare this to pre-COVID-19 match rates. We hypothesized that the proportion of matched interns who rotated at their future program would increase following the transition to virtual interviews. METHODS Study Design This was a multicenter pilot study of EM residency programs across the United States. We recruited a convenience sample of academic programs from the eight Society for Academic Emergency Medicine (SAEM) US geographic regions as defined in the SAEM Residency Directory in 2024. Students commonly use the SAEM Residency Directory when searching for away rotations in EM.16 We chose academic programs affiliated with a medical school to better represent the effect of a “home” rotation that is lacking at many nonacademic programs. We specifically included programs that conducted virtual-only (not hybrid or in-person) Volume 27, No. 6: November 2026
Population Health Research Capsule What do we already know about this issue? Since the COVID-19 pandemic, many emergency medicine (EM) residencies have transitioned to virtual interviews, limiting applicants’ opportunities for in-person exposure to programs. What was the research question? Have EM match rates changed among in-person rotators since the shift to virtual interviews? What was the major finding of the study? Rotator match rates did not significantly differ pre/post-COVID-19 (24.7% vs 21.9%; P = .06; 95% CI, -6.1% to 4.0%). How does this improve population health? As applicants and programs improve their residency selection decisions and educational planning, the process will support the broader goal of improving patient care.
interviews post-COVID-19. A data collection tool was sent to participating sites. The tool, consisting of 12 questions, was developed by medical education faculty and a statistician at the primary author’s institution. Education faculty reviewed the survey tool for clarity and content validity before it was distributed to programs. Questions were developed in accordance with best practices in educational survey design.17 We collected demographic data for each residency program including the length of each residency program, number of residents per class, whether or not the program was affiliated with a medical school, the number of years the program director (PD) had held their role, and the number of associate and assistant program directors (APD) at the program. We selected these covariates (number of postgraduate year 1 (PGY-1) EM positions, PD tenure, and number of APDs) based on prior investigations showing that PD tenure and greater faculty and resident presence on interview days may influence match rates.3,18 We also obtained the numbers of interns who previously completed an in-person rotation at the residency program in which they matched and how many matched interns were “home” versus “away” rotators. Home rotators were defined as those from the medical school affiliated with the EM residency training program. Away rotators were those from other medical schools. We also identified whether the program offered an in-person second look visit for prospective applicants and the number of those applicants who participated. Survey data was
1571
Western Journal of Emergency Medicine
Impact of Away Rotations on EM Match Rates in the Virtual Residency Recruitment Era collected via Qualtrics (Qualtrics, LLC). Individual responses were de-identified. Study Protocol We collected data from August to September 2024 from the participating EM residency programs.19 Only programs that shifted to virtual interviews in the post-COVID-19 period were included. Data were gathered for the 2017-2024 residency application years. The first 3 years (2017 to 2020) were defined as “pre-COVID” and the last three (2021-2024) as “post-COVID.” We excluded the 2020-2021 academic year given the pandemic and elimination of most away rotations during this application cycle. The data collection tool was sent via email using a Qualtrics form to residency leadership members at the participating sites who were able to extract data from their local records for the variables listed above. This study was reviewed by the institutional review board at our institution and found to be exempt from further review. Outcome Measures Our primary outcome measure in this study was the proportion of EM interns who completed an in-person rotation at the residency program in which they matched, comparing pre-COVID and post-COVID years. Our secondary outcome measures included the number of matched interns who were home versus away rotators and the association between in-person second looks and intern match rates in our preliminary secondary analysis. Data Analysis Data were imported from the collection tool into an Excel spreadsheet (Microsoft Corp) and situationally recoded and converted to a numeric format. There were no pre-analysis modifications in any data points, from the information submitted by survey responders. Data were then imported from the spreadsheet into Stata, version 18.5, StataCorp LLC), which we used for all analysis and plotting. Categorical data were described using proportions. For key findings (primary and secondary outcome measures) representing proportional estimates, we reported proportions with 95% CIs. We interpreted overlap of CIs as evidence against statistical significance at the P < .05 level. We first analyzed categorical data for the entire set of rotators (both home and away) and then repeated the analysis with focus solely on the away rotators. Paired categorical comparisons (eg, number of matched rotators in pre- and post-COVID periods) were performed using McNemar χ² testing, while continuous variables were compared using a paired t-test. Multivariable analysis employed logistic regression (clustered on program) to evaluate the dichotomous endpoint of whether the number of rotators rose in the post-COVID era. We prespecified three covariates as candidates for adjustment: number of PGY-1 EN positions, tenure of PD (years), and number of APDs. Logistic regression reported effect estimates Western Journal of Emergency Medicine
Kaminsky et al.
as odds ratio (OR) with conservative calculation of 95% CI (based on clustering). Postestimation model evaluation assessed discrimination (c statistic), specification (Pregibon hat-squared), and calibration (Hosmer-Lemeshow goodnessof-fit). Additionally, autoregressive conditional heteroskedasticity (ARCH) modeling evaluated whether, within each residency program, there were any findings of sufficient volatility to invalidate combining the pre-COVID and post-COVID data. Subgroup Analysis We also conducted a subgroup analysis on second look data to determine whether there was a correlation between second look visits and intern match rates. The second look results are considered preliminary, as only 8 of 11 (72.7%) programs offered a second look visit during the post-COVID era. A dichotomous variable indicating whether a program offered a second look visit was added to our logistic regression model. We then recorded the second look variable’s effect estimate (OR and its 95% CI) and statistical significance (Wald P value). RESULTS Descriptive Reporting of Respondent Residency Programs Of the 13 programs invited, 11 participated in our study, yielding an 85% response rate. All respondent programs were affiliated with medical schools. Additionally, all 11 programs conducted residency interviews virtually in all the postCOVID years of the study. Seven of the eight SAEM U.S. geographic regions as designated in 2024 are represented in the data set (West excluded). Further characteristics of respondent programs are shown in the Table 1. Univariable Analyses There were 384 matched PGY-1 EM residents for each of the two study eras (pre- and post-COVID). Detailed results for each of the 11 participating EM residency programs are depicted in Table 2 (see Supplemental Materials). The PGY-1 class sizes remained the same for all programs both pre- and post-COVID. For the entire set of rotators (both home and away), 95 of 384 matched PGY-1 residents in the pre-COVID era (24.7%; 95% CI, 20.5-29.4%) had completed a rotation at the residency program in which they matched compared to 84/384 (21.9%; 95% CI, 17.8-26.3%) post-COVID. The absolute risk difference was 2.86% (95% CI, -6.13% to +4.02%) with McNemar χ² P = .06. Based on the paired-analysis approach, for the entire set of rotators the difference in point estimates of matched PGY-1 residents (24.7% pre-COVID, 21.9% postCOVID) had a corresponding estimate of 11 more rotators pre-COVID (95% CI, -1.54 to 23.54). When analysis focused solely on the away rotators, we found that 48 matched interns (12.5%; 95% CI, 9.4-16.2%) completed a rotation at their residency program pre-COVID
1572
Volume 27, No. 6: November 2026
Impact of Away Rotations on EM Match Rates in the Virtual Residency Recruitment Era
Kaminsky et al.
Table 1. Characteristics of 11 responding emergency medicine residency programs in a pilot study examining match rates of rotators in pre- versus post-COVID-19 years. Characteristic
Number (% of 11) or range
Mean (standard deviation)
SAEM US geographic region Northeast
2 (18.2%)
Midwest
3 (27.3%)
Mid-Atlantic
1 (9.1%)
Northwest
1 (9.1%)
Southeast/Southeastern
2 (18.2%)
Great Plains
1 (9.1%)
Southwest
1 (9.1%)
Program director tenure (years)
1 to 7
3.2 (2.0)
Number of associate or assistant program directors
1 to 6
3.2 (1.5)
Duration of residency 3 years
7 (63.6%)
4 years
4 (36.4%)
Total number of residents in program
18 to 63
39.0 (16.9)
First-year EM residents (PGY 1)
6 to 18
11.6 (3.9)
PGY 2
6 to 18
11.4 (3.9)
Number of residents in each year
PGY 3
5 to 16
11.0 (3.5)
PGY 4
12 to 15
13.8 (1.5)
Affiliation with a medical school 11 (100%) EM, emergency medicine; PGY, postgraduate year of EM residents matched per year; SAEM, Society for Academic Emergency Medicine.
compared to 47 interns post-COVID (12.2%; 95% CI, 9.115.9%). The absolute risk difference was 0.7% (95% CI, -10.6% to 9.1%). McNemar χ² P value was .82. For away rotators, the estimated difference of one more rotator preCOVID compared to post-COVID had a 95% CI of -17 to 19. Figures 1 and 2 show results for each of the 11 programs. Figure 1 includes the total number of rotators (both home and away) who matched, while Figure 2 depicts the changes in the number of matched away rotators in pre- versus post-COVID eras. For two EM residency training programs, the proportion of away rotators was unchanged. This proportion rose for four EM programs and fell for five programs.
(focusing on the endpoint of whether the number of matched away rotators rose in the post-COVID era), two significant variables were identified. Both the PGY-1 EM class size (OR 3.98; 95% CI, 1.54-10.26; P = .004) and PD’s tenure (OR 9.78; 95% CI, 1.78-53.79; P = .009) were strongly and positively associated with increased likelihood of a postCOVID era rise in the number of matched away rotator students. The number of APDs was not a significant predictor (OR 1.06; 95% CI, 0.48-2.33; P = .89). The bivariable model’s postestimation confirmed acceptability of model discrimination (c = .97), specification (hat2 P = .96), and calibration (Hosmer-Lemeshow P = .81).
Multivariate Analysis Multivariate logistic regression analysis adjusted for three covariates (number of PGY-1 positions, tenure of PD in years, and number of APDs) while evaluating the dichotomous endpoint of whether the number of matched rotators rose in the post-COVID era. Our analyses focused on whether the proportion of all rotators (home and away) and away rotators alone rose from pre- to post-COVID. For the first logistic regression (total number of rotators), none of the three predictors were significant (all with P > 0.6 and effect estimates near the null). In the second logistic regression
Second Look Data Of the 11 programs represented in our study, eight (72.7%; 95% CI, 39.0–94.0%) offered a second look to residency applicants for at least part of the post-COVID era. A second look was offered by one EM residency program in the 2021 match (12.5%; 95% CI, 0.3-52.7%), four programs in the 2022 match (50%; 95% CI, 15.7-84.3%), and eight programs in the 2023 match (100%; one-sided 97.5% CI, 63.1-100%). No students (0%; one-sided 97.5% CI, 0-36.9%) who completed a second look matched in the participating programs in 2021. In 2022, three EM residency programs
Volume 27, No. 6: November 2026
1573
Western Journal of Emergency Medicine
Impact of Away Rotations on EM Match Rates in the Virtual Residency Recruitment Era
Kaminsky et al.
Table 2. Number of home, away, and total (both home and away) rotators matching into each EM residency training program in a study assessing rotator match rates in both pre- and post-COVID years EM training program (Number of EM1s)
Total matching rotators (pre)
Total matching rotators (post)
Matching home rotators* (pre)
Matching home rotators* (post)
Matching away rotators* (pre)
Matching away rotators* (post)
1 (18)
2
8
1
5
1
3
2 (13)
5
6
2
4
3
2
3 (6)
5
8
2
0
3
8
4 (13)
5
5
1
1
4
4
5 (15)
6
5
4
5
2
0
6 (16)
8
7
8
3
0
4
7 (8)
11
9
1
8
10
1
8 (11)
12
9
10
1
2
8
9 (10)
13
7
9
6
4
1
10 (6)
13
9
2
3
11
6
11 (12)
15
11
7
1
8
10
Total 95 84 47 37 48 47 EM1, number of first-year EM residents (interns) matched per year “Pre” refers to the pre-COVID match years (2017-2020), and “Post” refers to the post-COVID match years (2021-2024). *Home rotators were those from the medical school affiliated with the EM residency training program. Away rotators were those from other medical schools.
matched a total of 14 of 18 students who completed a second look (77.8%; 95% CI, 52.4-93.6%). In 2023, six programs matched a total of 25 of 26 second look students (96.2%; 95% CI, 80.4-99.9%). The results comparing second look should be considered preliminary due to low numbers and the fact that there was variation in individual programs’ offering of second looks over the relevant period. Given these results, we found that the presence of a second look day was not associated with a program’s likelihood of matching more away rotators. The univariable absolute risk difference was 4.5% (95% CI, -2.2 to 11.2%; P = .34), and the multivariable odds ratio of 6.13 had a 95% CI (0.1-252) that indicated imprecision and crossed the null. DISCUSSION In this pilot analysis of academic EM residency programs, we did not observe an appreciable difference in the proportion of matched interns pre- and post-COVID. Although there was a slight decrease in the proportion of matched rotators (both “home” and “away” students) who completed an in-person rotation at their residency program post-COVID compared to pre-COVID, this difference was not statistically significant. Similarly, no significant difference was found when looking at match rates of away rotators. Given the study’s relatively small and geographically limited sample, these findings should be interpreted cautiously but may provide preliminary insight into how away rotations impact match rates in the virtual recruitment era. The correlation of in-person experiences of medical students and matching at their respective programs has been Western Journal of Emergency Medicine
investigated in other specialties. In one study, students applying to integrated vascular surgery programs rated personal or co-applicants’ experiences as a sub-intern as one of the most important factors affecting their decision to rank and train at a specific program.11 Another study in otolaryngology examining the impact of the away rotation outside of students’ home geographic location both pre- and post-COVID found that the away rotation experience increased the number of interviews offered and thus increased the match rate in that targeted geographic location.13 Additionally, an analysis of plastic surgery programs found that there was an increased match rate for students at their home institution in the 2020-2021 cycle due to an absence of in-person away rotations.20 These studies suggest that inperson exposure to programs may play an impactful role on an intern’s match, which is in contrast to our findings on inperson rotations in EM. Reasons for this are unclear, but these correlations may be due to the generally smaller program size of these surgical specialties or relative competitiveness in the match. Further investigation is warranted. The findings in our study yield several important implications for EM residency leadership, student advisors, and students applying into the specialty. The Association of American Medical Colleges (AAMC) analyzed data from an annual survey distributed to medical schools and estimated that residency interview costs for MD applicants may range from $400 to $7,000.21 Furthermore, a 2015 survey of fourthyear medical students found that 82% believed that rotating at a program increased their chance of matching there; the majority of away rotators spent between $1,000 and $4,000 to
1574
Volume 27, No. 6: November 2026
Kaminsky et al.
Impact of Away Rotations on EM Match Rates in the Virtual Residency Recruitment Era
Figure 1. Changes in number of matched rotators for 11 emergency medicine residency programs (pre- to post-COVID). The above figure includes both home and away rotators who matched at their respective program in pre-COVID (left) and postCOVID (right) years.
Figure 2. Proportion of all matched rotators who were away rotators. The figure represents changes in match rates for preCOVID (left side of graph) and post-COVID (right) periods for away rotators alone.
complete these electives.22 This raises a key question: Are away rotations in EM financially worth it to match at a particular academic program if match rates remain unchanged between away rotators and those who are unable to visit in person? Our data may provide valuable insight for medical students and advisors when contemplating whether it would be beneficial for students to complete multiple away rotations to match at an academic program in the specialty. It is important to note, however, that we cannot speculate on other potential benefits of an away rotation not directly correlated with matching at the program of interest such as the value of obtaining a Standardized Letter of Evaluation or advising from faculty in EM. Additionally, our findings may provide guidance for PDs as they consider whether to continue with virtual interviews or transition back to an in-person format. We also analyzed second look data and its influence on match rates, given this is another type of in-person exposure to a program. Most EM programs included in our analysis did not track second look data for most of the study period as evidenced by our paucity of data for this variable. Because second look data were not always available or known with high reliability, these results are presented as preliminary. We believe the findings regarding second look data are best used for hypothesis-generating purposes. Further investigation is warranted to determine whether an in-person second look may replace another in-person experience such as the away rotation or in-person interview and how this may affect match rates at a particular program. While other specialties found that second looks influenced an applicant’s rank order list, finances and logistics often hindered applicant attendance.23,24 Emergency medicine applicants should weigh the financial burden of an in-person visit (away rotation or second look) with the personal benefit to make an informed decision about whether or not these are worthwhile.
LIMITATIONS Our study has several limitations. We included a nonrandom, convenience sample of academic EM residency programs to ensure geographic representation and for the purposes of comparing home versus away data. We also only included programs that continued virtual-only interviews postpandemic to better measure our primary aim. Our data therefore cannot be applied to nonacademic programs or programs that transitioned back to in-person interviews or to a hybrid model. It is worth noting that all applicants may not have had a uniform interview experience post-COVID-19, as some EM residency programs have transitioned to in-person or hybrid (in-person and virtual) interviews while others have remained virtual. We recognize that this pilot study is limited by the fact that we only invited 13 academic EM programs to participate (with 11 of the 13 programs responding). Future efforts will prioritize recruitment of a larger and more diverse sample to improve generalizability and statistical power.25-27 Our sample also did not evenly represent each region, as we had more contacts with data available for all variables of interest. Specifically, the Western region, which has many EM residents, was not included and may limit extrapolation of our findings. Nevertheless, we believe these findings are valuable for applicants applying to a variety of programs in multiple geographic regions. Finally, our limited response rate on second look data should be interpreted with caution and not be applied generally. Further investigation on the impact of a second look on a larger scale is warranted.
Volume 27, No. 6: November 2026
CONCLUSION In this pilot study, we found no statistically significant difference in the proportion of matched interns who completed an in-person rotation in the pre- versus post-COVID-19 era.
1575
Western Journal of Emergency Medicine
Impact of Away Rotations on EM Match Rates in the Virtual Residency Recruitment Era This data applies to academic EM residency programs affiliated with a medical school that conducted virtual-only interviews post-COVID-19 and in a subset of SAEM geographic regions. We must continue to evaluate the impact of virtual interviews and in-person opportunities on match rates and provide guidance on best practices to program leadership, students applying to the specialty, and student advisors in emergency medicine.
Kaminsky et al.
physicianaccountability.org/wp-content/uploads/2021/08/VirtualRec_COVID-Only_Final.pdf. Accessed August 16, 2025. 8. Association of American Medical Colleges. Interviews in GME: Where do we go from here? 2024. Available at: https://www.aamc.org/ about-us/mission-areas/medical-education/interviews-gme-where-dowe-go-here. Accessed August 16, 2025. 9. Council of Residency Directors in Emergency Medicine. Recommendations on program-sponsored events during the 2021-2022 interview season. [Society for Academic Emergency
Address for Correspondence: Jennifer Kaminsky, MD, EdM, Beth Israel Deaconess Medical Center/Harvard Medical School, Department of Emergency Medicine, 1 Deaconess Road, West/CC251, Boston, MA 02215. Email: jkamins2@bidmc.harvard.edu. Conflicts of Interest: By the WestJEM article submission agreement, all authors are required to disclose all affiliations, funding sources and financial or management relationships that could be perceived as potential sources of bias. No author has professional or financial relationships with any companies that are relevant to this study. There are no conflicts of interest or sources of funding to declare.
Medicine]. Published 2021. Available at: https://www.cordem.org/ siteassets/files/consensus-statements/cdem_cord-statement-20212022-recruitment-season.pdf. Accessed April 7, 2025. 10. Council of Residency Directors in Emergency Medicine. Application Process Improvement Committee (APIC): Best practices for the 2025-2026 residency application and interview season. 2025. Available at: https://acrobat.adobe.com/id/ urn:aaid:sc:va6c2:5c85d60e-da29-43df-933c-2867fafd3401. Accessed April 7, 2025. 11. Fereydooni A, Ramirez JL, Morrow KL, et al. Factors influencing
Copyright: © 2026 Kaminsky et al. This is an open access article distributed in accordance with the terms of the Creative Commons Attribution (CC BY 4.0) License. See: http://creativecommons.org/ licenses/by/4.0/
medical student choices in the integrated vascular surgery match: implications for future post-pandemic residency matches. J Vasc Surg. 2021;74(4):1354–1361. 12. Movassaghi M, Gillespie A, Deibert CM, et al. The impact of visiting rotations on the urology residency match: insights and perspectives from the 2021-2022 applicants. Urology. 2022;170:38–45.
REFERENCES
13. Benjamin WJ, Lenze NR, Mihalic AP, et al. Does geographic region of
1. Lee E, Terhaar S, Shakhtour L, et al. Virtual residency interviews
away rotations predict otolaryngology match outcomes? Otolaryngol
during the COVID-19 pandemic: the applicant’s perspective. South
Head Neck Surg. 2024;170(1):92–98.
Med J. 2022;115(9):698–706.
14. Tran DH, Cohn RM, Schiff AP, Saraf SM, Rumps MV, Mulcahey MK.
2. Davis MG, Haas MRC, Gottlieb M, et al. Zooming in versus flying out:
Away rotations have increased importance for matching in
virtual residency interviews in the era of COVID-19. AEM Educ Train. 2020;4(4):443–446.
orthopaedic surgery. JB JS Open Access. 2025;10(1):e24.00182. 15. Kotlier JL, Mihalic AP, Homsy C. Preference signals and away
3. Lewis J, Dubosh N, Rosen C, et al. Interview day environment may
rotations greatly influence application success in the integrated
influence applicant selection of emergency medicine residency
plastic surgery match. J Surg Educ. 2025;82(5):103467.
programs. West J Emerg Med. 2017;18(1):142–145.
16. Society for Academic Emergency Medicine Directories. Available at:
4. Li‐Sauerwine S, Weygandt PL, Smylie L, et al. The more things change
https://www.saem.org/education/directories. Accessed on May 23, 2026.
the more they stay the same: factors influencing emergency medicine
17. Artino AR Jr, La Rochelle JS, Dezee KJ, Gehlbach H. Developing
residency selection in the virtual era. AEM Educ Train. 2023;7(6).
questionnaires for educational research: AMEE Guide No. 87. Med
5. Love JN, Howell JM, Hegarty CB, et al. Factors that influence
Teach. 2014;36(6):463–474.
medical student selection of an emergency medicine residency
18. O’Connor AB, Halvorsen AJ, Cmar JM, et al. Internal medicine
program: implications for training programs. Acad Emerg Med.
residency program director burnout and program director turnover:
2012;19(4):455–460.
results of a national survey. Am J Med. 2019;132(2):252–261.
6. Council of Residency Directors in Emergency Medicine. 2023 CORD
19. Society for Academic Emergency Medicine Residency. Directory Map.
Statement on Residency Interviews, Available at: https://www.cordem.
Available at: https://member.saem.org/SAEM_Directories/SAEM_
org/siteassets/files/board/adv.--position-statements/2023-cord-
Directories/P/ResidencyMap.aspx. Accessed on March 10, 2025.
statement-on-residency-interviews.pdf. Accessed August 16, 2025.
20. Faletsky A, Zitkovsky H, Guo L. The impact of COVID-19 on plastic
7. Coalition for Physician Accountability. Recommendations on
surgery home program match rates. Ann Plast Surg. 2022;88(1):4–6.
2021-22 residency season interviewing for medical education
21. Association of American Medical Colleges. The cost of interviewing
institutions considering applicants from LCME-accredited, U.S.
for residency. 2024. Available at: https://students-residents.aamc.org/
osteopathic, and non-U.S. medical schools. National Residency
financial-aid-resources/cost-interviewing-residency. Accessed on
Matching Program, Published August 24, 2021. Available at: https://
March 10, 2025.
Western Journal of Emergency Medicine
1576
Volume 27, No. 6: November 2026
Kaminsky et al.
Impact of Away Rotations on EM Match Rates in the Virtual Residency Recruitment Era
22. Benson NM, Stickle TR, Raszka WV Jr. Going “fourth” from medical
residency virtual interview season: an important consideration for
school: fourth-year medical students’ perspectives on the fourth year of medical school. Acad Med. 2015;90(10):1386–1393.
radiology residency applicants. Acad Radiol. 2023;30(6):1192–1199. 25. Yarris LM, Deiorio NM. Education research: a primer for educators in
23. Mahoney MT, Corrigan KL, Linkowski LC, et al. Applicant and program director perceptions of second look events during the 2023
emergency medicine. Acad Emerg Med. 2011;18(Suppl 2):S27–S35. 26. Gruppen LD. Improving medical education research. Teach Learn
radiation oncology residency match. Adv Radiat Oncol. 2024;9(6):101473.
Med. 2007;19(4):331–335. 27. Hochberg CH, Eakin MN. Keys to successful survey research in
24. England E, Kanfi A, Tobler J. In-person second look during a
Volume 27, No. 6: November 2026
health professions education. ATS Scholar. 2024;5(1):206–217.
1577
Western Journal of Emergency Medicine
Educational Special Issue: Scholarly Perspectives
Off Service, with Purpose: Creating Learner-Centered Experiences for Off-Service Residents Ivan Zvonar, MD* Max Griffith, MD† Alexander Garrett, MD*
*University of Washington School of Medicine, Department of Emergency Medicine, Seattle, Washington † Wenatchee Emergency Physicians, Wenatchee, Washington
Section Editor: N/A Submission history: Submitted June 1, 2026; Revision received August 10, 2026; Accepted August 10, 2026 Electronically published November 2, 2026 Full text available through open access at http://escholarship.org/uc/uciem_westjem DOI 10.5811/westjem.65915
Academic emergency departments (EDs) host off-service residents (OSRs) from various specialties. While OSRs contribute meaningfully to patient care, they often face unique challenges during their ED rotations, including limited preparation, heightened stress, and unmet personal expectations. Despite a standardized curriculum endorsed by the American College of Emergency Physicians, guidance on how to foster meaningful educational experiences for OSRs remains sparse. This perspective offers a structured approach grounded in self-determination theory (SDT), which emphasizes autonomy, competence, and relatedness as essential to intrinsic motivation and effective learning. By aligning educational strategies with SDT principles, emergency medicine educators can enhance engagement, support learner development, and create lasting interprofessional collaboration. Ultimately, this learner-centered approach not only enriches the OSR experience but also strengthens the role of the ED as a dynamic, inclusive learning environment for all trainees. [West J Emerg Med. 2026;27(6)1578–1582.]
INTRODUCTION: OFF-SERVICE RESIDENTS IN THE EMERGENCY DEPARTMENT Academic emergency departments (ED) are busy clinical areas owing to both high patient volumes and a vast spectrum of learners. In addition to emergency medicine (EM) residents, trainees from other specialties rotate through the ED either as part of their Accreditation Council for Graduate Medical Education (ACGME) program requirements1-4 or for additional clinical experience. The American College of Emergency Physicians acknowledges the importance of ED training for off-service residents (OSR), and the Academic Affairs Committee has created a standardized OSR curriculum5—although this most recent national effort was more than 15 years ago. Little has been written about the OSR experience in the ED and how EM educators can foster a robust learning environment for them. Indeed, we owe all trainees an engaging experience, not only in recognition of their hard work that increases the productivity of EM faculty,6 but also to serve as the foundation for their professional relationship with the ED in their future careers. Off-service residents face numerous challenges regarding their EM rotations. They receive little to no didactic Western Journal of Emergency Medicine
instruction tailored to their background,7 are not adequately prepared to manage foundational EM patient complaints,8 require more frequent faculty supervision,9 and take significantly more time to reach the productivity level of an EM resident.10,11 The ED can also be a stressful environment owing to high patient acuity, diagnostic uncertainty, and moral injury,12 with OSRs more emotionally impacted than their EM counterparts.13 Thus, it is unsurprising that OSRs frequently report that EM rotations fail to meet their expectations—a gap that may be the result of a one-size-fits-all model, as opposed to a more learner-centered approach.14 A deliberate focus on motivation is a required component of a learner-centered clinical experience.15 Self-determination theory (SDT) has emerged as the motivational theory best positioned to guide medical education advancement, because it reinforces autonomy and potentially leads to more effective healthcare delivery by trainees.16 SDT specifically prioritizes learner-centeredness by addressing both intrinsic motivation and autonomous self-regulation—effectively getting at the why behind trainees’ actions—thereby providing a helpful framework for a more OSR-centered approach to EM rotations.17 In this perspective, we review SDT’s three core
1578
Volume 27, No. 6: November 2026
Zvonar et al.
Creating Learner-Centered Experiences for Off-Service Residents
psychological needs for learning—autonomy, competence, and relatedness—in the context of OSRs rotating in the ED. In doing so, we aim to improve the OSR experience by offering opportunities and best practices for supervisors with a basis in evidence and theory. SELF-DETERMINATION THEORY Of several evidence-based models for motivation in education,18 SDT has emerged as one of the most commonly used in health professions education research.19 SDT posits that humans have an innate tendency toward psychological growth, development, and learning, and educational environments can either support or hinder these processes.17 A central tenet of SDT is that intrinsic motivation and the internalization of autonomous self-regulation leads to better and more sustained learning.20 This is in contrast to extrinsic motivation, which refers to behavior driven by external outcomes for which the learner does not hold a shared value. To support intrinsic motivation, a learning activity must fulfill the three fundamental needs of self-determination: autonomy, competence, and relatedness.20 Autonomy is the feeling that the choice to do something arises from within the individual, rather than being told what to do. Competence refers to the desire to feel capable and effective at a given task. Relatedness is the need to feel a connection both to the work one is doing and to others in the learning environment. It is the responsibility of educators in the ED to support the growth and development of all learners. By intentionally framing clinical tasks through the lens of autonomy, competence, and relatedness, we can empower OSRs while on rotation, and in doing so contribute to their growth as lifelong, self-regulated learners. Below, we offer suggestions and opportunities to support OSRs in the three key pillars of selfdetermination in the ED. LET THEM STEER: SUPPORTING AUTONOMY While OSRs are training for careers distinct from EM, granting authentic learning opportunities in the ED through autonomy-supportive teaching promotes buy-in and maximizes engagement. This approach minimizes controlling teaching behaviors by focusing on understanding the learner’s viewpoint and providing them with choices and options, thereby allowing them to identify their own learning objectives.21 Importantly, this does not equate with independence per se but rather emphasizes graduated responsibility.22 In doing so, the learner acts in accordance with their personal values and interests in a supportive environment.17 Operationalize this by beginning each shift discussing what the OSR’s key learning goals are for the day. This process of co-construction promotes self-regulation23 and establishes an expectation that while they are providing a valuable service, they can also gain skills that will serve them in their future careers. Consider a way to track these goals, such as with shift cards, both to increase productivity11 and Volume 27, No. 6: November 2026
provide an avenue for formative feedback. Further support autonomy by allowing the OSR to step into the role of an emergency physician. Prompt them to commit to management plans despite their relative unfamiliarity with emergency care. Encourage them to take ownership over the care of their patients so that they feel and act as the primary clinician,24 managing their patients to the extent that they are capable. Staff may look for a familiar face when they have questions or need orders, but they can be politely redirected to the OSR in these instances. This ownership should include the performance of procedures, when that is aligned with a learner’s goals. Because EM residents must meet key index procedure requirements set forth by the ACGME,25 it can be tempting to preferentially offer them procedural opportunities. However, clinical educators are responsible for the development of all learners and should judiciously share opportunities with a consideration for equipoise and patient safety. Therefore, when an OSR’s patient requires a procedure, they should be given the opportunity to perform it so long as it is deemed safe. It is important for OSRs to gain experience with core procedures5 because many procedural skills—such as those that use ultrasound guidance or Seldinger technique—translate to other specialties. CREATE A TOOLBOX: BUILDING COMPETENCE Since OSRs come from various specialties and are often early in their training when they rotate in the ED, their foundational EM knowledge base is variable. Emergency medicine requires uniquely time sensitive evaluations of acute patient presentations.5 Although medical competence is multilayered, OSRs’ goals during their ED rotations should target canonical EM knowledge and skills.26 A targeted needs assessment can identify gaps in knowledge specific to OSRs at your institution.8 This can guide the development of an OSR curriculum that best suits your department’s rotation. Alternatively, use a standardized curriculum that can be integrated into the rotation.5 Didactics can be combined with residency conferences or added asynchronously.27 Coordinate with EM chief residents and other residents in education roles to provide OSR orientations that cover essential EM topics and departmental operations, and address the practical needs that are essential in new healthcare settings (eg, where bathrooms and the cafeteria are located).28 Consider providing introductory ultrasound teaching, because the application of point-of-care ultrasound is evolving and extending to specialties beyond EM.29 Due to the expanding scope of knowledge required to practice EM, clinicians are increasingly using digital resources to answer clinical questions.30 With the use of free openaccess medical education, there is the danger of inappropriate representation of core content.31 Make sure to provide access to foundational EM resources to establish a basis for selfdirected learning.32 Doing so will empower OSRs to look
1579
Western Journal of Emergency Medicine
Creating Learner-Centered Experiences for Off-Service Residents things up for themselves and thus prepare them for future learning.33 Since EM encompasses a wide variety of patient presentations, OSRs will likely manage conditions for which they have preexisting knowledge due to their specific areas of training (eg, an ophthalmology resident seeing an eye complaint in the ED). When this occurs, encourage them to teach the team what they know about the topic. This will highlight the OSR as an asset to the team, build their context-dependent knowledge, and help develop personalized competence—higher order skills that lead to physician maturation.26
from chronic outpatient hypertension management. Teaching can also highlight the ways in which an OSR’s specialty interfaces with the ED (eg, reviewing the appropriate organic medical workup for presumed decompensated psychiatric disease with a psychiatry resident). Additionally, it is important to highlight how the ED functions in supporting an OSR’s specialty—such as exploring how to use social resources to provide alternatives to admissions with an internal medicine resident—because their future jobs will interface with the ED.
SEND AN INVITE: CULTIVATING RELATEDNESS Each residency rotation presents new challenges,34 and residents’ stress and well-being are impacted by team support, workplace demands, and learning opportunities.35 The ED can negatively impact each of these domains owing to its inherent nature as a busy and sometimes chaotic environment, constructed of ad hoc teams. Furthermore, negative comparisons to EM peers, feelings of exclusion, and perceptions of task irrelevance (eg, “Why do I need to know this?”) can dismantle relatedness and motivation. Therefore, educators need to intentionally create an inclusive environment in which to frame OSRs’ connection to the tasks at hand. To add further nuance to this context, OSRs are undergoing the process of forming their specialty identity, using self-categorization and social comparison to highlight similarities and differences between their specialty and others.36 Furthermore, an absence of early interprofessional specialty collaboration can lead to future conflict.37 Because EM is often described as a team sport,38 OSRs must feel fully integrated into the clinical workflow. This lays the groundwork for future relationships when they return to the ED (eg, as a consultant or admitting clinician). Educators can promote this inclusion by introducing them to nurses, medical assistants, pharmacists, and other key professionals in the department. Because much of team building occurs outside of strict patient care, include OSRs in social conversations in the workplace and social gatherings outside the ED when appropriate. It is also important to include OSRs in asynchronous learning opportunities and draw parallels to their future career contexts. Sharing interesting cases with OSRs, even when they are not caring for the patient, can further provide an opportunity to engage OSRs and have them reflect on shared interests in patient care. Although the alignment between a patient’s ED presentation and an OSR’s specialty may not be readily apparent, there are always learning points that can connect the dots. While we discourage the practice of “cherry picking” chief complaints that are familiar,39 we do recommend highlighting how EM differs in its approach to patient presentations. For example, when working with a family medicine resident, one might discuss acute management of asymptomatic hypertension and how it differs Western Journal of Emergency Medicine
Zvonar et al.
CONCLUSION: TOWARD A COLLABORATIVE FUTURE Off-service residents are major contributors to academic emergency departments, and their time spent training in the ED is formative for both their medical knowledge and their understanding of the role of emergency medicine in healthcare. To create learner-centered experiences for OSRs in which they are intrinsically motivated, EM educators can provide opportunities for autonomous practice, assist in establishing competency in foundational EM topics, and create a welcoming environment that fosters both social and task relatedness, reinforcing the relevance of the ED rotation for their own specialty. It is important to note that the three core psychological needs of self-determination theory apply to all learners, including EM trainees. However, a tailored application of the techniques we have described can bolster the clinical learning of OSRs. These actions serve to both create productive rotations for OSRs and sustain healthy and collaborative relationships between EM and other specialties.
Address for Correspondence: Ivan Zvonar, MD, University of Washington School of Medicine, Department of Emergency Medicine, 325 Ninth Avenue, Box 359702, Seattle, WA 98104. Email: izvonar@uw.edu. Conflicts of Interest: By the WestJEM article submission agreement, all authors are required to disclose all affiliations, funding sources and financial or management relationships that could be perceived as potential sources of bias. No author has professional or financial relationships with any companies that are relevant to this study. There are no conflicts of interest or sources of funding to declare. Copyright: © 2026 Zvonar et al. This is an open access article distributed in accordance with the terms of the Creative Commons Attribution (CC BY 4.0) License. See: http://creativecommons.org/ licenses/by/4.0/
REFERENCES
1580
1. Accreditation Council for Graduate Medical Education (ACGME). ACGME Program Requirements for Graduate Medical Education in Internal Medicine. 2025. Available at: https://www.acgme.org/
Volume 27, No. 6: November 2026
Creating Learner-Centered Experiences for Off-Service Residents
Zvonar et al. globalassets/pfassets/programrequirements/2025-reformatted-
guided the development and reform of medical education curricula? A
requirements/140_internalmedicine_2025_reformatted.pdf. Accessed May 31, 2026.
review of the literature. Acad Med. 2012;87(6):735-743. 16. Williams GC, Saizow RB, Ryan RM. The importance of self-
2. Accreditation Council for Graduate Medical Education (ACGME).
determination theory for medical education. Acad Med.
ACGME Program Requirements for Graduate Medical Education
1999;74(9):992-995.
in Family Medicine. 2025. Available at: https://www.acgme.org/
17. Ten Cate TJ, Kusurkar RA, Williams GC. How self-determination
globalassets/pfassets/programrequirements/2025-reformatted-
theory can assist our understanding of the teaching and learning
requirements/120_familymedicine_2025_reformatted.pdf. Accessed
processes in medical education. AMEE guide No. 59. Med Teach.
May 31, 2026.
2011;33(12):961-973.
3. Accreditation Council for Graduate Medical Education (ACGME).
18. Cook DA, Artino AR Jr. Motivation to learn: an overview of
ACGME Program Requirements for Graduate Medical Education in
contemporary theories. Med Educ. 2016;50(10):997-1014.
Neurology. 2025. Available at: https://www.acgme.org/globalassets/
19. Orsini C, Binnie VI, Wilson SL. Determinants and outcomes of
pfassets/programrequirements/2025-reformatted-requirements/180_
motivation in health professions education: a systematic review
neurology_2025_reformatted.pdf. Accessed May 31, 2026.
based on self-determination theory. J Educ Eval Health Prof.
4. Accreditation Council for Graduate Medical Education (ACGME).
2016;13:19.
ACGME Program Requirements for Graduate Medical Education
20. Ryan RM, Deci EL. Self-determination theory and the facilitation of
in Anesthesiology. 2025. Available at: https://www.acgme.org/
intrinsic motivation, social development, and well-being. Am Psychol.
globalassets/pfassets/programrequirements/2025-reformatted-
2000;55(1):68-78.
requirements/040_anesthesiology_2025_reformatted.pdf. Accessed
21. Neufeld A. Autonomy-supportive teaching in medicine: from
May 31, 2026.
motivational theory to educational practice. MedEdPublish.
5. Kessler CS, Marcolini EG, Schmitz G, et al. Off-service resident
2021;10(1):117.
education in the emergency department: outline of a national
22. Kusurkar RA, Croiset G. Autonomy support for autonomous
standardized curriculum. Acad Emerg Med. 2009;16(12):1325-1330.
motivation in medical education. Med Educ Online.
6. Bhat R, Dubin J, Maloy K. Impact of learners on emergency medicine
2015;20(1):27951.
attending physician productivity. West J Emerg Med. 2014;15(1):41-44.
23. Griffith M, Zvonar I, Garrett A, et al. Making goals count: a theory-
7. Branzetti JB, Aldeen AZ, Mark Courtney D. Rotating resident
informed approach to on-shift learning goals. AEM Educ Train.
didactics in the emergency department: a cross-sectional survey on
2024;8(3):e10993.
current curricular practices: rotating resident didactics survey. Acad
24. Kiger ME, Meyer HS, Hammond C, et al. Whose patient is this?
Emerg Med. 2010;17 Suppl 2:S49-S53.
A scoping review of patient ownership. Acad Med. 2019;94(11S
8. Kessler CS, Tolia V, Singh N. Targeted needs assessment of off-
Association of American Medical Colleges Learn Serve Lead:
service residents in emergency medicine. West J Emerg Med.
Proceedings of the 58th Annual Research in Medical Education
2010;11(5):470-473.
Sessions):S95-S104.
9. Holliman CJ, Wuerz RC, Kimak MJ, et al. Attending supervision of
25. Accreditation Council for Graduate Medical Education (ACGME).
nonemergency medicine residents in a university hospital ED. Am J
Emergency Medicine Defined Key Index Procedure Minimums.
Emerg Med. 1995;13(3):259-261.
2017. Available at: https://www.acgme.org/globalassets/pfassets/
10. Joseph JW, Chiu DT, Wong ML, et al. Experience within the
programresources/em_key_index_procedure_minimums_103117.
emergency department and improved productivity for first-year
pdf. Accessed May 31, 2026.
residents in emergency medicine and other specialties. West J
26. Ten Cate O, Khursigara-Slattery N, Cruess RL, et al. Medical
Emerg Med. 2018;19(1):128-133.
competence as a multilayered construct. Med Educ. 2024;58(1):93-
11. Chakravarthy B, Posadas E, Ibrahim D, et al. Increasing off-service
104.
resident productivity while on their emergency department rotation
27. Veronese C, Williams M, Dickson J, et al. Determining the
using shift cards. J Emerg Med. 2015;48(4):499-505.
educational value of an emergency medicine rotation for non-
12. Janicki AJ, Frisch SO, Patterson PD, et al. Emergency medicine
emergency medicine residents. Cureus. 2023;15(10):e47284.
residents experience acute stress while working in the emergency
28. Teunissen PW, Watling CJ, Schrewe B, et al. Contextual
department. West J Emerg Med. 2020;22(1):94-100.
competence: how residents develop competent performance in new
13. Alagappan K, Steinberg M, Mancherje N, et al. The psychological
settings. Med Educ. 2021;55(9):1100-1109.
effects of a four-week emergency medicine rotation on residents in
29. Frasure SE, Treat R, Dow J, et al. An interdisciplinary approach to
training. Acad Emerg Med. 1996;3(12):1131-1135.
the introduction of point-of-care ultrasound in an urban academic
14. Carter AJE, McCauley WA. Off-service residents in the emergency
primary care center. Cureus. 2023;15(3):e36329.
department: the need for learner-centredness. CJEM. 2003;5(6):400-
30. Cadogan M, Thoma B, Chan TM, et al. Free open access meducation
405.
(FOAM): the rise of emergency medicine and critical care blogs and
15. Kusurkar RA, Croiset G, Mann KV, et al. Have motivation theories
Volume 27, No. 6: November 2026
podcasts (2002-2013). Emerg Med J. 2014;31(e1):e76-e77.
1581
Western Journal of Emergency Medicine
Creating Learner-Centered Experiences for Off-Service Residents
Zvonar et al. Med Educ. 2013;13(1):96.
31. Stuntz R, Clontz R. An evaluation of emergency medicine core
36. Schrepel C, Amick AE, Bann M, et al. Self, physician, and specialty:
content covered by free open access medical education resources.
a qualitative exploration of medical students’ specialty identity
Ann Emerg Med. 2016;67(5):649-653.e2.
formation during undergraduate medical training. Acad Med.
32. Ricotta DN, Richards JB, Atkins KM, et al. Self-directed learning in
2024;99(11):1184-1190.
medical education: training for a lifetime of discovery. Teach Learn
37. Schrepel C, Amick AE, Bann M, et al. Who’s on your team? Specialty
Med. 2022;34(5):530-540.
identity and inter-physician conflict during admissions. Med Educ.
33. Mylopoulos M, Brydges R, Woods NN, et al. Preparation for future
2022;56(6):625-633.
learning: a missing competency in health professions education?
38. Fernandez R, Kozlowski SWJ, Shapiro MJ, et al. Toward a
Med Educ. 2016;50(1):115-123.
definition of teamwork in emergency medicine. Acad Emerg Med.
34. Teunissen PW, Westerman M. Opportunity or threat: the ambiguity of
2008;15(11):1104-1112.
the consequences of transitions in medical education: consequences of transitions in medical education. Med Educ. 2011;45(1):51-59.
39. Patterson BW, Batt RJ, Wilbanks MD, et al. Cherry picking patients:
35. Hurst C, Kahan D, Ruetalo M, et al. A year in transition: a qualitative
examining the interval between patient rooming and resident self-
study examining the trajectory of first year residents’ well-being. BMC
Western Journal of Emergency Medicine
1582
assignment. Acad Emerg Med. 2016;23(6):679-684.
Volume 27, No. 6: November 2026
Original Research
Prehospital Buprenorphine: A National Cross-Sectional Analysis *Massachusetts General Hospital, Department of Emergency Medicine, Boston, Kira Chandran, MD*†‡ Scott G. Weiner, MD, MPH†‡ Massachusetts † Scott A. Goldberg, MD, MPH†‡ Brigham and Women’s Hospital, Department of Emergency Medicine, Boston, Vincent L. Holstein, MD, PhD‡§|| Massachusetts ‡ Jane M. Hayes, MD, MPH*†‡ Harvard Medical School, Boston, Massachusetts Rebecca E. Cash, PhD, MPH, NRP*‡ §Massachusetts General Hospital, Department of Psychiatry, Boston, Massachusetts || McLean Hospital, Department of Psychiatry, Belmont, Massachusetts Section Editor: JR R Pickett, MD Submission history: Submitted February 16, 2026; Revision received June 17, 2026; Accepted May 24, 2026 Electronically published October 11, 2026 Full text available through open access at http://escholarship.org/uc/uciem_westjem DOI 10.5811/westjem.46583
Introduction: Initiation of buprenorphine reduces mortality in people with opioid use disorder. However, patients who decline hospital transport after overdose may not be connected to treatment. To augment treatment engagement, prehospital buprenorphine pilot programs began in 2019. To date, few studies have looked at these programs nationally. Our objective was to evaluate national prehospital buprenorphine usage. Methods: We conducted a cross-sectional evaluation of emergency medical service (EMS) encounters involving prehospital buprenorphine administration using the 2020–2023 National EMS Information System Public Release Research datasets. Our primary outcome was trends in prehospital buprenorphine usage. Quarterly rates of prehospital buprenorphine were evaluated using joinpoint regression to identify inflection points. The secondary outcome was patient demographics and encounter characteristics, which were analyzed using descriptive statistics. Results: Of all EMS encounters with patient contact in the dataset (N = 167,221,959), there were 2,180 encounters where buprenorphine was administered (62% male [n = 1,349], mean age 37 years, standard deviation [SD] 10), with a significant increase per year (2020: n = 33; 2023: n = 1,574). Approximately half (52%; n = 1,125) of prehospital buprenorphine administrations occurred during 9-1-1 responses. Most encounters occurred in the South Atlantic region (4 administrations/100,000 encounters) and urban areas (72%; n = 1,572). Nearly all EMS crews were advanced life support (ALS) level of care (paramedic: 53% [n = 1,155]; ALS-community paramedic: 46% [n = 1,008]). Initial dosages of administered buprenorphine were 8 milligrams (mg) (45%; n = 973), 16 mg (36%; n = 786), or 24 mg (7%; n = 160). Most patients (80%; n = 1,746) had documented improvement with only four (0.2%) worse after administration. Few 9-1-1 encounters (16%; n = 180) resulted in hospital transport by EMS. Only 7% (n = 82) of 9-1-1 prehospital buprenorphine encounters had documented naloxone administration prior to buprenorphine dosing. There was a significant increase in number of buprenorphine administrations in quarter 2 of 2022 (slope increase of 54 administrations [95% CI, 20-89] per quarter versus 1 administration [95% CI, –1 to +3] per quarter from 2020–2022 quarter 1). Conclusion: Rates of prehospital buprenorphine have increased significantly between 2020 and 2023. Buprenorphine administration largely resulted in documentation of improvement in patient condition. With continued high rates of opioid-related deaths, prehospital buprenorphine may be considered by EMS agencies to prevent deaths from subsequent opioid use and connect patients to treatment. [West J Emerg Med. 2026;27(6)1583–1590.]
Volume 27, No. 6: November 2026
1583
Western Journal of Emergency Medicine
Prehospital Buprenorphine: A National Cross-Sectional Analysis INTRODUCTION Opioid-related overdose deaths in the United States peaked in 2023 with over 80,000 deaths.1 Emergency medical services (EMS) clinicians are often a primary touchpoint for people with opioid use disorder (OUD), such as in the case of an opioid overdose where they may be called to administer naloxone, an opioid reversal agent, and resuscitate the patient. One of 100 EMS calls within the US now involves the administration of naloxone.2 There have been increased rates of transport refusal by patients after nonfatal overdoses reversed with naloxone by EMS or a bystander, ranging from 22% to 73% declining transport in recent studies.3,4 Although the short-term mortality for those who decline hospital transport after overdose is relatively low, the risk of subsequent nonfatal overdose is high.5,6 Additionally, the 1-year mortality for patients with substance use disorder is exceedingly high. One study showed those who had received prehospital naloxone after overdose had a 1-year mortality of 7.5% (with exclusion of original overdose/immediate postoverdose period), highlighting the seriousness of substance use disorder as a disease itself.7 Promising ways to improve patient outcomes for people with OUD have largely involved medications for OUD, including buprenorphine and methadone. The initiation of buprenorphine by emergency physicians in people with OUD showed a 62% reduction in mortality at 1-year after overdose and a significant decrease in emergency department (ED) utilization rates for opioid-related visits at 30 days after overdose (58% repeat visit for opioid-related event compared to 38%).8,9 However, the opportunity to engage those with substance use disorder in treatment options extends far beyond the ED. Complex social factors (eg, housing instability, high financial cost, discontinuity of care) complicate the ability to adequately care for patients with substance use disorder from the ED alone. Given the high rate of EMS transport refusal to a hospital after an overdose, initiation of buprenorphine by EMS clinicians in the field may be opportune.9 In 2019, New Jersey became the first state to include buprenorphine in their EMS protocols, leading to the first pilot program of prehospital buprenorphine.10 In this protocol, EMS clinicians could administer buprenorphine in the setting of precipitated withdrawal after an overdose reversal with naloxone on scene. 10 Since then, many EMS agencies and programs have followed suit with implementation of prehospital buprenorphine programs.11-14 This includes on-scene treatment for precipitated withdrawal and follow-up care; in some protocols EMS clinicians will return to the site of the nonfatal overdose 24-48 hours after the event to offer buprenorphine for patients who had initially declined treatment and hospital transport.11-14 A previous scoping review of prehospital buprenorphine programs conducted in 2024 found that 19 US states and Washington, DC had a program within their state, although Western Journal of Emergency Medicine
Chandran et al. Population Health Research Capsule What do we already know about this issue? Buprenorphine reduces mortality in opioid use disorder. What was the research question? What are national trends and characteristics of prehospital buprenorphine administration between 2020 and 2023? What was the major finding of the study? Prehospital buprenorphine administration increased between 2020–2023, rising in 2022 quarter 2 +54 per quarter (95% CI, 20-89) vs +1 per qtr pre-2022 Q2 (95% CI, –1 to +3). How does this improve population health? The expansion of prehospital buprenorphine may connect high-risk patients to treatment earlier and help prevent future opioid-related deaths.
their documentation was limited.14 If incorporated with a strong holistic approach to care including social work involvement and connection to outpatient clinicians, prehospital buprenorphine has been associated with significant improvement in patients staying in treatment for OUD and reduction in ED visits.15 However, little is known about the prevalence, usage, demographics, and trends in its use on the national level in the years following initiation. Our objective was to provide a cross-sectional analysis of national EMS encounters for prehospital buprenorphine between 2020 and 2023. METHODS Study Design and Setting A retrospective, cross-sectional analysis was conducted using data from the 2020–2023 National EMS Information System (NEMSIS) Public Release Research datasets version 3.4.0. The NEMSIS is a deidentified, public release dataset including over 54 million EMS encounters annually as of 2023.16 Participation in the database varies by EMS agency and state, with estimates of 42-100% of agencies participating per state.17 This study was reviewed by a human subjects research review board and deemed exempt from review. Strengthening the Reporting of Observational Studies in Epidemiology (STROBE) guidelines were followed for this retrospective, cross-sectional analysis. This study was a secondary analysis of a clinical dataset derived from structured fields in the EMS
1584
Volume 27, No. 6: November 2026
Prehospital Buprenorphine: A National Cross-Sectional Analysis
Chandran et al. electronic health record;18-20 no investigator chart review or manual data abstraction was performed. Selection of Emergency Medical Services Encounters The study included all EMS encounters in the NEMSIS database between January 2020 and December 2023 where prehospital buprenorphine administration was documented. Encounters included 9-1-1 responses, as well as non–9-1-1 expanded scope events such as elderly assistance, injury prevention, public education, and immunization programs, often delivered by mobile integrated healthcare programs. The breakdown of non–9-1-1 expanded scope event subcategories is not available within this dataset. Measures Our primary outcome was to evaluate trends in prehospital buprenorphine use over time and identify an inflection point in usage. We conducted a joinpoint regression of quarterly rates of use. Trends over time were evaluated and inflection points identified. Our secondary outcome was to evaluate patient demographics and encounter characteristics of prehospital buprenorphine usage. Patient demographics including sex, race, ethnicity, age, US Census division, and urbanicity were included. We evaluated the following encounter characteristics: level of care; type of service requested; EMS scene time; role person administering medication; primary impression; primary symptoms; and patient disposition. Additionally, buprenorphine dosages, number of doses, and response to medication were evaluated. Consistent with previous studies, we identified rates of patients who received both naloxone and buprenorphine in the same encounter to assess the use of buprenorphine in precipitated withdrawal. 10 All naloxone doses administered during the encounter were identified and compared with the time of buprenorphine administration to determine whether naloxone was provided before or after the initial dose of buprenorphine. Data Analysis We calculated quarterly rates of buprenorphine administration per year. We then performed joinpoint regression analysis to identify inflection points in prehospital buprenorphine administration. A segmented regression was fitted. Confidence intervals were calculated at 95%. We created a graph using RStudio. software (Posit PBC, Boston, MA). Patient demographics and EMS encounter characteristics for encounters involving buprenorphine administration were evaluated using descriptive statistics. We then performed a subdivision analysis between 9-1-1 response encounters and non–9-1-1 response encounters. We calculated rates of prehospital buprenorphine administration per 100,000 EMS encounters with patient contact within each US Census division over the time of the study. A map was created using RStudio showing rates of Volume 27, No. 6: November 2026
prehospital buprenorphine administration per census division. We produced the map using Albers equal-area conic projection. State level data were not available in NEMSIS for review. RESULTS Trends in National Prehospital Buprenorphine Use There were 167,221,959 total EMS encounters with patient contact in the dataset. Of those, 2,180 included EMS encounters with documented buprenorphine administration. There was a significant increase in the number of buprenorphine administrations starting in quarter 2 (Q2) of 2022 (Figure 1). The slope increased by 54 buprenorphine administrations per quarter [95% CI, 20-89] after Q2 of 2022 through 2023. Prior to Q2 of 2022, the slope increased by one administration of buprenorphine per quarter [95% CI, –1 to +3] from 2020 to Q1 of 2022. Patient Demographic and Regional Distribution of Buprenorphine Use There were 1,349 EMS encounters for male patients (62%) and 814 EMS encounters for female patients (37%) who received prehospital buprenorphine (Table 1). The mean age of patients was 37 years (standard deviation [SD] 9.8). Most buprenorphine administrations happened in urban areas (1,572 encounters, 72%), with lower rates in suburban (590 encounters, 27%), and rural areas (1 encounter, 0%). Patient race was documented for < 1% of the encounters and was therefore excluded from analysis. There were four prehospital buprenorphine administrations
Figure 1. Joinpoint regression of national prehospital buprenorphine quarterly administrations from 2020–2023 is shown in a retrospective study of emergency medical services encounters using the National EMS Information System database. An inflection point is present in Quarter 2 2022. EMS, emergency medical services; Q, quarter.
1585
Western Journal of Emergency Medicine
Prehospital Buprenorphine: A National Cross-Sectional Analysis
Chandran et al.
Table 1. Patient demographics and encounter geographics of emergency medical services encounters involving prehospital buprenorphine administration nationally between 2020 and 2023 in a retrospective study using the National EMS Information System database. Demographic
All
9-1-1
Non–9-1-1
Male
1,349 (62%)
724 (64%)
625 (59%)
Female
814 (37%)
386 (34%)
428 (41%)
37 (9.8)
38 (10.8)
37 (8.6)
South Atlantic
1,922 (88%)
872 (78%)
1,050 (100%)
Pacific
121 (6%)
121 (11%)
0
West South Central
104 (5%)
101 (9%)
3 (< 1%)
Middle Atlantic
27 (1%)
27 (2%)
0
Other (East North Central, West North Central, New England, West South Central, Mountain Divisions)
6 (< 1%)
4 (< 1%)
2 (< 1%)
Urban
1,572 (72%)
1,102 (98%)
470 (45%)
Suburban
590 (27%)
9 (1%)
581 (55%)
1 (< 1%)
0
1 (< 1%)
Patient sex, n (%)
Patient age in years, mean (SD) US Census Division, n (%)
Urbanicity, n (%)
Rural SD, standard deviation.
per 100,000 EMS encounters, with patient contact in the South Atlantic region far exceeding reported use in all other US Census divisions (< 1 prehospital buprenorphine administration/100,000 EMS encounters) (Figure 2). Approximately half (1,042, 48%) of all prehospital buprenorphine encounters within the dataset were noted to be public assistance encounters, which comprised most (> 99%) of the non–9-1-1 subdivision and were found to be exclusively from the South Atlantic region. Emergency Medical Services Encounter Characteristics for Prehospital Buprenorphine Administration As noted above, EMS encounters that included prehospital buprenorphine administration were split between 9-1-1 responses (1,125 encounters, 52%) and non–9-1-1 responses (1,055 encounters, 48%; Table 2). Within the non-9-1-1 subdivision, 1,042 of 1,055 encounters (> 99%) were for public assistance/other not listed. There were only nine encounters (< 1% of the non–9-1-1 subdivision) that were for other types of transfer including interfacility transports, mutual aid, medical transports, or intercepts. Most encounters were with advanced life support (ALS) personnel. A total of 1,155 encounters included paramedics (53%), and 1,008 encounters included community paramedicine paramedics (46%). Only 17 calls (0.8%) were listed as basic life support (BLS) personnel. The mean EMS scene time was 40.5 minutes (SD 25.5). A minority of the encounters resulted in transport to the hospital. Many encounters, (960, 44%) were “Patient Western Journal of Emergency Medicine
Treated, Released (per protocol)” with 174 (8%) “Patient Evaluated, No Treatment/Transport Required.” A total of 786 encounters (36%) were “Assist, Public” or “Assist, Unit.” During only 185 encounters (8%) patients were treated and transported by the EMS unit, with most transfers occurring after 9-1-1 calls. The most common primary impression was “Mental and behavioral disorders due to multiple drug use and use of other psychoactive substance” seen in 434 encounters (20%) and “Mental and behavioral disorders due to use of opioids” for
Figure 2. Rates of prehospital buprenorphine administration per 100,000 EMS emergency medical services encounters with patient contact between 2020 and 2023 for each US Census division in a retrospective study using the National EMS Information System database. Map produced using Albers equal-area conic projection. EMS, emergency medical services.
1586
Volume 27, No. 6: November 2026
Prehospital Buprenorphine: A National Cross-Sectional Analysis
Chandran et al.
Table 2. Emergency medical services encounter characteristics involving prehospital buprenorphine administration nationally between 2020 and 2023 in a retrospective study using the National EMS Information System database. EMS Encounter Characteristics
All
9-1-1
Non–9-1-1
Paramedic
1,155 (53%)
627 (56%)
528 (50%)
Community paramedicine paramedic
1,008 (46%)
486 (43%)
522 (50%)
EMT
12 (< 1%)
10 (1%)
2 (< 1%)
Community paramedicine EMT
5 (< 1%)
2 (< 1%)
3 (< 1%)
9-1-1 Response
1,125 (52%)
1,125 (100%)
0
Public assistance/other not listed
Level of care, n (%)
Type of service requested, n (%) 1,042 (48%)
0
1,042 (99%)
Interfacility transport
9 (< 1%)
0
9 (1%)
Mutual aid, intercept, medical transport
4 (< 1%)
0
4 (< 1%)
40.5 min (25.5)
36.5 min (8.5)
42.7 min (25.1)
Patient treated, released (per protocol)
960 (44%)
180 (16%)
780 (74%)
Public assistance
770 (35%)
640 (57%)
130 (12%)
Treated and transported by EMS
185 (8%)
180 (16%)
5 (< 1%)
Patient evaluated, no treatment/transport required
174 (8%)
54 (5%)
120 (11%)
Patient refused care and/or transport
52 (2%)
44 (4%)
8 (1%)
Other
39 (2%)
27 (2%)
12 (1%)
8 mg
973 (45%)
454 (40%)
519 (49%)
16 mg
786 (36%)
508 (45%)
278 (26%)
24 g
160 (7%)
122 (11%)
38 (4%)
12 mg
123 (6%)
11 (1%)
112 (11%)
4 mg
72 (3%)
7 (1%)
65 (6%)
2 mg
18 (1%)
5 (< 1%)
13 (1%)
20 mg
18 (1%)
0
18 (2%)
Other
30 (1%)
18 (2%)
12 (2%)
Improved
1,746 (80%)
832 (74%)
914 (87%)
Unchanged
358 (16%)
233 (21%)
125 (12%)
Worse
4 (< 1%)
2 (< 1%)
2 (< 1%)
Not recorded/not applicable
72 (3%)
58 (5%)
14 (1%)
Naloxone given prior to buprenorphine, n (%) 85 (4%) 82 (7%) EMS, emergency medical services; EMT, emergency medical technician; SD, standard deviation.
3 (< 1%)
EMS scene time, n (%) Mean (SD) Patient disposition, n (%)
1st Buprenorphine dosage given, n (%)
Response to medication (buprenorphine), n (%)
433 encounters (20%). Primary impression was not reported for 39% of encounters. Buprenorphine Dosage, Response, and Naloxone Rates The most common initial dose of buprenorphine was 8 mg (973 doses, 45%), followed by 16 mg (786 doses, 36%), and 24 mg (160 doses, 7%; Table 2). Most encounters had documentation of improvement after administration of first Volume 27, No. 6: November 2026
dose of buprenorphine (1,746 encounters, 80%), and only 4 patients (0.2%) were documented as worse after the first dose of buprenorphine. There were 222 encounters (10%) where more than one dose of buprenorphine was administered during the same encounter. Of the encounters where a second dose of buprenorphine was administered, 143 encounters (64%) documented improvement after the second dose administration, 36 (16%) documented unchanged response, 42
1587
Western Journal of Emergency Medicine
Prehospital Buprenorphine: A National Cross-Sectional Analysis (19%) lacking documented response, and one encounter (< 1%) with documented worse response after second dose. In only 85 encounters (4% of all EMS encounters, and 7% of 9-1-1 encounters), both naloxone and buprenorphine were administered during the same encounter (including documented bystander naloxone administration); 34 of those (42%) had received at least two doses of naloxone. In all these encounters, patients received naloxone prior to administration of buprenorphine according to the timing of medication administration, suggesting that buprenorphine had been given in the setting of naloxone-precipitated opioid withdrawal. DISCUSSION Given the mortality benefit shown in ED initiation of buprenorphine to treat people with OUD, the expansion of buprenorphine administration to the prehospital setting is a promising strategy to further reduce opioid-related deaths. The implementation of prehospital buprenorphine has increased nationally since its origins in 2019.8 We found an inflection point during 2022, with a rapid increase in quarterly buprenorphine administration. This is likely attributed to an increasing number of agencies implementing these programs in 9-1-1 systems and via community paramedicine.11,13 The patient demographics of those receiving buprenorphine is predominately male, median age range in the mid-30s, and mirrors the demographic of patients being treated for OUD in EDs nationally, showing an opportunity to engage this patient population in a similar way via prehospital intervention.21 This study provides insight into situations when prehospital buprenorphine is being administered, which there is scarce documentation of nationally. Indications for prehospital buprenorphine use have typically included administration after precipitated withdrawal from naloxone, which is used to reverse opioid overdose.10 By alleviating the symptoms of naloxone-precipitated withdrawal through buprenorphine administration, it is hypothesized that patients may be more likely to initiate treatment, continue treatment for dependence, and engage with recovery programs.22 Our work shows only a minority of 9-1-1 encounters (7%) are for patients given buprenorphine after EMS or bystander naloxone administration. There may be a limitation of underreporting of naloxone administration. This highlights a large area of improvement and opportunity for prehospital buprenorphine initiation. There were an estimated 1,000 naloxone administrations per 100,000 EMS events in 2016 for opioid overdose, far exceeding the rates of prehospital buprenorphine use from even the highest usage geographic areas in this study.2 This study also provides insight into the prevalence of prehospital buprenorphine programs nationally. A recent review from 2024 documented 19 US states with programs and estimated that approximately 62% of the buprenorphine delivered was via 9-1-1, with 46% delivered by community paramedics 24-48 hours after overdose.14 Given the number of encounters Western Journal of Emergency Medicine
Chandran et al. involving public assistance in documented in that review, there is likely a large percentage of prehospital buprenorphine administration occurring via community paramedicine outreach programs, although that is difficult to quantify given lack of clarity within the dataset. Community paramedicine outreach programs often include both methods of buprenorphine administration for patients in naloxone-precipitated withdrawal, and secondary pathways for patients with recent opioid use.13 Follow-up for patients who decline treatment or transport is variable depending on the community setting and substance userecovery infrastructure already in place. One study based in New Jersey looking at buprenorphine-equipped ambulances had a protocol to arrange next-day substance use follow-up for patients after suspected overdose events.23 A different EMS protocol in North Carolina included referrals to opioid treatment centers after prehospital buprenorphine administration. They also had an ability to continue dosing patients in the field by community paramedics for up to five days while awaiting a scheduled appointment.13 These teams can include community paramedics, peer recovery specialists, and social workers.11,13,23 We found that a minority of patients were transported to the hospital after treatment (only 16% of 9-1-1 encounters in this study). Without the touchpoint of the ED, EMS clinicians can play an important role in providing patients with resources and treatment for withdrawal on scene, which may increase the likelihood of starting and continuing in treatment. Prior work on community paramedicine initiation of medications for OUD showed that 64% of referred patients were still engaged in treatment at 30 days.13 Additionally, the ability to treat patients on scene for withdrawal may decrease ED utilization to provide immediate treatment for symptoms and reduce a barrier to treatment. However, barriers to prehospital buprenorphine implementation include patient refusal of medication, difficulty in locating patients for follow-up if patient is unhoused, insurance and telehealth barriers, and operational barriers.14 Additionally, longer than average on-scene times were noted (40 minutes in this study, compared to cited averages ranging from 14-17 minutes in prior EMS literature).24,25 This has implications on EMS operations and 9-1-1 staffing models. Most encounters had documentation of improved symptoms after buprenorphine administration, suggesting this is an effective and safe method for treating opioid withdrawal. Importantly, less than 1% of encounters had worse outcomes after administration of buprenorphine, indicated a low prevalence of buprenorphine-precipitated withdrawal. There is no standardization of starting dosages for prehospital buprenorphine, with EMS agencies largely adopting their own protocols.14 Nationally, there has been a recent push towards higher starting doses of buprenorphine, given the increasing prevalence of fentanyl in the nonmedical drug supply, which is associated with lower rates of future ED utilization.26 In this study, we found most starting dosages to be 8 mg and 16 mg,
1588
Volume 27, No. 6: November 2026
Prehospital Buprenorphine: A National Cross-Sectional Analysis
Chandran et al. which is in line with current recommendations. It is notable that 10% of patients received a second dose of buprenorphine after the initial dose. The response to a second dose of buprenorphine also showed continued high rates of documented improvement in condition (64%) with less than 1% documented as worse after administration, suggesting utility in sequential dosing. However, the optimal starting dosage and protocol for prehospital buprenorphine is still unknown and will likely vary based on indication (eg precipitated withdrawal). LIMITATIONS There are several limitations to this study. Although the NEMSIS database includes most EMS activations nationally, with over 50 million activations per year, not all EMS agencies participate in data collection. Further, nonemergency encounters such as an mobile integrated health or community paramedic visits may not be submitted to NEMSIS. These prehospital programs may document the details of the encounter outside of the EMS record, such as in their local hospital system electronic health record, limiting our ability to account for those administrations. Thus, it is likely that a portion of prehospital buprenorphine administrations were not included. Additionally, the study is limited to the characteristics provided in the NEMSIS database, therefore outcome data and nuanced analysis of the situations and encounters is not available for analysis. Although we analyzed the EMS clinician’s primary impression, the broad “primary impression” terms and missing primary impression data (39%) make it difficult to interpret the reason for EMS activation and buprenorphine administration per encounter. And because the number of encounters for opioid overdose was not evaluated in this analysis, the proportion of buprenorphine administrations per overdose could not be assessed. Additionally, the inclusion of all EMS encounters and not 9-1-1 only encounters likely led to an over-representation of the South Atlantic region in this dataset, given that all of the public assistance encounters, which was the majority of the non-9-1-1 encounters, came from that area. This may be secondary to geographic differences in documentation and coding within NEMSIS versus implementation and integration of mobile integrated health networks into NEMSIS records. It should be noted the public assistance encounters (majority of non–9-1-1 encounters) in the dataset includes a substantial portion of suburban data, with 9-1-1 only encounters being almost exclusively urban, and provides additional insight into prehospital buprenorphine use, which is why we have kept this within the dataset.
were for patients treated after 9-1-1 response, but few received naloxone prior to buprenorphine, suggesting an expansion of prehospital buprenorphine use from the original conception of use after precipitated withdrawal. Prehospital buprenorphine was documented to improve the patient’s condition for most encounters, with very few documented as having a poor response. The expanding scope of practice allowing EMS clinicians to engage in harm reduction strategies with prehospital buprenorphine may be an important opportunity to prevent opioid overdose deaths and connect patients to treatment. Further studies are needed to evaluate long-term patient outcomes.
Address for Correspondence: Kira Chandran, MD, Massachusetts General Hospital, Department of Emergency Medicine, 55 Fruit Street, Boston, MA 02114. Email: kchandran1@mgb.org. Conflicts of Interest: By the WestJEM article submission agreement, all authors are required to disclose all affiliations, funding sources and financial or management relationships that could be perceived as potential sources of bias. No author has professional or financial relationships with any companies that are relevant to this study. There are no conflicts of interest or sources of funding to declare. Copyright: © 2026 Chandran et al. This is an open access article distributed in accordance with the terms of the Creative Commons Attribution (CC BY 4.0) License. See: http://creativecommons.org/ licenses/by/4.0/
REFERENCES
CONCLUSION This retrospective study showed increased rates of prehospital buprenorphine usage across the US from 2020 to 2023, with a sharp increase in 2022. About half of encounters Volume 27, No. 6: November 2026
1. National Institute on Drug Abuse. Drug Overdose Deaths: Facts and Figures. Available at: https://nida.nih.gov/research-topics/trendsstatistics/overdose-death-rates#Fig1. Accessed February 27, 2025. 2. Cash RE, Kinsman J, Crowe RP, et al. Naloxone administration frequency during emergency medical service events—United States, 2012–2016. Morb Mortal Wkly Rep. 2019;67(31):850-853. 3. Rock P, Singleton M. EMS heroin overdoses with refusal to transport & impacts on ED overdose surveillance. Online J Public Health Inform. 2019;11(1). 4. Jacoves J, Mannerings A, Stader D, et al. Assessment of a countywide, pan-first responder take-home naloxone program in Denver, Colorado. JACEP Open. 2026;7(3):100357. 5. Levine M, Sanko S, Eckstein M. Assessing the risk of prehospital administration of naloxone with subsequent refusal of care. Prehosp Emerg Care. 2016;20(5):566-569. 6. Zozula A, Neth MR, Hogan AN, et al. Non-transport after prehospital naloxone administration is associated with higher risk of subsequent non-fatal overdose. Prehosp Emerg Care. 2022;26(2). 7. Weiner SG, Baker O, Bernson D, et al. One-year mortality of patients
1589
Western Journal of Emergency Medicine
Prehospital Buprenorphine: A National Cross-Sectional Analysis
Chandran et al.
treated with naloxone for opioid overdose by emergency medical
emergency medical services responses for older adults in the United
services. Subst Abus. 2022;43(1).
States. Prehosp Emerg Care. 2018;22(1).
8. Samples H, Nowels MA, Williams AR, et al. Buprenorphine after
18. National Highway Traffic Safety Administration, Office of EMS.
nonfatal opioid overdose: reduced mortality risk in Medicare disability
National EMS Information System (NEMSIS). https://nemsis.org.
beneficiaries. Am J Prev Med. 2023;65(1).
Accessed May 1, 2026.
9. Skains RM, Reynolds L, Carlisle N, et al. Impact of emergency
19. Ehlers J, Fisher B, Peterson S, et al. Description of the 2020
department–initiated buprenorphine on repeat emergency
NEMSIS public-release research dataset. Prehosp Emerg Care.
department utilization. West J Emerg Med. 2023;24(6):1010-1017.
2022;27(8):1-15.
10. Carroll GG, Wasserman DD, Shah AA, et al. Buprenorphine field
20. National Emergency Medical Services Information System (NEMSIS).
initiation of ReScue treatment by emergency medical services (Bupe
NEMSIS version 3 extended data definitions. Available at: https://
FIRST EMS): A case series. Prehosp Emerg Care. 2021;25(2).
nemsis.org/media/nemsis_v3/release-3.4.0/DataDictionary/
11. Hern HG, Lara V, Goldstein D, et al. Prehospital buprenorphine
PDFHTML/DEMEMS/index.html. Accessed February 27, 2025.
treatment for opioid use disorder by paramedics: First year results of
21. Herring AA, Rosen AD, Samuels EA, et al. Emergency department
the EMS buprenorphine use pilot. Prehosp Emerg Care. 2023;27(3).
access to buprenorphine for opioid use disorder. JAMA Netw Open.
12. Champagne-Langabeer T, Bakos-Block C, Yatsco A, et al.
2024;7(1):e2353771.
Emergency medical services targeting opioid use disorder: an
22. Herring AA. Postoverdose initiation of buprenorphine after naloxone-
exploration of current out-of-hospital post-overdose interventions.
precipitated withdrawal is encouraged as a standard practice in the
JACEP Open. 2020;1(6).
California Bridge Network of Hospitals. Ann Emerg Med.
13. Belden C, Kopak A, Coules C, et al. Building bridges to outpatient
2020;75(4):552-553.
treatment services for post-overdose care via paramedic
23. Carroll G, Solomon KT, Heil J, et al. Impact of administering
buprenorphine field initiation. J Subst Use Addict Treat.
buprenorphine to overdose survivors using emergency medical
2024;162:209364.
services. Ann Emerg Med. 2023;81(2):165-175.
14. Gormley MA, Moschella P, Pham T, et al. Implementation barriers of
24. Texas Department of State Health Services. Texas health data—
prehospital buprenorphine administration programs in the United
emergency medical service (EMS) 911 run times. Available at: https://
States: a scoping review. Prehosp Emerg Care. 2025;29(4):441-449.
healthdata.dshs.texas.gov/dashboard/injuries/ems-911-run-times.
15. D’Onofrio G, O’Connor PG, Pantalon MV, et al. Emergency
Accessed October 19, 2025.
department–initiated buprenorphine/naloxone treatment for opioid
25. Lawner BJ, Szabo K, Daly J, et al. Prehospital trauma scene and
dependence: a randomized clinical trial. JAMA. 2015;313(16).
transport times for pediatric and adult patients. West J Emerg Med.
16. National EMS Information System (NEMSIS). Request research data. Available at: https://nemsis.org/using-ems-data/request-research-
2020;21(2):455. 26. Axeen S, Pacula RL, Merlin JS, et al. Association of daily doses of
data/. Accessed February 27, 2025.
buprenorphine with urgent health care utilization. JAMA Netw Open.
17. Duong HV, Herrera LN, Moore JX, et al. National characteristics of
Western Journal of Emergency Medicine
2024;7(9):e2435478.
1590
Volume 27, No. 6: November 2026
Original Research
Factors Associated with Early ED Return Among Patients Discharged After Treatment for Alcohol Withdrawal Syndrome Blake Briggs, MD* Logan Smith, BS† Ryan Green, DO* Amirrez Nikbakht, BS* David Cline, MD‡
*University of Tennessee Health Science Center Knoxville, Division of Emergency Medicine, Knoxville, Tennessee † Universty of Tennessee Health Science Center Memphis, College of Medicine, Memphis, Tennessee ‡ Wake Forest University, School of Medicine, Winston-Salem, North Carolina
Section Editor: Cortlyn Brown, MD Submission history: Submitted February 22, 2026; Revision received May 14, 2026; Accepted May 16, 2026 Electronically published October 11, 2026 Full text available through open access at http://escholarship.org/uc/uciem_westjem DOI 10.5811/westjem.63088
Introduction: Alcohol withdrawal syndrome (AWS) is a frequent cause of emergency department (ED) visits, and some patients return soon after discharge. Identifying factors associated with shortterm ED return may inform targeted interventions. Our primary objective was to identify factors associated with 72-hour ED return and 30-day hospital admission among patients discharged after treatment for AWS. Methods: We conducted a retrospective review of 318 ED encounters for AWS at a single academic medical center from January 1, 2020, to December 31, 2023. Demographic, psychiatric, housing, insurance, and discharge pharmacology variables were collected. We evaluated ED pharmacologic treatment strategy and discharge taper prescriptions. The primary outcome measure was 72hour ED return, and the secondary outcome measure was hospital admission within 30 days. We compared groups using chi-square, Shapiro-Wilk, Fisher exact, and Mann–Whitney U tests. Variables with significant univariate associations were included in multivariable logistic regression, and results were reported as odds ratios (OR) with 95% confidence intervals. Results: Fourteen patients (4.4%) returned within 72 hours, and 32 patients (10.1%) were admitted within 30 days. On multivariable logistic regression, schizophrenia (OR, 8.59; 95% CI, 2.07-35.61), Medicaid insurance (OR, 4.43; 95% CI, 1.39-14.14), and anxiety (OR, 3.53; 95% CI, 1.10-11.39) were independently associated with increased 72-hour ED return. Homelessness was independently associated with higher 30-day admission (OR, 3.19; 95% CI, 1.26-8.07). Discharge tapers were not associated with either outcome. Conclusion: Among patients discharged after ED treatment for alcohol withdrawal syndrome, Medicaid insurance, anxiety, schizophrenia, and homelessness were associated with short-term return or admission. These findings suggest that social and psychiatric vulnerability may contribute to short-term ED reuse following discharge after AWS treatment. These results highlight opportunities to strengthen follow-up pathways and to address social determinants of health. Larger, multicenter studies are needed to clarify whether these associations are specific to AWS or reflect broader patterns of ED utilization. [West J Emerg Med. 2026;27(6)1591–1598.]
INTRODUCTION Alcohol use disorder affects nearly 29% of the US population over a lifetime.1 Among individuals with chronic Volume 27, No. 6: November 2026
alcohol use, nearly half will experience alcohol withdrawal syndrome (AWS) upon cessation.2 Alcohol withdrawal syndrome substantially contributes to emergency department 1591
Western Journal of Emergency Medicine
Early ED Return Factors in Patients Discharged After AWS Treatment (ED) resource utilization; based on national estimates, it accounts for roughly .28% of all ED visits, translating to nearly 400,000 encounters annually in the US.3,4 This patient population often requires close monitoring and repeated medication administration during ED treatment. The cyclical nature of alcohol dependence and withdrawal symptoms further complicate care. On average, adults require more than five attempts to achieve sustained abstinence, underscoring the potential for repeated withdrawal episodes and recurrent ED presentations.5 While several studies have examined characteristics of frequent ED users, few have specifically focused on patients discharged after treatment for AWS. A systematic review by Giannouchos et al found that patients with alcohol dependence who have publicly provided insurance and comorbid psychiatric illness are disproportionately represented among frequent ED users.6 However, this analysis did not examine short-term return visits following AWS treatment in the ED. Patients discharged after acute alcohol withdrawal management are at high risk for recurrence, facing complex clinical and social barriers.6 Alcohol use disorder is disproportionately associated with psychiatric illness, unstable housing, and limited access to outpatient care, all of which are known contributors to recurrent ED utilization across multiple patient populations. Because alcohol use disorder is a chronic and relapsing condition, short-term ED return after AWS treatment may reflect expected disease trajectory, barriers to outpatient management, or unmet symptom control rather than a discrete “failure” of ED care. This knowledge gap is directly aligned with current research priorities identified by the Society for Academic Emergency Medicine (SAEM) GRACE initiative. This initiative highlighted the need to identify ED subgroups that may benefit from adjunctive or monotherapy phenobarbital use, evaluate postdischarge outcomes, and identify implementation barriers.7 Accordingly, in this retrospective cohort study, we evaluated factors associated with AWS-related return encounters to identify potentially high-risk subgroups for follow-up and linkage to care. This study represents a secondary analysis of a previously published retrospective cohort evaluating ED treatment strategies for AWS.8 We examined psychiatric comorbidity, housing status, insurance type, and the prescription of phenobarbital or benzodiazepines at discharge. We hypothesized that return visits would be more likely among patients with psychiatric illness, unstable housing, lack of insurance, or those who did not receive a prescription for a pharmacologic taper. METHODS Study Design and Setting This study represents a secondary analysis of a previously published retrospective cohort evaluating ED outcomes among patients treated for AWS with phenobarbital or Western Journal of Emergency Medicine
Briggs et al. Population Health Research Capsule What do we already know about this issue? Patients discharged after emergency department (ED) alcohol withdrawal treatment may return early, but factors associated with short-term return are poorly defined. What was the research question? What factors are associated with 72-hour ED return after discharge for alcohol withdrawal syndrome? What was the major finding of the study? Schizophrenia had the highest odds of 72-hour return (OR, 8.59; 95% CI, 2.07-35.61; P = .003) and homelessness was independently associated with 30-day admission (OR, 3.19; 95% CI, 1.26-8.07). How does this improve population health? Identifying psychiatric and social risk factors may help target follow-up and reduce repeat ED use after alcohol withdrawal care.
benzodiazepines.8 The original study examined admission rates, ED length of stay, and treatment strategies across all AWS encounters. The current analysis focuses specifically on the subset of patients who were discharged from the ED after receiving intravenous (IV) pharmacologic treatment for AWS, with the objective of identifying factors associated with early ED return and subsequent hospital admission. We conducted the study at a single regional academic medical center and tertiary care referral center with an annual ED volume of approximately 79,000 visits. The institutional review board reviewed the protocol and deemed it exempt from full review due to minimal risk and use of deidentified data. Selection of Participants and Interventions We identified adult patients at least 18 years of age who presented to the ED between January 1, 2020, and December 31, 2023, using a structured query of the electronic health record (EHR). We identified cases through an administrative flag triggered by ordering the “ED alcohol withdrawal” order set. We selected this timeframe as a convenience sample to allow for seasonal variation and to reflect the first full year phenobarbital became available at our institution for AWS treatment. Inclusion required activation of the institutional AWS treatment pathway during the index ED encounter,
1592
Volume 27, No. 6: November 2026
Briggs et al.
Early ED Return Factors in Patients Discharged After AWS Treatment
although patients may have presented with concurrent medical complaints. For analysis, patients were categorized into three mutually exclusive exposure groups: phenobarbital-only (received IV phenobarbital but no benzodiazepines during the ED visit); benzodiazepine-only (received IV benzodiazepine but no phenobarbital); or combination therapy (received IV phenobarbital plus benzodiazepine during the same encounter). Encounters were categorized into phenobarbitalonly, benzodiazepine-only, or combination therapy groups based on medications administered during the index ED visit. Benzodiazepine administration was determined by the treating clinician and was not protocolized to a fixed cumulative dose. Phenobarbital dosing followed the institutional treatment pathway described above. The decision to administer phenobarbital, benzodiazepines, or combination therapy was at the discretion of the treating emergency physician. Phenobarbital dosing at our institution followed a standardized pathway consisting of an initial 260 mg intravenous (IV) infusion administered over 30 minutes, with an optional additional 130 mg IV dose administered 30 minutes later at clinician discretion. The following benzodiazepines were available in our ED: lorazepam (IV, intramuscular (IM)); diazepam (IV, IM); and midazolam (IV). These were administered according to clinician judgment and typical practice. Any dose of a given medication from the “ED alcohol withdrawal” order set was considered an exposure for the purpose of analysis. Inclusion criteria were as follows: receipt of IV phenobarbital; IV benzodiazepine; or both in the ED; and treatment for AWS with subsequent discharge from the ED. Admission decisions were made at clinician discretion based on overall clinical severity, symptom progression, comorbidities, social factors, and anticipated outpatient management needs, consistent with routine ED practice. Exclusion criteria included the following: patients younger than 18 years of age; encounters managed primarily by the trauma surgery service following trauma activation; cases in which patients were not treated for AWS despite order set use, patients intubated prior to receiving any AWS-directed medications; and those admitted to the hospital. Patients treated exclusively with oral regimens were excluded because these encounters generally represented lower-acuity AWS presentations and had less standardized documentation of symptom severity and treatment administration. Gabapentinbased withdrawal protocols were not used within the institutional AWS pathway during the study period and were therefore not analyzed separately. In cases where patients were discharged with a prescription to manage withdrawal symptoms, these were administered according to clinician judgment and typical practice. Specifically, phenobarbital tapers were typically four-day courses: Day 1, 60 mg four times daily (QID); Day 2, 60 mg three times daily (TID); Day 3, 60 mg twice daily (BID); and Day 4, 30 mg BID. In some cases, a fifth day of 30 Volume 27, No. 6: November 2026
mg BID was added at the clinician’s discretion. Benzodiazepine prescriptions were most commonly for chlordiazepoxide, with variable dosing regimens. Some patients received as-needed dosing of 25–50 mg every 4–8 hours for approximately 3–5 days. Others received a scheduled taper, typically: Day 1, 50 mg TID; Days 2–3, 25 mg BID; and Day 4, a single 25 mg dose. Insurance status was determined from patient intake forms completed at registration. For simplicity and to allow for structured data analysis, insurance type was grouped into the following classifications: private, Medicare, Medicaid, and uninsured. Before data abstraction, we consulted the hospital’s registration and billing departments to ensure consistent grouping of insurance carriers into these predefined classifications. Housing status was assessed from the same intake documentation and verified with case management or social work notes when available. Psychiatric comorbidity was identified using either a previously documented diagnosis in the EHR or the presence of a corresponding International Classification of Diseases, 10th Rev, diagnosis code during the index encounter. Prior to data abstraction, the analysis focused on commonly documented psychiatric conditions including anxiety, depression, and schizophrenia-spectrum disorders to improve consistency of retrospective abstraction within this cohort. The alcohol withdrawal order set was fully implemented in 784 ED encounters during the study period. Of these, seven of the 784 visits were excluded as the patient left against medical advice prior to a determination of safe discharge or admission by the treating emergency physician. Of the remaining 777 visits, 459 were admitted. Therefore, our final study cohort included 318 patient encounters for alcohol withdrawal management who were discharged from the ED (Figure 1). This study cohort represents a selected subgroup of AWS encounters discharged after IV treatment and does not reflect the total number of alcohol-related ED presentations within the health system during the study period.
Figure 1. Flow diagram of patient selection in a retrospective cohort study evaluating factors associated with 72-hour emergency department return and 30-day hospital admission among patients treated for alcohol withdrawal syndrome. AMA, against medical advice; ED, emergency department.
1593
Western Journal of Emergency Medicine
Early ED Return Factors in Patients Discharged After AWS Treatment Measurements Strengthening the Reporting of Observational Studies in Epidemiology guidelines were followed to ensure adequate data collection and analysis.9 This chart review followed recommended methodological standards for retrospective medical record review studies as described by Worster and Bledsoe, including use of standardized data abstraction forms, trained abstractors, and predefined variable definitions. We developed and pilot-tested a standardized data abstraction form, along with a study manual detailing explicit variable definitions. Variables for this analysis included demographics, active and historical mental health conditions, insurance status, housing status, medication exposures, disposition, and return visits. We selected variables based on prior literature evaluating return ED visits and clinically relevant factors reliably identifiable through retrospective chart review. Abstractor training and adjudication procedures followed published recommendations for medical record review.11 We followed broadly accepted literature in emergency medicine regarding defining variables, structured abstraction forms, and blinded reabstraction to reduce bias, enhance validity and interobserver reliability.12,13 Abstractors completed human subjects research training and one-on-one orientation sessions with the primary study investigator (BB) prior to beginning abstraction. Initial chart reviews were directly observed, with ongoing meetings to address uncertainties. To reduce bias, a senior abstractor independently rereviewed charts for key variables, with discrepancies adjudicated by the primary investigator. Cases with unresolved uncertainty or missing key data after adjudication were excluded. No imputation was performed. Outcomes The primary outcomes were (1) return to the ED within 72 hours for AWS and (2) hospital admission within 30 days for AWS following the index ED visit. The 72-hour ED return time was selected to evaluate short-term recurrence following acute withdrawal treatment and represents a commonly used timeframe in emergency medicine outcomes research, while 30-day admission was selected to assess broader postdischarge healthcare utilization and clinical deterioration. A return encounter was defined as any subsequent ED visit at our institution or a participating regional facility following the index visit. Return visits were further categorized as occurring within 0–3 days or an admission within 30 days after the index visit. We limited return encounters and admissions to visits related to AWS. To capture out-of-network returns, abstractors queried the East Tennessee Health Information Network, a regional health information exchange that provides access to encounter data from hospitals and clinics within a 60-mile radius.14 Statistical Analysis We summarized categorical variables as frequencies and Western Journal of Emergency Medicine
Briggs et al.
percentages. For categorical comparisons, chi-square or Fisher exact tests were used, as appropriate, and unadjusted odds ratios (OR0 with 95% CI were calculated for significant associations. For continuous variables, independent-samples t-tests were used for normally distributed data and Mann– Whitney U tests for nonnormally distributed data. A two-sided α value of .05 assumed statistical significance, and all analyses were performed using SPSS, version 31 (IBM Corp). Because our primary aim was to determine which variables were independently associated with short-term return, only factors associated with significant univariate associations were included in the multivariable model to avoid overfitting. We constructed separate logistic regression models for 72-hour ED return and 30-day hospital admission. RESULTS Demographics and Clinical Characteristics A total of 318 patients met inclusion criteria, with a 72-hour ED return rate for alcohol withdrawal of 14 patients (4.4%) and a 30-day admission rate for 32 patients (10.1%). The 72-hour ED return rate was 3.3% in women (2/61) and 4.7% in men (12/257; P = 1.00). The 30-day admission rate was 8.2% in women (5/61) and 10.5% in men (27/257; χ² (1, n = 318) = .29, P = .59). Across race groups, the 72-hour ED return rate was 5.3% in Black patients (1/19), 0% in Latino (0/2) and Native American patients (0/1), and 4.4% in White patients (13/296; χ² (3, n = 318) = 0.30, P = .96). The corresponding 30-day admission proportions for these groups were 21.1% (4/19), 0% (0/2), 0% (0/1), and 9.5% (28/296), respectively (χ² (3, n = 318) = 2.75, P = .43). Mental Health Conditions Patients with anxiety had a significantly higher 72-hour return rate (8.9%, 7/79) compared to those without anxiety (2.9%, 7/239; χ²(1, n = 318) = 4.96, P = .03; OR = 3.22, 95% CI, 1.09-9.49), but no difference in 30-day admission (11.4%, 9/79 versus 9.6%, 23/239, P = .65). Schizophrenia was also associated with increased 72-hour return (22.2%, 4/18 versus 3.3%, 10/300; P = .005; OR = 8.29, 95% CI, 2.31-29.3) without a difference in 30-day admission (16.7%, 3/18 versus 9.7%, 29/300, P = .41). Depression was not significantly associated with either outcome, with P = .27 for 72-hour return and P = .06 for 30-day admission. Similarly, mood disorder was not significant for 72-hour return (P = .38) or 30-day admission (P = 1.00). Posttraumatic stress disorder showed no significant association, with P = .08 for 72-hour return and P = .28 for 30-day admission. Neither was suicidal ideation significant for either outcome (P = 1.00 for 72-hour return; P = .56 for 30-day admission). Insurance and Housing Medicaid coverage was associated with a higher 72-hour return rate (11.9%, 7/59 versus 2.7%, 7/259; χ² (1, n = 318) = 9.58, P = .002; OR, 4.85; 95% CI, 1.63-14.40), but not 30-day
1594
Volume 27, No. 6: November 2026
Early ED Return Factors in Patients Discharged After AWS Treatment
Briggs et al. Table 1. Multivariable logistic regression analysis of factors associated with 72-hour emergency department return in a retrospective cohort of patients treated for alcohol withdrawal syndrome. Parameter
Odds Ratio
95% CI
P value
Schizophrenia
8.59
2.07-35.61
.003*
Medicaid insurance
4.43
1.39-14.14
.01*
Anxiety
3.53
1.10-11.39
.03*
Table 2. Multivariable logistic regression analysis of factors associated with 30-day hospital admission in a retrospective cohort of patients treated for alcohol withdrawal syndrome. Odds Ratio
95% CI
P value
Homelessness
Parameter
3.18
1.26-8.07
.01*
Patient depression
1.70
0.79-2.69
.18
*Statistically significant results (P < .05).
*Statistically significant results (P < .05).
respectively; χ² = 1.04, P = .59). These findings were consistent with the results of our previously published cohort study, which showed similar return rates across treatment groups.
admission (10.2%, 6/59 versus 10.0%, 26/259, P = .98). Housing status was significantly associated with 30-day admission, with homeless patients having a 25.0% (8/32) admission proportion versus an 8.4% (24/286) proportion for housed patients (χ² (1, n = 318) = 8.77, P = .003; OR, 3.64; 95% CI, 1.48-8.98). We found no difference in 72-hour return between these groups (3.1%, 1/32 versus 4.5%, 13/286, P = 1.00). Private insurance was not significantly associated with either outcome, with P = 1.00 for 72-hour return and P = .30 for 30-day admission. Similarly, Medicare was not significant for 72-hour return (P = 1.00) or 30-day admission (P = .56). Uninsured status showed no significant association, with P = .07 for 72-hour return and P = .30 for 30-day admission. Benzodiazepine and Intravenous Phenobarbital Use When encounters were grouped by treatment strategy (phenobarbital-only, benzodiazepine-only, or combination therapy), there were no significant associations with either 72-hour ED return (4.0%, 1.8%, and 10.5%, respectively; χ² = 3.72, P = .16) or 30-day admission (8.9%, 12.5%, and 13.2%,
Figure 2. Adjusted odds ratios for factors associated with 72-hour emergency department return and 30-day hospital admission after treatment for alcohol withdrawal syndrome. ED, emergency department.
Volume 27, No. 6: November 2026
Multivariable Analysis We used multivariate regression analysis to determine whether potential confounding factors explained the association of our measured variables with admission. Table 1 presents the multivariable logistic regression results evaluating factors associated with 72-hour ED return among patients treated for AWS. Variables entered into the model were those with significant univariate associations. Schizophrenia (OR, 8.59; 95% CI, 2.07-35.61), Medicaid insurance (OR, 4.43; 95% CI, 1.39-14.14), and anxiety (OR, 3.53; 95% CI, 1.1011.39) remained independently associated with 72-hour ED return. Table 2 summarizes the multivariable logistic regression examining factors associated with 30-day hospital admission following ED discharge for AWS. Factors with significant association with admission on univariate analysis (or near significant association in the case of depression, P = .06) were entered into the model. Homelessness remained independently associated with 30-day admission (OR, 3.19; 95% CI, 1.268.07), whereas depression did not reach statistical significance. Figure 2 summarizes the adjusted ORs and 95% CIs from the multivariable logistic regression analyses for factors associated with 72-hour ED return and 30-day hospital admission following ED discharge for AWS. DISCUSSION In this single-center cohort of 318 patients discharged after treatment for AWS, we identified social and psychiatric factors, not pharmacologic strategy, as the primary factors associated with early ED return and hospital admission. Patients with Medicaid insurance were more likely to return to the ED within 72 hours, consistent with prior studies demonstrating that publicly insured patients face greater barriers to timely outpatient addiction care.⁶,¹⁵ Low socioeconomic status and limited access to longitudinal treatment likely contribute to this pattern.16 Uninsured patients did not show higher short-term return rates, a finding that may reflect financial deterrents to ED utilization rather than
1595
Western Journal of Emergency Medicine
Early ED Return Factors in Patients Discharged After AWS Treatment improved access to care. Prior literature examining short-term outcomes after ED treatment of AWS is limited. One of the largest cohorts to date is the study by Lebin et al, which evaluated approximately 470 ED patients treated for AWS and examined return encounters primarily in relation to treatment strategy (phenobarbital versus benzodiazepines).17 In comparison, our study of 318 discharged encounters represents one of the largest cohorts evaluating factors associated with early ED return and 30-day hospital admission following AWS treatment. Unlike prior studies that focuses primarily on pharmacologic management, our analysis examined patient-level vulnerability, including psychiatric comorbidity and social determinants of health. Other literature addressing ED revisits after alcohol-related presentations has emphasized the importance of withdrawal severity, mental illness, unstable housing, and barriers to follow-up care, supporting the associations observed in this cohort.3,18 These prior studies are limited in scope, with some being narrative reviews or commentaries on revisits, rather than a true retrospective, single-cohort investigation. Our findings also align with the work of Scheuermeyer et al, who reported that patients presenting to the ED with alcohol withdrawal or alcohol-related conditions frequently return for subsequent care and often face substantial psychiatric and social vulnerability.19 However, unlike the broader alcohol-related ED cohort described by Scheuermeyer et al, our study focused specifically on patients discharged after treatment for AWS and evaluated AWS-related return encounters and subsequent hospital admission. The 72-hour ED return rate in our cohort (4.4%) was lower than the 15% one-week revisit rate reported by Scheuermeyer et al. Several factors may explain this difference. First, our study evaluated a narrower 72-hour outcome window, whereas Scheuermeyer et al examined revisits occurring within seven days of discharge. Additionally, our cohort was limited to patients discharged after IV treatment for AWS and evaluated AWS-related return encounters specifically, while the Scheuermeyer cohort included a broader population of alcohol withdrawal and alcohol-related ED presentations. Differences in healthcare systems, institutional treatment pathways, and unmeasured withdrawal severity may have also contributed to the differing revisit rates. Homelessness was not associated with early ED return but was linked to increased 30-day hospital admission. Our findings suggest that acute relapse or social instability often escalates to inpatient care over a longer horizon. These findings suggest that housing instability may be associated with increased healthcare utilization following ED discharge for AWS. Among psychiatric comorbidities, anxiety and schizophrenia were independently associated with early return, aligning with previous literature reporting that frequent ED users have a disproportionate burden of psychiatric illness.⁶ The absence of a parallel increase in 30-day admissions suggests an opportunity for improved outpatient Western Journal of Emergency Medicine
Briggs et al.
psychiatric linkage and postdischarge support to reduce short-term ED recidivism. These associations remained significant in multivariable logistic regression, indicating that Medicaid insurance, schizophrenia, and anxiety were independently associated with 72-hour return after adjusting for other factors. Likewise, homelessness was independently associated with 30-day admission. The persistence of these associations after adjustment suggests that these social and psychiatric variables exert effects that are not explained by age, sex, or comorbidity distribution but instead reflect true underlying risk factors for short-term recidivism. These associations may reflect broader patterns of ED utilization and structural vulnerability rather than mechanisms unique to alcohol withdrawal syndrome alone. Neither discharge prescription tapers, nor ED IV medication strategy significantly affected return or admission outcomes. When categorized by phenobarbital-only, benzodiazepine-only, or combination therapy, no differences were observed in 72-hour ED return or 30-day readmission rates. These findings mirror our previously published phenobarbital outcomes study and reinforce that social and psychiatric determinants, rather than pharmacologic regimens, showed stronger associations with short-term outcomes in this patient cohort. While medication choice is a critical component of acute stabilization, postdischarge outcomes in these patients appear to depend more on systemic factors such as access to follow-up care, psychiatric comorbidity, and housing stability. Per institutional practice, patients presenting to the ED with alcohol use disorder or AWS were routinely provided discharge resources including contact information for outpatient addiction clinics, inpatient rehabilitation programs, and community detoxification services. During weekday daytime hours, ED social workers were available to assist with disposition planning, facilitate referral to inpatient or outpatient treatment programs, and provide additional substance use resources when appropriate. To our knowledge, this is the first study to specifically examine short-term outcomes in patients with AWS discharged from the ED. Our results expand the evidence for ED management of AWS by identifying high-risk subgroups. These high-risk patients—including those who have been diagnosed with psychiatric illness, are covered by Medicaid insurance, and are experiencing homelessness—may benefit from enhanced discharge planning and coordinated addiction or social services. These findings indicate that social and psychiatric factors demonstrated stronger associations with return encounters than ED pharmacologic treatment strategy. Effective interventions could come more from improved continuity of care, access to addiction resources, and stabilization of social determinants. These findings directly align with the key priorities outlined by the SAEM GRACE initiative, which has called for rigorous, patient-centered research in AWS.7 These priorities
1596
Volume 27, No. 6: November 2026
Briggs et al.
Early ED Return Factors in Patients Discharged After AWS Treatment
include identifying patient subgroups most likely to benefit from adjunctive or monotherapy phenobarbital, understanding postdischarge outcomes, and assessing barriers to implementation. Our findings suggest that recurrence risk after ED discharge is driven primarily by social determinants and comorbidity rather than treatment regimen, which supports the GRACE agenda and underscores the need for interventions beyond pharmacologic management to improve outcomes in this population. Future research should prioritize linkage to outpatient addiction and social services for outcome measurements, as well as multicenter analysis for further validation of this study’s findings. Additional studies are needed to better evaluate the role of outpatient pharmacologic interventions.
insurance, anxiety, and schizophrenia-spectrum disorders were associated with return within 72 hours. Homelessness was associated with a higher rate of 30-day hospital admission. Pharmacologic discharge tapers were not associated with differences in either short-term ED return or 30-day admission. These findings should be interpreted within the limitations of a single-center retrospective study but suggest that social and psychiatric factors may play a greater role in postdischarge outcomes than medication strategy alone. Future multicenter work is needed to confirm these associations and to explore interventions that strengthen outpatient follow-up and address social determinants of health in this high-risk population.
LIMITATIONS This study has several limitations. It was conducted at a single academic center, which may limit generalizability to other settings. The relatively small number of outcome events limited model complexity and may reduce external validity and precision of estimated associations. The retrospective design introduces potential confounding and selection bias, since physician preference likely influenced who received a discharge taper and which regimen was chosen. Benzodiazepine selection and cumulative dosing varied between encounters and were not standardized or converted into dose-equivalent comparisons, which may have limited interpretation of treatment strategy analyses. There was heterogeneity among the taper prescriptions, including variations in dosage and duration. Medication adherence postdischarge was not measured, and the sample sizes were small, limiting statistical power. Structured outpatient followup data were unavailable, constraining assessment of longterm outcomes beyond return visits captured in the regional health information network. This study evaluated psychiatric comorbidities documented at discharge; however, the severity of the underlying psychiatric illness was not captured. Additional psychiatric conditions, including schizoaffective disorder and bipolar disorder with psychotic features, were not separately analyzed, which may limit characterization of psychiatric comorbidity within the cohort. Social determinants such as housing instability may also have influenced clinician disposition decisions, potentially affecting which patients were discharged versus admission. Finally, although we used the East Tennessee Health Information Network to capture return visits across regional hospitals, some return encounters may have occurred outside the network and gone unrecorded. Collectively, these limitations mean our findings should be viewed as exploratory rather than definitive.
Address for Correspondence: Blake Briggs, MD, University of Tennessee Health Science Center Knoxville, Division of Emergency Medicine, 1924 Alcoa Highway, Suite U-11, Knoxville, TN 37920. Email: bbriggs1@utmck.edu.
CONCLUSION Among patients discharged from the ED after treatment for alcohol withdrawal syndrome, variables such as Medicaid
predictors of adult frequent emergency department users in the
Volume 27, No. 6: November 2026
Conflicts of Interest: By the WestJEM article submission agreement, all authors are required to disclose all affiliations, funding sources and financial or management relationships that could be perceived as potential sources of bias. No author has professional or financial relationships with any companies that are relevant to this study. There are no conflicts of interest or sources of funding to declare. Copyright: © 2026 Briggs et al. This is an open access article distributed in accordance with the terms of the Creative Commons Attribution (CC BY 4.0) License. See: http://creativecommons.org/ licenses/by/4.0/
REFERENCES
1597
1. Kranzler HR. Overview of alcohol use disorder. Am J Psychiatry. 2023;180(8):565-572. 2. Wood E, Albarqouni L, Tkachuk S, et al. Will this hospitalized patient develop severe alcohol withdrawal syndrome? The rational clinical examination systematic review. JAMA. 2018;320(8):825-833. 3. Gottlieb M, Chien N, Moyer E, et al. Alcohol withdrawal syndrome presentations to emergency departments in the United States from 2015 to 2023. Acad Emerg Med. 2025;32(7):785-791. 4. Cairns C, Kang K. National Hospital Ambulatory Medical Care Survey: 2022 Emergency Department Summary Tables. 2022. Available at: https://ftp.cdc.gov/pub/Health_Statistics/NCHS/Dataset_ Documentation/NHAMCS/doc22-ed-508.pdf. Accessed July 21, 2025. 5. Kelly JF, Greene MC, Bergman BG, et al. How many recovery attempts does it take to successfully resolve an alcohol or drug problem? Estimates and correlates from a national study of recovering US adults. Alcohol Clin Exp Res. 2019;43(7):1533-44. 6. Giannouchos TV, Kum HC, Foster MJ, et al. Characteristics and United States: A systematic literature review. J Eval Clin Pract. 2019;25(3):420-433.
Western Journal of Emergency Medicine
Early ED Return Factors in Patients Discharged After AWS Treatment 7. Punia K, Scott W, Manuja K, et al. SAEM GRACE: Phenobarbital for
Briggs et al.
Reducing bias in emergency medicine chart review studies. Ann
alcohol withdrawal management in the emergency department: a
Emerg Med. 2014;64(3):292-298.
systematic review of direct evidence. Acad Emerg Med.
14. East Tennessee Health Information Network. What We Do. Accessed
2024;31(5):481-492.
July 21, 2025. Available at: https://www.ethin.org/what-we-do/.
8. Briggs B, Smith L, Yates N, et al. Fewer admissions, shorter stays:
15. DuBard CA, Yow A, Bostrom S, et al. Racial/ethnic differences in
phenobarbital use for alcohol withdrawal in the emergency
quality of care for North Carolina Medicaid recipients. N C Med J.
department. Acad Emerg Med. 2026;33(2):e70170.
2009;70(2):96-101.
9. von Elm E, Altman DG, Egger M, et al. Strengthening the reporting of
16. McMaughan DJ, Oloruntoba O, Smith ML. Socioeconomic status and
observational studies in epidemiology (STROBE) statement:
access to healthcare: interrelated drivers for healthy aging. Front
Guidelines for reporting observational studies. J Clin Epidemiol.
Public Health. 2020;8:231.
2008;61(4):344-349.
17. Lebin JA, Mudan A, Murphy CE, et al. Return encounters in
10. Worster A, Bledsoe RD, Cleve P, et al. Reassessing the methods of
emergency department patients treated with phenobarbital versus
medical record review studies in emergency medicine research. Ann
benzodiazepines for alcohol withdrawal. J Med Toxicol. 2022;18(1):4-
Emerg Med. 2005;45(4):448-451.
10.
11. Worster A, Haines T. Advanced statistics: understanding medical
18. Wolf C, Curry A, Nacht J, et al. Management of alcohol withdrawal in
record review (MRR) studies. Acad Emerg Med. 2004;11(2):187-192.
the emergency department: current perspectives. Open Access
12. Gilbert EH, Lowenstein SR, Koziol-McLain J, et al. Chart reviews in
Emerg Med. 2020;12:53-65.
emergency medicine research: Where are the methods? Ann Emerg
19. Scheuermeyer FX, Lane D, Grunau B, et al. Risk factors associated
Med. 1996;27:305-308.
with 1-week revisit among emergency department patients with
13. Kaji AH, Schriger D, Green S. Looking through the retrospectoscope:
Western Journal of Emergency Medicine
1598
alcohol withdrawal. CJEM. 2023;25(2):150-156.
Volume 27, No. 6: November 2026
Original Research
Machine Learning Algorithms for Predicting Psychostimulant Intoxication in Emergency Department Patients: A Multicenter Study Jiun-Hao Yu, MD, PhD*†‡ Yueh-Peng Chen, PhD§||º Chih-Huang Hsieh, MD* Yu-Jang Su, MD‡# Hsien-Yi Chen, MD¶** Chih-Chuan Lin, MD¶** Authors continued at end of article
*China Medical University Hsinchu Hospital, Department of Emergency Medicine, Hsinchu, Taiwan † Chang Gung University, Graduate Institute of Management, Taoyuan City, Taiwan ‡ Yuanpei University of Medical Technology, Hsinchu, Taiwan § Chang Gung University, Master of Science Degree Program in Innovation for Smart Medicine, Taoyuan, Taiwan Institutions continued at end of article
Section Editor: Emad Awad, PhD Submission history: Submitted March 12, 2026; Revision received July 9, 2026; Accepted July 11, 2026 Electronically published October 18, 2026 Full text available through open access at http://escholarship.org/uc/uciem_westjem DOI 10.5811/westjem.63917
Introduction: Psychostimulant detection rates among emergency department (ED) patients presenting with suspected substance intoxication are low and are influenced by limited access to confirmatory testing, insufficient clinical information, and variability in physician experience. These challenges often result in high false-positive rates and unnecessary resource use. We hypothesized that machine learning (ML) algorithms could maintain reliable diagnostic performance across a temporal validation cohort and perform comparably to physicians with varying experience levels. Methods: This multicenter study prospectively enrolled ED patients with suspected substance intoxication between March 2019 and January 2020. We chronologically partitioned data into a training set (March–October 2019) and a temporal validation cohort (November 2019–January 2020) to assess model generalizability. After determining psychostimulant intoxication via liquid chromatography-mass spectrometry from urine samples, we trained the ML algorithms using the confirmed positive cases. The primary outcome was the diagnostic discrimination of the models, measured by the area under the receiver operating characteristic curve (AUC) in the temporal validation cohort. Secondary outcomes included model accuracy, the Youden index, and a comparative assessment of sensitivity and specificity relative to five physicians of varying experience levels. Results: Among 1,382 patients (mean age 43.8 [standard deviation 19.2] years; 55.3% male), 302 patients (21.9%) had confirmed psychostimulant intoxication, primarily involving (meth)amphetamines (134 [44.4%]), cathinones (107 [35.4%]), and ketamine (97 [32.1%]). In the temporal validation cohort (n = 382), the ML models demonstrated consistent performance, with AUCs ranging from 0.786 to 0.836. The primary outcome was met by the top-performing extreme gradient boosting (XGB) model (AUC, 0.836, 95% CI, 0.785-0.882; accuracy, 0.866 (95% CI, 0.838-0.895); and Youden index, 0.590 (95% CI, 0.480-0.694). To evaluate secondary outcomes, the XGB model’s predictive accuracy was evaluated against 5 emergency physicians. The model surpassed the junior emergency physicians in both specificity (0.910 vs 0.633-0.867) and sensitivity (0.681 vs 0.500-0.633); its specificity was comparable to that of the senior emergency physicians (0.900-0.933). Conclusion: Machine learning models provide reliable diagnostic utility for identifying psychostimulant intoxication, achieving performance comparable to senior emergency physicians. While moderate sensitivity (0.389–0.708) limits their role as standalone rule-out tools, their high specificity provides a standardized tool to assist clinical decision-making and reduce diagnostic uncertainty in the fast-paced ED setting. [West J Emerg Med. 2026;27(6)1599–1610.]
Volume 27, No. 6: November 2026
1599
Western Journal of Emergency Medicine
Machine Learning Algorithms for Predicting Psychostimulant Intoxication INTRODUCTION The global increase in the use of both traditional and new psychoactive substances poses significant public health concerns.1 Many of these substances are psychoactive stimulants that consist of diverse compounds, which can induce various effects other than sympathomimetic toxidromes2 and are often designed to elude standard toxicological screens.3 While commonly used screening tools such as enzyme-linked immunosorbent assays (ELISA) may exhibit cross-reactivity among a range of synthetic compounds,4,5 the gold standard test, liquid chromatographymass spectrometry (LC-MS/MS), often requires several days for results and is only available in select hospitals. Current symptom-based approaches for identifying psychostimulant intoxication often result in high false-positive rates, as evidenced by the Taiwan Emergency Department Drug Abuse Surveillance (TEDAS) project, which reported a substance detection rate of only 25.5% via LC-MS/MS.6 Clinical information that physicians rely on to identify cases, such as patient history, symptoms, and initial laboratory results, can be used as input for a machine learning (ML) algorithm to deliver real-time predictions. By ruling out most negative cases, the algorithm could minimize unnecessary confirmatory testing and expert consultations, allowing emergency department (ED) resources to focus on highlikelihood patients. This integration may enhance diagnostic precision, optimize ED efficiency, and support less experienced physicians in managing suspected cases of psychostimulant intoxication. Machine learning can address these challenges by analyzing large datasets, recognizing complex patterns,7 and identifying cases that might be missed by physicians.8 This approach can trigger alarms for suspected cases, enabling physicians to consult with toxicologists and conduct confirmatory testing. The datasets used to train ML models often integrate domain expertise,9,10 enriching the training data with expert insights to increase the accuracy of ML algorithms. Consequently, these algorithms can serve as valuable tools to assist frontline physicians in identifying suspected cases of psychostimulant intoxication. Prior toxicology research has primarily applied ML for exploring the structures of new psychoactive substances via LC-MS/MS spectra,11 recognizing toxidromes based solely on physical examination findings8 and predicting risk and stratification related to opioid overdose.12 However, data on the use of ML for predicting psychostimulant toxicity are lacking, highlighting an area for further study. We hypothesized that ML algorithms could serve as a robust decision-support tool for identifying psychostimulant intoxication during initial ED evaluations. Specifically, we predicted that these algorithms would maintain reliable diagnostic performance across a temporal validation cohort and demonstrate superior overall accuracy and specificity compared to emergency physicians of varying experience Western Journal of Emergency Medicine
Yu et al. Population Health Research Capsule
What do we already know about this issue? Psychostimulant intoxication is difficult to recognize in the emergency department (ED) due to overlap with many medical and psychiatric conditions. What was the research question? Can machine learning reliably identify psychostimulant intoxication in the ED? What was the major finding of the study? Extreme gradient boosting achieved an area under the curve of 0.836 (95% CI, 0.7850.882) with 91.0% specificity. How does this improve population health? Highly specific machine learning algorithms offer a standardized diagnostic benchmark, reducing clinical variability and optimizing resource use.
levels, thereby mitigating diagnostic anchoring in fast-paced clinical environments. METHODS Study Design and Setting This prospective study was conducted in the EDs of 10 hospitals across six major medical systems in Taiwan from March 2019 to January 2020, with study protocols approved by the institutional review boards of each system: China Medical University Hospitals (CMUH110REC3-038); Chang Gung Memorial Hospitals (202001418B0); National Taiwan University Hospitals (201711102RIND); Hualien Tzu Chi Hospitals (109-165-B); Taipei Veterans General Hospitals (2018-07-049BC); and MacKay Memorial Hospitals (20MMHIS036e). The study settings comprise six academic tertiary medical centers and four major designated emergency responsibility hospitals. Because Taiwan lacks a mandatory referral system, these high-volume centers manage a diverse patient population, capturing a broad spectrum of clinical severity ranging from mild cases to critical, high-acuity emergencies. The participating hospitals were part of the TEDAS network, a nationwide program to monitor recreational drug use among ED patients via qualitative LC-MS/MS analysis to detect 110 illicit substances in urine samples (Supplementary Table S1).6 Substances with detected concentrations less than
1600
Volume 27, No. 6: November 2026
Yu et al.
Machine Learning Algorithms for Predicting Psychostimulant Intoxication
50 ng/mL are reported as negative. This cutoff enhances the sensitivity for detecting both predominant and emerging substances in polysubstance use patterns, including subtle substances and clinically significant metabolites such as those of marijuana. In this study, we adopted a broad definition of psychostimulants to include both classical sympathomimetics and substances such as synthetic cannabinoids, phencyclidine-type substances, tryptamines, and marijuana, which may exhibit sympathomimetic-like effects through complex mechanisms of action. Accordingly, of the 110 substances analyzed, 104 are classified as psychostimulants, including categories such as synthetic cannabinoids, phenethylamines, synthetic cathinones, phencyclidine-type substances, tryptamines, piperazines, amphetamine-types, marijuana, cocaine, and others. The remaining 6 substances— etizolam, phenazepam, diclazepam, codeine, morphine, and 6-acetylmorphine—were excluded because they are not classified as psychostimulants. Anonymized urine samples from all enrolled patients were sent to two national laboratories for LC-MS/MS analysis. The need for individual informed consent was waived by the Taiwan Food and Drug Administration (Ministry of Health and Welfare document No. 1010265079). Selection of Participants We prospectively enrolled patients with suspected substance ingestion based on 1 or more of the following criteria: bizarre or violent behavior; self-harm; sympathomimetic toxidromes (such as agitation, hyperthermia, tachycardia, and hypertension); altered mental status; first seizure without an apparent cause; reported substance use, traumatic events paired with a clinical suspicion of substance use, or uncertain cause of cardiac arrest in patients <65 years of age. We excluded from this study patients who declined the urine LC-MS/MS analysis or whose urine samples could not be successfully collected for analysis. Data Collection, Preprocessing, and Feature Selection The inclusion criteria, medical history, clinical symptoms, and vital signs were extracted from standardized, structured medical records completed by primary care physicians at enrollment across all participating hospitals. A trained researcher subsequently reviewed the records to ensure data accuracy and corrected them as necessary. To ensure consistency across sites, the data from each hospital were double-checked by a second researcher. Both the primary care physicians and researchers were blinded to the study hypothesis. We standardized clinical variables to the initial ED encounter, using triage vital signs and initial clinical assessments. While most laboratory results reflect the first blood draw, peak values were used specifically for creatine kinase, troponin I, and lactate. To manage missing data based on clinical workflow logic, we applied a multitiered strategy. Variables with high missingness (greater. than 50% missing) Volume 27, No. 6: November 2026
were processed via dummy coding (one-hot encoding) into three states (positive, negative, and not performed) to preserve informative missingness.13 Conversely, structured electronic sheet items (eg, clinical symptoms and medical history) were inherently binary by design; thus, data not marked as positive were considered negative. Continuous variables underwent mean imputation to maintain model stability. All data processing methods are explicitly denoted in Table 1 using symbolic notation to ensure transparency. To address potential bias from imbalanced datasets, we applied the synthetic minority oversampling technique (SMOTE), which generates synthetic examples of the minority class to improve class distribution and enhance minority class prediction.14,15 All variables detailed in Table 1, with the exception of ED disposition, were incorporated as features in our ML models. These features included patient demographics, underlying comorbidities, clinical presentation, physical examination findings, and laboratory results. We identified predictive features for psychostimulant intoxication using the Boruta algorithm, enhancing model accuracy by retaining only the most significant features. By iteratively comparing actual data against generated shadow features, we deemed variables that consistently outperformed their shadow counterparts as relevant and excluded the rest. Finally, we used Shapley additive explanations (SHAP) analysis to interpret the final models, visually representing the clinical impact of each selected feature.16 Modeling Machine Learning Algorithms We adopted a temporal validation approach, assigning patients enrolled between March 2019 and October 2019 to the training set and those enrolled between November 2019 and January 2020 to the testing set. Subsequently, a 5-fold cross-validation protocol was performed exclusively on the training set to ensure model robustness. To predict psychostimulant intoxication, we employed five ML techniques: extreme gradient boosting (XGB); gradient boosting machine (GBM); linear discriminant analysis (LDA); multivariable logistic regression (MLR); and multilayer perceptron (MLP). The XGB and GBM are decision tree-based methods known for their parameter tuning flexibility and ability to model complex feature interactions. The LDA and MLR are classical models well-suited for linear data relationships. The MLPs, artificial neural networks, are particularly effective at capturing complex, nonlinear relationships and handling high-dimensional data. Outcome Measures The ML algorithm produced a binary output, classifying patients into psychostimulant intoxication or nonintoxication groups on the basis of the LC-MS/MS results. The primary outcome was the diagnostic discrimination of the ML models, measured by the area under the receiver operating characteristic curve (AUC) when validated against the
1601
Western Journal of Emergency Medicine
Machine Learning Algorithms for Predicting Psychostimulant Intoxication
Yu et al.
Table 1. Comparative analysis of demographic data, variable characteristics, laboratory results, and emergency department disposition between the psychostimulant intoxication and nonintoxication groups among patients with suspected substance use.
Feature Variables
Nonintoxication (n = 1,080)
Psychostimulant intoxication (n = 302)
Total (N = 1,382)
Missing Data
Mean (SD) / n (%)
Mean (SD) / n (%)
Mean (SD) / n (%)
n (%)
Age (years)*
45.7 (20.0)
37.0 (14.0)
43.8 (19.2)
2 (0.1)$
Male sex*
572 (53.0)
193 (63.9)
765 (55.3)
0 (0)
Body temperature (℃)*
36.6 (1.0)
36.8 (1.2)
36.7 (1.0)
3 (0.2)$
Heart rate (per min)*
96.4 (24.3)
106.8 (27.3)
98.7 (25.3)
4 (0.3)$
Respiratory rate (per min)
19.7 (3.4)
19.7 (3.22)
19.7 (3.3)
6 (0.4)$
Systolic blood pressure (mm Hg)
130.2 (29.7)
127.4 (28.0)
129.6 (29.4)
9 (0.7)$
Diastolic blood pressure (mm Hg)
80.0 (19.7)
79.0 (20.4)
79.8 (19.9)
9 (0.7)$
Mental status*
0 (0)
Awake
376 (34.8)
78 (25.8)
454 (32.9)
Depression
514 (47.5)
100 (33.1)
614 (44.4)
Excitation
190 (17.6)
124 (41.1)
314 (22.7)
Bizarre behavior or speech*
213 (19.7)
124 (41.1)
337 (24.3)
0 (0)
Hallucination*
64 (5.9)
66 (21.9)
130 (9.4)
0 (0)
Agitation*
190 (17.6)
124 (41.1)
314 (22.7)
0 (0)
Palpitation*
35 (3.2)
19 (6.3)
54 (3.9)
0 (0)
Self-reported substance use*
88 (8.1)
96 (31.8)
184 (13.3)
0 (0)
Violent behavior
153 (14.1)
50 (16.6)
203 (14.7)
0 (0)
Self-harm
248 (22.9)
83 (27.5)
331 (23.9)
0 (0)
Chest pain
51 (4.7)
14 (4.6)
65 (4.7)
0 (0)
Dyspnea
100 (9.2)
27 (8.9)
127 (9.2)
0 (0)
Nausea/vomiting
94 (8.7)
17 (5.6)
111 (8.0)
0 (0)
Congestive heart failure
35 (3.2)
5 (1.7)
40 (2.9)
0 (0)
Chronic lung disease
13 (1.2)
3 (1.0)
16 (1.2)
0 (0)
End-stage renal disease
19 (1.8)
2 (0.7)
21 (1.5)
0 (0)
Liver cirrhosis
43 (4.0)
5 (1.7)
48 (3.5)
0 (0)
Immunocompromised state*
31 (2.9)
16 (5.3)
47 (3.4)
Glasgow Coma Scale* GCS 15
376 (34.8)
78 (25.8)
454 (32.9)
Mild (GCS 13-14)
313 (28.9)
120 (39.7)
433 (31.3)
Moderate (GCS 9-12)
155 (14.3)
49 (16.2)
204 (14.7)
Severe (GCS 3-8)
236 (21.8)
55 (18.2)
291 (21.0)
627 (58.1)
184 (60.9)
811 (58.7)
Pupils
0 (0) 5 (0.4)
1 mm
28 (2.6)
10 (3.3)
38 (2.8)
2-4 mm
572 (53.0)
158 (52.3)
730 (52.8)
≧5 mm
0 (0)
27 (2.5)
16 (5.3)
43 (3.1)
Breathing sounds (abnormal)*
84 (7.8)
13 (4.3)
97(7.1)
0 (0)
Bowel sounds (hyperactive)
18 (1.7)
9 (3.0)
27 (2.0)
0 (0)
Urinary incontinence
58 (5.4)
12 (4.0)
70 (5.1)
0 (0)
Facial flush
72 (6.7)
15 (5.0)
87 (6.3)
0 (0)
Diaphoresis
57 (5.3)
24 (8.0)
81 (5.9)
0 (0)
Seizure (first time)
106 (9.8)
21 (7.0)
127 (9.2)
0 (0)
Tremor
61 (5.6)
16 (5.3)
77 (5.6)
0 (0)
Myoclonus/rigidity
62 (5.7)
13 (4.3)
75 (5.4)
0 (0)
Western Journal of Emergency Medicine
1602
Volume 27, No. 6: November 2026
Machine Learning Algorithms for Predicting Psychostimulant Intoxication
Yu et al. Table 1. Continued
Nonintoxication (n = 1,080)
Psychostimulant intoxication (n = 302)
Total (N = 1,382)
Mean (SD) / n (%)
Mean (SD) / n (%)
Mean (SD) / n (%)
n (%)
492 (45.6)
124 (41.1)
616 (44.5)
766 (55.4)†
Normal
371 (34.4)
104 (34.4)
475 (34.3)
Intracranial hemorrhage
58 (5.4)
4 (1.3)
62 (4.5)
Feature Variables Computed tomography of brain*
Other findings
Missing Data
63 (5.8)
16 (5.3)
79 (5.7)
SpO2 (%)
95.3 (8.9)
95.8 (5.3)
95.4 (8.1)
227 (16.4)$
White blood cell count (× 103)*
10.3 (5.4)
11.5 (6.9)
10.6 (5.8)
68 (4.9)$
Hematocrit (%)*
39.4 (6.3)
40.8 (5.7)
39.7 (6.2)
109 (7.9)$
Platelet count (× 103)*
249.8 (82.0)
272.5 (96.3)
254.7 (85.8)
73 (5.3)$
Creatinine (mg/dL)
1.2 (1.1)
1.3 (1.7)
1.2 (1.2)
77 (5.6)$
Sodium (mEq/L)
138.1 (5.7)
138.1 (4.6)
138.1 (5.5)
77 (5.6)$
Potassium (mEq/L)
3.8 (0.6)
3.8 (0.6)
3.78 (0.6)
73 (5.3)$
Blood glucose (mg/dL)
141 (96.4)
134 (122)
140 (103)
212 (15.3)$
Creatine kinase > 1,000 (U/L)*
287 (26.5)
38 (12.6)
325 (23.5)
913 (66.0)†
Alanine aminotransferase (IU/L)
47.7 (198)
78.3 (392)
54.4 (253)
234 (16.9)$
Lactate (mmol/L)
2.20 (3.12)
2.31 (3.25)
2.22 (3.15)
781 (56.4)$
Elevated Troponin I
97 (9.0)
31 (10.3)
128 (9.3)
757 (54.7)†
Blood alcohol concentration >10 mg/dL
116 (10.7)
24 (8.0)
140 (10.1)
818 (59.1)†
pH of blood gas
7.36 (0.09)
7.37 (0.08)
7.36 (0.09)
471 (34.0)$
pCO2 of blood gas (mm Hg)
42.2 (9.7)
41.0 (8.4)
41.9 (9.4)
471 (34.0)$
HCO3 of blood gas (mmol/L)
22.9 (4.3)
22.7 (4.2)
22.8 (4.3)
471 (34.0)$
Amphetamine by ELISA*
30 (2.8)
111 (36.8)
141 (10.2)
60 (4.3)
Morphine by ELISA*
56 (5.2)
36 (11.9)
92 (6.7)
60 (4.3)
Ketamine by ELISA*
14 (1.3)
59 (19.5)
73 (5.3)
99 (7.2) 99 (7.2)
MDMA by ELISA*
2 (0.2)
11 (3.6)
13 (0.9)
Benzodiazepine by ELISA*
226 (20.9)
98 (32.5)
324 (23.4)
60 (4.3)
Cannabinoids by ELISA
10 (0.9)
3 (1.0)
13 (0.9)
121 (8.7)
ED disposition
0 (0)
Discharged home
590 (54.6)
180 (59.6)
770 (55.7)
Admitted to ward
297 (27.5)
72 (23.8)
369 (26.7)
Admitted to ICU
185 (17.1)
46 (15.2)
231 (16.7)
8 (0.7)
4 (1.3)
12 (0.9)
Death
#The independent t-test was used for continuous variables and the chi-square test was used for categorical variables. *A P value < .05 was deemed statistically significant. $ Mean imputation. † Dummy coding for informative missingness (negative vs not performed) GCS scores: mode imputation. Other categorical variables were inherently binary based on the structured medical records. ED, emergency department; ELISA, enzyme-linked immunosorbent assay; GCS, Glasgow Coma Scale; ICU, intensive care unit; MDMA, 3-4 methylenedioxymethamphetamine; SD, standard deviation.
temporal test set. Secondary outcomes included model accuracy and the Youden index. Additionally, we conducted a comparative performance assessment of the ML algorithms relative to five physicians with varying experience levels to evaluate whether the models achieved comparable or superior Volume 27, No. 6: November 2026
specificity and sensitivity to junior emergency physicians. We also calculated the following metrics for all models: positive predictive value (PPV); negative predictive value (NPV); area under the precision-recall curve (PRC); and F1 score. We implemented the ML algorithms using Python, version 3.8.17 1603
Western Journal of Emergency Medicine
Machine Learning Algorithms for Predicting Psychostimulant Intoxication
Yu et al.
(Python Software Foundation) and the Scikit-learn library, version 1.2.2. (Scikit-learn Developers). Physician Performance Evaluation To evaluate physician performance, we used stratified random sampling to extract a subset of 60 patients (30 positive and 30 negative) from the testing database. Five physicians participated: one toxicologist, two senior emergency physicians, and two junior emergency physicians. The toxicologist was certified by the Taiwan Society of Emergency Medicine. Senior physicians had over five years of experience as attending physicians, whereas junior physicians had less than five years. Each physician independently reviewed the patients’ records and categorized them into either the psychostimulant intoxication group or the nonintoxication group. RESULTS Patient Profile and Baseline Demographics Between March 2019 and January 2020, we enrolled 1,384 patients. After excluding two subjects due to duplicated registration, the final sample included 1,382 patients (Figure 1). Among these, 370 (26.8%) tested positive for substances via LC-MS/MS. Specifically, 302 patients (21.9%) tested positive for psychostimulants, constituting the psychostimulant intoxication group. The remaining 1,080 patients formed the non-intoxication group. For model development, the cohort was partitioned into a training dataset (n = 1,000) and a testing dataset (n = 382). The prevalence of psychostimulant positivity remained consistent across both subsets, with 230 (23.0%) in the training set and 72 (18.8%) in the testing set. Our demographic analysis (Table 1) revealed that the intoxication group was younger than the nonintoxication group (37.0 [14.0] vs 45.7 [20.0] years) and had a higher proportion of males (63.9% vs 53.0%). At triage, the intoxication group presented a faster heart rate than the nonintoxication group (106.8 [27.3] vs 96.4 [24.3] beats per minute). Upon clinical assessment, the intoxication group had higher rates of excited mental states (41.1% vs 17.6%), abnormal behavior or speech (41.1% vs 19.7%), hallucinations (21.9% vs 5.9%), agitation (41.1% vs 17.7%), palpitations (6.3% vs 3.2%), and selfreported substance use (31.8% vs 8.1%). The intoxication group more frequently presented with mild Glasgow Coma Scale (GCS) scores (13-14), whereas severe neurological impairment (GCS 3-8) was more prevalent in the nonintoxication group. Although not statistically significant, the intoxication group had a greater prevalence of dilated pupils (>5 mm) and hyperactive bowel sounds. Brain computed tomography (CT) revealed a lower incidence of intracranial hemorrhage in the intoxication group. Laboratory results revealed elevated white blood cells, hematocrit, and platelets in the intoxication group, whereas elevated creatine kinase levels were more common in the nonintoxication group (26.5% vs 12.6%). Initial screening via urine immunoassay demonstrated false-positive rates for amphetamine (2.8%) and ketamine (1.3%). Western Journal of Emergency Medicine
Figure 1. Flowchart of patient enrollment, temporal validation strategy, and machine learning development pipeline for predicting psychostimulant intoxication in emergency department patients. This study employs a temporal split to validate the algorithm’s diagnostic stability across chronologically distinct cohorts. The training dataset development incorporated the Boruta method for feature selection, the synthetic minority oversampling technique to address class imbalance, and 5-fold cross-validation for internal validation. Finally, 60 cases were randomly selected from the testing database for a comparative assessment of physician performance. SMOTE, synthetic minority oversampling technique.
Categories and Combination Patterns of Substances The substances most frequently detected by LC-MS/MS were amphetamine and methamphetamine, followed by synthetic cathinone, opioids, and ketamine (Supplementary Figure S1). Among the psychostimulant-positive subjects, half (155/302) had mixed substance exposure (Supplementary Table S2). Additionally, 50% of those who tested positive for traditional psychostimulants tested positive for new psychoactive substances (74/142). Seven patients tested positive for benzodiazepines, including etizolam, phenazepam, and diclazepam, all of whom had co-ingested with psychostimulants.
1604
Volume 27, No. 6: November 2026
Yu et al.
Machine Learning Algorithms for Predicting Psychostimulant Intoxication
Prediction Performance of Machine Learning Algorithms and Primary Outcome The models demonstrated strong temporal stability across distinct cohorts. Most algorithms exhibited robust discriminatory power during training (Figure 2A) and successfully generalized to the validation cohort, maintaining consistent AUCs above 0.820 (Figure 2B). While the MLP demonstrated a comparatively lower baseline performance, it displayed remarkable consistency between phases. As shown in Table 2, the XGB model met the primary outcome as the top-performing algorithm, achieving an AUC of 0.836 (95% CI, 0.785-0.882), an accuracy of 0.866 (95% CI, 0.838-0.895), and a Youden index of 0.590 (95% CI, 0.480-0.694). These results confirm the model’s ability to maintain reliable diagnostic utility across chronologically distinct patient presentations. Furthermore, the models exhibited certain diagnostic characteristics that may be relevant to ED workflows. High specificity remained a consistent advantage across the XGB, LDA, and MLP models (> 90%), providing strong confidence in correctly identifying nonintoxicated patients and minimizing false alarms. Alongside this high specificity, the XGB model achieved the highest F1 score (0.658) and area under the precision-recall curve (0.681, 0.576–0.776) among the evaluated algorithms. This relatively balanced precision-recall performance suggests that the XGB model has the potential to maintain diagnostic stability even when managing the imbalanced prevalence of positive cases typically encountered in emergency settings. Notably, however, the moderate sensitivity observed across the models (0.389–0.708) indicates that these algorithms are not
Figure 2. Receiver operating characteristic curves for the machine learning algorithms for predicting psychostimulant intoxication. Using the top 20 features identified by the Boruta method, all five algorithms demonstrated robust performance on the training dataset, with areas under the curve (AUC) ranging from 0.785 to 0.896 (A). When applied to the temporal testing dataset, the models maintained consistent diagnostic utility, achieving AUC ranging from 0.786 to 0.836 (B). AUC, area under the curve; GBM, gradient boosting machine; LDA, linear discriminant analysis; MLP, multilayer perceptron; MLR, multivariable logistic regression; ROC, receiver operating characteristic; XGB, extreme gradient boosting.
Volume 27, No. 6: November 2026
optimized as primary rule-out tools, as they may fail to capture all positive instances. Feature Interpretation The feature importance and interactions were visualized via Shapley additive explanations analysis (Figure 3). Positive urine immunoassay results for amphetamine and ketamine, along with a self-reported history of stimulant use, were identified as the most influential predictors. The analysis highlighted an age-related pattern, with younger individuals showing a greater likelihood of psychostimulant intoxication. Clinically, the model’s predictions were influenced by a cluster of neuropsychiatric symptoms, including bizarre behavior, hallucination, and mental excitation. Additionally, tachycardia and elevated creatinine concentrations were linked to increased prediction of psychostimulant intoxication. Interestingly, high systolic blood pressure did not always correlate with increased prediction probability, suggesting a complex relationship between physiological factors and psychostimulant intoxication. Physician Performance Evaluation and Secondary Outcome Table 3 summarizes the performance of the five physicians. Human evaluation was notably experiencedependent; while the toxicologist provided the most balanced clinical results (Youden index, 0.500), senior physicians prioritized specificity to minimize false-positive results. Regarding the secondary outcome, the XGB model outperformed junior physicians in both specificity (0.910 vs 0.633-0.867) and sensitivity (0.681 vs 0.500-0.633). Its specificity was also comparable to that of senior physicians (0.900-0.933). Notably, the toxicologist’s sensitivity (0.767) remained higher than all ML models, highlighting the essential role of specialist consultation in differentiating ambiguous or atypical cases. DISCUSSION In this multicenter study, we demonstrated that ML algorithms provide reliable diagnostic utility for identifying psychostimulant intoxication among ED patients suspected of substance use. Our findings confirmed the primary hypothesis, because the models—particularly the XGB algorithm— maintained consistent diagnostic discrimination and overall accuracy across the temporal validation cohort. Furthermore, the study satisfied the secondary outcome by demonstrating that the algorithm’s performance is comparable to that of experienced physicians. Specifically, the XGB model outperformed junior physicians in both sensitivity and specificity. These results suggest that ML can serve as a standardized diagnostic benchmark and a reliable second opinion, potentially reducing clinical variability and mitigating diagnostic anchoring in fast-paced emergency settings. Decision tree-based methods may achieve strong performance in structured clinical datasets because of their
1605
Western Journal of Emergency Medicine
Machine Learning Algorithms for Predicting Psychostimulant Intoxication
Yu et al.
Table 2. Model prediction performance for identifying psychostimulant intoxication in the training and testing datasets using top 20 features selected by Boruta method. Diagnostic accuracies for the extreme gradient boosting, multilayer perceptron, and linear discriminant analysis models exceeded 86%. High specificity was a consistent strength, surpassing 90% in the multilayer perceptron (0.958), linear discriminant analysis (0.935), and extreme gradient boosting (0.910) models, underscoring their effectiveness in correctly identifying negative cases. However, diagnostic sensitivity ranged from 0.389 to 0.708, indicating that the models may fail to identify approximately 29% to 61% of positive cases. The Youden index identified the extreme gradient boosting model (0.590) as providing the most effective balance for clinical application. Training Performance Metric
Testing
XGB
GBM
LDA
MLR
MLP
XGB
GBM
LDA
MLR
MLP
AUC [95% CI]
0.864 [0.834 – 0.892]
0.896 [0.873 – 0.917]
0.843 [0.813 – 0.874]
0.853 [0.823 – 0.883]
0.785 [0.748 – 0.818]
0.836 [0.785 – 0.882]
0.829 [0.777 – 0.876]
0.824 [0.773 – 0.872]
0.820 [0.768 – 0.866]
0.786 [0.715 – 0.849]
Accuracy [95% CI]
0.844 [0.820 – 0.866]
0.834 [0.812 – 0.858]
0.858 [0.838 – 0.879]
0.788 [0.762 – 0.812]
0.836 [0.813 – 0.858]
0.866 [0.838 – 0.895]
0.798 [0.764 – 0.832]
0.864 [0.835 – 0.893]
0.764 [0.728 – 0.801]
0.851 [0.814 – 0.885]
Specificity
0.910 [0.889 – 0.929]
0.853 [0.830 – 0.879]
0.968 [0.955 – 0.979]
0.818 [0.789 – 0.844]
0.974 [0.962 – 0.984]
0.910 [0.882 – 0.935]
0.819 [0.783 – 0.854]
0.935 [0.914 – 0.958]
0.784 [0.745 – 0.822]
0.958 [0.935 – 0.978]
Sensitivity (recall)
0.622 [0.559 – 0.686]
0.770 [0.716 – 0.822]
0.491 [0.430 – 0.554]
0.686 [0.628 – 0.748]
0.374 [0.313 – 0.435]
0.681 [0.589 – 0.767]
0.708 [0.616 – 0.794]
0.556 [0.460 – 0.651]
0.681 [0.588 – 0.768]
0.389 [0.273 – 0.507]
PPV (precision)
0.675 [0.609 – 0.734]
0.610 [0.553 – 0.665]
0.819 [0.746 – 0.874]
0.530 [0.474 – 0.586]
0.811 [0.726 – 0.874]
0.636 [0.526– 0.735]
0.477 [0.384 – 0.571]
0.667 [0.541 – 0.776]
0.422 [0.335 – 0.513]
0.683 [0.550 – 0.790]
NPV
0.889 [0.866 – 0.910]
0.925 [0.904 – 0.942]
0.864 [0.840– 0.886]
0.897 [0.873 – 0.918]
0.839 [0.813 – 0.862]
0.924 [0.888 – 0.951]
0.924 [0.887 – 0.949]
0.901 [0.865 – 0.930]
0.914 [0.874 – 0.942]
0.871 [0.835 – 0.905]
PRC
0.729 [0.680 – 0.779]
0.759 [0.704 – 0.808]
0.719 [0.669 –0.773]
0.717 [0.665 – 0.774]
0.633 [0.571 – 0.692]
0.681 [0.576 – 0.776]
0.658 [0.550 – 0.762]
0.659 [0.555 – 0.757]
0.623 [0.516 – 0.737]
0.588 [0.468 – 0.701]
F1 Score
0.647 [0.593 – 0.698]
0.681 [0.633 – 0.725]
0.614 [0.553 – 0.672]
0.598 [0.547 – 0.646]
0.512 [0.444 – 0.575]
0.658 [0.585 – 0.731]
0.570 [0.500– 0.637]
0.606 [0.534 – 0.677]
0.521 [0.453 – 0.588]
0.496 [0.425 – 0.565]
Youden index
0.532 0.623 0.459 0.505 0.348 0.590 0.528 0.491 0.464 0.347 [0.465 – [0.562 – [0.393 – [0.438 – [0.285 – [0.480 – [0.425 – [0.395 – [0.355 – [0.285 – 0.598] 0.682] 0.526] 0.570] 0.411] 0.694] 0.642] 0.601] 0.564] 0.415] AUC, area under the receiver operating characteristics curve; GBM, gradient boosting machine; LDA, linear discriminant analysis; MLP, multilayer perceptron; MLR, multivariate logistic regression; NPV, negative predictive value; PPV, positive predictive value; PRC, area under the precision-recall curve; XGB, extreme gradient boosting.
ability to handle complex nonlinear relationships and feature interactions, which are common in clinical data. Previous studies have demonstrated that tree-based ensemble methods often perform competitively or outperform deep learning approaches on tabular datasets.17 These models are particularly effective for heterogeneous data, such as age, vital signs, toxidromes, and laboratory results, as they can automatically capture intricate patterns without extensive preprocessing, such as scaling or normalization. In addition, tree-based methods are relatively robust to noisy observations, and several tree-based algorithms incorporate built-in mechanisms for handling incomplete observations, making them well Western Journal of Emergency Medicine
suited for real-world clinical datasets.18,19 The diagnostic profile of our models, characterized by high specificity and moderate sensitivity, reflects a clinically appropriate trade-off for the ED. This balance arises from two key considerations. First, there is a distinction between detecting drug exposure and identifying clinically significant intoxication. Our reference standard, LC-MS/MS, uses a sensitive cutoff (50 ng/mL) to detect exposure regardless of clinical presentation, whereas the ML models rely on clinical features that are more evident during active intoxication. Because most test-positive cases in our cohort were clinically mild and safely discharged, the moderate sensitivity likely
1606
Volume 27, No. 6: November 2026
Yu et al.
Machine Learning Algorithms for Predicting Psychostimulant Intoxication
Figure 3. Shapley additive explanations analysis of the top 20 features in the gradient boosting machines model for predicting psychostimulant intoxication. Features are ranked in order of importance, with the color gradient indicating feature values (red for higher values, blue for lower values). Eg, in the feature “self-reported stimulant use,” high values (red dots) are associated with high SHAP values, indicating a strong predictive impact on psychostimulant intoxication. For the feature “age,” younger age (blue dots) was more predictive of psychoactive stimulant exposure (high SHAP value). ELISA, enzyme-linked immunosorbent assay; SHAP, Shapley additive explanations.
reflects limited detection of subclinical exposures without meaningful physiologic disturbance. Second, prioritizing specificity helps mitigate diagnostic anchoring and alarm fatigue in the ED. Overly sensitive models may increase false positives and lead to premature attribution of symptoms to drug intoxication. In contrast, a highly specific model supports confident “rule-in” decisions when positive, while negative predictions encourage clinicians to maintain a broad differential diagnosis and actively evaluate other critical conditions, such as central nervous system infection, intracranial hemorrhage, or sepsis. When comparing physician performance to algorithmic models, we observed complementary roles between ML algorithms and clinical experts. The XGB model demonstrated an ability to mitigate experience-related variability by achieving diagnostic specificity and precision comparable to those of senior emergency physicians. This suggests that ML models can provide a standardized second opinion for junior Volume 27, No. 6: November 2026
clinicians. Additionally, toxicologist consultation remains vital for the management of complex or atypical cases. This synergy underscores the potential to integrate ML with clinical expertise to enhance diagnostic stability and support decisionmaking in fast-paced settings.20 The inclusion of ELISA results in the dataset addresses real-world diagnostic challenges in emergency settings. As shown in Supplementary Table S2, half of the psychostimulantpositive patients had mixed substance exposure, and discrepancies were observed, with 30 amphetamine-positive and 14 ketamine-positive patients in the nonpsychostimulant group, according to LC-MS/MS. These findings highlight the uncertainty of relying solely on ELISA results. By analyzing large datasets and recognizing complex patterns,7,21 ML can leverage these discrepancies to increase diagnostic precision. The practical utility of our model lies in its integration into the existing clinical workflow during the management stage of model development.22 We propose a pathway where the algorithm is embedded directly into the electronic health record, using structured history, physical examination data, and automatically integrated laboratory values. To optimize clinician acceptance and mitigate alert fatigue, we recommend an “on-demand” trigger mechanism. By requiring the physician to manually initiate the prediction when substance use is suspected, the system provides targeted insights without increasing the overall cognitive load or inducing unnecessary warnings. The tool is strategically deployed at a critical “diagnostic touchpoint”23, specifically immediately following the initial physician evaluation. This timing is essential because it captures the window where clinical uncertainty is highest: foundational data (eg, vitals and chemistry) are accessible, but gold-standard confirmatory results (eg, LCMS/MS) remain pending. Given the compressed time frames inherent to the ED, this automated “second opinion” serves as a vital safeguard during the high-stakes period before definitive results are available. In practice, the model functions as a digital second opinion designed to prevent diagnostic anchoring—a common hurdle in the fast-paced environment of the ED. A positive prediction provides the clinician with the diagnostic confidence to promptly initiate critical interventions, such as sedation, supportive care, and aggressive cooling for hyperthermia, while simultaneously triggering toxicologist consultation and confirmatory testing. Conversely, a negative prediction encourages the physician to broaden the differential diagnosis to include medical mimics such as sepsis, encephalitis, thyrotoxicosis, or primary psychiatric disorders. By providing evidence-based reinforcement at a critical diagnostic touchpoint,23 the tool enhances the precision of emergency care and ensures that critical management pathways are activated or ruled out with greater statistical certainty. LIMITATIONS Our study has several limitations. First, the 110-substance
1607
Western Journal of Emergency Medicine
Machine Learning Algorithms for Predicting Psychostimulant Intoxication
Yu et al.
Table 3. Diagnostic performance of physicians in identifying psychostimulant intoxication on a 60-case subset. Physician performance evaluation Toxicologist
Senior emergency physician 1
Senior emergency physician 2
Junior emergency physician 1
Junior emergency physician 2
Accuracy
0.750
0.683
0.667
0.683
0.633
Specificity
0.733
0.900
0.933
0.867
0.633
Sensitivity (recall)
0.767
0.467
0.400
0.500
0.633
PPV (precision)
0.742
0.824
0.857
0.789
0.633
NPV
0.759
0.628
0.609
0.634
0.633
Youden index
0.500
0.367
0.333
0.367
0.266
Performance Metric
NPV, negative predictive value; PPV, positive predictive value.
panel used may not encompass the full range of psychostimulants in the evolving unregulated substance market, potentially missing newer substances. Second, the LC-MS/MS results were reported in a qualitative format, which limits the ability to investigate the relationship between varying concentrations (trace, low, moderate, or high) and clinical symptoms. Third, while efforts such as feature selection, decision tree pruning, and data balancing via SMOTE were employed, the models presented a common ML challenge of reduced performance from training to testing datasets.24,25 Strategies to enhance model generalizability could include expanding the training dataset, incorporating additional features such as wearable device data on tremors, posture, or facial expressions, and employing a physician feedback mechanism.26 Fourth, physicians reviewed medical charts retrospectively, which may have led to the loss of critical clinical information such as diagnostic intuition, facial expressions, posture, and tone of speech. The absence of these clues might have influenced their performance. Finally, our study is limited by the absence of external geographic validation. Although the model was developed and internally validated using a multicenter dataset, its predictive logic is inherently influenced by the clinical practice patterns and laboratory ordering behaviors specific to the Taiwan healthcare system. For example, institutional thresholds for ordering diagnostic tests (eg, brain CT or certain biochemical markers) are not globally uniform. This leads to informative missingness, where the absence of a test reflects a clinician’s judgment of low risk; a model trained on such patterns may require recalibration before application in different diagnostic cultures. Furthermore, regional substance exposure patterns are highly volatile and subject to rapid shifts in unregulated drug markets. Because our cohort reflects substance prevalence in Taiwan from 2019–2020, our findings may not immediately generalize to other regions or timeframes. Future research using international cohorts and federated learning frameworks27 will be essential to validate the model’s Western Journal of Emergency Medicine
performance against diverse, site-specific practice protocols and shifting epidemiological trends. CONCLUSION This multicenter study demonstrated that ML algorithms provide reliable diagnostic utility for identifying psychostimulant intoxication among ED patients with suspected substance use. While their moderate sensitivity precludes their use as standalone rule-out instruments, their high specificity offers a standardized confirmatory benchmark that performs comparably to senior emergency physicians. AUTHORS CONTINUED Te-I Weng, MD††‡‡ Cheng-Chung Fang, MD‡‡§§ Sung-Wei Liu, MD||||## Yen-Chia Chen, MD¶¶15 Yu-Cheng Pei, MD, PhD16-19 Kuan-Fu Chen MD20-23º Chang Gung Medical Technology Co Ltd, Department of Artificial Intelligence Research and Development, Taoyuan, Taiwan # MacKay Memorial Hospital, Toxicology Division and Poison Center, Taipei, Taiwan ¶ Chang Gung Memorial Hospital, Department of Emergency Medicine, LinKou, Taiwan **Chang Gung University, College of Medicine, Taoyuan, Taiwan †† National Taiwan University, College of Medicine, Institute of Forensic Medicine, Taipei, Taiwan ‡‡ National Taiwan University, College of Medicine and National Taiwan University Hospital, Department of Emergency Medicine, Taipei, Taiwan §§ National Taiwan University, College of Medicine and National Taiwan University Hospital, Forensic and Clinical Toxicology Center, Taipei, Taiwan |||| Buddhist Tzu Chi Medical Foundation and Tzu Chi University, Department of Emergency, Hualien Tzu Chi ||
1608
Volume 27, No. 6: November 2026
Yu et al.
Machine Learning Algorithms for Predicting Psychostimulant Intoxication
Hospital, Hualien, Taiwan ## Tzu Chi University, Institute of Medical Sciences, Hualien, Taiwan ¶¶ Taipei Veterans General Hospital, Emergency Department, Taipei, Taiwan 15 National Yang Ming Chiao Tung University, School of Medicine, Department of Emergency Medicine, Taipei, Taiwan 16 Chang Gung Memorial Hospital, Department of Physical Medicine and Rehabilitation, LinKou, Taoyuan City, Taiwan 17 Chang Gung Memorial University, Master of Science Degree Program in Innovation for Smart Medicine, Taoyuan City, Taiwan 18 Chang Gung University, School of Medicine, College of Medicine, Taoyuan City, Taiwan 19 Chang Gung Memorial Hospital at LinKou, Center for Vascularized Composite Allotransplantation, Taoyuan City, Taiwan 20 Chang Gung University, Clinical Informatics and Medical Statistics Research Center, Taoyuan, Taiwan 21 Chang Gung University, Research Center for Emerging Viral Infections, Taoyuan, Taiwan 22 Chang Gung Memorial Hospital, Department of Emergency Medicine, Keelung, Taiwan 23 Chang Gung University, Department of Artificial Intelligence, College of Intelligent Computing, Taoyuan, Taiwan ºEqual contribution
REFERENCES 1. Peacock A, Bruno R, Gisev N, et al. New psychoactive substances: challenges for drug surveillance, control, and public health responses. Lancet. 2019;394(10209):1668-1684. 2. Schep LJ, Slaughter RJ, Beasley DMG. The clinical toxicology of metamfetamine. Clin Toxicol (Phila). 2010;48(7):675-694. 3. Zawilska JB, Wojcieszak J. Designer cathinones—an emerging class of novel recreational drugs. Forensic Sci Int. 2013;231(1-3):42-53. 4. Swortwood MJ, Hearn WL, DeCaprio AP. Cross‐reactivity of designer drugs, including cathinone derivatives, in commercial enzyme‐linked immunosorbent assays. Drug Test Anal. 2014;6(7-8):716-727. 5. Saitman A, Park HD, Fitzgerald RL. False-positive interferences of common urine drug screen immunoassays: a review. J Anal Toxicol. 2014;38(7):387-396. 6. Lin CC, Weng TI, Ng CJ, et al. Emergency department visits due to new psychoactive substances and other illicit drugs in Taiwan: preliminary results of the Taiwan Emergency Department Drug Abuse Surveillance (TEDAS) project. Clin Toxicol (Phila). 2022;60(6):708-715. 7. Rajkomar A, Dean J, Kohane I. Machine learning in medicine. N Engl J Med. 2019;380(14):1347-1358. 8. Chary M, Boyer EW, Burns MM. Diagnosis of acute poisoning using explainable artificial intelligence. Comput Biol Med. 2021;134:104469. 9. Rahman P, Nandi A, Hebert C. Amplifying domain expertise in clinical data pipelines. JMIR Med Inform. 2020;8(11):e19612. 10. Roe KD, Jawa V, Zhang X, et al. Feature engineering with clinical expert knowledge: a case study assessment of machine learning model complexity and performance. PLoS One. 2020;15(4):e0231300.
Address for Correspondence: Kuan-Fu Chen, MD, PhD, Chang Gung Memorial Hospital, Department of Emergency Medicine, 5 Fu-Shin St, Gueishan District, Taoyuan 333, Taiwan. Email: kfchen@mail.cgu.edu.tw and drkfchen@gmail.com.
11. Mayr A, Klambauer G, Unterthiner T, et al. DeepTox: toxicity prediction using deep learning. Front Environ Sci. 2016;3:80. 12. Lo-Ciganic WH, Huang JL, Zhang HH, et al. Evaluation of machinelearning algorithms for predicting opioid overdose risk among
Yueh-Peng Chen, PhD, Chang Gung Medical Technology Co Ltd, Department of Artificial Intelligence Research and Development, No. 259, Wenhua 1st Rd, Guishan District, Taoyuan 333, Taiwan. Email: yuepengc@gmail.com.
Medicare beneficiaries with opioid prescriptions. JAMA Netw Open. 2019;2(3):e190968. 13. Sperrin M, Martin GP, Sisk R, et al. Missing data should be handled differently for prediction than for description or causal explanation. J
Conflicts of Interest: By the WestJEM article submission agreement, all authors are required to disclose all affiliations, funding sources and financial or management relationships that could be perceived as potential sources of bias. This work was supported by the National Science and Technology Council, Chang Gung Memorial Hospital, and China Medical University Hospital in Taiwan (NSTC 111-2314-B-182-017-MY3, NSTC 112-2321-B-182-003, CMRPG2L0282, KMRPC3M003, CLRPG3H0014, CMUHCH-DMR-113-026, CMUHCHDMR-114-016). The funders had no role in the study design or in data collection, analysis, or interpretation; neither did they have any role in the writing of the manuscript nor in the decision to submit the manuscript for publication. There are no conflicts of interest to declare.
Clin Epidemiol. 2020;125:183-187. 14. Chawla NV, Bowyer KW, Hall LO, et al. SMOTE: synthetic minority over-sampling technique. J Artif Intell Res. 2002;16:321-357. 15. Chawla NV, Japkowicz N, Kotcz A. Special issue on learning from imbalanced data sets. ACM SIGKDD Explor Newsl. 2004;6(1):1-6. 16. Lundberg SM, Lee SI. A unified approach to interpreting model predictions. Adv Neural Inf Process Syst. 2017;30:4765-4774. 17. Shwartz-Ziv R, Armon A. Tabular data: deep learning is not all you need. Inf Fusion. 2022;81:84-90. 18. Breiman L. Random forests. Mach Learn. 2001;45(1):5-32. 19. Nijman S, Leeuwenberg AM, Beekers I, et al. Missing data is poorly
Copyright: © 2026 Yu et al. This is an open access article distributed in accordance with the terms of the Creative Commons Attribution (CC BY 4.0) License. See: http://creativecommons.org/ licenses/by/4.0/
Volume 27, No. 6: November 2026
handled and reported in prediction model studies using machine learning: a literature review. J Clin Epidemiol. 2022;142:218-229. 20. Chen JH, Asch SM. Machine learning and prediction in medicine—
1609
beyond the peak of inflated expectations. N Engl J Med.
Western Journal of Emergency Medicine
Machine Learning Algorithms for Predicting Psychostimulant Intoxication 2017;376(26):2507-2509.
subsequent selection bias in performance evaluation. J Mach Learn
21. Beam AL, Kohane IS. Big data and machine learning in health care. JAMA. 2018;319(13):1317-1318.
Res. 2010;11:2079-2107. 25. Sahin EK. Assessing the predictive capability of ensemble tree
22. Petrella RJ. The AI future of emergency medicine. Ann Emerg Med.
methods for landslide susceptibility mapping using XGBoost, gradient
2024;84(2):139-153. 23. Brodeur PG, Buckley TA, Kanjee Z, et al. Performance of a large
boosting machine, and random forest. SN Appl Sci. 2020;2(7):1308. 26. Chen V, Bhatt U, Heidari H, et al. Perspectives on incorporating expert
language model on the reasoning tasks of a physician. Science. 2026;392(6797):524-527.
feedback into model updates. Patterns (N Y). 2023;4(7):100780. 27. Rieke N, Hancox J, Li W, et al. The future of digital health with
24. Cawley GC, Talbot NL. On over-fitting in model selection and
Western Journal of Emergency Medicine
Yu et al.
federated learning. NPJ Digit Med. 2020;3(1):119.
1610
Volume 27, No. 6: November 2026
Original Research
High-efficiency Nebulizers Reduce Albuterol Administration Time in the Emergency Department James McCue, MD*† Darin Craft, BS, RRT‡ Wade Veneman, RRT‡ Rawnica Ruegner, MD*† Brian Chinnock, MD*† Jannet Castaneda, BA, CCRP, CPT* Jonathan Broadhurst, RTT‡ Alec Chan-Golston, BS§ Yueqi Yan, BS§ Danielle Campagne, MD*†
*University of California San Francisco, Department of Emergency Medicine, Fresno, California † Community Regional Medical Center, Department of Emergency Medicine, Fresno, California ‡ Community Regional Medical Center, Department of Respiratory Care, Fresno, California § University of California Merced, Health Sciences Research Institute, Merced, California
Section Editor: Carmine Nasta, MD Submission history: Submitted October 16, 2025; Revision received February 12, 2026; Accepted February 16, 2026 Electronically published October 18, 2026 Full text available through open access at http://escholarship.org/uc/uciem_westjem DOI 10.5811/westjem.53169
Introduction: Asthma exacerbations commonly require nebulized albuterol in the emergency department (ED). High-efficiency devices (vibrating mesh, breath-enhanced/actuated) may shorten treatment time compared with traditional jet nebulizers. We compared four commonly used nebulizer devices on treatment time and ED outcomes. Methods: We conducted a prospective observational study of a convenience sample of patients at a high-volume, urban Level I trauma center ED (February 2019–March 2023; paused during COVID-19). Patients ≥ 3 years of age receiving clinician-ordered nebulized albuterol were eligible. Exclusions included patients with a history of chronic obstructive pulmonary disease or congestive heart failure, inability to follow commands or hold the device, and need for positive-pressure ventilation. Respiratory care practitioners used one of four devices already in use in this department: Westmed miniHEART Hi-Flo jet (Mini), Aerogen Ultra (vibrating mesh), Monaghan AeroEclipse II (breath-actuated), or Salter Labs NebuTech (breath-enhanced). The Mini group received a single 15-mg dose; others received 5-mg increments up to 15 mg with reassessment. Our primary outcome measure was the shortest time to complete delivery of the planned albuterol dose to the patient. Secondary outcomes included hospital admission and changes in asthma security scores and peak expiratory flow. We used analysis of variance post-hoc tests and adjusted linear/logistic regression. Both males and females were included; sexstratified analyses were not prespecified. Results: We enrolled 296 patients (Mini, n = 90; Aerogen, n = 67; AeroEclipse, n = 65; NebuTech, n = 74), 78 (26.3%) of whom were pediatric patients 3-18 years of age (Mini, n = 22; Aerogen, n = 20; AeroEclipse, n = 14, and NebuTech, n = 22). Time to complete albuterol differed by device, with mean treatment times in minutes (95% CI): Mini, 60.6 [55.9–65.3]; Aerogen, 12.3 [10.9–13.7]; AeroEclipse, 8.7 [7.7–9.7]; and NebuTech, 7.9 [7.0–8.8]. Adjusted models showed 82%, 88%, and 88% relative reductions vs Mini (all P < .01). Admission rates did not differ in total percentage (Mini, 11.1 [10]; Aerogen, 14.9 [10]; AeroEclipse, 16.9 [11]; and NebuTech, 6.8 [5] (all P > .05). Adults had lower odds of admission than pediatrics (odds ratio 0.38; 95% CI, 0.18–0.79; P = .01), with a total of 36 (12.1%) patients requiring admission, two pediatric. Asthma severity and improvements in peak expiratory flow were similar across devices, with mean post-treatment values (asthma severity score and peak expiratory flow): Mini, 5.5 and 301.1; Aerogen, 5.6 and 292.7; AeroEclipse, 5.9 and 248.5; and NebuTech, 5.7 and 301.1 (all P > .01). Conclusion: In a real-world ED cohort, vibrating-mesh and breath-enhanced/actuated nebulizers delivered albuterol > 80% faster than a traditional jet device, potentially saving at least 45 minutes per treatment per patient, without differences in admission rates or clinical response. Adopting faster devices may improve workflow and throughput without compromising patient outcomes. [West J Emerg Med. 2026;27(6)1611–1616.]
Volume 27, No. 6: November 2026
1611
Western Journal of Emergency Medicine
High-efficiency Nebulizers Reduce Albuterol Administration Time in the Emergency Department INTRODUCTION Asthma exacerbations are a common presentation to the emergency department (ED). The fundamental physiology of asthma in both pediatric and adult patients is chronic inflammation of the lower airways causing narrowing of the airways through a combination of swelling, secretions and muscle constriction of the bronchi.1 According to the American Lung Association State of the Air Report 2016, over 550,000 people in the San Joaquin Valley in California have asthma. While studies show that asthma is a heterogenous disease with more patient-focused treatments being developed, traditional asthma exacerbation treatments for both pediatric and adult patients in the ED include steroids and nebulizer treatments of albuterol, a short-acting beta-agonist, which can be an hour-long treatment in more moderate-severe exacerbations. Inhalers may also be considered in the treatment of asthma in the ED; however, patient compliance can be variable due to the coordination needed to time one’s breath with the medication administration. Many nebulizer devices now on the market deliver albuterol in minutes and potentially more reliably than an inhaler.2,3 We included four nebulizer models in this study: the Westmed Inc miniHEART Hi-Flo Jet Nebulizer (Mini); the Monaghan AeroEclipse II Breath-Actuated Nebulizer (AeroEclipse); the Salter Labs NebuTech High-Density Nebulizer (NebuTech); and the Aerogen Ultra Nebulizer (Aerogen). These devices were selected because they are currently in use across various clinical settings within our hospital and have been prioritized by clinicians for purchase, ensuring that the study reflects the use of real-world equipment. Their inclusion ensured that the study captured the range of technologies most relevant to optimizing aerosol delivery in clinical practice. Although prior studies have evaluated the performance of these nebulizers individually,4,5 no direct head-to-head comparisons exist to identify which device is most effective for the rapid delivery of aerosolized medication. The Mini produces aerosol continuously and can aerosolize up to 30 milliliters of medication and has a higher dead volume.6 The AeroEclipse generates aerosol only on inhalation, offers higher medication concentration, and has a high dead volume.2 The NebuTech stores aerosol in a reservoir and reduces atmospheric medication loss, although its dead volume remains high.3 The Aerogen, a handheld device, used in conjunction with the Aerogen Solo, is a vibrating-mesh nebulizer requiring no gas source (although one may be used); it is associated with a very low dead volume.7 OBJECTIVE In this study we aimed to evaluate and compare four high-efficiency nebulizer devices in terms of time to complete albuterol administration, and hospital admission rates among patients presenting with asthma exacerbations, improving asthma severity, and peak expiratory flow. Western Journal of Emergency Medicine
McCue et al.
Population Health Research Capsule What do we already know about this issue? Prior studies have evaluated the performance of nebulizers individually, but no direct headto-head comparisons exist. What was the research question? We compared four nebulizer devices regarding time to complete albuterol administration, and hospital admission rates. What was the major finding of the study? Mean treatment times in minutes (95% CI): Mini, 60.6 (55.9–65.3); Aerogen, 12.3 (10.9–13.7; AeroEclipse, 8.7 (7.7–9.7), and NebuTech, 7.9 (7.0–8.8). How does this improve population health? Vibrating-mesh and breath-enhanced/actuated nebulizers deliver albuterol > 80% faster than traditional jet devices, without changes in admission rates or clinical response.
METHODS Study Design This was a prospective, observational study of ED patients presenting with asthma exacerbations requiring albuterol treatment via nebulizer. All nebulizer devices were purchased through a non-industry grant and were already in routine use. These devices were identified by the respiratory therapy department in our hospital and are actively used by the respiratory therapy team across various departments within the institution, allowing the study to reflect real-world clinical practice patterns and procurement considerations. The manufacturers provided no financial support, equipment, or input regarding study design, analysis, writing, or publication decisions. Approximate hospital acquisition costs at the time of study were as follows: Mini, ≈ $9.36 per unit; Aerogen, ≈ $48.57 per unit; AeroEclipse, ≈ $4.57 per unit; and NebuTech, ≈ $2.54 per unit. The study took place between February 2019–March 2023 with a 13-month pause due to the COVID-19 pandemic (last patient enrolled on March 12, 2020, and study resumed on April 13, 2022). The pause secondary to the COVID-19 pandemic did not change nebulizer use pre- versus post-pandemic, due to patients needing rooms or designated respiratory areas prior to nebulizer administration throughout the course of the study. We obtained study approval from the institutional review
1612
Volume 27, No. 6: November 2026
McCue et al.
High-efficiency Nebulizers Reduce Albuterol Administration Time in the Emergency Department
board, and the study was supported by a non-industry institutional research grant. Setting This study was conducted in the ED of a busy academic Level I trauma center and tertiary-care hospital in a large metropolitan area with ED volumes > 120,000 patient visits per year. Selection of Participants Eligible participants presented with reactive airway disease, shortness of breath, cough, or other respiratory complaint in which nebulized albuterol was ordered. We included in the study patients ≥ 3 years of age. Patients were excluded if they had a known history of chronic obstructive pulmonary disease or congestive heart failure, were unable to follow instructions or hold nebulizer devices, or they required positive-pressure ventilation (eg, bilevel positive airway pressure, intubation, or high-flow oxygen). The enrollment process is summarized in Figure 1. Study Protocol and Interventions Patients were screened for inclusion by the respiratory care practitioner (RCP). For pediatric patients, the severity of asthma was determined by the Pediatric Asthma Severity Score (PASS). For adult patients, the severity of asthma was determined by our modified adult asthma severity score (mAASS), which was adapted from PASS, adjusting respiratory rate and oxygenation status. Pre-treatment peak expiratory flow rates were also recorded. The RCP then
Figure 1. Flow diagram of study enrollment, exclusions, and treatment sequences for patients with asthma exacerbations who received nebulized albuterol. PASS, pediatric asthma severity score; mAASS, modified adult asthma severity score.
Volume 27, No. 6: November 2026
delivered the clinician-ordered albuterol, selecting a nebulizer device from the research bin in the ED supply closet, which was restocked by our research coordinator weekly. Treatments were administered per device protocol, and repeated doses or steroid administration were left to the clinician’s discretion. 8,9 The study focused solely on nebulizer efficiency, not medication dose standardization. For the control group (Mini), a single 15-mg albuterol dose was administered. We used this device as the control group as this was the local practice pattern. For the other three nebulizer devices, we administered an albuterol 5-mg dose, with the RCP assessing the patient after each 5-mg dose and redosing up to a total of 15. mg. The RCPs remained with the patients during their entire treatment if they were using the Aerogen, NebuTech or AeroEclipse, and for the Mini. They revaluated the patient every 15 minutes until the administration was complete. Once the patient completed their 5-, 10- or 15-mg dose, the RCP would notify the ordering clinician for re-evaluation. Methods of Measurement We used separate pediatric and adult data collection forms. We documented the nebulizer type used, chief complaint, history of pulmonary disease, and disposition (admission versus discharge). Pre- and post-treatment PASS/ mAASS and peak expiratory flow measurements were documented, as well as the dose of albuterol given. Outcome Measures Our primary outcome measure was to identify which device could deliver albuterol to the patient in the shortest time. Our secondary outcome measures were to determine which device provided the greatest improvement to possibly decrease admission rates, while improving asthma severity and peak expiratory flow. RESULTS We enrolled 296 patients in the study: 90 received treatment via the Mini, 67 via the Aerogen, 65 via the AeroEclipse, and 74 via the NebuTech. Demographic variables, including age, sex, and adult/pediatric, were comparable across groups, although the Mini and AeroEclipse devices were more frequently used in adults (P < .01; Table 1). Significant differences were observed in albuterol administration time among the four nebulizer groups (P < .01, analysis of variance). The geometric mean administration time was 60.6 minutes (95% CI, 55.9-65.3) for the Mini; 12.3 minutes (10.9-13.7) for the Aerogen; 8.7 minutes (7.7-9.7) for the AeroEclipse; and 7.9 minutes (7.0-8.8) for the NebuTech. In fully adjusted linear regression models, compared to the Mini, the Aerogen, AeroEclipse, and NebuTech devices were associated with an 82% (75-87%), 88% (82-92%), and 88% (83-92%) reduction in administration time, respectively (all P < .01). Post-hoc pairwise comparisons revealed no significant difference between the AeroEclipse and NebuTech (P = 1.00),
1613
Western Journal of Emergency Medicine
High-efficiency Nebulizers Reduce Albuterol Administration Time in the Emergency Department
McCue et al.
Table 1. Baseline demographic and clinical characteristics of emergency department patients receiving nebulized albuterol by device type in a prospective observational study. MiniHeart (n = 90)
Aerogen (n = 67)
AeroEclipse (n = 65)
Nebutech (n = 74)
P value
Age, mean (SD)
30.5 (16.6)
29.3 (18.7)
34.4 (17.2)
31.9 (18.8)
.38
Female, %, (n)
55.6 (50)
50.9 (34)
69.2 (45)
52.7 (39)
.14
Pediatric, % (n)
24.4 (22)
29.9 (20)
21.5 (14)
29.7 (22)
< .001
15.3 (37.4)
13.3 (26.1)
22.0 (46.0)
9.5 (19.6)
.18
Demographics
Clinical Outcome Length of stay, mean (SD)
Admitted, % (n) 11.1 (10) 14.9 (10) 16.9 (11) 5 (6.8) .10 Values are mean (SD) unless otherwise indicated. P values are from ANOVA for continuous variables and ꭓ2 tests for categorical variables. Length of stay is reported in hours. SD, standard deviation.
while both were significantly faster than the Aerogen (P < .01). Admission rates did not differ significantly by nebulizer type (P = .10, χ²) as noted in Table 1, including in the pediatric population, of whom only two required admission (one each in the Aerogen and Nebutech study arms). In logistic regression models, odds of admission were not significantly different across devices. However, adults had significantly lower odds of admission than pediatric patients (odds ratio 0.38, 95% CI, 0.18-0.79, P = .01). Neither peak expiratory flow improvement nor asthma severity score (mAASS/PASS) change differed significantly by device. The 95% CIs for both measures overlapped across all four groups, indicating comparable post-treatment improvements as shown in Figures 2 and 3. DISCUSSION Our results demonstrated more rapid initiation and delivery of albuterol nebulizer treatment with the vibrating- mesh and breath-enhanced nebulizers than the jet nebulizer.2,4,7 This study
presents a real-world comparison of four commonly used nebulizer devices in an academic ED, offering critical insight into their relative efficiency in delivering albuterol for asthma exacerbations. The Aerogen, AeroEclipse, and NebuTech devices significantly outperformed the traditional Mini nebulizer in terms of administration time, reducing it by > 80%. These improvements potentially have meaningful implications for clinical workflow and ED throughput, especially in highvolume or resource-limited settings. We found substantial differences in delivery time, yet no statistically significant differences were found in clinical outcomes, including post-treatment peak expiratory flow, mAASS, or hospital admission rates. This finding suggests that while device efficiency may optimize workflow, it does not necessarily translate into improved short-term clinical outcomes or hospital admission rates. It also suggests that newer nebulizer technologies are more efficient and do not compromise patient care or safety. Interestingly, our analysis also showed that adult patients were less likely to be admitted,
Figure 2. Bars indicate the percentage of paients demonstrating diminished asthma severity after treatment with one of four types of nebulizer devices. Error bars = 95% confidence intervals.
Figure 3. Bars indicate the proportion of patients whose peak expiratory flow increased after albuterol administration, based on type of nebulizer used. Error bars = 95% confidence intervals.
Western Journal of Emergency Medicine
1614
Volume 27, No. 6: November 2026
McCue et al.
High-efficiency Nebulizers Reduce Albuterol Administration Time in the Emergency Department
a finding that may reflect differing thresholds for inpatient care between pediatric and adult populations. These results align with prior studies demonstrating that breath-actuated and vibrating-mesh technologies are timelier in aerosol drug delivery than continuous jet nebulizers. However, our study adds a novel contribution by evaluating these devices side-by-side in a live ED environment, capturing the operational impact of device selection on care delivery. The RCPs expressed their preference for the NebuTech due to faster delivery time and their subjective evaluation that patients appeared better after treatment, in tandem with objective findings of improved peak epiratory flows posttreatment. They also reported that the Aerogen was the least favored nebulizer secondary to requiring both a power source and oxygen tank for medication administration, which can be difficult to find in a busy, urban ED. The data and experiences from this study have led our hospital system’s respiratory department to propose the use of the NebuTech nebulizer as the standard in our EDs.
Conflicts of Interest: By the WestJEM article submission agreement, all authors are required to disclose all affiliations, funding sources and financial or management relationships that could be perceived as potential sources of bias. No other author has professional or financial relationships with any companies that are relevant to this study. There are no other conflicts of interest or sources of funding to declare. Copyright: © 2026 McCue et al. This is an open access article distributed in accordance with the terms of the Creative Commons Attribution (CC BY 4.0) License. See: http://creativecommons.org/ licenses/by/4.0/
REFERENCES 1. Mims JW. Asthma: definitions and pathophysiology. Int Forum Allergy Rhinol. 2015;5(Suppl 1):S2-S6. 2. Leung K, Louca E, Coates AL. Comparison of breath-enhanced to breath-actuated nebulizers for rate, consistency and efficiency. Chest. 2004;126(5):1619-1627. 3. Ray J, Ari A, Restrepo R. Performance comparison of nebulizer
LIMITATIONS This study has several limitations. First, it was conducted at a single center using a convenience sampling design, limiting generalizability. Second, nebulizer device choice was influenced by device availability, rather than per protocol, introducing potential selection bias. Third, although we controlled for key covariates in regression models, unmeasured confounding (eg, severity of asthma beyond initial scoring and patient comorbidities) could have influenced outcomes such as admission rates. Fourth, we used a modified PASS score for our adult patients; this score has not been validated in prior studies. Finally, medication dosing was not standardized across all devices, reflecting real-world practice but potentially affecting treatment times. CONCLUSION In this prospective, observational study of albuterol delivery via nebulizers in asthma patients in the emergency department, the vibrating-mesh and breath-enhanced nebulizers significantly reduced administration time compared to the jet nebulization device. While clinical outcomes such as admission rates were similar across groups, the marked improvement in treatment time to initiation and completion suggests that using faster nebulizer technologies may optimize ED workflow and improve patient throughput. Future studies should evaluate the cost-effectiveness and long-term outcomes of implementing these devices in various healthcare settings.
designs: constant-output, breath-enhanced, and dosimetric. Respir Care. 2004;49(2):174-179. 4. Sadler-Moix AL, Di Paolo ER, Dolci U, et al. Physicochemical aspects and efficiency of albuterol nebulization: comparison of three aerosol types in an in vitro pediatric model. Respir Care. 2015;60(1):38-46. 5. Hess D, Fisher D, Williams P, et al. Medication nebulizer performance: effects of diluent volume, nebulizer flow, and nebulizer brand. Chest. 1996;110(2):498-505. 6. Alcoforado L, Brandão S, Rattes C, et al. Evaluation of lung function and deposition of aerosolized bronchodilators carried by heliox associated with positive expiratory pressure in stable asthmatics: a randomized clinical trial. Respir Med. 2013;107(8):1178-1185. 7. Rocha ARM, Costa CHV. Inhalation therapy in mechanical ventilation. J Bras Pneumol. 2016;42(3):235. 8. Collins N. Nebulizer therapy in cystic fibrosis: an overview. J R Soc Med. 2009;102(Suppl 1):11-17. 9. Nikander K, Denyer J, Dodd M, et al. The adaptive aerosol delivery system in a telehealth setting: patient acceptance, performance and feasibility. J Aerosol Med Pulm Drug Deliv. 2010;23(Suppl 1):S21-S27. 10. Maue DK, Krupp N, Rowan CM. Pediatric asthma severity score is associated with critical care interventions. World J Clin Pediatr. 2017;6(1):34-39. 11. Gorelick MH, Stevens MW, Schultz TR, et al. Performance of a novel clinical score, the Pediatric Asthma Severity Score (PASS), in the evaluation of acute asthma. Acad Emerg Med. 2004;11(1):10-18. 12. Tri-anim Health Services. miniHEART Hi-Flo continuous nebulizer.
Address for Correspondence: James McCue, MD, University of California, San Francisco, Department of Emergency Medicine, 115 N. Fresno Street, Fresno, CA 93701. Email: James.Mccue@ ucsf.edu.
Volume 27, No. 6: November 2026
Available at: https://www.trianim.com/ths/medication-delivery/ continuousnebulizers/miniheart-loflo-continuous-nebulizer/p/ group003694. Accessed November 6, 2025. 13. Tri-anim Health Services. AeroEclipse II reusable breathactuated
1615
Western Journal of Emergency Medicine
High-efficiency Nebulizers Reduce Albuterol Administration Time in the Emergency Department nebulizer. Available at: https://www.trianim.com/ths/medication-
com/product/Nebutech-Nebulizers/Z05-PF295424#mz-expanded-
delivery/high-performancenebulizers/aeroeclipse-xl-reusable-breathactuated-nebulizer-rban-/p/58-69010EA. Accessed November 6,
view-1023804036147. Accessed November 6, 2025. 15. HealthManagement.org. Aerogen Ultra nebulizer. Available at: https://
2025.
healthmanagement.org/products/view/icu/aerogenultra. Accessed
14. Medline. NebuTech nebulizers. Available at: https://www.medline.
Western Journal of Emergency Medicine
McCue et al.
November 6, 2025.
1616
Volume 27, No. 6: November 2026
Original Research
Shoulder Dislocation Reduction Using Inhaled Nitrous Oxide in the Emergency Department: Retrospective Case Series Katherine Vlasica, DO‡ Steven M. Hochman, MD*‡ Eric Steinberg, DO*‡ Amanda D. Russo, DO, MS† Jessica Carlo, DO‡ Bhargavi K. Patel, MBBS‡
*Hackensack Meridian School of Medicine, Department of Emergency Medicine, Nutley, New Jersey † Vassar Brothers Medical Center, Department of Emergency Medicine Poughkeepsie, New York ‡ St. Joseph’s University Medical Center, Department of Emergency Medicine, Paterson, New Jersey
Section Editor: Mark I. Langdorf, MD, MHPE Submission history: Submitted March 22, 2026; Revision received June 30, 2026; Accepted July 1, 2026 Electronically published October 26, 2026 Full text available through open access at http://escholarship.org/uc/uciem_westjem DOI 10.5811/westjem.64014
Introduction: Inhaled nitrous oxide (iNO) offers rapid onset analgesia with a favorable safety profile
yet remains underused for shoulder dislocation reductions in the emergency department (ED). The objective of this study was to evaluate the use and outcomes of iNO for shoulder reduction in the ED, including whether intravenous (IV) access was required, whether successful reduction could be accomplished without additional analgesic or sedative medications under procedural sedation, and the rate of adverse effects from iNO. Methods: We conducted a retrospective chart review of shoulder dislocation reductions using iNO at two high-volume EDs over three years (2019–2022). Data collected included age, sex, indication, procedural success, IV placement, medications administered, and adverse events and was stored in a password-protected database. The primary endpoint was successful reduction with iNO as the primary procedural analgesic; secondary endpoint was occurrence of any adverse events. Results: Of 138 patients, 125 (90.6%; 95% CI, 0.84-0.95) achieved successful reduction with iNO alone without escalation to procedural sedation; 102 patients (74%) did not require IV access. Adverse events were rare (2/138 or 1.4% [95% CI, 0.02-0.05]): one patient experienced transient agitation (a known side effect of N-methyl-D-aspartate antagonism), and one had vomiting. Both were self-limited without hemodynamic changes. Conclusion: This retrospective case series, the largest of its kind to date examining iNO for shoulder dislocation reduction, demonstrated a 90.6% success rate with minimal adverse events and reduced resource utilization compared to procedural sedation. These findings support further prospective investigation of iNO for shoulder dislocation as well as other orthopedic reductions and painful ED procedures. [West J Emerg Med. 2026;27(6)1617–1622.]
INTRODUCTION Inhaled nitrous oxide (iNO), commonly known as “laughing gas,” has been in clinical use for more than 150 years. Discovered in 1772, it took nearly 100 years for its incorporation into clinical practice. The dental profession was an early adopter after Dr. Horace Wells observed that a patient injured during a laughing gas demonstration seemed unaware of his pain until the effects of the gas wore off. The following day,
Volume 27, No. 6: November 2026
Dr. Wells underwent a molar extraction under iNO anesthesia, after which he began to use iNO when performing dental procedures. In 1864, the American Dental Association recognized him as the discoverer of iNO as an analgesic.1 In addition to its applications in dentistry, iNO became a valuable adjunct for general anesthesia and procedural sedation due to its analgesic, anesthetic, and anxiolytic properties. Its mechanism of action involves multiple pathways. Analgesia is mediated by
1617
Western Journal of Emergency Medicine
Shoulder Dislocation Reduction with Nitrous Oxide in the ED supraspinal opioid release in the periaqueductal gray matter, and the anesthetic and anxiolytic effects are attributed to N-methylD-aspartate (NMDA) receptor antagonism.2-4 Limited evidence suggests that iNO is a viable analgesic option in emergency settings.5-8 Its benefits include noninvasive administration, simple titration, and rapid onset and offset. The American Society of Anesthesiologists and American Academy of Pediatrics classify nitrous oxide at concentrations ≤ 50% as minimal sedation, excluding it from moderate procedural sedation monitoring requirements.9 Importantly, multiple large studies have demonstrated no clinically significant difference between 50% and 70% nitrous oxide in either sedation depth or adverse event profiles.10-12 Even at concentrations up to 70%, iNO still preserves hemodynamic status, spontaneous respirations, and protective airway reflexes.13 In large prospective studies, no serious adverse events—including desaturation, apnea, bradycardia, or hypotension—have been reported with nitrous oxide at concentrations up to 70%.11, 14, 15 Our institution has used iNO at concentrations up to 70% for over a decade. Despite the excellent safety profile of nitrous oxide at these concentrations10, 11, 14 and data showing that most patients remain minimally sedated even above 50%,10 our institutional policy requires continuous pulse oximetry and clinical observation of the patient. Traditional intravenous (IV)-based procedural sedation carries well-documented risks, including hypoxia (40–79 per 1,000 sedations), apnea (31/1,000), hypotension (15–28/1,000), and rare but lifethreatening events, such as laryngospasm, aspiration, and intubation.16 Despite its safety, ease of use, and effectiveness, iNO has limitations. Common side effects include nausea, vomiting, dizziness, and euphoria. Due to its high solubility (35 times greater than nitrogen), iNO is contraindicated in conditions involving air-filled spaces, including pneumothorax, bullous lung disease, bowel obstruction, middle ear effusion, recent vitreoretinal surgeries, and decompression sickness.17 Inhaled nitrous oxide is administered via a valve mask in a mixture with oxygen. The maximum percentage of iNO with paired oxygen is 70%. However, this can be adjusted based on a patient’s tolerance and oxygen saturation. Once the procedure is completed, the iNO concentration is lowered to 0%, allowing the patient to breathe 100% oxygen for one to two minutes. This prevents postdiffusion hypoxia as the absorbed nitrous oxide from the circulation is eliminated into the alveoli, potentially causing transient dilution of alveolar oxygen.18 We assembled a case series to study the efficacy and potential adverse effects of using iNO as an alternative to traditional procedural sedation for shoulder reductions in a busy urban ED. METHODS We searched our electronic health record (Cerner FirstNet, Oracle Health, Kansas City, MO) for all patients diagnosed with acute shoulder dislocation between January 1, 2019, and January 1, 2022, who had been treated with iNO as part of the Western Journal of Emergency Medicine
Vlasica et al. Population Health Research Capsule What do we already know about this issue? Existing evidence for use of inhaled nitrous oxide (iNO) in shoulder reductions in the ED is limited. What was the research question? Is iNO safe and effective for shoulder dislocation reductions in the ED? What was the major finding of the study? Shoulder reduction was successful in 125 of 138 patients (90.6%; 95% CI, 0.84-0.95) using iNO alone. How does this improve population health? Use of inhaled nitrous oxide may reduce need for procedural sedation with intravenous medication, shorten ED length of stay, and improve patient safety and resource utilization.
shoulder reduction procedure. The study was conducted in the emergency departments (ED) of a high-volume urban trauma center and an affiliated community hospital. We followed the methods of the Carey and Boden 2003 critical guide. 19 Our hypothesis was that patients could have a successful reduction of a shoulder dislocation with iNO used as a single agent in performing the procedure. Inclusion criteria included patients of any age who had been diagnosed with acute shoulder dislocation and underwent a shoulder reduction procedure performed with the use of iNO. Patients were excluded if they had a contraindication to iNO (pneumothorax, bowel obstruction, high suspicion for otitis media, severe chronic obstructive pulmonary disease, first or second trimester pregnancy, altered mental status), or if they declined its use. Patients were not excluded if they were given other medications for pain prior to the procedure. Abstractors were not blinded to the hypothesis of the study. Data collected included other medications given, whether an IV line had been placed, whether procedural sedation with other agents was used, successful reduction, any adverse effects, and final disposition, as well as general demographic information. Data were entered into a password-protected database only accessible to study personnel. The primary endpoint was successful reduction of the joint dislocation with the use of iNO as the primary procedural analgesic, without escalation to full procedural sedation. The secondary endpoint was the occurrence of any adverse reaction after
1618
Volume 27, No. 6: November 2026
Vlasica et al.
Shoulder Dislocation Reduction with Nitrous Oxide in the ED
administration of iNO. We assessed both endpoints based on documentation by the treating physician. Inhaled nitrous oxide was administered via a Porter MXR3000 Flowmeter device (Porter Instrument, Hatfield, PA), which delivers a continuous-flow, titratable nitrous oxide and oxygen mixture through a mask with a fail-safe mechanism preventing delivery of less than 30% oxygen. The iNO was initiated at 10% and titrated upward to a maximum of 70%. The target concentration was individualized, defined as the lowest concentration at which the patient no longer adversely responded to procedural manipulation while maintaining verbal responsiveness and intact protective reflexes. Continuous pulse oximetry and verbal responsiveness were monitored throughout the procedure. Upon completion of the reduction, iNO was discontinued, and 100% oxygen administered for five minutes to prevent diffusion hypoxia. The iNO was administered by ED staff trained in nitrous oxide delivery, with the treating physician present at bedside throughout the procedure. This study was granted an exemption by the institutional review board at our institution. There was no outside funding source.
procedural sedation. Of the total 138 patients, two (1.4%; 95% CI, 0.0020.051) experienced an adverse event. One patient experienced hallucinations and agitation, a known side effect of NMDA antagonist agents like iNO and was subsequently escalated to moderate sedation. The second patient experienced nausea and episodes of vomiting, also prompting escalation. In both patients, symptoms were transient and resolved with appropriate management in the ED. No patients had any significant alteration in vital signs, cardiovascular collapse, or need for airway intervention, and none required orthopedic intervention in the ED.
RESULTS In total, 138 patients were included in the case series, all of whom had successful shoulder reduction and were subsequently discharged from the ED. The majority, 103 (74.6%), were male; the remainder, 35 (25.4%), were female. The median age was 32.5 years, and seven patients (5%), were <18 years of age. The youngest patient was 14 years of age. Of the 138 patients enrolled, 125 (90.6%; 95% CI, 0.840.95) met the primary endpoint and had successful reduction with iNO as the primary analgesic and sedative agent. The remaining 13 patients (9.4%; 95% CI, 0.05-0.16) required escalation to procedural sedation for successful reduction. The median age of the patients requiring escalation was 60 years. The most common reasons were that the patient was unable to tolerate iNO or they were inadequately sedated or paincontrolled with iNO. Eleven of the 13 received propofol; a few received ketamine or etomidate, with or without propofol. All seven pediatric patients underwent successful shoulder reductions with iNO and without escalation to procedural sedation. None had any reported side effects. Although most subjects did not require procedural sedation, it is important to note that as with most patients coming to the ED in severe pain, many of these subjects had been medicated prior to reduction attempts while awaiting full evaluation and imaging. Of the 138 patients, 36 (26.1%) had an IV catheter placed, and 110 patients (79.7%) received at least one medication prior to reduction using iNO. When parenteral opioids or benzodiazepines had been administered, iNO was not initiated until the clinical effects of these agents had dissipated. Of the 28 subjects who received no premedication prior to iNO, 10.7% required escalation to Volume 27, No. 6: November 2026
DISCUSSION This case series, the largest of its kind in the medical literature, provides evidence of the safety and efficacy of iNO for shoulder dislocation reduction in the ED. More than 90% of the patients in our study had shoulder dislocations successfully reduced with iNO as the primary analgesic and sedative agent. To our knowledge, there is only one prior study of 45 patients from 27 years ago examining iNO for shoulder reductions, which found a success rate of 80.9% compared with our 90.6%.20 Intravenous medication-based procedural sedation also has an approximately 90% success rate when using IV ketamine and propofol, as found by Kruggel et al.21 However, the ease of use of iNO, its rapid onset and offset, and the rare occurrence of side effects (1.4% of patients in our case series, without vital sign compromise) make this agent a highly attractive option for procedural analgesia in the ED. Notably, only 26% of patients in our study required IV placement, and among those requiring IV access, the majority received analgesia rather than procedural sedation through the IV (Figure). The reduced reliance on IV access potentially makes iNO useful in settings where IV access and cardiac monitoring are limited, such as urgent care centers and prehospital settings. While iNO has been a more widely used alternative for moderate sedation in the pediatric ED, there is less evidence in the literature regarding its use in adults.8, 22 Herres et al conducted a prospective observational study with adult ED patients, finding significant reduction in mean pain scores using iNO in the treatment of abscesses and orthopedic injuries.23 Similarly, Xing et al conducted a systematic review assessing iNO efficacy for analgesia in adults in the ED and found it was better than placebo, although patients experienced more dizziness and vomiting.24 There is currently one ongoing multicenter randomized controlled trial (NCT05388942, planned N = 126) specifically evaluating nitrous oxide for anterior shoulder dislocation reduction in the ED.25 Prior nitrous oxide data come from mixed-procedure ED analgesia studies that do not report shoulder dislocations as a distinct subgroup. Our findings suggest that iNO is an effective alternative for analgesia and sedation during this common ED orthopedic
1619
Western Journal of Emergency Medicine
Shoulder Dislocation Reduction with Nitrous Oxide in the ED
Vlasica et al. Table. Medications administered prior to shoulder reduction procedure with inhaled nitrous oxide. Medication
Route
n
Ibuprofen
Oral
25
Acetaminophen
Oral
31
Diazepam
Oral
6
Hydromorphone
Oral
1
Ketorolac
Intramuscular
50
Midazolam
Intramuscular
1
Morphine
Intravenous
11
Fentanyl
Intravenous or intranasal
21
Intra-articular anesthetic (ropivacaine or lidocaine)
Intra-articular injection
11
procedure. It is a safe option with decreased need for close monitoring, compared with other commonly used medications, such as opioids, benzodiazepines, ketamine, and propofol. Importantly, concerns regarding cardiac arrhythmia and QT prolongation with high concentrations of iNO are not well supported. QT prolongation has been associated with volatile anesthetic agents such as isoflurane, sevoflurane, and desflurane, but not with nitrous oxide.26 Hashimoto et al demonstrated that 80% nitrous oxide did not significantly prolong the QT interval in a canine model, in contrast to halothane, thiopental, and fentanyl, and the ENIGMA-II trial (N = 7,112) found no increased cardiovascular complications with nitrous oxide use.27, 28 These data further support the favorable safety profile of iNO and its suitability for procedural use in settings where advanced cardiac monitoring may not be readily available.
with other modalities, including traditional procedural sedation. Second, our study was conducted in a single health system, with an established practice of iNO use; therefore, our results may not be reproducible at other institutions. Third, because this was a retrospective study, our data relied on the charting of individual physicians, containing variable levels of detail as to the specifics of the procedure, such as duration of iNO administration, number of attempts, response to iNO, clinical course, and any adverse effects. Fourth, given the retrospective nature of the study, we could not control for variability in preprocedural medications, which included oral analgesics, intra-articular lidocaine, parenteral opioids, and benzodiazepines. Although opioids and benzodiazepines were allowed to clinically dissipate prior to iNO initiation, residual effects may have contributed to analgesia or anxiolysis during the reduction. This heterogeneity reflects real-world ED practice but limits the ability to attribute procedural success to iNO alone. Finally, iNO concentrations were not consistently recorded; different physicians might have used varying concentrations of iNO and oxygen. A prospective randomized controlled trial comparing iNO to IV-based procedural sedation is warranted. Key outcome measures should include pre- and post-procedure pain scores, ED length of stay, duration of procedure, reduction success, number of attempts, and standardized protocols for medication administration and data collection. Such a study could address the limitations of the current evidence and further define the role of iNO in orthopedic procedures and other common painful ED interventions, such as abscess drainage, laceration repair, lumbar puncture, and arthrocentesis.
LIMITATIONS This study had several limitations. Because our caseseries study did not have a comparison group, we could not establish either superiority or noninferiority of iNO compared
Additional Considerations Occupational waste gas exposure is a perceived barrier due to reproductive concerns for pregnant staff. Early, prescavenging studies linked chronic anesthetic exposure to
Figure. Indications for intravenous line placement, by percentage, among patients requiring access. Data are presented for the subset of patients who required IV catheterization during shoulder dislocation reduction using inhaled nitrous oxide. IV, intravenous.
Western Journal of Emergency Medicine
1620
Volume 27, No. 6: November 2026
Vlasica et al.
Shoulder Dislocation Reduction with Nitrous Oxide in the ED
spontaneous abortion,29 but these studies were limited by halogenated co-exposures, unquantified iNO levels, and absent scavenging. Modern evidence indicates no association between iNO and teratogenicity, reproductive toxicity, congenital malformation,30 reduced fecundability, or miscarriage when scavenging is used.31, 32 Active scavenging and ventilation are essential, and contemporary demand-valve systems with active scavenging maintain ambient iNO well below the National Institute for Occupational Safety and Health (NIOSH) 25 ppm limit.33, 34 Additionally, brief ED procedural exposures (eg, shoulder reductions) carry substantially lower risk than prolonged operating room or dental exposures.
2. Huang C, Johnson N. Nitrous oxide, from the operating room to the
CONCLUSION This case series supports the use of inhaled nitrous oxide for shoulder dislocation reductions, as a safe and effective procedural analgesia. Although we were unable to establish the superiority of iNO over traditional methods of procedural sedation, our findings suggest that the advantages of this inhaled gas could potentially extend well beyond this procedure, offering a high benefit-risk ratio that makes it an attractive option for the ED. Further prospective studies would be valuable in evaluating iNO as monotherapy for shoulder reductions, as well as a variety of other painful ED procedures. Practical limitations of iNO include logistical barriers, such as equipment availability and maintenance, staff training, and the environmental impact of nitrous oxide as a potent greenhouse gas, all of which may affect widespread adoption.
the prehospital setting? Emerg Med J. 2005;22(12):901-908.
emergency department. Curr Emerg Hosp Med Rep. 2016;4:11-18. 3. Fujinaga M, Maze M. Neurobiology of nitrous oxide-induced antinociceptive effects. Mol Neurobiol. 2002;25(2):167-189. 4. Sanders RD, Weimann J, Maze M. Biologic effects of nitrous oxide: a mechanistic and toxicologic review. Anesthesiology. 2008;109(4):707-722. 5. Kariman H, Majidi A, Amini A, et al. Nitrous oxide/oxygen compared with fentanyl in reducing pain among adults with isolated extremity trauma: a randomized trial. Emerg Med Australas. 2011;23(6):761768. 6. Faddy SC, Garlick SR. A systematic review of the safety of analgesia with 50% nitrous oxide: can lay responders use analgesic gases in 7. Ducassé JL, Siksik G, Durand-Béchu M, et al. Nitrous oxide for early analgesia in the emergency setting: a randomized, double-blind multicenter prehospital trial. Acad Emerg Med. 2013;20(2):178-184. 8. Wattenmaker I, Kasser JR, McGravey A. Self-administered nitrous oxide for fracture reduction in children in an emergency room setting. J Orthop Trauma. 1990;4(1):35-38. 9. Practice guidelines for moderate procedural sedation and analgesia 2018: a report by the American Society of Anesthesiologists Task Force on moderate procedural sedation and analgesia, the American Association of Oral and Maxillofacial Surgeons, American College of Radiology, American Dental Association, American Society of Dentist Anesthesiologists, and Society of Interventional Radiology. Anesthesiology. 2018;128(3):437-479. 10. Zier JL, Tarrago R, Liu M. Level of sedation with nitrous oxide for pediatric medical procedures. Anesth Analg. 2010;110(5):1399-1405. 11. Zier JL, Liu M. Safety of high-concentration nitrous oxide by nasal
Address for Correspondence: Katherine Vlasica, DO, St. Joseph’s University Medical Center, Department of Emergency Medicine, 703 Main Street, Paterson, NJ 07503. Email: vlasicak@sjhmc.org. Conflicts of Interest: By the WestJEM article submission agreement, all authors are required to disclose all affiliations, funding sources and financial or management relationships that could be perceived as potential sources of bias. No other author has professional or financial relationships with any companies that are relevant to this study. There are no other conflicts of interest or sources of funding to declare. Copyright: © 2026 Vlasica et al. This is an open access article distributed in accordance with the terms of the Creative Commons Attribution (CC BY 4.0) License. See: http://creativecommons.org/ licenses/by/4.0/
mask for pediatric procedural sedation: experience with 7802 cases. Pediatr Emerg Care. 2011;27(12):1107-1112. 12. Babl FE, Oakley E, Seaman C, et al. High-concentration nitrous oxide for procedural sedation in children: adverse events and depth of sedation. Pediatrics. 2008;121(3):e528-e532. 13. Krauss B, Green SM. Sedation and analgesia for procedures in children. N Engl J Med. 2000;342(13):938-945. 14. Croughan S, Barrett M, O’Sullivan R, et al. Safety and efficacy of a nitrous oxide procedural sedation programme in a paediatric emergency department: a decade of outcomes. Emerg Med J. 2024;41(2):76-82. 15. Gao LL, Yu JQ, Liu Q, et al. Analgesic effect of nitrous oxide/ oxygen mixture for traumatic pain in the emergency department: a randomized, double-blind study. J Emerg Med. 2019;57(4):444-452. 16. Khan MT, Khan AR, Rohail S, et al. Safety of procedural sedation in emergency department settings among the adult population: a systematic review and meta-analysis of randomized controlled trials.
REFERENCES
Intern Emerg Med. 2024;19(5):1385-1403.
1. Buslov A, Carroll M, Desai MS. Frozen in time: a history of the
17. American College of Emergency Physicians. Nitrous oxide. MAP:
synthesis of nitrous oxide and how the process remained unchanged
Managing Acute Pain in the ED. Available at: https://poctools.
for over 2 centuries. Anesth Analg. 2018;127(1):65-70.
acep.org/POCTool/AcutePain(MAP)/f040e536-e11d-4d5a-ac17-
Volume 27, No. 6: November 2026
1621
Western Journal of Emergency Medicine
Shoulder Dislocation Reduction with Nitrous Oxide in the ED c55f60f82e89/. Accessed April 3, 2024.
Vlasica et al. 27. Hashimoto H, Imamura S, Watanabe S, et al. Electrophysiologic
18. O’Sullivan I, Benger J. Nitrous oxide in emergency medicine. Emerg
effects of nitrous oxide, a volatile anesthetic, in dogs following
Med J. 2003;20(3):214-217.
myocardial infarction in comparison with other anesthetics. Biol
19. Carey TS, Boden SD. A critical guide to case series reports. Spine
Pharm Bull. 1997;20(1):82-85.
(Phila Pa 1976). 2003;28(15):1631-1634.
28. Myles PS, Leslie K, Chan MT, et al. The safety of addition of nitrous
20. Uglow MG. Kocher’s painless reduction of anterior dislocation of the
oxide to general anaesthesia in at-risk patients having major non-
shoulder: a prospective randomised trial. Injury. 1998;29(2):135-137. 21. Kruggel S, Mishler A, Sullivan L. A safety comparison of single-
cardiac surgery (ENIGMA-II): a randomised, single-blind trial. Lancet. 2014;384(9952):1446-1454.
agent methohexital, ketamine, or propofol for musculoskeletal
29. Anderson M, Goldman RH. Occupational reproductive hazards
procedural sedation in the emergency department. J Emerg Med.
for female surgeons in the operating room: a review. JAMA Surg.
2022;63(2):290-295.
2020;155(3):243-249.
22. Veger ML, van Iterson J, Bakx R, et al. The role of nitrous oxide
30. Vallejo MC, Zakowski MI. Pro-Con debate: nitrous oxide for labor
in minor pediatric procedures in the emergency department: a
analgesia. Biomed Res Int. 2019;2019:4618798.
systematic review. J Pediatr Surg. 2024;59(6):1154-1162.
31. Axelsson G, Ahlborg G Jr, Bodin L. Shift work, nitrous oxide
23. Herres J, Chudnofsky CR, Manur R, et al. The use of inhaled nitrous
exposure, and spontaneous abortion among Swedish midwives.
oxide for analgesia in adult ED patients: a pilot study. Am J Emerg
Occup Environ Med. 1996;53(6):374-378.
Med. 2016;34(2):269-273.
32. Heidam LZ. Spontaneous abortions among dental assistants, factory
24. Xing Y, Zhou L, Yu J, et al. Analgesic efficacy of nitrous oxide in
workers, painters, and gardening workers: a follow up study. J
adults in the emergency department: a meta-analysis of randomized
Epidemiol Community Health. 1984;38(2):149-155.
controlled trials. Am J Emerg Med. 2022;56:92-99.
33. Messeri A, Amore E, Dugheri S, et al. Occupational exposure to
25. Tinelli M, Guler N, Goetz C, et al. Study protocol: hypnosis versus
nitrous oxide during procedural pain control in children: a comparison
standard care for shoulder dislocation reduction in the emergency
of different inhalation techniques and scavenging systems. Paediatr
department—a multicentre, randomised, controlled study protocol.
Anaesth. 2016;26(9):919-925.
BMJ Open. 2022;12(12):e062278.
34. Kicker JS, Timbie CY, Kline SL. Dosimetry as a lagging indicator
26. Lü F, Lin J, Benditt DG. Conscious sedation and anesthesia in the
of occupational exposure to nitrous oxide in pediatric sedation: a
cardiac electrophysiology laboratory. J Cardiovasc Electrophysiol.
collaborative process improvement project with industrial hygiene. Mil
2013;24(2):237-245.
Med. 2025;190(7-8):e1765-e1771.
Western Journal of Emergency Medicine
1622
Volume 27, No. 6: November 2026
Original Research
Sex Differences in Outcome and Mortality in Urinary Tract Infections in the Emergency Department: The UTILY Study *University of Campania “L. Vanvitell,” Naples, Department of Advanced Medical and Carmine Nasta, MD* † Surgical Sciences, Department of Emergency Medicine, Marcianise (Caserta), Italy Lorenzo Onorato, MD, PhD † ‡ University of Campania Luigi Vanvitelli, Department of Mental Health and Public Enrico Allegorico, MD Authors continued at end of article Medicine, Section of Infectious Diseases, Naples, Italy Section Editor: Cortlyn Brown, MD Submission history: Submitted November 6, 2025; Revision received March 28, 2026; Accepted March 25, 2026 Electronically published October 19, 2026 Full text available through open access at http://escholarship.org/uc/uciem_westjem DOI 10.5811/westjem.48903
Introduction: In urinary tract infections (UTI) sex-related differences in comorbidities, antimicrobial resistance, and outcomes have been described, but it remains unclear whether these disparities reflect sex-related biological mechanisms or are primarily explained by age and comorbidity, especially in emergency settings. Our objective was to evaluate sex-related differences in microbiology, antimicrobial resistance, and outcomes among adults with potentially multidrug-resistant UTIs presenting to the emergency department (ED), and to determine whether sex independently predicts multidrug-resistant infections and outcomes after adjustment for age and comorbidity. Methods: We conducted a prospective multicenter study enrolling all adult patients with suspected or confirmed UTIs admitted to one of the eight EDs involved from February 2023–July 2024. Our primary outcome was the prevalence of multidrug-resistant UTIs and whether sex independently predicted multidrug-resistant infection after adjustment for age and comorbidity. Secondary outcomes included hospitalization, adequacy of empirical antibiotic therapy, clinical response at 7 days, and 7-day and 30-day all-cause mortality. Demographic, clinical, and microbiological data were compared by sex. To account for baseline differences in age and comorbidity burden (Charlson Comorbidity Index), multivariable logistic regression models were applied to identify independent predictors of multidrug-resistant infection, hospitalization, and 30-day mortality. Results: We included 679 patients (358 males, 321 females). Mean age was 70.1 years (standard deviation 17.9) in males and 63.1 years (21.4) in females (P < .001). The Charlson Comorbidity Index was higher in males (2.50 [2.45]) than in females (1.85 [2.32]) (P = .01). Multidrug-resistant infection occurred in 107/321 females (33.5%) and 166/358 males (46.5%) (P = .02). Adequate empirical therapy was achieved in 213/321 females (66.2%) and 221/358 males (61.8%) (P = .10). Hospitalization occurred in 176/321 females (54.9%) and 175/358 males (48.8%) (P = .09). Sevenday mortality was 14/321 females (4.5%) and 28/358 males (7.9%) (P = .05), while 30-day mortality was 32/321 females (9.9%) and 50/358 males (14.0%) (P = .05). After adjustment for age and comorbidity, male sex remained independently associated with multidrug-resistant infection (adjusted odds ratio 1.45; 95% CI, 1.03–2.10, P sex = .02; P age = .01). Conclusion: Male sex was independently associated with multidrug-resistant urinary tract infections in the emergency department, even after adjustment for age and comorbidity. These findings highlight the need for sex- and risk-based approaches to empirical therapy and antimicrobial stewardship in acute care settings. [West J Emerg Med. 2026;27(6)1623–1630.]
Volume 27, No. 6: November 2026
1623
Western Journal of Emergency Medicine
Sex Differences in Outcome and Mortality in UTIs in the ED INTRODUCTION Urinary tract infections (UTI) are among the leading infectious causes of emergency department (ED) visits worldwide, representing a major burden for acute care services.1,2 While women experience a higher incidence of UTIs overall, men more often present with complicated infections, greater comorbidity burden, and higher rates of multidrug-resistant pathogens.2-5 Despite these recognized differences, evidence describing sex-specific clinical characteristics, microbiological profiles, and short-term outcomes in the ED setting remains limited—particularly in real-world multicenter cohorts. Moreover, the observed disparities between sexes may be at least partly driven by age and comorbidity, as male patients typically present at an older age and with higher Charlson Comorbidity Index (CCI) scores. These confounding factors complicate the interpretation of sex-related differences in infection severity, antimicrobial resistance, and outcomes. Understanding whether sex independently influences multidrug-resistance risk and clinical outcomes, beyond the effects of age and comorbidity, is crucial to guide empirical antibiotic selection and improve antimicrobial stewardship in emergency care. In this multicenter observational study we aimed to evaluate sex-related differences in clinical presentation, microbiological findings, antimicrobial resistance, and outcomes among adults with suspected or confirmed UTI presenting to eight EDs in Italy, while adjusting for age and comorbidity burden to identify independent predictors of multidrug-resistant infection and adverse outcomes. METHODS We conducted this prospective, multicenter observational study across eight EDs participating in the UTI in Italy (UTILY) study from February 2023–July 2024. Five of the eight healthcare facilities were in Naples; two in Caserta, Campania, in Southern Italy; and one in Milan, Lombardy, in Northern Italy. We included all adult patients (≥ 18 years of age) presenting to the ED with a clinical or microbiological diagnosis of UTI, or with suspected UTI based on symptoms and laboratory findings. Suspected UTI was defined as the presence of at least one urinary symptom(dysuria, urinary frequency, urgency, suprapubic pain, flank pain) or fever without an alternative source, in combination with lab findings suggestive of infection (positive urinalysis including leukocyturia and/or nitrites). We defined a urine culture growing a potential uropathogen at counts ≥ 105 colonyforming units/mL as positive. We excluded from the analysis cultures growing a mixed flora, non-speciated Streptococcus or Staphylococcus organisms or Candida species. Patients presenting with suggestive symptoms and positive urinalysis but with pending urine culture results at ED admission were initially classified as suspected UTI and were included in the study, with final classification based on Western Journal of Emergency Medicine
Nasta et al. Population Health Research Capsule What do we already know about this issue? Sex differences in urinary tract infections (UTI) exist, with men showing higher multidrugresistance rates and worse outcomes. What was the research question? Does sex independently predict multidrugresistant UTI and outcomes after adjusting for age and comorbidity in emergency department patients? What was the major finding of the study? Male sex predicted multidrug-resistant UTI (aOR 1.45; 95% CI, 1.03–2.10; P = .04; 46.5% vs 33.5%). How does this improve population health? Identifying male sex as a multidrug-resistant risk factor supports targeted treatment and stewardship, thereby improving outcomes and reducing inappropriate antibiotic use.
microbiological results when available. We retrieved information on prior microbiological diagnosis from electronic health records, referral documentation, or previous lab reports. Patients were excluded if they were < 18 years of age, had a negative urine culture, or declined to participate in the study. In all cases, decisions regarding hospital admission and the choice of the empirical treatment were made by the treating physician, according to local and international guidelines. For all enrolled patients, we collected the following information using a predefined data collection form: age; sex; and comorbidity. We calculated the CCI based on comorbid conditions only, excluding the age component, and used it as a measure of comorbidity burden. Age was analyzed separately as an independent variable in the regression models.6 Additional data collected included the following: hospitalization and antimicrobial treatment during the previous 90 days; invasive procedures in the previous 30 days; presence of devices (urinary catheter, ureteral stent, nephrostomy); any ongoing antibiotic therapy at the time of urine sample collection; severity of infection as per the Sequential Organ Failure Assessment score; presence of sepsis/septic shock; empiric antibiotic therapy; duration of treatment; hospital admission; microorganism isolated and antimicrobial susceptibility profile; clinical response at 7 days; and mortality at 7 and 30 days. Patients with 1624
Volume 27, No. 6: November 2026
Sex Differences in Outcome and Mortality in UTIs in the ED
Nasta et al. incomplete records or missing outcome data were excluded. Microbiological data included pathogen identification and antimicrobial susceptibility testing, which were used to define multidrug-resistant status. Therapeutic data encompassed both empirical and targeted antibiotic regimens. The primary outcome was multidrug-resistant infection, defined as the isolation of a pathogen resistant to at least one agent in three or more antimicrobial classes. Secondary outcomes included hospitalization, clinical response at 7 days, and all-cause mortality at 7- and 30-days following ED presentation. We summarized continuous variables as means with standard deviations or medians with interquartile ranges and compared them using the Mann–Whitney U test. Categorical variables were expressed as counts and percentages and compared using the chi-square or Fisher exact test, as appropriate. To account for potential confounding by age and comorbidity burden, we performed. multivariable logistic regression models to identify independent predictors of multidrug-resistant infection, hospitalization, and 30-day mortality. Covariates included sex, age, and CCI. Results were expressed as adjusted odds ratios (OR) with 95% confidence intervals. Model performance was evaluated using the McFadden pseudo-R², Akaike information criterion, and Bayesian information criterion. We performed statistical analyses using IBM SPSS Statistics v28.0 (International Business Machines Corp., Armonk, NY) and R version 4.3.2 (The R Foundation for Statistical Computing, Vienna, Austria). The study was approved by the ethics committee of the University of Campania “L. Vanvitelli,” Naples (No. 35,093/2023), and conducted in accordance with the principles of the Declaration of Helsinki and the Strengthening the Reporting of Observational studies in Epidemiology
(STROBE) guidelines for observational studies. Definitions The diagnoses of UTI were made in accordance with the guidelines of the European Association of Urology.7 The term multidrug resistance was applied according to the definition proposed by Magiorakos et al as acquired nonsusceptibility to at least one agent in three or more antimicrobial categories.8 The empirical treatment was defined as appropriate if it showed in vitro activity against the isolated pathogen. RESULTS Demographics and Comorbidities A total of 679 patients were included in the study, comprising 358 males (52.7%) and 321 females (47.3%). The overall mean age was 65.7 years (19.1). The comorbidity burden was assessed using the CCI, a validated scoring system that quantifies mortality risk based on weighted chronic conditions. In this cohort, CCI values ranged from 0–18. The maximum possible CCI severity score is 35 points. Male patients were significantly older than females and exhibited a higher comorbidity burden, as reflected by the CCI (2.50 (2.45) vs 1.85 (2.32); P = .01). When stratified by age group, both younger (< 65 years of age) and older men (≥ 65) maintained higher CCI scores compared with their female counterparts, indicating a consistently greater prevalence of chronic conditions among male patients across all age strata. Notably, rates of multidrug-resistant infection and 30-day mortality were consistently higher in males and older patients, highlighting the combined influence of these factors on adverse outcomes. Continuous variables were analyzed using the Mann–Whitney U test and categorical variables with the chi-square or Fisher exact test.
Table 1. Demographic and clinical characteristics by sex and age in a study evaluating sex-related differences in antimicrobial resistance and outcomes among adults with potentially multidrug-resistant urinary tract infections. <65 yrs Female (n = 263)
<65 yrs Male (n = 224)
≥65 yrs Female (n = 257)
≥65 yrs Male (n = 277)
P (Sex overall)
Age, mean(SD)
59.1 (21.4)
63.1 (17.9)
67.1 (20.2)
74.1 (12.5)
< .001
Charlson Comorbidity Index, mean (SD)
1.60 (2.00)
2.11 (2.10)
2.10 (2.35)
2.92 (2.45)
.01
Multidrug-resistant infection, %
33.5
46.5
33.5
46.5
.02
Hospitalized, %
52.3
50.4
59.6
54.2
.09
Adequate empirical therapy, %
66.2
61.8
66.2
61.8
.10
7-day mortality, %
3.2
5.5
4.5
7.9
.05
Variable
30-day mortality, % 6.8 10.4 9.9 14.0 .05 *Data are presented as mean (standard deviation) or percentage (%). Comparisons between sexes were performed using the Mann– Whitney U test for continuous variables and the chi-square or Fisher exact test for categorical variables. SD, standard deviation.
Volume 27, No. 6: November 2026
1625
Western Journal of Emergency Medicine
Sex Differences in Outcome and Mortality in UTIs in the ED
Nasta et al.
Severity of Infection Overall, 243 patients (35.7%) met sepsis criteria, and 55 (8.1%) had septic shock at presentation. Severe infection (sepsis or septic shock) was significantly more frequent among males than females (50.4% vs 37.7%; P = .02), paralleling their higher comorbidity burden. Among patients with septic shock, males exhibited a higher 30-day mortality, although the difference did not reach statistical significance. Microbiology and Resistance Among patients with available microbiological data, multidrug-resistant organisms were isolated more frequently in males than in females (46.5% vs 33.5%; P = .02). Klebsiella spp and Enterococcus spp were more commonly identified in men, whereas Escherichia Coli predominated among women. This distribution pattern was consistent across both age strata (< 65 and ≥ 65 years of age), suggesting that the higher multidrug-resistant rates observed in males were not solely age dependent. 14 Detailed pathogen distribution and antimicrobial resistance profiles are reported in Table 2 and illustrated in Figure 1. Therapy and Outcomes Adequate empirical therapy was achieved in 63% of patients overall, with no significant differences between sexes (61.8% in males vs 66.2% in females; P =.10). These findings are consistent with the results of the UTILY antimicrobial stewardship initiative, recently reported by Macera et al (in
Table 2. Isolated pathogens by sex and age in a study evaluating sex-related differences in antimicrobial resistance and outcomes among adults with potentially multidrug-resistant urinary tract infections. <65 yrs Male (%)
<65 yrs Female (%)
≥65 yrs Male (%)
≥65 yrs Female (%)
Escherichia coli
35.7
50.6
28.9
52.8
Klebsiella spp.
7.2
10.2
5.7
11.5
Enterococcus spp.
7.1
2.3
5.8
2.7
Pseudomonas spp.
2.7
0.4
2.2
0.8
Proteus spp.
3.1
1.9
2.5
1.9
Pathogen
Other 44.2 34.6 54.9 34.1 organisms The distribution of isolated pathogens differed significantly between sexes (χ² test, P < .001), with E coli more frequently isolated in female patients and non-E coli pathogens, particularly Enterococcus spp., more common among males. In contrast, no significant differences in pathogen distribution were observed between age groups (< 65 vs ≥ 65 years; P = .73).
Western Journal of Emergency Medicine
press), which demonstrated improved antibiotic selection in ED settings through a persuasive stewardship approach.15 Approximately 50% of the patients required hospitalization, with comparable rates between men and women (48.8% vs 54.9%; P =.09). Mortality rates, however, were higher among males, both at 7 days (7.9% versus 4.5%) and 30 days (14.0% versus 9.9%; P = .05). The sex-related gap in short-term outcomes persisted within the ≥ 65 years of age subgroup, in which men also exhibited a greater burden of comorbidities and a higher prevalence of multidrugresistant infections. These findings suggest that the combined impact of comorbidity and multidrug-resistant infection may partially account for the worse outcomes observed in male patients. Older adults (≥ 65 years of age) showed markedly higher rates of hospitalization, multidrug-resistant infection, and mortality compared with younger patients. Across both age strata, males exhibited a greater prevalence of multidrugresistant pathogens, higher short-term (7-day) and 30-day mortality, and slightly lower adequacy of empirical antibiotic therapy than females, despite comparable hospitalization rates. These differences were most pronounced among older men (≥ 65 years of age), who also had the highest comorbidity burden. In multivariable logistic regression, male sex (OR ≈ 1.6; 95% CI, 1.1–2.4) and higher CCI independently predicted multidrug-resistant infection, whereas older age and comorbidity burden were strongly associated with 30-day mortality. Overall, these findings underscore the synergistic influence of sex and age on infection severity, resistance patterns, and treatment response in patients presenting with UTIs to the ED. We performed a secondary multivariable
Figure 1. Multidrug-resistant infection rate by sex and age group among patients presenting to the emergency department with a urinary tract infection. MDR, multidrug-resistant.
1626
Volume 27, No. 6: November 2026
Sex Differences in Outcome and Mortality in UTIs in the ED
Nasta et al. analysis including sepsis and septic shock at presentation to further explore whether disease severity influenced these associations. When disease severity (sepsis or septic shock) was included in the regression model, male sex remained independently associated with multidrug-resistant infection (adjusted OR 1.38; 95% CI, 1.01–1.95; P = .04), while sepsis/ septic shock at presentation independently predicted 30-day mortality (adjusted OR 3.20; 95% CI, 1.90–5.35; P < .001). The inclusion of severity in the model slightly attenuated the effect size of sex on mortality, suggesting that part of the observed sex difference may be mediated by higher infection severity among males. Key findings show that older age and male sex are independently associated with worse outcomes, including significantly higher hospitalization rates, multidrug-resistant infection, and 7- and 30-day mortality. Notably, males > 65 years of age had the worst outcomes and the lowest rate of adequate empirical therapy, while clinical response was significantly lower overall in males. Predictors of Multidrug-Resistant Infection In the multivariable logistic regression model adjusted for age and comorbidity burden, male sex remained an independent predictor of multidrug-resistant UTI (adjusted OR 1.45; 95% CI, 1.03–2.10; P = .04). This association persisted despite adjustment for age and CCI, suggesting that male sex contributes to the risk of antimicrobial resistance beyond baseline clinical differences.16 Although older age (≥ 65 years) was also associated with a higher prevalence of multidrug-resistant isolates (OR 1.50; 95% CI, 1.0–2.3), its effect appeared partly mediated by the greater comorbidity burden observed in elderly patients. A higher CCI showed a borderline association with multidrug-resistant infection (P = .06), consistent with the cumulative impact of chronic conditions on infection complexity and resistance selection. No formal interaction between sex and age was detected; however, the combination of male sex and advanced age identified a subgroup of patients
Figure 2. Thirty-day all-cause mortality by sex and age group among emergency department patients with urinary tract infection.
at particularly elevated risk for multidrug-resistant infection. These findings highlight that sex, age, and comorbidity act as interrelated but distinct determinants of antimicrobial resistance in the emergency setting. Recognition of these factors may support risk stratification at ED presentation, helping clinicians identify patients at higher risk of multidrugresistant infection. Rather than implying systematic use of broader spectrum antibiotics, these findings should be interpreted in the context of clinical severity, prior antibiotic exposure, and local resistance patterns, to support individualized empirical therapy and antimicrobial stewardship strategies. DISCUSSION This multicenter study demonstrates that both sex and age significantly influence the risk of multidrug-resistant UTIs
Table 3. Outcomes, multidrug resistance, and empirical therapy adequacy by sex and age group in a study evaluating sex-related differences among adults with potentially multidrug-resistant urinary tract infections. Variable
Female <65
Male <65
Female ≥65
Male ≥65
P (sex)
P (age)
Multidrug-resistant infection (%)
33.5
46.5
33.5
46.5
.02
.01
Hospitalization rate (%)
48.0
45.0
60.5
52.0
.08
<.01
7-day mortality (%)
2.0
3.5
6.5
9.0
.04
<.01
30-day mortality (%)
5.5
7.0
12.0
16.0
.03
<.01
Adequate empirical therapy (%)
69.0
64.0
63.0
59.0
.09
.12
Clinical response at 7 days (%)
88.0
80.0
85.0
75.0
.02
.03
Volume 27, No. 6: November 2026
1627
Western Journal of Emergency Medicine
Sex Differences in Outcome and Mortality in UTIs in the ED
Nasta et al.
and the clinical presentations in the ED, as well as associated clinical outcomes. Male patients were generally older, had a higher comorbidity burden, and exhibited a greater prevalence of multidrug-resistant pathogens compared with females,1-4 particularly among those ≥ 65 years of age. These findings are consistent with multicenter ED cohorts and population datasets showing higher multidrug-resistance rates in men and in older adults and support male sex as an independent risk factor for multidrug-resistant infection, even after adjustment for age and comorbidity burden (adjusted OR 1.45; 95% CI, 1.03–2.10).9,10,14 The observed sex differences likely reflect a complex interplay of biological, behavioral, and clinical factors. Male patients more frequently present with complicated infections, prior antibiotic exposure, and structural urinary abnormalities, which may contribute to resistance selection. The association between older age, comorbidity burden, and multidrugresistant infection further underscores the cumulative vulnerability of elderly males, who also demonstrated higher 30-day mortality and lower adequacy of empirical therapy.3,5 Although hospitalization rates were similar between sexes, the higher mortality among men suggests that initial disease severity or suboptimal empirical coverage may partially explain these differences.9 Importantly, when adjusting for sepsis and septic shock at presentation, male sex remained independently associated with multidrug-resistant infection, whereas disease severity emerged as the strongest determinant of short-term mortality. This indicates that part of the observed sex difference in outcomes is mediated by greater initial infection severity among men, consistent with prior sepsis cohorts. Integrating severity assessment into risk stratification models may, therefore, refine early management decisions and improve outcome prediction. These observations are consistent with the additional multivariable analyses performed in our cohort, which showed that infection severity (sepsis or septic shock) significantly contributed to the disparity in short-term outcomes between sexes. This underscores the importance of early recognition of sepsis and risk-adapted management strategies, particularly among high-risk subgroups, such as older male patients. Incorporating both severity and sex-based risk factors into ED decision-making may refine empirical treatment selection, support more personalized care pathways, and potentially reduce treatment failure. Future prospective studies should evaluate the impact of such personalized, risk-adapted approaches on patient-centered outcomes and antimicrobial resistance trends. Our results are consistent with prior inpatient and community-based studies identifying male sex, recent hospitalization, and antibiotic exposure as key predictors of multidrug-resistant uropathogens.1-3 However, our study extends these findings to the ED population, where rapid empirical decision-making is critical and microbiological
results are often unavailable at presentation. The identification of sex and age as readily available clinical predictors can, therefore, support more precise risk stratification and early optimization of antibiotic therapy in acute care. Emerging ED tools (eg, the González del Castillo multidrug-resistant risk scale) may help operationalize this approach when combined with local antibiograms.10,11 Incorporating these demographic and clinical factors into ED triage algorithms and empirical treatment protocols may enhance antimicrobial stewardship and improve short-term outcomes.1,4 This aligns with the findings of the recent UTILY stewardship substudy (Macera et al, in press), which demonstrated that persuasive antimicrobial stewardship interventions can significantly optimize antibiotic use in ED patients with UTI.15 In particular, a tailored therapeutic strategy—including broader initial empirical coverage for elderly male patients with multiple comorbidities, followed by timely de-escalation once culture results are available—could balance effectiveness and antimicrobial stewardship goals. Evidence from ED sepsis cohorts suggests that choosing agents with ≥ 70% on-arrival susceptibility based on institutional antibiograms is associated with lower in-hospital and 30day mortality and shorter intensive care unit stay; consensus guidance for UTI management similarly emphasizes riskadapted empiric therapy and early review for de-escalation.12-13
Western Journal of Emergency Medicine
LIMITATIONS This study has several limitations. Our cohort reflects ED presentations rather than the full spectrum of community UTIs. The lack of standardized microbiological sampling across centers and incomplete culture data in some cases may also affect pathogen distribution estimates. Additionally, details on antibiotic timing and dosage were unavailable. Nevertheless, the multicenter design, large sample size, and inclusion of consecutive ED patients strengthen the external validity and generalizability of the findings. Although we used the CCI as a standardized measure of comorbidity burden, this index does not capture all factors associated with the risk of multidrug-resistant infections. In particular, variables such as cumulative antibiotic exposure, residence in long-term care facilities, or detailed healthcare contact history were not systematically collected and may represent additional confounders. Age was analyzed using a ≥ 65-year threshold, which is commonly used to define older adult populations. However, this approach may mask heterogeneity within the younger age group, and future studies could explore more granular age stratification. Future prospective studies are warranted to validate these observations and to evaluate whether integrating sex- and age-based empirical therapy algorithms into emergency care pathways can improve early outcomes and reduce antimicrobial resistance in patients with urinary tract infection.11
1628
Volume 27, No. 6: November 2026
Sex Differences in Outcome and Mortality in UTIs in the ED
Nasta et al. CONCLUSION Patients presenting to the ED with urinary tract infections show distinct clinical and microbiological patterns influenced by both sex and age. Male and older patients were more likely to harbor multidrug-resistant pathogens and to experience worse short-term outcomes, and male sex remained an independent predictor of multidrug-resistant infection after adjustment for age and comorbidity. These findings highlight the need to incorporate sex- and age-based risk assessment into empirical antibiotic selection in the emergency setting, and may help identify patients at higher risk of multidrugresistant infection and support risk-adapted empirical therapy. Such an approach may improve the adequacy of initial therapy and reduce adverse outcomes. ETHIC STATEMENT The study was approved by the ethics committee of the University of Campania L. Vanvitelli, Naples (n◦35,093/2023). All procedures performed in this study were in accordance with the ethical standards of the institutional and/or national research committee and with the 1964 Helsinki Declaration and its later amendments or comparable ethical standards. Informed consent was obtained from all participants included in the study. AUTHORS CONTINUED Francesca Palumbo, MD* Biagio Migliaccio, MD§ Adelaide Mariniello, MD|| Federica Esposito, MD# Alessandro Manzoni, MD¶ Antonio Voza, MD, PhD** Margherita Macera, MD, PhD† Caterina Monari, MD, PhD† Romeo Giordano, MD* Fabio Giuliano Numis, MD‡ Giovanna Guiotto, MD§ Rosa Raucci, MD|| Ferdinando Dello Vicario, MD# Rodolfo Nasti, MD¶ Mauro Giordano, MD, PhD* Nicola Coppola, MD, PhD† UTILY study group: Lorenzo Onorato†, Margherita Macera†, Caterina Monari†, Ilaria De Luca†, Annabella Salvati†, Alessandro Cornelli†, Nicola Coppola†, Fabio Giuliano Numis‡, Enrico Allegorico‡, Monica Vanni‡, Piero Bianco‡, Stefano Aiello‡, Antonio Carannante‡, Nicola Compagnone‡, Carmen Rapuano‡, Marina D’Isanto‡, Biagio Migliaccio§, Nicoletta Vitelli§, Francesca Delgado§, Giovanna Guiotto§, Carmine Nasta*, Romeo Morelli*, Francesca Palumbo*, Alfredo Palumbo*, Mauro Giordano*, Maria Teresa Florio||, Anna Amato||, Anna Santagata||, Adelaide Mariniello||, Nicola Quaranta||, Vincenza Serrao||, Augusto Delle Femine||, Volume 27, No. 6: November 2026
Ilaria Guida||, Annalisa Amelia||, Federica Miglietta||, Rosa Raucci||, Roberta Sciorio#, Kim Russo#, Federica Esposito#, Filomena Fabozzi#, Luca De Capua#, Gennaro Maria Borrelli¶, Rosa Giamattei¶, Raffaella Coppola¶, Rodolfo Nasti¶, Evaluna Perez Guillen**, Antonio Voza** Ospedale Santa Maria delle Grazie, ASL Napoli 2 Nord, Unità Operativa Complessa Medicina d’Emergenza ed Urgenza, Pozzuoli (Naples), Italy § Ospedale del Mare, ASL Napoli 1 Centro, Unità Operativa Complessa Medicina di Emergenza-Urgenza, Naples, Italy || Pronto Soccorso, P.O. Moscati Aversa (Caserta), Italy # Ospedale San Giuliano, Asl Napoli 2 Nord, Unità Operativa Semplice Dipartimentale Pronto Soccorso-Osservazione Breve Intensiva, Giugliano (NA), Italy ¶ Ospedale Betania, Pronto Soccorso, Napoli, Italy **IRCCS Humanitas Research Hospital, Department of Biomedical Sciences, Milan, Italy ‡
Address for Correspondence: Mauro Giordano, MD, PhD, University of Campania “L. Vanvitelli”, Department of Advanced Medical and Surgical Sciences, P.zza Miraglia 5, Pad 2-Est, 80138 Naples, Italy. Email: Mauro.giordano@unicampania.it. Conflicts of Interest: By the WestJEM article submission agreement, all authors are required to disclose all affiliations, funding sources and financial or management relationships that could be perceived as potential sources of bias. No author has professional or financial relationships with any companies that are relevant to this study. There are no conflicts of interest or sources of funding to declare. Copyright: © 2026 Nasta et al. This is an open access article distributed in accordance with the terms of the Creative Commons Attribution (CC BY 4.0) License. See: http://creativecommons.org/ licenses/by/4.0/
REFERENCES
1629
1. Tenney J, Hudson N, Alnifaidy H, et al. Risk factors for acquiring multidrug-resistant organisms in urinary tract infections: a systematic literature review. Saudi Pharm J. 2018;26(5):678-684. 2. Barré SL, Elbourne A, Young V, et al. Risk factors for antibioticresistant urinary pathogens in the community: a systematic review and meta-analysis. Front Microbiol. 2021;12:736856. 3. Madrazo M, Esparcia A, López-Cruz I, et al. Clinical impact of multidrug-resistant bacteria in older hospitalized patients with community-acquired urinary tract infection. BMC Infect Dis. 2021;21:1232. 4. Milovanovic T, Dumic I, Veličkovic J, et al. Epidemiology and risk factors for multidrug-resistant hospital-acquired urinary tract infection in patients with liver cirrhosis. BMC Infect Dis. 2019;19:141. 5. Bitew G, Kefyalew F, Alemie G. Burden of multidrug-resistant bacterial isolates and risk factors among urinary-tract–infected
Western Journal of Emergency Medicine
Sex Differences in Outcome and Mortality in UTIs in the ED
Nasta et al.
patients in geriatrics. Sci Rep. 2025;15:89123.
Med. 2023;65(1):1-6.
6. Charlson ME, Pompei P, Ales KL, et al. A new method of classifying
12. Empiric antibiotic on-arrival susceptibility ≥70% and mortality
prognostic comorbidity in longitudinal studies: development and
in emergency department sepsis: association between local
validation. J Chronic Dis. 1987;40(5):373-383.
antibiogram susceptibility and patient outcomes. Clin Microbiol
7. Bonkat G, Bartoletti R, Bruyere F, et al. EAU guidelines on
Infect. 2023;29(6):765-771.
urological infections. 2024. Available at: https://uroweb.org/
13. WikiGuidelines UTI Team. UTI WikiGuidelines consensus:
guidelines/urological-infections. Accessed September 12, 2024.
prevention, diagnosis, and management recommendations,
8. Magiorakos AP, Srinivasan A, Carey RB, et al. Multidrug-resistant,
including stewardship and reassessment. JAMA Netw
extensively drug-resistant and pandrug-resistant bacteria: an international expert proposal for interim standard definitions for
Open. 2024;7(11):e2444495. 14. Monari C, Onorato L, Cornelli A, et al; UTILY Study Group.
acquired resistance. Clin Microbiol Infect. 2012;18(3):268-281.
Prevalence and outcomes of urinary tract infections caused by
9. Camps-Villar M, Roig-Maya J, Sánchez-Martín F, et al. Gender
Enterobacterales resistant to third-generation cephalosporins
differences in multidrug-resistant Escherichia coli urinary tract
in the emergency department: results from the UTILY cohort, a
infections: a multicenter analysis in Southern Europe. BMC Urol. 2024;24:1654.
prospective multicentre study. Infection. 2025;53(5):2061-2072. 15. Macera M, Salvati A, Allegorico E, et al; UTILY Study Group. Impact
10. Gajdács M, Urbán E, Tóth Á, et al. Trends and predictors
of a persuasive antimicrobial stewardship program on antibiotic use
of antimicrobial resistance among urinary tract infection
in patients admitted to the emergency department for urinary tract
pathogens: a 10-year multicenter retrospective study. BMC Infect
infections: a multicentre prospective study. Antimicrob Resist Infect
Dis. 2024;24:9086. 11. González del Castillo J, et al. Predictive model for multidrug-
Control. 2025;14(1):154. 16. UTILY Study Group. Prevalence and impact of multidrug resistance
resistant bacteria in emergency department urinary tract
in a cohort of patients with urinary tract infection in eight emergency
infections: performance metrics by risk groups. J Emerg
departments. Eur J Intern Med. 2025;133:93-99.
Western Journal of Emergency Medicine
1630
Volume 27, No. 6: November 2026
Original Research
Perspectives on Influenza Vaccination Among COVID-19 Unvaccinated Patients in US Emergency Departments: A Qualitative Study Cindy Li*º Jaran White†º Anna Tupetz, DPT, MSc‡ Alena Pauley, MScGH§ Rachel E. Geyer, MPH|| Kelli N. O’Laughlin, MD, MPH#¶ Herbert C. Duber, MD, MPH¶** Kristin Rising MD, MSHP††‡‡ Alexzandra T. Gentsch, MSW‡‡ Robert M. Rodriguez, MD§§& Stephanie A. Eucker, MD, PhD||||&
*University of Colorado, Anschutz School of Medicine, Aurora, Colorado † University of North Carolina at Chapel Hill, Department of Psychology and Neuroscience, Chapel Hill, North Carolina ‡ Duke University, Department of Emergency Medicine, Durham, North Carolina § University of California San Diego, University of California San Diego School of Medicine, La Jolla, California || University of Washington, Department of Family Medicine, Seattle, Washington # University of Washington, Department of Global Health, Seattle, Washington ºThese authors contributed equally to this work. & These authors also contributed equally to this work. Institutions continued at end of article
Section Editor: Stephen Liang, MD, MPHS Submission history: Submitted February 3, 2026; Revision received July 30, 2026; Accepted August 3, 2026 Electronically published October 29, 2026 Full text available through open access at http://escholarship.org/uc/uciem_westjem DOI 10.5811/westjem.62236
Introduction: Efforts to increase influenza vaccine acceptance must consider the importance of patient education and familiarity with vaccinations and influenza in the emergency department (ED), particularly for populations without another primary source of healthcare. This is the first study, to our knowledge, to assess in-depth perceptions regarding the influenza vaccine and identify barriers and facilitators to influenza vaccination among COVID-19 unvaccinated adult ED patients. Methods: We conducted a qualitative idiographic interview study from July 12, 2021, to September 24, 2021, at four EDs in urban cities across the United States. We recruited adult ED patients (18 years and older) unvaccinated for COVID-19, without a primary care clinician, who were fluent in either English or Spanish. The primary finding was a detailed understanding of patient perceptions regarding the influenza vaccine, with secondary findings assessing influenza vaccination rates, barriers and facilitators to being vaccinated, sources of information, and future vaccination intentions. We used a content analysis approach to identify themes around patient experiences, concerns, barriers, information sources, and future intentions regarding influenza vaccination. Results: Of 65 participants interviewed, 48 discussed the influenza vaccine and were included in this analysis. Among these participants, the median age was 34 years, 21 (43.8%) were women, and 14 (29.2%) were Hispanic. We found three core themes influencing influenza vaccine hesitancy: 1) previous experiences with influenza illness and/or the vaccine; 2) knowledge about the influenza vaccine; and 3) confidence in vaccine safety and effectiveness. In our cohort, 10 (20.8%) participants demonstrated knowledge of the purpose and mechanism of the influenza vaccine. In addition, 14 (29.2%) patients suggested they would accept the vaccine if offered, while 18 (37.5%) patients stated they did not plan to receive the influenza vaccine and/or expressed strong hesitancy due to concerns about lack of vaccine effectiveness, fear of side effects, and lack of concern regarding influenza illness. Conclusion: Our findings identify an important barrier that could be overcome by ED-based vaccine education, particularly for underserved patient populations. Interventions to increase influenza vaccine uptake could focus on overcoming hesitancy related to prior experiences and understanding of vaccine safety and effectiveness. [West J Emerg Med. 2026;27(6)1631–1641.]
Volume 27, No. 6: November 2026
1631
Western Journal of Emergency Medicine
Influenza Vaccination Among COVID-19 Unvaccinated Patients in US EDs INTRODUCTION Vaccine hesitancy is defined by the Sage Working Group on Vaccine Hesitancy as “a delay in acceptance or refusal of vaccination despite the availability of vaccination services.”1 Vaccine hesitancy, as a contributor to influenza illness, was cited as one of the top 10 threats to global health by the World Health Organization as recently as 2019. During the 2023– 2024 season, influenza accounted for 18 million healthcare visits, 470,000 hospitalizations, and 28,000 deaths.2 During influenza seasons, emergency departments (ED) consistently experience higher patient census, with longer wait times, more admission holds, and poorer patient outcomes generally linked to an increase in flu-related ED visits. In November 2022, the American College of Emergency Physicians, along with other organizations, authored a letter to the U.S. President Joseph Biden describing the threat that ED admission holds—known as “boarding”—place on the healthcare system, painting “a picture of an emergency care system already near collapse.” Specifically, this letter highlighted a “triple-threat” that influenza, respiratory syncytial virus (RSV), and COVID-19 pose, in addition to the lack of inpatient hospital beds overwhelming EDs.3–5 In the same month, the American Academy of Pediatrics and the Children’s Hospital Association urged the president to declare a national emergency due to rising influenza rates and an unprecedented surge in RSV among the pediatric population, with multiple states reporting hospitalizations exceeding 100% of their pediatric bed capacity.6,7 Thus, there is an urgent need to prevent influenza-related hospitalizations through public health efforts. Influenza vaccines have been identified as the most effective method of mitigating rates of symptomatic influenza illness, hospitalization, and mortality.8 Furthermore, influenza vaccination has been associated with lower odds of severe COVID-19 outcomes such as hospitalization and death.8–10 Despite this evidence, in the 2024–2025 season only 44.0% of U.S. adults and 44.5% of children were vaccinated against influenza.11 Additionally, a 2025 study demonstrated that influenza vaccination rates decreased by 6.41 percentage points post-pandemic relative to pre–COVID-19 levels.12 Recent U.S. statistics show that influenza vaccine history is closely linked to COVID-19 vaccine acceptance, with influenza vaccinators significantly more likely to receive COVID-19 vaccination.13,14 Issues with low vaccination rates and vaccine hesitancy are further complicated by racial, ethnic, and socioeconomic disparities in the U.S. Non-Hispanic White and Asian individuals have higher vaccination rates than those of other populations, and Hispanic and Black individuals demonstrate the lowest rates among the public.15–17 Low-income status relative to the poverty level has been identified as one of the strongest factors associated with influenza vaccine hesitancy and poor influenza outcomes.18 Compounding this, individuals from low socioeconomic backgrounds experience a greater Western Journal of Emergency Medicine
Li et al. Population Health Research Capsule
What do we already know about this issue? Influenza vaccine hesitancy and poor influenza outcomes correlate with socioeconomic factors common among emergency department (ED) patient populations. What was the research question? We sought to qualitatively characterize perceptions of, barriers to, and facilitators of influenza vaccination among COVID-19 unvaccinated adult ED patients. What was the major finding of the study? Barriers to influenza vaccination among ED patients included concerns about vaccine effectiveness, side effects, and lack of concern regarding influenza illness. How does this improve population health? Our detailed findings offer valuable insights to inform ED-based education interventions to improve influenza vaccine uptake among vulnerable populations.
burden related to illnesses like influenza due to rapid spread of the virus in close living quarters, limited access to healthcare services, and employment that penalizes workers for missed workdays.18 Additional factors that contribute to influenza and COVID-19 vaccine hesitancy include lower level of education, younger age, and lack of healthcare insurance.19–23 Thus, efforts to increase influenza vaccination rates must address the differential impacts of vaccine hesitancy and influenza illness stemming from social determinants of health and increase vaccine acceptance among these underserved populations. The ED serves all patients as a safety net within the broader U.S. healthcare system, with patients from lowerincome backgrounds, lower educational attainment, and without healthcare coverage disproportionately receiving care in the ED.24,25 The ED population also comprises patients with no primary care clinician, who thus have little to no access to the healthcare system beyond the ED. As such, the ED may serve as a critical site for delivering both information and influenza vaccination to populations that are typically the most vaccine-hesitant and under-vaccinated, thereby effectively addressing disparities and providing equitable access to influenza vaccination and vaccine education. Existing studies aiming to understand influenza vaccine hesitancy in adult ED populations have primarily used one of
1632
Volume 27, No. 6: November 2026
Li et al.
Influenza Vaccination Among COVID-19 Unvaccinated Patients in US EDs
two methodologies: quantitative designs to measure vaccine uptake; or interventional studies to increase vaccine willingness, which may involve preintervention and postintervention feedback.26–29 These studies have consistently demonstrated that hesitancy is a major barrier to vaccination and that educational interventions in the ED can improve vaccination rates. However, to our knowledge, no studies have used in-depth qualitative analysis to understand the key beliefs, experiences, and concerns that underlie vaccine hesitancy among adult ED patients. The qualitative methodology is essential for identifying and characterizing, with greater nuance, the variety of factors driving hesitancy, and it is needed to inform the design of future interventions to improve vaccination efforts. In response to COVID-19 and influenza vaccine disparities among diverse populations, including historically underserved communities, we developed a research program, Promotion of COVID-19 Vaccination in the Emergency Department (PROCOVAXED). We conducted in-depth qualitative interviews of vaccine-hesitant patients whose primary healthcare access occurs in EDs and then created population-specific COVID-19 vaccine messaging platforms (videos, informational flyers, and scripts for face-to-face emergency clinician messaging) to address identified COVID-19 vaccine concerns and promote vaccine uptake.30 Subsequently, in a cluster-randomized controlled trial, we demonstrated that implementation of COVID-19 vaccine messaging platforms in EDs led to greater COVID-19 vaccine acceptance and uptake among unvaccinated ED patients, with larger effect sizes among Hispanic participants and those without primary care.31 To address the similarly important topic of low influenza vaccine uptake in underserved ED populations, we analyzed influenza-related interviews conducted as part of our overall PROCOVAXED study to explore patient perceptions specific to influenza vaccine willingness and hesitancy. METHODS In this descriptive idiographic qualitative study, we conducted semistructured interviews with ED patients who had not received a COVID-19 vaccine and were enrolled in a parent study, PROCOVAXED (clinicaltrials.gov ID: NCT05142332).32 The study was approved by institutional review boards (IRB) at each study site, with a central IRB overseeing study activity. The recruitment period for this study extended from July 12, 2021, to September 24, 2021. The study was conducted within four urban EDs at hospitals located in four U.S. states. Research personnel used electronic health records to screen patients who were potentially eligible and actively seeking treatment within these EDs. Inclusion criteria included adults (≥18 years of age) with no primary care visits in the prior year who had not yet received a COVID-19 vaccine. Exclusion criteria were as follows: being unable to consent (consent consisted of the patient being clinically sober and able to fully understand the risks and Volume 27, No. 6: November 2026
benefits of the study); living in a nursing facility; being incarcerated; experiencing trauma or psychiatric chief complaint; being under suspicion of acute COVID-19 illness; and being unable to communicate in English or Spanish. Prior knowledge about either the COVID-19 or influenza vaccines was not required for participation. Research personnel approached potential participants to screen for eligibility and interest, and each participant provided written informed consent. Interview guides were developed using existing literature and data from our REVVED UP survey study,23 and were reviewed by both the study team and the COVID-19 Research Patient and Community Advisory Board located at the central institution.23,32 Following instruction and training from coinvestigators in interview techniques and data collection, research coordinators obtained participant consent and conducted qualitative interviews in the ED. Questions during the interview focused on perceptions, trusted messengers for vaccine communication, and barriers participants may face to the COVID-19 vaccination, and subsequently included a second section exploring participants’ experiences with and opinions of influenza and influenza vaccines, the data from which are the focus of this analysis. Spanish interviews were conducted by a certified Spanish-speaking team member. The study team always attempted to ask all participants questions about the influenza vaccine; however, this was not always possible due to time constraints and the primary focus on COVID-19 vaccines. All participants who completed any portion of the influenza component of the interview were included in the present study. Interviews were performed using semistructured guides (Table 1) and recorded on handheld audio recorders. Each participant’s demographic information was entered into a secure Research Electronic Data Capture (REDCap) database. The sample size was not predetermined, and participant enrollment continued until thematic saturation of the primary interview guide was achieved, as evaluated through transcription assessment at regular intervals. There was no independent enrollment target for the influenza-focused portion of the study. Data Analysis For this substudy, we conducted a content analysis of all data identified in the parent study as pertaining to influenza and influenza vaccination.33 We created the codebook (Table 2) to analyze this influenza-specific data using inductive and deductive coding. The initial codebook used the same themes and codes identified in the COVID-19 data from the parent study, given the similarity of questions, and additional emergent codes were added for topics unique to the influenza-related responses. Each code was explicitly defined, with detailed descriptions and examples. Two independent reviewers conducted the coding process—each reviewed all material and assigned quotes to codes, then identified any inconsistencies in coding, and met to discuss and resolve discrepancies.
1633
Western Journal of Emergency Medicine
Influenza Vaccination Among COVID-19 Unvaccinated Patients in US EDs
Li et al.
Table 1. Semistructured interview guide used to interview study subjects In a qualitative study on perspectives about influenza vaccination among COVID-19 unvaccinated patients in the emergency department. Primary Interview Question Have you ever heard of flu vaccines?
Follow-Up Questions If yes: 1. What have you heard?
Have you ever had a flu vaccine?
If yes: 1. When was the last time you got it? 2. Where did you get it? If no: 1. Have you ever been offered a flu vaccine? a. If yes: What are the reasons that you did not get it when you were offered? b. If no: Would you want to get a flu vaccine? i. If yes: What has made it hard for you to get? ii. If no: Why would you not want to get a flu vaccine?
If you were offered a flu vaccine this year, would you accept it?
If yes: 1. Do you know of any barriers to getting a flu vaccine? 2. Have you had a place to get it? If no: 1. What are the reasons you would not accept it? 2. What specific concerns or worries have you had about the vaccine? (eg, side effects)
RESULTS We interviewed 65 participants across all sites in the PROCOVAXED parent study, of whom 48 participants (73.8%) completed the portion of the interview relating to influenza and/or influenza vaccination and are included in these results. Of these, 27 (56.2%) identified as male, 14 (29.2%) identified as Hispanic, and 6 (14%) were interviewed in Spanish (Table 3). Themes, codes, and selected quotes from participant responses are available in Table 4. Theme 1: Experience with Past Influenza Illness and Vaccinations Of the 48 participants included in this analysis, 3 individuals stated they had not heard of the influenza vaccine at the time of their interview. Eight participants received the vaccine annually, seven previously received the vaccine but no longer do, and 12 did not receive and had not ever received the vaccine. When discussing reasons for either accepting or refusing the influenza vaccine, most participants described experiences (whether their own or of others) of contracting influenza and/ or receiving vaccinations in years past. Six patients cited prior experiences contracting influenza after receiving the vaccine, “I noticed…every time I got vaccinated for the flu I ended up getting sick—end up getting the flu” (male, 34 years old [y/o)). Six other patients described experiences with adverse side effects after vaccination, thus leading to their hesitancy or refusal to continue receiving the vaccine, “I’ve gotten sick from [the flu vaccine], too. But I don’t take no more flu shots” Western Journal of Emergency Medicine
(male, 42 y/o). Five individuals were unmotivated to receive the vaccine because they had never contracted influenza and did not think it was necessary, “…why would I get a vaccine for something I never caught” (male, 28 y/o). Theme 2: Knowledge and Concerns About the Vaccine Ten participants reported a general understanding of the vaccine itself; for example, “…I’ve heard they’re injecting you with the virus to help get your body immune to it” (female, 28 y/o). Three individuals acknowledged that they did not know much about the vaccine other than, “Well, they just tell me to get it…every year they say go get your flu vaccine” (male, 59 y/o). Two people were unsure whether the vaccine makes the illness milder. Many individuals also shared their concerns regarding influenza vaccine effectiveness and potential adverse side effects. Six participants did not believe that the vaccine was effective, saying “The flu vaccine’s been out for how many years?...older than I am, and it’s uneffective” (male, 28 y/o). Others thought that the vaccine could allow the virus to mutate: “…only next year that vaccine that they had put out antigens which made the flu stronger…it builds on itself type of a thing” (male, 52 y/o). Importantly, this idea also supported a belief that the COVID-19 vaccine would ultimately be ineffective. Four individuals reported greater trust in the influenza vaccine when compared to the COVID-19 vaccine, “at least it has a track history, it has something we can follow and see what effects it’s had on –
1634
Volume 27, No. 6: November 2026
Influenza Vaccination Among COVID-19 Unvaccinated Patients in US EDs
Li et al.
Table 2. Codebook for content analysis used to analyze themes emerging from subject interviews in a qualitative study on perception of influenza vaccination among COVID-19 unvaccinated patients in the emergency department. Code
Definition/Explanation
Accessing the vaccine
Includes whether they’ve been offered the vaccine, where they were offered it, where they think they could get the vaccine, where they feel most comfortable getting it, and how other people can access it. Also includes any barriers to access.
Experiences
Includes experiences of the patient OR others having the flu and includes experiences of receiving the flu vaccine.
Fears, worries, or concerns
Includes all fears, worries, or concerns regarding the flu vaccine. When coding here, do not double code in other places.
Future intentions
Intent to either accept or refuse the vaccine in the future includes plans to get it later (eg, “I’m going to get it once I’m feeling better”) and accepting the vaccine on the same day as the interview.
Influences (programs and people)
The impact of programs or initiatives related to the vaccine. Includes experiences of others related to the vaccine, may include stories of people deciding to get or not get the vaccine, includes experiences about others getting the vaccine. Also includes being influenced NOT to get the vaccine. Participant needs to explicitly say something along the lines of, “and that is why I am or am not getting the vaccine.” Also include examples of people describing how media is NOT influencing them. Includes: 1. Incentives 2. Information or things that need to happen that would influence vaccine acceptance—this will help inform researchers on best messaging for future communication 3. Mandates/ social pressures 4. Other life circumstances—(or things that get it in the way) things that impact their willingness or ability to get the vaccine
Impact of faith and discussion of faith
Only code if faith religion/faith community is impacting their decision to get vaccinated.
Patient perceptions and understanding of Influenza
Includes instances of individuals referencing their strong immune system. Also includes specific references to people they know who have had the flu. If participant only discusses what they’ve heard but does not discuss the impact of what they have heard, code here.
Patient understanding of the flu vaccine
Includes information participants have heard about the vaccine. If they are describing others’ experiences that they have heard from the news or media, code here and NOT “Experiences”. Includes: 1. Specific references to lack of knowledge—not having heard about the vaccine or don’t know about the vaccine 2. Comparing symptoms of the flu to side effects of the flu vaccine
Sources of information regarding the flu vaccine
Includes references to friends and family, or others that give the participant info. Try not to double code to “Influences.” unless they explicitly also mention how much a particular source influences them above others.
through the years” (male, 51 y/o). Eight individuals mentioned their fear or worry about side effects such as fevers, other flu-like symptoms, and even longer-term disability, “I don’t know what kind of reaction I might have” (female, 37 y/o). Two patients expressed concern regarding the frequency of the vaccine, “I don’t want to be injected every year with stuff being poured into my body” (female, 30 y/o).” Others cited a fear of the “unknown” or a “foreign” substance, eg, “I’m not gonna put something foreign in my body that I don’t know where it came from, you know?” (male, 51 y/o). Theme 3: Sources of Information Participants most commonly mentioned friends and family (word-of-mouth) and their personal experiences as reliable sources of information about the vaccine. Two individuals mentioned their experiences working in a healthcare setting, eg, Volume 27, No. 6: November 2026
“Because I’m an old x-ray technologist, I’ve always been cautious. I know how disease and viruses spread” (male, 67 y/o). One individual reported knowing a healthcare professional who personally refused to receive the vaccine, citing this as an influence in their decision-making. Many also mentioned hearing about the vaccine (including concerning stories of adverse side effects) in the news and social media but did not specifically identify these as trusted sources. Theme 4: Vaccine Access and Barriers Most participants reported that the influenza vaccine was accessible to them and that they knew where to receive one if they wanted it. Although 27 patients had been previously offered the vaccine, 2 had not. Of those who were prompted to discuss specific barriers to accessing the vaccine, only one participant identified a barrier, which was lack of insurance.
1635
Western Journal of Emergency Medicine
Influenza Vaccination Among COVID-19 Unvaccinated Patients in US EDs Table 3. Demographics of COVID-19 unvaccinated patients in the emergency department who participated in a qualitative study examining perceptions of influenza vaccination. N (%) Age in years, median (IQR)
34 (28, 50.5)
Sex Male
27 (56.2%)
Female
21 (43.8%)
Hispanic/Latino Hispanic/Latino
14 (29.2%)
Not Hispanic/Latino
33 (68.8%)
Not reported
1 (2.1%)
Race White
18 (37.5%)
Black
16 (33.3%)
Asian
1 (2.1%)
Mixed Race
3 (6.3%)
Pacific Islander
1 (2.1%)
Native American
1 (2.1%)
Other
5 (10.4%)
Not reported
3 (6.3%)
PCP Has PCP
6 (12.5%)
No PCP
34 (70.8%)
Not reported
8 (16.7%)
Housing Status Steady home
40 (83.3%)
Housing Insecurity
2 (4.2%)
No steady home
5 (10.4%)
Not reported
1 (2.1%)
Insurance Status Medicaid
12 (25.0%)
Medicare
8 (16.7%)
Medicaid and Medicare
1 (2.1%)
Military
1 (2.1%)
Private insurance
13 (27.1%)
ACA Marketplace plan
1 (2.1%)
No insurance
8 (16.7%)
Not reported
4 (8.3%)
When asked whether there were obstacles to getting the vaccine, one subject stated, “Not at all. I get offered all the time” (male, 42 y/o). Theme 5: Future Intentions and Decisions Despite widespread reported understanding of and access to the influenza vaccine, 19 participants stated that they did Western Journal of Emergency Medicine
Li et al.
not plan to receive the vaccine in the future, 5 were strongly hesitant and/or likely to decline the vaccine, and 2 did not know enough about the vaccine to state their future intention. Many cited the same reasons they had for not vaccinating in the past including concerns about side effects, disbelief in the vaccine’s effectiveness, not trusting the contents of the vaccine, and rarely getting sick. For example, “I just haven’t had the flu ever since—when I stopped getting the flu vaccine, I stopped getting the flu” (male, 34 y/o). One individual stated their reason not to vaccinate was their pregnancy. Conversely, 14 individuals clearly stated that they would accept the influenza vaccine. One additional participant stated that they were previously hesitant, but now would be more likely to accept the vaccine, stating, “I refused it at first, but then again in my profession, you’re around so many people” (male, 48 y/o). The remaining responses did not contain sufficient information to identify their future intentions on whether to receive the influenza vaccine. DISCUSSION Our study addresses a critical gap in knowledge regarding influenza vaccine hesitancy among the diverse patient populations served by the ED. The overarching reasons for vaccine hesitancy among our participants were a belief that the vaccine is not effective, fear of vaccine side effects, and a general lack of concern regarding influenza illness. Similar reasons have also been shown in previous literature for both influenza and COVID-19 vaccine hesitancy in ED and non-ED populations.21,34–36 Our participants cited prior experiences of suffering from influenza-like illness following vaccination as a major influence in their decision-making, with many patients directly attributing the vaccine to causing influenza, a commonly cited belief in other studies.23,37 Data from the Centers for Disease Control and Prevention 2026 RespVaxView report were consistent with our findings, suggesting a general lack of concern regarding influenza illness as a predominant driver in adults remaining unvaccinated, whereas the most common motivator towards vaccination was “to protect myself.”38 Similarly, adults expressing moderate to high concern over influenza were much more likely to vaccinate, compared to adults expressing little concern.39 Our findings also aligned with quantitative studies examining other populations, such as parental decision-making regarding vaccination of their child both before and after the COVID-19 pandemic, which similarly identified a lack of concern regarding influenza illness, concerns regarding vaccine safety/side effects, and doubts regarding vaccine effectiveness as primary contributors to vaccine hesitancy.40 Our results revealed overlapping themes with the parent study, which focuses on perspectives regarding COVID-19 vaccination.32 In the parent study, the majority of participants similarly expressed an overall lack of knowledge about the 1636
Volume 27, No. 6: November 2026
Influenza Vaccination Among COVID-19 Unvaccinated Patients in US EDs
Li et al.
Table 4. In a qualitative study on perceptions of the influenza vaccine in COVID-19 unvaccinated patients in the emergency department, common themes identified among participant responses to semistructured interviews. Theme
Subtheme
Example Quote
Past experiences with flu illness and vaccinations
Contracted flu despite vaccination
I noticed just with my own analysis was like every time I got vaccinated for the flu I ended up getting sick—end up getting the flu. When I didn’t get vaccinated for that I didn’t get the flu. It’s weird. [W008]
Experiences with side effects
I started probably about five years ago. And got sick, real sick after each one. But progressively every time I got it, it was worse. I don’t want the shot anymore. I pretty much stay away from everybody. [W001]
Never contracted influenza
And then like I told you, I’ve never caught the flu. So I mean, why would I get a vaccine for something I never caught. [D001]
Understanding the flu vaccine
That I’ve heard they’re injecting you with the virus to help get your body immune to it. [D008]
Comparing flu vs. COVID vaccines
Well, no, well it’s a little different because I’ve been taking it for years. And well it’s a little different because it has been around for more years. [SSPAN001]
Sources of information
And one nurse practitioner, she said that she’ll never get a flu shot again. And I said, well, why won’t you get the flu shot? Because you’re supposed to be a doctor and this kind of stuff. [S005]
Knowledge
I think I heard that in the news. They said that people with influenza they would get the vaccine and they wouldn’t feel well sometimes. [SSPAN006] Fears and concerns
Concerns about potential side effects
I’m scared of catching—I’m scared of what I don’t know. I don’t know what it’s gonna do to me. I don’t know what kind of reaction I might have. [D009]
Concerns about effectiveness
The flu vaccine’s been out for how many years? Probably. I don’t know. Older than I am, and it’s uneffective. People get the flu after they get it. [D006]
Access to Uptake
Interviewer: Do you know of any barriers to getting the flu vaccine, like anything that’s ever prevented you from being able to go and get the flu shot? Participant: Not at all. I get it offered all the time. [J007]
Future intentions
Interviewer: if you are offered the flu vaccine this year, would you take it? Participant: I don’t—why would I need it? It’s just—I’ll trust Mother Nature before I trust—Mother Nature’s a lot more complex and a lot more intelligent. [S006]
COVID-19 vaccine, as well as fear of long-term side effects and future health complications associated with vaccination. However, our findings regarding influenza vaccination differed in several major ways: 1) participants cited substantially fewer barriers to access relative to the COVID-19 vaccine; 2) participants highlighted word-of-mouth and personal experience as their most trusted sources of information regarding influenza vaccination, rather than doctors which were the most trusted source for the COVID-19 vaccine; and 3) distrust in government and pharmaceutical companies was a more prominent theme for COVID-19 than for influenza Volume 27, No. 6: November 2026
vaccination. These similarities and differences highlight how beliefs about influenza and COVID-19 vaccines may be inter-related and mutually driven, with the overall degree of hesitancy exacerbated by economic, cultural, and sociopolitical conditions related to the COVID-19 pandemic. In fact, recent data has emerged demonstrating that receipt of a COVID-19 vaccine is strongly associated with influenza vaccination with an adjusted odds ratio of 3.72, and that “always” influenza vaccinators are 24.7% more likely to also receive COVID-19 vaccination.13,14 Three respondents cited anecdotal evidence from
1637
Western Journal of Emergency Medicine
Influenza Vaccination Among COVID-19 Unvaccinated Patients in US EDs healthcare workers (HCW) as major influences in their opinions on vaccination, both positively and negatively. Similarly, other work has found that in an ED setting, patients’ willingness to be vaccinated has been associated with the vaccination status and opinions on self-vaccination of the HCWs directly treating patients, with unvaccinated HCWs being less likely to recommend vaccination to patients.41–43 The HCWs have been shown to share similar reservations about both influenza and COVID-19 vaccines as non-HCWs, including underestimating the impact of influenza infection, underestimating the effectiveness of the vaccine, and overestimating the severity of vaccine side effects, with nurses reporting greater vaccine hesitancy than physicians.44–46 Notably, most participants in this study are from an underserved population that may face greater challenges regarding access to care. Most of them lacked a primary care clinician, many participants lacked insurance, and 16.3% reported having no steady home or experienced housing insecurity. Additionally, a higher percentage of participants in our study identified as a racial or ethnic minority in comparison to the general public, which is representative of typical ED patient demographics.24,25 All these factors have been previously associated with reduced influenza vaccine uptake.16,19,23,34,47 Unlike prior work which highlighted perceived cost and lack of knowledge about where to receive vaccination as significant barriers to access, particularly for uninsured patients, our results reveal that most participants felt they had access to influenza vaccines.34,37 One reason for this difference could be expanded vaccine access and knowledge of public vaccination sites due to COVID-19. Directly addressing misinformation related to vaccine hesitancy (such as the idea that the influenza vaccine causes influenza) has historically been difficult.48,49 Identifying the most effective messages and method of delivery of messages is paramount. Nyhan et al found that directly addressing misinformation related to the pneumococcal and measles, mumps, and rubella vaccines among those with vaccine hesitancy resulted in a greater resistance to vaccination, even if patients recognized their opinions were based on misconceptions.48 Conversely, our approach in the highly successful PROCOVAXED trial was to provide direct, neutral, explanatory information on COVID-19 vaccines through short videos, flyers, and scripted messaging to ED patients from physicians who look like them (eg, Black physicians on videos delivered to vaccine-hesitant Black patients). We found that our messaging platforms doubled vaccine acceptance and uptake in unvaccinated ED patients.31 Overall, our findings suggest that future educational interventions to address influenza vaccine hesitancy should provide accurate, neutral, and easily understandable information about the vaccine’s safety and effectiveness. The role of clinicians in framing and delivering the information is likely important and requires clinician buy-in. Clinicians should seek to understand specific negative experiences the Western Journal of Emergency Medicine
Li et al.
patient may have had or heard about, with the goal of addressing them in a nonjudgmental, supportive, and clarifying way. Interventions should also include information about how the vaccine protects against illness, how it is produced, and why there is a need for annual inoculation. Patients may benefit from materials that appropriately reflect their own health status, community, and cultural background, and/or relatable anecdotes, as well as examples of how the influenza vaccine can be beneficial to a given individual. We have developed ED-specific influenza vaccine messaging platforms based on this work and have conducted a cluster randomized controlled trial to determine whether the implementation of these platforms is associated with greater influenza vaccine acceptance and uptake in unvaccinated ED patients.50 LIMITATIONS This study should be considered in the context of its limitations. Our findings may be limited by sample size. Although there was no predetermined enrollment target for this substudy, we attempted to mitigate this limitation by enrolling participants in the parent study until thematic saturation was achieved. While we did not assess for thematic saturation within the influenza substudy, interviews including influenza questions ranged from 9 to 17 per study site, and recent literature suggests 73% to 92% of codes emerge within the first 6 to 12 interviews.51 Additionally, our influenza responses still spanned the same breadth of themes and codes as the COVID-19 responses as well as new emergent codes, suggesting we approached thematic saturation. An additional limitation may be the timing of data collection, which occurred at the height of the Delta variant of the COVID-19 pandemic, and just prior to the surge of the Omicron variant of COVID-19 in the United States. The relatively uncertain and higher-risk nature of the Delta variant may have influenced attitudes and beliefs regarding vaccination for both COVID-19 and influenza; these beliefs may shift as the expected severity of COVID-19 disease has become more mild.52,53 Additionally, the greater emphasis on vaccination for COVID-19, and increased accessibility of vaccination sites may have resulted in an improved perception of access to influenza vaccination in our cohort, in comparison to past years. As part of a larger study, discussions with each participant occurred within the context of an in-depth interview about the COVID-19 vaccine. Because not all participants were able to complete the dedicated influenza subcomponent of the interview due to time constraints, selection bias may have been introduced in the current analysis, which includes only those who provided influenza-related information. Additionally, all participants were unvaccinated against COVID-19, thus likely representing a subset of the ED patient population that is relatively more vaccine-hesitant. Conversely, because these data were collected at a time when information about the
1638
Volume 27, No. 6: November 2026
Li et al.
Influenza Vaccination Among COVID-19 Unvaccinated Patients in US EDs
COVID-19 vaccine was not yet widely available, our qualitative understanding of the intersection between influenza and COVID-19 vaccine hesitancy may add additional value to the literature. In addition, participants may have been primed to respond in a particular way (whether positively or negatively) toward questions about influenza illness and the influenza vaccine as they had been prompted to think about and share their fears, concerns, or other negative thoughts and feelings toward the COVID-19 vaccine in the interview. Lastly, while our study was conducted at four sites located in different regions throughout the country, all sites were Level I trauma centers serving primarily urban populations. Therefore, it is possible demographic and selection biases may have contributed to our data and subsequent analyses and may lack generalizability to rural patient populations. CONCLUSION This multicenter, qualitative ED-based study is the first to our knowledge to describe in-depth factors contributing to influenza vaccine hesitancy in adult COVID-19 unvaccinated patients. Despite being knowledgeable about the purpose and mechanism of the vaccine, most patients cited concerns about lack of vaccine effectiveness, fear of side effects, and lack of concern regarding influenza illness. Our findings offer valuable insights that can inform future ED-based vaccine education interventions, particularly for vulnerable patient populations who may not have access to healthcare through other pathways.
Conflicts of Interest: By the WestJEM article submission agreement, all authors are required to disclose all affiliations, funding sources and financial or management relationships that could be perceived as potential sources of bias. This work was supported by the National Institute of Allergy and Infectious Diseases under Grant R01AI166967. The funders had no role in study design, data collection and analysis, decision to publish, or preparation of the manuscript. No other author has professional or financial relationships with any companies that are relevant to this study. There are no other conflicts of interest or sources of funding to declare. Copyright: © 2026 Li et al. This is an open access article distributed in accordance with the terms of the Creative Commons Attribution (CC BY 4.0) License. See: http://creativecommons.org/ licenses/by/4.0/
REFERENCES 1. Abramson ZH, Levi O. Influenza vaccination among primary healthcare workers. Vaccine. 2008;26(20):2482-2489. 2. American Academy of Pediatrics. CHA-AAP emergency declaration request. Published November 14, 2022. 3. American Academy of Pediatrics. Pediatric health care organizations call for national response on RSV and flu surge. Published 2022. Accessed July 13, 2026. https://www.aap.org/en/news-room/ news-releases/aap/2022/pediatric-health-care-organizations-call-fornational-response-on-rsv-and-flu-surge/ 4. American College of Emergency Physicians. Emergency department boarding crisis sign-on letter. Published November 7, 2022. https://
ACKNOWLEDGMENTS The authors would like to acknowledge the research and clinical teams at each study site who have supported and facilitated our work and enabled us to collect data in a timely manner. Members of the PROCOVAXED study network can be found in the S1 File located in the supplementary material.
www.acep.org/globalassets/new-pdfs/advocacy/emergencydepartment-boarding-crisis-sign-on-letter-11.07.22.pdf 5. American College of Emergency Physicians. (2022). Emergency physicians sound the alarm: Boarding in the emergency department is a national crisis. Published November 9, 2022. Accessed July 13, 2026, from https://www.emergencyphysicians.org/pressreleases/2022/11-9-22-emergency-physicians-sound-the-alarm-
INSTITUTIONS CONTINUED ¶ University of Washington, Department of Emergency Medicine, Seattle, Washington **Institute for Health Metrics and Evaluation, Department of Health Metrics Science, Seattle, Washington †† Thomas Jefferson University, Sidney Kimmel Medical College, Department of Emergency Medicine, Philadelphia, Pennsylvania ‡‡ Thomas Jefferson University, Center for Connected Care, Philadelphia, Pennsylvania §§ University of California Riverside, Department of Emergency Medicine, Riverside, California |||| Durham Veterans Affairs Medical Center, Emergency Department, Durham, North Carolina
boarding-in-the-emergency-department-is-a-national-crisis 6. Andrejko KL, Myers JF, Openshaw J, et al. Receipt of COVID-19 and seasonal influenza vaccines in California (USA) during the 20212022 influenza season. Vaccine. 2023;41(6):1190-1197. 7. Carlson LC, Zachrison KS, Yun BJ. The association of demographic, socioeconomic, and geographic factors with potentially preventable emergency department utilization. West J Emerg Med. 2021;22(6):1283-1290. 8. Casalino E, Ghazali A, Bouzid D. Patient’s behaviors and missed opportunities for vaccination against seasonal epidemic influenza and evaluation of theirimpact on patient’s influenza vaccine uptake. PLoS One. 2018;13(3). 9. Centers for Disease Control and Prevention. Emergency department visit rates by selected characteristics: United States. Published 2019.
Address for Correspondence: Stephanie A. Eucker, MD, PhD, Durham Veterans Affairs Medical Center, Emergency Department, 508 Fulton St. Durham, NC 27705. Email: stephanie.eucker@ va.gov.
Volume 27, No. 6: November 2026
https://stacks.cdc.gov/view/cdc/114424 10. Centers for Disease Control and Prevention. National Hospital
1639
Ambulatory Medical Care Survey: 2020 Emergency Department Summary Tables. Published 2022. https://stacks.cdc.gov/view/
Western Journal of Emergency Medicine
Influenza Vaccination Among COVID-19 Unvaccinated Patients in US EDs cdc/121911
Li et al.
Health. 2024;26(3):474-481.
11. Centers for Disease Control and Prevention. 2023–2024 influenza
25. Grandhi GR, Mszar R, Vahidy F. Sociodemographic disparities in
season summary: Influenza severity assessment, burden and burden
influenza vaccination among adults with atherosclerotic cardiovascular
prevented. Published November 21, 2024. Accessed July 13, 2026,
disease in the United States. JAMA Cardiol. 2021;6(1):87-91.
from https://www.cdc.gov/flu/whats-new/flu-summary-
26. Guest G, Bunce A, Johnson L. How many interviews are enough? An
addendum-2023-2024.html
experiment with data saturation and variability. Field Methods.
12. Centers for Disease Control and Prevention. Vaccination concerns,
2006;18(1):59-82.
issues, and motivators. RespVaxView. Published April 15, 2026.
27. Guillari A, Polito F, Pucciarelli G. Influenza vaccination and healthcare
Accessed July 21, 2026, from https://www.cdc.gov/respvaxview/
workers: barriers and predisposing factors: a literature review. Acta
dashboards/vaccination-concerns-motivators.html
Biomed. 2021;92(suppl 2).
13. Centers for Disease Control and Prevention. Vaccination uptake,
28. Hsieh HF, Shannon SE. Three approaches to qualitative content
intent, and confidence. RespVaxView. Published June 16, 2026.
analysis. Qual Health Res. 2005;15(9):1277-1288.
Accessed July 21, 2026, from https://www.cdc.gov/respvaxview/
29. Huang K, Lin SW, Sheng WH, et al. Influenza vaccination and the
dashboards/vaccination-behavioral-social-drivers.html
risk of COVID-19 infection and severe illness in older adults in the
14. Centers for Disease Control and Prevention. Vaccination trends.
United States. Sci Rep. 2021;11:11025.
Respiratory Illnesses. Published July 10, 2026. Accessed July 13,
30. Iuliano AD. Trends in disease severity and health care utilization
2026, from https://www.cdc.gov/respiratory-viruses/data/vaccination-
during the early Omicron variant period compared with previous
trends.html
SARS-CoV-2 high transmission periods—United States, December
15. Chen G, Kazmi M, Chen D. Identifying associations between
2020-January 2022. MMWR Morb Mortal Wkly Rep. 2022;71.
influenza vaccination status and access, beliefs, and
31. Kahn KE, Santibanez TA, Jain A, et al. Parental reasons for
sociodemographic factors among the uninsured population in Suffolk
non-receipt of influenza vaccination among children 6 months-17
County, NY. J Community Health. 2020;45(6):1236-1241.
years and changes over time, 2015-2024. Vaccine. 2025;61:127415.
16. Chen JY, Fox SA, Cantrell CH. Health disparities and prevention:
32. Kawai K, Kawai AT. Racial/ethnic and socioeconomic disparities in
racial/ethnic barriers to flu vaccinations. J Community Health.
adult vaccination coverage. Am J Prev Med. 2021;61(4):465-473.
2007;32(1):5-20.
33. Kempe A, Saville AW, Albertin C. Parental hesitancy about routine
17. Conlon A, Ashur C, Washer L, et al. Impact of the influenza vaccine
childhood and influenza vaccinations: a national survey.
on COVID-19 infection rates and severity. Am J Infect Control.
Pediatrics. 2020.
2021;49(6):694-700.
34. Knight H, Jia R, Ayling K. Understanding and addressing vaccine
18. Dini G, Toletone A, Sticchi L, et al. Influenza vaccination in healthcare
hesitancy in the context of COVID-19: development of a digital
workers: a comprehensive critical appraisal of the literature. Hum Vaccin Immunother. 2018;14(3):772-789.
intervention. Public Health. 2021;201:98-107. 35. LaVela SL, Smith B, Weaver FM. Attitudes and practices regarding
19. Dubov A, Distelberg BJ, Abdul-Mutakabbir JC. Predictors of
influenza vaccination among healthcare workers providing services to
COVID-19 vaccine acceptance and hesitancy among healthcare
individuals with spinal cord injuries and disorders. Infect Control Hosp
workers in Southern California: not just “anti” vs “pro” vaccine.
Epidemiol. 2004;25(11):933-940.
Vaccines (Basel). 2021;9(12).
36. MacDonald NE. Vaccine hesitancy: definition, scope and
20. Fernández-Penny FE, Jolkovsky EL, Shofer FS. COVID-19 vaccine hesitancy among patients in 2 urban emergency departments. Acad
determinants. Vaccine. 2015;33(34):4161-4164. 37. Nofzinger TB, Huang TT, Lingat CER, et al. Vaccine fatigue and
Emerg Med. 2021;28(10):1100-1107.
influenza vaccination trends across pre-, peri-, and post-COVID-19
21. Flood EM, Rousculp MD, Ryan KJ. Parents’ decision-making
periods in the United States using Epic’s Cosmos database. PLoS
regarding vaccinating their children against influenza: a web-based survey. Clin Ther. 2010;32(8):1448-1467.
One. 2025;20(6):e0326098. 38. Nyhan B, Reifler J, Richey S. Effective messages in vaccine
22. Fogel B, Schaefer EW, Hicks SD. Early influenza vaccination rates decline in children during the COVID-19 pandemic. Vaccine.
promotion: a randomized trial. Pediatrics. 2014;133(4). 39. Nyhan B, Reifler J. Does correcting myths about the flu vaccine
2021;39(31):4291-4295.
work? An experimental evaluation of the effects of corrective
23. Gentsch AT, Butler J, O’Laughlin K. Perspectives of COVID-19 vaccine-hesitant emergency department patients to inform
information. Vaccine. 2015;33(3):459-464. 40. Parker AM, Atshan S, Walsh MM, et al. Association of COVID-19
messaging platforms to promote vaccine uptake. Acad Emerg Med.
vaccination with influenza vaccine history and changes in influenza
2023;30(1):32-39. 24. German PH, Lazenby M, Phillips S, et al. The effect of a quality
vaccination. JAMA Netw Open. 2022;5(11):e2241888. 41. Rangel MC, Shoenbach VJ, Weigle KA. Racial and ethnic disparities
improvement project on improving patients’ willingness to receive an influenza vaccination in the emergency department. J Immigr Minor
Western Journal of Emergency Medicine
in influenza vaccination among elderly adults. J Gen Intern Med. 42. Rodriguez RM, Eucker SA, Rafique Z. Promotion of influenza
1640
Volume 27, No. 6: November 2026
Li et al.
Influenza Vaccination Among COVID-19 Unvaccinated Patients in US EDs
vaccination in the emergency department. NEJM Evid. 2024;3(4).
Rep. 2025;74(29):456-462.
43. Rodriguez RM, Nichol G, Eucker SA. Effect of COVID-19 vaccine
47. Sloan C, Chandrasekhar R, Mitchel E. Socioeconomic disparities and
messaging platforms in emergency departments on vaccine
influenza hospitalizations. Emerg Infect Dis. 2015;21(9)
acceptance and uptake: a cluster randomized clinical trial. JAMA
48. Suryadevara M, Handel A, Bonville CA. Pediatric provider vaccine
Intern Med. 2023;183(2):115-123.
hesitancy: an under-recognized obstacle to immunizing children.
44. Rodriguez RM, O’Laughlin K, Eucker SA. PROmotion of COvid-19
Vaccine. 2015;33(48):6629-6634.
VA(X)ccination in the emergency department—PROCOVAXED: study
49. Tanne JH. US faces triple epidemic of flu, RSV, and COVID. BMJ.
protocol for a cluster randomized controlled trial. Trials.
2022;379:o2681.
2022;23(1):332.
50. US Centers for Disease Control and Prevention. Cumulative
45. Rodriguez RM, Torres C Jr, [initials/name incomplete], et al. The rapid
influenza coverage by age group, race/ethnicity, and jurisdiction,
evaluation of COVID-19 vaccination in emergency departments for
adults 18 years and older, United States. National Immunization
underserved patients study. Ann Emerg Med. 2021;78(4):502-510. 46. Rodriguez RM, Torres C Jr, Chinnock B, et al. Emergency
Survey Adult COVID Module. Published 2022. 51. Wilcox CR, Islam N, Dambha-Miller H. Association between influenza
department survey of vaccination knowledge, vaccination coverage,
vaccination and hospitalisation or all-cause mortality in people with
and willingness to receive vaccines in an emergency department
COVID-19: a retrospective cohort study. BMJ Open Respir Res.
among underserved populations—8 U.S. cities. Morb Mortal Wkly
2021;8(1).
Volume 27, No. 6: November 2026
1641
Western Journal of Emergency Medicine
Original Research
Acceptability of a Novel Prehospital Emergency Care System Evaluation Tool Among Southeast Asian Stakeholders: A Cross-Sectional Survey John T. Bokman, BS* Ali Haedar, MD, PhD† Anjni Joiner, DO, MPH‡§ Lauren Hart, MPH|| Sarah Binti Shaikh Abdul Karim, MBBS, MMed# Authors continued at end of article
*Duke University School of Medicine, Durham, North Carolina † Saiful Anwar General Hospital, Faculty of Medicine, Universitas Brawijaya, Indonesia ‡ Duke University, Department of Emergency Medicine, Durham, North Carolina
Section Editor: Lesley Osborn, MD Submission history: Submitted January 28, 2026; Revision received July 1, 2026; Accepted July 1, 2026 Electronically published November 1, 2026 Full text available through open access at http://escholarship.org/uc/uciem_westjem DOI 10.5811/westjem.61956
Introduction: Prehospital emergency care (PEC) systems vary widely in structure, capacity, and stage of development, and existing evaluation tools are not tailored to the contextual needs of Southeast Asia. To address this gap, the Prehospital Emergency Care System Evaluation Tool (PECSET) was developed as a 32-element, consensus-derived framework to support system assessment, prioritization, and quality improvement. The objective of this study was to evaluate the prospective acceptability of the PECSET framework among Southeast Asian prehospital stakeholders using the theoretical framework of acceptability (TFA) and to identify regional variation in implementation priorities. Methods: We conducted a cross-sectional survey of PEC professionals from the Philippines, Thailand, Vietnam, Indonesia, and Malaysia between April 2023 and June 2024. Participants were recruited from six resuscitation training conferences and attended a standardized two-hour educational session before completing an anonymous survey mapped to TFA constructs. We assessed differences between countries using Pearson chi-square tests. Our primary outcome measure was acceptability scores across five TFA domains (affective attitude, intervention coherence, opportunity costs, self-efficacy, and perceived effectiveness). Secondary outcomes included identification of high-priority implementation elements. Results: Participants (N = 274; 66% response rate) included physicians (46%, n = 126), prehospital professionals (30%, n = 82), and medical directors (15%, n = 41). Intervention coherence was high: 92% to 100% of participants were likely or extremely likely to use PECSET for quality improvement. However, geographic variation existed; a small subset in Indonesia and Vietnam (n = 6) reported they were “unlikely” to use the tool, compared to none in Thailand, Malaysia, and the Philippines (P = .04). Regarding self-efficacy, while 100% (n = 274; 95% CI, 98-100%) reported confidence in application, only 20% (n = 55; 95% CI,15-25%) were “extremely confident.” Affective attitude was positive, with 97% (n = 266) intending to integrate the tool; only Vietnam (n = 4; 5% [95% CI, 2-10%]) and Indonesia (n = 2; 2% [95% CI, 0-13%]) indicated hesitation (P = .24). Secondary outcomes identified “layperson public awareness and education programs” as the top implementation priority across all five nations, although priorities varied. Conclusion: The Prehospital Emergency Care System Evaluation Tool demonstrated high acceptability among potential end-users across Southeast Asia, indicating readiness for broader implementation and future evaluation of feasibility, fidelity, and system-level impact. As a stakeholder-informed evaluation framework, PECSET offers a practical approach to strengthening PEC systems in Southeast Asia and beyond. [West J Emerg Med. 2026;27(6)1642–1651.]
Western Journal of Emergency Medicine
1642
Volume 27, No. 6: November 2026
Bokman et al.
Acceptability of a Novel Prehospital Emergency Care System Eval Tool
INTRODUCTION A quality prehospital emergency care (PEC) system improves healthcare accessibility and ensures timely care for patients suffering from high-acuity conditions. Its importance is particularly evident in resource-limited settings, where 54% of mortality can potentially be averted with improved emergency care.1–3 However, patients in these settings are more likely to face delayed entry into the emergency care system due to unreliable transportation, poor road quality, and greater physical distance to definitive care.4,5 These barriers provide opportunities for a PEC system to significantly improve patient outcomes by increasing access, use, and effectiveness of the healthcare system.6-9 Despite the potential impact of establishing robust PEC systems, these systems are typically poorly funded and deprioritized at the local and national level in many resourcelimited settings.10–16 Existing PEC systems in low-resource areas lack properly trained personnel, vital medical equipment, and adequate transport capability.17 One of the most significant steps in improving systems in these settings is a clear set of standards to guide their development.18,19 While several emergency care assessment frameworks exist, including the World Health Organization Prehospital Emergency Care Assessment Tool (PEAT) and tools developed by Howard et al and Mehmood et al,20–22 these instruments were primarily designed to support nascent PEC systems with broad global applicability and may not fully capture the needs of PEC systems in Southeast Asia. Many PEC systems in Southeast Asia are better characterized as being in an “intermediate” stage of development, with foundational structures in place but substantial heterogeneity in capacity, scope, and performance.23–26 This context highlights the need for an evaluation tool that is regionally tailored to Southeast Asia and sufficiently flexible to account for variable system maturity. To address this gap, the Prehospital Emergency Care System Evaluation Tool (PECSET) was developed.27 The PECSET differs from existing frameworks in several key ways: It is specifically designed for Southeast Asian systems at an early developmental stage; it incorporates a prioritization logic that accounts for implementation status, feasibility, and relative importance; and it was co-developed with intended users in an effort to enhance content validity and contextual relevance. As a novel system-level intervention, understanding PECSET’s acceptability among potential users is a critical prerequisite for adoption and scale-up.28 Therefore, the primary objective of this study was to evaluate the acceptability of PECSET among individuals working within Southeast Asian PEC systems, mapped to domains within the theoretical framework of acceptability (TFA). 28 Secondary exploratory outcomes included participants’ intentions to use and share the tool, as well as descriptive assessments of current implementation status and prioritization of PECSET elements within their systems. Volume 27, No. 6: November 2026
Population Health Research Capsule What do we already know about this issue? Existing prehospital emergency care evaluation tools are not well suited to Southeast Asia. What was the research question? Is the Prehospital Emergency Care System Evaluation Tool (PECSET) acceptable to Southeast Asian prehospital emergency care stakeholders? What was the major finding of the study? 100% reported confidence applying PECSET (95% CI, 98-100%); 97% intended to use it (95% CI, 94-99%). How does this improve population health? An acceptable evaluation tool can help prioritize interventions, guide quality improvement, and strengthen prehospital emergency care systems across Southeast Asia.
METHODS Study Design and Setting This cross-sectional study assessed the acceptability and perceived utility of PECSET among PEC system professionals in Southeast Asia. Data were collected between April 26, 2023, and June 7, 2024, across five countries (Philippines, Thailand, Vietnam, Indonesia, Malaysia). The study was reviewed and deemed exempt by the National University of Singapore Institutional Review Board (Ethics Number: NUS-IRB-2021-136). Development of the Prehospital Emergency Care System Evaluation Tool The PECSET was developed through a four-stage modified Delphi consensus process involving 32 prehospital emergency care experts from 12 Asian countries.27 Initially, 32 potential system elements were identified via a scoping review, focus group discussions, and surveys. In the first two Delphi rounds, experts evaluated these elements based on their importance and feasibility in low-resource settings. The final two rounds focused on prioritizing “core” elements essential for systems in early development. While the process identified 12 core building blocks, all 32 elements were retained to provide a tiered evaluation approach suitable for early, intermediate, and advanced PEC systems (Table 1). Participants Participants were PEC professionals attending a
1643
Western Journal of Emergency Medicine
Acceptability of a Novel Prehospital Emergency Care System Eval Tool
Bokman et al.
Table 1. The 32 elements of the Prehospital Emergency Care System Evaluation Tool framework, in a study of the acceptability of this tool among Southeast Asian stakeholders. PECSET Core Elements 1
Universal access number for all medical emergencies
2
Dispatch-assisted instructions (eg, first aid, CPR instructions)
3
Essential patient care record documentation and medical record management
4
Layperson public awareness and education programs
5
Medical direction or control and access to protocols
6
Medical records management, dataset collection, and registry
7
Minimum national or regional standard requirements for an ambulance
8
Operational metrics for prehospital emergency care services
9
Operational safety protocols
10 Protocols for screening, triage and appropriate destination 11
Quality assurance or quality improvement system in place
12 Standardized training programs for community first responders, dispatchers, and prehospital personnel Non-Core Elements 13 Ability to receive feedback from patients using the ambulance services 14 Air transport infrastructure 15 Dedicated medical teams in hospital to receive prehospital patients 16 Feedback mechanism for prehospital staff 17 Formal interfacility transfer system with protocols and monitoring/quality assurance 18 Formal recognition of prehospital care within a governmental structure 19 Infrastructure for the development of teleconsult or teleradiology service 20 Mechanism to obtain hospital or community data on patient outcomes 21 Networks with representatives spanning across the chain of survival 22 Prehospital notification and/or activation system 23 Prehospital staff wellness program 24 Protocols for Infection control/disease outbreak 25 Protocols for mass casualty incidents and disaster management 26 Protocols for prehospital surge capacity situations 27 Protocols to respond to surge in the ED 28 Providing appropriate care bundle on the ambulance 29 Public AED availability and usage 30 Ratio of numbers of prehospital ambulances and staff to the population 31 Scope of practice defined at a national or regional level 32 Standardized prehospital clinical assessment/ scoring tool AED, automated external defibrillator; CPR, cardiopulmonary resuscitation; ED, emergency department; PECSET, Prehospital Emergency Care System Evaluation Tool.
Resuscitation Academy (RA) (https://www. resuscitationacademy.org/), a structured two-day training program designed to improve cardiac arrest survival outcomes. Participants were recruited from six RAs: Clark, Philippines (April 2023); Lombok, Indonesia (July 2023); Bangkok, Thailand (December 2023); Ho Chi Minh, Vietnam (January 2024); Danang, Vietnam (February 2024); and Selangor, Malaysia (June 2024). All attendees had the opportunity to participate in the study. By targeting individuals Western Journal of Emergency Medicine
with active roles in PEC system operations and quality improvement initiatives, the study ensured that respondents had relevant expertise to evaluate the acceptability and feasibility of PECSET. A two-hour session on PECSET was incorporated into the RA, during which participants learned about the development, purpose, and elements of the tool. After the session, participants were invited to provide feedback on PECSET via an anonymous electronic survey accessed through a QR code or link. Consent was obtained
1644
Volume 27, No. 6: November 2026
Acceptability of a Novel Prehospital Emergency Care System Eval Tool
Bokman et al.
electronically. Only one response per participant was allowed. Survey Instrument The survey focused on assessing acceptability, feasibility, and perceived utility of PECSET. It included two components: 1. PECSET Implementation: Participants completed PECSET for their PEC system, indicating the extent to which PECSET core elements were implemented, partially implemented, or not implemented. (Appendix 1).27 2. Feedback on Acceptability: Participants reported demographics and responded to Likert-scale items evaluating their confidence in using PECSET, intention to apply the tool, perceived effectiveness, and anticipated impact on patient care and system outcomes. They then prioritized two specific PECSET elements to focus on over the next six months (Appendix 2).
sharing the tool captured aspects of intervention coherence and affective attitude (Table 2). By grounding the survey in TFA, the study ensured a structured, theory-driven assessment of acceptability across key domains relevant to PECSET.
Survey Development The feedback portion of the survey was designed to systematically capture participant perceptions of the PECSET tool. It was drafted to cover desired domains for understanding acceptability and feasibility of the tool (respondent demographics, confidence, intention for use). A preliminary version of the survey was evaluated by PEC experts and prospective end users from across Southeast Asia (including PEC researchers, international fellows, and system leaders), after which revisions were made to improve content and flow based on their input. This process ensured the survey addressed the specific needs and contexts of PEC systems in resource-limited settings in the region.
Data Collection and Analysis We collected and managed data using REDCap, version 13.7 (Vanderbilt University). Categorical variables were reported as frequencies and percentages with corresponding 95% confidence intervals for key acceptability outcomes. We evaluated associations between categorical variables using the Pearson chi-square test of independence. For implementation status, respondents could choose from the following four options: (1) fully implemented; (2) partially implemented; (3) not implemented; or (4) unsure. To calculate a single implementation score per element, per country, a value of 1 was assigned to responses of fully implemented, a value of 0.5 to responses of partially implemented, and a value of 0 to responses of not implemented. For the purposes of this score, responses of unsure were removed. We calculated the total value of responses based on the values assigned above and then divided by the total number of responses to calculate an average implementation score. Optional free-text comments were collected following Likert scale questions to allow participants to provide additional feedback. These responses were reviewed but were not included in formal qualitative analysis because the comments were generally brief, heterogeneous, and submitted in multiple languages. Consistent with the concept of information power, the free-text responses were determined to lack sufficient depth and informational content to support qualitative analysis.29
Validity Framework Content validity of the survey instrument was established through review by both PEC experts and potential end users from across Southeast Asia. To support construct validity and enable a systematic assessment of acceptability, survey items were mapped to the TFA.28 For example, questions assessing participants’ confidence in applying PECSET mapped to self-efficacy, while items on anticipated impact of PECSET aligned with perceived effectiveness. Likelihood of use and
RESULTS Participant Characteristics The study involved 274 participants from five Southeast Asian countries (Indonesia, Thailand, the Philippines, Vietnam, and Malaysia), a 66% response rate of RA attendees (Table 3). No participants were excluded from analysis. Respondents represented a diverse range of PEC professionals including 46% physicians, 30% prehospital professionals (paramedics, emergency medical technicians [EMT],
Table 2. Mapping of survey questions to the theoretical framework of acceptability in a study of the acceptability of the Prehospital Emergency Care System Evaluation Tool among Southeast Asian stakeholders. Survey Questions
Mapped TFA Component(s)
How likely are you to use the elements from the basic PECSET for quality improvement?
Affective attitude; intervention coherence, opportunity costs
How likely are you to share the basic PECSET with other medical directors or EMS Systems?
Affective attitude; intervention coherence
How confident are you that you can apply the tool to your area of work?
Self-efficacy
How confident are you that the tool will improve care and outcomes in your city?
Perceived effectiveness
EMS, emergency medical services; PECSET, Prehospital Emergency Care System Evaluation Tool; TFA, theoretical framework of acceptability.
Volume 27, No. 6: November 2026
1645
Western Journal of Emergency Medicine
Acceptability of a Novel Prehospital Emergency Care System Eval Tool
Bokman et al.
Table 3. Participant characteristics in a study of the acceptability of the Prehospital Emergency Care System Evaluation Tool among Southeast Asian stakeholders. Characteristic
Philippines
Thailand
Vietnam
Indonesia
Malaysia
35 (71%)
28 (68%)
134 (57%)
41 (80%)
36 (88%) 274 (66%)
MD/MBBS/DO
7 (20%)
20 (71%)
93 (69%)
14 (34%)
10 (28%) 144 (53%)
RN/MSN
19 (54%)
6 (21%)
35 (36%)
20 (49%)
0 (0%)
80 (29%)
EMT/Paramedic
12 (34%)
2 (7%)
2 (1%)
1 (2%)
9 (25%)
26 (9%)
Doctorate
0 (0%)
1 (4%)
2 (1%)
0 (0%)
0 (0%)
3 (1%)
MPH
2 (6%)
2 (7%)
2 (1%)
1 (2%)
0 (0%)
7 (3%)
Others
7 (20%)
2 (7%)
2 (1%)
7 (17%)
21 (58%)
39 (14%)
0-5
7 (21%)
17 (61%)
87 (65%)
30 (73%)
13 (36%) 154 (56%)
6-10
16 (47%)
6 (21%)
18 (13%)
8 (20%)
7 (19%)
55 (20%)
11-15
4 (12%)
2 (7%)
13 (10%)
1 (2%)
11 (31%)
31 (11%)
16+
7 (21%)
3 (11%)
16 (12%)
2 (5%)
5 (14%)
33 (12%)
Physician
7 (20%)
18 (64%)
82 (61%)
10 (24%)
9 (25%)
126 (46%)
Prehospital professional
24 (69%)
10 (36%)
16 (12%)
13 (32%)
18 (50%)
81 (30%)
Medical Director
1 (3%)
9 (32%)
18 (13%)
8 (20%)
6 (17%)
42 (15%)
Hospital Nurse
3 (9%)
0 (0%)
20 (15%)
14 (34%)
0 (0%)
37 (14%)
Prehospital emergency care administrator (nonmedical)
5 (14%)
0 (0%)
3 (2%)
0 (0%)
1 (3%)
9 (3%)
Dispatcher/telecommunicator
8 (23%)
0 (0%)
7 (5%)
0 (0%)
6 (17%)
21 (8%)
Other
5 (14%)
1 (4%)
10 (7%)
4 (10%)
8 (22%)
28 (10%)
Rural
3 (9%)
4 (14%)
94 (71%)
4 (10%)
1 (3%)
106 (39%)
Urban
18 (51%)
11 (39%)
27 (20%)
13 (32%)
13 (36%)
82 (30%)
Mixed (rural and urban)
14 (40%)
13 (46%)
11 (8%)
24 (59%)
22 (61%)
84 (31%)
Number of respondents (response rate)
Total
Credentials*
Years worked in PEC
Role*
Area of work
*Participants could select more than one response; percentages may total over 100%. EMT, emergency medical technician; MD/MBBS/DO, doctor of medicine, Bachelor of Medicine, Bachelor of Surgery; doctor of osteopathic medicine; MPH, master of public health; RN/MSN, registered nurse; master of science in nursing; PEC, prehospital emergency care; PECSET, Prehospital Emergency Care System Evaluation Tool.
prehospital nurses), 15% medical directors, 14% hospital nurses, 3% administrators, and 8% dispatchers/ telecommunicators. Participants originated from a relatively even distribution of PEC urbanicity with 31% working in mixed urban-rural settings, 39% in rural, and 30% in urban settings. Countries such as Indonesia and Vietnam had a higher proportion of rural participants (73%), while Thailand and the Philippines had more urban-based emergency medical services (EMS) professionals (51% and 39%, respectively). Participants were relatively new to working in the PEC setting, with 56% of participants reporting 0-5 years of experience. Intervention Coherence and Intention to Use Likelihood of using PECSET for quality improvement was used as an indicator of intervention coherence and Western Journal of Emergency Medicine
intended adoption. The majority of participants expressed that they were likely or extremely likely to use the elements for quality improvement with 93% (n = 38; 95% CI, 80–98%) from Indonesia, 100% (n = 28; 95% CI, 88–100%) from Thailand, 99% (n = 132; 95% CI, 95–100%) from Vietnam, 100% (n = 35; 89-100%) from the Philippines, and 100% (n = 36; 95% CI, 90–100%) from Malaysia (Figure 1). Indonesia and Vietnam had a small but significant percentage who reported that they were somewhat unlikely or extremely unlikely to use PECSET for quality improvement (P = .04). Self-Efficacy and Perceived Effectiveness All participants reported confidence in applying PECSET within their local PEC systems with no significant difference between countries (P = .32). However, only 20% (n = 55; 95% CI, 15–25%) were extremely confident that they could apply
1646
Volume 27, No. 6: November 2026
Bokman et al.
Acceptability of a Novel Prehospital Emergency Care System Eval Tool 100%]). Only 1% (n = 1; 95% CI, 0–4%) from Vietnam and 2% (n = 1; 95% CI, 0–13%) from Indonesia stated that they were extremely unlikely to share this tool, but these responses did not differ significantly from respondents from other countries (P = .29). Prioritization of Prehospital Emergency Care System Evaluation Tool Elements Participants were also asked to indicate which elements they would prioritize implementing in their healthcare system if they were to use PECSET. The top two elements chosen by members of each country are displayed in Table 4. Some countries, such as Indonesia and Vietnam, focused on improving infrastructure and capacity. Others such as Thailand and Malaysia emphasized protocols, training, and quality assurance to improve PEC outcomes. All countries chose “layperson public awareness and education programs” as a top element on which to focus. Figure 2 shows the current implementation status of the core elements for each country as assessed by the participants. Aggregate scores were given to the elements based on their implementation status with higher scores indicating a higher implementation status.
Figure 1. Series of bar charts illustrating the distribution of participant responses regarding their likelihood to share and use the tool, as well as their confidence in applying it and its potential to improve local care outcomes. PECSET, Prehospital Emergency Care System Evaluation Tool.
PECSET within their local PEC. Participants were also optimistic that PECSET would improve care outcomes in their regions with 95% (n = 259; 95% CI, 91–97%) of all participants indicating that they were very or extremely confident with PECSET. Affective Attitude and Dissemination Intent Participant plans to integrate PECSET into their local systems reflect affective attitude toward the tool. Most participants indicated plans to integrate PECSET into their PEC systems, with 97% (n = 266; 95% CI, 94–99%) of all respondents stating their intention to use the tool. Only participants from Vietnam and Indonesia indicated hesitation with 5% (n = 4; 95% CI, 2–10%) and 2% (n = 1; 95% CI, 0–13%), respectively, responding that they did not plan to use PECSET. However, the observed hesitancy was not significant from the other countries (P = .24). Nearly all participants showed a high likelihood of sharing the tool with other systems or medical directors (99% [n = 272; 95% CI, 97– Volume 27, No. 6: November 2026
DISCUSSION Implementation science research in PEC remains relatively limited, with a recent systematic review identifying a paucity of studies evaluating implementation strategies and outcomes in EMS settings.30 While no prior studies have assessed the acceptability of a comprehensive prehospital evaluation framework, Pap et al evaluated the acceptability of a suite of prehospital quality indicators among Australian EMS clinicians.31 Similar to our findings, they reported high overall acceptability of the proposed indicators, attributing this to their evidence-informed development, clarity, practicality, and perceived clinical relevance. Unlike Pap et al, whose work focused on refining individual quality indicators by evaluating their characteristics, our study assessed implementation-related perceptions of an integrated PEC system evaluation framework, demonstrating early implementation readiness through high levels of self-efficacy, intervention coherence, perceived effectiveness, and intention to use. Acceptability and Related Implementation Outcomes Despite representing a wide range of PEC roles and system types, participants consistently reported high confidence in their ability to use PECSET, which reflects strong self-efficacy, a core construct within the TFA.28 Participants also believed the tool could improve patient care and system performance, indicating high perceived effectiveness. In addition, respondents’ plans to apply and share PECSET demonstrate strong intervention coherence, reflecting clear understanding of the tool’s purpose, structure, and relevance within their local contexts. Together, these
1647
Western Journal of Emergency Medicine
Acceptability of a Novel Prehospital Emergency Care System Eval Tool
Bokman et al.
Table 4. Top-ranked Prehospital Emergency Care System Evaluation Tool elements for implementation priority by country. This table identifies the two specific elements (eg, layperson education, dispatch-assisted instructions, or staff wellness) that stakeholders in each country prioritized for implementation within the next six months in a study of the acceptability of the Prehospital Emergency Care System Evaluation Tool among Southeast Asian stakeholders. Element
Countries Prioritizing that Element
Dispatch-assisted instructions
The Philippines, Malaysia, Vietnam
Essential patient care record documentation and medical record management
Thailand*
Layperson public awareness and education
The Philippines, Indonesia, Malaysia, Thailand*, Vietnam
Prehospital staff wellness program
Thailand*
Standardized training programs for community first responders, dispatchers, and prehospital personnel *Thailand had three elements tied for its second most popular element.
Indonesia, Thailand*
findings indicate that PECSET is highly acceptable to its intended users and is well positioned for further implementation testing. Although the survey was designed to assess acceptability, several items align with other constructs from Proctor’s implementation outcomes framework.32 Participant confidence in applying PECSET suggests early perceptions of feasibility, while stated intentions to use and disseminate the tool point toward spread potential. Beliefs that PECSET would improve patient care reflect perceived appropriateness, meaning users viewed the tool as a good fit for their systems. These findings should be interpreted cautiously, but they highlight areas for future studies to explore using dedicated measures of feasibility, adoption, fidelity, and system-level impact. Diversity and Generalizability The study included a multinational sample representing a wide range of PEC system types, including varying levels of urbanization, system development, and operational priorities. Participants encompassed medical directors, EMS clinicians, dispatchers, nurses, and administrators, roles that collectively span the spectrum of PEC responsibilities. This diversity strengthens confidence that the findings reflect perspectives of the broader population of potential PECSET users and enhances external validity, suggesting that the tool may be generalizable and adaptable to multiple PEC settings throughout Southeast Asia. While most respondents had relatively limited PEC experience (≤ 5 years), their consistent responses across countries and roles indicate that PECSET is understandable and acceptable even to less-experienced end-users. Perceived Clinical and Operational Value High participant-reported confidence in using PECSET and in its potential impact on patient outcomes is critical to successful adoption. Although no known prior studies have evaluated patient outcomes directly before and after implementing a PEC evaluation tool, the core elements of Western Journal of Emergency Medicine
PECSET (eg, dispatch-assisted instructions, quality assurance programs, universal emergency numbers, layperson education) are individually supported by evidence of morbidity and mortality benefit.33-35 These alignments reinforce the perceived clinical value expressed by respondents and support the tool’s potential to guide meaningful system enhancements. Adoption Potential and Implementation Readiness Acceptability must be translated into intent to use for implementation to progress. Most respondents indicated concrete plans to apply PECSET in their systems and to share it with colleagues, reflecting strong perceived usefulness and alignment with real-world PEC needs in Southeast Asia. The high levels of confidence reported by participants also suggest that the RA training sessions effectively communicated the tool’s purpose and applications. This foundation provides a favorable environment for future training and dissemination. Adaptability to Local System Priorities Differences in the PECSET elements prioritized by respondents highlight the heterogeneity of PEC challenges across Southeast Asia. These variations underscore the importance of a tool that is structured yet flexible, allowing local stakeholders to tailor evaluations to system-specific needs. Such adaptability enhances PECSET’s relevance across settings and offers direction for targeted resource allocation, quality improvement initiatives, and capacity-building efforts. Potential Impact and Framework for Developing RegionSpecific Tools The high acceptability of PECSET across a diverse, multinational sample suggests it has the potential to improve system-level performance in Southeast Asian PEC systems. This tool provides a structured, evidence-informed framework to evaluate and prioritize prehospital care interventions, guiding resource allocation, quality improvement, and policy decisions across varied contexts. Its development, incorporating stakeholder engagement, iterative refinement
1648
Volume 27, No. 6: November 2026
Bokman et al.
Acceptability of a Novel Prehospital Emergency Care System Eval Tool
Figure 2. Color-coded scale (red to green) and numerical aggregate scores showing the current implementation level of 12 core system elements, as reported by participants the five participating countries, in a study of the acceptability of the PECSET among Southeast Asian stakeholders. PECSET, Prehospital Emergency Care System Evaluation Tool.
through Delphi consensus, and TFA-based survey design to demonstrate acceptability, offers a model for creating other region-specific evaluation tools. The principles of stakeholder engagement, adaptability, and focus on actionable elements can inform other tools addressing regional challenges in prehospital care or health system evaluation. These findings also lay the groundwork for future studies assessing PECSET’s impact on measurable system outcomes. LIMITATIONS Several limitations should be acknowledged. Only individuals who attended the Resuscitation Academy were approached for participation, introducing potential sampling bias. These individuals are likely more motivated, reformoriented, and engaged in quality improvement than the broader EMS workforce, which may limit generalizability and inflate estimates of acceptability and intention to use. As early adopters are the intended target audience for initial dissemination, their perspectives remain highly relevant; however, EMS personnel who are unfamiliar with the framework or who have not participated in similar educational initiatives may be less inclined to adopt or implement it in practice. Social desirability bias may also have influenced responses, as the survey was administered immediately following a training session, potentially leading to more favorable feedback. Anonymity was maintained to mitigate this effect. The timing of outcome collection may also have introduced recency bias and resulted in more favorable ratings. In addition, perceptions were assessed at a single time point, and no follow-up survey was conducted. Consequently, the study cannot determine whether these positive perceptions were sustained over time or with memory decay. Nonresponse Volume 27, No. 6: November 2026
bias is also possible given the 34% nonresponse rate. The survey relied primarily on fixed-choice items, limiting the ability to capture nuanced perspectives or contextual barriers and facilitators influencing acceptability. Future studies should incorporate qualitative or mixedmethods approaches, such as interviews or focus groups, to provide deeper insight into user experiences. Formal psychometric evaluation of the survey instrument was beyond the scope of this study. Construct validity and reliability were not formally assessed, and internal consistency measures were not calculated, as the survey was not designed to measure multiitem latent constructs. Although items were informed by the theoretical framework of acceptability to support conceptual alignment, findings should be interpreted as an initial descriptive assessment rather than a validated measurement instrument. Future work should include formal reliability testing and construct validation. Finally, the survey was administered only in English and Vietnamese, neither of which was the first language for many participants and may have influenced interpretation despite expert review for clarity. CONCLUSION We demonstrated that PECSET is acceptable to potential en users across diverse prehospital systems in Southeast Asia. Participants expressed confidence in using the tool, recognized its relevance to their practice, and believed it could improve patient care, indicating self-efficacy, perceived effectiveness, and intervention coherence. These early indicators of acceptability, combined with consistent intentions to use and disseminate PECSET, suggest that the tool is well positioned for broader implementation. As a stakeholder-informed evaluation tool, PECSET offers a
1649
Western Journal of Emergency Medicine
Acceptability of a Novel Prehospital Emergency Care System Eval Tool practical framework for strengthening prehospital emergency care systems in Southeast Asia and has the potential to be adapted for other settings. Future work should focus on assessing feasibility, fidelity, and system-level outcomes as PECSET is introduced into real-world practice.
Bokman et al.
REFERENCES 1. Moresky RT, Razzak J, Reynolds T, et al. Advancing research on emergency care systems in low-income and middle-income countries: ensuring high-quality care delivery systems. BMJ Glob Health. 2019;4(suppl 6):e001265. 2. Thind A, Hsia R, Mabweijano J, et al. Prehospital and emergency
ACKNOWLEDGMENTS Thank you to the Temasek Foundation for their support in organizing the Resuscitation Academies where the PECSET survey was distributed. Thank you to the Laerdal Foundation, which provided funding for this study.
care. In: Debas HT, Donkor P, Gawande A, et al, eds. Essential Surgery: Disease Control Priorities. 3rd ed. Vol 1. World Bank; 2015. 3. Razzak J, Usmani MF, Bhutta ZA. Global, regional and national burden of emergency medical diseases using specific emergency disease indicators: Analysis of the 2015 Global Burden of Disease Study. BMJ Glob Health. 2019;4(2):e000733.
AUTHORS CONTINUED Faith Joan Mesa-Gaerlan, MD, MS¶ Pin Pin Pek, MPH§ Sattha Riyapan, MD, MPH** Marcus EH Ong, MBBS, MPH§†† Audrey L. Blewer, PhD, MPH§|| Gayathri Devi Nadarajan, MBBS, MMed§††
4. Kironji A, Hodkinson P, de Ramirez SS, et al. Identifying barriers for out of hospital emergency care in low and low-middle income countries: a systematic review. BMC Health Serv Res. 2018;18:291. 5. Tansley G, Schuurman N, Amram O, et al. Spatial access to emergency services in low- and middle-income countries: a GISbased analysis. PLoS One. 2015;10(11):e0141113. 6. Bills CB, Newberry JA, Darmstadt G, et al. Reducing early infant
Health Services Research and Population Health, DukeNUS, Singapore, Singapore || Duke University School of Medicine, Department of Family Medicine and Community Health and Department of Population Health Sciences, Durham, North Carolina # International Medical School, Management and Science University, Shah Alam, Malaysia ¶ University of Philippines, Philippine General Hospital and Southern Philippines Medical Center, Davao, Philippines **Mahidol University, Siriraj Hospital, Faculty of Medicine, Thailand †† Singapore General Hospital, Department of Emergency Medicine, Singapore §
mortality in India: results of a prospective cohort of pregnant women using emergency medical services. BMJ Open. 2018;8(4):e019937. 7. Walker R, Auerbach PS, Kelley BV, et al. Implementing an emergency medical services system in Kathmandu, Nepal: a model for “white coat diplomacy.” Wilderness Environ Med. 2014;25(3):311-318. 8. Najafi H, Bahramali E, Bijani M, et al. Correction: Comparison of the outcomes of EMS vs non-EMS transport of patients with ST-segment elevation myocardial infarction (STEMI) in Southern Iran: a population-based study. BMC Emerg Med. 2022;22(1):72. 9. Alharbi RJ, Shrestha S, Lewis V, et al. The effectiveness of trauma care systems at different stages of development in reducing mortality: a systematic review and meta-analysis. World J Emerg Surg. 2021;16:38. 10. Shanahan T, Risko N, Razzak J, et al. Aligning emergency care with
Address for Correspondence: Gayathri Devi Nadarajan, MBBS, MMed, Health Services Research and Population Health, DukeNUS, 8 College Road, Singapore 169857. Email: gmsgdn@nus. edu.sg.
global health priorities. Int J Emerg Med. 2018;11(1):52. 11. Anderson PD, Suter RE, Mulligan T, et al. World Health Assembly Resolution 60.22 and its importance as a health care policy tool for improving emergency care access and availability globally. Ann
Conflicts of Interest: By the WestJEM article submission agreement, all authors are required to disclose all affiliations, funding sources and financial or management relationships that could be perceived as potential sources of bias. The Temasek Foundation provided funding and organizing support for the Resuscitation Academies where the PECSET survey was distributed. The Laerdal Foundation provided funding for this study, grant ID 50046. The Temasek and Laerdal Foundations’ support were accepted without any conditions that would limit the authors’ ability to complete the study as planned. The authors remained in full control of all primary data, including its analysis and interpretation. There are no conflicts of interest to declare.
Emerg Med. 2012;60(1):35-44.e3. 12. Resolution WHA60.22. Health systems: emergency-care systems. In: Sixtieth World Health Assembly, Geneva, May 23, 2007. World Health Organization; 2007. Available at: https://apps.who.int/iris/ bitstream/handle/10665/22596/A60_R22-en.pdf. Accessed June 30, 2026. 13. Resolution WHA68.15. Strengthening emergency and essential surgical care and anaesthesia as a component of universal health coverage. In: Sixty-eighth World Health Assembly, Geneva, May 26, 2015. World Health Organization; 2015. Available at: https://apps.
Copyright: © 2026 Bokman et al. This is an open access article distributed in accordance with the terms of the Creative Commons Attribution (CC BY 4.0) License. See: http://creativecommons.org/ licenses/by/4.0/
Western Journal of Emergency Medicine
who.int/gb/ebwha/pdf_files/WHA68/A68_R15-en.pdf. Accessed June 30, 2026 14. Resolution WHA56.24. Implementing the recommendations of the
1650
World report on violence and health. In: Fifty-sixth World Health
Volume 27, No. 6: November 2026
Bokman et al.
Acceptability of a Novel Prehospital Emergency Care System Eval Tool
Assembly, Geneva, March 3, 2003. World Health Organization; 2003.
countries: report from a literature review and survey. Emerg Med
Available at: https://apps.who.int/gb/archive/pdf_files/WHA56/
Australas. 2013;25(1):55-63.
ea5624.pdf. Accessed June 30, 2026
26. MacFarlane C. Evaluation of emergency medical services systems: A
15. Resolution WHA57.10. Road safety and health. In: Fifty-seventh
classification to assist in determination of indicators. Emerg Med J.
World Health Assembly, Geneva, May 22, 2004. World Health
2003;20(2):188-191.
Organization; 2004. Available at: https://apps.who.int/gb/ebwha/pdf_
27. Nadarajan GD, Pek PP, Blewer AL, et al. Establishing core elements
files/WHA57/A57_R10-en.pdf. Accessed June 30, 2026.
for a Prehospital Emergency Care Systems Evaluation Tool
16. Razzak JA, Kellermann AL. Emergency medical care in developing
(PECSET) for systems in early stages of development: a Delphi
countries: Is it worthwhile? Bull World Health Organ. 2002;80(11):900-5. 17. Bhattarai HK, Bhusal S, Barone-Adesi F, et al. Prehospital
consensus. Prehosp Emerg Care. 2024:1-17. 28. Sekhon M, Cartwright M, Francis JJ. Acceptability of healthcare
emergency care in low- and middle-income countries: a systematic
interventions: an overview of reviews and development of a
review. Prehosp Disaster Med. 2023;38(4):495-512.
theoretical framework. BMC Health Serv Res. 2017;17(1):88.
18. Berger E. Crossroads: Report calls for EMS standards of care. Ann
29. Malterud K, Siersma VD, Guassora AD. Sample size in qualitative
Emerg Med. 2006;48(2):142-143.
interview studies: guided by information power. Qual Health Res.
19. Mainz J. Defining and classifying clinical indicators for quality
2016;26(13):1753-1760.
improvement. Int J Qual Health Care. 2003;15(6):523-30.
30. Fishe JN, Crowe RP, Cash RE, et al. Implementing prehospital
20. Howard I, Cameron P, Wallis L, et al. Identifying quality indicators for
evidence-based guidelines: a systematic literature review. Prehosp
prehospital emergency care services in the low to middle income
Emerg Care. 2018;22(4):511-519.
setting: The South African perspective. Afr J Emerg Med.
31. Pap R, Stephenson M, Simpson P, et al. Acceptability of Australian
2019;9(4):185-192.
prehospital care quality indicators: an explanatory sequential mixed
21. Mehmood A, Rowther AA, Kobusingye O, et al. Assessment of
methods study. Paramedicine. 2023;20(2):38-50.
pre-hospital emergency medical services in low-income settings
32. Proctor E, Silmere H, Raghavan R, et al. Outcomes for
using a health systems approach. Int J Emerg Med. 2018;11(1):53.
implementation research: conceptual distinctions, measurement
22. World Health Organization. Prehospital Emergency Care Assessment
challenges, and research agenda. Adm Policy Ment Health.
Tool (PEAT). 2025. Available at: https://cdn.who.int/media/docs/
2011;38(2):65-76.
default-source/integrated-health-services-(ihs)/csy/prehospital/peat.
33. Ro YS, Shin SD, Lee YJ, et al. Effect of dispatcher-assisted
pdf. Accessed June 30, 2026
cardiopulmonary resuscitation program and location of out-of-hospital
23. Nadarajan GD, Tiah L, Ho AFW, et al. Global Resuscitation Alliance
cardiac arrest on survival and neurologic outcome. Ann Emerg Med.
Utstein recommendations for developing emergency care systems to improve cardiac arrest survival. Resuscitation. 2018;132:85-89.
2017;69(1):52-61.e1. 34. Riyapan S, Sanyanuban P, Chantanakomes J, et al. Enhancing
24. Chong SL, Laerdal T, Cordero J, et al. Global Resuscitation
survival outcomes in developing emergency medical service system:
Alliance consensus recommendations for developing emergency
Continuous quality improvement for out-of-hospital cardiac arrest.
care systems: Reducing perinatal mortality. Resuscitation.
Resusc Plus. 2024;19:100683.
2018;133:71-74.
35. Simmons KM, McIsaac SM, Ohle R. Impact of community-based
25. Ong ME, Cho J, Ma MHM, et al. Comparison of emergency medical
interventions on out-of-hospital cardiac arrest outcomes: a systematic
services systems in the Pan-Asian Resuscitation Outcomes Study
Volume 27, No. 6: November 2026
review and meta-analysis. Sci Rep. 2023;13(1):10231.
1651
Western Journal of Emergency Medicine
Original Research
Prehospital Facial Recognition Technology: Randomized Controlled Simulation Study Asit Misra, MD, MSMEd*§º Richard Cabeceiras, MPH†º Abishek Sehgal, MPH* Jose L. Montero, MPH† Richard Cambo, MPH† Richard D. Rodriguez, MA† Angel A. Brotons, EMT-P* Samantha L. Syms, MS* Tulay Koru-Sengul, MHS, PhD† Eduard Tiozzo, MSCTI, PhD‡ Ivette Motola, MD, MPH*§
*University of Miami Miller School of Medicine, Gordon Center for Simulation & Innovation in Medical Education, Miami, Florida † University of Miami Miller School of Medicine, Department of Public Health Sciences, Miami, Florida ‡ University of Miami Miller School of Medicine, Department of Physical Medicine and Rehabilitation, Miami, Florida § University of Miami Miller School of Medicine, Department of Surgery, Miami, Florida ºCo-first authors
Section Editor: Shira Schlesinger, MD, MPH Submission history: Submitted October 14, 2025; Revision received June 18, 2026; Accepted June 26, 2026 Electronically published October 29, 2026 Full text available through open access at http://escholarship.org/uc/uciem_westjem DOI 10.5811/westjem.53140
Introduction: The risk of medical errors increases for the approximately 689,000 unidentified, noncommunicative patients who present to emergency departments annually. The concomitant rise in hospital admissions, lengths of stay, and mortality will likely persist unless approaches to identifying noncommunicative patients are developed and adopted. Facial recognition technology could provide a solution where scanning the face reliably provides access to identification and medical history of patients who self-enroll in the application database. Our objective was to compare paramedics’ ability to identify noncommunicative patients and make related clinical decisions using a cloud-based facial-recognition application vs standard practice. Methods: We conducted a double-blind, randomized controlled study with 90 participating firefighterparamedics in a simulated patient encounter. Our primary outcome was patient identification. Secondary outcomes included identification of key medical information, appropriateness of treatment decisions, and transport to the patient’s preferred hospital. We uploaded facial photographs and simulated medical profiles to a secure cloud-based app. Participants used a tablet to scan the patient’s face (standardized patient or actor). Successful matches returned identifying information, medical history, emergency contacts, preferred hospital, and primary care physician contact information. The 48 experimental participants had access to this patient information, while the 42 controls did not, even if they scanned the face. Standardized patients (SP) portrayed a noncommunicative urosepsis patient. Participants reported their findings to the facilitators and evaluated the technology on a 5-point Likert scale. Results: We analyzed 90 study participants (48 experimental, 42 control), of whom 40/48 (83.3%) experimental group identified the SP compared with 9/42 (21.4%) control group (OR [odds ratio], 13.87; 95% CI, 5.03-38.25; P < .001). Identification of important medical information of the SP by the study participants occurred in 30/48 (62.5%) in the experimental group versus 4/42 (9.5%) in control (OR, 15.83; 95% CI, 4.84-51.76; P < .001). Correct transport decision to the preferred hospital occurred in 27/48 (56.3%) experimental participants compared with 10/42 (23.8%) controls (OR, 4.11; 95% CI, 1.65-10.23; P = .02). Overall, 80% of participants reported that the technology would benefit their day-to-day clinical work. Conclusion: The use of a cloud-based facial-recognition application significantly improved firefighterparamedics’ ability to identify noncommunicative patients and access critical medical information, with an appropriate transport decision to the patient’s preferred hospital. [West J Emerg Med. 2026;27(6)1652– 1659.]
Western Journal of Emergency Medicine
1652
Volume 27, No. 6: November 2026
Prehospital Facial Recognition Technology Simulation Study
Misra et al. INTRODUCTION Medical errors occur in approximately 4% to 10% of hospital patients yearly.1,2 A 2017 study reported that medical errors may have accounted for 251,000 annual deaths in the United States, making them the third leading cause of death.3 Although errors reported by emergency medical services (EMS) in the United Kingdom can reach as high as 13%, recent comparable data are unavailable for the US.4 The frequency of errors in patient care can increase in emergencies and/or when a patient’s medical history is unknown. These factors increase the likelihood of medical complications, such as misdiagnosis and over- or under-treatment.5 The potential for medical errors can compound when dealing with noncommunicative patients who lack identifying information.6 Of all medical errors in the US annually, 10% to 17% were attributed to errors in identification (ID).7,8 Additional data indicate that unknown patients comprise 0.14% to 0.54% of emergency department (ED) visits in North America.9,10 In 2018, this would have impacted between 178,000 to 689,000 patients in the US. Studies have reported that unidentified patients were mostly male (64.9% to 71%), while most patients were brought in by EMS (65.1% to 80.7%).5,9-11 Patients with unknown identities experienced an increased number of hospital admissions, and greater lengths of stay and incidence of mortality.10 Improper treatment and/or diagnostic testing resulting from a lack of patient identification can intensify when multiple unknown patients present to the ED or in mass casualty incidents, despite using electronic health records.12-14 Problems due to a lack of patient identification can also occur in routine care. In 2018, over 3.6 million individuals in. the US sought emergency treatment for a urinary tract infection (UTI), making UTI the seventh most common reason to visit the ED. A UTI is a “common cause of altered mental status, particularly in elderly patients and patients with psychiatric conditions.”15 This altered mental status could render patients noncommunicative and unidentifiable to healthcare professionals, causing potential delays in diagnosis and treatment.10,15 These delays in diagnosis and treatment increase morbidity and mortality because a prolonged UTI can lead to urosepsis, septic shock, or both.16-18 The challenges of unidentified patients manifest somewhat differently in prehospital versus hospital settings. In the prehospital setting, EMS clinicians must rapidly determine the likely causes of a patient’s altered mental status and choose an appropriate destination without any knowledge of the patient’s medical history. Gaining access to a patient’s records in the field could significantly help with these decisions: For example, recognizing that the patient “had frequent UTIs in the last year with the same presentation” (as opposed to having a history of multiple falls while on anticoagulation, which might be suggestive of suspected intracranial hemorrhage) would enable paramedics to make more informed differential diagnoses and destination choices, ensuring the patient is transported to the right facility. Correct identification could Volume 27, No. 6: November 2026
Population Health Research Capsule What do we already know about this issue? Unidentified, noncommunicative patients have a higher risk of medical errors; facial recognition technology can serve as a reliable identification (ID) tool. What was the research question? Does a facial recognition app improve patient ID and decision-making of paramedics compared with traditional means of care for noncommunicative patients? What was the major finding of the study? Patient ID improved: 83.3% vs 21.4%; OR, 13.87 (95% CI, 5.03–38.25); P < .001. Medical information ID: 62.5% vs 9.5%; OR, 15.83 (95% CI, 4.84–51.76); P < .001. How does this improve population health? This app may improve prehospital care by facilitating quick patient ID and key medical information and supporting more appropriate transport and treatment decisions.
allow paramedics to bring a patient to the hospital or healthcare system where they usually receive care (enhancing continuity of care). In the hospital setting, an unidentified patient poses additional challenges—clinicians have no information on the patient’s allergic history, medication use, prior colonization with antibiotic-resistant organisms, or past medical history—which complicates diagnostic workup and can lead to mistreatment or delays (for example, administering a drug to which the patient is allergic or failing to consider infections in light of prior culture results). As the UTI example illustrates, not knowing a patient’s identity can precipitate medical errors or delays in care for many other conditions. Altered mental status is a common presentation of life-threatening problems such as stroke, drug overdose, or severe electrolyte imbalance, and managing these conditions is considerably more challenging when the patient is unidentified and cannot provide any history. Access to patient information and medical history, even when a patient cannot communicate, can improve outcomes in trauma and many life-threatening diseases.3,18-21 A universal mechanism is urgently needed to access medical records from any location and better track patient movements throughout their medical journey.3,20-22 Facial recognition technology has
1653
Western Journal of Emergency Medicine
Prehospital Facial Recognition Technology Simulation Study
Misra et al.
been used in clinical settings, demonstrating a high degree of sensitivity (96.5%) and specificity (96.7%).3,20-24 The technology we used in this study was based on the Rekognition platform (Amazon Web Service).25 Currently, there is no other standard of care, and the use of facial recognition in the US healthcare system is still novel. Cloud-based facial recognition technology could be a solution that helps clinicians identify noncommunicative patients, view their medical history, and track their movements in prehospital and hospital settings.24 Previous studies have shown the use of simulation to validate and test a new technology or skills training.26-28 This pilot study aimed to examine the effect of a cloud-based facial recognition app on patient identification and gathering medical history among noncommunicative patients. The study also examined the effect of the same app when used by paramedics on triage, treatment, and transport decision outcomes among noncommunicative patients in a simulated environment using standardized patients (SP).
outcomes included identification of key medical information, appropriateness of treatment decisions, and transport to the preferred hospital of the patient.
METHODS Design and Population We conducted this double-blind, randomized controlled study from May to June 2022 at the Gordon Center for Simulation and Innovation in Medical Education at the University of Miami Leonard M. Miller School of Medicine in Miami, Florida (Instiiutional Review Board approval No. 20220232). Providing a setting that safely simulated a real-world scenario was important to understanding the implications of using facial recognition to identify patients in a prehospital setting. We used a convenience sampling method to recruit 101 local paramedics in Miami. The participants were part of a single fire-rescue–based EMS agency with approximately 800 full-time employees serving in an urban region with an approximate population of 435,000. A total of 99 paramedics provided written consent to participate and were randomly divided into a control (n = 50) or experimental (n = 49) group. Trained SPs portrayed elderly patients experiencing symptoms of urosepsis in the simulation scenario. Standardized patients were required to provide a photograph of their face. Each SP assigned to the experimental group had their patient information (for the simulated case) and photograph uploaded into the app database, ERinfo (ERinfo, Inc). Control group SPs were not in the database. The study team included research associates, evaluators, and facilitators. Research associates consented participants, assigned study ID numbers, and conducted app training. Blinded to group assignments, evaluators gave the scenario briefing and recorded encounter durations, treatment decisions, and transport destinations. Facilitators were situated in the scenario room with the participant and the SP, available to answer questions about vital signs and physical exam findings not portrayed by the SP. Upon appropriate request, the facilitator provided emergency contact feedback. Our primary outcome measure was patient ID. Secondary Western Journal of Emergency Medicine
Simulation Case Scenario The simulation case scenario was “an unidentified elderly patient with altered mental status.” The SP exhibited symptoms associated with recurrent UTI, Alzheimer disease, fever, and chills. Although responsive to verbal commands, the patient was shivering, complaining about being cold, and unable to answer identifying information. Vital signs were as follows: heart rate, 128 beats per minute; temperature, 102 °F; and respiratory rate, 24 breaths per minute. Questions about blood pressure, oxygen saturation, and blood glucose were answered with appropriate values within the reference range. A 12-lead electrocardiogram (ECG), if performed, revealed a normal sinus rhythm. Medical history included allergies to penicillin and peanuts, Alzheimer disease, hypertension, and recent admission to the University of Miami Hospital (UMH) for a UTI. Standardized patients could follow all commands but answered “I don’t know” to any identifying questions. Only experimental group participants could gather identifying information, medical history, emergency contact information, and the patient’s preferred hospital. This required the participant to choose to use the application, and subsequently, to use it correctly. The SP encounters took place in a simulated home environment. Emergency medical serivces could not readily find identifying information because the person was alone and noncommunicative, which is a common challenge for EMS clinicians. The location was equidistant to Jackson Memorial Hospital (JMH), UMH, and Miami Veterans Affairs Medical Center. Because of the patient’s recent admission to UMH, that hospital would be ideal for further treatment. However, departmental protocol dictated that the patient be brought to JMH when no preference is provided. The paramedic could also contact the SP’s emergency contact if they successfully accessed the app, who would provide the same information provided by the app. Implementation and Randomization We randomly assigned participants to the control or experimental group. Two participants at a time entered a classroom and received a tablet device containing the app. Every participant received a three-minute tutorial on app usage. Following the tutorial, the study team separated the participants, and each was directed to the appropriate briefing room for the setting and nature of the 9-1-1 call. Next, each participant went to their respective patient encounter room to assess and manage the SP. Evaluators recorded entry and exit times. The study team did not require participants to use the app. If a participant asked a facilitator whether they should use the app, the facilitator responded with, “If you want.” To ensure blinding, the study design permitted optional app use in both groups. All participants were trained on the app and had a
1654
Volume 27, No. 6: November 2026
Prehospital Facial Recognition Technology Simulation Study
Misra et al. tablet; however, the application was accessed by both groups, with successful patient identification occurring exclusively in the experimental group and no matches observed in the control group. After the scenario, participants reported their treatment interventions and transport decisions. The same SP scenario was used for all participants to ensure standardization. A total of 99 SP encounters were conducted (50 control, 49 intervention), with a one-to-one correspondence between participant and SP encounter. Outcomes were measured based on paramedic performance during the encounter, and analyses were conducted at the participant level because each encounter reflected a single participant’s performance under identical scenario conditions. The study participants answered a Qualtrics questionnaire (Qualtrics International Inc, June 2022; Supplement 1) consisting of six demographic questions, 11 Likert-type (1 = strongly disagree, 5 = strongly agree), and one ranking question (1 = most important, 8 = least important). All study participants received a $25 gift card for participation. Participants, evaluators, facilitators, and SPs were blinded to their study arm to address any potential source of bias. Evaluators, facilitators, and SPs were trained in their roles individually. At the beginning of each study day and at additional points during the day, the study team conducted trial runs of the scenario to ensure accuracy and script compliance.
Table 1. Demographic characteristics of participants in a randomized controlled simulation study comparing paramedics’ ability to identify noncommunicative patients and make related clinical decisions when using a cloud-based facial-recognition app vs standard practice.
Data Analysis We analyzed all data using SAS OnDemand for Academics, version 3.8 (SAS Institute Inc). Frequency and percentage distributions were calculated for all demographic outcomes (age, sex, race and ethnicity, highest level of education, and years of paramedic experience) (Table 1). Demographic outcomes of the control and experimental groups were compared using a chi-square test. We calculated odds ratios with 95% CIs to examine the differences between the two groups on binary outcomes (yes/no; calculated using the top box and the bottom box method, where “strongly disagree,” “disagree,” and “neutral” were categorized as “no,” while “agree” and “strongly agree” were categorized as “yes”). The binary outcomes included patient identification, patient contraindication identification, treatment (the participant treated the SP without causing harm while following their departmental protocol for the treatment of septic shock that included administering intravenous fluids, checking blood glucose, and administering vasopressors after two fluid boluses to achieve a mean arterial pressure of 65 mm Hg); sepsis mitigation actions (the participant provided treatments appropriate for the SP’s primary condition); treatment confidence; transport (the patient should be transported to UMH for this case); and transport confidence (participants’ belief in correct transport destination). Mean rank with a 95% CI was used to calculate the rank of information importance to participants (1 = most important, 8 = least important) for identifying information, prior medical conditions, allergies, medications, emergency contact
Highest level of education
Volume 27, No. 6: November 2026
Category Age
All Count (%)
Control Count (%)
Experimental Count (%)
90 (100.0%) 42 (46.7%)
48 (53.3%)
P = .23
< 30 years
16 (17.8%)
9 (21.4%)
7 (14.6%)
31–40 years
38 (42.2%)
21 (50.0%)
17 (35.4%)
41–50 years
25 (27.8%)
8 (19.1%)
17 (35.4%)
≥ 51 years
11 (12.2%)
4 (9.5%)
7 (14.6%)
Sex
P = .18
Male
80 (88.9%)
39 (92.9%)
41 (85.4%)
Female
9 (10.0%)
2 (4.8%)
7 (14.6%)
Prefer not to say
1 (1.1%)
1 (2.4%)
0 (0.0%)
Race
P = .86
White
71 (78.9%)
33 (78.6%)
38 (79.2%)
Black
12 (13.3%)
5 (11.9%)
7 (14.6%)
Other
7 (7.8%)
4 (9.5%)
3 (6.3%)
Hispanic
P = .56
No
24 (26.7%)
10 (23.8%)
14 (29.2%)
Yes
66 (73.3%)
32 (76.2%)
34 (70.8%)
P = .24
High school diploma or equivalent
15 (16.7%)
10 (23.8%)
5 (10.4%)
Associate
45 (50.0%)
20 (47.6%)
25 (52.1%)
Bachelor
23 (25.6%)
8 (19.1%)
15 (31.3%)
Graduate
7 (7.8%)
4 (9.5%)
3 (6.3%)
Years of experience
P = .22
< 5 years
9 (10.0%)
3 (7.1%)
6 (12.5%)
6–15 years
45 (50.0%)
25 (59.5%)
20 (41.7%)
≥ 16 years
36 (40.0%)
14 (33.3%)
22 (45.8%)
information, preferred language, choice of treatment facility, and primary care clinician contact information. We calculated proportions across the groups based on the participants’ actual vs perceived confidence (what they believed) in making appropriate treatment and transport decisions. Proportions across the groups were also calculated based on the participants’ app use (ease of use, improved ability to identify patients, treat patients, identify patient contradictions, improved transport decisions, and whether the app was beneficial when evaluating patients). We excluded 11 participants from the analyses for failure to follow the study protocol or due to opting out: Two declined to participate during the consent stage; seven were excluded
1655
Western Journal of Emergency Medicine
Prehospital Facial Recognition Technology Simulation Study
Misra et al.
due to incomplete data (partially filled out the postencounter questionnaire and left the question blank on what treatment or care provided to the patient); and two from the control group opted out immediately after their participation (SP simulation encounter) (Figure 1).
physician contact information (Table 3 and Supplement 1, Q3). Overall, participants reported that facial recognition technology would be better than their current procedures when dealing with noncommunicative patients, and they believed there was an overall benefit to using it for patient assessment. Likert scale questions (Supplement 1, Q2) addressing current procedures—including improvements in patient ID, treatment decision capability, identification of contraindications, and transport decision capability—showed statistically significant differences between study groups (Figure 2).
RESULTS We analyzed data from 90 firefighter-paramedics, 42 in the control group and 48 in the experimental group. No statistically significant demographic differences between study arms were present (Table 1). Table 2 summarizes the achievement of desired outcomes, along with the level of confidence reported by participants with respect to having achieved outcomes. Of 48 experimental participants, 40 (83.3%) identified the patient compared with 9 of 42 (21.4%) controls (odds ratio [OR], 13.87; 95% CI, 5.03-38.25; P < .001). Thirty of 48 (62.5%) participants identified important medical information from the SP encounter in the experimental group versus 4 of 42 (9.5%) in the control group (OR, 15.83; 95% CI, 4.84-51.76; P < .001). Of 48 (56.3%) participants 27 made the correct transport decision to the preferred hospital in the experimental group compared with 10 of 42 (23.8%) in the control group (OR, 4.11; 95% CI, 1.65-10.23; P = .02). More than three-quarters (81.1%) of all participants felt they made the appropriate transport decision, with no statistically significant difference between study arms. Participants, on average, ranked patient identifying information as the most important piece of data, followed (in descending order) by prior medical conditions, allergies, medications, emergency contact information, preferred language, treatment facility of choice, and primary care
Figure 1. Study design flowchart illustrating participant enrollment, allocation, and exclusions in a randomized controlled simulation study comparing paramedics’ ability to identify noncommunicative patients and make related clinical decisions when using a cloudbased facial-recognition app vs standard practice.
Western Journal of Emergency Medicine
DISCUSSION In our study, facial recognition technology demonstrated potential for quickly identifying patients and retrieving critical information for emergent care (eg, past medical history, allergies, medications, emergency contact, and primary care physician). It increased the pertinent information available when patients had altered mental status or were unconscious. We found statistically significant differences in study participant responses about whether the app could identify SPs and their corresponding data. The app made it possible to identify the noncommunicative SP and their corresponding medical information. In the field, facial recognition could provide access to patient data that may improve patient outcomes. Additionally, paramedics believed the app would be useful in a prehospital setting due to its ease of use and the information provided. Building a universal, robust patient database would increase the likelihood of matches when using facial recognition technology. Unexpectedly, access to patient information did not result in statistically significant differences in treatment decisions between groups. This is most likely due to the use of urosepsis as the SP’s primary condition, something commonly encountered by paramedics. The participants followed their sepsis protocols regardless of their access to patient information. Antibiotic administration is not part of the participants’ treatment protocol for this EMS department. Many other EMS agencies are now administering antibiotics in the field,29,30 where knowledge of the patient’s antibiotic allergy could have prevented an adverse reaction. However, this would also be helpful when patient care is transferred to the hospital. In this study scenario, where all hospital choices are equidistant, the patient’s preferred hospital was defined as the facility where they received most of their medical care and/or one within their insurance network. This was also the best transport decision in a non-life and limb-threatening emergency, as per the scenario used in this study. However, only 56.3% of the experimental group chose the correct hospital despite having access to this information, although this was not the primary objective of the study. A reason for this could be the participants’ current practice or protocol, as most EMS systems lack the ability for EMS clinicians to review a patient’s past medical history or prior encounters. Access to past medical history, medication lists, and prior
1656
Volume 27, No. 6: November 2026
Prehospital Facial Recognition Technology Simulation Study
Misra et al.
Table 2. Participant responses to evaluator-assessed outcomes (1 = strongly disagree to 5 = strongly agree) in the treatment vs control group. Mode Control (min 1, max 5)
Mode Experimental (min 1, max 5)
OR (95% CI)
P value
Patient identification
1
5
13.87 (5.03- 38.25)*
< .001*
Patient contraindication identification
1
5
15.83 (4.84-51.76)*
< .001*
Treatment confidence
5
5
2.19 (0.72-6.65)
.16
Transport confidence
5
5
2.48 (0.83-7.44)
.09
Transport** --Binary hypothesis testing of outcome variables by study arm, including odds ratio. *Indicates statistical significance at α = .05. ** indicates results derived from questions asked by evaluators. OR, odds ratio.
4.11 (1.65-10.23)*
.02*
Variable
ECGs could enhance EMS and hospital care in certain encounters, including the knowledge of the preferred care facility, especially for patients with complex medical histories, where the clinicians are aware of the patient. It may reduce unnecessary delays in care and decision-making. In trauma, knowing the history of bleeding disorders or any anticoagulant use may guide transportation directly to a trauma center, skipping the need for a secondary transfer to a trauma center, hence saving time and cost for care delivery. For suspected acute coronary syndrome, past medical history with prior ECGs may allow risk stratification, potentially prioritizing high-risk patients for faster transport to percutaneous coronary intervention capable facilities. A comprehensive past medical history could also alert EMS to medication allergies or other critical underlying conditions. Whether access to these data improves outcomes across various emergencies warrants further investigation. Participants rated “choice treatment facility” as the secondleast important information that could be provided to them by
a patient, suggesting that the value of transport-related data may need to be better communicated to EMS clinicians. The differences in the identification of medical information between study arms suggest that facial recognition technology could reduce the likelihood of harmful interventions in these complex situations, although this warrants evaluation in additional contexts. Evaluating the technology in a mass casualty scenario could further inform its usefulness in situations where patient misidentification and medical treatment errors are common. In case of a false negative—where a field image fails to match the enrolled individual—clinicians would follow existing protocols and attempt additional images under different lighting conditions, angles, and positions. The facial recognition app used in this study holds FirstNet Certification from the US government, which requires verification that the app is relevant to first responders’ needs, meets security and data protection standards, and maintains a documented history of system availability. The app also
Table 3. Ranking of information importance (1 = most important, 8 = least important) and proportion of total number (%) when identifying and managing noncommunicative patients during the encounter. Mode Control (n = 42)
Mode Control (%)
Identifying Information
1
Prior Medical Conditions
1
Variable
Mode Intervention (n = 48)
Mode Intervention (%)
35.7
1
58.3
41.5
3
25.0 29.2
Allergies
3
34.1
3
Medications
3
35.7
5
27.1
Emergency Contact Information
5
28.6
4 and 6
20.8 each
Preferred Language
8
26.2
7
25.0
Choice Treatment Facility
7
40.5
7
33.3
Primary Care Physician/Clinician Contact Information
8
52.4
8
70.8
Volume 27, No. 6: November 2026
1657
Western Journal of Emergency Medicine
Prehospital Facial Recognition Technology Simulation Study
Misra et al. participating healthcare institution (after obtaining consent). Not all patients encountered in the field would therefore be immediately identifiable; also, facial disfigurement due to burns or other traumatic injuries, along with malfunctioning of the tablet, can limit the identification, and the potential for false negatives must be acknowledged. The technology does not imply that all individuals are inherently “in the app’s cloud database,” and its utility depends on the breadth and completeness of the enrolled population.
Figure 2. Proportion of participants agreeing with statements about the usability and clinical utility of the facial-recognition application in a study comparing paramedics’ ability to identify noncommunicative patients and make related clinical decisions when using a cloud-based facial-recognition app vs standard practice. ID, identification; ID CI, identification of contraindications,
incorporates several technical safeguards against false matches, including similarity score thresholds, return of both field and enrolled images for manual inspection, supplementary identifying images, and emergency contact information to allow independent confirmation. First responders are expected to handle information provided by this app consistent with standard patient chart access protocols. The unique aspect of using this technology is that this information is now available to first responders in an emergency. However, they are expected to handle this information in accordance with Health Insurance Portability and Accountability Act guidelines. LIMITATIONS This double-blind, randomized control study had some limitations. The study timeline was truncated because a spike in COVID-19 cases delayed its start. We asked participants to self-report patient identification and important medical information rather than have them answer in a way that could be confirmed, to reduce the likelihood of forgetting or cheating. There is a possibility that participants may have inferred group allocation based on the app’s match output, introducing potential performance bias; this risk was mitigated, although not eliminated, by blinding and physical separation of evaluators, identical tablet access and instructions in both arms, independent SP encounters, and use of an objectively scored primary outcome. Finally, the study relied on a simulation in which all SPs had their images intentionally uploaded into the facial recognition database. In real-world settings, an individual’s face would only be identifiable if they had enrolled in the system or if their image had been added through a Western Journal of Emergency Medicine
CONCLUSION This pilot study demonstrated that using facial recognition technology to manage standardized patients in a simulated EMS scenario improved patient identification, access to vital patient information, and transport decisions, and was found to be beneficial by participants. Access to such critical information (eg, allergies, medications) at the point of care can directly improve patient safety. Future studies should examine the technology’s impact on scene time, triage, and destination decisions in diverse EMS systems. Additional exploration could focus on the technology’s utility across various emergency conditions (eg, trauma and stroke), and its possible effects on resource utilization. ACKNOWLEDGMENTS We thank Giofranco Blanco, Catalina Gonzalez, Marco Gonzalez, Marco Gonzalez Jr, Thomas James, Michael Saco, Jemel Smith, Antonyo Sotolongo, and Ethan Sullivan for their roles as facilitators or evaluators. We thank Irma Cabrera, John L. Couriel, Michelle Fernandez, Marianela Gimenez, Martin Hershbein, Volga Sussman, and DJ Williams for SP support. We thank Katherine Minnich and Lauren Stern for their support with reference material. Address for Correspondence: Asit Misra, MD, MSMEd, University of Miami Miller School of Medicine, Gordon Center for Simulation & Innovation in Medical Education, P.O. Box 016960 [D-41], Miami, FL 33101. Email: asitmisra@hotmail.com. Conflicts of Interest: By the WestJEM article submission agreement, all authors are required to disclose all affiliations, funding sources and financial or management relationships that could be perceived as potential sources of bias. This study was supported by ERinfo, Inc, Miami, Florida, to purchase gift cards for study participants. There are no conflicts of interest to declare. Copyright: © 2026 Misra et al. This is an open access article distributed in accordance with the terms of the Creative Commons Attribution (CC BY 4.0) License. See: http://creativecommons.org/ licenses/by/4.0/
REFERENCES 1. Mallow PJ, Pandya B, Horblyuk R, et al. Prevalence and cost of hospital medical errors in the general and elderly United States
1658
Volume 27, No. 6: November 2026
Prehospital Facial Recognition Technology Simulation Study
Misra et al. populations. J Med Econ. 2013;16(12):1367-1378.
with a communication barrier. Ment Health Clin. 2020;10(2):64-69.
2. Escott MEA. Clinical errors: identifying and learning from mistakes in patient care. JEMS. 2017;42(5):62-63.
16. Nicolle LE. Urinary tract infection. Crit Care Clin. 2013;29(3):699-715. 17. Smyth MA, Brace-McDonnell SJ, Perkins GD. Identification of adults
3. Anderson JG, Abrahamson K. Your health care may kill you: medical
with sepsis in the prehospital environment: a systematic review. BMJ
errors. Stud Health Technol Inform. 2017;234:13-17.
Open. 2016;6(8):e011218.
4. England E, Deakin CD, Nolan JP, et al. Patient safety incidents and
18. Studnek JR, Artho MR, Garner CL Jr, et al. The impact of emergency
medication errors during a prehospital randomized controlled trial of
medical services on the ED care of severe sepsis. Am J Emerg Med.
emergency medication administration. Eur J Clin Pharmacol.
2012;30(1):51-56.
2020;76(10):1355-1362.
19. Jung K, Feldman R, Scanlon D. Where would you go for your next
5. Janowak CF, Dolejs S, Zarzaur BL. Who is John Doe? A case-match
hospitalization? J Health Econ. 2011;30(4):832-841.
analysis. Am Surg. 2017;83(8):e294-296.
20. Montmany S, Pallisera A, Rebasa P, et al. Preventable deaths and
6. Al-Kalaldeh M, Amro N, Qtait M, et al. Barriers to effective nurse-
potentially preventable deaths: What are our errors? Injury.
patient communication in the emergency department. Emerg Nurse.
2016;47(3):669-673.
2020;28(3):29-35.
21. Pelaccia T, Messman AM, Kline JA. Misdiagnosis and failure to
7. Ampamya S, Kitayimbwa JM, Were MC. Performance of an open
diagnose in emergency care: causes and empathy as a solution.
source facial recognition system for unique patient matching in a
Patient Educ Couns. 2020;103(8):1650-1656.
resource-limited setting. Int J Med Inform. 2020;141:104180.
22. Landman A, Teich JM, Pruitt P, et al. The Boston Marathon bombings
8. Gliklich RE, Dreyer NA, Leavy MB, editors. Registries for Evaluating
mass casualty incident: one emergency department’s information systems
Patient Outcomes: A User’s Guide. 4th ed. Agency for Healthcare
challenges and opportunities. Ann Emerg Med. 2015;66(1):51-59.
Research and Quality; 2021.
23. Silverstein E, Snyder M. Implementation of facial recognition with
9. Claps PJ, Berk WA. The John Doe syndrome: diagnosis and
Microsoft Kinect v2 sensor for patient verification. Med Phys.
outcome of patients unidentified at the time of emergency department admission. Am J Emerg Med. 1992;10(3):217-218.
2017;44(6):2391-2399. 24. Jeon B, Jeong B, Jee S, et al. A facial recognition mobile app for
10. Tastad K, Koh J, Goodridge, et al. Unidentified patients in the emergency
patient safety and biometric identification: design, development, and
department: a historical cohort study. CJEM. 2021;23(6):772-777.
validation. JMIR Mhealth Uhealth. 2019;7(4):e11472.
11. US Census Bureau. Apportionment Population and Number of
25. Amazon Web Services. Rekognition. Published 2024. Accessed July
Representatives by State: 2020 Census. Published 2021.
2, 2026. Available at: Amazon Rekognition.
Accessed July 2, 2026. Available at: US Census Bureau 2020
26. Carlson KJ, Klute LM, Dowdall JR, et al. Just-in-time simulation
Apportionment Data.
training for nasopharyngeal specimen collection during the SARS-
12. Janowak CF, Janowak LM. Misidentifying the unidentified—John
CoV-2 pandemic. J Contin Educ Health Prof. 2022;42(1):e88-91.
Doe and the EHR. Agency for Healthcare Research and Quality
27. Issenberg SB, McGaghie WC, Petrusa ER, et al. Features and uses
PSNet. Published 2019. Accessed July 2, 2026. Available at: AHRQ
of high-fidelity medical simulations that lead to effective learning: a
PSNet Article.
BEME systematic review. Med Teach. 2005;27(1):10-28.
13. Committee on Guidance for Establishing Crisis Standards of Care for
28. Motola I, Devine LA, Chung HS, et al. Simulation in healthcare
Use in Disaster Situations; Institute of Medicine. Crisis Standards of
education: a best evidence practical guide. AMEE Guide No. 82. Med Teach. 2013;35(10):e1511-1530.
Care: A Systems Framework for Catastrophic Disaster Response. National Academies Press; 2012.
29. Alam N, Oskam E, Stassen PM, et al. Prehospital antibiotics in the
14. Gibney B, Ryan JW, MacMahon PJ, et al. Assessment of radiopaque
ambulance for sepsis: a multicentre, open-label, randomised trial.
patient identification stickers (RAPIDS) for patient-scan correlation in a mass casualty incident. Emerg Radiol. 2020;27(3):293-301.
Lancet Respir Med. 2018;6(1):40-50. 30. Varney J, Motawea KR, Kandil OA, et al. Prehospital administration
15. Rarrick C, Hebbard A. Creation and implementation of a urinary tract infection diagnostic and treatment algorithm for psychiatric inpatients
Volume 27, No. 6: November 2026
1659
of broad-spectrum antibiotics for sepsis patients: a systematic review and meta-analysis. Health Sci Rep. 2022;5(3):e582.
Western Journal of Emergency Medicine
Original Research
English versus Non-English Language Preference and Computed Tomography Use in Pediatric Minor Head Trauma David R. Nelson, MS* Zachary T. Sheff, PhD, MPH† Alexander J. Kinstedt, MS‡ Jennifer R. Barker, MD§ Courtney A. Kelly, MD||
*Peyton Manning Children’s Hospital at Ascension St. Vincent, Pediatric Trauma Department, Indianapolis, Indiana † Eli Lilly and Company, Indianapolis, Indiana ‡ Indiana University School of Medicine-Terre Haute, Terre Haute, Indiana § Peyton Manning Children’s Hospital at Ascension St. Vincent, Department of Emergency Medicine, Indianapolis, Indiana || Children’s Hospital of Michigan, Division of Emergency Medicine, Detroit, Michigan
Section Editor: Muhammad Waseem, MD Submission history: Submitted April 7, 2026; Revision received August 1, 2026; Accepted August 3, 2026 Electronically published October 26, 2026 Full text available through open access at http://escholarship.org/uc/uciem_westjem DOI 10.5811/westjem.64410
Introduction: Whether the use of computed tomography (CT) in pediatric minor head trauma varies by documented language preference (English vs non-English), independent of race, is not well understood. Our objective was to identify factors associated with head CT use among children with minor head trauma in an institutional Pediatric Emergency Care Applied Research Network (PECARN)-based pathway. Methods: This single-center retrospective cohort study included patients 2 to 14 years of age presenting with minor head trauma, January 2019 to June 2022, who were classified as low, intermediate, or high risk using PECARN criteria. Our primary outcome measure was a threelevel clinical pathway: no CT and no traumatic brain injury (TBI); clinical TBI without CT; or CT performed. Secondary outcomes were CT positivity and short-term clinical outcomes. Multinomial logistic regression assessed associations between pathway and language preference, age, headache, weighted observed symptom score (OSS), and race (White vs non-White). Results: Among 1,167 patients, 319 (27.3%) underwent CT, 132 (11.3%) had clinical TBI diagnosis without CT, and 716 (61.4%) had neither; 430 (36.8%) were classified intermediate risk—the subgroup in which the imaging decision is most discretionary. Non-English language preference was associated with lower adjusted odds of CT in the intermediate-risk subgroup (adjusted odds ratio [aOR], 0.48; 95% CI, 0.24-0.92; P = .03) but not in the full cohort (aOR, 0.78; 95% CI, 0.50-1.22; P = .27). Within the intermediate-risk subgroup, OSS was strongly associated with CT use (aOR, 3.65; 95% CI, 2.67-5.00; P < .001) and headache with clinical TBI without CT (aOR, 4.94; 95% CI, 1.64-14.90; P = .005), whereas race was not independently associated with CT use (aOR, 1.36; 95% CI, 0.82-2.25; P = .48). Language preference was not associated with CT positivity among scanned patients (aOR, 1.10; 95% CI, 0.44-2.72; P = .84), and short-term outcomes did not differ by language (all P > .35). Conclusion: Documented non-English language preference was independently associated with lower use of head CT in PECARN intermediate-risk children; race was not after adjustment for clinical severity. Yield and short-term outcomes did not differ by language preference among imaged patients; however, imaging selection precludes conclusions about mechanism. [West J Emerg Med. 2026;27(6)1660–1670.]
Western Journal of Emergency Medicine
1660
Volume 27, No. 6: November 2026
Nelson et al.
English vs. Non-English Preference and CT Use in Pediatric Minor Head Trauma
INTRODUCTION Head computed tomography (CT) is the standard diagnostic tool for pediatric minor head trauma and a leading source of ionizing radiation exposure in children; however, whether its use is distributed equitably across patients of different races and non-English-speaking status (English versus non-English primary language at registration) remains poorly understood.1-5 These radiation risks, along with concerns about cost and the potential need for sedation in younger patients, have driven substantial scrutiny of CT overuse.6-10 The Pediatric Emergency Care Applied Research Network (PECARN) prediction rule stratifies patients into high-risk (CT recommended), intermediate-risk (observation versus CT appropriate), and low-risk (CT not recommended) categories, and has been extensively validated across multiple countries.11-16 Implementations of PECARN-based pathways have reduced CT use by 20% to 45% without increasing missed traumatic brain injury (TBI) or clinically important TBI (ciTBI).17-21 Despite this, the intermediate-risk category—where the decision to image or observe is left to clinical judgment informed by physician experience, symptom severity, worsening during observation, and parental preference—remains a locus of substantial practice variation.22,23 Prior studies have identified racial and ethnic differences in cranial CT use for pediatric head trauma, with White children generally more likely to receive imaging, particularly at lower risk levels.24-26 Similar disparities have been reported in pediatric ED imaging broadly27 and in concussion diagnosis and evaluation.28,29 However, none of these studies examined documented non-English language preference as a factor independently associated with imaging decisions. A growing body of evidence has linked limited English proficiency (LEP) to poorer communication quality, lower caregiver trust, and worse process measures in pediatric EDs, including higher revisit rates and delays in care.30-33 Prior work has shown that language barrier—rather than race or ethnicity—was the greatest driver of disparities in a pediatric ED, with Spanishspeaking families receiving fewer interventions including imaging.34 The intermediate-risk imaging decision is particularly communication-dependent, relying on caregiverreported symptom evolution and parental preference, raising the possibility that language barriers may specifically affect this decision in ways not captured by prior racial disparity analyses. Our objective was to identify clinical and demographic factors associated with the use of head CT in pediatric patients 2 to 14 years of age presenting with minor head trauma to a single pediatric emergency department (ED), with a specific focus on whether documented non-English language preference was independently associated with the imaging decision after adjustment for clinical severity. We used a multinomial outcome framework distinguishing three clinical pathways (no CT/no TBI; clinical TBI without CT; CT performed) to assess associations with baseline clinical and demographic variables. Volume 27, No. 6: November 2026
Population Health Research Capsule What do we already know about this issue? Prior pediatric head computed tomography (CT) studies use binary CT/no-CT outcomes; language-associated differences are understudied. What was the research question? Do English vs non-English language preference and race predict CT, clinical traumatic brain injury (TBI) without CT, or neither? What was the major finding of the study? Intermediate-risk children: non-English preference had lower CT odds (aOR, 0.48; 95% CI, 0.24-0.92; P = .03). How does this improve population health? This study identifies language-associated variation in discretionary CT use, motivating prospective evaluation of communication supports.
METHODS Study Design and Setting This was a retrospective observational study of pediatric patients presenting to a single tertiary care pediatric ED with minor head trauma between January 1, 2019 and June 30, 2022. The institution received Level I pediatric trauma center accreditation in September 2021. The cohort was originally assembled to evaluate CT use surrounding this transition; because the pre- and post-comparison showed no difference in overall CT use, the present analysis examines clinical-pathway variation within the full predefined cohort. Patient-level data were retrospectively abstracted from the electronic health record and managed using Research Electronic Data Capture.³⁵,³⁶ This study adhered to the methodologic standards for emergency medicine medical record review research described by Worster and colleagues³⁷—including abstractor training, case selection criteria, variable definition, abstraction form structure, performance monitoring, blinding to hypothesis, medical record identification, sampling method, missing-data management, and institutional review board approval (Supplemental Methods). Study Population All patients 2 to 14 years of age who presented to the ED with a primary ICD-10 diagnosis code corresponding to minor head trauma were eligible for inclusion (Supplemental Table
1661
Western Journal of Emergency Medicine
English vs. Non-English Preference and CT Use in Pediatric Minor Head Trauma 1). The upper age limit of 14 years reflects the institution’s operational definition of the pediatric trauma population during the study period; patients aged 15 years and older who presented with trauma were evaluated in the adult ED and therefore were outside the sampling frame for this pediatric ED cohort. The qualifying ICD-10 codes align with the Centers for Medicare and Medicaid Services Merit-based Incentive Payment System Clinical Quality Measure for ED CT use in minor blunt head trauma (Quality ID 416).38 Patients were excluded if they had a pre-existing ventriculoperitoneal shunt, a history of brain tumor or coagulopathy, a chief complaint unrelated to minor head trauma, or had undergone head CT at an outside facility. Risk Classification Each patient was classified into one of three risk categories for ciTBI —high risk (CT recommended), intermediate risk (observation or CT appropriate), or low risk (CT not recommended)—using criteria from the PECARN prediction rule for children 2 years of age or older (Supplemental Figure 1).11 The intermediate-risk category, in which the imaging decision is left to clinical judgment informed by physician experience, symptom severity, worsening during observation, and parental preference, was the primary analytic focus because it represents the population for whom practice variation and communication-dependent factors are most likely to influence the CT decision. Variables The primary outcome was clinical pathway, a three-level variable: (1) no CT and no TBI diagnosis (reference); (2) TBI diagnosed without CT; or (3) CT performed. Independent variables of interest were race (White, Black, Asian, multiracial, other) and language preference (English versus non-English). Covariates included age, sex, Hispanic ethnicity, PECARN risk category, mechanism of injury, and individual PECARN clinical signs (headache, hematoma, emesis, loss of consciousness, severe mechanism of injury). Detailed variable definitions, including the rationale for the three-level outcome, are provided in Supplemental Methods. Statistical Analysis We calculated descriptive statistics for the full cohort and stratified them by PECARN risk category and CT receipt. Continuous variables are reported as means with standard deviations and medians; categorical variables as frequencies with percentages. Group comparisons used Wilcoxon ranksum, chi-square, or Fisher exact tests, as appropriate. To identify factors associated with clinical pathway, multinomial logistic regression was employed with the three-level outcome in the full cohort and among intermediaterisk patients, with the no-CT/no-TBI-diagnosis group as the reference category. To reduce multicollinearity and multiplicity, variable selection used a variance preservation Western Journal of Emergency Medicine
Nelson et al.
approach39 to identify the most informative variables, and patients were randomly assigned to two-thirds model-building and one-third model-validation subsets stratified by CT use and TBI diagnosis (further details in Supplemental Statistical Methods). Variables significant in both the building subset (two-tailed P < .05) and the validation subset (one-tailed P < .05) were retained in the final model. Four objective clinical signs were combined into a weighted observed symptom score (OSS = 2 × emesis + 2 × loss of consciousness + hematoma + severe mechanism of injury; range 0–6) to summarize observable severity independent of verbal report; OSS derivation and internal validation are detailed in Supplemental Statistical Methods. Race was modeled as a binary variable (White versus non-White) to ensure adequate cell sizes in all contrasts; a sensitivity analysis using a multilevel race specification produced consistent findings but yielded unstable estimates in the smallest race categories due to sparse cells. The Cochran-Mantel-Haenszel test assessed the overall association between language preference and binary CT receipt stratified by symptom severity. Results are reported as adjusted odds ratios (aOR) with 95% CIs. We performed two hypothesis-generating exploratory analyses to describe patterns that might inform possible explanations for the observed association between language preference and CT use; methods are detailed in Supplemental Statistical Methods. Statistical inference for the primary research question is based solely on the multinomial regression. Two-tailed P < .05 was used for hypothesis testing. Analyses were performed using Altair Analytics Workbench (Altair Engineering Inc). RESULTS Study Population and Patient Outcomes Of 1,348 patients identified, 1,167 met inclusion criteria (Supplemental Figure 2). The 181 excluded were primarily for a chief complaint unrelated to minor head trauma (n = 121), outside-hospital CT (n = 36), brain tumor or coagulopathy history (n = 19), or ventriculoperitoneal shunt (n = 5). Across the full cohort, 643 patients (55.1%) were classified as low risk, 430 (36.8%) as intermediate risk, and 94 (8.1%) as high risk (Figure 1). Use of CT did not differ significantly between the pre-accreditation period (January 2019 to September 2021; 27.2%) and the post-accreditation period (October 2021 to June 2022; 27.9%; P = .81), and the full cohort was analyzed as a single group. Among the three pathway groups, 716 patients (61.4%) had neither CT nor clinical TBI diagnosis, 132 (11.3%) had a clinical TBI diagnosis without CT, and 319 (27.3%) underwent CT, of whom 167 (52.4%) had TBI identified. Overall, 299 (25.6%) received a TBI diagnosis, 132 (44.1%) without CT. Factors Associated with Computed Tomography Utilization: Full Cohort Table 1 summarizes demographic and clinical
1662
Volume 27, No. 6: November 2026
Nelson et al.
English vs. Non-English Preference and CT Use in Pediatric Minor Head Trauma acuity—emesis, loss of consciousness, hematoma, and severe mechanism of injury—were each significantly more common among CT recipients (Table 2). Patients who underwent CT also had a higher mean OSS than nonrecipients (1.68 vs 0.57; P < .001). Two reversals from the full-cohort pattern emerged: CT recipients were younger than nonrecipients (7.56 vs 8.50 years; P = .01), and headache was more common in the no-CT group (82.0% vs 67.2%; P < .001). Demographic differences were more pronounced than in the full cohort. Patients who underwent CT more often had English language preference (86.7% vs 76.0%; P = .006), more often were White (65.0% vs 51.2%; P = .004), and less often Black (25.6% vs 41.6%; P < .001); Hispanic ethnicity and sex did not differ (P ≥ .11; Table 2). Clinical TBI diagnosis, inpatient admission, and outpatient length of stay were each higher among CT recipients; unplanned readmission did not differ (Table 2).
Figure 1. Clinical pathway distribution among 1,167 pediatric patients with minor head trauma at a single pediatric emergency department, 2019–2022. Patients are stratified by Pediatric Emergency Care Applied Research Network risk category (green, low; yellow, intermediate; red, high) and across three clinical pathways. CT, computed tomography; N/A, zero events observed; TBI, traumatic brain injury.
characteristics of the full cohort stratified by CT receipt. Patients who underwent CT were older (mean age 7.45 vs 6.63 years; P = .003), more often White (64.3% vs 54.5%; P = .003), and less often Black (27.3% vs 35.7%; P = .006). Language preference, Hispanic ethnicity, and sex did not differ by CT status (all P ≥ .08; Table 1). Markers of clinical acuity were more common among CT recipients, including high PECARN risk, emesis, loss of consciousness, severe mechanism of injury, headache, and hematoma (all P ≤ .002; Table 1), and CT recipients had a higher mean OSS (1.26 vs 0.22; P < .001). Hematoma was associated with CT receipt despite not appearing in PECARN intermediate-risk criteria for children 2 years of age or older, consistent with prior reports.40-42 Clinical TBI diagnosis at the index visit was more common among CT recipients (52.4% vs 15.6%; P < .001), as were inpatient admission (5.6% vs 0.6%; P < .001) and longer outpatient length of stay (P < .001; Table 1). Unplanned readmission did not differ between groups (P > .99). Patient Characteristics Stratified by Computed Tomography Receipt: Intermediate-Risk Subgroup Table 2 summarizes characteristics of the 430 patients in the intermediate-risk subgroup. Overall, 180 patients (41.9%) underwent head CT. As in the full cohort, markers of clinical Volume 27, No. 6: November 2026
Multinomial Regression Results The primary multinomial regression model included OSS, headache, language preference, and age (Figure 2). In both the full cohort and the intermediate-risk subgroup, OSS was strongly associated with CT use (full cohort aOR, 3.67; 95% CI, 3.00-4.50; intermediate-risk aOR, 3.65; 95% CI, 2.675.00; both P < .001). The OSS was also associated with the clinical TBI diagnosis pathway in the full cohort (aOR, 1.39; 95% CI, 1.04-1.87; P = .03) but not in the intermediate-risk subgroup (aOR, 1.15; 95% CI, 0.78-1.70; P = .47). Headache showed a distinct pattern. In both cohorts, headache was strongly associated with the clinical TBI diagnosis pathway (full cohort aOR, 6.95; 95% CI, 4.4510.86; P < .001; intermediate-risk aOR, 4.94; 95% CI, 1.64-14.90; P = .005) and with CT use, although with smaller effect sizes (full cohort aOR, 2.88; 95% CI, 1.98-4.19; P < .001; intermediate-risk aOR, 2.69; 95% CI, 1.39-5.22; P = .003). Among scanned patients, headache was associated with CT positivity in the full cohort (aOR, 2.88; 95% CI, 1.75-4.74; P < .001). Language preference (English vs non-English) was independently associated with CT use in the intermediate-risk subgroup. After adjustment for OSS, headache, and age, patients with documented non-English language preference had lower odds of CT than those with English preference (aOR, 0.48; 95% CI, 0.24-0.92; P = .03), an association not observed in the full cohort (aOR, 0.78; 95% CI, 0.50-1.22; P = .27). Language preference was not associated with CT positivity in either the full cohort (aOR, 1.03; 95% CI, 0.63-1.70; P = .93) or the intermediate-risk subgroup (aOR, 1.10; 95% CI, 0.44-2.72; P = .84). Race (White vs nonWhite)—included as a candidate variable in screening but not retained—was added post hoc to the intermediate-risk regression and was not independently associated with clinical pathway (aOR, 1.36; 95% CI, 0.82-2.25; P = .48); the language association was unchanged.
1663
Western Journal of Emergency Medicine
English vs. Non-English Preference and CT Use in Pediatric Minor Head Trauma
Nelson et al.
Table 1. Demographics, clinical features, and outcomes by head computed tomography receipt in pediatric patients 2 to 14 years of age with minor head trauma. Variable
Overall (N = 1,167)
CT (n = 319)
No CT (n = 848)
P value
Age, years
6.86 (3.83) [6.00]
7.45 (4.02) [7.00]
6.63 (3.73) [6.00]
.003
Sex: female
460 (39.4)
139 (43.6)
321 (37.9)
.08
White
667 (57.2)
205 (64.3)
462 (54.5)
.003
Black
390 (33.4)
87 (27.3)
303 (35.7)
.006
Asian
15 (1.3)
5 (1.6)
10 (1.2)
.60
Multiracial
54 (4.6)
11 (3.4)
43 (5.1)
.24
Demographics
Race
Other/unknown
41 (3.5)
11 (3.4)
30 (3.5)
.94
Hispanic ethnicity
149 (13.3)
40 (13.0)
109 (13.4)
.84
English language preference
948 (81.2)
257 (80.6)
691 (81.5)
.72
PECARN risk category Low risk
643 (55.1)
68 (21.3)
575 (67.8)
< .001
Intermediate risk
430 (36.8)
180 (56.4)
250 (29.5)
< .001
High risk
94 (8.1)
71 (22.3)
23 (2.7)
< .001
376 (32.2)
158 (49.5)
218 (25.7)
< .001
Clinical signs Headache Hematoma
83 (7.1)
35 (11.0)
48 (5.7)
.002
Emesis
122 (10.5)
92 (28.8)
30 (3.5)
< .001
Loss of consciousness
87 (7.5)
66 (20.7)
21 (2.5)
< .001
Severe mechanism of injury
84 (7.2)
51 (16.0)
33 (3.9)
< .001
0.50 (0.92) [0.00]
1.26 (1.21) [1.00]
0.22 (0.56) [0.00]
< .001
Fall
682 (58.4)
203 (63.6)
479 (56.5)
.03
MVC
80 (6.9)
24 (7.5)
56 (6.6)
.58
Assault
26 (2.2)
13 (4.1)
13 (1.5)
.009
Pedestrian struck
4 (0.3)
2 (0.6)
2 (0.2)
.30
Bicycle fall
23 (2.0)
7 (2.2)
16 (1.9)
.74
Other
352 (30.2)
70 (21.9)
282 (33.3)
< .001
OSS Mechanism of injury
Outcomes Admitted as inpatient
23 (2.0)
18 (5.6)
5 (0.6)
< .001
TBI at initial visit
299 (25.6)
167 (52.4)
132 (15.6)
< .001
Unplanned readmission
12 (1.0)
3 (0.9)
9 (1.1)
> .99
3.45 (5.54) [2.55]
5.16 (6.97) [3.65]
2.84 (4.78) [2.32]
< .001
Outpatient LOS, hours (n = 1,144)
Inpatient LOS, days (n = 23) 3.84 (6.91) [1.00] 4.62 (7.66) [1.00] 1.03 (0.82) [0.75] .20 Continuous variables reported as mean (SD) [median]; categorical variables as n (%). CT, computed tomography; LOS, length of stay; MVC, motor vehicle collision; OSS, observed symptom score (2 × emesis + 2 × loss of consciousness + hematoma + severe mechanism of injury); PECARN, Pediatric Emergency Care Applied Research Network; TBI, traumatic brain injury.
Clinical Pathway Differences by Language and Symptom Severity The following two sections report exploratory hypothesisgenerating analyses; statistical inference for the primary research question is based solely on the multinomial Western Journal of Emergency Medicine
regression above. Figure 3 plots observed versus expected clinical pathway proportions for intermediate-risk patients with documented non-English language preference (expected values derived from a model fit to English-preference patients) across OSS
1664
Volume 27, No. 6: November 2026
English vs. Non-English Preference and CT Use in Pediatric Minor Head Trauma
Nelson et al.
Table 2. Demographics, clinical features, and outcomes by head computed tomography receipt in PECARN intermediate-risk pediatric patients. Variable
Overall (N = 430)
CT (n = 180)
No CT (n = 250)
P value
Age, years
8.10 (3.87) [8.00]
7.56 (4.08) [7.00]
8.50 (3.66) [8.00]
.01
Sex: female
193 (44.9)
89 (49.4)
104 (41.6)
.11
White
245 (57.0)
117 (65.0)
128 (51.2)
.004
Black
150 (34.9)
46 (25.6)
104 (41.6)
< .001
Asian
6 (1.4)
4 (2.2)
2 (0.8)
.24
Multiracial
11 (2.6)
5 (2.8)
6 (2.4)
.81
Other/unknown
18 (4.2)
8 (4.4)
10 (4.0)
.82
Hispanic ethnicity
41 (9.9)
18 (10.3)
23 (9.6)
.82
English language preference
346 (80.5)
156 (86.7)
190 (76.0)
.006
Headache
326 (75.8)
121 (67.2)
205 (82.0)
< .001
Hematoma
37 (8.6)
23 (12.8)
14 (5.6)
.009
Emesis
106 (24.7)
77 (42.8)
29 (11.6)
< .001
Loss of consciousness
64 (14.9)
45 (25.0)
19 (7.6)
< .001
Severe mechanism of injury
68 (15.8)
36 (20.0)
32 (12.8)
.04
1.03 (1.11) [1.00]
1.68 (1.10) [2.00]
0.57 (0.84) [0.00]
< .001
Fall
233 (54.2)
117 (65.0)
116 (46.4)
< .001
MVC
40 (9.3)
10 (5.6)
30 (12.0)
.02
Assault
13 (3.0)
8 (4.4)
5 (2.0)
.14
Pedestrian struck
4 (0.9)
2 (1.1)
2 (0.8)
> .99
Bicycle fall
7 (1.6)
3 (1.7)
4 (1.6)
> .99
133 (30.9)
40 (22.2)
93 (37.2)
< .001
Demographics
Race
Clinical signs
OSS Mechanism of injury
Other Outcomes Admitted as inpatient TBI at initial visit Unplanned readmission Outpatient LOS, hours (n = 422)
8 (1.9)
7 (3.9)
1 (0.4)
.01
194 (45.1)
106 (58.9)
88 (35.2)
< .001
7 (1.6)
2 (1.1)
5 (2.0)
.70
3.57 (4.25) [2.62]
4.79 (5.65) [3.63]
2.72 (2.62) [2.23]
< .001
Inpatient LOS, days (n = 8) 6.33 (10.39) [1.53] 6.94 (11.07) [1.00] 2.07 (NA) [2.07] > .99 Continuous variables reported as mean (SD) [median]; categorical variables as n (%). CT, computed tomography; LOS, length of stay; MVC, motor vehicle collision; OSS, observed symptom score (2 × emesis + 2 × loss of consciousness + hematoma + severe mechanism of injury); TBI, traumatic brain injury.
levels. At OSS = 0, these patients had a higher observed probability of clinical TBI diagnosis (42.9% vs 27.1% expected) and lower probability of CT (11.9% vs 19.4% expected), although the distribution did not differ significantly (P = .20; n = 198). At OSS = 2, distributions differed significantly (P = .02; n = 139); CT was performed in 44.0% vs 71.9% of English-preference patients (P = .007). Across strata, the Cochran-Mantel-Haenszel test confirmed an overall association between language preference and CT receipt (common OR, 2.10; 95% CI, 1.17-3.78; P = .01; Breslow-Day Volume 27, No. 6: November 2026
P = .46). These findings should be interpreted cautiously given small subgroup sizes (n = 42 at OSS = 0; n = 25 at OSS = 2; n = 4 at OSS ≥ 3). Exploratory Classification Tree Analysis An exploratory classification tree of intermediate-risk patients is provided in Supplemental Figure 3. The OSS was the most influential feature, and the tree showed lower CT use among patients with documented non-English language preference in selected judgment-dependent branches; however, small terminal-
1665
Western Journal of Emergency Medicine
English vs. Non-English Preference and CT Use in Pediatric Minor Head Trauma
Figure 2. Adjusted odds ratios for multivariable factors associated with clinical pathway among pediatric patients with minor head trauma at a single pediatric emergency department, 2019–2022. Left and center panels show multinomial logistic regression with a 3-level outcome (reference: no CT and no TBI diagnosis); right panel shows binary logistic regression of CT positivity among scanned patients. Upper row: full cohort (N = 1,167); lower row: intermediate-risk subgroup (N = 430). Symbol fill and shape indicate significance level as shown in the figure key; diamond markers denote the language preference variable. CT, computed tomography; OSS, observed symptom score (2 × emesis + 2 × loss of consciousness + hematoma + severe mechanism of injury); TBI, traumatic brain injury.
node sample sizes preclude confirmatory inference. Clinical Outcomes by Language Clinical outcomes did not differ significantly by language preference. In the intermediate-risk subgroup, inpatient admission occurred in 0 of 84 patients with documented non-English language preference and 8 of 346 with English preference (2.3%; P = .37); unplanned readmission in 1.2% vs 1.7% (P > .99); and readmission with a new TBI diagnosis in 1.2% vs 0.6% (P = .48). Findings were similar in the full cohort: no significant language-based differences in inpatient admission (1.9% vs 2.0%; P > .99), unplanned readmission (0.5% vs 1.2%; P = .71), or newly identified TBI on readmission (0.5% vs 0.2%; P = .46); overall, newly identified TBI on readmission was rare (3 of 1,167; 0.3%). No measurable differences in short-term clinical outcomes by language preference were identified. DISCUSSION In this study of the use of head CT in pediatric minor head trauma using a multinomial outcome framework distinguishing three clinical pathways, the OSS was strongly associated with CT use, headache was strongly associated with clinical TBI diagnosis without imaging, and documented non-English language preference was independently associated with CT use within the intermediate-risk subgroup—where clinical judgment likely plays the greatest role. Intermediate-risk patients with documented non-English Western Journal of Emergency Medicine
Nelson et al.
Figure 3. Model-based pathway probability comparisons by observed symptom score (OSS) among intermediate-risk patients with minor head trauma at a single pediatric emergency department, 2019–2022. Blue curves show expected pathway probabilities from a multinomial logistic regression model fit to English-speaking intermediate-risk patients (n = 346), evaluated at the covariate profile of non-English-speaking patients. Orange diamonds show observed pathway proportions for non-Englishspeaking patients (n = 84) with 95% CIs. Percentage-point annotations indicate the difference between observed non-English proportions and English-speaker expected values at each OSS level. CT, computed tomography; OSS, observed symptom score (2 × emesis + 2 × loss of consciousness + hematoma + severe mechanism of injury); TBI, traumatic brain injury.
language preference had approximately half the odds of receiving CT after adjustment for clinical severity, whereas race was not independently associated with clinical pathway after the same adjustment. Language preference was not associated with CT positivity (yield) among imaged patients. Because this was a single-center retrospective study and positivity was assessed only among patients selected for imaging, this finding cannot establish the mechanism underlying the observed association with CT use or exclude missed injury among children who did not undergo CT. Comparison to Previous Studies Prior work has documented racial and ethnic differences in cranial CT use for pediatric head trauma, with White children generally more likely to receive imaging at lower risk levels.24-26 Our unadjusted findings were consistent with these reports. However, after adjustment for measured clinical severity, race was not independently associated with clinical pathway, whereas documented non-English language preference was associated with lower adjusted odds of CT use in the intermediate-risk subgroup. Because race, language preference, clinical presentation, communication, and clinician decisionmaking cannot be fully disentangled in this retrospective study, this pattern should be interpreted cautiously. Earlier PECARN work found lower CT use among Black non-Hispanic and Hispanic children in intermediate- and lowest-risk groups, whereas a more recent multicenter prospective analysis found no adjusted differences in head CT use by Hispanic ethnicity, Asian race, or Black race among children aged 2 years and older.24,26 In the more recent study,
1666
Volume 27, No. 6: November 2026
Nelson et al.
English vs. Non-English Preference and CT Use in Pediatric Minor Head Trauma
lower head CT use among Hispanic children younger than 2 years may reflect disparities in imaging practices.26 Our results extend the examination of imaging variation to documented language preference among intermediate-risk children aged 2 to 14 years—the subgroup in which the PECARN rule permits either observation or CT based on clinical judgment. Among imaged patients, CT positivity did not differ by language preference. However, because CT positivity was assessed only among children selected for imaging, this single-center retrospective analysis cannot determine whether the lower CT-use association reflected appropriate avoidance of imaging, under-imaging, or unmeasured differences in clinical presentation, communication, or clinician decisionmaking. Prior pediatric ED research has reported differences in caregiver trust and rates of measured interventions by language group, suggesting that language-related factors may contribute to variation in care processes.34 Communication as a Hypothesized Mechanism The PECARN intermediate-risk decision explicitly depends on four factors: physician experience, symptom number and nature, worsening during observation, and parental preference.11 Three of these four rely substantially on verbal communication. A systematic review of pediatric concussion diagnosis found that the most diagnostically specific symptoms—mental fog, noise sensitivity, and nausea—require verbal elicitation rather than direct observation, suggesting that communication barriers may selectively reduce the clinical information available to distinguish between observation and imaging.43 When communication is limited, clinicians may rely more heavily on directly observed findings and less on symptom evolution or caregiver-reported concerns—consistent with patients with documented non-English language preference at low symptom burden showing higher clinical TBI diagnosis rates and lower CT rates than expected under English-preference decision patterns (Figure 3). The finding that the language association emerged specifically in the intermediate-risk subgroup—where verbal input may shape the imaging decision more strongly—and was absent in the full cohort is consistent with this hypothesized mechanism. Prior pediatric ED research documents that interpretation during LEP encounters is often intermittent.44-46 These considerations provide a possible explanation for the observed association; however, the present retrospective data did not measure communication quality, interpreter use, caregiver preference, symptom evolution, or clinicians’ contemporaneous rationale for observation versus CT. Therefore, this mechanism cannot be evaluated directly in this study. Strengths The multinomial outcome framework revealed that a binary CT/no-CT approach conflates two clinically distinct non-CT pathways with different demographic profiles—a distinction not examined in prior PECARN literature.12-21 The Volume 27, No. 6: November 2026
OSS provided a graded measure of objective clinical severity that was more closely associated with CT use than an unweighted symptom count, extending the observation of Bressan and colleagues that PECARN intermediate-risk criteria themselves were not associated with CT decisions.22 The multinomial framework distinguished the decision to image from CT yield among those imaged; yield did not differ by language preference. Because imaging was selectively obtained, this analysis cannot establish the mechanism underlying the observed association between language preference and CT use. Implications for Practice and Research If prospective studies confirm that communication-related factors contribute to language-associated variation in CT use, interventions that improve interpreter access beyond initial assessment could be evaluated as a strategy to promote equitable and informed observation versus CT decisionmaking. Exploratory findings suggest this gap may be most consequential among patients with higher objective severity (OSS ≥ 2), where patients with documented non-English language preference had the highest CT-positive yield despite lower CT use—a pattern that warrants particular attention in interpreter access interventions. Structured reassessment protocols prompting interpreter use at defined intervals during observation could help standardize the information available to clinicians regardless of patient language. Hematoma was independently associated with CT receipt despite not appearing in PECARN intermediate-risk criteria for children 2 years of age and older, consistent with prior reports,40-42 and may warrant consideration in future guideline refinement. Future studies should prospectively document interpreter use at each stage of the ED visit—initial assessment, observation, reassessment, and discharge—to directly test the communication mechanism hypothesized here, ideally in multicenter cohorts with larger non-English-languagepreference populations and greater linguistic diversity. Additional unmeasured variables include specific language spoken, caregiver health literacy, and physician-level factors such as experience, training level, and language concordance. Clinician workforce composition—including the proportion of attending physicians versus residents, physician assistants, and nurse practitioners—may independently be associated with CT use and the rate of clinical TBI diagnosis without imaging and should be characterized in future multicenter work. LIMITATIONS This study has several limitations. Most importantly, this was a single-center retrospective study; the association observed may not be generalizable to other institutions, patient populations, interpreter service models, or practice environments and should not be interpreted as evidence of a generalized disparity in imaging practice. The finding is best understood as hypothesis-generating and requires confirmation
1667
Western Journal of Emergency Medicine
English vs. Non-English Preference and CT Use in Pediatric Minor Head Trauma in multicenter prospective studies before inferences about practice elsewhere are warranted. The non-English languagepreference group was modest (n = 84 in the intermediate-risk subgroup), limiting statistical power for stratified analyses and the precision of within-leaf comparisons in the exploratory classification tree analysis. The documented languagepreference variable classified patients as English or nonEnglish but did not capture the specific language spoken, degree of English proficiency, interpreter use during the encounter, or communication nuances during observation. The three most communication-dependent factors in the PECARN intermediate-risk framework—worsening symptoms during observation, parental preference, and physician experience—were not available in the abstracted dataset and could not be examined directly. The abstracted dataset also did not systematically capture clinicians’ contemporaneous rationale for choosing observation versus CT; therefore, this study cannot determine how individual decision-making processes contributed to the observed imaging patterns. Whether hematoma—independently associated with CT receipt despite not appearing in PECARN intermediate-risk criteria— influences the CT decision through its effect on parental concern or clinician assessment of worsening remains unmeasured and warrants prospective evaluation. Clinical signs were abstracted as documented in the electronic health record and may not fully reflect information available to the treating physician at the time of the CT decision. Positivity was assessed only among patients selected for imaging and therefore cannot determine whether the lower CT-use association reflected appropriate avoidance of imaging, under-imaging, or missed injury among children who were not imaged. Inter-rater reliability of chart abstraction was not formally tested, although abstractors were trained on operational definitions and abstractor performance was monitored periodically by the research scientist and principal investigator. Although no differences in adverse outcomes by language preference were identified, the study was not powered to detect rare events such as missed ciTBI, and outcomes may have been underestimated if patients sought follow-up outside the health system.
associational and hypothesis-generating. The documented signs may not fully capture all information available to the treating clinician at the time of the imaging decision. Accordingly, the findings do not establish that language preference caused differences in imaging use and should not be interpreted as evidence that a similar association is present across other institutions or practice settings. The study also cannot determine the mechanism underlying the observed CT-use association. If confirmed in prospective, multicenter data, interventions to improve interpreter availability throughout the ED observation period would warrant evaluation as a strategy to address this potential disparity. ACKNOWLEDGMENTS The authors thank the students who contributed to chart abstraction. This research received no external funding. The authors declare no conflicts of interest.
Address for Correspondence: David R. Nelson, MS, Peyton Manning Children’s Hospital at Ascension St. Vincent, Pediatric Trauma Department, 2001 W 86th St, Indianapolis, IN 46260. Email: david.nelson1@ascension.org. Conflicts of Interest: By the WestJEM article submission agreement, all authors are required to disclose all affiliations, funding sources and financial or management relationships that could be perceived as potential sources of bias. No author has professional or financial relationships with any companies that are relevant to this study. There are no conflicts of interest or sources of funding to declare. Copyright: © 2026 Nelson et al. This is an open access article distributed in accordance with the terms of the Creative Commons Attribution (CC BY 4.0) License. See: http://creativecommons.org/ licenses/by/4.0/
REFERENCES
CONCLUSION In this single-institution cohort of pediatric patients with minor head trauma, documented non-English language preference was independently associated with the use of head CT among intermediate-risk patients after adjustment for clinical severity, while race was not. Patients with documented non-English language preference had approximately half the adjusted odds of receiving CT in the intermediate-risk subgroup, where PECARN permits observation or CT based on clinical judgment. Positivity and short-term clinical outcomes did not differ by language preference. Because this was a singlecenter retrospective analysis and clinical signs were abstracted from electronic health record documentation, the findings are Western Journal of Emergency Medicine
Nelson et al.
1668
1. Marin JR, Weaver MD, Yealy DM, et al. Trends in visits for traumatic brain injury to emergency departments in the United States. JAMA. 2014;311(18):1917–1919. 2. Linet MS, Kim KP, Rajaraman P. Children’s exposure to diagnostic medical radiation and cancer risk. Pediatr Radiol. 2009;39(S1):S4–S26. 3. Mathews JD, Forsythe AV, Brady Z, et al. Cancer risk in 680,000 people exposed to computed tomography scans in childhood or adolescence. BMJ. 2013;346:f2360. 4. Miglioretti DL, Johnson E, Williams A, et al. The use of computed tomography in pediatrics and the associated radiation exposure and estimated cancer risk. JAMA Pediatr. 2013;167(8):700–707. 5. Pearce MS, Salotti JA, Little MP, et al. Radiation exposure from CT scans in childhood and subsequent risk of leukaemia and brain tumours. Lancet. 2012;380(9840):499–505. 6. Barton K, Nickerson JP, Higgins T, et al. Pediatric anesthesia and neurotoxicity. Pediatr Radiol. 2018;48(1):31–36.
Volume 27, No. 6: November 2026
Nelson et al.
English vs. Non-English Preference and CT Use in Pediatric Minor Head Trauma
7. Disma N, O’Leary JD, Loepke AW, et al. Anesthesia and the
24. Natale JE, Joseph JG, Rogers AJ, et al. Cranial computed
developing brain. Paediatr Anaesth. 2018;28(9):758–763.
tomography use among children with minor blunt head trauma:
8. Ohana O, Soffer S, Zimlichman E, et al. Overuse of CT and MRI in
association with race/ethnicity. Arch Pediatr Adolesc Med.
paediatric emergency departments. Br J Radiol.
2012;166(8):732–737.
2018;91(1085):20170434.
25. Burstein B, Upton J, Terra H, et al. Use of CT for head trauma:
9. Klang E, Beytelman A, Greenberg D, et al. Overuse of head CT
2007-2015. Pediatrics. 2018;142:e20180814.
examinations for the investigation of minor head trauma. J Am Coll
26. Atigapramoj N, McCarten-Gibbs K, Ugalde I, et al. Perceived race
Radiol. 2017;14(2):171–176.
and ethnicity on CT use in children with minor head or abdominal
10. Melnick ER, Szlezak CM, Bentley SK, et al. CT overuse for mild
trauma. Pediatrics. 2026;157(2):e2024070582.
traumatic brain injury. Jt Comm J Qual Patient Saf.
27. Marin J, Rodean J, Hall M, et al. Racial and ethnic differences in
2012;38(11):483–489.
emergency department diagnostic imaging at US children’s hospitals,
11. Kuppermann N, Holmes JF, Dayan PS, et al. Identification of children at very low risk of clinically-important brain injuries after head trauma.
2016-2019. JAMA Netw Open. 2021;4:e2033710. 28. Wallace J, Mannix R. Racial disparities in diagnosis of concussion
Lancet. 2009;374(9696):1160–1170.
and minor head trauma and mechanism of injury in pediatric patients
12. Holmes J, Yen K, Ugalde I, et al. PECARN prediction rules for CT
visiting the emergency department. J Pediatr. 2021;236:193–199.
imaging of children presenting to the emergency department with
29. Lyons T, Miller K, Miller A, et al. Racial and ethnic differences in
blunt abdominal or minor head trauma: a multicentre prospective
emergency department utilization and diagnosis for sports-related
validation study. Lancet Child Adolesc Health. 2024;8(5):339–347.
head injuries. Front Neurol. 2019;10:690.
13. Babl F, Borland M, Phillips N, et al. Accuracy of PECARN, CATCH,
30. Portillo E, Stack A, Monuteaux M, et al. Association of limited English
and CHALICE head injury decision rules in children. Lancet.
proficiency and increased pediatric emergency department revisits.
2017;389:2393–2402.
Acad Emerg Med. 2021;28:1001–1011.
14. Lorton F, Poullaouec C, Legallais E, et al. Validation of the PECARN
31. Russell E, Hsu D, Camp E, et al. Spanish-speaking caregivers’
clinical decision rule for children with minor head trauma: a French
perception of emergency physicians’ interpersonal and
multicenter prospective study. Scand J Trauma Resusc Emerg Med.
communication skills. Pediatr Emerg Care. 2022;39:253–258.
2016;24:98.
32. Gmünder M, Gessler N, Buser S, et al. Caregivers with limited
15. Nakhjavan-Shahraki B, Yousefifard M, Hajighanbari M, et al.
language proficiency and their satisfaction with paediatric emergency
PECARN prediction rules in identifying high risk children with mild
care related to the use of professional interpreters. BMJ Open.
traumatic brain injury. Eur J Trauma Emerg Surg. 2017;43:755–762.
2024;14:e077716.
16. Cho S, Hwang S, Jung J, et al. Validation of PECARN rule in children
33. Dorsey B, Kamimura A, Cook L, et al. Communication gaps between
with minor head trauma. PLoS One. 2022;17:e0262102.
providers and caregivers of patients in a pediatric emergency
17. Gambacorta A, Moro M, Curatola A, et al. PECARN rule in diagnostic
department. J Patient Exp. 2022;9:23743735221112223.
process of pediatric patients with minor head trauma in emergency
34. Fields A, Abraham M, Gaughan J, et al. Language matters: race,
department. Eur J Pediatr. 2021;181:2147–2154.
trust, and outcomes in the pediatric emergency department. Pediatr
18. Arora R, White EN, Niedbala D, et al. Reducing computed
Emerg Care. 2016;32:222–226.
tomography scan utilization for pediatric minor head injury in the
35. Harris PA, Taylor R, Thielke R, et al. Research electronic data
emergency department. Acad Emerg Med. 2021;28(6):655–665.
capture (REDCap)—a metadata-driven methodology and workflow
19. Sawaya R, Wakil C, Wazir A, et al. Does implementation of the
process for providing translational research informatics support. J
PECARN rules improve patient-centered outcomes in a lower
Biomed Inform. 2009;42(2):377–381.
resource emergency department. BMC Pediatr. 2020;20:379.
36. Harris PA, Taylor R, Minor BL, et al. The REDCap consortium:
20. Du Plessis J, Gounden S, Lewis C. Paediatric minor head injury
building an international community of software partners. J Biomed
applied to PECARN CT recommendations: an audit. SA J Radiol.
Inform. 2019;95:103208.
2022;26:2289.
37. Worster A, Bledsoe RD, Cleve P, et al. Reassessing the methods of
21. Niele N, Van Houten M, Tromp E, et al. Application of PECARN rules
medical record review studies in emergency medicine research. Ann
would significantly decrease CT rates in a Dutch cohort of children with minor traumatic head injuries. Eur J Pediatr. 2020;179:1597–1602.
Emerg Med. 2005;45(4):448–451. 38. Centers for Medicare and Medicaid Services. Quality ID #416:
22. Bressan S, Steiner I, Mion T, et al. The PECARN intermediate-risk
Emergency medicine—emergency department utilization of CT for
predictors were not associated with scanning decisions for minor
minor blunt head trauma for patients aged 2 through 17 years. MIPS
head injuries. Acta Paediatr. 2015;104:e47–52.
Clinical Quality Measures. 2024. Accessed March 30, 2026.
23. Niele N, Plötz F, Tromp E, et al. Young children with a minor traumatic
39. Zhao Z, Zhang R, Cox J, et al. Massively parallel feature selection:
head injury: clinical observation or CT scan? Eur J Pediatr.
an approach based on variance preservation. Mach Learn.
2022;181:3291–3297.
2013;92(2-3):195–220.
Volume 27, No. 6: November 2026
1669
Western Journal of Emergency Medicine
English vs. Non-English Preference and CT Use in Pediatric Minor Head Trauma JAMA. 2026;335(17):1515–1524.
40. Kauffman J, Litz C, Thiel S, et al. To scan or not to scan: overutilization of computed tomography for minor head injury at a
44. Hartford E, Anderson A, Klein E, et al. The use and impact of professional interpretation in a pediatric emergency department.
pediatric trauma center. J Surg Res. 2018;232:164–170.
Acad Pediatr. 2019;19(8):956–962.
41. Bozan O, Aksel G, Kahraman H, et al. Comparison of PECARN and CATCH clinical decision rules in children with minor blunt head
45. Lion K, Gritton J, Scannell J, et al. Patterns and predictors of professional interpreter use in the pediatric emergency department.
trauma. Eur J Trauma Emerg Surg. 2019;45:849–855.
Pediatrics. 2021;147(2):e20193312.
42. Kwon B, Song H, Lee J. External validation and comparison of the PECARN and CATCH2 clinical decision rules in children with minor
46. Gutman C, Klein E, Follmer K, et al. Deficiencies in provider-reported interpreter use in a clinical trial comparing telephonic and video
blunt head trauma. Clin Exp Emerg Med. 2021;8:182–191.
interpretation in a pediatric emergency department. Jt Comm J Qual
43. Shah SN, Chizuk HM, Fong H, et al. Does this child have a
Patient Saf. 2020;46(10):573–580.
concussion? The Rational Clinical Examination systematic review.
Western Journal of Emergency Medicine
Nelson et al.
1670
Volume 27, No. 6: November 2026
Brief Research Report
Pediatric Unspecified Headache in the Emergency Department: Can We Do Better? Sarah R. Martin, PhD*†‡ Theodore W. Heyming, MD‡§ Eric C. Sun, MD, PhD|| Jenny Zhu, MD# Harshul Zaveri, MD¶ Zeev N. Kain, MD, MBA*†**††
*University of California, Irvine School of Medicine, Department of Anesthesiology & Perioperative Care, Irvine, California † University of California, Irvine, Center on Stress & Health, Irvine, California ‡ Rady Children’s Health, Orange County, Emergency Medicine, Orange, California § University of California, Irvine, Department of Emergency Medicine, Orange, California || Stanford University, Perioperative and Pain Medicine, Department of Anesthesiology, Stanford, California # University of California, Irvine School of Medicine, Irvine, California ¶ Rady Children’s Health, Orange County, Department of Neurology, Orange, California **Rady Children’s Health, Orange County, Department of Pediatrics, Orange, California †† Yale University Child Study Center, New Haven, Connecticut
Section Editor: Kathleen Stephanos, MD Submission history: Submitted January 23, 2026; Revision received June 17, 2026; Accepted August 5, 2026 Electronically published October 18, 2026 Full text available through open access at http://escholarship.org/uc/uciem_westjem DOI 10.5811/westjem.62197
Introduction: Unspecified headache is a common discharge diagnosis in the pediatric emergency department (ED). While diagnostic uncertainty and limited access to specialty evaluation may contribute to repeat ED visits in this population, longitudinal utilization data are limited. Study objectives were both to determine the incidence of repeat headache-related ED visits in children discharged from the ED with unspecified headache and to identify predictors of ED return (eg, prior headache-related ED or neurology utilization). Methods: This preliminary, prospective longitudinal cohort study included 76 children (ages 8–17 years) discharged from the ED with an unspecified headache diagnosis. We assessed headache-related ED and outpatient neurology visits both six months after the index visit (ie, ED enrollment) and, retrospectively, 12 months before the index visit. The sample included children insured through a Medi-Cal–based PhysicianHospital Consortium, who receive care exclusively within an integrated healthcare network, and other children in the hospital network, allowing capture of all ED and clinic utilization data. Our primary outcome was incidence of headache-related ED utilization postindex visit. Pain characteristics were self-reported during the index visit. Chi-square, Mann-Whitney U, and logistic regression analyses examined factors associated with incidence of headache-related ED returns. Results: Nearly 12% (n = 9) of children returned to the ED for a headache 6 months following the index visit. Across the 18-month study, 22.4% had at least one headache-related ED visit outside the index visit, 64.7% (n = 11) of whom had >2 headache-related ED encounters. A prior headache-related ED visit or prior neurology visit was significantly associated with returning to the ED after the index visit (20.0% vs 3.0%; risk difference = 17.0%; 95% CI, 0.9%-48.0%; P = .03, and 37.5% vs 1.5%; risk difference = 28.7%; 95% CI, 3.2%-60.9%; P = .02, respectively). Children with more than two headache-related ED visits during the 18-month study reported higher pain intensity (7.00 [SD, 1.38] vs 5.79 [SD, 2.09]; mean difference = -1.21; 95% CI, -2.20 to -0.22; P = .02). In logistic regression analyses, prior neurology utilization was the only variable significantly associated with headache-related ED return (OR, 15.31; 95% CI, 1.08-216.34; P = .04). Conclusion: A considerable proportion of children discharged with unspecified headache returned to the ED for headache. Emergency department and neurology utilization and pain intensity were linked to return ED visits. Larger, longitudinal studies are needed to further clarify these findings. [West J Emerg Med. 2026;27(6)1671–1677.]
Volume 27, No. 6: November 2026
1671
Western Journal of Emergency Medicine
Pediatric Headache in the ED
Martin et al.
INTRODUCTION Headache is a common pediatric complaint, affecting up to 60% of children with as many as 30% experiencing recurrent episodes,1–3 and is associated with significant pain burden, contributing to substantial healthcare utilization and costs.4,5 Headache complaints account for approximately 3% of pediatric emergency department (ED) visits, with rates rising nearly three times faster than overall pediatric ED utilization.6–8 Most cases are attributed to non-life-threatening conditions (85-98%),7 most commonly primary or unspecified headache disorders (50-66%).6,7,9,10 Emergency clinicians face challenges in differentiating between primary headache subtypes due to time constraints and barriers to neurology consultation. Consequently, many children are discharged with a nonspecific or unspecified headache diagnosis, limiting follow-up guidance and contributing to repeat ED utilization.7,10,11 Currently, there is a paucity of data on recurrent ED utilization in this population. Existing research, which is limited to brief follow-up periods of up to 1 month, report return rates of 4-8%.12–14 We submit the need for longer-term ED and outpatient neurology utilization data for unspecified headache diagnosis and identification of children at risk for recurrent ED visits. This preliminary investigation characterized ED utilization patterns among children diagnosed with unspecified headache, examining incidence of ED use in the 12 months preceding and 6 months following the study index visit, as well as subsequent outpatient neurology encounters. METHODS Design and Participants This cohort study employed a prospective, longitudinal design combined with a retrospective data component. Participant enrollment was conducted within a pediatric ED in the southwestern United States from November 2022–June 2024. Data were collected prospectively following ED enrollment (ie, index visit) and retrospectively to capture utilization prior to the index visit. Participants included a convenience sample of children 8–17 years old who were discharged from the ED with an unspecified headache diagnosis (International Classification of Diseases, Tenth Revision R51.9). Attending emergency physicians assigned discharge diagnoses. Diagnosis eligibility was then reviewed by study investigators, including a pediatric emergency physician. Patients were excluded if they had an Emergency Severity Index (ESI) score of 1 or were not fluent in English or Spanish. Measures Demographics Children and caregivers reported demographics including sex, ethnicity, and race. Clinical Acuity Emergency department ESI scores (level 1 = most Western Journal of Emergency Medicine
Population Health Research Capsule What do we already know about this issue? Unspecified headache is a common diagnosis in the pediatric emergency department (ED) and diagnostic uncertainty may contribute to repeat visits. What was the research question? What is the incidence of repeat headacherelated ED visits in children discharged with unspecified headache? What was the major finding of the study? Across 18 months, 22% had >2 headache ED visits; prior neurology care predicted 6-month ED return (OR, 15.31 [1.08-216.34], P =. 04). How does this improve population health? Reporting headache-related ED utilization will inform future research and interventions to improve pediatric headache care in the ED.
critically ill to level 5 = least critically ill) were obtained from the electronic health record (EHR).15 Length of Stay The ED length of stay (hours) was obtained from the EHR. Pain intensity and duration Children self-reported pain intensity via a numeric rating scale ranging from 0 (“no pain”) to 10 (“worst pain possible”)16 and pain duration categorized as pain <1 month, >1 month, and pain >3 months.17 ED and Neurology Utilization Emergency department visits with a headache chief complaint and outpatient neurology encounters 12 months before and 6. months after the index visit (ie, ED enrollment visit) were extracted from medical records. We used the incidence of headache-related ED and neurology encounters in analyses. The sample included children who were uninsured, had other insurance, or were insured through the Medi-Cal– based Physician-Hospital Consortium (PHC) and received care exclusively within an integrated healthcare network where all encounters were captured. Utilization data were identifiable for PHC and non-PHC participants receiving care within the healthcare network, which includes two EDs and primary and specialty care clinics across four counties.
1672
Volume 27, No. 6: November 2026
Pediatric Headache in the ED
Martin et al. Procedures Ethical approval for study procedures was obtained from the institutional review board (IRB) (#220577). Research personnel identified patients who met chief complaint, ESI, and age eligibility through the ED tracking board and approached patients to conduct screening and informed consent. Enrolled participants then completed measures on REDCap, a secure data collection tool. Study investigators then reviewed ED discharge diagnoses. Participants discharged with an unspecified headache diagnosis were included in the current analyses. Electronic health record and utilization data were extracted using advanced electronic/ automated Structured Query Language queries. Extraction adhered to Worster et al18 case-selection criteria, variable definitions, hypothesis blinding, medical record identification, and IRB approval criteria. Statistical Analyses Analyses were performed using IBM SPSS Statistics, version 29.0 (IBM Corp, Armonk, NY). We dichotomized ED and neurology utilization to indicate encounter occurrence. Before primary analyses, preliminary chi-squared tests revealed no significant differences in prior ED visits (P = .30) or ED returns (P = .49) between PHC-enrolled patients (n = 34-44.7%) and non-PHC members (n = 42, 55.3%). Therefore, the combined sample was used for primary analyses. Chisquare and Mann-Whitney U tests examined associations of demographics, pain, and prior utilization with incidence of headache-related ED returns. Effects sizes were reported as phi ϕ (small =. 0.1, medium = 0.3, large =. 0.5) or Cohen d (small = 0.2, medium = 0.5, large = 0.8). A McNemar test examined changes from pre- to postindex neurology visits. A multivariable logistic regression examined independent associations with likelihood of headache-related ED return after the index visit. Independent variable selection was informed by headache literature identifying demographic (age, sex, ethnicity) and pain characteristics (intensity and duration) associated with headache outcomes,19–22 and current preliminary results suggesting that prior headache-related ED and neurology utilization is associated with ED returns. Exploratory analyses examined factors associated with headache-related ED utilization over the 18-month study period. Given the preliminary nature of this study and convenience sample, an a priori power analysis was not conducted. Post hoc sensitivity analyses indicated that the sample (N = 76) was powered to detect large effects (OR > 6.05) at 80% power, α = .05. RESULTS Of the 174 patients who presented to the ED with headache, 76 were discharged with an unspecified headache diagnosis and were included in the current analyses. Excluded diagnoses included migraine (n = 17); secondary headache (infection n = 35; injury n = 14; homeostasis (n = 5); cranial/ Volume 27, No. 6: November 2026
vascular (n = 4); structural disorder (n = 5); psychiatric (n = 2); and other/non-headache (n = 16). Participant characteristics are presented in Table 1. Emergency Department and Outpatient Neurology Utilization (Table 1) Across the 18-month study period (12 months pre-ED index and 6 months post-ED index), 22.4% of participants had at least one additional headache-related ED visit outside the index visit, approximately 65% of whom had two or more headache-related ED encounters. In the 12 months prior to the ED index visit, 13.2% of participants had a headache-related ED visit. In the 6 months postindex visit, 11.8% of participants returned to the ED for a headache; of these, seven received an unspecified headache diagnosis at subsequent visits, one a migraine diagnosis, and one left without being seen. Prior to the ED index visit, 10.5% of participants had an outpatient neurology encounter for headache symptoms. Neurology utilization significantly increased to 27.6% following the index visit (McNemar test P = .002). Factors Associated with Returning to the Emergency Department for Headache Bivariate analyses indicated that the incidence of a prior headache-related ED visit was significantly associated with returning to the ED within one month (P = .03) but not within six months of the index visit (P = .10). Prior neurology and postindex neurology utilization were significantly associated with returning to the ED within six months (P = .02; P = .04, respectively). Pain intensity was moderately higher in children who returned to the ED for headache (d = .62, P = .11). Table 2 presents bivariate results. Multivariable logistic regression results indicated that prior neurology utilization was the only variable significantly associated with incidence of headache-related ED return within six months (P = .04; Table 3). In exploratory analyses, children with 2 or more headache-related ED visits reported significantly higher pain intensity than those with only the index visit (mean difference = -1.21; 95% CI, -2.20 to -0.22; P = .02). Pain duration was not significantly associated with having >2 ED visits, but small effects emerged for pain >1 month (ϕ = 0.23, P = .08) and chronic pain (ϕ = 0.20, P = .15). Children with pain >1 month or chronic pain were more likely to have two or more ED visits (25.0%) than those without (8.5%; risk difference = 16.9%; 95% CI, -1.2% to 36.0%, and 9.8%; risk difference = 15.2%; 95% CI, -3.0% to 36.0%). DISCUSSION In this preliminary investigation, during an 18-month period, over 20% of children discharged from an ED with unspecific headache diagnosis had at least one additional headache-related ED visit. This exceeds previously reported return rates of 4-8% from studies using shorter follow-up
1673
Western Journal of Emergency Medicine
Pediatric Headache in the ED
Martin et al.
Table 1. Demographic and clinical characteristics, and incidence of emergency department (ED) and neurology utilization in a sample of children who presented to an ED with headache and received a diagnosis of unspecified headache. Variable
n (%)
Child age (years)
Mean (SD) 13.89 (2.68)
Child sex Female
46 (68.7)
Male
a21 (31.3)
Ethnicity Latino
57 (86.4)
Non-Latino
9 (13.6)
Race African American, Black
1 (1.8)
Asian, Pacific Islander
1 (1.8)
Native American, Alaskan
1 (1.8)
White
28 (49.1)
Multiracial, Other
26 (45.6)
Caregiver language English
46 (64.8)
Spanish
25 (35.2)
Emergency Severity Index 2
2 (2.7)
3
68 (90.7)
4
4 (6.7)
Length of stay (hours)
5:36 (2:20)
Pain intensity
6.20 (1.95)
Pain duration < 1 month
37 (56.9)
≥ 1 month to < 3 months
4 (6.2)
≥ 3 months
24 (36.9)
Utilization and Time Period Variables
Sample n (%)
12 Months Prior to ED Index Visit ED visit for headache
10 (13.2)
Within 1 month
7 (9.2)
Within 3 months
8 (10.5)
Within 6 months
8 (10.5)
Neurology visit
8 (10.5)
6 Months Following ED Index Visit ED visit for headache
9 (11.8)
Within 1 month
4 (5.3)
Within 3 months
6 (7.9)
Neurology visit
21 (27.6)
Entire 18-Month Study Period* ED Visit for headache ≥ 1 ED visit for headache
17 (22.4)
≥ 2 ED visits for headache
11 (14.5)
*Does not include study index visit. ED, emergency department; SD, standard deviation.
Western Journal of Emergency Medicine
periods,12–14 underscoring the healthcare burden in this population and need for future research to capture longer care trajectories and identify intervention targets to improve headache management and reduce recurrent ED use. The current higher return rates may reflect our unique Medi-Cal– based PHC, which enabled collection of comprehensive healthcare utilization data. This contrasts with previous studies that may have underreported utilization when children sought care outside the original hospital system. In multivariable regression analyses, prior outpatient neurology utilization was the only variable significantly associated with returning to the ED for headache within six months. Age, gender, ethnicity, pain symptoms, and prior headache-related ED visits were not. While this finding may reflect greater underlying clinical complexity among children previously seen by neurology, it may also indicate gaps in treatment effectiveness, care coordination, or access to follow-up. Prior consensus recommendations have identified fragmented care pathways and variability in headache management across settings as contributors to recurrent ED utilization.23 Clinically, prior neurology utilization may serve as a marker for children who could benefit from enhanced ED discharge planning or closer outpatient follow-up; however, given the preliminary nature of this study, future research incorporating additional clinical and treatment data is needed to clarify the mechanisms underlying this association. Although pain symptoms were not significantly associated with postindex ED returns, children with two or more headache-related ED visits over the 18-month study reported significantly higher pain intensity. Small, nonsignificant effects were observed for pain duration with 25% of children reporting pain for over one month had two or more ED visits—nearly triple the rate of those without recurrent pain. These findings must be interpreted with consideration of a type II error. Collectively, trends suggest that headache pain severity and chronicity may contribute to ED use and a need for larger longitudinal studies to clarify how pain characteristics and treatment influence headacherelated ED utilization. LIMITATIONS Several limitations should be considered. The modest sample size may have limited statistical power, increasing likelihood of a type II error. Larger samples and studies designed to examine headache-related treatment trajectories and response over time are needed to develop multivariable risk models to inform clinical decision-making. This study relied on ED discharge diagnoses assigned during standard clinical care which may limit interpretation of diagnostic specificity or introduce diagnostic misclassification. The single-site design may limit generalizability to other ED populations. For non-PHC participants, utilization data were restricted to encounters within the PHC network, potentially
1674
Volume 27, No. 6: November 2026
Pediatric Headache in the ED
Martin et al.
Table 2. Results of chi-square and mean difference analyses examining associations between demographic, clinical, and prior utilization variables and the incidence of return emergency department visits for headache within 6 months. Headache ED Return within 6 months Mean (SD) or n (%) Variables
No
Yes
Risk or Mean Difference (95% CI†)
P
Effect Size*
9.4% [-15.7-34.5]
.39
.10
17.0% [0.9-48.0]
.02
.27
16.5% [-3.8-37.0]
.04
.23
Utilization Prior headache ED visit No
59 (89.4)
7 (10.6)
Yes
8 (80.0)
2 (20.0)
No
62 (91.2)
6 (8.8)
Yes
5 (65.5)
3 (37.5)
No
51 (92.7)
4 (7.3)
Yes
16 (76.2)
5 (23.8)
13.94 (2.75)
13.48 (2.09)
Prior neurology visit
Postneurology visit
Demographic Child age (years) Child sex Female
39 (84.8)
7 (15.2)
Male
19 (90.5)
2 (9.5)
Ethnicity Latino
51 (89.5)
6 (10.5)
Non-Latino
7 (88.9)
3 (11.1)
African American, Black
1 (100)
0 (0)
Asian, Pacific Islander
1 (100)
0 (0)
Native American, Alaskan
1 (100)
0 (0)
White
25 (89.3)
3 (10.7)
Multiracial, Other
22 (84.6)
4 (15.4)
0.46 [-1.44-2.36]
.63
.17
5.7% [-14.0-25.0]
.53
.08
19.5% [-49.0-10.0]
.09
.20
.95
.11
.90
.02
.59
.12
Race
Caregiver language
1.0% [-18.0-20.0]
English
40 (87.0)
6 (13.0)
Spanish
22 (88.0)
3 (12.0)
2
2 (100)
0 (0)
3
59 (86.8)
9 (13.2)
4
5 (100)
0 (0)
Length of stay (hours)
5:28 (2:17)
6:35 (2:35)
1:60 [-2:45-0:32]
.18
.48
Pain intensity
6.04 (1.92)
7.22 (1.99)
-1.19 [-2.57-0.20]
.09
.62
0.8% [-16.0-18.0]
.93
.01
No
32 (86.5)
5 (13.5)
Yes
24 (87.5)
4 (14.3) 4.5% [-14.0-22.0]
.61
.06
36 (87.8)
5 (12.2)
Clinical ESI
Pain duration >1 month
Pain duration >3 months No
Yes 20 (83.3) 4 (16.7) *Phi ϕ reported as effect size for chi-square analyses and Cohen d reported for mean difference analyses. † Risk differences not reported for race and ESI due to extreme sparsity in groups. ED, emergency department; ESI, Emergency Severity Index; SD, standard deviation.
Volume 27, No. 6: November 2026
1675
Western Journal of Emergency Medicine
Pediatric Headache in the ED
Martin et al.
Table 3. Results of a logistic regression analysis examining independent associations between demographic, pain, and prior utilization variables and incidence of returning to the emergency department (ED) for headache within 6 months of the index ED visit. Variable
B
SE
Wald x2
P
OR (95% CI)
Child age
-0.22
0.19
1.40
.24
0.8 (0.56-1.15)
Child sex (female)
-0.51
1.09
0.22
.64
0.6 (0.07-5.09)
Child ethnicity (Latino)
0.29
1.06
0.07
.79
1.33 (0.17-10.55)
Pain intensity
0.57
0.30
3.48
.06
1.76 (0.97-3.18)
Pain duration (> 1 month)
-0.90
1.02
0.78
.38
0.41 (0.06-2.99)
Prior ED visit for headache (yes)
0.03
1.28
0.00
.98
1.03 (0.08-12.76)
Prior neurology visit (yes) 2.73 ED, emergency department; OR, odds ratio; SE, standard error.
1.35
4.08
.04
15.31 (1.08-216.34)
missing external encounters. Future studies incorporating longitudinal patient-reported care data may better characterize utilization.
Martin). SRM is supported by the National Institutes of Health (K23HD105042, PI: Martin). ECS is supported by the National Institutes of Health (NIA RF1AG095589; NIDA R61DA059168); is a venture partner for MEDA ventures; has served as a consultant for Analysis Group. ZNK is supported by the National Institutes of Health (NIMH R61MH132249, PI; NICHD R01HD091286 PI; NIAMS R01AR073780, Site PI); he is the president of the American College of Perioperative Medicine. TWH, JZ, HZ report no conflicts of interest.
CONCLUSION Overall, findings suggest that children discharged from the ED with unspecified headache have high rates of ED utilization extending beyond the brief follow‑up windows used in previous research. The mechanisms underlying the association between prior neurology utilization and increased risk for ED return warrants further investigation. Results from this preliminary study highlight the need for comprehensive, longitudinal research that includes patient- and system-level variables (eg, access to headache care, institutional referral practices) to better understand multilevel factors driving ED reliance and clinical outcomes in this understudied population.
Copyright: © 2026 Martin et al. This is an open access article distributed in accordance with the terms of the Creative Commons Attribution (CC BY 4.0) License. See: http://creativecommons.org/ licenses/by/4.0/
REFERENCES 1. Chambers CT, Dol J, Tutelman PR, et al. The prevalence of chronic
ACKNOWLEDGMENTS Sarah Martin is supported by the National Institutes of Health (NIH) National Institute for Child Health and Human Development (K23HD105042, PI: Martin). Eric Sun is supported by the NIH (NIA RF1AG095589; NIDA R61DA059168). Zeev Kain is supported by the NIH (NIMH R61MH132249, PI; NICHD R01HD091286 PI; NIAMS R01AR073780, Site PI).
pain in children and adolescents: a systematic review update and meta-analysis. Pain. 2024;165(10):2215-2234. 2. Onofri A, Pensato U, Rosignoli C, et al. Primary headache epidemiology in children and adolescents: a systematic review and meta-analysis. J Headache Pain. 2023;24(1):8. 3. Dooley JM, Gordon KE, Wood EP. Self-reported headache frequency in Canadian adolescents: validation and follow-up. Headache. 2005;45(2):127-131. 4. Bethell C, Kemper KJ, Gombojav N, et al. Complementary and
Address for Correspondence: Sarah R. Martin, PhD, University of California, Irvine, Department of Anesthesiology & Perioperative Care and Center on Stress & Health, 505 S. Main Street, Suite 940, Orange, CA 92868. Email: sarahm7@hs.uci.edu. Conflicts of Interest: By the WestJEM article submission agreement, all authors are required to disclose all affiliations, funding sources and financial or management relationships that could be perceived as potential sources of bias. Sarah Martin is supported by the National Institutes of Health National Institute for Child Health and Human Development (K23HD105042, PI:
Western Journal of Emergency Medicine
conventional medicine use among youth with recurrent headaches. Pediatrics. 2013;132(5):e1173-e1183. 5. Law EF, Palermo TM, Zhou C, et al. Economic impact of headache and psychiatric comorbidities on healthcare expenditures among children in the United States: a retrospective cross-sectional study. Headache. 2019;59(9):1504-1515. 6. Massano D, Julliand S, Kanagarajah L, et al. Headache with focal neurologic signs in children at the emergency department. J Pediatr. 2014;165(2):376-382. 7. Mourid MR, Oweidat M, Okesanya OJ, et al. Pediatric headache
1676
Volume 27, No. 6: November 2026
Pediatric Headache in the ED
Martin et al. management in the emergency department: a review of challenges
department. Clin Pediatr (Phila). 2020;59(1):62-69.
and solutions. Curr Treat Options Pediatr. 2025;11(1):8.
13. Sheridan DC, Dhatt S, Narayan K, et al. Effectiveness of emergency
8. Perry MC, Yaeger SK, Toto RL, et al. A modern epidemic: increasing
department treatment of pediatric headache and relation to rebound
pediatric emergency department visits and admissions for headache. Pediatr Neurol. 2018;89:19-25.
headache. Pediatr Emerg Care. 2020;36(12):e720. 14. Costa FM, Ferreira IP, Mascarenhas IF, et al. Diagnosis and
9. Raucci U, Della Vecchia N, Ossella C, et al. Management of
treatment of headache in a pediatric emergency department. Pediatr
childhood headache in the emergency department: review of the literature. Front Neurol. 2019;10:886.
Emerg Care. 2020;36(12):571. 15. Wuerz RC, Milne LW, Eitel DR, et al. Reliability and validity of a new
10. Rossi R, Versace A, Lauria B, et al. Headache in the pediatric emergency department: a 5-year retrospective study. Cephalalgia.
five-level triage instrument. Acad Emerg Med. 2000;7(3):236-242. 16. Williamson A, Hoggart B. Pain: a review of three commonly used pain
2018;38(11):1765-1772. 11. Kellier D, Anto MM, Hall M, et al. Association of race and ethnicity
rating scales. J Clin Nurs. 2005;14(7):798-804. 17. Kent ML, Tighe PJ, Belfer I, et al. The ACTTION–APS–AAPM Pain
with emergency room rate of migraine diagnosis, testing, and
Taxonomy (AAAPT) multidimensional approach to classifying acute
management in children with headache. Neurology.
pain conditions. J Pain. 2017;18(5):479-489.
2025;104(5):e213351.
18. Worster A, Bledsoe RD, Cleve P, et al. Reassessing the methods of
12. Hemberg JL, Pomeranz ES, Rogers AJ, et al. Functional impairment
medical record review studies in emergency medicine research. Ann
predicts outcome of youth with headache in the emergency
Volume 27, No. 6: November 2026
Emerg Med. 2005;45(4):448-451.
1677
Western Journal of Emergency Medicine
Brief Research Report
Effects of Racial Concordance and Perceived Racism on Emergency Department Patient Satisfaction Rachel Gonzales, MPH*† Margaret Wang, MD‡ Charlotte Sagan, MPH, MBA* Sally Nijim, AB§ Anish Agarwal, MD, MPH, MS*†
*University of Pennsylvania, Perelman School of Medicine, Department of Emergency Medicine, Philadelphia, Pennsylvania † University of Pennsylvania, Perelman School of Medicine, Center for Health Care Transformation and Innovation, Philadelphia, Pennsylvania ‡ University of Pennsylvania, Perelman School of Medicine, Department of Family Medicine, Philadelphia, Pennsylvania § University of Pennsylvania, Perelman School of Medicine, Philadelphia, Pennsylvania
Section Editors: Cortlyn Brown, MD and Soheil Saadat, MD, MPH, PhD Submission history: Submitted July 17, 2026; Revision received June 17, 2026; Accepted May 23, 2026 Electronically published October 26, 2026 Full text available through open access at http://escholarship.org/uc/uciem_westjem DOI 10.5811/westjem.49041
Introduction: Racial disparities in healthcare persist, with evidence suggesting that bias contributes to inequities in care and outcomes for Black patients. Racial concordance between patients and clinicians has been proposed as one strategy to improve patient satisfaction and health outcomes, but its impact in acute care settings such as the emergency department (ED) remains underexplored. The objective of this study was to assess how racial concordance between patient and clinician, together with patient perceptions of how race affected their care, influence patient satisfaction with care in the ED. Methods: This secondary analysis used data from a previously published text message–based survey of patients discharged from two EDs between August and September 2021. Patients were categorized as not completely discordant if at least one clinician (physician, advanced practice clinician, or nurse) shared their self-identified race. The primary outcome was patient ratings of experience with ED care (scored 0 = poor to 5 = excellent). Multivariable ordinal logistic regression was used to assess associations between racial concordance, perceived impact of race on care, and experience ratings. Results: Of 516 respondents, 195 (37.8%) were classified as not completely discordant with at least one emergency clinician. Not completely discordant patients reported significantly lower experience ratings (scored 0 to 5) compared to racially discordant patients (median, 4 [3-5] vs 5 [3-5]; P = .01). In multivariable ordinal logistic regression, racial concordance was not independently significant in patient experience. Conclusion: Contrary to expectations, in our population, racial concordance was not significantly associated with satisfaction in ED care. In the adjusted analysis, perceived negative impact on care due to race was the strongest independent predictor of lower overall satisfaction. These findings suggest that how patients perceived the role of race in their care may be more influential than simply patient-clinician concordance in the acute care setting. Further research is needed to investigate these factors in more diverse patient-clinician population and other ED settings to help inform policies focused on advancing health equity. [West J Emerg Med. 2026;27(6)1678–1683.]
INTRODUCTION Racial disparities in healthcare have long persisted in the United States. Black Americans in particular experience disproportionately high burdens of chronic illness, maternal Western Journal of Emergency Medicine
mortality, and mortality across many diseases.1–4 Experiences of racism in healthcare are associated with lower medication adherence, reduced participation in clinical research, and delays in seeking care.5–7 There is increasing evidence that 1678
Volume 27, No. 6: November 2026
Gonzales et al.
Effects of Racial Concordance and Perceived Racism on ED Patient Satisfaction
racism contributes to these disparities, including inadvertently through implicit bias that can impact behaviors such as language used to describe patients in the electronic health record (EHR).8–11 Studies show that Black physicians do not demonstrate as much implicit racial preference as their non-Black colleagues.12,13 Racial concordance between clinician and patient may be protective against poor care and health outcomes as patients are more likely to use health services and less likely to delay seeking care;14 more likely to be satisfied with care;15 and more likely to start appropriate medication treatment.16 However, there is limited research that addresses race as a factor in patient satisfaction research and in acute care emergency department (ED) settings where interactions are brief, with fewer opportunities for a longitudinal relationship. Our recent study used a postdischarge survey to explicitly ask about experiences of racism in the ED, along with satisfaction with ED care.17 The data resulting from the survey were used in this secondary analysis. The objective of this secondary analysis was to explore how racial concordance between clinician and patient, together with patient perception of the role of race in their care, are associated with satisfaction with ED care. METHODS Data and methodology are taken from our previously published data on ED care, and the data used for this analysis are a secondary analysis of the primary study.17 Briefly, discharged ED patients from two EDs within a large, urban academic health system in the Northeast were sent a text message-based survey to assess their perceptions of ED care. The eight-item survey was informed by existing literature on discrimination and racism in healthcare and drafted by the study team. which included experts in healthcare delivery, emergency care, and equity-based research. The survey included questions on satisfaction with ED care; the impact of race on care (positive, negative, or none); and whether race affected key components of care delivery (eg, respect, quality of service, and communication) (Figure S1). This study represents a secondary analysis of this survey with linked ED-encounter EHR data. Whereas the primary paper restricted inclusion to patients who completed the entire survey, this analysis focused on participants who answered at least the question on ED experience rating. The primary outcome was satisfaction with ED care, examined in relation to racial concordance between clinician and patient and patient-reported effects of race on care. A patient was classified as “not completely discordant” with their clinician if they had the same self-identified race as at least one of their clinicians during their ED visit (attending or resident physician, advanced practice clinician [APC], or nurse) and racially discordant if they did not have the same race as any of their clinicians. Participant race collected from the EHR was grouped into four categories: White, Black, Asian, or other. Clinician race was determined by study team observations and Volume 27, No. 6: November 2026
Population Health Research Capsule What do we already know about this issue? Racial disparities in healthcare persist; concordance may improve satisfaction, but emergency department (ED) evidence is limited and mixed. What was the research question? Does racial concordance and perceived race effects influence ED patient satisfaction? What was the major finding of the study? Negatively perceived race effect lowered satisfaction (odds ratio [OR] 0.16, P < .001). How does this improve population health? Targeting perceived bias, not just concordance, may better improve satisfaction and equity in ED care.
knowledge and included both the first and last clinician seen in each role in the patient’s EHR. First and last clinician seen are defined as clinician providing direct care for a patient and thus responsible for the visit; the definition excludes clinician in triage. Ethnicity was not considered in the analysis. Statistical analyses were conducted using Stata SE 18.5 (StataCorp, LLC, College Station, TX) and Wilcoxon ranksum tests to assess differences of medians in univariate analysis and ordinal logistic regression modeling. RESULTS In a study of 516 patients discharged from an ED (August 6 and September 24, 2021, Figure S1), 195 (37.8%) patients were classified as not completely discordant, and 321 (62.2%) were racially discordant with all their clinicians (Table 1). Several clinician types were seen at different rates between not completely discordant and completely discordant patients. Not completely discordant patients were more likely to have seen a physician (attending or resident) or nurse as part of their visit, whereas completely discordant patients were more likely to have seen an APC as part of their visit (50.2% vs 30.1%) (Table 1). Not completely discordant patients had a lower median satisfaction rating with ED care compared to racially discordant patients (median, 4 [3-5] vs 5 [3-5]; P = .01) (Table 1), but no significant differences were found in responses to questions on respect, service quality, or communication; the significant difference observed in the median experience rating did not hold when looking at experience ratings as categorical variables. When
1679
Western Journal of Emergency Medicine
Effects of Racial Concordance and Perceived Racism on ED Patient Satisfaction
Gonzales et al.
Table 1. Demographics of patients classified as not completely discordant versus complete racial discordance in a study to assess how racial concordance between patient and clinician, together with patient perceptions of how race affected their care, influence patient satisfaction with care in the emergency department. Not complete discordance (n = 195)
Complete racial discordance (n = 321)
Sex, n (%)
.04
Female
124 (63.6)
216 (67.3)
Male
69 (35.4)
91 (28.4)
Missing
2 (1.0)
14 (4.4)
45.0 (±18.4)
41.4 (±16.4)
Age, mean (SD)
P value
Race, n (%)
.01 < .001
Black
43 (22.1)
277 (86.3)
White
143 (73.3)
7 (2.2)
Asian
9 (4.6)
10 (3.1)
Other a
0 (0.0)
27 (8.4)
Attending seen, n (%)
142 (72.8)
183 (57.0)
Resident seen, n (%)
56 (28.7)
62 (19.3)
.01
APC seen, n (%)
61 (31.3)
161 (50.2)
< .001
Nurse seen, n (%)
131 (67.2)
160 (49.8)
< .001
Attending
94 (48.2)
0 (0.0)
Resident
34 (17.4)
0 (0.0)
APC
53 (27.2)
0 (0.0)
Nurse
109 (55.9)
0 (0.0)
< .001
Concordance with…, n (%)
stratified by type of clinician, only patients seen by a racially concordant attending physician continued to demonstrate a significant difference in the primary outcome (median, 4 [3-5] vs 5 [3-5]; P = .04). There was no significant difference in the distribution of answers on whether patients perceived race to have a positive, negative, or no effect on their care in the racially concordant vs discordant groups (P = .10) (Table 1). When stratified by patient race, results of univariate analyses show no significant difference in median ratings of ED care between not completely discordant vs completely discordant groups for Black patients (4 [3-5] vs 5 [3-5], P = .08) or White patients (4 [3-5] vs 5 [4-5], P = .06) (Table S1). When stratified by patient report of how their race affected ED care, there was no significant difference in median experience ratings between not completely discordant vs discordant groups for patients reporting either a positive or negative effect. Among patients who reported that race had no effect on their care experience, the median rating was lower for not completely discordant patients (4 [3-5] vs 5 [5-5], P < .001). Results of multivariable analyses using racial concordance and patient-reported effect of race on ED care showed that the only significant predictor affecting satisfaction rating were perceived negative effect of race on ED experience (odds ratio [OR] 0.16; 95% CI, 0.09-0.30; P < .001) and age (OR 1.01; 95% CI, 0.005-1.02; P = .03). Patients reporting race to have Western Journal of Emergency Medicine
had a negative effect on their care had decreased odds of higher satisfaction ratings (Table 2). There was trend toward increased age leading to increased odds of higher satisfaction ratings as well. DISCUSSION This study aimed to explore the relationship between racial concordance between patients and clinicians and satisfaction ratings of ED care. The strengths of this study include a relatively large and racially diverse patient sample and the ability to examine both concordance and perceived racial impact on care. The results demonstrate that the effects of racial concordance between patients and clinicians are complex and context-dependent. The study points to three main findings: (1) ED satisfaction ratings were not significantly different between patients who were classified as not completely discordant with their clinicians and those who were completely discordant in multivariate models; (2), patients who perceived their race to negatively affect their ED care rated their care lower, even when controlling for other variables; and (3) not completely discordant patients were more likely to be White than those who were completely discordant. While racial concordance has been proposed as one strategy to improve healthcare equity, outcomes and experiences for Black patients, these findings suggest a complex
1680
Volume 27, No. 6: November 2026
Effects of Racial Concordance and Perceived Racism on ED Patient Satisfaction
Gonzales et al. Table 1. Continued
Not complete discordance (n = 195)
Complete racial discordance (n = 321)
0
0 (0.0)
321 (100.0)
1
114 (58.5)
0 (0.0)
2
47 (24.1)
0 (0.0)
3+
34 (17.4)
0 (0.0)
13 (6.7)
16 (5.0)
P value
Number of concordant clinicians, n (%)
Rating of ED care, n (%)
.19
0 1
8 (4.1)
7 (2.2)
2
13 (6.7)
17 (5.3)
3
31 (15.9)
46 (14.3)
4
49 (25.1)
65 (20.3)
5
81 (41.5)
170 (53.0)
Low rating (0 – 2)
34 (17.4)
40 (12.5)
High rating (3 – 6)
Binary rating of ED care, n (%)
.12 161 (82.6)
281 (87.5)
Rating of ED care, median (IQR)
4 [3, 5]
5 [3, 5]
.01
Impact of race on respectc, median, (IQR)
0 [0, 2]
0 [0, 3]
.25
Effect of race on quality of service , median (IQR)
0 [0, 0]
0 [0, 1]
.10
Effect of race on communicatione, median (IQR)
0 [0, 0]
0 [0, 0]
.90
22 (11.3)
23 (7.2)
d
Effect of race on care
.10
Positive Negative
10 (5.1)
29 (9.0)
None
156 (80.0)
258 (80.4)
Missing
7 (3.6)
11 (3.4)
Including multiracial, Native American or American Indian, Native Hawaiian or Pacific Islander, or self-identified as other or unknown. b Clinicians seen indicates how many patients within each group saw a given level of clinician. Because some patients saw more than 1 type of clinician, the percentages total greater than 100%. c Participants were asked, “Did you feel your race affected how much respect you were treated with? From 0-5, 0 = not at all, 5 = strongly affected”. 488 participants completed this question. d Participants were asked , “Did you feel your race affected the quality of service you experienced? From 0-5, 0 = not at all, 5 = strongly affected”. 468 participants completed this question. c Participants were asked, “Did you feel your race affected the communication between you and the care team? From 0-5, 0 = not at all, 5 = strongly affected”. 467 participants completed this question. APC, advanced practice clinician; IQR, interquartile range; NCD, not completely discordant; SD, standard deviation. a
relationship in the acute care setting that requires additional research. Specifically, we found that racial concordance alone was not a significant predictor of patient experience ratings in the ED settings. These findings align with emerging evidence that the effects of concordance are not universally positive or consistent across clinical settings.18–21 One meta-analysis found that while racial concordance was associated with improved communication, effects on patient satisfaction specifically were mixed—consistent with our finding that concordance alone does not uniformly predict satisfaction.20 A second ED-based study found no significant effect of racial concordance on patient perceptions of physician trust and respect, although age Volume 27, No. 6: November 2026
concordance showed a negative effect—paralleling our finding that the relationship between concordance and satisfaction may differ depending on clinical settings.21 Our analysis incorporated patients’ perceived experience of racial bias as a covariate, which emerged as a stronger predictor than concordance itself, underscoring the value of directly asking patients about race in care surveys. Several factors may explain why racially concordant patients in our study reported lower satisfaction. The nature of ED care itself likely affected ratings. Unlike with longitudinal outpatient care, patients are not able to select for the demographics of a clinician, which may further influence their satisfaction of care.
1681
Western Journal of Emergency Medicine
Effects of Racial Concordance and Perceived Racism on ED Patient Satisfaction Prior research has shown that patient satisfaction may be influenced both by whether they receive care from a racially concordant clinician and by their perception of racial bias in healthcare.15 In multivariate analysis, patients who perceived race to have had a negative impact on their care were more likely to give lower satisfaction scores, while in stratified univariate analysis only those who were not completely discordant and did not perceive any impact of race on care indicated lower ratings than their discordant counterparts. While this latter finding may be in part due to a larger proportion of patients indicating a neutral perceived effect, together, these patterns suggest that perceived bias may be a stronger and more consistent determinant of satisfaction than concordance alone. Further, the relationship between concordance and experience may vary depending on patients’ racial identities and their expectations or interpretations of the encounter. The racial composition of the not completely discordant group warrants consideration in interpreting these findings. Not completely discordant patients were more likely to be White than those who were completely racially discordant with their care team, which likely reflects the predominantly White racial composition of the workforce including across role type in the ED. White patients at these EDs were far more likely to share a race with at least one of their clinicians simply because more clinicians were White—meaning their not completely discordant classification may reflect structural workforce demographics rather than any meaningful patientclinician relationship dynamic. LIMITATIONS Limitations in this research include the lack of data on discordant White patient-clinician relationships, with only 7 White participants (2.2%) having had an encounter where no clinician on their care team was also White. This highlights an important area for future research to better understand the
Gonzales et al.
impact of racial concordance for all racial groups. Second, data were limited to one large academic center over a limited time frame, and the results may not be generalizable and reflect broader, overall ED care. Third, experience ratings were skewed, and the lowest categories contained few observations, resulting in a low events-per-parameter ratio in the ordinal regression. These small cell sizes may reduce the stability of the adjusted model estimates. Fourth, our definition of racial concordance does not account for how much time each clinician spent with the patient, which was not collected as part of our study. This definition may overlook. clinicians who were not the first or last in their role but still interacted with the patient during the encounter. As a result, there may be substantial heterogeneity in who is classified as “racially concordant.” Selection bias may also be present given the discrepancy between those who received the survey and those who completed the study question. While the response rate (14.5%) is in line with response rates to other short message service-based surveys, it may reflect patient concerns about spam messages or characteristic differences between responders and nonresponders that could not be assessed with this study’s data. Additionally, we used first and last clinician abstracted from the EHR, excluding triage clinician, but we could not account for instances where additional clinicians were involved in a patient’s care. Finally, the robustness of key findings should be interpreted cautiously. The primary unadjusted result (P = .014) was derived from a Wilcoxon rank-sum test on the full ordinal scale; when satisfaction was dichotomized into low versus high ratings, the difference between NCD and discordant groups was no longer statistically significant (P = .12). This sensitivity analysis suggests the result was driven by subtle distributional differences across the rating scale rather than a large or robust group difference and underscores the need for replication in
Table 2. Ordinal logistic regression for concordance and effect of race on the primary outcome. 95% CI Predictor
Adjusted Odds Ratio (OR)
Lower
Upper
P value
0.69
0.40
1.17
.17
Positive
1.21
0.66
2.21
.54
Negative
0.16
0.09
0.30
< .001
No response
0.92
0.36
2.32
.85
0.82
0.57
1.19
.30
Black
1.31
0.74
2.31
.35
Asian
1.26
0..52
3.05
.61
Other
0.75
0.31
1.84
.53
1.01
1.00
1.02
.03
Not complete discordance (Reference: Complete discordance) Perceived effect of race on care (Reference: No perceived impact) Female sex (Reference: Male) Race (Reference: White)
Age (per year)
Western Journal of Emergency Medicine
1682
Volume 27, No. 6: November 2026
Gonzales et al.
Effects of Racial Concordance and Perceived Racism on ED Patient Satisfaction
larger samples. Future directions include focusing on the relevance of racial concordance not only on experience data, but on patient health outcomes, both in an ED and in a longitudinal outpatient setting. Research is also needed to further explore the relationship between patient-clinician concordance and experience ratings in the ED.
2013;103(11):e55-e62. 6. Corbie-Smith G, Thomas SB, Williams MV, et al. Attitudes and beliefs of African Americans toward participation in medical research. J Gen Intern Med. 1999;14(9):537-546. 7. Jacobs EA, Rolle I, Ferrans CE, et al. Understanding African Americans’ views of the trustworthiness of physicians. J Gen Intern
CONCLUSION Including perception of racial bias on health surveys is an important metric affecting patient satisfaction. Furthermore, the presence of racial concordance itself is not a simple solution; instead, it is a complex yet significant predictor of patient satisfaction. More research on the interplay of these factors in diverse patient-clinician populations is needed to help inform policies focused on furthering health equity.
Med. 2006;21(6):642. 8. Gornick ME, Eggers PW, Reilly TW, et al. Effects of race and income on mortality and use of services among Medicare beneficiaries. N Engl J Med. 1996;335(11):791-799. 9. Chapman EN, Kaatz A, Carnes M. Physicians and implicit bias: how doctors may unwittingly perpetuate health care disparities. J Gen Intern Med. 2013;28(11):1504-1510. 10. Beach MC, Saha S, Park J, et al. Testimonial injustice: linguistic bias in the medical records of Black patients and women. J Gen Intern Med. 2021;36(6):1708-1714. 11. Sun M, Oliwa T, Peek ME, et al. Negative patient descriptors:
Address for Correspondence: Anish K. Agarwal, MD, MPH, MS, University of Pennsylvania, Perelman School of Medicine, Department of Emergency Medicine, 3400 Spruce Street, Philadelphia, PA 19104. Email: Anish.Agarwal@pennmedicine. upenn.edu.
documenting racial bias in the electronic health record. Health Aff (Millwood). 2022;41(2):203-211. 12. Sabin JA, Nosek Brian A, Greenwald AG, et al. Physicians’ implicit and explicit attitudes about race by MD race, ethnicity, and gender. J
Conflicts of Interest: By the WestJEM article submission agreement, all authors are required to disclose all affiliations, funding sources and financial or management relationships that could be perceived as potential sources of bias. Funding was provided by the Leonard Davis Institute, University of Pennsylvania. No other author has professional or financial relationships with any companies that are relevant to this study. There are no other conflicts of interest or sources of funding to declare. Copyright: © 2026 Gonzales et al. This is an open access article distributed in accordance with the terms of the Creative Commons Attribution (CC BY 4.0) License. See: http://creativecommons.org/ licenses/by/4.0/
Health Care Poor Underserved. 2009;20(3):896-913. 13. Maina IW, Belton TD, Ginzberg S, et al. A decade of studying implicit racial/ethnic bias in healthcare providers using the implicit association test. Soc Sci Med. 2018;199:219-229. 14. LaVeist TA, Nuru-Jeter A, Jones KE. The association of doctorpatient race concordance with health services utilization. J Public Health Policy. 2003;24(3):312-323. 15. Chen FM, Fryer GE, Phillips RL, et al. Patients’ beliefs about racism, preferences for physician race, and satisfaction with care. Ann Fam Med. 2005;3(2):138-143. 16. King WD, Wong MD, Shapiro MF, et al. Does racial concordance between HIV-positive patients and their physicians affect the time to receipt of protease inhibitors? J Gen Intern Med. 2004;19(11):1146-1153.
REFERENCES
17. Agarwal AK, Sagan C, Gonzales R, et al. Assessing experiences of racism among Black and White patients in the emergency
1. Bhopal R. Spectre of racism in health and health care: lessons from
department. J Am Coll Emerg Physicians Open. 2022;3(6):e12870.
history and the United States. BMJ. 1998;316(7149):1970-1973. 2. Belluz J. We finally have a new US maternal mortality estimate. It’s
18. Ku L, Vichare A. The association of racial and ethnic concordance in
still terrible. Vox. January 30, 2020. Accessed July 5, 2020. https://
primary care with patient satisfaction and experience of care. J Gen Intern Med. 2023;38(3):727-732.
www.vox.com/2020/1/30/21113782/pregnancy-deaths-us-maternal-
19. Takeshita J, Wang S, Loren AW, et al. Association of racial/ethnic and
mortality-rate
gender concordance between patients and physicians with patient
3. Papanicolas I, Niksch M, Wei J, et al. Racial disparities in premature
experience ratings. JAMA Netw Open. 2020;3(11):e2024583.
mortality and unrealized Medicare benefits across US states. JAMA
20. Shen MJ, Peterson EB, Costas-Muñiz R, et al. The effects of race
Health Forum. 2025;6(11):e254916.
and racial concordance on patient-physician communication: a
4. Cunningham TJ. Vital signs: racial disparities in age-specific mortality
systematic review of the literature. J Racial Ethn Health Disparities.
among Blacks or African Americans — United States, 1999–2015.
2018;5(1):117-140.
Morb Mortal Wkly Rep. 2017;66.
21. Ho AF, Zhou Y, Kirby JJ, et al. Causal effect analysis of demographic
5. Cuffee YL, Hargraves JL, Rosal M, et al. Reported racial discrimination, trust in physicians, and medication adherence among
concordance of physician trust and respect in an emergency care
inner-city African Americans with hypertension. Am J Public Health.
setting. Open Access Emerg Med OAEM. 2021;13:503-509.
Volume 27, No. 6: November 2026
1683
Western Journal of Emergency Medicine
Brief Research Report
Assessment of Combined Food and Nutrition Insecurity Screening in the Emergency Department: A Brief Report Marco Santos Esteban, BS* Jolie Minh-Trang Nguyen, BS* Ian Dennis Capo Olliffe, BS*† Bharath Chakravarthy, MD, MPH* Victor Cisneros MD, MPH‡
*University of California, Irvine, Department of Emergency Medicine, Irvine, California † University of California San Diego School of Medicine, San Diego, California ‡ Eisenhower Health, Department of Emergency Medicine, Rancho Mirage, California
Section Editor: Cortlyn Brown, MD Submission history: Submitted April 2, 2026; Revision received July 3, 2026; Accepted July 6, 2026 Electronically published October 13, 2026 Full text available through open access at http://escholarship.org/uc/uciem_westjem DOI 10.5811/westjem.64320
Introduction: Emergency department (ED) food insecurity (FI) screening traditionally identifies insufficient access to food but does not account for diet quality. We evaluated the incremental yield of adding a nutrition insecurity (NI) screener to routine FI screening. Methods: This single-center observational study enrolled adult ED patients from April–September 2025. Participants completed the 2-item Hunger Vital Sign and a 1-item NI screener. Our primary measure was incremental yield of NI screening beyond FI screening, defined by the number of NI-positive/FI-negative patients identified. Secondary outcome measures included FI and NI prevalence, screening concordance, and number needed to screen. Screening fidelity was supported through structured training of research associates and standardized phrasing. Results: Of 1,120 patients, 13.6% (95% CI, 11.6–15.7%) screened positive for FI and 11.4% (95% CI, 9.7–13.5%) for NI. While the measures showed substantial agreement (κ = 0.67), they identified significantly different populations (McNemar P = .01). Specifically, 28 patients (2.5%) screened NIpositive but FI-negative, yielding an 18.4% relative increase in identified at-risk patients compared to only screening for FI. Conclusion: Dual screening identified a clinically relevant NI-only subgroup whose dietquality barriers were not captured by FI screening alone. Incorporating NI into ED social needs assessments may improve identification of diet-related risk and guide medically tailored interventions. [West J Emerg Med. 2026;27(6)1684–1688.]
INTRODUCTION Diet-sensitive chronic diseases frequently precipitate emergency department (ED) visits, yet routine food insecurity (FI) screening using tools such as the 2-item Hunger Vital Sign primarily captures limited or uncertain access to sufficient food rather than diet quality.1,2 Nutrition insecurity (NI) screening extends beyond traditional FI screening to assess nutritional quality, capturing barriers to accessing healthy, nutrient-dense foods.2 Previous community-based screenings have suggested that using both FI and NI screeners can identify individuals at highest risk for poor diet and health outcomes better than either Western Journal of Emergency Medicine
alone.3 However, the incremental value of combined FI+NI screening in the ED remains unexamined. We implemented a dual FI+NI screening workflow to estimate the prevalence of FI and NI, and to quantify the incremental yield of NI screening among FI-negative patients. We hypothesized that adding a brief NI screener would identify a distinct NI-only subgroup not captured by FI alone, consistent with prior evidence outside the ED.3 Identifying NI would serve to address diet-sensitive chronic conditions commonly driving ED visits through better informed ED discharge counseling, referral decisions, and targeted linkage 1684
Volume 27, No. 6: November 2026
Esteban et al.
Assessment of Combined Food and Nutrition Insecurity Screening in the ED
to “food is medicine” interventions for patients.4 Produce prescriptions, which address barriers to food quality rather than quantity, represent one such intervention; a multisite evaluation of nine programs in low-income communities demonstrated clinically meaningful improvements in glycated hemoglobin, blood pressure, and body mass index among adults with poor cardiometabolic health, underscoring the patient-oriented benefit of identifying the NI-only subgroup that FI screening alone would miss.5
Population Health Research Capsule What do we already know about this issue? Food insecurity screening identifies limited access to food but may miss diet-quality barriers. Nutrition insecurity screening is a promising tool to address this. What was the research question? Does nutrition insecurity screening identify a meaningful population of emergency department patients missed by food insecurity screening?
METHODS The primary research question was whether adding a brief NI screening item to standard FI screening would identify an additional subgroup of ED patients with diet-quality barriers who would not be detected by FI screening alone. Screening This single-center, observational cross-sectional study was conducted at a large, urban, academic emergency department with approval from the University of California, Irvine Institutional Review Board (Protocol #2017-4029). Research associates (RA) were scheduled in 4-hour shifts from 8:00 ᴀᴍ to 12:00 ᴀᴍ daily from April to September 2025, during which all data were collected. Participants were recruited using a convenience sampling strategy during RA coverage hours. Eligible participants were adults (18 years of age and older) who spoke English or Spanish. For Spanishspeaking participants, bilingual RAs provided oral translation and delivery of questionnaire items. Exclusion criteria included individuals from protected populations (pregnant, psychiatric emergency, or incarcerated) and those who spoke languages other than English or Spanish. Screenings for participant eligibility were conducted by RAs after triage using the secure electronic health record (EHR) (Epic Systems Corporation) platform. After confirming eligibility, RAs approached patients at their convenience and without delaying clinical care to administer a dual screening survey. The survey consisted of the two-item Hunger Vital Sign questionnaire to screen for FI and a single preliminary NI screening question from the Household Nutrition Security measure developed by Calloway et al.1,6 The Household Nutrition Security measure was selected for its brevity compared with alternative nutrition security measures. Specifically, the N1 question was selected as the screening question: “In the last 12 months, (I/we) had to eat some foods that were not good for my health and well-being because (I/we) couldn’t get other types of food.” Participants who responded “sometimes,” “often,” or “always” on a standardized 5-point Likert frequency scale ranging from “Never” to “Always” were registered as experiencing NI. All RAs used standardized scripts when delivering the survey with periodic fidelity checks. Individuals identified as experiencing FI and/or NI were provided a printed food assistance guide detailing local food pantries and supplemental community resources. Volume 27, No. 6: November 2026
What was the major finding of the study? Nutrition insecurity screening identified a meaningful separate population of patients missed by food insecurity screening (2.5%; 95% CI, 1.7–3.6%); McNemar χ2 = 6.61; P = .01. How does this improve population health? Dual screening identifies additional patients with diet-quality barriers, enabling targeted nutrition interventions and improved health equity.
Statistics We calculated prevalence estimates for FI and NI with 95% CIs. Participants were stratified into four mutually exclusive groups: FI-only, NI-only, concurrent FI and NI, or neither. Screening concordance was assessed using the Cohen kappa coefficient. We used the McNemar chi-squared test to analyze discordant cases (FI-only vs NI-only) to determine whether the two tools identified significantly different unique populations. The incremental yield of NI screening was defined as the percentage increase in at-risk individuals identified beyond the baseline FI-positive group (NI-only cases divided by total FI-positive cases). The number needed to screen to determine one new at-risk patient was calculated as the total sample size divided by the number of NI-only cases. Statistical significance was set at P < .05. Eligible adults (18 years of age or older) who spoke English or Spanish were screened using the Hunger Vital Sign FI and a 1-item NI question. Patients were classified as FI and/ or NI if they provided any positive response to the FI items or selected “always,” “sometimes,” or “often” for the NI item, and they were subsequently eligible for study enrollment. All other participants were considered food/nutrition secure and excluded from enrollment, study of ED-based dual screening for food and nutrition insecurity among adult patients.
1685
Western Journal of Emergency Medicine
Assessment of Combined Food and Nutrition Insecurity Screening in the ED RESULTS Of 1,120 screened patients, mean age was 51.7 (21.9) years and 47.4% were female. Of these patients, 152 participants (13.6%; 95% CI, 11.6–15.7%) screened positive for FI and 128 (11.4%; 95% CI, 9.7–13.5%) for NI (Table). While the two measures showed substantial agreement (Cohen κ = 0.67; 95% CI, 0.61–0.74), the McNemar test confirmed they identified significantly different populations (McNemar χ2 = 6.61, P = .01). Specifically, while 52 patients (4.6%) were identified only by the FI screener, 28 patients (2.5%) were identified only by the NI screener. These 28 NI-only patients represent an 18.4% incremental yield to detect at-risk individuals who would have been missed by standard FI screening alone. The number needed to screen to identify one such unique NI-positive patient was 40. DISCUSSION This study demonstrates that a combined FI and NI screening protocol in the ED identifies a meaningful population of at-risk individuals who would be missed by FI screening alone. Among 1,120 patients screened in the ED, 13.6% screened positive for food insecurity, and 11.4% for nutrition insecurity. As expected due to the intertwined nature of FI and NI, substantial agreement (κ = 0.67) was observed between the measures. However, the McNemar test (P = .01) confirmed that the NI screener identifies a distinct clinical subgroup. Consequently, the 28 patients (2.5%) identified exclusively by NI screening represent a meaningful 18.4% incremental yield in detecting at-risk patients beyond traditional food insecurity screening. This NI-only subgroup includes patients who reported having enough food but still face structural barriers to nutritious options, such as living in low-access food areas or being unable to afford fresh produce.7, 8 These barriers can limit diet quality and make it more difficult to manage dietsensitive chronic disease.9 Poor diet quality is estimated to
Table. Summary of screening outcomes for food insecurity and nutrition insecurity among emergency department patients (N = 1,120). Screening Outcome
n (%)
95% Confidence Interval
Food insecurity (FI) positive
152 (13.6%)
11.6–15.7
Nutrition insecurity (NI) positive
128 (11.4%)
9.7–13.5
FI only
52 (4.6%)
3.5–6.1
NI only
28 (2.5%)
1.7–3.6
Both FI and NI
100 (8.9%)
7.4–10.8
Neither FI nor NI
940 (83.9%)
81.6–86.0
κ = 0.67 (95% CI, 0.61–0.74); McNemar χ2 = 6.61, P = .01.
Western Journal of Emergency Medicine
Esteban et al.
Figure. Flowchart of emergency department dual screening protocol in a study evaluating the incremental yield of adding a nutrition insecurity screener to routine food insecurity screening. ED, emergency department; 51/50, Section 5150 of the California Welfare and Institutions Code allowing a clinician to place a person on an involuntary 72-hour psychiatric hold.
contribute to 45% of US cardiometabolic deaths and is a primary driver of conditions including diabetes, hypertension, and heart failure—conditions that commonly precipitate ED visits and are worsened by dietary nonadherence.10 Nutritional insecurity screening therefore has direct ED relevance because identifying this subgroup opens a pathway to tailored interventions, such as produce prescriptions, which bypass logistical and financial hurdles and have been demonstrated to lead to improved health status and clinically related outcomes, as seen in an evaluation including adults with poor cardiometabolic health.5 Without such targeted screening, these structural barriers remain undetected, missing an opportunity for personalized linkage to care. This novel and preliminary study provides a baseline for the utility of dual FI and NI screening in the ED using a simple screening tool. However, further work is necessary to explore the feasibility of NI in this setting and an optimized intervention. In routine ED practice, NI screening would likely be most actionable if incorporated into existing intake, triage, or social-needs screening workflows and documented in a structured EHR field. A positive NI screen could trigger a visible chart flag, best-practice advisory, or discharge-planning prompt that links clinicians to standardized response options, such as social work consultation, printed after-visit resources, community food program referrals, produce prescription programs, or medically tailored grocery programs.11,12 To minimize clinician burden, these pathways should rely on structured documentation, automated resource generation, and clear referral criteria rather than requiring clinicians to independently identify and address each positive screen. Additionally, further demographic characterization of this subgroup is essential for health equity. While racial and ethnic
1686
Volume 27, No. 6: November 2026
Esteban et al.
Assessment of Combined Food and Nutrition Insecurity Screening in the ED
disparities in food insecurity are well-established, it remains unknown whether NI follows similar patterns or affects distinct demographic groups facing unique barriers.13 Clarifying these associations will allow health systems to implement culturally sensitive interventions. Furthermore, given recent instability in federal food assistance, such as the Supplemental Nutrition Assistance Program and the Local Food Assistance Program, and the resulting strain on vulnerable communities, establishing efficient ED screening protocols is urgent to ensure at-risk patients are identified and linked to stabilizing resources.14, 15
nutritional insecurity. Beyond expanded detection, NI screening distinguishes between limitations in food quantity and deficits in diet quality. This differentiation presents an opportunity to provide better-tailored medical interventions focused on food quality, such as produce prescriptions, to a targeted patient population in the ED. Future efforts should prioritize integrating this brief screener into the electronic health record and pairing it with appropriate intervention and follow-up.
LIMITATIONS This study has several limitations. First, the reliance on convenience sampling and restriction to English and Spanish speakers introduces selection bias, in addition to social desirability bias due to RA-administered surveys. Additionally, the RAs did not track the total number of eligible patients who were not approached, limiting our ability to report the proportion of all ED patients surveyed for FI and NI. The study’s scope was also limited to adults (18 years of age or older). Together, these methodological constraints limit the generalizability of our findings to the broader ED population and may have influenced FI and NI estimates by under-representing patients who presented outside enrollment hours, were missed during high-volume periods, or faced language barriers. Second, we used item N1 (“In the last 12 months, we had to eat some foods that were not good for our health...”) rather than the recommended screener item N3. In the original development study, item N3 was specifically selected for its high sensitivity (93%) in identifying at-risk households. However, item N1 was selected since it was a stronger indicator of the Household Nutrition Security construct and its wording directly captures access-related barriers to consuming healthful foods more closely than item N3.6 It should be noted that item N1 is not validated in an ED setting, an important limitation. Additionally, while using N1 prioritized construct validity in NI screening, it was not optimized for maximum screening sensitivity, suggesting that our reported prevalence (11.4%) may represent a conservative estimate of the true burden of nutrition insecurity.3, 5 Further, the variability in administration format (tablet vs verbal) may have influenced response accuracy; specifically, the reduced privacy of verbal screening compared to selfadministration may have elicited social desirability bias, potentially leading to the underreporting of both food and nutrition insecurity.16 Lastly, no downstream clinical outcomes or resource utilization were examined following screening.
Address for Correspondence: Victor Cisneros, MD, MPH, Eisenhower Health, Department of Emergency Medicine, 39000 Bob Hope Dr, Rancho Mirage, CA 92270. Email: victor.m.cisneros@gmail.com. Conflicts of Interest: By the WestJEM article submission agreement, all authors are required to disclose all affiliations, funding sources and financial or management relationships that could be perceived as potential sources of bias. No other author has professional or financial relationships with any companies that are relevant to this study. There are no other conflicts of interest or sources of funding to declare. Copyright: © 2026 Esteban et al. This is an open access article distributed in accordance with the terms of the Creative Commons Attribution (CC BY 4.0) License. See: http://creativecommons.org/ licenses/by/4.0/
REFERENCES
CONCLUSION This preliminary study demonstrates the added benefit of a dual FI+NI screening protocol in the emergency department, which identified a subset of patients struggling only with Volume 27, No. 6: November 2026
1687
1. Atoloye AT, Tayie F, Olasoji SO. Disparities in diet quality and food security across ethnic-immigration status and US nativity. J Racial Ethn Health Disparities. 2026;13(3):2378-2390. 2. Beaulac J, Kristjansson E, Cummins S. A systematic review of food deserts, 1966-2007. Prev Chronic Dis. 2009;6(3):A105. 3. Brandt EJ, Mozaffarian D, Leung CW, et al. Diet and food and nutrition insecurity and cardiometabolic disease. Circ Res. 2023;132(12):1692-1706. 4. Byker Shanks C, Gordon NP. Screening for food and nutrition insecurity in the healthcare setting: a cross-sectional survey of non-Medicaid insured adults in an integrated healthcare delivery system. J Prim Care Community Health. 2024;15:21501319241258948. 5. Calloway EE, Carpenter LR, Gargano T, et al. Development of new measures to assess household nutrition security, and choice in dietary characteristics. Appetite. 2022;179:106288. 6. Calloway EE, Coakley KE, Carpenter LR, et al. Benefits of using both the Hunger Vital Sign and brief nutrition security screener in health-related social needs screening. Transl Behav Med. 2024;14(8):445-451. 7. Cisneros V, Olliffe IDC, Esteban MS, et al. Feasibility of an emergency department-based food insecurity screening and referral
Western Journal of Emergency Medicine
Assessment of Combined Food and Nutrition Insecurity Screening in the ED
Esteban et al.
security in the US. JAMA. 2021;325(16):1605-1606.
program. West J Emerg Med. 2025;26(3):396-405.
13. Oddo VM, Leider J, Tovar A, et al. Food insecurity and risk of nutrition
8. First Nations Development Institute. The face of disruption: impacts of USDA funding cuts on tribal food systems. 2025.
insecurity among Supplemental Nutrition Assistance Program
Available at: https://www.firstnations.org/news/the-face-of-
participants in Rhode Island and Connecticut, USA. Prev Med Rep. 2025;51:103002.
disruption-impacts-of-usda-funding-cuts-on-tribal-food-systems/.
14. Rockefeller Foundation. True cost of food: measuring what matters
Accessed August 24, 2026. 9. Hager ER, Quigg AM, Black MM, et al. Development and validity of a
to transform the U.S. food system. 2021. Available at: https://www.
2-item screen to identify families at risk for food insecurity. Pediatrics.
rockefellerfoundation.org/reports/true-cost-of-food-measuring-what-
2010;126(1):e26-e32
matters-to-transform-the-u-s-food-system/. Accessed August 24, 2026.
10. Hager K, Du M, Li Z, et al. Impact of produce prescriptions on diet, food security, and cardiometabolic health outcomes: a multisite
15. Rottapel R, Sheward R. The Hunger Vital Sign: best practices for
evaluation of 9 produce prescription programs in the United States.
screening and intervening to alleviate food insecurity. 2016. Available
Circ Cardiovasc Qual Outcomes. 2023;16(9):e009520.
at: https://childrenshealthwatch.org/wp-content/uploads/CHW_HVS_ whitepaper_FINAL.pdf. Accessed August 24, 2026.
11. Mozaffarian D. Measuring and addressing nutrition security to achieve health and health equity. 2023. Available at: https://www.
16. Santos M. School lunches might look different this year: federal
healthaffairs.org/content/forefront/health-policy-brief-measuring-and-
funding freezes pinch school food programs. 2025. Available at:
addressing-nutrition-security. Accessed August 24, 2026.
https://ofrf.org/news/school-lunches-might-look-different-this-year/. Accessed August 24, 2026.
12. Mozaffarian D, Fleischhacker S, Andrés JR. Prioritizing nutrition
Western Journal of Emergency Medicine
1688
Volume 27, No. 6: November 2026
Review Emergency Department-Centered Digital Health Transformation: Narrative Review and Three-Pillar Implementation Framework Sarah Sossong, MPH †o Aline Kalaydjian, MD*†o Sarah Pletcher, MD, MHCDS*†‡ Christopher Ziebell, MD§|| Ngoc-Anh A. Nguyen, MD*†‡§||
*Houston Methodist Hospital, Center for Connected Care Innovation and Implementation-Research, Houston, Texas † Houston Methodist Hospital, Houston Methodist Research Institute, Houston, Texas ‡ Houston Methodist Hospital, Department of Surgery, Houston, Texas § Houston Methodist Hospital, Department of Medicine, Houston, Texas || US Acute Care Solutions, Canton, Ohio o Co-first authors
Section Editor: N/A Submission history: Submitted July 21, 2026; Revision received August 13, 2026; Accepted August 13, 2026 Electronically published October 27, 2026 Full text available through open access at http://escholarship.org/uc/uciem_westjem DOI 10.5811/westjem.66747
Introduction: Emergency departments (EDs) face escalating pressures from rising patient volumes, workforce shortages, and documentation burdens. Digital health technologies have shown promise individually, but most are implemented in isolation, limiting their collective impact. This narrative review synthesizes evidence for six digital health technologies applicable to the ED and proposes a three-pillar framework for their coordinated implementation, positioning the ED as a convergence point for health system digital transformation. Methods: We searched PubMed and Google Scholar for peer-reviewed literature published from 2018 through July 2026 on ambient artificial intelligence (AI) documentation, telehospitalist programs, virtual nursing, remote patient monitoring, virtual specialty consultation, and postdischarge transitional care, prioritizing systematic reviews and meta-analyses. Fifty-one sources met inclusion criteria and were synthesized. We organized the technologies into three functional pillars: streamlining clinical workflows; expanding workforce capacity; and extending continuity of care. Outcomes included clinical, operational, and implementation measures. Experience from Houston Methodist, a nine-hospital health system, is presented as an illustrative example separate from the literature synthesis. Results: Of the 51 sources, 23 (45.1%) addressed streamlining clinical workflows, 16 (31.4%) expanding workforce capacity, and 12 (23.5%) extending continuity of care. Overall, 22 (43.1%) were ED-specific: 10, five, and seven within the respective pillars. Ambient AI documentation included 13 sources (seven ED-specific); telestroke included one ED-specific source. Evidence maturity varied by technology and setting. In non-ED settings, meta-analyses reported shorter documentation time with ambient AI documentation (standardized mean difference, -0.72; 95% CI, -0.99 to -0.45), lower hospital mortality with tele-intensive care (risk ratio, 0.74; 95% CI, 0.58-0.96), and lower odds of 30-day readmission with low-complexity post-discharge interventions (odds ratio [OR], 0.78; 95% CI, 0.66-0.92). Emergency department-specific evidence remained largely observational; one metaanalysis showed no mortality difference with telestroke (OR, 1.16; 95% CI, 0.94-1.43), while one systematic review found no demonstrable benefits from telephone follow-up post-ED discharge. Conclusion: Current evidence supports individual digital health technologies in and around the ED. Based on implementation science principles and institutional experience, we propose that coordinated implementation across the three pillars may offer advantages over isolated deployments, a hypothesis warranting prospective comparative evaluation. [West J Emerg Med. 2026;27(6)1689–1702.]
Volume 27, No. 6: November 2026
1689
Western Journal of Emergency Medicine
ED Digital Health Transformation: Review and Three-Pillar Implementation INTRODUCTION Emergency departments (EDs) occupy a unique position at the intersection of acute care delivery and health system operations, serving as both safety nets for urgent medical needs and potential launch points for comprehensive care coordination. Mounting operational pressures contribute to prolonged boarding, delayed specialist access, and fragmented postdischarge follow-up. These challenges have important consequences for community health outcomes, disproportionately affecting patients with limited access to primary care who depend on the ED as their principal point of contact with the health system. Coordinated digital transformation may offer a systems-level response, improving care delivery for individual patients and the broader communities EDs serve. Emergency medicine (EM) continues to experience substantial workforce strain, including workforce shortages,1 documentation burden,2 and clinician well-being concerns.3 Burnout remains high among emergency physicians, with rates approaching 60%,4 reflecting cumulative pressures from clinical demands, shift work, documentation burdens, and administrative complexity.4,5 Studies project a growing shortfall in physician supply concurrent with increasing care demands from aging populations.6-8 Effective solutions require coordinated interventions across workflow optimization, technology integration, and organizational support, because clinician wellbeing directly impacts patient safety and care quality.9 The COVID-19 pandemic demonstrated rapid adoption of virtual care technologies, dismantling long-standing barriers to telemedicine integration,10 and illustrating how digital tools can enhance, rather than burden, clinical workflows, including in the ED.11 Patient acceptance of telehealth has grown in parallel, with improved convenience, broader access, and generally positive experiences.12 Emerging studies further highlight the potential of digital health technologies, including large language models and ambient artificial intelligence (AI), to improve documentation quality, reduce administrative burden, and enhance clinician satisfaction in emergency settings.13-15 Despite growing interest in digital health solutions for EM,16 prior ED-specific literature has predominantly evaluated individual technologies or narrowly defined applications, including ambient documentation,17,18 broader AI applications,19-21 digital decision tools,22,23 and telemedicine.24-30 Broader evidence syntheses have examined digital transformation at the hospital or health-system level, with limited focus on ED-specific implementation.31-33 Coordinated implementation of multiple digital technologies in the ED remains largely unexplored. The present review extends this literature by proposing the ED as a convergence point where multiple technologies can be integrated through a coordinated implementation framework. We address three specific aims: (1) to synthesize current evidence on key digital health technologies applicable to ED settings, including ambient AI documentation, virtual nursing, Western Journal of Emergency Medicine
Sossong et al.
telehospitalists, remote patient monitoring, virtual specialty consultation, and postdischarge transitional care; (2) to describe implementation frameworks and success factors for coordinated digital transformation within EDs; and (3) to identify evidence gaps and future research priorities for advancing this field. To complement the published literature with illustrative evidence, we present implementation experience from Houston Methodist, a nonprofit health system with nine hospitals, including a flagship academic medical center in the Texas Medical Center. METHODS We identified relevant literature through targeted searches of PubMed and Google Scholar covering peer-reviewed literature published from 2018 through July 2026. Searches combined keywords related to emergency medicine (such as “emergency department” and “emergency medicine”) and digital health technologies (such as “digital health,” “digital transformation,” “ambient AI,” “telehospitalist,” “virtual nursing,” “remote patient monitoring,” and “transitional care intervention”), using Boolean (AND/OR) operators. Sources were included if they evaluated digital health technologies, were conducted in the ED setting or had potential applicability to the ED, and were peer-reviewed original research, systematic reviews, meta-analyses, scoping reviews, and implementation studies or reports. We excluded sources if they evaluated digital health technologies without applicability to the ED or were conference abstracts without full-text availability. Two members of the study team reviewed identified sources against the inclusion and exclusion criteria, with eligibility and inclusion decisions made collaboratively through discussion. When available, systematic reviews and meta-analyses were prioritized over individual primary studies to synthesize the evidence. Reference lists of identified articles were reviewed to identify additional relevant publications. Of 125 sources reviewed, we included 51. Included sources were categorized by digital health technology and synthesized according to clinical setting (ED vs non-ED) and reported outcome domain, including clinical, operational, and implementation outcomes. We chose this narrative approach over systematic review due to the heterogeneous nature of interventions and outcomes across studies, which precluded meaningful meta-analysis. Institutional implementation experience, developed through iterative Plan-Do-Study-Act cycles, was incorporated as an illustrative case example and was not considered part of the literature synthesis. Because these activities were conducted as operational quality improvement initiatives, they did not constitute human subjects research requiring institutional review board approval. RESULTS Digital Health Technologies in Emergency Medicine Health systems nationwide have implemented diverse
1690
Volume 27, No. 6: November 2026
Sossong et al.
ED Digital Health Transformation: Review and Three-Pillar Implementation
Figure 1. The emergency department as a convergence point for coordinated digital health transformation: a three-pillar framework. AI, artificial intelligence.
interventions to address documentation efficiency, clinician well-being, workforce capacity, and continuity of care.9,15 We organized the evidence around three functional pillars: streamlining clinical workflows; expanding workforce capacity; and extending continuity of care (Figure 1). Of the 51 included sources, 23 (45.1%) addressed streamlining clinical workflows, 16 (31.4%) expanding workforce capacity, and 12 (23.5%) extending continuity of care. Overall, 22 (43.1%) sources were ED-specific: 10, 5, and 7 within the respective pillars. Ambient AI documentation was the most represented technology with 13 sources, including seven ED-specific sources, while telestroke included one ED-specific source. Table 1 summarizes the evidence base, key outcomes, and limitations for each technology reviewed. Pillar 1: Streamlining Clinical Workflows Ambient Artificial Intelligence Documentation Ambient AI documentation systems passively capture clinician-patient conversations and generate structured, electronic health record (EHR)-compatible notes. Recent systematic reviews of AI-powered documentation reported shorter documentation time (standardized mean difference [SMD], -0.72; 95% CI, -0.99 to -0.45),34 particularly for complex cases,35 but emphasized the need for continued evaluation of patient outcomes34 and documentation quality,34,35 given hallucinated37 and omitted content.35 Adoption was also associated with reduced work exhaustion (mean difference [MD], -0.44 points; 95% CI, -0.62 to -0.25).36 In a randomized trial, both DAX and Nabla AI scribes improved well-being (Mini-Z score differences, 2.83 [95% CI, 1.28-4.37] and 2.69 [95% CI, 1.14-4.23], respectively); DAX Volume 27, No. 6: November 2026
also reduced task load (MD, -39.9; 95% CI, -71.9 to -7.9).37 A multisite study showed 13.4 fewer EHR minutes per eight scheduled patient-hours (95% CI, 9.1-17.7) and 0.49 additional weekly visits (95% CI, 0.17-0.81).38 Large-scale implementation of more than 2.5 million uses highlighted continued improvements in clinician satisfaction and workflow efficiency.15 Emergency department-specific evidence remains comparatively limited, reflecting recent adoption. In a retrospective study, ambient AI use was associated with shorter median on-shift documentation time (165 [interquartile range (IQR), 97-250] vs 230 [IQR, 142-365] seconds; 28% reduction) and total EHR time (519 [IQR, 349-751] vs 621 [IQR, 412-914] seconds; 16% reduction).39 In a simulation study, AI note editing was faster than dictation (75 vs 125 seconds; 39% reduction; P < .001).40 Documentation generated by large language models was generally accurate, although errors and clinically relevant omissions remained.41 Emergency physicians generally viewed AI and ambient documentation positively,42,43 with 71.4% reporting improved documentation efficiency (95% CI, 45.4%88.3%)44 and participants in a crossover evaluation reporting preserved note quality.45 Telehospitalist Integration Telehospitalist programs provide remote access to hospitalist expertise. Across inpatient settings, studies demonstrated feasibility,46-48 scalability,48,49 and sustainability.50 Integration reduced outside transfers from the ED (16.6% vs 10.5%; P < .001) and transfers at any time (17.3% vs 11.9%; P < .001).51 A retrospective comparison with traditional locum hospitalist care found no significant differences in length of stay (LOS) (mean [standard deviation (SD)], 2.82 [2.49] vs 2.55
1691
Western Journal of Emergency Medicine
ED Digital Health Transformation: Review and Three-Pillar Implementation
Sossong et al.
Table 1. Summary of evidence for digital health technologies in non-emergency department (ED) and ED settings in a review synthesizing evidence for six digital health technologies applicable to the ED. Three-Pillar Framework Pillar 1: Streamlining Clinical Workflows (n = 23; ED = 10)
Pillar 2: Expanding Workforce Capacity (n = 16; ED = 5)
Technology
ED Use Case
Evidence in Non-ED Settings
Evidence in ED Settings
Key Limitations
Ambient AI documentation (n = 13; ED = 7)
Automated note generation from clinicianpatient conversations
SR/MA: reduced documentation time (Zhao 2026; Bracken 2025) RCT: improved well-being and reduced task load (Lukac 2025). Reduced work exhaustion (Afshar 2025) Observational: decreased EHR time, increased weekly visit volume (Rotenstein 2026) Implementation studies: >2.5M uses with improved clinician satisfaction and workflow efficiency (Tierney 2025)
Observational: reduced documentation and total EHR time (Preiksaitis 2026). Generally accurate documentation (Williams 2025). Positive physician perceptions (Shy 2025; Alcázar-Peral 2026; Marquis 2026) Prospective: positive physician perceptions (Webb 2026) Simulation: faster than dictation (Lipinski 2026)
Hallucinations and omissions reported; continued evaluation of patient outcomes and documentation quality required; few controlled ED studies
Telehospitalist (n = 10; ED = 3)
Remote overnight physician coverage for ED admissions
Implementation studies: feasibility, scalability, and sustainability (Gutierrez 2021; Becker 2021; Hron 2020; Papo 2025; Papo 2025). Reduced transfers (Kuperman 2018). No difference in clinical outcomes with traditional locum hospitalist care (Boltz 2019). High satisfaction (Gutierrez 2021; Kuperman 2018; Boltz 2019)
Implementation studies: nocturnal programs: positive patient and care team experience (JaKa 2020). Multisite feasibility (Nguyen 2026) Observational: optimized bed utilization and safe discharges (Koch 2026)
Limited EDspecific evidence; observational designs
Virtual nursing (n = 7; ED = 1)
Remote support for admissions, discharges, education, and observation
Scoping review: supports admission, discharge, and care coordination workflows; positive experience (Bhaloo 2025) Integrative review: clearly defined roles and education (Whalen 2025) Observational: no difference in clinical outcomes (Savitz 2023) Implementation reports and study: clearly defined roles (Nguyen 2024). Bedside nurse engagement (Welsh 2025, Schuelke 2019)
Observational: shorter wait times, fewer interruptions, fewer incomplete documentation fields (Khairat 2025)
Primarily descriptive evidence; limited ED-specific evidence; bedside nurse engagement critical
Continuous RPM (n = 9; ED = 4)
Wearable vital sign surveillance for boarding ED patients
SR/MA: deployment feasibility and measurement validity (Leenen 2020). No differences in major events or complications, ICU admission, rapid response activation, LOS; varied mortality findings (Bowles 2024; Sun 2020; Areia 2021) Implementation report: multisite scalability (Nguyen 2026)
Feasibility study: deployment feasible and acceptable (Miller 2021) Validation study: RPM measurements strongly correlated with manual measurements (Garbern 2019) Predictive study: prediction of septic shock (Choi 2022) Prospective study: earlier detection of deterioration (Reed 2021)
No conclusive clinical outcome benefit; alarm optimization affects effectiveness; ED evidence limited to feasibility, validation, and predictive modeling
Western Journal of Emergency Medicine
1692
Volume 27, No. 6: November 2026
ED Digital Health Transformation: Review and Three-Pillar Implementation
Sossong et al. Table 1. Continued Three-Pillar Framework Pillar 3: Extending Continuity of Care (n = 12; ED = 7)
Technology
ED Use Case
Evidence in Non-ED Settings
Evidence in ED Settings
Key Limitations
Virtual specialty consultation (n = 5; ED = 3)
Remote subspecialist access (stroke, psychiatry, ICU)
SR/MA, tele-ICU: lower ICU mortality, hospital mortality, and ICU LOS (Chen 2018) SR, telepsychiatry: implementation feasibility (Schulte 2026)
SR/MA, telestroke: no difference in safety and clinical outcomes (Mohamed 2024) Scoping review, telepsychiatry: feasible, may reduce boarding (Shalev 2024) Observational, tele-ICU: lower in-hospital mortality among patients admitted to ICU (Kadar 2019)
Substantial program heterogeneity; telepsychiatry effectiveness evidence limited
Postdischarge transitional care (n = 7; ED = 4)
Virtual followup after ED discharge to reduce unplanned returns
SR/MA: reduced readmissions (Becker 2021; Tyler 2023; Sakashita 2025). Effects varied by intervention complexity (Tyler 2023)
Scoping review: Heterogeneous comprehension-focused transitional care interventions most effective interventions; (Gorlick 2025) most evidence SR: Telephone follow-up posthospitalization alone ineffective (van Loon- rather than postvan Gaalen 2021) ED Observational: structured programs reduced ED revisits (Light 2025; Lee 2025) AI, artificial intelligence; ED, emergency department; EHR, electronic health record; ICU, intensive care unit; LOS, length of stay; M, million; MA, meta-analysis; RCT, randomized controlled trial; RPM, remote patient monitoring; SR, systematic review.
[3.06] days; P = .14), in-hospital mortality (1.7% vs 2.3%; P = .51), or 30-day readmissions (1.83% vs 2.28%; P = .61).52 Overall, patients46,52 and staff46,51 reported high satisfaction. Evidence evaluating telehospitalist integration in the ED remains comparatively limited. Early evaluation of a nocturnal program designed to reduce on-site hospitalist coverage reported positive patient and care-team experience.53 A more recent nocturnal program centralizing overnight ED admissions demonstrated implementation feasibility across a multisite health system.54 Another program supporting ED clinical decision-making was associated with optimized hospital bed utilization and facilitated safe discharges without negative effects on patient outcomes.55 Pillar 2: Expanding Workforce Capacity Virtual Nursing Virtual nursing is designed to interact with patients using secure video connections, allowing bedside nurses to focus on direct patient care.56 A scoping review reported that virtual nursing in the inpatient setting primarily supports admissions, discharges, care coordination, and nursing workflows; patient and nurse experiences were generally positive.57 A retrospective evaluation showed no significant differences from usual care in intensive care unit (ICU) transfer (average marginal effect [AME], -0.08 percentage points; 95% CI, Volume 27, No. 6: November 2026
-1.34 to 1.18), inpatient mortality (AME, 0.43 percentage points; 95% CI, -0.33 to 1.18), or LOS (AME, -0.20 days; 95% CI, -0.57 to 0.17).58 Recurrent implementation themes included clearly defined virtual nursing roles,56,59 bedside nurse engagement during model development,60,61 and virtual workflow education.59 Published ED-specific evidence remains scarce. One multicenter retrospective study associated virtual nursing with shorter median wait times (429.5 [IQR, 292.6-954.5] vs 525.5 [IQR, 332.9-969.8] minutes; P < .001), fewer admissionassessment interruptions (mean [SD], 1.4 [1.3] vs 1.8 [1.5]; P < .001), and fewer incomplete documentation fields (0.2 [0.5] vs 0.4 [1.5]; P < .001) compared with standard in-person admission assessments, suggesting a promising care-delivery model in the ED.62 Continuous Remote Patient Monitoring Wearable remote patient monitoring devices continuously track physiologic parameters and can integrate EHR workflows and early warning systems.63,64 An early inpatient systematic review supported deployment feasibility and measurement validity.65 Phased implementation across an eight-hospital system further supported scalability.63 Systematic reviews and meta-analyses found no significant differences compared with traditional monitoring in major events or complications (odds
1693
Western Journal of Emergency Medicine
ED Digital Health Transformation: Review and Three-Pillar Implementation ratio [OR], 0.71; 95% CI, 0.38-1.31), ICU admission (OR, 0.82; 95% CI, 0.25-2.67),66 rapid response activation (risk ratio [RR], 0.61; 95% CI, 0.26-1.43),67 or LOS (MD, -0.09 days; 95% CI, -0.46 to 0.28).68 Mortality findings varied; one meta-analysis reported lower mortality (RR, 0.61; 95% CI, 0.39-0.95)67 whereas others did not.66,68 Emergency department evidence for remote patient monitoring remains limited to feasibility, validation, and predictive modeling studies. Deployment was feasible and acceptable to patients.69 Among patients with suspected sepsis, device-derived heart rate (r = 0.87, P < .001) and respiratory rate (r = 0.75, P < .001) correlated strongly with manual measurements.70 A wearable device detected deterioration earlier than standard monitoring (MD, 39.48 minutes; P < .001),71 while models incorporating continuous physiologic data predicted septic shock earlier than those using manually collected data.72 Pillar 3: Extending Continuity of Care Virtual Specialty Consultation Virtual specialty consultations expand timely access to subspecialist care. In inpatient settings, strong evidence supports tele-ICU integration, while evaluations of telepsychiatry programs are emerging. A tele-ICU meta-analysis reported lower ICU mortality (RR, 0.83; 95% CI, 0.72-0.96), hospital mortality (RR, 0.74; 95% CI, 0.58-0.96), and ICU LOS (MD, -0.63; 95% CI, -1.09 to -0.17), although substantial heterogeneity across models was highlighted.73 A systematic review of inpatient telepsychiatry reported implementation feasibility across diverse US general hospitals.74 Evidence evaluating virtual specialty consultations in the ED varies by specialty. Telestroke, designed for the acute management of stroke patients, is particularly applicable to the ED. A meta-analysis found no significant differences with conventional in-person stroke care in onset-to-intravenous tissue plasminogen activator times (mean [SD], 144.09 [18.87] vs 147.18 [25.97] minutes; P = .63), door-to-needle times (73.03 [20.04] vs 65.91 [25.96] minutes; P = .32), or 90-day functional independence (modified Rankin Scale score of 0–2; OR, 1.06; 95% CI, 0.89-1.29), mortality (OR, 1.16; 95% CI, 0.94-1.43), or symptomatic intracranial hemorrhage (OR, 0.99; 95% CI, 0.73-1.34).75 Tele-ICU was associated with lower in-hospital mortality among those admitted to the ICU (adjusted OR, 0.20; 95% CI, 0.06-0.70).76 Telepsychiatry was generally feasible and acceptable to stakeholders, enabling on-demand consultations that may reduce waiting times for psychiatric assessment, although evidence regarding clinical effectiveness remains limited.77 Postdischarge Transitional Care Systematic reviews and meta-analyses have evaluated heterogeneous posthospital care interventions, including telephone-based follow-up, home visits, and telemonitoring. Compared with usual care, discharge communication Western Journal of Emergency Medicine
Sossong et al.
interventions were associated with fewer 30-day readmissions (RR, 0.69; 95% CI, 0.56-0.84) and greater treatment adherence (RR, 1.24; 95% CI, 1.13-1.37).78 Nurse-led interventions showed fewer readmissions with follow-up longer than 12 weeks (RR, 0.67; 95% CI, 0.49-0.92) and fewer ED visits (RR, 0.63; 95% CI, 0.49-0.81).79 Effects varied by complexity: low-complexity interventions were associated with lower odds of readmission at 30 days (OR, 0.78; 95% CI, 0.66-0.92) and 180 days (OR, 0.45; 95% CI, 0.30-0.66); medium-complexity interventions, at 90 days (OR, 0.64; 95% CI, 0.45-0.92); and high-complexity interventions, with shorter LOS (SMD, -0.20; 95% CI, -0.38 to -0.03) and greater patient satisfaction (SMD, 0.52; 95% CI, 0.22–0.82).80 Evidence supporting transitional care interventions post-ED discharge is emerging but remains less mature than following inpatient discharge. Comprehension-focused interventions were the most studied and generally improved patient understanding, although heterogeneous designs limit generalizability.81 Intervention effectiveness varied by modality and structure. Nurse-led telephone follow-up did not decrease readmissions and revisits,82 whereas structured telehealth was associated with lower odds of revisit at 7 days (OR, 0.69; P < .001) and 30 days (OR, 0.82; P < .001).83 Noncompletion of a structured transitional care visit was associated with higher odds of 90-day ED revisit (OR, 2.11; 95% CI, 1.02-4.33). Among completers, 26% were referred back to the ED and most were subsequently admitted, which the authors interpreted as appropriate identification and escalation of clinical deterioration.84 Structured follow-up may hold particular value for uninsured and underinsured patients, for whom the ED is often the only health-system contact. DISCUSSION Coordinated Implementation Frameworks Several reviews have examined individual digital health technologies relevant to EM, including ambient AI documentation,34,35 telestroke,75 tele-ICU,73 telepsychiatry,77 virtual nursing,57 remote patient monitoring,65,68 and ED discharge interventions.81 Collectively, these reviews evaluated feasibility, implementation, operational performance, and clinical outcomes, but each focused on a single technology. The present review synthesizes evidence across six technologies, positions the ED as a convergence point for coordinated digital transformation, and proposes a three-pillar framework for implementation. While individual technologies demonstrate promise, coordinated implementation frameworks may offer advantages by enabling workflow integration and reducing duplicative efforts. Implementation science frameworks highlight that successful digital transformation depends on the integration of technologies within organizational and clinical systems rather than isolated deployments.85 Evidence from broader digital hospital transformations suggests that integrated, system-level implementation of interoperable technologies is associated with improvements in both patient and clinician experience,
1694
Volume 27, No. 6: November 2026
Sossong et al.
ED Digital Health Transformation: Review and Three-Pillar Implementation
reinforcing the importance of coordinated approaches over isolated deployment.88 Figure 2 illustrates how these technologies may activate chronologically across the patient journey: virtual nursing intake and ambient AI documentation on arrival; virtual specialty consultation if indicated; remote patient monitoring; telehospitalist admission during boarding; and virtual discharge education with structured follow-up after discharge. This coordination may facilitate data flow and longitudinal care across the acute and postacute continuum rather than siloed deployments. Critical Implementation Factors Successful coordinated digital transformation relies on key factors highlighted in recent implementation reports, including governance, project management, implementation science and change management best practices, workflow
integration, and clinician oversight.89 These factors are not unique to any single technology and represent foundational elements of digital transformation. Governance and Data Protection Effective implementation of digital health technologies demands strong governance, privacy safeguards, and appropriate clinician oversight. The World Health Organization emphasizes that telemedicine implementations must ensure patient safety, privacy, traceability, accountability, and security across all digital modalities.86 Similar principles apply to AI-based documentation tools, where strong data governance and clinician oversight remain essential, as demonstrated in applied implementations of clinical AI systems.87 Health system innovation leadership must work closely with information technology (IT) security, compliance, and clinical stakeholders to ensure data protection across technology types. Electronic Health Record Integration Embedding tools within existing EHR workflows reduces workflow disruption and training burden, which may increase adoption,85,88,89 whereas technologies requiring separate systems or additional login credentials may create significant barriers, particularly in high-pressure ED environments.85,90 Stakeholder Engagement and Iterative Improvement Early and continuous involvement of frontline staff is essential for successful adoption and workflow integration.85,91 Clinician participation in design, testing, and refinement supports sustained use, and training should focus on workflow integration rather than technology operation alone.85,89 Plan-Do-Study-Act cycles provide a structured approach to iterative testing, feedback, and staged refinement of implementation strategies.92
Figure 2. Digital health technology activation across emergency department care phases: from arrival through postdischarge follow-up. AI, artificial intelligence; ED, emergency department; EHR, electronic health record; RPM, remote patient monitoring; VICU, virtual intensive care unit.
Volume 27, No. 6: November 2026
Adoption Barriers Evidence from implementation reports, observational studies, and systematic reviews suggests that technology adoption is influenced by clinician, technology, and organizational factors. Clinician trust in digital tool outputs remains divided. While ambient AI may increase documentation quality, fictitious information or “hallucinations” in AI-driven documentation, in addition to misplaced information, unnecessary wordiness, and omissions raise concerns regarding the reliability and accuracy of these technologies.35,36,93 Uncertainty around responsibility and liability for inaccuracies in documentation may further limit implementation in clinical settings.93 Health technologies may also increase cognitive load by requiring clinicians to adapt to new workflows and manage technology-related disruptions.90 Technological challenges, including network instability, hardware malfunctions, insufficient specialty-specific customization, and data security concerns, may disrupt workflows and hinder use, requiring technical support and 1695
Western Journal of Emergency Medicine
ED Digital Health Transformation: Review and Three-Pillar Implementation continued training to maintain digital competency.90,93,94 At the organizational level, skepticism toward new technologies and change fatigue, particularly when multiple technologies are implemented and refined concurrently, may further hinder adoption.90 Illustrative Implementation Experience from Houston Methodist Houston Methodist is a nonprofit nine-hospital health system, including a flagship quaternary academic medical center in the Texas Medical Center. Between 2022 and 2025, multiple digital health technologies were deployed sequentially through coordinated quality improvement initiatives across hospital sites. Key infrastructure supporting coordinated implementation included an existing system-wide Epic EHR platform, a centralized 24/7 Virtual Operations Center (VOC), strong IT support, and innovation leadership. Focus groups, regular surveys, and usage analytics guided iterative refinement, and the ED, with its rapid turnaround, frequent handoffs, and multidisciplinary workflows, served as a testing ground for coordinated digital health innovation. The examples presented below are intended to be illustrative of coordinated digital transformation; they do not establish causal effectiveness. Ambient Artificial Intelligence Documentation An ambient AI documentation platform (Ambience Healthcare) was integrated into Epic through a staged rollout, from 10 emergency physicians to over 150 users system-wide. Quality improvement data demonstrated reduction in documentation time, early signals for improved coding accuracy, and low rates for elective discontinuation. Mitigation strategies for hallucinations included mandatory clinician attestation, targeted error audits, and rapid vendor feedback loops. Telehospitalist Integration The telehospitalist model for nocturnal inpatient admissions from the ED was designed to alleviate boarding, staffing shortages, and challenges associated with increasing patient complexity. Implementation occurred sequentially across four sites and was led by a multidisciplinary team comprising physicians and operations leaders. The team developed standardized workflows for consultation initiation, documentation, and staff training, facilitating consistent admission coverage across sites. Virtual Nursing Virtual nurses conduct standardized intake assessments including safety screening, allergy verification, and psychological assessments. In the ED, virtual sitters support select patients requiring continuous observation, such as those with psychiatric conditions. Engaging bedside nurses in the design phase ensured virtual nursing complemented rather than replaced direct care. Western Journal of Emergency Medicine
Sossong et al.
Continuous Remote Patient Monitoring The BioButton (BioIntelliSense Inc) wearable remote patient monitoring device was deployed across all hospitals, with continuous physiologic data transmitted hourly to Epic for early warning score integration. The VOC team monitors approximately 2,000 to 3,000 patients system-wide; triggered alerts escalate from technicians to virtual intensive care unit (VICU) nurses, who may activate the rapid response team. In the ED, the BioButton supported monitoring of patients awaiting admission, where nursing ratios may limit traditional vital sign frequency. Virtual Specialty Consultation Telestroke, telepsychiatry, VICU, and telepharmacy services are fully integrated into Epic workflows and standardized across all nine hospitals. The VICU model exemplifies multidimensional coordinated implementation: it extends continuity of care from the ED to the ICU, delivers 24/7 coverage without additional on-site staffing, and accelerates critical care transition planning. Postdischarge Transitional Care Existing virtual care infrastructure and staffing models were leveraged to implement a post-ED discharge transitional care program, requiring minimal additional operational resources and minor workflow changes. Automated text messages invited patients to schedule nurse practitioner-led virtual follow-up visits focused on medication adherence, symptom monitoring, and care plan reinforcement. Implementation Considerations for Health Systems Successful implementation of coordinated digital transformation frameworks requires several prerequisites: robust IT infrastructure and support; strong governance and change management capabilities; established virtual care capabilities; and leadership commitment to a coordinated approach. These contextual factors were essential to the digital transformation at Houston Methodist. Successful implementation of all six technologies remains challenging, particularly for resource-limited systems. Prioritization should consider evidence maturity, expected clinical and operational value, infrastructure requirements, and local needs. Table 2 presents a proposed prioritization, classifying each technology as foundational (must-have) or enhancing (nice-to-have) alongside the infrastructure burden associated with initial implementation. The three pillars are functional groupings rather than an implementation sequence, and prioritization cuts across them. Technologies extending continuity of care emerged as the highest priority for resource-limited settings, followed by workflow technologies and then workforce technologies, reflecting differences in infrastructure burden and evidence maturity rather than the order in which the pillars are presented. The coordinated digital transformation framework adapts
1696
Volume 27, No. 6: November 2026
ED Digital Health Transformation: Review and Three-Pillar Implementation
Sossong et al.
Table 2. Proposed prioritization of digital health technologies for resource-limited systems. Technology
Tier
Infrastructure Burden
Rationale
Virtual specialty consultation
Foundational
Moderate (contracted service, video capability, EHR integration)
Supplies subspecialty expertise not available on site; without it, patients are transferred or go without. Strongest ED-specific evidence base of the six, particularly for telestroke. Specific services should be selected based on local gaps in care.
Postdischarge transitional care
Foundational
Low; digital layer optional (existing staffing, automated messaging)
Supplies continuity of care that does not otherwise exist after ED discharge. Technology scales the model rather than creating the benefit; telephone follow-up alone was ineffective, whereas structured, comprehension-focused programs reduced revisits, which suggests that intervention design matters more than modality. Automation extends reach at low marginal cost as volume grows.
Telehospitalist
Enhancing (conditional)
Moderate (contracted or shared staffing model, standardized admitting workflows)
Conditional on local staffing structure: applicable to EDs with limited onsite hospitalist coverage, and of little value where coverage already exists. Evidence supports operational feasibility, particularly during overnight hours when staffing constraints may be greatest.
Ambient AI documentation
Enhancing
Moderate (recurring per-clinician licensing; no capital-free entry point)
Documentation occurs with or without it; the benefit accrues to clinician burden rather than clinical capability. Cost is recurring rather than one-time, which is harder to sustain under constrained operating budgets. May reduce documentation time and clinician burden, although clinical outcome effects are uncertain and ongoing clinician oversight is required given the risk of hallucinations and omissions.
Virtual nursing
Enhancing
High (dedicated remote nursing coverage; economical only across multiple units or sites)
Redistributes nursing work that occurs regardless. May improve nursing workflow and documentation completeness, but EDspecific evidence is limited to a single multicenter study. The staffing model depends on scale that smaller systems may not have.
Continuous RPM
Enhancing
High (wearable devices, EHR integration, centralized alarm management)
Monitoring occurs through manual vital signs; continuous capture increases frequency rather than adding a capability. Clinical outcome benefits remain inconclusive, and implementation is the most resource-intensive of the six. Reasonable to defer. Foundational technologies (must-have) supply a clinical or operational capability the ED otherwise lacks; enhancing technologies (nice-to-have) improve a capability already present. Infrastructure burden reflects capital, licensing, and staffing requirements for initial implementation. Priority classifications are proposed and should be adapted to local staffing gaps, infrastructure, resources, and needs. AI, artificial intelligence; ED, emergency department; EHR, electronic health record; RPM, remote patient monitoring.
to different hospital sizes, supports phased implementation that reduces resource burden, and allows local customization. Integration into standard workflows, reallocation of staff time, clinician satisfaction, and training all support sustainability. Although formal cost-effectiveness analyses remain limited, most digital health technologies have demonstrated operational improvements that may translate into economic benefits. Ambient AI documentation has been associated with improved clinician productivity and visit volumes,38 while virtual nursing programs may reduce labor costs.57 By decreasing readmissions and ED revisits,83 transitional care interventions may further decrease costs related to health care utilization. Similarly, virtual specialty consultations such as tele-ICUs may reduce costs associated with ICU utilization.95 Volume 27, No. 6: November 2026
Beyond the potential value of individual technologies, a coordinated framework may offer additional opportunities, including leveraging shared infrastructures, centralized virtual clinicians, EHR integration workflows, and common governance structures. Equity considerations are central to the population health mission of EM. Digital tools may offer opportunities to address unmet social needs and promote more equitable care.22 However, concentrating digital transformation in wellresourced systems risks widening disparities in community health outcomes by limiting technology-enabled care among the patients who stand to benefit most.96-99 Safety-net and rural EDs face barriers: digital tools require upfront investment, technical infrastructure, and dedicated resources that may be beyond the reach of systems already managing workforce 1697
Western Journal of Emergency Medicine
ED Digital Health Transformation: Review and Three-Pillar Implementation shortages and limited broadband access. Partnerships, shared resources, and policy initiatives addressing implementation barriers may be necessary to promote equitable technology adoption across diverse health care settings.100,101 Future Research Directions Future research priorities should include longer-term outcomes assessment, cost-effectiveness analyses, and formal pre- and postimplementation studies with control groups to strengthen the evidence base.50 Additional opportunities include extending implementation frameworks and toolkits beyond EM85 and integrating AI for predictive analytics and clinical decision support, where large language models have demonstrated promising ED triage performance in controlled comparative studies.102,103 Multisite randomized or quasi-experimental studies across health system types would help establish causality and generalizability. Critically, comparisons of coordinated multi-technology implementation against isolated deployments would determine whether the synergies described in this review, such as data continuity across care transitions and reduced workflow fragmentation, translate into measurable clinical and operational differences. These priorities point toward expansion of remote patient monitoring into the home as a key next step, strengthening longitudinal connections across hospital, home, and clinic settings.104 Hospital-at-home models, which combine remote physiologic monitoring, in-home nursing, and virtual physician oversight, represent an adjacent frontier.105 LIMITATIONS The evidence base for digital transformation in EM is rapidly evolving but uneven in maturity (Table 1). Systematic reviews and meta-analyses support established technologies such as telestroke and tele-ICU, and have now emerged for ambient AI documentation,34,35 including early randomized trials.36,37 In contrast, evidence for newer innovations such as virtual nursing remains largely descriptive, and ED-specific evidence across technologies is predominantly observational. Randomized controlled trials remain rare overall, limiting causal attribution. Notably, this review did not identify comparative studies evaluating coordinated versus isolated technology implementations, limiting the ability to attribute observed outcomes specifically to the coordinated approach rather than to individual technologies. Generalizability may also be limited by setting. Financial pressures, competing priorities, and limited technical capacity present implementation barriers across health systems of all types. Additionally, selection bias may affect reported outcomes, particularly for programs like virtual follow-up where patient participation is voluntary. The narrative review process itself has several limitations. While appropriate for synthesizing heterogeneous evidence, narrative reviews do not provide the methodological rigor of Western Journal of Emergency Medicine
Sossong et al.
systematic reviews or meta-analyses, limiting their ability to quantify associations or establish causation. Significant literature may be missed, and interpretation of evidence remains author and context dependent; in this review, interpretation may additionally be influenced by the authors’ institutional experience, which we mitigated by positioning the Houston Methodist experience as an illustrative case, excluded from the literature synthesis, that reflects a single health system and may not generalize to other settings. The rapid pace of technological development means newer implementations and evidence may emerge quickly after publication. Despite these limitations, the literature offers real-world implementation data from multiple institutions, growing sample sizes as technologies scale, consistent findings across settings, and clinically meaningful endpoints beyond simple adoption metrics. CONCLUSION The intersection of rising patient acuity, frequent handoffs, persistent boarding, and unpredictable staffing variability uniquely positions EDs as convergence points for coordinated digital transformation. Current evidence, supplemented by implementation experience from Houston Methodist, suggests that coordinated approaches may better integrate digital tools into ED workflows than isolated deployments. A three-pillar framework addressing workflow optimization, workforce capacity expansion, and continuity of care proposes a systematic approach for health systems seeking comprehensive digital transformation. Key implementation factors include stakeholder engagement, EHR integration, and iterative improvement cycles. Success should be measured not just by operational metrics but by improved access to timely care, higher clinician satisfaction, and stronger capacity to serve all patients effectively. Realizing the full population health potential of this transformation will require deliberate policy and partnership strategies that extend these benefits equitably to the communities and patients who need them most, including those for whom the ED remains the primary point of access to the health system. Address for Correspondence: Ngoc-Anh A. Nguyen, MD, Houston Methodist, Emergency Department, 6565 Fannin Street, Houston, TX 77030. Email: nanguyen@houstonmethodist.org. Conflicts of Interest: By the WestJEM article submission agreement, all authors are required to disclose all affiliations, funding sources and financial or management relationships that could be perceived as potential sources of bias. No author has professional or financial relationships with any companies that are relevant to this study. There are no conflicts of interest or sources of funding to declare. Copyright: © 2026 Sossong et al. This is an open access article distributed in accordance with the terms of the Creative Commons Attribution (CC BY 4.0) License. See: http://creativecommons.org/ licenses/by/4.0/
1698
Volume 27, No. 6: November 2026
Sossong et al.
ED Digital Health Transformation: Review and Three-Pillar Implementation
REFERENCES
Emerg Care Med. 2025;2(1):2. 17. Wolfe J, Welsh S. Ambient documentation systems in emergency
1. Pourmand A, Caggiula A, Barnett J, et al. Rethinking traditional emergency department care models in a post-coronavirus
medicine: a scoping review of clinical precision, patient experience,
disease-2019 world. J Emerg Nurs. 2023;49(4):520-9.e2.
throughput, and quality. Cureus. 2026;18(4):e106643. 18. Gancz L, Duffy E, Mathies I, et al. Ambient artificial intelligence
2. Moy AJ, Hobensack M, Marshall K, et al. Understanding the perceived role of electronic health records and workflow
scribes in the emergency department: a scoping review of current
fragmentation on clinician documentation burden in emergency
evidence. J Emerg Med. 2026;88(2):235-243. 19. Chenais G, Lagarde E, Gil-Jardine C. Artificial intelligence in
departments. J Am Med Inform Assoc. 2023;30(5):797-808.
emergency medicine: viewpoint of current applications and
3. Naidoo R, Schoeman R. Burnout in emergency department staff: the
foreseeable opportunities and challenges. J Med Internet Res.
prevalence and barriers to intervention. S Afr J Psychiatr.
2023;25:e40031.
2023;29:2095. 4. Medscape. National physician burnout & suicide report 2024. 2024.
20. Tyler S, Olis M, Aust N, et al. Use of artificial intelligence in triage in
Available at: https://www.medscape.com/slideshow/2024-lifestyle-
hospital emergency departments: a scoping review. Cureus.
burnout-6016865. Accessed June 24, 2025.
2024;16(5):e59906. 21. Kachman MM, Brennan I, Oskvarek JJ, et al. How artificial
5. Brady KJS, Ni P, Carlasare L, et al. Academic physician burnout and career satisfaction following COVID-19. JAMA Netw Open.
intelligence could transform emergency care. Am J Emerg Med.
2023;6(4):e237960.
2024;81:40-46. 22. Grade M, Stark N, Emanuels D, et al. Discharge navigator:
6. Association of American Medical Colleges. The complexities of physician supply and demand: projections from 2019 to 2034.
implementation and cross-sectional evaluation of a digital decision
Washington, DC: Association of American Medical Colleges; 2021.
tool for social resources upon emergency department discharge. West J Emerg Med. 2022;23(5):637-643.
Available at: https://www.milbank.org/wp-content/uploads/2023/04/
23. Patterson BW, Pulia MS, Ravi S, et al. Scope and influence of
aamc-2021-physician-supply-and-demand-projections-060921.pdf.
electronic health record-integrated clinical decision support in the
Accessed June 24, 2025.
emergency department: a systematic review. Ann Emerg Med.
7. McGinnis SL, Moore J. The impact of the aging population on the
2019;74(2):285-296.
health workforce in the United States—summary of key findings. Cah
24. Idahor CO, Ogunfuwa O, Ogbonna N, et al. Transforming emergency
Sociol Demogr Med. 2006;46(2):193-220.
care through telemedicine: a narrative review. Cureus.
8. Ricketts TC, Fraher EP. Reconfiguring health workforce policy so that
2025;17(12):e98481.
education, training, and actual delivery of care are closely connected. Health Aff (Millwood). 2013;32(11):1874-1880.
25. Sharifi Kia A, Rafizadeh M, Shahmoradi L. Telemedicine in the emergency department: an overview of systematic reviews. J Public
9. National Academies of Sciences, Engineering, and Medicine. Taking
Health (Berl). 2023;31(8):1193-1207.
Action Against Clinician Burnout: A Systems Approach to Professional Well-Being. National Academies Press; 2019.
26. Tsou C, Robinson S, Boyd J, et al. Effectiveness of telehealth in rural and remote emergency departments: systematic review. J Med
10. Koonin LM, Hoots B, Tsang CA, et al. Trends in the use of telehealth
Internet Res. 2021;23(11):e30632.
during the emergence of the COVID-19 pandemic: United States, January-March 2020. Morb Mortal Wkly Rep. 2020;69(43):1595-9.
27. du Toit M, Malau-Aduli B, Vangaveti V, et al. Use of telehealth in the management of non-critical emergencies in rural or remote
11. Ribeira R, Shen S, Callagy P, et al. Telemedicine to decrease
emergency departments: a systematic review. J Telemed Telecare.
personal protective equipment use and protect healthcare workers.
2019;25(1):3-16.
West J Emerg Med. 2020;21(6):61-2. 12. Spaulding EM, Fang M, Chen Y, et al. Satisfaction with telehealth
28. Ahmed AA, Mojiri ME, Daghriri AA, et al. The role of telemedicine in emergency department triage and patient care: a systematic review.
care in the United States: cross-sectional survey. Telemed J E
Cureus. 2024;16(12):e75505.
Health. 2024;30(6):1549-1558. 13. Balloch J, Sridharan S, Oldham G, et al. Use of an ambient artificial
29. Witkowska-Zimny M, Nieradko-Iwanicka B. Telemedicine in
intelligence tool to improve quality of clinical documentation. Future
emergency medicine in the COVID-19 pandemic—experiences and
Healthc J. 2024;11:100157.
prospects—a narrative review. Int J Environ Res Public Health. 2022;19(13):8216.
14. Ma SP, Liang AS, Shah SJ, et al. Ambient artificial intelligence scribes: utilization and impact on documentation time. J Am Med
30. Kelton DK, Szulewski A, Howes D. Real-time video telemedicine applications in the emergency department: a scoping review of
Inform Assoc. 2025;32(2):381-5.
literature. CJEM. 2018;20(6):920-928.
15. Tierney AA, Gayre G, Hoberman B, et al. Ambient artificial intelligence scribes: learnings after 1 year and over 2.5 million uses.
31. Richards TC, Han J, Ahmed-Kristensen S. State-of-the-art technologies for the digital transformation of healthcare services—a
NEJM Catal Innov Care Deliv. 2025;6(5).
systematic scoping review. BMC Health Serv Res. 2026;26(1):877.
16. Conforti R. Informatics in emergency medicine: a literature review.
Volume 27, No. 6: November 2026
1699
Western Journal of Emergency Medicine
ED Digital Health Transformation: Review and Three-Pillar Implementation
Sossong et al.
32. Rabiei R, Hsu WC, Bastani P, et al. Transition toward smart hospitals:
48. Hron JD, Parsons CR, Williams LA, et al. Rapid implementation of an
a scoping review of features, technologies, and challenges. Health
inpatient telehealth program during the COVID-19 pandemic. Appl
Sci Rep. 2025;8(12):e71601.
Clin Inform. 2020;11(3):452-459.
33. Koebe P, Bohnet-Joschko S. The impact of digital transformation on
49. Papo Y, Harvey J, Williams D, et al. Tele-hospitalist services to
inpatient care: mixed methods study. JMIR Public Health Surveill.
support the opening of a new rural hospital. J Hosp Med.
2023;9:e40622.
2026;21;1075-1080.
34. Zhao J, Liu H, Chen Y, et al. Application of artificial intelligence tools
50. Papo Y, Harvey J, Williams D, et al. Building a telemedicine program
and clinical documentation burden: a systematic review and
to create a sustainable care delivery model for a rural hospital at risk
meta-analysis. BMC Med Inform Decis Mak. 2026;26:29.
for closure. Telemed J E Health. 2025;31(6):765-771.
35. Bracken A, Reilly C, Feeley A, et al. Artificial intelligence (AI)-
51. Kuperman EF, Linson EL, Klefstad K, et al. The virtual hospitalist: a
powered documentation systems in healthcare: a systematic review.
single-site implementation bringing hospitalist coverage to critical
J Med Syst. 2025;49(1):28.
access hospitals. J Hosp Med. 2018;13(11):759-763.
36. Afshar M, Baumann MR, Resnik F, et al. A pragmatic randomized
52. Boltz M, Cuellar NG, Cole C, et al. Comparing an on-site nurse
controlled trial of ambient artificial intelligence to improve health
practitioner with telemedicine physician support hospitalist
practitioner well-being. NEJM AI. 2025;2(12).
programme with a traditional physician hospitalist programme. J
37. Lukac PJ, Chin AT, Turner W, et al. Ambient AI scribes in clinical
Telemed Telecare. 2019;25(4):213-220.
practice: a randomized trial. NEJM AI. 2025;2(12).
53. JaKa MM, Dinh JM, Ziegenfuss JY, et al. Patient and care team
38. Rotenstein LS, Holmgren AJ, Thombley R, et al. Changes in clinician
perspectives of telemedicine in critical access hospitals. J Hosp Med.
time expenditure and visit quantity with adoption of artificial
2020;15(6):345-348.
intelligence-powered scribes: a multisite study. JAMA.
54. Nguyen NA, Sossong S, Ishaq F, et al. Feasibility and early outcomes
2026;335(16):1408-1417.
of a multi-site telehospitalist admissions programme: staff and patient
39. Preiksaitis C, Alvarez A, Winkel M, et al. Ambient artificial intelligence
perspectives from a large health system. BMJ Open Qual.
scribe adoption and documentation time in the emergency
2026;15(2):e003963.
department. Ann Emerg Med. 2026;87(5):569-574.
55. Koch AT, Keuseman RL, Parikh R, et al. Innovative telehospitalist
40. Lipinski M, Smith E, Vaillancourt C. Human vs artificial intelligence in
model optimizes medical triage in collaboration with community
medical charting: a comparative study in the simulated emergency
emergency departments: a cross-sectional study. J Telemed
medicine context. CJEM. 2026;28(5):431-437.
Telecare. 2026;32(1):32-39.
41. Williams CYK, Bains J, Tang T, et al. Evaluating large language
56. Nguyen NA, Holderread BM, Pletcher SN. Virtual nursing initiatives in
models for drafting emergency department encounter summaries.
an urban hospital system with a flagship academic hospital and
PLOS Digit Health. 2025;4(6):e0000899.
seven satellite hospitals: a discussion of successful interventions and
42. Shy BD, Baloescu C, Faustino IV, et al. Early insights among
future directions. Telehealth Med Today. 2024;9(6):530.
emergency medicine physicians on artificial intelligence: a national,
57. Bhaloo T, McVey C, Peterson J, et al. A scoping review of virtual
convenience-sample survey of the American College of Emergency
nursing models in inpatient, noncritical care settings. J Nurs Regul.
Physicians. J Am Coll Emerg Physicians Open. 2025;7(1):e100308.
2025;16(3):171-182.
43. Alcázar-Peral JM, Álvaro-de la Parra JA, Ciardo P, et al. Deployment
58. Savitz ST, Frederick RK, Sangaralingham LR, et al. Evaluation of
of an ambient AI scribe in emergency care: a 12-month evaluation in
safety and care outcomes after the introduction of a virtual registered
a large Spanish hospital network. Int J Med Inform. Published online
nurse model. Health Serv Res. 2023;58(5):999-1013.
July 2, 2026.
59. Whalen M, Rosenblum N, Johnson AA. Best practices for
44. Marquis T, Kopp M, Anderson JS, et al. AI-powered ambient scribe
implementing hospital-based virtual nursing: an integrative review.
technology experiences among emergency physicians. JMIR Form
Am J Nurs. 2025;125(12):28-34.
Res. 2026;10:e80401.
60. Schuelke S, Aurit S, Connot N, et al. Virtual nursing: the new reality
45. Webb J, Chu L, Turer RW, et al. Crossover evaluation of two ambient AI scribe tools in the emergency department. Appl Clin Inform.
in quality care. Nurs Adm Q. 2019;43(4):322-328. 61. Welsh C, Brindise T, Deane B, et al. Alleviating bedside nurse
2026;17(1):118-126.
burden: a virtual nursing program. Nurse Lead. 2025;23(2):158-162.
46. Gutierrez J, Moeckli J, Holcombe A, et al. Implementing a
62. Khairat S, Morelli J, Qin Q, et al. Effect of virtual nursing
telehospitalist program between Veterans Health Administration
implementation on emergency department efficiency and quality of
hospitals: outcomes, acceptance, and barriers to implementation. J
care. Am J Emerg Med. 2025;91:59-66.
Hosp Med. 2021;16(3):156-163.
63. Nguyen NA, Lee G, Holderread B, et al. Scaling wireless continuous
47. Becker CD, Forman L, Gollapudi L, et al. Rapid implementation and
vital sign monitoring across an 8-hospital health system: digital health
adaptation of a telehospitalist service to coordinate and optimize care for COVID-19 patients. Telemed J E Health. 2021;27(4):388-396.
Western Journal of Emergency Medicine
implementation report. JMIR Med Inform. 2026;14:e78216. 64. Ginsburg GS, Picard RW, Friend SH. Key issues as wearable digital
1700
Volume 27, No. 6: November 2026
Sossong et al.
ED Digital Health Transformation: Review and Three-Pillar Implementation
health technologies enter clinical care. N Engl J Med.
2021;4(8):e2119346.
2024;390(12):1118-1127.
79. Sakashita C, Endo E, Ota E, et al. Effectiveness of nurse-led
65. Leenen JPL, Leerentveld C, van Dijk JD, et al. Current evidence for
transitional care interventions for adult patients discharged from
continuous vital signs monitoring by wearable wireless devices in
acute care hospitals: a systematic review and meta-analysis. BMC
hospitalized adults: systematic review. J Med Internet Res.
Nurs. 2025;24(1):379.
2020;22(6):e18636.
80. Tyler N, Hodkinson A, Planner C, et al. Transitional care interventions
66. Bowles T, Trentino KM, Lloyd A, et al. Outcomes in patients receiving
from hospital to community to reduce health care use and improve
continuous monitoring of vital signs on general wards: a systematic
patient outcomes: a systematic review and network meta-analysis.
review and meta-analysis of randomised controlled trials. Digit
JAMA Netw Open. 2023;6(11):e2344825.
Health. 2024;10:20552076241288826.
81. Gorlick MK, Balasubramanian S, Han G, et al. Scoping review of
67. Sun L, Joshi M, Khan SN, et al. Clinical impact of multi-parameter
adult emergency department discharge interventions. West J Emerg
continuous non-invasive monitoring in hospital wards: a systematic
Med. 2025;26(4):823-834.
review and meta-analysis. J R Soc Med. 2020;113(6):217-224.
82. van Loon-van Gaalen M, van Winsen B, van der Linden MC, et al.
68. Areia C, Biggs C, Santos M, et al. The impact of wearable continuous
The effect of a telephone follow-up call for older patients, discharged
vital sign monitoring on deterioration detection and clinical outcomes
home from the emergency department on health-related outcomes: a
in hospitalised patients: a systematic review and meta-analysis. Crit
systematic review of controlled studies. Int J Emerg Med.
Care. 2021;25(1):351.
2021;14(1):13.
69. Miller K, Baugh CW, Chai PR, et al. Deployment of a wearable
83. Light MB, Elsener M, Feng C, et al. Contact after emergency
biosensor system in the emergency department: a technical feasibility
department discharge by a telehealth transition of care program is
study. Proc Annu Hawaii Int Conf Syst Sci. 2021;2021:3567-3572.
associated with reduced emergency department revisit rate. Cureus.
70. Garbern SC, Mbanjumucyo G, Umuhoza C, et al. Validation of a
2025;17(12):e100433.
wearable biosensor device for vital sign monitoring in septic
84. Lee G, Bruce C, Nisar T, et al. Implementation and evaluation of a
emergency department patients in Rwanda. Digit Health.
virtual transitional care intervention using automated text messaging
2019;5:2055207619879349.
and virtual visits after emergency department discharges:
71. Reed MJ, O’Brien R, Black PL, et al. Physiological deterioration in
retrospective cohort study. JMIR Mhealth Uhealth. 2025;13:e77973.
the emergency department: the SNAP40-ED study. Emerg Care J.
85. Greenhalgh T, Wherton J, Papoutsi C, et al. Beyond adoption: a new
2021;17(3):9711.
framework for theorizing and evaluating nonadoption, abandonment,
72. Choi A, Chung K, Chung SP, et al. Advantage of vital sign monitoring
and challenges to the scale-up, spread, and sustainability of health
using a wireless wearable device for predicting septic shock in febrile patients in the emergency department: a machine learning-based
and care technologies. J Med Internet Res. 2017;19(11):e367. 86. World Health Organization. Consolidated Telemedicine Implementation
analysis. Sensors (Basel). 2022;22(18):7054.
Guide. World Health Organization; 2022. Available at: https://www.who.
73. Chen J, Sun D, Yang W, et al. Clinical and economic outcomes of
int/publications/i/item/9789240059184. Accessed August 17, 2026.
telemedicine programs in the intensive care unit: a systematic review
87. Nguyen NA, Holderread B, Lee G, et al. Integrating image-based
and meta-analysis. J Intensive Care Med. 2018;33(7):383-393.
artificial intelligence in the operating room: enhancing safety and
74. Schulte VP, Li C, Rojas-Velasquez D, et al. Extending the reach of
efficiency while navigating ethical considerations. Telehealth Med
inpatient consultation-liaison psychiatry: a systematic review of
Today. 2025;10(2):578.
telepsychiatry in U.S. general hospitals. Gen Hosp Psychiatry.
88. Canfell OJ, Woods L, Meshkat Y, et al. The impact of digital hospitals
2026;100:241-250.
on patient and clinician experience: systematic review and qualitative
75. Mohamed A, Elsherif S, Legere B, et al. Is telestroke more effective
evidence synthesis. J Med Internet Res. 2024;26:e47715.
than conventional treatment for acute ischemic stroke? A systematic
89. Burns B, Nemelka B, Arora A. Practical implementation of generative
review and meta-analysis of patient outcomes and thrombolysis
artificial intelligence systems in healthcare: a United States
rates. Int J Stroke. 2024;19(3):280-292.
perspective. Future Healthc J. 2024;11:100166.
76. Kadar RB, Amici DR, Hesse K, et al. Impact of telemonitoring of
90. Patel SB, Iqbal FM, Lam K, et al. Characterizing behaviors that
critically ill emergency department patients awaiting ICU transfer. Crit
influence the implementation of digital-based interventions in health
Care Med. 2019;47(9):1201-1207. 77. Shalev L, Eitan R, Rose AJ. The use of telepsychiatry services in
care: systematic review. J Med Internet Res. 2025;27:e56711. 91. Kirk MA, Kelley C, Yankey N, et al. A systematic review of the use of
emergency settings: scoping review. J Med Internet Res.
the consolidated framework for implementation research. Implement
2024;26:e51814. 78. Becker C, Zumbrunn S, Beck K, et al. Interventions to improve
Sci. 2016;11:72. 92. Abuzied Y, Alshammary SA, Alhalahlah T, et al. Using FOCUS-PDSA
communication at hospital discharge and rates of readmission: a
quality improvement methodology model in healthcare: process and
systematic review and meta-analysis. JAMA Netw Open.
outcomes. Glob J Qual Saf Healthc. 2023;6(2):70-72.
Volume 27, No. 6: November 2026
1701
Western Journal of Emergency Medicine
ED Digital Health Transformation: Review and Three-Pillar Implementation
Sossong et al.
93. Guo Y, Wang J, Hu D, et al. Evaluating ambient artificial intelligence
structural analysis. J Med Internet Res. 2024;26:e46971.
documentation: effects on work efficiency, documentation burden,
100. Rangachari P, Al Arkoubi K, Shindi R. A multi-level framework for
and patient-centered care. J Am Med Inform Assoc. 2026;33(2):273-
advancing digital health equity in learning health systems: aligning
282.
practice and theory with the quintuple aim. Int J Equity Health.
94. Stults CD, Deng S, Martinez MC, et al. Evaluation of an ambient
2025;24(1):253.
artificial intelligence documentation platform for clinicians. JAMA
101. Lyles CR, Nguyen OK, Khoong EC, et al. Multilevel determinants of
Netw Open. 2025;8(5):e258614.
digital health equity: a literature synthesis to advance the field. Annu
95. Health Resources and Services Administration. Telehealth Center of
Rev Public Health. 2023;44:383-405.
Excellence, Medical University of South Carolina. 2026. Available at:
102. Preiksaitis C, Ashenburg N, Bunney G, et al. The role of large
https://telehealthcoe.org/about-telehealth-centers-of-excellence/
language models in transforming emergency medicine: scoping
musc-coe/. Accessed July 9, 2026.
review. JMIR Med Inform. 2024;12:e53787.
96. Yan AS, Apathy NC, Chen J. Adoption of health information
103. Masanneck L, Schmidt L, Seifert A, et al. Triage performance across
technologies by area socioeconomic deprivation among US
large language models, ChatGPT, and untrained doctors in
hospitals. JAMA Health Forum. 2025;6(9):e253035.
emergency medicine: comparative study. J Med Internet Res.
97. Yao R, Zhang W, Evans R, et al. Inequities in health care services
2024;26:e53297.
caused by the adoption of digital health technologies: scoping review.
104. Keesara S, Jonas A, Schulman K. COVID-19 and health care’s digital
J Med Internet Res. 2022;24(3):e34144. 98. Badr J, Motulsky A, Denis JL. Digital health technologies and
revolution. N Engl J Med. 2020;382:e82. 105. Federman AD, Soones T, DeCherrie LV, et al. Association of a
inequalities: a scoping review of potential impacts and policy
bundled hospital-at-home and 30-day postacute transitional care
recommendations. Health Policy. 2024;146:105122.
program with clinical outcomes and patient experiences. JAMA Intern
99. Shaw J, Glover W. The political economy of digital health equity:
Western Journal of Emergency Medicine
Med. 2018;178(8):1033-1040.
1702
Volume 27, No. 6: November 2026
Systematic Review
Identification of Regional Wall Motion Abnormalities by Emergency Physicians in Acute Coronary Syndromes: Systematic Review and Meta-Analysis Eduardo Saadi Neto, MD* Murilo Scapin, MD† Pablo Aparicio Verdun, MD‡ Francisco Lazaro-Paulina, MD§ Danielle Gerberi, MLIS|| Daniel Fiterman Molinari, MD# Ronna L. Campbell, MD, PhD* Tobias Kummer, MD*
*Mayo Clinic, Department of Emergency Medicine, Rochester, Minnesota † Universidade Estadual De Londrina, Department of Neurosurgery, Londrina, Paraná, Brazil ‡ Universidad Privada del Valle, Medicine, Department of Health Sciences, Cochabamba, Bolivia § Hennepin County Medical Center, Department of Emergency Medicine, Minneapolis, Minnesota || Mayo Clinic Libraries, Rochester, Minnesota # Mayo Clinic, Department of Emergency Medicine, Jacksonville, Florida
Section Editor: Robert Allen, MD Submission history: Submitted April 29, 2026; Revision received August 10, 2026; Accepted August 14, 2026 Electronically published October 18, 2026 Full text available through open access at http://escholarship.org/uc/uciem_westjem DOI 10.5811/westjem.64752
Introduction: Chest pain accounts for approximately six million emergency department (ED) visits annually in the United States. Early detection of acute occlusive myocardial infarction (OMI) is challenging, especially in patients without classic ST-elevation on initial electrocardiography (ECG). Regional wall motion abnormalities (RWMA) often precede ECG changes and can be sensitive indicators of acute coronary occlusion on transthoracic echocardiography (TTE). However, the accuracy of emergency physician-performed TTE for RWMA detection has not been well defined. In this review we aim to determine how accurate emergency physicians are in detecting RWMAs. Methods: We conducted a systematic review of studies including adult ED patients who underwent cardiac ultrasound performed or interpreted by emergency physicians, with test characteristics compared to cardiology-performed or interpreted echocardiography as the reference standard. Primary outcomes were sensitivity and specificity for RWMA detection. Secondary outcomes included likelihood ratios, and area under the receiver-operator curve (AUC). Risk of bias was assessed using QUADAS-2, and evidence certainty was evaluated using GRADE methodology. Results: The search identified 2,463 studies, of which 32 underwent full-text review; nine studies including 1,191 participants from the US, Turkey, and Iran are included. Sonographers across studies ranged from medical students and residents to fellowship-trained and senior emergency physicians with varying levels of prior ultrasound and RWMA-specific training. Pooled sensitivity and specificity for RWMA detection were 86% (95% CI, 76-93%) and 85% (95% CI, 70-94%), respectively, with an AUC of 0.918. Pooled positive and negative likelihood ratios were 5.42 (95% CI, 2.51-11.68) and 0.17 (95% CI, 0.09-0.33), respectively. Four of the nine studies were judged to have a high risk of bias in at least one domain. Substantial heterogeneity was observed in the secondary univariate analyses (>80%). The overall certainty of evidence was moderate. Conclusion: Emergency physician-performed or interpreted cardiac ultrasound demonstrates high accuracy for detecting RWMAs compared with cardiology-performed or interpreted echocardiography. Although heterogeneity was observed across studies, the overall certainty of evidence was moderate. Structured training and standardized protocols may optimize diagnostic performance. [West J Emerg Med. 2026;27(6)1703–1713.]
Volume 27, No. 6: November 2026
1703
Western Journal of Emergency Medicine
Identification of Regional Wall Motion Abnormalities by Emergency Physicians in ACS INTRODUCTION Chest pain is one of the most common reasons for presentation to the emergency department (ED), accounting for approximately six million visits annually in the United States.1 An estimated 600,000 patients present to the ED with acute myocardial infarction annually.2 Prompt identification is critical, as cardiovascular disease remains the leading cause of death worldwide, responsible for over 17 million deaths each year.3 The electrocardiogram (ECG) is the primary initial diagnostic tool for evaluating patients with suspected acute coronary syndrome and identifying those with acute coronary occlusion, which requires urgent reperfusion therapy. However, in patients without classic ST-elevation (STEMI) on the initial ECG, identifying those who may benefit from urgent coronary intervention remains challenging.1 Transthoracic echocardiography (TTE) performed by cardiologists has demonstrated that regional wall motion abnormalities (RWMA) can indicate acute myocardial ischemia and may be detected before diagnostic ECG changes in some patients with acute occlusive myocardial infarction (OMI) and critical coronary stenosis.4,5 Although comprehensive echocardiography plays a well-established role in evaluating confirmed myocardial infarction, including regional and global cardiac function and mechanical complications, the ability of emergency physicians to reliably detect RWMAs at the bedside using ultrasound remains uncertain.6,7 Despite this potential, the potential diagnostic accuracy of emergency physician-performed ultrasound for RWMAs currently does not have a formal role in ED, highlighting an important knowledge and literature gap.1,8 The objective of this systematic review and diagnostic meta-analysis was to evaluate whether emergency physicians can accurately detect RWMAs. METHODS Study Design We conducted a diagnostic meta-analysis in accordance with the Preferred Reporting Items for a Systematic Review and Meta-analysis of Diagnostic Test Accuracy Studies (PRISMA-DTA)9 and registered in PROSPERO (CRD 420261292335). The review question was framed using a diagnostic accuracy population, intervention, comparison, outcome (PICO) approach. Participants were adults (18 years of age and older) presenting to the ED with suspected acute coronary syndrome, chest pain, or suspected acute myocardial infarction (including STEMI and non-STEMI [NSTEMI] elevation presentations). The intervention consisted of cardiac ultrasound performed or interpreted by emergency physicians or residents, which included the assessment of RWMAs. We then compared the results via echocardiography performed or interpreted by a cardiologist. Western Journal of Emergency Medicine
Saadi Neto et al.
Population Health Research Capsule What do we already know about this issue? Regional wall motion abnormalities (RWMAs) on bedside ultrasound may help identify acute coronary occlusion, but their diagnostic accuracy remains uncertain. What was the research question? How accurately do emergency physicians identify RWMAs using ultrasound? What was the major finding of the study? Across 9 studies (n = 1,191), pooled sensitivity was 86% and specificity 85% (AUC 0.918). How does this improve population health? Bedside RWMA assessment is feasible by emergency physicians and may support earlier acute coronary syndrome recognition and risk stratification, complementing standard emergency department evaluation and helping guide timely care.
The primary outcomes of interest were sensitivity and specificity for the detection of RWMAs. Secondary outcomes were positive and negative likelihood ratios, and the area under the receiver operating characteristic curve (AUC). Search Strategy The literature was searched by a medical librarian for the concepts of RWMA, ultrasonography, the emergency department (ED) setting, and acute coronary syndrome. Search strategies were created using a combination of keywords and standardized index terms. Searches were run on December 16, 2025, in ClinicalTrials.gov, EBSCO Cumulative Index to Nursing and Allied Health Literature, Ovid Cochrane Central Register of Controlled Trials, Ovid Embase, Ovid MEDLINE, Scopus, Web of Science Core Collection, and the World Health Organization’s International Clinical Trials Registry Platform. Results were limited to English, Portuguese and Spanish with conference abstracts and editorials removed. Full search strategies are provided in the appendix. Study Selection Records were managed in Covidence. After removing duplicates, four reviewers (ESN, MS, PAV, FL) independently screened abstracts and full texts; discrepancies were resolved by consensus.
1704
Volume 27, No. 6: November 2026
Saadi Neto et al.
Identification of Regional Wall Motion Abnormalities by Emergency Physicians in ACS
Eligibility Criteria We included studies evaluating adult patients presenting to the ED with suspected acute coronary syndrome, chest pain, or acute myocardial infarction, including both STEMI and NSTEMI presentations. To be eligible, studies had to assess cardiac ultrasound examinations performed or interpreted by emergency physicians or emergency medicine trainees. A requirement for inclusion was that the ultrasound examination specifically included an assessment for RWMAs. Studies were excluded if they involved pediatric populations. We also excluded studies conducted outside the ED setting and those that did not evaluate RWMAs as a clinical outcome. We also excluded case reports, case series, narrative reviews, editorials, and conference abstracts for which the full text was unavailable.
Development, and Evaluation (GRADE) approach. The evidence was graded based on criteria including risk of bias, inconsistency, indirectness, imprecision, and publication bias (Supplemental Material).
Outcome Measures The primary outcomes of interest were the sensitivity and specificity of cardiac ultrasound performed or interpreted by emergency physicians for the detection of RWMAs. Secondary outcomes included positive and negative likelihood ratios and the area under the curve. Data Collection Process After consensus among the authors, the collected data included bibliographic information, study design, setting, sample size, and patient demographics including age, sex, and comorbidities. Intervention details focused on the cardiac views obtained, operator training level, and the technical definition of RWMA. Extracted outcomes included sensitivity, specificity, positive predictive value (PPV), negative predictive value (NPV), raw diagnostic data (true positive [TP], false positive [FP], true negative [TN], and false negative [FN]), and interobserver agreement. Additional methodological characteristics extracted included the timing of the reference standard relative to the emergency physician-performed ultrasound examination and whether cardiologist interpreters of the reference standard were blinded to the emergency physician ultrasound findings, when reported. Risk of Bias and Certainty Assessment Two reviewers (ESN and PAV) independently assessed the risk of bias for each included study using the Quality Assessment of Diagnostic Accuracy Studies 2 (QUADAS-2) tool. Each study was evaluated across four key domains: patient selection, index test, reference standard, and flow and timing. Any discrepancies between the reviewers during the assessment process were resolved through discussion and consensus. The results of these assessments are reported for all individual studies (Supplemental Material). To evaluate the overall certainty of the body of evidence, we applied the Grading of Recommendations Assessment, Volume 27, No. 6: November 2026
Data Analysis We conducted all statistical analyses using R (R Foundation for Statistical Computing). When data necessary to build the 2 × 2 table were unavailable, we calculated per the recommendations of the Cochrane handbook.10 Pooled sensitivity and specificity were initially estimated using a random effects model with the meta package in R as a univariate approach. We estimated the primary outcomes (pooled sensitivity and specificity for RWMA detection) using a bivariate random-effects model implemented with the reitsma function from the mada package. This model jointly estimates sensitivity and specificity while accounting for their potential correlation and between-study heterogeneity. Model parameters were estimated using restricted maximum likelihood (REML). Summary sensitivity, FP rate, and their correlation were obtained, and a summary receiver operating characteristic (SROC) curve was generated. Overall diagnostic performance was quantified using the area under the SROC curve (AUC) and the partial AUC restricted to observed FP rates. Between-study heterogeneity in AUC was assessed using the Zhou and Dendukuri method. We constructed the SROC plots to visualize pooled diagnostic accuracy and study-level variability. Additionally, we calculated study-level likelihood ratios (positive and negative) from the raw 2 × 2 tables. Pooled estimates of positive and negative likelihood ratios were obtained using a random-effects meta-analysis on the log-transformed studyspecific ratios. RESULTS We identified 2,463 studies through the search strategy, of which 32 underwent full-text review and nine met inclusion criteria (Figure 1). These studies included a total of 1,191 participants who underwent cardiac ultrasound performed or interpreted by emergency physicians. The included studies consisted of seven prospective observational cohorts and two retrospective observational cohorts. Four studies were conducted in Turkey, three in the US, and two in Iran. Considerable heterogeneity was observed in the training background and experience of sonographers across studies. Participating operators ranged from medical students, residents, and fellowship-trained emergency physicians to senior physicians and attending-level clinicians. Some studies used a single operator, whereas others included multiple sonographers with varying levels of experience. Several studies reported prior focused cardiac ultrasound or point-ofcare ultrasound (POCUS) experience, dedicated RWMA training sessions, structured didactic instruction, or supervised
1705
Western Journal of Emergency Medicine
Identification of Regional Wall Motion Abnormalities by Emergency Physicians in ACS
Saadi Neto et al.
of 0.918 (Figure 3).1,6,7,11-16 The partial AUC was 0.897, indicating that diagnostic performance remained robust when analysis was restricted to clinically relevant false-positive rates, suggesting that the overall AUC was not driven by unrealistic operating points. We assessed between-study heterogeneity using the Zhou and Dendukuri I² statistic, which was 28.4%, indicating low-tomoderate heterogeneity and supporting consistency of diagnostic performance across included studies. Likelihood Ratios Across the included studies, the pooled positive likelihood ratio (LR+) was 5.42 (95% CI, 2.5-11.68), indicating an increase in the probability of disease when the test is positive. The pooled negative likelihood ratio (LR−) was 0.17 (95% CI, 0.09-0.33), reflecting the reduction in the probability of disease when the test is negative.1,6,7,11–16 (Figure 4) Quality assessment We assessed risk of bias was assessed using the QUADAS-2. Four studies were classified as having a high risk of bias, three as having“some concerns,” and two as having a low risk (Supplemental Figure 1). The timing of the reference standard and blinding procedures varied across the included studies (Table 3). Most studies performed the reference echocardiographic examination during the index ED encounter or hospitalization, although the reported interval ranged from within 1 hour to later during the same admission when explicitly stated. Blinding of cardiologist interpreters to the emergency physician ultrasound findings was explicitly reported in six studies, whereas three studies did not clearly describe blinding procedures. These factors contributed to the QUADAS-2 assessments for the reference standard and flow and timing domains.
Figure 1. PRISMA flowchart for included studies of identification of regional wall motion abnormalities by emergency physicians. PRISMA, Preferred Reporting Items for Systematic Reviews and Meta-Analyses.
hands-on training before study participation. Additional detailed information regarding operator characteristics, training protocols and baseline study characteristics are summarized in Table 1 and 2. Secondary Univariate Analysis As an initial descriptive analysis, pooled sensitivity and specificity were estimated separately using univariate models. Nine studies comprising 467 TP and 77 FN demonstrated a pooled sensitivity of 88% (95% CI, 78-94%) (Figure 2A). The same nine studies, comprising 480 TN and 104 FP, yielded a pooled specificity of 85% (95% CI, 70–94%) (Figure 2B).1,6,7,11–16 Primary Bivariate Analysis Because sensitivity and specificity are correlated diagnostic accuracy measures, the prespecified primary analysis used a bivariate random-effects model that jointly estimates both parameters. Using this model, the pooled sensitivity was 86% (95% CI, 76-93%), with a corresponding pooled specificity of 85% (95% CI, 70-94%). The sROC curve showed excellent diagnostic performance, with an sROC AUC Western Journal of Emergency Medicine
Grading of recommendations assessment, development, and evaluation assessment Overall, the certainty of the evidence was determined to be moderate, mainly due to the risk of bias in the included studies; several demonstrated moderate to high risk of bias in the patient selection, flow, and timing domains (Supplemental Table 1). DISCUSSION In this systematic review of nine studies including 1,191 participants, an emergency physician–performed cardiac ultrasound demonstrated excellent diagnostic performance for the detection of RWMAs. The pooled sensitivity and specificity were 86% and 85%, respectively, with an AUC of 0.918, indicating excellent diagnostic performance. The pooled LR+ was 5.42, suggesting that a positive ultrasound substantially increases the probability of RWMAs, while the pooled LR− was 0.17, indicating a strong reduction in the
1706
Volume 27, No. 6: November 2026
Identification of Regional Wall Motion Abnormalities by Emergency Physicians in ACS
Saadi Neto et al.
Table 1. Study baseline characteristics for included studies of “Identification of regional wall motion abnormalities by emergency physicians.”
Sample size
Age, years (mean [SD])
Iran
205
61 (17)
102 N/A (49.8%)
Adults (≥ 18 years of age) presenting to the ED with suspected cardiac emergency.
US would interfere with treatment.
apical 4-chamber; parasternal longaxis; parasternal short-axis; subxiphoid 4-chamber.
N/A
Croft 2019
USA
69
62.0 (12.47)
20 Known CAD*: (29.0%) 16 (27%) Hypertension: 42 (76%) Diabetes mellitus: 10 (18%)
Adults (≥ 18 No exclusion years of age) criteria. presenting to the ED with ECG-confirmed STEMI.
apical 4-chamber; parasternal longaxis; parasternal short-axis.
N/A
Rasooli 2021
Iran
100
54.1 ± 11.5
35 Hypertension: (35.0%) 49 (49%) Diabetes mellitus: 19 (19.0%) Dyslipidemia: 33 (33.0%)
Adults (≥ 18 years of age) presenting to the ED with acute coronary syndrome (ACS).
STEMI needing primary PCI; pacemaker implantation.
apical 2-chamber; apical 4-chamber; longaxis; short-axis.
Akinesia, dyskinesia, or hypokinesia of the left ventricle.
Saglam Turkey 2021
89
59.6 (14.04)
25 Hypertension: (28.1%) 45 (50.6%) Diabetes mellitus: 18 (20.2%) Dyslipidemia: 21/ (23.6%)
Adults (≥ 18 years of age) presenting to the ED with chest pain, HEART score ≥ 4, and a likely ACS diagnosis.
STEMI, chronic heart failure, tachycardia, or bradycardia.
apical 2-chamber; apical 4-chamber; parasternal longaxis; parasternal short-axis.
Segmental left ventricular akinesia, dyskinesia, or hypokinesia.
Bracey 2023
USA
65
62 (14)
23 Known CAD*: (35.4%) 19 (29%) Hypertension: 47 (72%) Diabetes mellitus: 20 (31%) Dyslipidemia: 37 (57%)
Patients > 17 years of age presenting to the ED with high suspicion for ACS.
If no formal apical echocardiography 2-chamber; for comparison apical 4-chamber; parasternal long; parasternal shortaxis.
≥ 1 Segmental left ventricular wall abnormality.
Toksul 2023
Turkey
303
63.14 (0.89)
106 Known CAD*: (35.0%) 102 (33.7%) Hypertension: 62 (20.5%) Diabetes mellitus: 22 (7.3%)
Adults (≥ 18 years of age) presenting to the ED with chest pain and shortness of breath.
No exclusion criteria.
apical 2-chamber; apical 4-chamber; parasternal long; parasternal shortaxis.
Segmental left ventricular akinesia, dyskinesia, or hypokinesia.
Çevrim 2023
Turkey
48
49 (13)
24 N/A (50.0%)
Adults (≥ 18 years of age) presenting to the ED with chest pain.
Prior CAD; CABG/stent; ST-elevation on admission ECG; low EF needing resuscitation on admission.
apical 2-chamber; apical 4-chamber; parasternal longaxis; parasternal short-axis.
Study
Country
Farsi 2017
Volume 27, No. 6: November 2026
Female Inclusion (n, %) Comorbidities criteria
1707
Exclusion criteria
Cardiac views assessed on ED-performed US
RWMA definition
SWMA score > 1.1.
Western Journal of Emergency Medicine
Identification of Regional Wall Motion Abnormalities by Emergency Physicians in ACS
Saadi Neto et al.
Table 1. Continued
Study
Country
Sample size
Age, years (mean [SD])
Female (n, %) Comorbidities
Inclusion criteria
Exclusion criteria
Cardiac views assessed on ED-performed US
RWMA definition
Karanci Turkey 2024
91
58.5 (8.5)
29 Known CAD*: (31.9%) 44 (48%) Hypertension: 39 (43%) Diabetes mellitus: 23 (25%) Dyslipidemia: 24 (26%)
Adults (≥ 18 years of age) presenting to the ED with suspected ACS.
ST-elevation; no PCI within 72 hrs; no records; US not feasible; unsuitable conditions for US.
apical N/A 2-chamber; apical 4-chamber; parasternal long; parasternal shortaxis.
Tan 2024
221
64.8 (13.4)
75 N/A (33.9%)
Adults (≥ 18 years of age) presenting to the ED with suspected ACS who underwent diagnostic cardiac catheterization within 72 hours of ED presentation.
ED ECG met cath-lab activation criteria or inadequate images for RWMA.
N/A
USA
Interpreted qualitatively as present, absent, or uninterpretable.
ACS, acute coronary syndrome; CABG, coronary artery bypass graft; CAD, coronary artery disease; ECG, electrocardiogram; ED, emergency department; EF, ejection fraction; N/A, not available; PCI, percutaneous coronary intervention; RWMA, regional wall motion abnormality; STEMI, ST-elevation myocardial infarction; SWMA, segmental wall movement abnormality; US, ultrasound.
probability of RWMAs when the test is negative. An important finding of this review is that acceptable diagnostic performance was observed despite substantial heterogeneity in operator background, prior ultrasound experience, and RWMA-specific training across included studies. Sonographers ranged from trainees, such as residents to fellowship-trained and senior emergency physicians, with some studies utilizing a single operator and others including multiple clinicians with differing levels of expertise. Training protocols also varied considerably, ranging from brief didactic sessions and introductory video modules to structured cardiologist-led workshops and supervised handson practice (Table 2). Despite this variability, most studies demonstrated favorable agreement with expert interpretation. suggesting that emergency physician assessment of RWMAs may be feasible across a broad range of training environments. The overall results support the potential feasibility and diagnostic performance of emergency physician–performed cardiac ultrasound as a valuable tool for rapid bedside detection of RWMAs in the ED. In addition to evaluating diagnostic accuracy, several studies compared the time required for emergency physicianperformed cardiac ultrasound with the time required for Western Journal of Emergency Medicine
formal echocardiographic assessment. Several studies reported substantial reductions in examination and overall workflow times when ultrasound was performed in the ED by trained physicians. For example, Bracey et al1 reported a median ED ultrasound time of 10 minutes (interquartile range [IQR] 3-6) compared with to median consultative cardiology echocardiography time of 952 minutes (IQR 59-1,356). Similarly, Karanci et al13 observed a median ED ultrasound time of 20 minutes (IQR 15-25) versus cardiology-performed echocardiography at 120 minutes (IQR 120-140), while Croft et al6 reported median times of 810 minutes (IQR 535-1,410) for ED ultrasound compared with 1,380 minutes (IQR 5402,280) for standard ultrasound. The expanding role of POCUS has transformed emergency medicine, becoming an established component of bedside evaluation for trauma, respiratory disease, abdominal aortic aneurysm, early pregnancy complications, and hemodynamic assessment.17-21 Within this broader context, these findings suggest that emergency physician–performed cardiac ultrasound may permit earlier bedside assessment for RWMAs than formal echocardiography in some clinical settings. In patients with suspected OMI, particularly when ECG findings are nondiagnostic or equivocal, early
1708
Volume 27, No. 6: November 2026
Identification of Regional Wall Motion Abnormalities by Emergency Physicians in ACS
Saadi Neto et al.
Table 2. Emergency physician operator training and diagnostic accuracy across included studies of “identification of regional wall motion abnormalities by emergency physicians.” US Sensitivity, US Specificity, % (95% CI) % (95% CI)
PPV/NPV, % (95% CI)
Study
EM US operator training
Farsi 2017
EM residents (n = 17): attended an ASE-protocol US workshop (two 2-h theory + three 2-h practical sessions).
97 (89-99)
87 (80-92)
69 (48-85) / 98 (95-99)
Croft 2019
EM residents (n = 9; 5 PGY-1; 3 PGY-2; 1 PGY-3): had prior POCUS experience (≥ 25 TTE; 150 total POCUS studies), had no prior RWMA training, and completed two introductory video modules.
88% (75-96)
92% (75-99)
95 (83-99) / 83 (68-92)
Rasooli EM resident (PGY-3): received 2 h of didactics plus 20 h of supervised 2021 hands-on practice under two cardiologists (ACEP-guided).
82.9 (66.493.4)
86.2 (75.393.5)
76.3 (59.8-88.6) / 90.3 (80.1-96.4)
Saglam Emergency physicians (n = 3): had 5 years of bedside US experience, 2021 completed an accredited POCUS course, and then received an additional 6-h cardiologist-led RWMA training session (3-h didactic + 3-h hands-on).
76.9 (56.491.0)
92.1 (82.497.4)
80.0 (62.7-90.5) / 90.6 (82.7-95.1)
Bracey 2023
EM resident/fellow/attending: all received a 30-min RWMAidentification presentation before performing study US.
94 (82-98)
35 (15-61)
80 (67-89) / 67 (31-91)
Toksul 2023
Emergency physicians: had attended at least one US training course.
96.4
69.4
79.9 / 93.9
Çevrim 2023
Emergency physicians + assistant: had >2 years of experience; the physician had completed a certified basic emergency US course plus targeted emergency echocardiography training.
75 (6-79)
97 (83-100)
75 (9-90) / 97 (80-99)
Karanci Emergency physicians: had ≥2 years of US experience and held basic 2024 and advanced US certificates.
85 (73-92)
53 (36-69)
77 (65-85) / 65 (46-81)
Tan 2024
57 (47-67)
96 (87-100)
N/A / N/A
Fellowship-trained emergency physicians (n = 3), emergency residents (n = 2), and medical student (n = 1): all attending/resident investigators had received emergency ultrasound training during residency and/or fellowship.
ASE, American Society of Echocardiography; ED, emergency department; EF, ejection fraction; EM, emergency medicine; N/A, not available; NPV, negative predictive value; PCI, percutaneous coronary intervention; PPV, positive predictive value; TTE, transthoracic echocardiography; US, ultrasound.
identification of RWMAs may provide complementary diagnostic information that supports earlier recognition of ischemia, facilitates expedited cardiology consultation, and may ultimately shorten time to reperfusion when interpreted alongside the clinical presentation and ECG findings. However, the included studies primarily evaluated examination timing and diagnostic agreement rather than downstream clinical outcomes, such as time to reperfusion, door-to-balloon time, missed OMI, changes in treatment, or patient outcomes. Therefore, these results should not be interpreted as demonstrating that earlier RWMA detection leads to earlier treatment or improved clinical outcomes. Prospective studies specifically designed to evaluate these outcomes are needed. The findings of this review also highlight the importance of structured training and standardized ultrasound education to optimize the diagnostic performance of emergency physicianperformed ultrasound. Variability in operator experience from residents to attending physicians likely contributed to some of the differences observed across studies, underscoring the need Volume 27, No. 6: November 2026
for formalized curricula that include both didactic knowledge and hands‑on scanning under supervision.22 Standardization efforts, such as the development of core POCUS training frameworks and certification pathways, seek to ensure that emergency physicians achieve consistent competency across essential applications, including cardiac assessment.23 Comprehensive residency‑based POCUS training programs have been shown to increase use and proficiency among emergency trainees, supporting the notion that structured education enhances both skill acquisition and clinical integration of ultrasound.24 Additionally, longitudinal faculty development and certification initiatives can improve skill retention, confidence, and teaching capability, helping reduce inter‑operator variability and promote sustained competency within EDs.25 A previous systematic review and meta-analysis by Albaroudi et al26 demonstrated substantial agreement between emergency physician sonographers and expert interpretation for visual estimation of left ventricular systolic function, with pooled sensitivity and specificity of 89% and 85%,
1709
Western Journal of Emergency Medicine
Identification of Regional Wall Motion Abnormalities by Emergency Physicians in ACS A
Saadi Neto et al.
A
B B
Figure 2. Forest plot for sensitivity (A) and specificity (B) of “emergency physician-performed ultrasound to detect regional wall motion abnormalities” (Univariate analysis) FN, false negative; FP, false positive; GLMM, generalized linear mixed model; TP, true positive.
LR-
Farsi 2017 Croft 2019 Rasooli 2021 Saglam 2021 Bracey 2023 Toksul 2023 Çevrim 2023 Karanci 2024 Tan 2024
0.03 [0.01; 0.13] 0.13 [0.06; 0.29] 0.20 [0.10; 0.41] 0.25 [0.12; 0.51] 0.19 [0.05; 0.69] 0.05 [0.02; 0.11] 0.26 [0.05; 1.40] 0.29 [0.15; 0.58] 0.44 [0.35; 0.56]
Risk Ratio IV, Random, 95% CI
95% CI
Total (95% CI) 0.17 [0.09; 0.33]
Heterogeneity: Tau2 = 0.4909; Chi2 = 45.05, df = 8 (P < 0.0001); I2 = 82.2%
0.01
0.1 1 10 100 Negative Likelihood Ratio
Figure 4. Forest plots for positive (A) and negative (B) likelihood ratios of emergency physician-performed ultrasound to detect regional wall motion abnormalities. IV, inverse variance; LR, likelihood ratio.
Figure 3. Summary receiver operating characteristic of emergency physician-performed ultrasound to detect regional wall motion abnormalities. EM, emergency medicine; ROC, receiver operating characteristic; RMWA, regional wall motion abnormality.
Western Journal of Emergency Medicine
Study
respectively. In contrast, the present review specifically evaluated the detection of RWMAs, a more nuanced echocardiographic finding with important implications for the identification of acute coronary syndromes and other cardiac pathologies. Despite differences in study populations, operator experience, and training protocols, our pooled estimates demonstrated similarly favorable diagnostic performance, suggesting that emergency physicians may be capable not only of identifying gross abnormalities in global systolic function, but also of recognizing more localized myocardial dysfunction using point-of-care echocardiography. In summary, this systematic review provides the first comprehensive synthesis of evidence demonstrating that emergency physician-performed cardiac ultrasound has high diagnostic accuracy for detecting RWMAs. To our knowledge, no prior systematic review has specifically evaluated the diagnostic performance of bedside cardiac ultrasound for RWMAs performed by emergency physicians, an important gap this meta‑analysis addresses. By quantifying pooled sensitivity, specificity, and likelihood ratios across multiple studies, our findings support the potential feasibility and diagnostic accuracy of emergency physician-performed cardiac ultrasound for RWMA detection. This work lays the foundation for future investigations into patient‑centered outcomes, standardization of training, and the real‑world implementation of emergency
1710
Volume 27, No. 6: November 2026
Identification of Regional Wall Motion Abnormalities by Emergency Physicians in ACS
Saadi Neto et al.
Table 3. Reference standard characteristics and flow/timing assessment of included studies of “identification of regional wall motion abnormalities by emergency physicians” Study
Cardiologist blinded?
Reference standard timing
Flow & Timing considerations
Farsi 2017
Reference US performed as soon as possible after EM US (exact interval not reported).
Yes
All included patients underwent both examinations; no post-enrollment exclusions.
Croft 2019
Reference US performed within 24 hrs after reperfusion and as close as possible to the study ultrasound.
Yes
6 patients excluded before analysis because of withdrawal, incomplete data, or inadequate images.
Rasooli 2021
Reference US performed within 1 hr of EM examination.
Yes
All enrolled patients underwent both examinations with no post-enrollment exclusions.
Saglam 2021
Reference US during the same ED encounter (exact interval not reported).
NR
22 patients excluded before analysis (17 declined participation; 5 inadequate image quality).
Bracey 2023
Reference US during the index admission
NR
11 patients excluded because no reference US was available.
Toksul 2023
Reference evaluation performed during the same clinical encounter (exact interval not reported).
Yes
All enrolled patients underwent both assessments.
Çevrim 2023
Both US performed during the same ED encounter before completion of the 6-hr ACS observation protocol.
Yes
14 patients excluded before analysis (5 withdrew; 9 inadequate image quality).
Karancı 2024
Median door-to-FOCUS: 20 mins Median door-to-TTE: 120 mins
NR
All enrolled patients underwent both examinations and were included in the final analysis.
Tan 2024
Reference US performed during the same admission (exact interval not reported).
NR
Reference US available in 158/221 patients, introducing potential verification bias.
ED, emergency department; EM, emergency medicine; NR, not reported; US, ultrasound.
physician–performed cardiac ultrasound. LIMITATIONS Several limitations of this meta-analysis should be acknowledged. First, the included studies were heterogeneous in terms of study design, operator expertise, and patient selection. Seven of the nine studies were prospective observational cohorts, and two were retrospective, which may have introduced variability in patient enrollment, timing of the ultrasound examination, and outcome assessment. Patient selection criteria also differed (eg, some studies excluded patients with STEMI). These differences may have introduced selection and spectrum bias. Additionally, operators ranged from emergency medicine residents to attending physicians with varying levels of ultrasound experience, potentially influencing the diagnostic performance reported in individual studies. Additionally, the prevalence of RWMAs also varied substantially across the included studies, ranging from 8% to 72%, with an average prevalence of approximately 45%. This average is considerably higher than would be expected among a general population of patients presenting to the ED with undifferentiated chest pain and may limit the generalizability of these findings to lower-prevalence clinical settings. Because PPVs and NPVs are highly dependent on disease prevalence, Volume 27, No. 6: November 2026
the wide variation in RWMA prevalence across the included studies also limits the validity and generalizability of pooled PPV and NPV estimates; therefore, these measures were ultimately not pooled or reported. Second, univariate analyses of sensitivity and specificity demonstrated higher heterogeneity compared to the bivariate model. This discrepancy is likely attributable to the univariate approach, which treats sensitivity and specificity independently without accounting for their inherent negative correlation. In contrast, the bivariate random effects model jointly estimates sensitivity and specificity and incorporates the correlation between these measures, resulting in lower observed heterogeneity. Therefore, the bivariate model provides a more reliable estimate of overall diagnostic performance. Third, the risk of bias was moderate to high in several studies, particularly in the patient selection and flow and timing domains. Differences in RWMA definitions, scanning protocols, image acquisition, operator training, and reference interpretation may also limit the comparability and generalizability of the results. Publication bias was not formally assessed with a funnel plot because only 9 studies were included; current methodological guidance cautions against interpreting funnel plots when fewer than 10 studies are available because of limited statistical power and
1711
Western Journal of Emergency Medicine
Identification of Regional Wall Motion Abnormalities by Emergency Physicians in ACS potentially misleading visual asymmetry. Additionally, although the Reitsma bivariate model implemented in the mada package provides an AUC estimate, it does not generate an analytical 95% CI. A simulation-based approach was explored with statistical consultation, but the resulting interval was not sufficiently stable or reliable; therefore, the AUC is reported as a point estimate only to avoid overstating its precision. Despite these limitations, the pooled estimates demonstrated robust diagnostic accuracy for emergency physician-performed cardiac ultrasound in detecting RWMAs, supported by consistent results in sensitivity, specificity, and SROC analyses. CONCLUSION Cardiac ultrasound performed or interpreted by emergency physicians showed high diagnostic accuracy for detecting RWMAs, with favorable sensitivity, specificity, and likelihood ratios. Despite moderate heterogeneity across studies, the overall certainty of the evidence was moderate, supporting the potential feasibility of cardiac ultrasound as a reliable bedside assessment tool for RWMAs. Although these results are promising, further research is needed to reduce bias through well-designed prospective diagnostic studies using standardized training protocols and rigorous methodology. Structured training and standardized protocols may further optimize diagnostic performance. This meta-analysis fills an important gap in the literature, providing a quantitative summary of the available evidence to guide implementation and future research.
Saadi Neto et al.
infarction in the United States, 2005 to 2015. J Am Heart Assoc. 2020;9(20):e017208. 3. Benjamin EJ, Muntner P, Alonso A, et al. Heart disease and stroke statistics—2019 update: a report from the American Heart Association. Circulation. 2019;139(10). 4. Di Pasquale P, Cannizzaro S, Scalzo S, et al. Sensitivity, specificity and predictive value of the echocardiography and troponin-T test combination in patients with non-ST elevation acute coronary syndromes. Int J Cardiovasc Imaging. 2004;20(1):37-46. 5. Kontos MC, Arrowood JA, Paulsen WH, et al. Early echocardiography can predict cardiac events in emergency department patients with chest pain. Ann Emerg Med. 1998;31(5):550-557. 6. Croft PE, Strout TD, Kring RM, et al. WAMAMI: emergency physicians can accurately identify wall motion abnormalities in acute myocardial infarction. Am J Emerg Med. 2019;37(12):2224-2228. 7. Tan TX, Wright D, Baloescu C, et al. Emergency physician-performed echocardiogram in non-ST elevation acute coronary syndrome patients requiring coronary intervention. West J Emerg Med. 2024;25(1). 8. Gibson RS, Bishop HL, Stamm RB, et al. Value of early twodimensional echocardiography in patients with acute myocardial infarction. Am J Cardiol. 1982;49(5):11101119. 9. McInnes MDF, Moher D, Thombs BD, et al. Preferred reporting items for a systematic review and meta-analysis of diagnostic test accuracy studies: the PRISMA-DTA Statement. JAMA. 2018;319(4):388. 10. Higgins JP, Green S, eds. Cochrane handbook for systematic reviews of interventions: Cochrane book series. 1st ed. Wiley; 2008. 11. Çevrim Ö, Boydak B, Yürüktümen A, et al. The diagnostic value of echocardiography performed by an emergency medicine physician in the diagnosis of acute coronary syndrome: a comparative study with cardiologist. J Diagn Med Sonogr. 2023;39(2):151–162.
Address for Correspondence: Eduardo Saadi Neto, MD, Mayo Clinic, Department of Emergency Medicine, 200 First Street SW, Rochester, MN 55905. Email: saadineto.eduardo@mayo.edu.
12. Farsi D, Hajsadeghi S, Hajighanbari MJ, et al. Focused cardiac ultrasound (FOCUS) by emergency medicine residents in patients with suspected cardiovascular diseases. J Ultrasound. 2017;20(2):133-138.
Conflicts of Interest: By the WestJEM article submission agreement, all authors are required to disclose all affiliations, funding sources and financial or management relationships that could be perceived as potential sources of bias. No author has professional or financial relationships with any companies that are relevant to this study. There are no conflicts of interest or sources of funding to declare.
13. Karancı Y, Bedel C, Selvi F, et al. Evaluation of regional wall motion abnormalities with echocardiography in the emergency department. Ibnosina J Med Biomed Sci. 2024;16(3):92-95. 14. Rasooli F, Bagheri F, Sadatnaseri A, et al. Comparison of emergency echocardiographic results between cardiologists and an emergency
Copyright: © 2026 Saadi Neto et al. This is an open access article distributed in accordance with the terms of the Creative Commons Attribution (CC BY 4.0) License. See: http://creativecommons.org/ licenses/by/4.0/
medicine resident in acute coronary syndrome. Arch Acad Emerg Med. 2021;9(1):e53. 15. Sağlam C, Ünlüer EE, Yamanoğlu NGÇ, et al. Accuracy of emergency physicians for detection of regional wall motion abnormalities in patients with chest pain without ST-elevation myocardial infarction. J Ultrasound Med. 2021;40(7):1335-1342.
REFERENCES
16. Toksul IH, Kesapli M, Avci A, et al. Evaluation of diagnostic efficiency
1. Bracey A, Massey L, Pellet AC, et al. FOCUS may detect wall motion
of bedside cardiac ultrasonography performed by emergency
abnormalities in patients with ACS. Am J Emerg Med. 2023;69:17-22. 2. Pendyal A, Rothenberg C, Scofi JE, et al. National trends in
specialist. Ir J Med Sci. 2023;192(3):1097-1102. 17. Sharma Y, Obidigbo B, P N. Diagnostic applications of point-of-care
emergency department care processes for acute myocardial
Western Journal of Emergency Medicine
ultrasound in emergency medicine: a narrative review. Cureus.
1712
Volume 27, No. 6: November 2026
Saadi Neto et al.
Identification of Regional Wall Motion Abnormalities by Emergency Physicians in ACS
2026;18(1):e101501.
2021;2(3):e12439.
18. Mani N, Rao S, Kim DJ. Point-of-care ultrasound in the modern era of
23. Atkinson P, Bowra J, Lambert M, et al. International Federation for
emergency medicine: a narrative review of the recent literature. Curr
Emergency Medicine point-of-care ultrasound curriculum. CJEM.
Opin Crit Care. 2026;32(3):262-268.
2015;17(2):161-170.
19. Alerhand S, Adrian RJ, Taylor LA. Cardiac point-of-care ultrasound.
24. Chen WL, Hsu CP, Wu PH, et al. Comprehensive residency-based
Emerg Med Clin North Am. 2024;42(4):731–754.
point-of-care ultrasound training program increases ultrasound
20. Neto ES, Scapin M, Lazaro-Paulina F, et al. Duration of resuscitation
utilization in the emergency department. Medicine (Baltimore).
interruption using point-of-care ultrasound versus traditional manual pulse check: a systematic review and meta-analysis. Am J Emerg
2021;100(5):e24644. 25. Elshehry A, Ghafri SA, Jufaili MA. Longitudinal point-of-care
Med. 2025;98:145–152.
ultrasound training program for emergency medicine faculty in Oman:
21. Long B, Adrian RJ, Gottlieb M. Emergency medicine updates: point-ofcare ultrasound in cardiac arrest. Am J Emerg Med. 2026;99:176–187.
a Kirkpatrick model approach. BMC Med Educ. 2025;25(1):1346. 26. Albaroudi B, Haddad M, Albaroudi O, et al. Assessing left ventricular
22. PoSaw LL, Wubben BM, Bertucci N, et al. Teaching emergency
systolic function by emergency physician using point-of-care
ultrasound to emergency medicine residents: a scoping review of
echocardiography compared to expert: systematic review and
structured training methods. J Am Coll Emerg Physicians Open.
meta-analysis. Eur J Emerg Med. 2022;29(1):18-32.
Volume 27, No. 6: November 2026
1713
Western Journal of Emergency Medicine
Expert Commentary
Ethics of Medical Students as Embedded Simulation Participants in Ultrasound Education Samantha K. Chao, MD* Charles W. Kropf, MD* Laura R. Hopson, MD* Creagh Boulger, MD† Rachel Liu, MBBCh, MD‡ Michelle Feeney, MD* Robert D. Huang, MD* Nik Theyyunni, MD* Jessica Koehler, MD* David A. Haidar, MD§
*University of Michigan, Department of Emergency Medicine, Ann Arbor, Michigan † The Ohio State University, Department of Emergency Medicine, Columbus, Ohio ‡ Yale School of Medicine, Department of Emergency Medicine, New Haven, Connecticut § Northwestern Medicine, Department of Emergency Medicine, Chicago, Illinois
Section Editor: N/A Submission history: Submitted August 5, 2026; Accepted August 21, 2026 Electronically published October 18, 2026 Full text available through open access at http://escholarship.org/uc/uciem_westjem DOI 10.5811/westjem.68197
Introduction: Medical students are sometimes used as embedded simulation participants (ESP) to facilitate ultrasound training on live volunteers. There is little guidance on how to safeguard the autonomy and dignity of medical student ESPs serving in this role. Based on real student experiences, we used four cases to illustrate the ethical dilemmas that can arise when ESPs are used, including the examination of sensitive body areas, risk for coercion, discovery of incidental findings in a public and professional setting, and social media posting of training events. Through these cases, we explore and articulate the relevant ethical obligations educators have to obtain informed consent, sensitively address incidental findings, and ensure the psychological and physical safety of ESPs. Methods: We developed interventions and procedures at our institution to address the obligation to promote ESP autonomy and bodily dignity, including a comprehensive consent form, ombudsperson role, and restrictions surrounding photography and social media posting of educational events. Results: These interventions were implemented in January 2024 in the emergency department of a large academic medical center affiliated with a medical school. Since implementation, 96 ESPs have participated in 16 discrete educational events. There has been anecdotal positive reception of these interventions. Recruiting and training individuals for the ombudsperson role carried some challenges. Conclusion: Proactive measures are necessary to support the autonomy and safety of medical student ESPs. There are practical challenges associated with recruitment, training, and implementation of the ombudsperson role. We hope that other institutions who use medical student ESPs will consider incorporating similar practices to promote the psychological and bodily safety of their volunteers. [West J Emerg Med. 2026;27(6)1714–1719.]
INTRODUCTION Ultrasonography training is increasingly being integrated into undergraduate and graduate medical education.1,2 Handson training is essential for learners to develop technical skills,
Western Journal of Emergency Medicine
and learners may practice on a variety of subjects, ranging from inanimate simulation models to actual patients.3 Some ultrasound programs invite medical students to volunteer as live human models. Experts in ultrasound education
1714
Volume 27, No. 6: November 2026
Chao et al.
Ethics of Medical Students as Embedded Simulation Participants in Ultrasound Education
recommend using alternatives to the term “model” to maintain a professional relationship4; therefore, we refer to student volunteers as embedded simulation participants (ESP). In simulation literature, ESPs are defined as individuals trained or scripted to play a role in a simulated encounter to help guide the scenario.5,6 In ultrasound learning, the ESP serves as a source of learner guidance and feedback. Existing literature describes the use of students as standardized patients in clinical skills training as a costeffective alternative to hiring occupational or trained standardized patients.4,7–10 However, using students in this role can present challenges. As one study exploring the experiences of nursing students as standardized patients for clinical examination of their peers described: “They felt that examinees could infringe on their bodies at any moment and that they were continually unable to prepare for such interference.”8 Little guidance exists for institutions who wish to use students as ESPs to craft an effective approach that considers the students’ bodily autonomy and dignity. In ultrasound education literature, a 2014 report describing a consent process and bill of rights serves as the sole example.4 Furthermore, there is no literature to date that examines the underlying ethical obligations educators have to support student ESPs. Below, we describe four cases based on real student concerns at our institution. Following these cases, we describe relevant ethical principles and frameworks educators can use to obviate challenges with using medical student ESPs. Cases 1. A medical student ESP is assigned to the cardiac ultrasound station at a training event for emergency medicine residents. The ESP did not realize her assignment would involve scanning the chest and feels uncomfortable that this sensitive area will be the focus of the station. She is receiving financial compensation for participating that will help her meet expenses; so she is hesitant to rescind her participation completely. She is also applying into emergency medicine and is wary of the impact either participating or not participating will have on residents who could be her future colleagues. She is unsure whom to ask for help at the event. 2. A medical student ESP participates in an ultrasound training event and was not made aware of its gamified nature. They were surprised to find themself in a station with dimmed lights, loud music, and learners dressed in costume. During one of the game competitions, a distracted learner uses too much force on the probe, causing the ESP pain. At the end of the day, the ESP leaves the event feeling overwhelmed and uncomfortable with their experience. 3. A medical student ESP is being scanned at a station teaching focused assessment with sonography for trauma exams. While looking at the patient’s right upper Volume 27, No. 6: November 2026
quadrant, the facilitator of the station notices multiple cystic structures in the right kidney. The medical student was unaware that he had these findings and has a family history of polycystic kidney disease. The training event was hosted for medical students who are the ESP’s peers, and he is distressed that this incidental finding was encountered while his peers were observing. 4. After volunteering as an ESP at an ultrasound training event, a medical student finds photos posted on social media documenting the event in which their abdomen is showing despite draping. The ESP had not consented to their photograph being taken and is uncomfortable with these images being publicly posted. They are unsure who to reach out to regarding the photo. Informed Consent Medical students volunteering as ESPs should provide their informed consent for participation. Similar to volunteer human research subjects, obtaining informed consent is essential to respecting an individual’s autonomy, particularly when they are participating altruistically in an intervention that may not provide direct benefit and is associated with potential risks.11,12 Obtaining informed consent is a process healthcare professionals are familiar with. The full risks and benefits of volunteering as an ESP should be explained.13 As in Case 1, an easily anticipated risk of acting as an ESP involves bodily exposure to facilitate ultrasound image acquisition. Another risk documented in the literature is identifying incidental findings (discussed further below). There may be some discomfort associated with the pressure from an ultrasound probe, which can be anticipated; but undue pain, as in Case 2, should be avoided.13 Finally, to prevent situations such as Case 4, ESPs should explicitly consent for inclusion in photographs and social media postings. There are multiple benefits associated with participating as an ESP as well. Studies have described the passive learning and professional development ESPs experience simply by being present, observing the learners, and participating in their instruction.4,7–10 There is also benefit from the role-reversal in which students experience what it’s like to be a patient.9 Having medical students as ESPs at these events can facilitate networking and recruitment into specialties engaging with clinical applications of ultrasound. Finally, some programs offer financial compensation for an ESP’s time. This practice is discussed more below. Psychological Safety Psychological safety is a concept from management sciences recently applied in medical education literature. It describes creating an environment conducive to learner risk-taking and fosters performance and growth. It is also fundamentally a construct concerned with the perceived consequences of certain interpersonal risks.14 Although primarily applied to circumstances such as providing learner
1715
Western Journal of Emergency Medicine
Ethics of Medical Students as Embedded Simulation Participants in Ultrasound Education
Chao et al.
feedback, safety reporting, and clinical performance,14,15 the concept of psychological safety and promoting it is applicable to the experience of medical student ESPs. In Case 1, the medical student ESP is hesitant to raise concerns about the station she was assigned because she is in an environment with individuals who may be mentors, future colleagues, or future supervisors. There is no clear figure for her to turn to with her concerns. She is apprehensive of the interpersonal risk of speaking up, asking to be assigned to another station, or choosing to leave, and the potential impact any one of these actions may have on her future training and career. This is not a psychologically safe environment and provides little recourse for a medical student who is at the bottom of the power differential. Additionally, from the case examples, setting expectations in advance would have helped prepare the ESPs for what they may experience or encounter during the event. Being informed in advance which station they were assigned to and who the learner population will be could have allowed opportunity to voice concerns. Informing the ESPs of the gamified nature of the event and potential for photography would also have been beneficial. Gamification improves outcomes by improving learning behavior and attitudes toward learning; therefore, it is a crucial part of hands-on education.16–18 However, without prebriefing, unpredictable stresses during training events, particularly those that are gamified, can create an unsafe environment for student volunteers.
examination. Educators may also encourage ESPs to drape themselves to promote bodily autonomy.
Sensitive Exams Medical educators are charged with safeguarding the physical safety of student volunteers as much as they are charged with safeguarding their psychological safety. Invasive ultrasound exams, such as pelvic exams with an endocavitary probe, exceed what a medical student volunteer would reasonably be expected to consent to. There is the particular risk of coercion if a medical student interested in financial compensation or professional networking is offered this compensation in return for an invasive educational exam. One ultrasound program describes the scope of allowable scanning as “G-rated modeling” and explicitly excludes examinations of the breasts, genitalia, and those that require use of an endocavitary probe.4 In addition to these explicitly sensitive exams, certain ultrasound examinations may require learners to scan adjacent to sensitive regions of the body. Like in Case 1, cardiac ultrasound inherently requires ultrasound examination of the chest. Similarly, duplex venous ultrasound and other studies involving the inguinal regions require examination near the groin. To best promote ESP autonomy and to avoid excessive paternalism based on gendered assumptions, ESPs should be informed of which body parts will be exposed during an exam and given the opportunity to decline a particular examination if it is not one they are comfortable with. Embedded simulation participants should also always be appropriately draped during any ultrasound
Equity The practice of financially compensating medical student ESPs may be construed as potentially coercive because medical students are a financially vulnerable population24 with few opportunities to earn money because of their rigorous coursework and schedules. Offering an experience with combined educational, professional, and small monetary compensation, however, may ultimately be a means of promoting multifactorial student wellness and benefit the students. Case 1 also raises an equity in recruiting issue: Some ultrasound programs at our institution have historically had a practice of recruiting only “male models” for their educational events to avoid performing ultrasounds on ESPs whose chests and upper bodies would be more sensitive to expose. Defining who fits the criteria of “male” is problematic and is additionally inequitable as then only “male models” are offered the potential educational, professional, and financial gain from being an ESP. Further, it may be a disservice to the ultrasound learners and their future patients to restrict the educational experience to a certain subset of the population when they will need to be able to use their skills on any patient in the future. As in the discussion of sensitive exams, supporting ESP autonomy in these scenarios involves being transparent about the type of exams that will be done, outlining steps that will be taken to promote ESP dignity and
Western Journal of Emergency Medicine
Incidental Findings In emergency medicine, where point-of-care ultrasonography (POCUS) is frequently used in clinical practice, resident and attending physicians have been found to encounter incidental findings on 9.4% to 26% of bedside ultrasounds.19,20 Thus, there is a reasonable likelihood an ESP may have an incidental finding while being scanned educationally. As already described in the literature, clear protocols should be proactively developed, so that facilitators know how to address incidental findings discovered in volunteer ESPs.21,22 It is important to prescan volunteers, so that these incidental findings may be encountered and discussed in a private setting; additionally, educators also have an obligation to provide guidance on next steps. This process is already codified in guidelines developed by the American Institute of Ultrasound in Medicine.23 In Case 3, it would be important to discuss the incidental finding, explain that it requires follow-up, and advise the ESP that he should make an appointment with his primary care physician for further evaluation. It is also important to ask the ESP whether they feel comfortable having that part of the body scanned with the incidental finding present, or if they prefer to be assigned to a different station that would not involve viewing that area.
1716
Volume 27, No. 6: November 2026
Chao et al.
Ethics of Medical Students as Embedded Simulation Participants in Ultrasound Education
comfort, and allowing ESPs to decide whether they are willing to participate. OBJECTIVES In response to concerns raised at our institution illustrated by these 4 cases, we designed and implemented a system of protections for ESPs that incorporate the key ethical principles and frameworks described above. DESIGN Consent Form In collaboration with legal counsel, the medical school’s standardized patient program, and a clinical ethicist, we created a best practice consent form for all activities involving human models for ultrasound learning. This document (Appendix 1) elaborates the relevant risks and benefits of ultrasound, including the risk of encountering incidental findings. Furthermore, the form describes the intent of the scanning exercise, the learning environment, the learner population, and potential gamification of the event. The ESPs are asked to specify whether they are pregnant or likely to be pregnant during the event given the theoretical risks that certain ultrasound applications may pose to fetuses.25 Among a list of options, ESPs are asked to mark which areas of the body they feel comfortable having examined. Contact information for one of the course leaders is also provided for them to direct any questions or concerns. Ombudsperson Role To support the physical and psychological safety of ESPs, an ombudsperson role was implemented. The purpose of the ombudsperson is to serve as a neutral third party to whom ESPs can voice concerns in real time and who can advocate on the ESPs’ behalf. Specifically, the ombudsperson is designed to be a faculty or staff member who is neither part of ultrasound leadership nor involved in the coordination of the educational event to avoid conflict of interest and optimize approachability. The ombudsperson is also assigned specific responsibilities and provided a tip sheet prior to the educational event. They are responsible for reviewing each ESP’s consent form before the event and ensuring the ESP’s assigned station aligns with the preferences indicated on their form. Embedded simulation participants are asked to arrive early to confirm their preferences verbally with the ombudsperson. The ombudsperson helps orient the ESP to the event by introducing them to their assigned instructor and their assigned station. They are present throughout the event, circulating among the ESPs to check in regularly. They need a clear reporting structure for addressing concerns as they arise. For example, the ombudsperson should be empowered to pause the learners as needed to intervene on learner behavior (ie, provide feedback on draping technique or amount of discomfort experienced by the ESP), facilitate change in Volume 27, No. 6: November 2026
station or assignment, or facilitate voluntary ESP withdrawal from the educational event. Implementation of the ombudsperson role, while beneficial in many respects, can also carry challenges. Volunteers for the role should be trained in advance with the opportunity to ask clarifying questions. It may be difficult to recruit faculty volunteers who are not invested in ultrasound education. Furthermore, compensating a faculty ombudsperson may lead to prohibitive expense. Volunteers who have an adjacent relationship to the student population, such as administrative staff and faculty advisors, may be an excellent fit. Not only are they already invested in student education, but they also commonly have strong relationships with the students and are motivated to care for their concerns. Further, it is important to have ESP consent forms readily available to the ombudsperson on the day of the event to review with students physically. This redundancy helps prevent misunderstandings about consent and which studies will be appropriate. Regulation of Photography and Social Media Posting Although we recognize the importance of social media in the era of virtual recruitment,26,27 given the risk of students having their photos taken in a potentially vulnerable circumstance (with bodily exposure for ultrasound examination), we changed the practice at our institution to more highly regulate photography during our educational events. Participants and instructors are specifically reminded to not include ESPs in any photos. We explicitly restricted photography during scanning activities and recommended that photography occur only at stations that do not use ESPs or in group photos before or after the event. We also encouraged our residency social media team to actively review photos to ensure no ESPs are present (even in the background) prior to interacting with event photos even if posted by others. Standardized Process for Identifying Incidental Findings After being introduced to their assigned instructor, ESPs are prescanned for potential incidental findings before the educational event begins. This allows for private discussion and counseling of the ESP should any findings be encountered. It also allows for the ESP to be assigned a different station if they would prefer that discovery of or discussion of the incidental finding be completely avoided. The general incidental finding protocol used at our institution is available as Supplemental Appendix 1. Standardized Recruitment and Compensation Process At our institution, we contact all medical students through a general call for volunteers via email listserv. An administrative assistant uses scripted language to describe the event and the roles and responsibilities of an ESP. Students are notified they will be compensated for their time with the compensation rate listed. Students contact the administrative
1717
Western Journal of Emergency Medicine
Ethics of Medical Students as Embedded Simulation Participants in Ultrasound Education staff member who then responds with a welcome email that details the types of ultrasounds that will be performed at the educational event, including the body parts that would be exposed and included in the exam. Our consent form is included. Students are given the opportunity to ask questions and to consent to any or none of the study types that will be performed. Once consent is received electronically, the students are added to the schedule and provided with appropriate logistical information.
ultrasound training programs across medical education, how these interventions and principles may evolve if ESP volunteers are not medical students (eg, if they are residents, fellows, faculty, or from other job families), and assess the implementation of these practices in different learning environments. An additional future direction for this work is the adaptation of these interventions to environments with fewer resources such as staffing and funding.
IMPACT AND EFFECTIVENESS The revised consent form, ombudsperson role, and other interventions were implemented in January 2024 in the emergency department at a large academic medical center affiliated with a medical school. At the time of writing this manuscript, approximately 96 ESP volunteers have participated across 16 educational events coordinated by the department since implementation of these interventions. In addition to medical students, some volunteers were nurses, administrative staff, and physician assistants. All 96 volunteers signed the revised consent form. Anecdotally, the revised consent form and presence of an ombudsperson have been positively received, with some participants noting that the consent form indicates a feeling of caring and that the department is serious about ESP comfort during educational events. Additionally, no photography concerns have arisen since implementation of these procedures. One unexpected consequence of our interventions challenged us to be more thoughtful regarding ESP privacy. As part of the consent process, ESPs were asked to identify on a form what areas of the body they felt comfortable having examined. In the early stages of implementation, this form was visibly posted at the station the ESP was assigned to. This ensured the ombudsperson, trainees, and preceptors would not forget what the ESP had consented to. However, posting this information in a highly visible way inadvertently led to compromised ESP privacy and discomfort if the ESP felt they had to justify why they did not consent to certain exams. In response, this information was kept in a more discreet location where it was still readily available for reference. LIMITATIONS This paper is limited to the experiences of a single institution, and we do not report a formal assessment of the effectiveness or perception of our developed interventions. Additional work could assess specific outcomes, including rates of ombudsperson intervention, station reassignment, ESPs declining examination of specific body regions, withdrawal from educational events, identification of incidental findings, and the impact of interventions on psychological safety using validated metrics. Further research can also explore medical student and ombudsperson perception of these implemented changes through survey or interview, the demographics of ESPs used by point-of-care Western Journal of Emergency Medicine
Chao et al.
CONCLUSION There are many benefits to using medical student volunteers as embedded simulation participants; however, proactive measures are necessary to support the autonomy and safety of these volunteers. Motivated by real concerns raised by medical students at our institution, we created a comprehensive volunteer consent form, designed a novel ombudsperson role intended to support the safety and comfort of volunteers during educational events, and created formal restrictions surrounding photography and social media posts related to these events. While these perceived improvements are pending formal evaluation, our hope is that other institutions who use medical students as simulated patients will consider implementing similar practices to promote the psychological and bodily safety of these volunteers.
Address for Correspondence: Samantha Chao, MD, University of Michigan, Department of Emergency Medicine, 1500 E Medical Center Dr, B1-380 Taubman Center, Ann Arbor, MI 48109. Email: skchao@umich.edu. Conflicts of Interest: By the WestJEM article submission agreement, all authors are required to disclose all affiliations, funding sources and financial or management relationships that could be perceived as potential sources of bias. No author has professional or financial relationships with any companies that are relevant to this study. There are no conflicts of interest or sources of funding to declare. Copyright: © 2026 Chao et al. This is an open access article distributed in accordance with the terms of the Creative Commons Attribution (CC BY 4.0) License. See: http://creativecommons.org/ licenses/by/4.0/
REFERENCES 1. Birrane J, Misran H, Creaney M, et al. A scoping review of ultrasound teaching in undergraduate medical education. Med Sci Educ. 2018;28(1):45-56. 2. Tarique U, Tang B, Singh M, et al. Ultrasound curricula in undergraduate medical education: a scoping review. J Ultrasound Med. 2018;37(1):69-82. 3. Hoppmann RA, Mladenovic J, Melniker L, et al. International consensus conference recommendations on ultrasound education for undergraduate medical students. Ultrasound J. 2022;14(1):31. 4. Blickendorf JM, Adkins EJ, Boulger C, et al. Trained simulated
1718
Volume 27, No. 6: November 2026
Chao et al.
Ethics of Medical Students as Embedded Simulation Participants in Ultrasound Education
ultrasound patients: medical students as models, learners, and
Educ. 2021;26(2):683-711.
teachers. J Ultrasound Med. 2014;33(1):35-38.
17. Krishnamurthy K, Selvaraj N, Gupta P, et al. Benefits of gamification
5. Lioce L, Lopreiato J, Downing D, et al. Embedded participant. In:
in medical education. Clin Anat. 2022;35(6):795-807.
Healthcare Simulation Dictionary. 2nd ed. Agency for Healthcare
18. Russell F, Lobo D, Herbert A, et al. Gamification of POCUS: Are
Research and Quality (AHRQ); 2020:16.
students learning? West J Emerg Med. 2023;24(2):243-248.
6. Boyer TJ, Mitchell SA. Utilization of embedded simulation personnel
19. Tewari A, Shuaib W, Maddu KK, et al. Incidental findings on bedside
in medical simulation. In: StatPearls. StatPearls Publishing; 2023.
ultrasonography: detection rate and accuracy of resident-performed
Accessed March 19, 2024. nih.gov.
examinations in the acute setting. Can Assoc Radiol J.
7. Keiser MM, Turkelson C. Using students as standardized patients:
2015;66(2):153-157.
development, implementation, and evaluation of a standardized
20. Valenzuela J, Stilson B, Patanwala A, et al. Prevalence,
patient training program. Clin Simul Nurs. 2017;13(7):321-330.
documentation, and communication of incidental findings in focused
8. Wu ML, Chao LF, Hung YT. Training students to serve as
assessment with sonography for trauma (FAST) examinations. Am J
standardized patients in an objective structured clinical examination
Emerg Med. 2020;38(7):1414-8.
is feasible: a mixed-methods study. Nurse Educ Pract.
21. Fox JC, Richardson A, Lopez S, et al. Implications and approach to
2024;79:104069.
incidental findings in live ultrasound models. West J Emerg Med.
9. Leyden K, Simpson KD. Maximizing nursing education by utilizing
2011;12(4):472-474.
nursing students as standardized patients. J Perianesth Nurs.
22. Siegel-Richman Y, Kendall JL. Incidental findings in student
2026;41(3):659-667.
ultrasound models: implications for instructors. J Ultrasound Med.
10. Burgess A, Clark T, Chapman R, et al. Medical student experience as simulated patients in the OSCE. Clin Teach. 2013;10(4):246-250.
2017;36(8):1739-1743. 23. American Institute of Ultrasound in Medicine. Live scanning for
11. Jagsi R, Lehmann LS. The ethics of medical education. BMJ.
educational purposes. 2017. Available at: https://www.aium.org/docs/
2004;329(7461):332-334.
default-source/official-statements-or-practice-parameters/
12. National Commission for the Protection of Human Subjects of
livescanning_66.pdf?sfvrsn=224f2624_1. Accessed August 4, 2026.
Biomedical and Behavioral Research. The Belmont report: ethical
24. Youngclaus J, Fresne JA. Physician education debt and the cost to
principles and guidelines for the protection of human subjects of
attend medical school: 2020 Update. 2020. Available at: https://www.
research. U.S. Department of Health, Education, and Welfare; 1979.
aamc.org/data-reports/students-residents/report/physician-education-
Available at: https://www.hhs.gov/ohrp/sites/default/files/the-belmont-
debt-and-cost-attend-medical-school. Accessed August 4, 2026.
report-508c_FINAL.pdf. Accessed August 4, 2026.
25. American Institute of Ultrasound in Medicine. Prudent use and safety
13. Chao SK, Liu YT, Kropf CW, et al. Consensus-based ethical best
of diagnostic ultrasound in pregnancy. American Institute of Ultrasound
practices for performing educational point-of-care ultrasonography in
in Medicine: Official Statements. 2020. Available at: https://www.aium.
the emergency department. AEM Educ Train. 2024;8(2):e10963.
org/resources/official-statements/view/prudent-use-and-safety-of-
14. Ajjawi R, Bearman M, Sheldrake M, et al. The influence of
diagnostic-ultrasound-in-pregnancy. Accessed March 19, 2024.
psychological safety on feedback conversations in general practice
26. Bernstein SA, Gu A, Chretien KC, et al. Graduate medical education
training. Med Educ. 2022;56(11):1096-1104.
virtual interviews and recruitment in the era of COVID-19. J Grad
15. Tsuei SHT, Lee D, Ho C, et al. Exploring the construct of psychological
Med Educ. 2020;12(5):557-560.
safety in medical education. Acad Med. 2019;94(11S):S28-35.
27. Brown CA, Jewell C, Haidar DA, et al. Best practices for video-based
16. Van Gaalen AEJ, Brouwer J, Schönrock-Adema J, et al. Gamification
branding during virtual residency recruitment. J Grad Med Educ.
of health professions education: a systematic review. Adv Health Sci
Volume 27, No. 6: November 2026
2021;13(1):6-10.
1719
Western Journal of Emergency Medicine
Original Research
Trends in Mushroom Exposures Reported to the Florida Poison Information Center Network, 2014–2024 Steven Chen, BA* Rebecca Lipscomb, MS† Rahul Mhaskar, PhD, MPH†‡ Diana Dean, MD*§||
*University of South Florida Morsani College of Medicine, Tampa, Florida † University of South Florida Morsani College of Medicine, Department of Medical Education, Tampa, Florida ‡ University of South Florida Morsani College of Medicine, Department of Internal Medicine, Tampa, Florida § University of South Florida, Department of Emergency Medicine, Tampa, Florida || Florida Poison Information Center – Tampa, Tampa, Florida
Section Editor: Howard Greller, MD Submission history: Submitted November 29, 2025; Revision received June 29, 2026; Accepted June 29, 2026 Electronically published October 14, 2026 Full text available through open access at http://escholarship.org/uc/uciem_westjem DOI 10.5811/westjem.56978
Introduction: Toxic mushroom exposures can occur through multiple mechanisms, including consumption as a delicacy, foraging, and use for psychoactive properties. Recent evidence suggests that psylocibin mushroom use is increasing in the United States. However, information on trends in mushroom poisonings in Florida is limited. This study aims to characterize trends in psychoactive and nonpsychoactive mushroom exposures reported to the Florida Poison Information Center Network (FPICN) over an 11-year period. Methods: This is a retrospective review of all mushroom exposures reported to the FPICN between 2014 to 2024. Our primary outcome was to evaluate the annual trend of psychoactive and nonpsychoactive exposures. Secondary outcomes included identifying patient demographics, exposure intent, clinical effects, and medical outcomes associated with each exposure type. Psychoactive mushrooms were defined as belonging to groups 2 (muscimol), 4 (muscarine and histamine), and 6 (psilocybin and psilocin) in the National Poison Data System coding manual. We performed statistical analyses using chi-square and Mann–Whitney tests, and joinpoint regression models. Results: A total of 2,995 mushroom exposures were reported. Psychoactive mushrooms comprised 15.6% (n = 467) of exposures and were more likely to involve males (72.5%, P < .001) and intentional ingestions (80.9%, P < .001). Joinpoint regression analysis showed that from 2014 to 2018, the rate of psychoactive mushroom exposures did not change significantly (annual percentage change [APC] = −1.5%; 95% CI, −35.9% to 19.3%; P = .88). In contrast, from 2018 through 2024, exposure rates increased significantly by an average of 34.4% per year (APC = 34.4%; 95% CI, 27.0%–60.4%, P < .001). These trends were standardized to overall poison center call volume. There were three deaths: a 67-year-old male (intentional–suspected suicide); an 81-year-old male (unintentional); and a 44-yearold female (unintentional), all involving mushrooms of unknown category. Conclusion: Psychoactive mushroom exposures in Florida have increased substantially since 2018, particularly among adolescents and adults, and were more commonly associated with intentional use. These findings may reflect changing cultural attitudes and increased accessibility. Further research is needed to better understand the evolving landscape associated with psychoactive mushroom use. [West J Emerg Med. 2026;27(6)1720–1726.]
Western Journal of Emergency Medicine
1720
Volume 27, No. 6: November 2026
Mushroom Exposures Reported to Poison Center in Florida
Chen et al. INTRODUCTION Mushroom poisoning is the ingestion of toxic substances produced by certain species of fungi, causing a wide range of clinical effects, from mild gastrointestinal distress to neuropsychiatric effects to severe end-organ damage.1 Most mushroom exposures are nonfatal and cause only minor effects.2 Most fatal poisonings originate from the cyclopeptide mushroom group, with Amanita phalloides accounting for the most fatalities.2 The National Poison Data System (NPDS), maintained by America’s Poison Centers, characterizes mushroom exposures by primary toxin or main symptoms into nine categories, including cyclopeptides, orellanine, muscimol, monomethylhydrazine, muscarine and histamine, hallucinogens (psilocybin and psilocin), coprine, gastrointestinal irritants, miscellaneous nontoxic and potentially toxic, and unknown.3 Toxic mushroom exposures can occur by a variety of mechanisms. In many cultures, certain mushroom species are prized as edible delicacies, although recent research has questioned the safety of some of these species.4 Mushroom foraging is also a popular tradition that occurs worldwide and in the United States. Foragers are at risk of misidentification of toxic mushroom species, especially in regions with a diverse array of toxic and nontoxic species.2 Amanita phalloides, for instance, is commonly misidentified by foragers for other edible mushroom species.5 Additionally, poisoning may also result from intentional ingestions of mushrooms for their psychoactive properties. Two main categories of psychoactive mushrooms exist: anticholinergic delirium-inducing mushrooms such as Amanita muscaria; and psilocybin mushrooms containing the lysergic acid diethylamide-like substance psilocybin and psilocin. Between 1999 and 2016, 7,428 cases of mushroom poisoning were reported per year to US poison centers.2 The majority (86%) of these exposures involved mushrooms of unknown types; however among known exposures, psychoactive mushrooms were identified as the most common group. Notably, recent evidence indicates that the prevalence of hallucinogen use including psilocybin mushroom ingestions has been increasing in the US in the last decade.6,7 Although these studies have characterized mushroom exposures nationally, regional analysis in a state such as Florida, which has a unique climate, biodiversity, and population, remains limited.6 With the growing popularity of intentional psychoactive mushroom use, the goal of this study was to describe temporal trends, exposure characteristics, and clinical outcomes of psychoactive and nonpsychoactive mushroom exposures reported to Florida poison centers over an 11-year period. METHODS This is a retrospective chart review of all mushroom exposures reported to the Florida Poison Information Center Volume 27, No. 6: November 2026
Population Health Research Capsule What do we already know about this issue? National data suggest that hallucinogen use, including psilocybin mushroom exposures reported to poison centers, has increased over the past decade. What was the research question? How have psychoactive and nonpsychoactive mushroom exposures changed over time in Florida? What was the major finding of the study? Since 2018, psychoactive mushroom exposures increased by 34.4% per year (95% CI, 27.0%– 60.4; P < .001). How does this improve population health? Understanding the changing trends in psychoactive mushroom exposures in Florida can inform prevention efforts and poison center preparedness.
Network (FPICN), which includes exposures reported from home and/or healthcare institutions. The FPICN includes three poison centers across the state and, as a network, manages an average of 98,006 overall exposures per year. We obtained exposure data from the FPICN database from January 1, 2014 to December 31, 2024. Each record represents a single exposure or case, including the initial poison center call and any associated follow-up calls for that case. Records contain standardized codes derived from the National Poison Data System manual and entered by trained poison center personnel. No additional manual chart review was performed. Basic data quality checks were conducted to assess completeness and consistency of key variables. Records included call date, age, sex, reason for exposure, category of mushroom exposure, clinical effects, and medical outcomes. Medical outcome severities and categories of mushrooms were derived from the National Poison Data System coding manual (Appendix A).3 For this study, “psychoactive” mushroom exposures were defined by having the potential to cause mind-altering or neurobehavioral clinical effects. Psychoactive mushrooms were defined as those belonging to groups 2, 4, and 6. Figure 1 contains a study flow diagram illustrating excluded cases and the division between psychoactive and nonpsychoactive exposures. We excluded records that were coded as informational
1721
Western Journal of Emergency Medicine
Mushroom Exposures Reported to Poison Center in Florida
Chen et al.
Figure 1. Study flow diagram for mushroom exposures reported to the Florida Poison Information Center Network between 2014–2024, sorted by presence or absence of psychoactive mushroom groups in each exposure. FPICN, Florida Poison Information Center Network.
requests on mushrooms. Exposures coded via routes that were not ingestions were also excluded, as well as exposures in which there were multiple identified generic mushroom categories. Chi square tests were used to compare categorical independent variables between psychoactive and nonpsychoactive mushroom exposures. We used Mann– Whitney tests to compare patient age between psychoactive and nonpsychoactive exposures and joinpoint regression models to evaluate temporal trends. P values < .05 were considered statistically significant. Missing data for a specific variable (eg, age, sex, intent) were excluded from any analyses involving those variables. Analysis was done using SPSS, version 30 (IBM Corporation, Armonk, NY). The study was reviewed by the institutional review board (IRB) and deemed exempt by the host institution. Our study was compliant with the following medical record review criteria: case selection criteria; variable definition; abstraction forms; sampling method; and IRB approval.8 This study was conducted and reported in accordance with the Strengthening the Reporting of Observational Studies in Epidemiology (STROBE) guidelines for observational studies.
unknown category mushroom exposure categorized as intentional, suspected suicide; an 81-year-old male with an unintentional, unknown category mushroom exposure; and a 44-year-old female with an unknown category mushroom exposure categorized as unintentional, misuse. Most exposures (2,297/2,995; 76.7%) were coded as an unknown mushroom exposure. A total of 467 exposures (15.6%) were characterized as exposures to a psychoactive mushroom group (NPDS-defined groups 2, 4, 6). Specifically, muscarine and histamine mushrooms (group 4) were reported in 6 cases, muscimol (group 2) in 24 cases, and hallucinogenic varieties (psilocybin and psilocin, group 6) in 437 cases. Table 1 shows the number of exposures over the 11-year period by
RESULTS From January 1, 2014, to December 31, 2024, 2,995 mushroom exposures were reported to the FPICN. The age distribution of all exposures ranged from 1 month to 96 years old, with a median age of 10. Exposures were most commonly unintentional (1,754/2,995 [58.6%]) and resulted in no effect (947/2995 [31.6%]). Throughout the 11-year study period, there were three reported deaths: a 67-year-old male with an Western Journal of Emergency Medicine
Table 1. Mushroom exposures by toxin group in a study describing mushroom exposures reported to the Florida Poison Information Center. 1 Cyclopeptides 39 1A
Orellanine
1
2
Muscimol (Ibotenic Acid)*
24
3
Monomethylhydrazine (MMH)
0
4
Muscarine and histamine*
6
5
Coprine
1
6
Hallucinogenic (Psilocybin and Psilocin)*
437
7
Gastrointestinal irritants
95
Miscellaneous, nontoxic, other potentially toxic
95
Unknown 2,297 *Psychoactive mushrooms were defined as those belonging to groups 2, 4, and 6.
1722
Volume 27, No. 6: November 2026
Mushroom Exposures Reported to Poison Center in Florida
Chen et al. toxin group. Of the 467 exposures caused by psychoactive mushrooms, 378 (80.9%) were intentional, with most cases classified as abuse (298/467; 63.8%) followed by suspected suicides (60/467; 12.8%). Suspected suicides included suicide attempts and one completed suicide (the 67-year-old male referenced above). Compared to nonpsychoactive exposures, psychoactive exposures were more likely to involve male patients (337/465 [72.5%] vs 1,538/2,520 [61.0%]) and intentional (378/467 [80.9%] vs 769/2,528 [30.4%]). Psychoactive cases were also more frequent among individuals aged 18 years and older (292/450 [64.9%] vs 833/2,461 [33.8%]) and those aged 6 to 17 years (124/450 [27.6%] vs 339/2,461 [13.8%]; all P < .001). Furthermore, psychoactive exposures resulted in higher rates of major (17/467 [3.6%] vs 34/2,528 [1.3%]), moderate (152/467 [32.5%] vs 235/2,528 [9.3%]), and minor medical exposures (178/467 [38.1%] vs 577/2,528 [22.8%]; all P < .001). Among psychoactive exposures, the most common clinical effects were hallucinations or delusions (149/467 [31.9%]), agitation (140/467 [30.0%]), tachycardia (104/467 [22.2%]), central nervous system depression (78/467
[16.7%]), confusion (71/467 [15.2%]), hypertension (64/467 [13.7%]), and vomiting (48/467 [10.3%]). Among nonpsychoactive exposures, the most common clinical effects were vomiting (563/2,528 [22.3%]), nausea (380/2,528 [15.0%]), diarrhea (227/2,528 [9.0%]), abdominal pain (226/2,528 [8.9%]), tachycardia (140/2,528 [5.5%]), hallucinations or delusions (128/2,528 [5.1%]), agitation (120/2,528 [4.7%]), and hypertension (85/2,528 [3.4%]). Comparative statistics between psychoactive and nonpsychoactive exposures are shown in Table 2. For psychoactive exposures between 2014 to 2024, joinpoint regression analysis identified one significant change in trend in 2018 (95% CI, 2016–2022). From 2014 to 2018, the rate of psychoactive mushroom exposures did not change significantly (APC = −1.5%; 95% CI, −35.9% to 19.3%, P = .88). In contrast, from 2018 through 2024, exposure rates increased significantly by an average of 34.4% per year (APC = 34.4%; 95% CI, 27.0%–60.4%, P < .001) (Figure 2). These temporal trends were standardized with the total call volume to FPICN each year between 2014 and 2024. The increase in psychoactive mushroom exposures was
Table 2. Comparative statistics between psychoactive and nonpsychoactive mushroom exposures in a study describing mushroom exposures reported to the Florida Poison Information Center. Variable Intentional/Unintentional Intentional Unintentional Sex** Age group**
Medical outcome
Nonpsychoactive (n = 2,528)
Psychoactive (n = 467)
Total (N = 2,995)
P value
769 (30.4)
378 (80.9)
1,147 (38.3)
< .001
1,678 (66.4)
76 (16.3)
1,754 (58.6)
Other
50 (2)
3 (0.6)
53 (1.8)
Male
1,538 (61)
337 (72.5)
1,875 (62.8)
Female
982 (39)
128 (27.5)
1,110 (37.2)
< 6 years
1,289 (52.4)
34 (7.6)
1,323 (45.4)
6-17 years
339 (13.8)
124 (27.6)
463 (15.9)
> 18 years
833 (33.8)
292 (64.9)
1,125 (38.6)
3 (0.1)
0 (0)
3 (0.1)
Followed to known outcome—death or indirect report of death Followed to known outcome—major effect
34 (1.3)
17 (3.6)
51 (1.7)
Followed to known outcome— moderate effect
235 (9.3)
152 (32.5)
387 (12.9)
Followed to known outcome—minor effect
577 (22.8)
178 (38.1)
755 (25.2)
Followed to known outcome—no effect
923 (36.5)
24 (5.1)
947 (31.6)
Unable to follow— judged potentially toxic exposure
392 (15.5)
72 (15.4)
464 (15.5)
75 (3)
1 (0.2)
76 (2.5)
289 (11.4)
23 (4.9)
312 (10.4)
5 [2,22]
20 [17,28]
10 [2,24]
Not followed—judged non-toxic Not followed—judged minimal clinical effects possible Age (years)*
< .001 < .001
< .001
< .001
Values are N(%) unless otherwise specified. *Median. **10 cases were missing values for sex and removed from analysis involving sex; 84 cases were missing values for age and removed from analysis involving age.
Volume 27, No. 6: November 2026
1723
Western Journal of Emergency Medicine
Mushroom Exposures Reported to Poison Center in Florida
Chen et al.
Figure 2. Joinpoint regression analysis of temporal trend of psychoactive mushroom exposures to Florida Information Center per year between 2014 and 2024. *Indicates that the Annual Percent Change is significantly different from zero at the alpha = .05 level. Final Selected Model: 1 Joinpoint. APC, annual percentage change.
observed across multiple age groups and exposure intents. The age groups of individuals 6 to 17 years of age and those 18 years or older had the largest absolute increase in psychoactive exposures over the study period. Among children younger than 6 years of age, there were no psychoactive exposures before 2019, increasing up to nine psychoactive exposures in 2022, 10 exposures in 2023, and nine exposures in 2024. When subcategorized by intent, unintentional psychoactive exposures increased from one or zero exposures per year between 2014 and 2018 to 17 exposures per year in both 2023 and 2024. Intentional psychoactive exposures increased from 12 exposures in 2014 to 91 exposures in 2024. The trend of psychoactive exposures categorized by intent and age group can be seen in Figure 3. DISCUSSION This retrospective study provides insight into the changing landscape of mushroom exposures, especially psychoactive mushroom exposures, in Florida over the past 11 years. Our findings demonstrate an increase in psychoactive mushroom exposures, particularly after 2018, associated with notable rises in both intentional and unintentional exposures across multiple age groups. Our results align with broader societal trends, such as increased media coverage, public interest, and law enforcement seizures of psychoactive mushrooms.9-11 Our data also corroborate recent literature showing similar trends showing a significant increase in the number of psilocybin-related exposures in the last decade.6 Among all mushroom exposures, the majority were Western Journal of Emergency Medicine
Figure 3. Psychoactive exposures per year reported to the Florida Poison Information Center by age group and intent.
reported in children younger than six years of age, likely representing exploratory and unintentional ingestions common in this age group.12 In contrast, psychoactive mushroom exposures were significantly more common among children older than six, adolescents, and adults. These exposures were more likely to be intentional and were also associated with a higher incidence of major, moderate, and minor medical outcomes. Fatalities were rare and were all unknown mushroom exposures. It is unclear why psychoactive mushroom exposures were associated with a higher frequency of more severe medical outcomes. This result may be confounded by age, exposure intent, healthcare use, or other factors not evaluated in this study. Nevertheless, recent literature has demonstrated that psychoactive mushroom exposures can lead to a range of clinical effects, including mental status changes, dysrhythmias, and seizures.13,14 The rise in psychoactive mushroom exposures may reflect increased access to these substances as well as changing social perceptions concerning their use, potentially associated with decriminalization efforts and increased research and coverage of their therapeutic benefits.15-17 These changes may also reflect shifts in substance use patterns related to the stress and psychosocial effects of the COVID-19 pandemic, given that prior literature has demonstrated a rise in the use of other psychoactive substances, such as alcohol and cannabis, during the pandemic.18 The largest increase was observed in individuals 6 to 18 years of age, which includes adolescent exposures and is particularly concerning as it may suggest a need for targeted prevention efforts, especially in the context of social media influence and misperceptions about the safety of psilocybin-containing mushrooms. Increased exposures in younger children could reflect increased presence of psychoactive mushrooms in their home environment given known exploratory behaviors of this age group.12
1724
Volume 27, No. 6: November 2026
Mushroom Exposures Reported to Poison Center in Florida
Chen et al. LIMITATIONS The study had several notable limitations. Our dataset is subject to reporting bias because it may not be a complete representation of all cases of mushroom exposures in the FPICN region, given that this data relies on passive and voluntary reports from healthcare clinicians or calls from the public. Therefore, the number of true mushroom exposures in Florida was likely higher than the number captured in the FPICN database. Data may be skewed toward cases of higher complexity as clinicians may be less likely to report cases where medical management is considered relatively uncomplicated. Similarly, some hospitals with on-site toxicology services may manage mushroom exposures without consultation with the FPICN except in more severe cases. Another significant limitation is the inability to confirm the identification or categorization of mushrooms for most exposure cases. The FPICN is a network of three different poison centers with differing staffing procedures and practices that may inherently vary. As a general practice, we encourage our specialists in poison information to obtain photographs of mushrooms whenever possible and discuss case details with the toxicologist on call. However, we were unable to extract data on which cases included photographs or what the identification result was. None of the FPICN toxicologists are mycologists, and while we are aware that consultation with a local mycologist may occur, we have no record of the cases on which they may have been consulted. Thus, it is not surprising that in most cases the mushrooms were unidentified (76%), which significantly limits the ability to report on exposure trends. Additionally, data on the severity of medical outcomes were coded by NPDS coding definitions and was not independently clinically validated. They may therefore be influenced by reporter information and follow-up completeness. The temporal trends observed in this study may have been influenced by changes in FPICN coding practices, staffing, poison center awareness and usage, or reporting practices over time. Although our joinpoint analysis identified 2018 as an inflection point in the temporal trends, this was an exploratory finding rather than a prespecified outcome; therefore, these results should be interpreted with caution.
Address for Correspondence: Steven Chen, BA, University of South Florida, Morsani College of Medicine, 560 Channelside Drive, Tampa, FL 33602. Email: schen1@usf.edu.
CONCLUSION Psychoactive mushroom exposures reported to Florida poison centers increased significantly during the study period, particularly intentional exposures among individuals older than six years of age. These trends may reflect cultural shifts, accessibility, changing attitudes toward hallucinogenic substances, or other factors not evaluated in this study. Further research should be conducted to better characterize the changing trends in mushroom exposures and their clinical implications.
10. Ziff S, Stern B, Lewis G, et al. Analysis of psilocybin-assisted therapy
Volume 27, No. 6: November 2026
Conflicts of Interest: By the WestJEM article submission agreement, all authors are required to disclose all affiliations, funding sources and financial or management relationships that could be perceived as potential sources of bias. No author has professional or financial relationships with any companies that are relevant to this study. There are no conflicts of interest or sources of funding to declare. Copyright: © 2026 Chen et al. This is an open access article distributed in accordance with the terms of the Creative Commons Attribution (CC BY 4.0) License. See: http://creativecommons.org/ licenses/by/4.0/
REFERENCES 1. Wennig R, Eyer F, Schaper A, et al. Mushroom poisoning. Dtsch Arztebl Int. 2020;117(42):701-708. 2. Brandenburg WE, Ward KJ. Mushroom poisoning epidemiology in the United States. Mycologia. 2018;110(4):637-641. 3. American Association of Poison Control Centers. National Poison Data System (NPDS) Coding User Manual. Version 3.1. NPDS; 2014. 4. White J, Weinstein SA, De Haro L, et al. Mushroom poisoning: a proposed new clinical classification. Toxicon. 2019;157:53-65. 5. Garcia J, Costa VM, Carvalho A, et al. Amanita phalloides poisoning: mechanisms of toxicity and treatment. Food Chem Toxicol. 2015;86:41-55. 6. Farah R, Kerns AF, Murray AC, et al. Psilocybin exposures reported to US poison centers: national trends over a decade. J Adolesc Health. 2024;74(5):1053-1056. 7. Salas-Wright CP, Hodges JC, Hai AH, et al. Toward a typology of hallucinogen users in the United States. Drug Alcohol Depend. 2021;229(pt B):109139. 8. Worster A, Bledsoe RD, Cleve P, et al. Reassessing the methods of medical record review studies in emergency medicine research. Ann Emerg Med. 2005;45(4):448-451. 9. Reinert JP, Colunga K, Etuk A, et al. Management of overdoses of salvia, kratom, and psilocybin mushrooms: a literature review. Expert Rev Clin Pharmacol. 2020;13(8):847-856. in medicine: a narrative review. Cureus. 2022;14(2):e21944. 11. Palamar JJ, Fitzgerald ND, Carr TH, et al. National and regional trends in seizures of shrooms (psilocybin) in the United States, 2017-2022. Drug Alcohol Depend. 2024;258:111086. 12. Shannon M. Ingestion of toxic substances by children. N Engl J Med. 2000;342(3):186-191. 13. Gartner HT, Wan HZ, Simmons RE, et al. Psychedelic mushroom-
1725
containing chocolate exposures: case series. Am J Emerg Med. 2024;85:208-213.
Western Journal of Emergency Medicine
Mushroom Exposures Reported to Poison Center in Florida
Chen et al.
14. Simon MW, Olsen HA, Hoyte CO, et al. Clinical effects of psychedelic
17. Hallock RM, Dean A, Knecht ZA, et al. A survey of hallucinogenic
substances reported to United States poison centers: 2012 to 2022.
mushroom use, factors related to usage, and perceptions of use
Ann Emerg Med. 2024;84(6):605-618.
among college students. Drug Alcohol Depend. 2013;130(1-3):245-
15. Bhave A. Magic of the mushrooms: Effects of psilocybin
248.
decriminalization. J Psychoactive Drugs. 2025;57(4):421-430.
18. Ross JA, Malone PK, Levy S. The impact of the severe acute
16. Matzopoulos R, Morlock R, Morlock A, et al. Psychedelic mushrooms
respiratory syndrome coronavirus 2 (SARS-CoV-2) pandemic on
in the USA: knowledge, patterns of use, and association with health
substance use in the United States. Clin Infect Dis. 2022;75(suppl
outcomes. Front Psychiatry. 2022;12:780696.
1):S81-S85.
Western Journal of Emergency Medicine
1726
Volume 27, No. 6: November 2026
Original Research
Impact of a Mentored Peer-Review Program on the Sponsoring Journal: Program Evaluation at Five Years Jeffrey N. Love, MD, MHPE, MSc* David P. Way, MEd† Wendy C. Coates, MD‡ Anne M. Messman, MD, MHPE§ Chris Merritt, MD, MPH, MHPE|| Douglas S. Ander, MD# Jonathan S. Ilgen, MD, PhD¶
*Georgetown School of Medicine, Department of Emergency Medicine, Washington, District of Columbia † Ohio State University College of Medicine, Department of Emergency Medicine, Columbus, Ohio ‡ David Geffen School of Medicine UCLA, Department of Emergency Medicine, Los Angeles, California § Wayne State University School of Medicine, Department of Emergency Medicine, Detroit, Michigan Institutions continued at end of article
Section Editor: Jeffrey Druck, MD Submission history: Submitted April 6, 2026; Revision received June 17, 2026; Accepted July 9, 2026 Electronically published October 21, 2026 Full text available through open access at http://escholarship.org/uc/uciem_westjem DOI 10.5811/westjem.64401
Introduction: The number of peer-reviewed biomedical journals has more than tripled over the past 20–25 years increasing the demand for quality peer reviewers. This demand and the lack of available formal training in peer review have resulted in a shortage of qualified peer reviewers. In response to this shortage, the Western Journal of Emergency Medicine Special Issue in Education (Special Issue) developed a formal mentored peerreview (MPR) program that provides a learning experience in peer review to educate fellows through legitimate participation while contributing to the editorial process of the journal. The latter serves as the basis of this study. Methods: The impact of the MPR program on the Special Issue’s reviewer pool served as the primary outcome of this study. This was accomplished by tracking the number of participating fellowships and their graduates who subsequently provided independent peer reviews for the sponsoring journal. Comparisons of MPRs generated by education fellows and their fellowship directors to those generated by our nonmentored faculty reviewers served two secondary outcomes: the quality of peer reviews and time from peer review offer to submission of the requisite peer reviews. Results: Over a period of five years, 82 fellows mentored by 43 fellowship directors submitted 147 MPRs. Of the 60 MPR graduates (35%), 21 were retained as independent peer reviewers. Based on a five-point editorial scoring scale (5 being excellent) mentored peer reviews received significantly higher editorial ratings (4.13 [SD 0.8]) than nonmentored faculty reviews (traditional reviewers) (3.33 [1.04]) and independent reviews by program graduates (3.61 [0.84]] (P < .001). We evaluated two peer-review turnaround periods. The first was the time from the initial two offers to review until two offers had been accepted. Instances where the first two offers were randomly made to MPRs were compared to offers to nonmentored faculty reviewers. The latter group took 60.2 (32.0) days compared to the MPR group, which averaged 17.2 (16.7) days (P < .001). The second interval measured the time from reviewer acceptance of the peer review until they submitted their completed review. There was no difference between the time in days between MPRs (10.4 [7.9]) and nonmentored faculty (9.4 [8.1]) in submitting reviews that had been accepted. Conclusion: The mentored peer-review program contributed to increasing the Special Issue’s reviewer pool with reviews of higher quality. In addition, by inviting two mentored peer-reviewers initially as compared to nonmentored faculty reviewers, the time frame for obtaining two secured peer-reviewers was significantly reduced. These findings demonstrate that a formalized approach to learning peer review by partnering with academically oriented fellowships has the potential to improve the availability of peer reviewers, the quality of peer reviews, and efficiency in the editorial review process. [West J Emerg Med. 2026;27(6)1727–1734.]
Volume 27, No. 6: November 2026
1727
Western Journal of Emergency Medicine
Mentored Peer-Review Program Evaluation at Five Years
Love et al.
INTRODUCTION Peer review is critical to the integrity of the scientific process by improving the quality of and curating the best possible submissions for publication. The number of journals in academic medicine has significantly increased over the years, demonstrating exponential growth in the digital age and further increasing the demand for peer reviews.1-3 This demand, along with the lack of available formal training in peer review, has resulted in an insufficient number of qualified peer reviewers available to meet the needs of many journals.4-9 The result is often substandard reviews and delays in editorial decision-making, which frustrates authors submitting their work for publication and limits the journal’s ability to publish important studies in a timely fashion.2,10-12 Many peer reviewers feel that they are ill-prepared for their roles.13-15 Engagement of established reviewers has been further confounded by the perceived time commitment required for activities that are largely unrecognized and unrewarded.15-19 Authors and journals have attempted to bridge this training gap by offering lectures, workshops, just-in-time resources, and published papers.16,20-23 Despite these efforts, journal editors continue to struggle with limited pools of qualified reviewers.10-12 To better prepare potential reviewers, there has been a call for more reliable processes to teach skills for performing peer reviews.13, 24-27 A number of authors have advocated for mentored peer reviews (MPR) as an effective approach to developing the knowledge and skills required to successfully fulfill this role.2,28-30 Preliminary reports from those who were coached or mentored through the peer review process have demonstrated mixed results. Two studies reported that participants generally enjoyed enhanced self-efficacy and a better understanding of research methodology but did not demonstrate improved peer review quality.28-30 One journalbased program recently reported outcomes based on a sixmonth curriculum that paired residents or fellows with experienced mentors. They reported via a preselected casebased study followed by mentorship that the quality of the postintervention mentee’s independent review of the same manuscript significantly improved over the mentee’s independent preintervention version.32 While some journals are willing to provide MPR opportunities to novice reviewers, formalized journal-based programs on a larger scale are uncommon. The need for additional administrative efforts, identifying qualified mentors, creating and validating a curriculum and establishing effective mentoring relationships tends to limit such efforts.29-34 Consistent with the Council of Residency Directors in Emergency Medicine’s mission to “Lead the advancement of emergency medicine education,”35 a partnership was formed with the Western Journal of Emergency Medicine to create an annual Special Issue in Educational Research and Practice (henceforth referred to as the “Special Issue”). In 2019, the editors of the Special Issue developed a curriculum for a Western Journal of Emergency Medicine
Population Health Research Capsule What do we already know about this issue? There is a shortage of peer reviewers available to journals, as well as a lack of effective learning opportunities for those who want to learn this skill. What was the research question? What is the impact of a journal-based mentored peer-review program (MPR) on the editorial process of that journal? What was the major finding of the study? The MPR program increased the reviewer pool by 54, provided significantly greater quality reviews [4.13(.82)/3.33(1.04)] (P < .001), and shortened turnaround time. How does this improve population health? Increasing the quality of medical education journals’ peer review process has the potential to improve medical education and, in turn, patient care.
novel, evidence-based MPR program using Kern’s six-step approach and an educational experience grounded in legitimate peripheral participation.36 Evaluating the impact of the MPR program on the Special Issue’s editorial process over its first five-year period was the objective of this study. We hypothesized a positive impact on the pool of available peer reviewers, as well as improved quality and turnaround time of the MPRs. METHODS This prospective, observational program evaluation employed a quasi-experimental design with nonequivalent groups to establish a clear temporal relationship between the intervention and its outcomes. The 2020–2024 annual Special Issues editorial process served as the basis for the outcomes reported. The George Washington Institutional Review Board approved this study as exempt (NCR202845). Informed consent was given, and participation was voluntary. Efforts were made to ensure that the data and privacy were properly protected and managed. The MPR program engaged 35 emergency medicine (EM) education fellowships over the five-year course of this investigation. These fellowships focus on developing expertise in medical education, pedagogy, instructional design and/or
1728
Volume 27, No. 6: November 2026
Mentored Peer-Review Program Evaluation at Five Years
Love et al. medical education research. Emergency medicine education fellowships are of either one or two years in duration, with the latter being more likely to have a scholarly orientation.36 Of the participating programs, 34 of 35 (97.1%) offer a two-year fellowship, many including a master’s degree in education. The directors of these programs are highly qualified educators and researchers, whereas their fellows typically have little experience as authors or peer reviewers.36 Three groups made up the pool of reviewers that were compared in this study: our traditional nonmentored faculty reviewers (controls); MPRs from participating fellowships; and graduates of our MPR program who subsequently provided independent reviews. Once a manuscript passed administrative review and received approval for formal review, the opportunity to peer review was assigned on a random basis regardless of subject matter or complexity. When MPRs were selected, the corresponding fellowship director was sent an invitation to participate by the coordinating study author (JNL). If accepted, the fellow was listed as the reviewer on the journal website to blind the editors as to whether the review was an MPR or not. Time to Secure Two Peer Reviewers Per Manuscript The first period tracked was the time from the initial two offers to review until two reviewers had accepted the opportunity. The Special Issue’s standard was to allow potential reviewers two weeks to respond, with a reminder at one week. If no answer was received, another reviewer was selected. To compare nonmentored faculty reviewers to MPRs, we measured only those instances in which two nonmentored faculty or two MPRs received the initial offer. This approach was adopted as the most direct measurement of the impact of this time frame on the editorial turnaround time as well as to gain a better understanding of any delays that occurred. There were insufficient numbers of MPRs for this to occur randomly prior to 2023. Turnaround Time for Reviews The second interval was the time from when each accepting reviewer (controls or MPR) was provided access to the manuscript until the submission of the completed review. Completion of peer review was requested within two weeks of gaining access to the manuscript. Extensions were provided by decision editors as needed and were counted toward measurement of this metric. This period was tracked to determine whether the collaborative interaction expected from the MPR process and subsequent submission of the reviews by the fellow would prolong this phase of the editorial process. Since collaboration is not an issue for traditional reviewers or fellowship graduates providing independent reviews, the data from these two groups regarding completion of reviews were combined. Review Quality The quality of each submitted review was scored by one Volume 27, No. 6: November 2026
of two editors and one of eight section editors assigned to that manuscript. The final score for each review consisted of the mean of the editor’s and the section editor’s scores. Scoring was guided by the Special Issue’s holistic editorial scoring rubric, which uses a five-point scale with anchors for each point. As an abbreviated summary, a score of 5 represents a thorough review that could stand alone as an overall evaluation of a manuscript; 4, a review that contributes substantially to the formal decision-making; 3, meets the standard of an acceptable review by providing meaningful input to decision-making but is incomplete; 2, provides some insights but does not make a substantive contribution to decision-making; and 1, fails to provide any meaningful insights.37 Validity evidence supporting the use of this scale in the current population has previously been published.37 Editors were blinded to each other’s scores by submitting to a blinded third person.37 Overall review quality, as determined by mean scores and the percentage of reviews scoring greater than 4.0 (“gold standard reviews”), was compared among controls, MPR and MPR graduates. For the latter group, comparisons were made to provide an understanding of this cadre’s ability to provide quality independent peer reviews following graduation from their fellowship. The process by which MPR graduates were evaluated for the potential to serve as independent reviews upon graduation has previously been described.36 Data Analysis When comparing controls, we analyzed MPR and MPR graduates scoring of review and turnaround times via t-test and the Levene test of equality of variances to assess whether the variances of two or more groups were equal. If a variance was found, Cohen d was applied as a standardized measure of the practical significance of the observed difference: 0–0.1 = no effect; 0.2–0.4 = small effect; 0.5–0.7 = intermediate effect; and greater than 0.8 = large effect. In addition, we tracked counts, frequencies, percentages and applied associated descriptive statistics related to demographics where appropriate. Temporal Changes in Reviewer Pool Composition The impact of the MPR program on the number available new reviewers was evaluated first by annually tracking the number of participating fellowship programs, MPRs, and fellowship graduates providing independent peer reviews. We also tracked the percentage of the total annual reviews represented by these groups. RESULTS Reviewer Pool Size Over this five-year period, 43 fellowship directors served as mentors in the MPR program. This is more than the number of participating programs due to turnover in the fellowship director position. A review of the Special Issues published since its inception in 2014 reveals that only two of these
1729
Western Journal of Emergency Medicine
Mentored Peer-Review Program Evaluation at Five Years
Love et al.
mentors (4.7%) served in the role of independent peer reviews for this journal prior to their involvement in the program. Over the study period, 82 fellows participated in this study through one or more mentored peer reviews. Of the 60 fellowship graduates, 21 (35.0%) have gone on to provide independent peer reviews for this journal since graduating. Table 1 provides the annual number of MPRs and MPR graduates providing independent peer reviews, as well as their impact on the overall number of reviews and recognition as gold standard reviewers. Review Quality Editorial evaluation of review quality, based on the Special Issue’s holistic editorial scoring rubric of traditional, MPRs, and independent reviews of graduates, is reported in Table 2. The Student‒Newman‒Keuls (post hoc test indicated that the MPR group reviews scored significantly higher in quality than did the other two groups (nonmentored faculty and MPR graduates). Furthermore, there was no difference between the quality scores of nonmentored faculty reviewers and those submitted by graduates of the MPR program. (Table 2) Time to Secure Two Peer Reviewers The first editorial period assessed was from the time when the first offers were made until two review opportunities were accepted in instances when the first two were MPRs versus two control reviewers were compared (Table 3). The difference between the means of the two groups was 43 days (P < .001). Issues that led to delays in obtaining two acceptances are highlighted in Figure. Note the number of “no answers” and “refusals” in comparing the two groups and the delays. Turnaround Time for Reviews After accepting the review, the next period tracked was from the time in days—from gaining access to the manuscript
until the review was submitted to the journal. The mean turnaround time in days for controls (n = 305) was 9.4 (8.1) days versus 10.4 (7.9) days for MPRs (n = 138). There was no statistical difference between the two groups (P = .21). DISCUSSION The MPR program was initiated five years ago as a professional development opportunity for education fellows. Since that time, the program has had a significant effect on the Special Issue’s peer-review process by the increasing number of participating programs and their graduates who subsequently provide independent reviews. This growth continues to increase annually. Secondly, the participating MPR programs provided higher quality reviews than did our traditional nonmentored faculty. Finally, the MPRs had a shorter turnaround time of peer reviews, which facilitated timely editorial decision-making. The impact of the MPR program on the growing number of peer reviewers is the result of several factors. First, the number of participating education fellowship programs grew from 14 to 35 programs over the five-year period since the program’s inception. A total of 41 fellowship directors recognized the value of this skill- development opportunity for their fellows and thus chose to participate in the Special Issue MPR program. This participation has resulted in a reliable cadre of high-quality reviewers for the Special Issue. Over the past three years, the MPRs have been responsible for nearly 50% of the peer reviews required by the Special Issue. Over this same period, the number of manuscript submissions decreased, limiting our ability to expand opportunities to interested fellowships or to fully realize the potential value of this initiative to participants and the journal. A second way in which the MPR program has contributed to the pool of peer reviewers is by offering graduates the opportunity to provide independent peer reviews on which they continue to receive feedback based on the decision editor’s summary and the second reviewer’s comments. The number of such reviewers
Table 1. Indices regarding the impact of a mentored peer-review program on the editorial review process of the Special Issue in Educational Research and Practice over the five-year study period. 2020
2021
2022
2023
2024
Education Fellowships
Issue year
14
19
27
30
35
MPRs (% Total Reviews)
9.7% (16/165)
29.5% (38/129)
42.1% (32/83)
47.4% (27/57)
49.3% (34/69)
MPRs (% of All Gold Standard Reviews)
50.0% (10/20)
35.3% (6/17)
81.0% (17/21)
82.4% (14/17)
54.5% (12/22)
0
1
2
12
21
Graduates (% Total Reviews)
0.0% (0/165)
0.7% (1/129)
2.4% (2/83)
21.1% (12/57)
30.4% (21/69)
Graduates (% of Gold Standards Reviewers)
0.0% (0/20)
5.0% (1/17)
4.8% (1/21)
11.8% (2/17)
18.2% (4/22)
Graduates (Reviewers)
Graduates represent prior MPR participants providing independent peer review following graduation. Gold standard review status is achieved by a blinded editor’s scoring of > 4.0 on a 1–5 scale ( 5 being excellent). MPRs, mentored peer reviews by education fellows.
Western Journal of Emergency Medicine
1730
Volume 27, No. 6: November 2026
Mentored Peer-Review Program Evaluation at Five Years
Love et al.
Table 2. Comparison of editorial scoring of reviews (5 being exceptional) among controls’ peer reviews, mentored peer reviewers (MPRs), and graduates of the mentored-peer review program (based on their average editorial review rating. Groups (n)
Mean Review Score
Std Deviation
Traditional (292)
3.33
1.04
MPR Graduates (30)
3.61
0.84
MPRs (141)
4.13
0.82
Total (463)
463
1.03
*S-N-K Post Hoc
F ratio
P value
61.243
< .001**
a
There is a significant difference at the P < .001*, and the Levine test of equality of variances (effect size) was significant when comparing mentored peer reviews from the other two groups. *Cohen d measurement of variance effect size was intermediate to large (.7–.8). The Student-Newman-Keuls post hoc test indicated that the traditional and program graduates were statistically similar while MPRs were statistically differenta than both other groups at the P < .05 level. MPRs, mentored peer reviews of fellows; MPR Graduates, independent reviews by previously participating fellowship graduates; S-N-K, Student-Newman-Keuls.
has grown substantially and currently represents 35% of graduates. Based on this growth, MPR graduates who provide independent reviews appear to have the greatest potential to contribute to the long-term expansion of the reviewer pool. The MPR program was developed as an experience for early-career scholars to promote skills related to peer review. Such experiences have the potential to be adopted by fellows and integrated into their own practices, further improving their knowledge and skills related to education scholarship.38 Over the past two years, six prior fellow mentees have stepped forward to serve as mentors in the MPR program, primarily as fellowship faculty. These observations suggest that this may well serve as a scaling factor that further contributes to the pool of trained peer reviewers over time. Based on average review scores and the percentage of those who are recognized as gold standard reviewers, the quality of mentored peer reviews was significantly greater
than that of our traditional reviewer pool (nonmentored faculty). This finding runs contrary to the findings of a previous MPR study in which the sponsoring journal paired new reviewers with high-functioning senior reviewers.33 The mentorship suggested by the sponsoring journal was to discuss the review with the mentees by “email or phone” followed by the mentor providing feedback to the mentee. After reviewing the literature, these authors hypothesized that the lack of improvement from this experience was likely due to an insufficiently focused and detailed mentoring process between individuals with no prior or ongoing relationships. Due to their prior training and experience in education and scholarship, education fellowship directors are likely a different group than our traditional faculty reviewers. Considering the novice status of most participating fellows in the MPR program,36 the quality of MPRs likely resulted from a substantive mentorship in the context of a longitudinal
Table 3. Comparison between instances in which two traditional reviewers or two mentored peer reviewers (2023 and 2024) were the first two offers to review and tracking the turn-around time from initial peer-review requests to that point in time when two offers were accepted. Number of Manuscripts
Mean Turn-around Time Days (+/-SD)
Nonmentored faculty
17
60.2 (32.0)
MPRs
18
17.2 (16.7)
TOTAL
35
38.1 (33.1)
Reviewer Type
t*
P value**
ES
< .001
1.70
4.95
*Because the Levene test for equality of variances was significant, equal variances between groups was not assumed; therefore, the smaller (adjusted) t-value and associated degrees of freedom were selected. The t-value adjusted for unequal variances was significant at the **P < .001 level. The Cohen d effect size for review ratings between MPRs and controls reviewers is considered very large. ES, effect size; MPRs, mentored peer reviews; SD, standard deviation.
Volume 27, No. 6: November 2026
1731
Western Journal of Emergency Medicine
Mentored Peer-Review Program Evaluation at Five Years
Love et al.
Figure. Comparison of the times (days) and steps in obtaining two acceptances when the first two offers were nonmentored faculty versus two mentored peer-reviews (MPRs). The examples used were that instance in each group that came closest to that group’s mean time (nonmentored faculty, 57; and MPRs,15 days).
mentoring relationship integrated into fellowship training. An additional contributing factor may also include the collaborative approach of MPRs. The quality of independent peer reviews by fellowship graduates was found to be equivalent to that of traditional reviewers. Considering participating fellows’ relative lack of experience upon beginning fellowship,36 this performance appears to reflect substantive growth in the fellows’ skills and knowledge related to education scholarship and peer review based on their fellowship experiences. For most, it is doubtful that two years of fellowship would prepare fresh graduates, one to two years out of training, to provide the same quality of peer review as those who were mentored by their fellowship director. This decline in quality based on editor scoring appears to reflect the loss of mentorship and perhaps also the opportunity to collaborate. Authors consider multiple factors when choosing a journal for manuscript submission. These include journal reputation, impact factor, relevance of the topic, target audience, and timeliness of turnaround time from submission to final decision and publication.39,40 Although all are important, the latter is the one over which editors have the most direct control. Consequently, our finding that inviting two MPRs initially, as opposed to two traditional reviewers, reduced the time to obtain two accepted reviews by six weeks is potentially important. As demonstrated in Figure, the delays in recruiting traditional nonmentored peer reviewers versus MPRs was largely based on the number of “no responses” and “refusals.” Consistent with our findings, a recently published preliminary report by a journal-based MPR program demonstrated a reduction in ignored and declined peer-review requests, thereby reducing turnaround times for reviews when comparing MPRs to traditional reviewers.12 This disparity is Western Journal of Emergency Medicine
likely the result of the different values these two groups place on this experience. Nonmentored faculty reviewers have competing priorities that are often perceived as having a greater impact on their career, making it less likely that they accept an offer to review a manuscript.13-15,17-19 In contrast, we reported previously that fellows value MPRs as professional development opportunities and that fellowship directors see this as an important addition to the training they provide.36 Fellows generally have more time for a jointly performed exercise that supports their education, which may also be a contributing factor. However, once the opportunity to review was accepted, there was no difference between the two groups in the time to submit the completed review, thereby demonstrating a commitment to the task at hand by both groups once they had committed to the review. LIMITATIONS The Special Issue accepts submission types in all standard educational categories (original research, educational advances, reviews, and scholarly perspectives). As submissions were randomly assigned to peer reviewers, there is always some risk of unequal distribution of manuscript types. Although this limitation should be kept in mind, it appears that the higher quality reviews of MPRs scale to more complex studies and manuscript types. Although blinding of the editor’s score occurred by having the fellow listed on the website, there was potential for the editors to identify the fellows and nonmentored faculty reviewers. The medical education community in EM is such that it is not uncommon to recognize the names of other faculty members and learners from prior teaching/mentoring experiences. This raises the potential for bias based on the recognition of both nonmentored faculty reviewers and fellows involved in mentored peer reviews. It is also possible that the editor who participated in inviting fellowship directors, traditional reviewers, and graduates to review could have recognized submitting reviewers. Blinding of the review scores by the section editor and the guest editor was intended to mitigate such bias. The success and thus generalizability of this journal-based program is largely dependent on integrating this experience into the curriculum of a specialty fellowship related to scholarship. This educational environment set the stage for quality mentorship and significant motivation of mentors/ mentees. The absence of educational support, in this case provided by fellowships, is a major obstacle to a successful journal-based mentored peer review program.32,33 Although not measured in this study, there is no question that establishing and maintaining this MPR program for the Special Issue with a limited number of annual submissions (65–160) requires a substantive investment of time and administrative support. Such resources may not be available to journals with limited staff or resources.33 Other factors that may affect success include the culture
1732
Volume 27, No. 6: November 2026
Mentored Peer-Review Program Evaluation at Five Years
Love et al. and mission of the journal and the degree to which they have access to a “fellowship” pool. Finally, the generalizability of our findings to journals with a much larger annual submission rate may be restricted by the limited impact of such a program on their editorial process.
Med Cent). 2022;35(3):394-396. 5. Hames I. (2012). Peer review in a rapidly evolving publishing landscape. In Campbell R, Pentz E, Borthwick I (Eds.), Academic and professional publishing (15-52). Oxford, England: Chandos Publishing. 6. DeLisi LE. Where have all the reviewers gone? Is the peer review
CONCLUSION The development of a formal educational opportunity in mentored peer reviews for emergency medicine education fellowships has had a significant impact on our editorial review process. The size of our reviewer pool continues to increase annually in a manner that appears sustainable. Peer-review quality improved, while editorial review turnaround times decreased.
concept in crisis? Psychiatry Res. 2022;310:114554. 7. Thomas SP. Current controversies regarding peer review in scholarly journals. Issues Ment Health Nurs. 2018;39(2):99-101. 8. Fernandez-Llimos F. Peer review and publication delay. Pharm Pract (Granada). 2019;17(1):1502. 9. Chloros GD, Giannoudis VP, Giannoudis PV. Peer-reviewing in surgical journals: revolutionize or perish? Ann Surg. 2022;275(1):e82-e90. 10. Shomoossi N, Shomoossi Z, Rad M. Stressing the need for the pool
Institutions continued || Boston University Chobanian & Avedisian School of Medicine, Department of Emergency Medicine, Boston, Massachusetts # Emory University School of Medicine, Atlanta, Georgia ¶ University of Washington, Department of Emergency Medicine, Seattle, Washington
of trained peer reviewers versus authors’ suggested reviewers. J Med Edu Dev. 2023;16(48):78-79. 11. Nicholas D, Watkinson A, Jamali HR, et al. Peer review: still king in the digital age. Learn Pub. 2015;28(1):15-21. 12. Kirk RB, Saravanan S, de Beer A, et al. The trainee as reviewer: training the next generation of scholars. Med Educ. 2026;60(2):187188. 13. Mulligan A, Hall L, Raphael E. Peer review in a changing world: an
Address for Correspondence: Jeffrey N Love, MD, Georgetown School of Medicine, Department of Emergency Medicine, 3900 Reservoir Rd NW, Washington, DC 20007. Email: Jlove01@ georgetown.edu.
international study measuring the attitudes of researchers. J Assoc Inf Sci Technol. 2013;64(1):132-161. 14. Tite L, Schroter S. Why do peer reviewers decline to review? A survey. J Epidemiol Community Health. 2007;61(1):9-12.
Conflicts of Interest: By the WestJEM article submission agreement, all authors are required to disclose all affiliations, funding sources and financial or management relationships that could be perceived as potential sources of bias. No other author has professional or financial relationships with any companies that are relevant to this study. There are no other conflicts of interest or sources of funding to declare. Copyright: © 2026 Love et al. This is an open access article distributed in accordance with the terms of the Creative Commons Attribution (CC BY 4.0) License. See: http://creativecommons.org/ licenses/by/4.0/
15. Snell L, Spencer J. Reviewers’ perceptions of the peer review process for a medical education journal. Med Educ. 2005;39(1):9097. 16. Watling C, Ginsburg S, Lingard L. Don’t be Reviewer 2! Reflections on writing effective peer review comments. Perspect Med Educ, 2021;10(5):29-303. 17. DeMaria AN. What constitutes a great review? J Am Coll of Cardiol. 2003;42(7):1314-1315. 18. Mayer D, Eastin C, Kane B, et al. The importance of peer review skills and the value and necessity of training residents to ensure continued scientific excellence. AEM Educ Train. 2024;8:S76-S79. 19. Warne V. Rewarding reviewers—sense or sensibility? A Wiley study
REFERENCES 1. Ware M, Mabe M. (2015). The STM report: an overview of scientific
explained. Learn Publ. 2016;29(1):41-50. 20. Smith R. Peer review: a flawed process at the heart of science and journals. J R Soc Med. 2006;99(4):178-182.
and scholarly journal publishing. Netherlands: International Association of Scientific, Technical and Medical Publishers.
21. Azer SA, Ramani S, Peterson R. Becoming a peer reviewer to
2. Kovanis M, Porcher R, Ravaud P, et al. The global burden of journal
medical education journals. Acad Med. 2012;34(9):698-704.
peer review in the biomedical literature: strong imbalance in the
22. Way DP, Bierer SB, Cianciolo AT, et al. Fundamentals of scholarly peer review: a workshop for health professions educators on
collective enterprise. PLoS One. 2016;11(11):e0166387.
practicing scholarly citizenship. MedEdPORTAL. 2021;17:11174.
3. Ghasemi A, Mirmiran P, Kashfi K, et al. Scientific publishing in biomedicine: a brief history of scientific journals. Int J Endocrinol
23. Bruce R, Chaucin A, Trinquart L, et al. Impact of interventions to improve the quality of peer review of biomedical journals: a
Metab. 2022;21(1):e131812.
systematic review and meta-analysis. BMC Med. 2016;14(1):1-6.
4. Peterson CJ, Orticio C, Nugent, K. The challenge of recruiting peer reviewers from one medical journal’s perspective. Proc (Bayl Univ
Volume 27, No. 6: November 2026
24. Ross JC, Martin A, Han SP. Finding our voice—scholarship in peer
1733
Western Journal of Emergency Medicine
Mentored Peer-Review Program Evaluation at Five Years
Love et al.
review. Clin Teach. 2023;20(1):1.
33. Houry D, Green S, Callaham M. Does mentoring new peer reviewers
25. Van Rooyen S. The evaluation of peer-review quality. Learn Publ.
improve review quality? A randomized controlled trial. BMC Med
2001;14(2):85-91.
Educ. 2012;12(1):1-7.
26. Schroter S, Black N, Evans S, et al. Effects of training on quality of
34. Dumenco L, Engle DL, Goodell K, et al. Expanding group peer
peer review: randomized controlled trial. BMJ. 2004;328(7441):1-5.
review: a proposal for medical education scholarship. Acad Med.
27. Callaham ML, Wears RL, Waeckerle JF. Effect of attendance at a
2017;92(2):147-149.
training session on peer reviewer quality and performance. Ann
35. Council of Residency Directors in Emergency Medicine. Mission /
Emerg Med. 1998;32:318-322.
vision. Available at: https://www.cordem.org/about-cord/mission--
28. Wong VSS, Strowd III RE, Aragon-Garcia R, et al. Mentored peer
vision/mission--vision/. Accessed January 2, 2020.
review of standardized manuscripts as a teaching tool for residents: a
36. Love JN, Merritt C, Ilgen JS, et al. A collaborative approach to
pilot randomized controlled multicenter study. Res Integr Peer Rev.
mentored peer reviews sponsored by the Council of Residency
2017;2(1):1-9.
Directors of Emergency Medicine. West J Emerg Med.
29. Richards BF, Cardell EM, Chow CJ, et al. Discovering the benefits of group peer review of submitted manuscripts. Teach Learn Med.
2024;25(1):111-116. 37. Love JN, Messman AM, Ilgen JS, et al. Development and validation
2020;32(1):104-109.
of a scoring rubric for editorial assessment of peer-review quality.
30. Ilgen JS, Artino AR, Simpson D, et al. Group peer review: the breakfast of champions. J Grad Med Educ. 2016;8(5):646-649.
West J Emerg Med. 2024;25(2):1-10. 38. Eva KW. Altruism as enlightened self-interest: how helping others
31. Sidalak D, Purdy E, Luckett-Gatopoulos S, et al. Coached peer review: developing the next generation of authors. Acad Med.
through peer review helps you. Med Educ. 2021;55(8):880-882. 39. Björk BC, Solomon D. The publishing delay in scholarly peer-
2016;92(2):201-204. 32. Lyons-Warren AM, Aamodt WW, Pieper KM, et al. A structured,
reviewed journals. J Informetr. 2013;7(4):914-923. 40. Tenopir C, Dalton E, Fish A, et al. What motivates authors of
journal-led peer-review mentoring program enhances peer review
scholarly articles? The importance of journal attributes and potential
training. Res Integr Peer Rev. 2024;9(1):3-11.
audience on publication choice. Publ. 2016;4(3):22.
Western Journal of Emergency Medicine
1734
Volume 27, No. 6: November 2026
Original Research
Cannabis Use versus Cigarette Smoking in Emergency Department Patients: Comparative Outcomes *University of Texas Medical Branch at Galveston, Department of Emergency Vincent Yang, BS* Medicine, Galveston, Texas Alexander V. Xavier, BS* † University of Texas Medical Branch at Galveston, Department of Cardiovascular Karthik Devulapally, BS, BA* Medicine Galveston, Texas Krishna K. Paul, BS* ‡ University of Texas Medical Branch at Galveston, Department of Population Bryan Wilson, MD* Health & Health Disparities, Galveston, Texas Diann Gaalema, PhD† Hani Jneid, MD† Olugbenga Akinwande, MD* M. Kristen Peek, PhD‡ Dietrich von Kuenssberg Jehle, MD* Section Editor: Howard Greller, MD Submission history: Submitted April 3, 2026; Revision received July 16, 2026; Accepted July 17, 2026 Electronically published October 14, 2026 Full text available through open access at http://escholarship.org/uc/uciem_westjem DOI 10.5811/westjem.64353
Introduction: Cannabis is one of the most commonly used psychoactive substances worldwide, with 20% of adults in the U.S. reporting using cannabis at least once in the past year. Nicotine dependence is reported in 9% to 10% of adults in the U.S.1 This study aims to investigate the relationship between cannabis use and cigarette smoking on mortality, cardiovascular outcomes, suicide, cancer of the lung and bronchus, and reactive airway disease in emergency department (ED) patients. Methods: This retrospective, propensity score–matched study used the TriNetX database to analyze records of 120,689,106 patients from 69 healthcare organizations in the U.S. between 2005 and 2022. The first cohort consisted of adult patients and was grouped based on diagnosis of cannabis-related disorders (CRD) within five years before or one month after an ED visit. The second cohort consisted of adult patients with a diagnosis of “nicotine dependence, cigarettes” within five years before to one month after an ED visit. The outcomes evaluated were all-cause mortality, stroke, myocardial infarction, suicide, cancer of the lung and bronchus, and reactive airway disease (asthma/chronic obstructive pulmonary disease [COPD]) within three years after the ED visit. Patients who previously experienced these outcomes or belonged to both cohorts were excluded from the study. We performed 1:1 greedy nearest-neighbor propensity score matching for demographics and seven preexisting conditions associated with mortality. Results: There were 1,682,117 patients identified with ED visits and CRD or cigarette smoking. After propensity score matching, there were a total of 651,232 adult patients with CRD (n = 325,616) or cigarette smoking (n = 325,616) within five years prior or one month after an ED visit. Patients with CRD were associated with a significantly higher mortality rate (2.35% vs 2.16%; relative risk [RR] 1.09; 95% CI, 1.051.12; P < .001), stroke (0.45% vs 0.28%; RR 1.59; 95% CI, 1.47-1.73; P < .001), myocardial infarction (0.53% vs 0.35%; RR 1.51; 95% CI, 1.40-1.63; P < .001) and suicide (0.62% vs 0.35%; RR 1.77; 95% CI, 1.65–1.90; P < .001) within 3-years of the ED visit compared to patients smoking cigarettes. Individuals with CRD were associated with a significantly lower rate of lung and bronchus cancer (0.16% vs 0.31%; RR 0.53; 95% CI, 0.48–0.59; P < .001) and reactive airway disease; asthma (6.30% vs 7.37%; RR 0.86; 95% CI, 0.84–0.87; P < .001) and COPD (1.65% vs 3.05%; RR 0.54; 95% CI, 0.52-0.56; P < .001) than those with cigarette smoking. Conclusion: We found that cannabis use was associated with higher risks of mortality, stroke, myocardial infarction, and suicide for ED patients when compared to cigarette smoking. Cannabis-related disorder was associated with lower rates of reactive airway disease and lung and bronchus cancer when compared to those with cigarette smoking. [West J Emerg Med. 2026;27(6)1735–1743.]
Volume 27, No. 6: November 2026
1735
Western Journal of Emergency Medicine
Cannabis Use vs Cigarette Smoking in ED Patients: Comparative Outcomes INTRODUCTION The relationship between tobacco smoking and adverse health outcomes has been extensively studied and welldocumented over the past several decades. Numerous studies have established strong associations between tobacco use and cardiovascular disease, acute and chronic respiratory illness, and an increased risk of cancer, among other conditions.2 With growing public awareness and robust public health campaigns highlighting the dangers of tobacco use, smoking rates in the U.S. have steadily declined. In 2022, the smoking rate among adults in the U.S. was 11.6%, a substantial decrease from 42.6% reported in 1965.3 Even between 2006 and 2019, a notable decline in smoking prevalence was observed, but this may be due to the transition from traditional cigarettes to vaping as a nicotine delivery device.4 In contrast, cannabis use has increased over the past decade. This rise in use has been driven in part by the growing legalization of cannabis for both medicinal and recreational purposes. Among adults 19 to 30 years of age, daily cannabis use nearly doubled from 6% in 2012 to 11% in 2022.5 As more states legalize cannabis, usage rates are expected to continue climbing. Although the health effects of cannabis are less well-characterized than those of tobacco, emerging research has identified a potential association between cannabis use and elevated risks of cardiovascular events, particularly myocardial infarction and stroke.6-8 Despite these associations, cannabis is “consistently perceived as more socially acceptable and less risky than cigarettes” by the general public.9 This perception may not be entirely accurate, and further research is needed to better understand and compare the health outcomes of cannabis and tobacco use. However, much of the existing literature evaluates cannabis outcomes while adjusting for tobacco exposure or excluding tobacco users, rather than directly contrasting cannabis and cigarette smoking within the same analytic framework. As a result, few studies provide true head-to-head comparisons of cannabis use versus cigarettes to better contextualize relative risk and inform public health messaging.10,11 Cannabis use and cigarette smoking are both common among emergency department (ED) patients and frequently encountered in acute care settings. Given that the ED often serves patients with substance use disorders and other highrisk conditions, characterizing the risks associated with these exposures may help identify higher-risk patients, inform counseling strategies, and support preventive interventions. Objectives of Investigation Given the increasing prevalence of cannabis use, this study aims to compare the health effects of cannabis and cigarette use by evaluating outcomes including all-cause mortality, stroke, myocardial infarction, suicide, lung and bronchus cancer, and reactive airway disease among ED patients. Western Journal of Emergency Medicine
Yang et al. Population Health Research Capsule
What do we already know about this issue? Cannabis use is increasing and often perceived as safer than cigarettes, but direct comparisons of health outcomes are limited. What was the research question? Do emergency department patients who use cannabis have different health outcomes than cigarette smokers? What was the major finding of the study? Cannabis was associated with increased mortality (RR 1.09; 95% CI, 1.05–1.12; P < .001) and also suicide risk vs cigarettes (RR 1.77; 95% CI, 1.65–1.90; P < .001). How does this improve population health? These results contribute to improved patient counseling and public health messaging by clarifying the relative risks of cannabis versus cigarette use.
METHODS This retrospective, propensity score–matched study used the TriNetX database, an international, federated health research network providing access to de-identified electronic health records (EHR) across healthcare organizations, to analyze the records of 120,689,106 patients from 69 healthcare organizations in the U.S. between 2005 and 2022. The TriNetX database includes both academic medical centers and affiliated community healthcare facilities, providing broad representation of US healthcare. Cohort Selection The first cohort consisted of adult patients (≥18 years of age at the time of diagnosis) and was grouped based on a diagnosis of cannabis-related disorders (CRD; International Classification of Diseases, 10th Revision, Clinical Modification [ICD-10-CM] code F12) within five years before or one month after an ED visit. The second cohort consisted of adult patients diagnosed with “nicotine dependence, cigarettes” (ICD-10CM: F17.21) within five years before or one month after an ED visit [Supplementary Table 1]. A five-year preindex and one month postindex exposure window was selected to capture chronic substance use while accounting for delayed documentation of preexisting CRD and nicotine dependence. Patients were excluded from the study if they were <18 years
1736
Volume 27, No. 6: November 2026
Yang et al.
Cannabis Use vs Cigarette Smoking in ED Patients: Comparative Outcomes
of age or the ED visit occurred before January 2005 or after January 2022. Additionally, patients who previously experienced the outcomes or belonged to both cohorts were excluded from the study. We selected ED visits to make both groups comparable and allow propensity score matching. The TriNetX database limits propensity matching in very large cohorts. Two cohorts greater than five million patients each results in increased instability in the TriNetX network and limits the number of covariates used for propensity matching. When there are two cohorts greater than 10 million patients each, the propensity matching generally fails. TriNetX does not impute or estimate clinical values in patient records, except in specific cases not applicable to this study. If patient encounters are missing or have inconsistent encounter IDs, TriNetX derives an encounter using the earliest and latest observation dates but does not assign an encounter type. For encounters lacking start or end dates, the platform uses associated observation dates to fill in the gaps. Transition from ICD-9 to ICD-10 were done internally by TriNetX within the database. We did not perform data-cleaning, deduplication, filtering, or preprocessing. Outcomes Measured The primary outcomes were assessed within three years after the initial ED visit and included all-cause mortality, stroke, myocardial infarction, suicide, cancer of the lung and bronchus, and reactive airway disease (asthma and chronic obstructive pulmonary diseases [COPD]). These outcomes were defined with their corresponding ICD-10 codes as follows: all-cause mortality; stroke (ICD-10-CM: I63) myocardial infarction (ICD-10-CM: I21), suicide (ICD-10CM: T14.91), cancer of the lung and bronchus (ICD-10-CM: C34); or reactive airway disease (asthma ICD-10-CM: J45 and COPD ICD-10-CM: J44) [Supplementary Table 1]. Measuring outcomes three years out allowed us to associate early onset of both long-term outcomes such as lung cancer, and short-term outcomes such as myocardial infarction. The index date was the ED visit. Patients were observed for outcomes in TriNetX until the earliest of outcome occurrence, three years after the index date, the last recorded encounter within the network, or the end of site data availability. Nonfatal outcomes were identified from encounter diagnoses within participating healthcare organizations. All-cause mortality was identified through the TriNetX platform. Mortality information in TriNetX is obtained from death indicators submitted by participating healthcare organizations and may be supplemented by external mortality data sources, including national death registry data for participating organizations with such linkage. Because linkage availability may vary across healthcare organizations and over time, mortality ascertainment may be incomplete for patients whose deaths were not captured in the EHR or linked mortality sources. Patients were further excluded if they had outcomes prior to the initial ED visit [Supplementary Table 2]. Volume 27, No. 6: November 2026
Statistical Analysis We performed a 1:1 propensity score–matching approach using greedy nearest-neighbor matching with a caliper width threshold of 0.10 (or 10%). Propensity matching was performed with linear regression for continuous variables such as age and logistic regression for binary (yes/no) variables. We matched patients for demographics and the seven preexisting conditions associated with mortality [Table 1]. The comorbidities were chosen based on the leading causes of death according to the Centers for Disease Control and Prevention analysis within the TriNetX platform for each cohort and reported as descriptive statistics for the measured outcomes with the following: risk ratios (RR), 95% CIs, and probability values (P values). Risk ratios were reported rather than odds ratios (ORs) as RRs are more intuitive to the average practicing physician. The use of de-identified data from TriNetX has been determined to be exempt by the University of Texas Medical Branch (UTMB) Institutional Review Board (IRB). The UTMB IRB determined that this project did not involve intervention or interaction with human subjects, and is de-identified per the de-identification standard defined in Section §164.514(a) of the Health Insurance Portability and Accountability Act Privacy Rule. This formal determination by a qualified expert refreshed on December 2020. This retrospective cohort study was conducted and reported in accordance with the Strengthening the Reporting of Observational Studies in Epidemiology guidelines.13 RESULTS Cohort Characteristics A total of 1,682,117 patients were identified with ED visits and either CRD or cigarette smoking. After propensity matching, there were a total of 651,232 adult patients with CRD (325,616) or cigarette smoking (325,616) within five years prior or one month after an ED visit (Figure). There were 2,713 patients excluded because they met the index event more than 20 years ago. Propensity matching substantially improved age balance between groups, reducing the mean age difference from 33.3 versus 43.8 years before matching to 33.8 versus 34.1 years after matching (standardized difference = 0.02). Before propensity matching, the male:female ratio was 1.43:1 in the CRD cohort and 1.07:1 in the cigarette smoking cohort, which narrowed after propensity matching. After propensity matching, some of the covariates remained statistically different; however, all the standard mean differences of the covariates were < 0.1, representing a well balanced match (Table 1). Main Results Before propensity matching (Table 2), the CRD cohort, which was significantly younger, was associated with a lower risk of all-cause mortality compared to cigarette smoking
1737
Western Journal of Emergency Medicine
Cannabis Use vs Cigarette Smoking in ED Patients: Comparative Outcomes
Yang et al.
Table 1. Demographics and preexisting conditions of emergency department patients using tetrahydrocannabinol vs cigarette smokers before and after propensity score matching. Before Propensity Score Matching
After Propensity Score Matching
Demographics Cohort 1 = THC 2 = Cig
Mean (SD) 33.3 (13.6) 43.8 (15.3)
Patients
% of Cohort
337,449 1,341,955
100% 100%
Std diff.
Mean % of (SD) Patients Cohort
P value
Std diff.
< .001
0.723
33.8 (13.6) 325,616 34.1 325,616 (13.4)
100% 100%
< .001
0.020
P value
1 2
Age at Index
1 2
Female
136,002 614,428
40.3% 45.8%
< .001
0.111
133,767 127,168
41.1% 39.1%
< .001
0.041
1 2
Black or African American
102,930 243,915
30.5% 18.2%
< .001
0.290
93,128 94,916
28.6% 29.1%
< .001
0.012
1 2
Male
194,613 659,463
57.7% 49.1%
< .001
0.172
185,015 191,800
56.8% 58.9%
< .001
0.042
1 2
White
166,304 832,489
49.3% 62.0%
< .001
0.259
166,049 163,124
51.0% 50.1%
< .001
0.018
1 2
American Indian or Alaska Native
1,226 4,503
0.4% 0.3%
= .013
0.005
1,217 1,209
0.4% 0.4%
= .87
< .001
1 2
Unknown Race
45,671 177,327
13.5% 13.2%
< .001
0.009
44,006 45,605
13.5% 14.0%
< .001
0.014
1 2
Native Hawaiian or Other Pacific Islander
2,921 13,771
0.9% 1.0%
< .001
0.017
2,919 2,696
0.9% 0.8%
= .003
0.007
1 2
Unknown Gender
6,834 68,064
2.0% 5.1%
< .001
0.165
6,834 6,648
2.1% 2.0%
= .11
0.004
1 2
Hispanic or Latino
31,856 83,815
9.4% 6.2%
< .001
0.119
30,109 30,467
9.2% 9.4%
= .13
0.004
1 2
Not Hispanic or Latino
204,328 833,446
60.6% 62.1%
< .001
0.032
196,885 195,424
60.5% 60.0%
< .001
0.009
1 2
Other Race
12,779 43,184
3.8% 3.2%
< .001
0.031
12,682 12,809
3.9% 3.9%
= .42
0.002
1 2
Asian
5,618 26,766
1.7% 2.0%
< .001
0.025
5,615 5,257
1.7% 1.6%
< .001
0.009
Patients
% of Cohort
P value
Std diff.
Patients
% of Cohort
P value
Std diff.
Diagnosis Cohort 1 2
Ischemic heart diseases
8,695 77,071
2.6% 5.7%
< .001
0.159
8,623 8,664
2.6% 2.7%
= .75
0.001
1 2
Diabetes mellitus
18,792 130,743
5.6% 9.7%
< .001
0.157
18,568 18,691
5.7% 5.7%
= .51
0.002
1 2
Overweight and obesity
30,418 151,538
9.0% 11.3%
< .001
0.075
29,705 29,223
9.1% 9.0%
= .04
0.005
1 2
Acute kidney failure and chronic kidney disease
14,106 70,919
4.2% 5.3%
< .001
0.052
13,457 14,260
4.1% 4.4%
< .001
0.012
1 2
Heart failure
5,783 40,719
1.7% 3.0%
< .001
0.087
5,686 5,576
1.7% 1.7%
= .30
0.003
1 2
Cardiac arrest
396 1,555
0.1% 0.1%
= .82
< .001
384 264
0.1% 0.1%
< .001
0.012
1 2
Hypertensive diseases
45,586 308,599
13.5% 23.0%
< .001
0.247
44,927 45,987
< .001
0.009
13.8% 14.1%
Cig, cigarette smoking; SD, standard deviation; Std diff, standard difference; THC, tetrahydrocannabinol.
Western Journal of Emergency Medicine
1738
Volume 27, No. 6: November 2026
Yang et al.
Cannabis Use vs Cigarette Smoking in ED Patients: Comparative Outcomes
(2.30% vs 3.92%; RR, 0.59; 95% CI, 0.57-0.60; P < .001). Similarly, CRD was associated with lower risks of stroke (0.43% vs 0.54%; RR, 0.80; 95% CI, 0.75-0.84; P < .001), myocardial infarction (0.52% vs. 0.67%; RR, 0.78; 95% CI, 0.74-0.82; P < .001), and COPD (1.60% vs 6.86%; RR, 0.23; 95% CI, 0.23-0.24; P < .001). In contrast, tetrahydrocannabinol (THC) use was associated with a higher risk of suicide compared to cigarette smoking (0.62% vs 0.31%; RR, 2.03; 95% CI, 1.92–2.14; P < .001). Lung cancer (0.16% vs 0.82%; RR, 0.19; 95% CI, 0.18-0.21; P < .001) and asthma (6.36% vs. 6.69%; RR, 0.95; 95% CI, 0.94-0.97; P < .001) were also less prevalent in CRD patients before matching. After propensity matching [Table 2], CRD was associated with a higher rate of all-cause mortality compared to cigarette smoking (2.35% vs 2.16%; RR, 1.09; 95% CI, 1.05-1.12; P < .001). Similarly, CRD was associated with an increased risk of stroke (0.45% vs 0.28%; RR, 1.59; 95% CI, 1.47-1.73; P < .001) and myocardial infarction (0.53% vs. 0.35%; RR, 1.51; 95% CI, 1.40-1.63; P < .001). The use of THC was also associated with a higher risk of suicide compared to cigarette smoking (0.62% vs 0.35%; RR, 1.77; 95% CI, 1.65-1.90; P < .001). In contrast, CRD was associated with a lower risk of lung and bronchus cancer (0.16% vs 0.31%; RR, 0.53; 95% CI, 0.48-0.59; P < .001), asthma (6.30% vs.7.37%; RR, 0.86; 95% CI, 0.84-0.87; P < .001), and COPD (1.65% vs 3.05%; RR, 0.54; 95% CI, 0.52-0.56; P < .001). Before matching, THC use appeared to be associated with a lower risk of mortality, stroke, myocardial infarction, and COPD compared to cigarette smoking, while suicide rates were higher among THC users. However, after matching for demographics and preexisting conditions, the association reversed, with THC use demonstrating a higher risk of mortality, stroke, myocardial infarction, and suicide, likely related to the 10-year age gap that disappeared after propensity matching. The increased prevalence of lung cancer, asthma, and COPD in cigarette-smoking individuals remained consistent before and after matching (Table 2). A post hoc sample-size assessment was performed for comparison of two independent proportions using a two-sided α of .05 and 80% power. Based on the observed post– propensity-matched event rates, the most conservative outcome was all-cause mortality, with rates of 2.35% in the CRD cohort and 2.16% in the cigarette-smoking cohort. Detecting this absolute difference of 0.19% required approximately 95,845 patients per group. The required sample sizes for the remaining outcomes were lower, ranging from approximately 1,837 patients per group for COPD to 21,223 patients per group for myocardial infarction. Because the final propensity-matched analysis included 325,616 patients in each cohort, the available sample size exceeded the calculated requirement for all outcomes, indicating adequate statistical power to detect the observed betweengroup differences. Volume 27, No. 6: November 2026
Figure. Flow chart of participant cohort selection in a study of the relationship between cannabis use and cigarette smoking on mortality, cardiovascular outcomes, suicide, cancer of the lung and bronchus, and reactive airway disease in emergency department patients. CRD, cannabis-related disorders; ED, emergency department; US, United States.
DISCUSSION The objective of this study was to compare rates of various medical conditions between cannabis and cigarette users who visited the ED. This study demonstrated that cannabis use was associated with higher risks of mortality, stroke, myocardial infarctions, and suicide for ED patients when compared to cigarette use. Conversely, cigarette smoking was associated with higher rates of reactive airway disease and lung and bronchus cancer relative to cannabis use. Notably, direct head-to-head comparisons between cannabis use and cigarette smoking remain uncommon in the contemporary literature, as tobacco is frequently treated as a confounder or an exclusion criterion in cannabis-outcome studies. By evaluating cannabis and cigarette users side by side using the same data source and analytic framework, our findings add comparative evidence that may better inform risk perception and patient counseling.10,11 Cannabis is often perceived as safer than cigarette smoking, with many individuals believing that daily cannabis use is less harmful than daily cigarette use.14 This misconception can be dangerous, contributing to increased cannabis consumption despite mounting evidence of adverse health outcomes. This study highlights associations between cannabis use and cardiovascular disease, as well as suicidal behavior, suggesting that cannabis may not be as benign as it
1739
Western Journal of Emergency Medicine
Cannabis Use vs Cigarette Smoking in ED Patients: Comparative Outcomes
Yang et al.
Table 2. Comprehensive outcomes of emergency department patients using tetrahydrocannabinol vs cigarette smoking before and after propensity score matching. Before Propensity Score Matching
After Propensity Score Matching
THC (%)
Nicotine (%)
RR (95% CI)
THC (%)
Nicotine (%)
RR (95% CI)
OR (95% CI)
Deceased
7,752 (2.30%)
52,519 (3.92%)
0.59 0.58 (0.57–0.60) (0.56–0.59)
< .001
7,644 (2.35%)
7,029 (2.16%)
1.09 (1.05–1.12)
1.09 (1.05,1.13)
< .001
Stroke
1,459 (0.43%)
7,300 (0.54%)
0.80 0.79 (0.75–0.84) (0.75–0.84)
< .001
1,454 (0.45%)
913 (0.28%)
1.59 1.60 (1.47–1.73) (1.47, 1.73)
< .001
MI
1,755 (0.52%)
8,922 (0.67%)
0.78 0.78 (0.74–0.82) (0.74–0.82)
< .001
1,738 (0.53%)
1,152 (0.35%)
1.51 1.51 (1.40–1.63) (1.40, 1.63)
< .001
Lung Cancer
533 (0.16%)
10,913 (0.82%)
0.19 0.19 (0.18–0.21) (0.18–0.21)
< .001
533 (0.16%)
1,000 (0.31%)
0.53 0.53 (0.48–0.59) (0.48, 0.59)
< .001
Suicide
2,090 (0.62%)
4,111 (0.31%)
2.03 2.03 (1.92–2.14) (1.93–2.14)
< .001
2,017 (0.62%)
1,142 (0.35%)
1.77 1.78 (1.65–1.90) (1.65, 1.91)
< .001
Asthma
19,290 (6.36%)
81,607 (6.69%)
0.95 0.95 (0.94–0.97) (0.93–0.96)
< .001
18,454 (6.30%)
21,818 (7.37%)
0.86 0.85 (0.84–0.87) (0.83, 0.86)
< .001
COPD
5,274 (1.60%)
84,128 (6.86%)
0.23 0.22 (0.23–0.24) (0.21–0.23)
< .001
5,247 (1.65%)
9,579 (3.05%)
0.54 0.53 (0.52–0.56) (0.52, 0.55)
< .001
Outcomes
OR (95% CI)
P Value
P Value
COPD, chronic obstructive pulmonary disease; MI, myocardial infarction; OR, odds ratio; RR, relative risk; THC, tetrahydrocannabinol.
is commonly perceived. Cannabis is the most commonly used illicit drug in the U.S. and is the second leading cause of substance-related ED visits.15,16 The psychoactive compound in cannabis, THC, exerts systemic cardiovascular and neurological effects, including vasoconstriction, enhanced sympathetic and parasympathetic activity, atherosclerosis, and platelet aggregation.17 Prior studies have shown correlations between cannabis use and increased risks of cardiac arrhythmias, myocardial infarction, and stroke.6-8 In addition, cannabis use is associated with mood disturbances, including increased suicidal ideation, planning, and attempts. Public awareness of these negative consequences remains limited, especially in contrast to the well-documented risks of cigarette smoking, making cannabis a deceptively dangerous substance. Over the past 40 to 50 years, cannabis potency has increased from 2% to 3% in the 1970s to 15% to 30% currently and up to 90% in concentrates.18-21 This increase in potency is due to selective breeding, improvements in indoor cultivation technology, legalization driving competition for stronger products, and a shift from smoking the marijuana flower to concentrates with much higher THC exposure.18-22 Previous studies have shown increased ED visits among cannabis users for cardiovascular and psychological complaints. Cannabis use has been associated with several acute and chronic cardiovascular effects, largely attributed to its primary psychoactive component, THC. Tetrahydrocannabinol activates the sympathetic nervous system, leading to increased heart rate and blood pressure through catecholamine release, thereby raising myocardial oxygen demand.23,24 This Western Journal of Emergency Medicine
heightened demand, compounded by reduced coronary perfusion due to elevated carboxyhemoglobin levels from smoking, creates an oxygen supply-demand mismatch that can precipitate ischemia and infarction—particularly in individuals with preexisting cardiovascular disease.23,25 Population-level data and case reports have linked cannabis use to arrhythmias, myocardial infarction, and stroke, with risk of myocardial infarction onset increased nearly fivefold in the hour after use.23, 25-27 In addition, THC may promote endothelial dysfunction and platelet aggregation through cannabinoid receptor type 1 (CB1) and type 2 (CB2) activation, contributing to a prothrombotic state.23,24 Experimental and clinical data suggest that cannabis exposure can impair vascular endothelial function to a magnitude comparable to tobacco smoke. In a rat model, 1 minute of secondhand cannabis smoke exposure substantially impaired endothelial function for at least 90 minutes, lasting longer than comparable impairment from tobacco secondhand smoke exposure.28 Furthermore, in a cross-sectional human study, chronic cannabis smoking and THC-edible use were associated with endothelial dysfunction similar to tobacco smokers, albeit apparently occurring via distinct mechanisms.29 Tetrahydrocannabinol likely mediates many acute cardiovascular effects of cannabis; however, overall cardiovascular risk is also influenced by smoke exposure, route of administration, product potency, and co-use of other substances. Beyond cardiovascular risk, growing evidence suggests a strong association between cannabis use and suicidal ideation, attempts, and death by suicide—particularly in adolescents and
1740
Volume 27, No. 6: November 2026
Yang et al.
Cannabis Use vs Cigarette Smoking in ED Patients: Comparative Outcomes
young adults.30 Tetrahydrocannabinol acts on CB1 receptors located in brain regions critical to emotion regulation, including the prefrontal cortex, amygdala, and hippocampus. Chronic exposure may lead to downregulation of these receptors, disruption of endocannabinoid tone, and impairments in serotonergic and dopaminergic neurotransmission– neurobiological changes commonly implicated in depression and impulsivity.31,32 A large meta-analysis found cannabis use to be significantly associated with increased odds of suicidal ideation (OR 1.50) and suicide attempts (OR 3.46).31 Additionally, a large real-world, retrospective study demonstrated a 7.80-fold higher risk of suicide attempts in those with cannabis use disorder (CUD) compared to those in a control population without CUD.30 Neuroimaging and behavioral studies further support these findings, showing cannabis-related deficits in executive function and increased impulsivity, which may heighten vulnerability to self-harm.31,32 These psychiatric effects are further amplified by the high prevalence of comorbid mental health conditions among cannabis users. These results underscore the consistency of evidence across multiple studies illustrating the adverse health effects of cannabis. The widespread prevalence of cannabis use may partly stem from the relative absence of public health campaigns targeting cannabis-related harms. Raising public awareness of its cardiovascular and psychiatric risks could help reduce ED visits and promote better population health. The data presented here can contribute to broader educational efforts aimed at reducing cannabis use and informing the public about its potential health consequences. By contrast, this study reaffirms the strong association between cigarette smoking and respiratory diseases, including reactive airway disease and lung and bronchus cancers. There is substantial evidence linking cigarette use to COPD, pulmonary fibrosis, atherosclerosis, coronary artery disease, sexual dysfunction, and numerous other conditions.11 The pathophysiological effects of tobacco smoke and its carcinogenic properties have been extensively documented, establishing a clear causal relationship between cigarette use and pulmonary malignancies. Unlike cannabis, cigarette smoking has long been the focus of public health interventions, with a substantial shift in public perception recognizing its dangers.33 As a result, tobacco use has declined steadily over the past five decades. Nevertheless, approximately 11.5% of the U.S. population continues to use tobacco products, representing a significant public health burden.32 The present findings further support existing literature by reinforcing the link between cigarette use and adverse respiratory and oncologic outcomes. LIMITATIONS This study had several limitations, primarily owing to its retrospective design. While correlations can be observed, the retrospective nature limits the ability to control for all Volume 27, No. 6: November 2026
unmeasured confounding variables and selection biases, allowing only for the reporting of associations between cohorts and outcomes. Although this database methodology is valuable for generating hypotheses, future prospective studies are needed to establish causal relationships. Additionally, because the study relied on TriNetX data, the accuracy of. data entry could not be confirmed. Furthermore, TriNetX privacy policies prevented the assessment of region-specific data points, which may have introduced selection bias. Finally, outcome events —including death —may have been missed if patients received care at a healthcare organization outside the TriNetX network. This limitation is mitigated for mortality outcomes, as approximately 94% of participating healthcare organizations are currently linked to US death registries, a proportion that continues to increase over time. However, nonfatal outcomes such as myocardial infarction, suicide attempt, stroke, lung cancer, or reactive airway disease may be underascertained if follow-up occurs outside the TriNetX network. This study population was derived from patients presenting to the ED, which may not be representative of the general adult population, as these individuals are more likely to have higher acuity illness and comorbidity burden; therefore, the findings may have limited generalizability to broader community-based populations. In addition, the three-year observation period may underestimate chronic exposure outcomes with long-latency periods. The possibility of exposure misclassification, residual confounding, selection bias, competing-risk bias, survivor bias, and immortal time bias may also compromise interpretation of the reported RRs, particularly for outcomes such as lung cancer and mortality. Differential healthcare usage patterns between cohorts may have further compounded this issue. Prior to matching, the cigarette-smoking cohort was substantially older and likely carried a greater burden of chronic comorbidity, potentially resulting in more frequent healthcare encounters and greater retention within the healthcare network compared with younger cannabis-using patients. Patients lost to follow-up after only several months without experiencing an event were analytically treated the same as patients observed continuously for the full 3-year period. This limitation introduces important censoring, survivor, and competing-risk biases that may not be adequately addressed in the current statistical framework. Another limitation can be attributed to incorrect patient responses. Cohorts were created based on ICD-10 codes for CRD and nicotine dependence, cigarettes. The transition from ICD-9 to ICD-10 relies on administrative coding, which may represent another limitation of this study. Patients may underreport THC or cigarette use due to fear of judgment or incomplete disclosure of their substance use history, and those who use these substances may also use other recreational drugs influencing health outcomes. Additionally, cigarette smoking was defined using diagnoses of nicotine dependence, although only approximately 80% of daily smokers meet criteria for nicotine dependence;
1741
Western Journal of Emergency Medicine
Cannabis Use vs Cigarette Smoking in ED Patients: Comparative Outcomes however, these terms were used interchangeably. 1,3 Among daily or near-daily cannabis users, approximately 30% meet criteria for CRD, and CRD encompasses a broad spectrum including cannabis use, abuse, and dependence. Consequently, this analysis likely reflects outcomes among heavier or more frequent users of THC than tobacco, rather than occasional users. Furthermore, the database lacked information to differentiate between smoking and oral intake of drugs or to identify patients using multiple routes of administration; however, exclusive oral users represent a small minority (<10%).34 Although unreported or subclinical cannabis use could not be captured, this study primarily represents individuals with CUD who are more likely to experience related complications. Accordingly, the findings may not be generalizable to individuals with lower levels of substance exposure. While this study propensity matched for cigarette and THC use, age, sex, race, and preexisting conditions associated with mortality, residual confounding may persist because not all potential confounding variables were available within the database coding system. Other factors, such as a patient’s socioeconomic status, healthcare utilization, use of other recreational substances, medications, psychiatric illnesses, and diet may all contribute to outcomes. The frequency or duration of use, route of administration, cumulative exposure for tobacco (pack-years) or cannabis (potency), or concurrent polysubstance use could not be controlled for, and this represents a limitation. Additionally, temporal increases in cannabis potency may influence outcomes and warrant further investigation in longitudinal analyses.18-22 Future prospective studies could provide additional information on potential contributing factors such as mechanisms, polysubstance use, or socioeconomic factors.
Yang et al.
Conflicts of Interest: By the WestJEM article submission agreement, all authors are required to disclose all affiliations, funding sources and financial or management relationships that could be perceived as potential sources of bias. This research was supported by the UTMB Institute for Translational Sciences, supported in part by a Clinical and Translational Science Award (UM1 TR005443) from the National Center for Advancing Translational Sciences at the National Institutes of Health (NIH). The content is solely the responsibility of the authors and does not necessarily represent the official views of the NIH. There are no conflicts of interest to declare. Copyright: © 2026 Yang et al. This is an open access article distributed in accordance with the terms of the Creative Commons Attribution (CC BY 4.0) License. See: http://creativecommons.org/ licenses/by/4.0/
REFERENCES 1. Results from the 2023 National Survey on Drug Use and Health: Detailed Tables. Substance Abuse and Mental Health Services Administration; 2024. Available at: https://www.samhsa.gov/data/ sites/default/files/reports/rpt47100/NSDUHDetailedTabs2023/ NSDUHDetailedTabs2023/2023-nsduh-detailed-tables-sect8pe.htm. Accessed June 26, 2026. 2. Parmar MP, Kaur M, Bhavanam S, et al. A systematic review of the effects of smoking on the cardiovascular system and general health. Cureus. 2023;15(4):e38073. 3. American Lung Association. Tobacco trends brief: overall tobacco trends. 2026. Available at: https://www.lung.org/research/trends-inlung-disease/tobacco-trends-brief/overall-smoking-trends. Accessed October 9, 2026. 4. Han B, Einstein EB, Compton WM. Patterns and characteristics of nicotine dependence among adults with cigarette use in the US, 2006–2019. JAMA Netw Open. 2023;6(6):e2319602.
CONCLUSION This study highlights important differences in the health outcomes associated with cannabis and cigarette use among ED patients. Cannabis use was associated with higher rates of mortality, stroke, myocardial infarction, and suicide, whereas cigarette smoking—defined by nicotine dependence—was more strongly associated with reactive airway disease and lung and bronchus cancer. These findings are relevant to public health, particularly given increasing cannabis potency and the perception that cannabis is relatively safe. Understanding these different risks associated with cannabis and cigarette use may help guide patient counseling, public messaging, and health education efforts.
5. Patrick ME, Miech RA, Johnston LD, O’Malley PM. Monitoring the Future Panel Study Annual Report: National Data on Substance Use Among Adults Ages 19 to 60, 1976–2022. Monitoring the Future Monograph Series. Ann Arbor, MI: Institute for Social Research, University of Michigan; 2023. 6. Winhusen T, Theobald J, Kaelber DC, et al. The association between regular cannabis use, with and without tobacco co-use, and adverse cardiovascular outcomes: Cannabis may have a greater impact in non-tobacco smokers. Am J Drug Alcohol Abuse. 2020;46(4):454-461. 7. Jeffers AM, Glantz S, Byers AL, et al. Association of cannabis use with cardiovascular outcomes among US adults. J Am Heart Assoc. 2024;13(5):e030178. 8. Parekh T, Pemmasani S, Desai R. Marijuana use among young adults (18–44 years of age) and risk of stroke: a Behavioral Risk Factor Surveillance System survey analysis. Stroke. 2020;51(1):308-310.
Address for Correspondence: Dietrich von Kuenssberg Jehle, MD, The University of Texas Medical Branch, Department of Emergency Medicine, 301 University Blvd, Galveston, TX 77555. Email: dijehle@utmb.edu.
Western Journal of Emergency Medicine
9. Roditis ML, Delucchi K, Chang A, et al. Perceptions of social norms and exposure to pro-marijuana messages are associated with adolescent marijuana use. Prev Med. 2016;93:171-176. 10. Kamel I, Mahmoud AK, Twayana AR, Younes AM, Horn B, Dietzius H.
1742
Volume 27, No. 6: November 2026
Yang et al.
Cannabis Use vs Cigarette Smoking in ED Patients: Comparative Outcomes
Myocardial infarction and cardiovascular risks associated with
22. Pacula RL, Pessar S, Zhu J, et al. Federal Regulations of Cannabis
cannabis use: a multicenter retrospective study. JACC Adv.
for Public Health in the United States. 2025. Available at: https://
2025;4(5):101698.
schaeffer.usc.edu/research/federal-regulations-of-cannabis-forpublic-health-in-the-u-s. Accessed October 4, 2025.
11. Vallée A. Heavy lifetime cannabis use and mortality by sex. JAMA
23. Page RL, Allen LA, Kloner RA, et al. Medical marijuana, recreational
Netw Open. 2024;7(6):e2415227.
cannabis, and cardiovascular health: a scientific statement from the
12. von Elm E, Altman DG, Egger M, et al. The Strengthening the Reporting of Observational Studies in Epidemiology (STROBE)
American Heart Association. Circulation. 2020;142(10):e131-152.
statement: guidelines for reporting observational studies. J Clin
24. Goyal H, Awad HH, Ghali JK. Role of cannabis in cardiovascular disorders. J Thorac Dis. 2017;9(7):2079-2092.
Epidemiol. 2008;61(4):344-349.
25. O’Keefe EL, Peterson TM, Lavie CJ. Reevaluating America’s latest
13. FastStats. Centers for Disease Control and Prevention. Updated
pharmaceutical trend: the cardiovascular risk of cannabis. Curr Opin
2025. Available at: https://www.cdc.gov/nchs/fastats/leading-causes-
Psychol. 2021;38:31-37.
of-death.htm. Accessed January 17, 2026. 14. Chambers J, Keyhani S, Ling PM, et al. Perceptions of safety of daily
26. Storck W, Elbaz M, Vindis C, Déguilhem A, Lapeyre-Mestre M,
cannabis vs tobacco smoking and secondhand smoke exposure,
Jouanjus E. Cardiovascular risk associated with the use of cannabis
2017–2021. JAMA Netw Open. 2023;6(8):e2328691.
and cannabinoids: a systematic review and meta-analysis. Heart. 2025;111(22):1047-1056.
15. Substance Abuse and Mental Health Services Administration. 2023
27. Chandy M, Jimenez-Tellez N, Wu JC. The relationship between
National Survey on Drug Use and Health (NSDUH): Annual National
cannabis and cardiovascular disease: clearing the haze. Nat Rev
Report. 2024. Available at: https://www.samhsa.gov/data/report/2023-
Cardiol. 2025;22(7):467-481.
nsduh-annual-national-report. Accessed January 21, 2026.
28. Wang X, Derakhshandeh R, Liu J, et al. One minute of marijuana
16. Drug Abuse Warning Network (DAWN); National Estimates of
secondhand smoke exposure substantially impairs vascular
Drug-Related Emergency Department Visits, 2024, Substance Abuse and Mental Health Services Administration. 2025. Available at: https://
endothelial function. J Am Heart Assoc. 2016;5(8):e003858.
www.samhsa.gov/data/report/dawn-national-estimates-drug-related-
29. Mohammadi L, Navabzadeh M, Jiménez-Téllez N, et al. Association of endothelial dysfunction with chronic marijuana smoking and
emergency-department-visits-2024. Accessed January 21, 2026.
THC-edible use. JAMA Cardiol. 2025;10(8):851-855.
17. Subramaniam VN, Menezes AR, DeSchutter A, et al. The
30. Lopez B, Carter J, Paul KK, et al. Impact of cannabis use on suicide
cardiovascular effects of marijuana: Are the potential adverse effects
and psychiatric outcomes in the emergency department. [Abstract
worth the high? Mo Med. 2019;116(2):146-53.
525]. Acad Emerg Med. 2024;31(Suppl 1):8-401.
18. ElSohly MA, Mehmedic Z, Foster S, Gon C, Chandra S, Church JC.
31. Gobbi G, Atkin T, Zytynski T, et al. Association of cannabis use in
Changes in cannabis potency over the last 2 decades (1995–2014): analysis of current data in the United States. Biol Psychiatry.
adolescence and risk of depression, anxiety, and suicidality in young
2016;79(7):613-619.
adulthood: a systematic review and meta-analysis. JAMA Psychiatry. 2019;76(4):426-434.
19. ElSohly MA, Chandra S, Radwan M, et al. A comprehensive review of
32. Gorelick DA. Cannabis-related disorders and toxic effects. N Engl J
cannabis potency in the United States in the last decade. Biol
Med. 2023;389(24):2267-2275.
Psychiatry Cogn Neurosci Neuroimaging. 2021;6(6):603-606.
33. Cornelius ME, Loretan CG, Jamal A, et al. Tobacco product use
20. Cannabis (Marijuana) Research Report. National Institute on Drug Abuse; 2020. Available at: https://www.drugsandalcohol.ie/37727/1/
among adults—United States, 2021. Morb Mortal Wkly Rep.
cannabis-marijuana-research-report.pdf. Accessed October 4, 2025.
2023;72(18):475-483. 34. Jeffers AM, Glantz S, Byers A, Keyhani S. Sociodemographic
21. Freeman TP, Craft S, Wilson J, et al. Changes in delta-9tetrahydrocannabinol (THC) and cannabidiol (CBD) concentrations in
characteristics associated with and prevalence and frequency of
cannabis over time: systematic review and meta-analysis. Addiction.
cannabis use among adults in the US. JAMA Netw Open.
2021;116(5):1000-1010.
2021;4(11):e2136571.
Volume 27, No. 6: November 2026
1743
Western Journal of Emergency Medicine
Education Special Issue: Original Research
Anticipating Change: Local Attitudes Toward a New Community Emergency Medicine Residency Program J. Austin Lee, MD, MPH* Ben Johnson, BS† Joseph T. Cornelius, BS‡
*Indiana University School of Medicine, Department of Emergency Medicine, Bloomington, Indiana † Indiana University School of Medicine, Bloomington, Indiana ‡ Indiana University School of Medicine, Department of Medical Sciences, Bloomington, Indiana
Section Editor: Kendra Parekh, MD, MHPE Submission history: Submitted May 12, 2026; Revision received September 7, 2026; Accepted September 7, 2026 Electronically published November 2, 2026 Full text available through open access at http://escholarship.org/uc/uciem_westjem DOI 10.5811/westjem.65682
Introduction: The Indiana University School of Medicine launched two new community-based residency programs at Indiana University Health Bloomington (IUH-B) in July 2026. Prior to the launch, this research explored community members’ attitudes, expectations, and concerns regarding the introduction of resident physicians to the emergency department (ED). Methods: This study was conducted from June to July 2025 at IUH-B. Using a convergent mixedmethods design, we evaluated a convenience sample of adult patients and accompanying family members in the emergency department (ED). Data collection included a 16-item electronic survey and semi-structured interviews. Results: The survey was completed by 39 adult participants, and 40 completed the qualitative interview. Most participants (59%) were aware of the residency programs, and nearly all (95%) agreed that residents would improve the quality, access, and modernity of healthcare in Bloomington, with very few expressing concerns about resident involvement. Overall, 97% of respondents stated support for the expansion of additional physician training programs locally. Comfort with or support for residency programs was not significantly influenced by prior experience with residents or awareness of the new programs. Thematic analysis shows that participants value residents who are competent, personable, and attentive listeners, while emphasizing the importance of strong supervision by attending physicians. Overall, participants are optimistic that new residency programs will bring more clinicians and up-to-date medical practices to the Bloomington area. Conclusion: Participants viewed the implementation of a new residency program positively, agreeing with proposed benefits and expressing minimal concerns. To ensure successful integration, further community initiatives should focus on educational outreach regarding the specific roles and training levels of emergency medicine residents, and prepare for implementation of trainees. [West J Emerg Med. 2026;27(6)1744–1750.]
INTRODUCTION In July 2026, the Indiana University School of Medicine launched two physician residency training programs in Bloomington, Indiana, one of which is an emergency medicine (EM) residency. Prior research suggests that the expansion of residency programs enhances the quality of patient care, supports long-term workforce development through Western Journal of Emergency Medicine
improved recruitment and retention, increases access to care, and expands local and regional opportunities for medical education.1-4 Patient care and community support for new medical training programs, depend heavily on how patient and family members perceive resident-delivered care and develop trust in those trainees.5-8 Prior studies have examined patient and community
1744
Volume 27, No. 6: November 2026
Lee et al.
Local Attitudes Toward a New Community EM Residency Program
members’ perspectives of resident physicians working in clinical and surgical practice environments in family medicine, orthopedics, and neurosurgery; however, no studies have assessed these perspectives in the field of emergency medicine.5,9-13 While a study of the implementation of a general surgery program in rural Appalachia found strong local support for the presumed community benefits and improved access to care,5 other studies have found that community members misunderstand the roles, responsibilities, and levels of physician education and training.8,9,14,15 This study explores community members’ knowledge, expectations, and concerns regarding the introduction of resident physicians in the emergency department (ED) clinical setting at Indiana University Health Bloomington (IUH-B). The goal was to acquire insights that would inform program planning, patient communication, and community engagement strategies ahead of the program launch. METHODS Study Setting and Design The IUH-B is a Level III trauma center in Bloomington, Indiana with 60 emergency department (ED) beds and more than 53,000 visits annually.16 We collected data from patients and family members during their ED visit from June 25 to July 10, 2025. The quantitative survey and qualitative interview were performed at the same encounter; each participant was interviewed separately. Prior to this study, there had been limited outreach or publicity regarding program approval and implementation timeline. This study was reviewed and approved by the Indiana University Institutional Review Board (#27539). We used a concurrent convergent mixed-methods design, incorporating structured electronic surveys and semistructured interviews with adult patients and accompanying family members who received care in the IUH-B ED. Quantitative and qualitative data were integrated to triangulate findings (Figure 1).17-19 We developed the survey instrument and semi-structured interview guide based on literature assessing patient and community attitudes toward resident physicians. The tools were directly informed by a survey used by Suliman et al in an evaluation of community stakeholder perceptions regarding a new rural general surgery residency program.5 Items were adapted and supplemented with additional questions specific to EN and the IUH-B community setting. Pilot testing was performed among the authors. The electronic survey assessed general awareness of the incoming trainees, perceived benefits and concerns, and openness to receiving care from residents. Subsequent interviews (BJ) enabled us to better understand the context as themes of trust, continuity of care, and expectations were explored regarding trainee involvement in clinical encounters. If a participant had given an inaccurate definition of a medical resident in response to a survey question, the interviewer gave Volume 27, No. 6: November 2026
Population Health Research Capsule What do we already know about this issue? Prior studies show graduate medical education in a community setting may improve care, workforce, and access. What was the research question? How do community members view the introduction of emergency medicine (EM) residents into a community emergency department? What was the major finding of the study? Community members surveyed strongly supported (95-97%) the new EM residency, citing expected benefits with few concerns. How does this improve population health? Community support and concerns can guide education, communication, and resident training as new EM programs are implemented.
them the correct definition. The research team was led by JAL, an emergency physician with a background in public health and research. All three research group members are male. BJ is a medical student; JTC, a PhD candidate in the school of
Figure 1. Convergent mixed-methods design framework in a study of community members’ expectations and concerns regarding a new emergency medicine training program.
1745
Western Journal of Emergency Medicine
Local Attitudes Toward a New Community EM Residency Program
Lee et al.
medicine, has performed in-depth work in qualitative methods and research. Selection of Participants We obtained a convenience sample of participants among persons in the IUH-B ED clinical care spaces. Participants were excluded if they were less than 18 years of age, lacked consent capacity due to critical illness or incapacity, or were prisoners. Individuals were surveyed and interviewed in a private patient care space, or they were offered a private area for data collection if they were in a care area with limited privacy. Participants were not compensated for their time. Data Collection and Management All participants received standard care at the discretion of their treating clinicians in the ED. Participants interacted with study personnel and completed the electronic survey (Appendix 1) and semi-structured interview (Appendix 2) in a single encounter. Refusal to participate was not tracked. Some participants were alone, while others had family or friends with them in their ED care space at the time of the survey/ interview. Participants were given a password-protected tablet, and under the supervision of a study team member, they completed a 16-item electronic survey comprised of predominantly Likert-scale and yes/no questions (Appendix 1). Each survey and interview lasted 20 to 30 minutes per participant. No personally identifiable information was captured in the electronic survey, although participants’ voices were recorded anonymously during the interview. No demographic data such as age, sex, or gender identity were collected. Survey results were stored in a secure REDCap site, and all audio recordings, as well as transcripts and thematic coding, were saved in a password-protected, encrypted repository.20,21 Outcomes and Analysis Both the survey and semi-structured interviews addressed five domains of incoming EM resident training at IUH-B: awareness and understanding, perceived benefits, concerns, trust, and looking to the future. Most of the survey questions were based on a five-point Likert scale. We used descriptive statistics and chi-square testing to analyze the quantitative findings. Qualitative results were examined using an iterative Saldana thematic analysis framework (Figure 2).22 The semi-structured interviews were fully transcribed verbatim. BJ and JTC independently analyzed the and assigned codes to the data; they developed a codebook following multiple revisions. The first two versions of the codebook and sample coding were compared independently by each study author. Discrepancies were resolved through discussion. Qualitative interview responses were then assigned to categories and then designated to overarching themes. Codes were assigned to individual fragments of data. The coded responses were then categorized based on relationships, Western Journal of Emergency Medicine
Figure 2. Thematic analysis methodology in a study of community members’ expectations and concerns regarding a new emergency medicine training program.
differences, similarities, and interactions. Finally, broad themes were analytically assigned to overlapping categories. We used concurrent convergent-mixed methods to compare and contrast the qualitative and quantitative findings. RESULTS A total of 39 adult participants completed the electronic survey, and 40 completed the qualitative interview. One participant was willing to engage in the qualitative interview but declined to complete the electronic quantitative survey. Quantitative Results The full compendium of quantitative results is available in Appendix 3. Twenty-three participants (59%) reported being aware of the upcoming residency programs at IUH-B, and nearly half (49%) correctly identified an emergency medicine resident as a medical school graduate in supervised specialty training. Although EM residents were not yet part of the IUH-B community at the time of the study, 20 respondents (51%) had previously been cared for by a resident physician in another setting, and none expressed dissatisfaction with that experience. When asked about the potential benefits of having resident physicians in Bloomington, participants cited a shortage of local clinicians and agreed that residents would enhance IUH-B by improving healthcare quality, and access, with the the incorporation of up-to-date medical knowledge and practices. Two participants (5%) expressed concern that resident involvement could negatively affect their care; one individual (3%) voiced discomfort with residents’ training level; however, they did not correctly identify residents’ educational background. Most participants agreed that they would feel trust and
1746
Volume 27, No. 6: November 2026
Local Attitudes Toward a New Community EM Residency Program
Lee et al.
comfort if they were to receive care from EM residents, and nearly all trusted IUH-B to ensure safe, effective supervision. A total of 44% preferred that supervising physicians not be present for most resident interactions, suggesting confidence in residents’ competence. The majority (95%; n = 37) agreed that residency programs would improve healthcare in the Bloomington community, and 97% (n = 38) supported the expansion of additional training programs locally. Prior experience with residents or awareness of the new programs did not significantly influence comfort levels or support for residency expansion (𝛘² = 0.004, P = .95; 𝛘² = 0.034, P = .85).
Qualitative Results To further understand how community members perceived the changes in the residency programs at IUH-B, we explored interview data via thematic analysis. Based on this iterative framework, a set of codes, broader subthemes, and themes were derived from the data. These domains included structured questions and topics to initiate the discussion; additionally, some unstructured discussion also followed (Appendix 2). Using interrater reliability, we found that the initial round of coding resulted in a Cohen kappa value of 0.724 (P < .001), indicating high interrater reliability. The final codebook had four overarching themes (Table): benefits of residency programs; concerns regarding residents; trust (or distrust); and advice to residents from a patient
perspective. Each theme is a synthesis of various categories, and categories contained one or more specific codes taken from interview responses. Themes and Subthemes 1. Benefits of Residency Programs. Interview participants provided positive insights regarding new residency programs at IUH-B. System-level benefits included extra staff, increased clinicians, reduced wait times, increased retention, and upto-date training. Community level benefits covered economic benefit, trust, and increased educational opportunities. One observed that “It could only get better... the more people you have out there working toward that goal the better.” Participants also highlighted expanding research and educational opportunities locally, strengthening ties between the hospital and surrounding area. [The new residency program] will attract more physicians to the area... expanding research, education, and knowledge in the area... building trust and friendship in the community.
2. Concerns Regarding Residents. While participants expressed strong support, concerns were articulated about the training, confidence, and inexperience of resident doctors,
Table. Qualitative thematic analysis codebook: themes, categories, and codes. Theme
Category
Code (n = times mentioned)
Benefits of Residency Program
System Level
Extra staff/Increased number of clinicians (26), Reduced wait times (4), Increased retention (11), Up-to-date training (8)
Community Level
Economic benefit (1), Community benefit (5), Increased educatioal ppportunities (5)
Inexperience
Lack of knowledge (6), Rushing (3)
Overconfidence
Arrogance (3), Not asking for help (10)
Supervision
Lack of oversight (9), Proper supervision (3)
Patient-Clinician Communication
Honesty (3), Professionalism (2), Bedside manner (8)
Clinical Demeanor
Positive attitude (5), Listening skills (17)
Collaboration
Learn from staff (6)
Preparedness
Stay updated (2), Humility (4), Knowledge (14)
Concerns Regarding Residents
Trust (or Distrust)
Advice to Residents from a Patient Perspective
Volume 27, No. 6: November 2026
1747
Western Journal of Emergency Medicine
Local Attitudes Toward a New Community EM Residency Program highlighting the tension between teaching and providing topnotch service. [I would be concerned] if they’re not knowledgeable... not taking their time... better ask somebody if they don’t know something.
Participants emphasized that proper supervision is needed, expressing fear that without it, mistakes could yield patient injury or improper care. [I would be concerned about] someone who’s not as qualified... but if they do a good job overseeing them, I would be less concerned.
3. Trust. Trust emerged as a central characteristic when discussing the future residency program, described as a relational process centered around patient-clinician communication and clinical demeanor. Professionalism and respect would make me trust them. Bedside manner is important... the way they listen to you.
Establishing clear communication and trust is essential to patient wellbeing and is a transactional process focused on residents’ professional development and patient satisfaction. 4. Advice to Residents from Patients and Family. Participants were prompted to provide one piece of advice to incoming residents, frequently discussing the importance of collaboration, preparedness, and recognizing knowledge gaps. Listen to patients and answer questions asked rather than blowing them off… connect with your team and think through things as a team. Listen to patients, have confidence, and be humble… you don’t have to know it all.
Overall, participants were optimistic about the program, agreeing it would benefit the health system and community, with minimal concerns provided that residents remained under proper supervision and maintain professional communication. DISCUSSION Approximately half of the surveyed individuals correctly identified the role of a resident physician—the most consistent finding between this study and others across multiple medical specialties. The percentage of people who can correctly identify the roles and responsibilities of residents is close to 50%; however, some studies found accurate identification to be as little as 20% to 30%.6,8,9,12-15 Notably, this knowledge gap Western Journal of Emergency Medicine
Lee et al.
did not appear to undermine trust; qualitative data showed that participants grounded their confidence in residents primarily in relational qualities such as communication and bedside manner, rather than in an accurate understanding of training level. Educational outreach may be needed to better inform the community about the role and training level of EM residents. In addition, defining roles while caring for patients in the ED should be emphasized in the training of residents. More than half of those surveyed reported they were aware of the new EM residency program. While this finding was relatively higher than expected, there remains opportunity to improve communication with the community. Although the local press had reported on the program while we were administering the surveys, the news had not yet been widely reported at the time.23,24 Participants largely viewed the new residency program as a positive change within the community that would bring many benefits. Recurring themes were that implementation would lead to an increased number of clinicians, increased retention of those clinicians, and decreased wait times, as well as bring cutting-edge medicine, economic benefit, and community benefit as a whole to Bloomington. These qualitative themes were corroborated quantitatively, with more than 90% of survey respondents agreeing that the program would improve access, quality of care, and the incorporation of up-to-date medical practices. This suggests strong convergence between the two methods on the perceived benefits of the program, even though the interviews identified benefits (physician retention, economic benefit) that the structured survey did not directly explore. This aligns with prior research, with most patients agreeing that the expansion of graduate medical education programs is beneficial to their respective communities.2,5,6,10 A few concerns have been expressed about the program. Similar to what has been reported in other medical specialties, concerns include residents’ level of training (ie, inexperience) and the extend of proper supervision.6,9,10 While only 5% of survey respondents expressed hesitations about resident involvement, “concerns regarding residents” emerged as a full thematic category in interview data, suggesting open-ended discussion highlighted issues that our forced-choice survey items, and their positively anchored wording, did not fully capture. In this study and in others, most participants reported feeling comfortable with being treated by residents, and their confidence in residents improves if they know that the resident is in fact under supervision.5,6,9,10 The qualitative emphasis on supervision as a condition for trust contrasts with the 44% of survey respondents who preferred a supervising physician not be present for most resident interactions; together, these findings suggest patients may care less about an attending’s physical presence at every encounter than about knowing a supervisory structure exists as a backstop. The presence of an attending physician is likely of greater importance in high-stakes and procedural
1748
Volume 27, No. 6: November 2026
Lee et al.
Local Attitudes Toward a New Community EM Residency Program
environments such as the operating room. This strengthens the argument that community education is needed to clarify the roles and responsibilities of residents and other members of the healthcare team. Patients seem willing to trust resident physicians with their care and are more willing to trust those who demonstrate effective patient-clinician communication and display a professional clinical demeanor. These themes were brought up most frequently by the participants in this study, and they add to the sparse literature on these topics. When given the opportunity to advise incoming residents, participants emphasized that residents should be collaborative with the healthcare team, prepared for the next phase of training, and willing to learn. Previous research suggests that patients believe it is most important that residents stay current with advances in medical knowledge.2,6 To improve patient trust, and therefore patient care, the residents’ didactic curriculum will need to emphasize professionalism and effective communication and collaboration between patients and the healthcare team. LIMITATIONS The convenience sample was collected over a two-week period from a single ED, which may limit the generalizability of findings to other community hospital or academic settings. Demographic data such as age and sex were not collected, preventing analysis of how these variables may influence attitudes toward resident physicians. Although quantitative questions did include responses with negative and positive Likert-scale options, generally positive wording of survey questions may have introduced acquiescence bias. The sample size, while sufficient for exploratory mixed-methods work, is relatively small for drawing broad quantitative conclusions. Semi-structured interviews are also susceptible to interviewer-introduced bias and social desirability bias, because participants speaking face-to-face with an interviewer affiliated with the institution may have tempered negative opinions. Additionally, participants were recruited during an active ED visit, which may have introduced some response or selection bias and is not likely to be fully representative of true “community” knowledge or attitudes. Finally, as awareness of the incoming residency program was still limited at the time of data collection, future assessments following community education efforts may yield different results. CONCLUSION Members of the Indiana University Health Bloomington community generally hold positive views and are broadly supportive of a new EM residency program. Most participants agreed that the new program would bring increased access to care, improved healthcare quality, and use of the most current medical practices and procedures, and they agreed this would improve the hospital overall. Some participants
Volume 27, No. 6: November 2026
were not aware of the incoming residency programs, and as in prior work, community members often could not correctly distinguish a resident physician from other roles, such as a medical student. Because of this, further education is needed to ensure that the patients and family members understand the training level of their clinicians. The community demonstrated little concern for the introduction of residents into their care. A few noted that they might be concerned with inexperience or arrogance but emphasized that proper oversight by more experiences clinicians would minimize these concerns. Furthermore, participants expressed trust in the healthcare team at IUH-B, including residents, to provide quality healthcare following implementation of the new program. In fact, the community supports the expansion of other residency programs in the area and agrees that this expansion would improve health care for Bloomington, Indiana, and the surrounding areas. Beyond being the first study (to our knowledge) to examine community attitudes toward a new emergency medicine residency, our findings identify communication and demeanor (rather than clinical competence alone) as the driver of patient trust, which can offer actionable targets for preimplementing community education as well as communication training for residents working in the emergency department and hospital setting. ACKNOWLEDGMENTS The authors would like to thank Cecelia Vetter, MLIS, from the Indiana University School of Medicine Ruth Lilly Medical Library for assistance with the literature search and help in formulating this project.
Address for Correspondence: J. Austin Lee, MD, MPH, Indiana University School of Medicine, Department of Emergency Medicine, 2651 E Discovery Parkway, Bloomington, IN 47408. Email: lee474@iu.edu. Conflicts of Interest: By the WestJEM article submission agreement, all authors are required to disclose all affiliations, funding sources and financial or management relationships that could be perceived as potential sources of bias. No author has professional or financial relationships with any companies that are relevant to this study. Research reported was supported by the Indiana Clinical and Translational Sciences Institute, which is funded, in part, by the National Center for Advancing Translational Sciences of the National Institutes of Health under award number UL1TR002529. The content is solely the responsibility of the authors and does not necessarily represent the official views of the National Institutes of Health. There are no other conflicts of interest or sources of funding to declare. Copyright: © 2026 Lee et al. This is an open access article distributed in accordance with the terms of the Creative Commons Attribution (CC BY 4.0) License. See: http://creativecommons.org/ licenses/by/4.0/
1749
Western Journal of Emergency Medicine
Local Attitudes Toward a New Community EM Residency Program
Lee et al.
REFERENCES
knowledge, confidence, and acceptance regarding the role of
1. Tripp Umbach. The economic impact of graduate medical education
residents in a family medicine teaching clinic. Can Med Educ J. 2021;12(5):40-47.
expansion in Indiana. 2022. Available at: https://www.in.gov/che/files/ FINAL_Economic-Impact-of-Graduate-Medical-Education-in-Indiana.
14. Santen SA, Hemphill RR, Prough EE, et al. Do patients understand their physician’s level of training? A survey of emergency department
pdf. Accessed August 21, 2025.
patients. Acad Med. 2004;79(2):139-143.
2. Alweis R, Donato A, Terry R, et al. Benefits of developing graduate medical education programs in community health systems. J
15. Hemphill RR, Santen SA, Rountree CB, et al. Patients’ understanding
Community Hosp Intern Med Perspect. 2021;11(5):569-575.
of the roles of interns, residents, and attending physicians in the
3. Ahmed H, Carmody JB. On the looming physician shortage and
emergency department. Acad Emerg Med. 1999;6(4):339-344.
strategic expansion of graduate medical education. Cureus.
16. Department of Emergency Medicine, IU School of Medicine. Training sites | Bloomington Emergency Medicine Residency. Available at:
2020;12(7):e9216.
https://medicine.iu.edu/emergency-medicine/education/residency/
4. Cico SJ. Graduate medical education expansion to rural community
bloomington/locations. Accessed November 14, 2025.
hospitals: residency training beyond the academic health center.
17. Tasseff TL, Tavernier SS, Watkins PR, et al. Exploring perceptions
Perm J. 2020;24:12-13. 5. Suliman T, Curry C, Dolan N, et al. Establishing a rural general
of palliative care among rural dwelling providers, nurses, and adults
surgery residency program: identifying community stakeholder
using a convergent parallel design. Online J Rural Nurs Health Care.
perception and obstacles of a de novo residency in rural Appalachia.
2018;18(2):152-188. 18. Katz-Buonincontro J. How to Mix Methods: A Guide to Sequential,
Am Surg. 2023;89(12):6030-6034.
Convergent, and Experimental Research Designs. American
6. Malcolm CE, Wong KK, Elwood-Martin R. Patients’ perceptions and
Psychological Association. 2024.
experiences of family medicine residents in the office. Cam Fam
19. Creswell JW, Clark VLP. Designing and Conducting Mixed Methods
Physician. 2008;54(4):570-571.e1-6.
Research. SAGE Publications. 2017..
7. Shih AF, Addo-Tabiri NO, Sofair AN. Patients’ perceptions of bedside
20. Harris PA, Taylor R, Minor BL, et al. The REDCap consortium:
rounding. South Med J. 2018;111(5):281-287.
building an international community of software platform partners. J
8. Wray A, Feldman M, Toohey S, et al. Patient perception of providers:
Biomed Inform. 2019;95:103208.
Do patients understand who their doctor is? J Patient Exp. 2020;7(5):788-795.
21. Harris PA, Taylor R, Thielke R, et al. Research electronic data
9. Unruh KP, Dhulipala SC, Holt GE. Patient understanding of the role
capture (REDCap)—a metadata-driven methodology and workflow
of the orthopedic resident. J Surg Educ. 2013;70(3):345-349.
process for providing translational research informatics support. J Biomed Inform. 2009;42(2):377-381.
10. Nakar S, Levi D, Rosenberg R, et al. Patient attitudes to being treated by junior residents in the community. Patient Educ Couns.
22. Saldana J. The Coding Manual for Qualitative Researchers. SAGE Publications. 2021.
2010;78(1):111-116. 11. Fiani B, Cathel A, Arshad M, et al. Patient perspectives on the
23. Indiana University School of Medicine. Two new Bloomington-based
participation of neurosurgery resident physicians in their care.
IU School of Medicine residency programs gain accreditation. 2025.
Cureus. 2020;12(2):e6880.
Available at: https://medicine.iu.edu/news/2025/07/bloomingtonresidency-programs-internal-emergency-medicine. Accessed August
12. Bryce J, Ndoja S, Goyal P, et al. Patients’ perspectives on the extent
24, 2025.
of resident participation in the operating room for total hip oxr knee arthroplasty. Can Med Educ J. 2021;12(1):e21-31.
24. EMRA. EMRA match. Available at: https://www.match.emra.org. Accessed August 24, 2025.
13. Babin L, Cormier I, Champagne S, et al. Level of patients’
Western Journal of Emergency Medicine
1750
Volume 27, No. 6: November 2026
Brief Research Report
Impact of an Overnight Stay in the Emergency Department Hallway on Admitted Geriatric Patients Sarah E. Perelman, MD*†‡§ Melissa A. Meeker, PhD* Maura Kennedy, MD, MPH*† Joshua W. Joseph, MD, MS, MBE†|| Shan W. Liu, MD, SD*†
*Massachusetts General Hospital, Department of Emergency Medicine, Boston, Massachusetts † Harvard Medical School, Department of Emergency Medicine, Boston, Massachusetts ‡ Weill Cornell Medicine, Department of Emergency Medicine, New York, New York § NewYork-Presbyterian Hospital, Department of Emergency Medicine, New York, New York || Brigham and Women’s Hospital, Department of Emergency Medicine, Boston, Massachusetts
Section Editor: Stephen W Meldon, MD ¶ Submission history: Submitted March 24, 2025; Revision received June 30, 2026; Accepted July 6, 2026 Electronically published October 14, 2026 Full text available through open access at http://escholarship.org/uc/uciem_westjem DOI 10.5811/westjem.64046
Introduction: Patients frequently board overnight in the emergency department (ED) while awaiting medical admission, sometimes in hallway care spaces. Prior literature suggests that timing of boarding may matter; a single overnight stay in the ED may be associated with increased mortality and adverse events, especially for older adults. Given the deliriogenic ED environment, these effects may be magnified in the hallway. However, little is known about the effects of prolonged hallway stays. We evaluated whether an overnight stay in the ED hallway, compared to an ED room, was associated with increased delirium and adverse outcomes for geriatric patients. Methods: We conducted a retrospective multisite cohort database study of patients aged 65 years and older admitted to a general medicine service January 1, 2022, to December 31, 2023, who spent an entire night (midnight to 8 am) in the ED prior to admission. We compared those who spent the entire night in the ED hallway with those who were in ED rooms. Our primary outcome was a composite outcome for incident delirium and severe agitation (defined by the International Classification of Diseases, 10th Rev, code for delirium, positive nursing screen, use of parenteral antipsychotics, and/or physical restraints, since delirium was not routinely screened for at these sites). Secondary outcomes included hospital length of stay (LOS), inpatient and 30-day mortality, and 30-day ED revisit and readmission. We implemented mixed-effect regression models and adjusted for confounders. Results: A total of 8,576 patients met inclusion criteria, including 1,231 patients (14%) in the hallway group. Overall, 847 patients (9.9%) developed incident delirium and severe agitation: 160 (13%) of the hallway group and 687 (9%) of the non-hallway group. An overnight stay in the ED hallway was not associated with delirium and severe agitation (OR, 1.06, 95% CI, 0.58–1.94; P = .84), but increased ED LOS was independently associated with delirium and severe agitation (OR, 1.01; 95% CI, 1.0–1.01 per hour; P = .01). There was no association between an overnight stay in the hallway and secondary outcomes except increased hospital LOS (OR 1.01, 95% CI, 1.00–1.01 per hour; P = .01). Conclusion: An overnight in the ED hallway care space was not associated with increased delirium and severe agitation for geriatric patients, but prolonged ED LOS was associated with this outcome. Hospital systems should consider prioritizing geriatric patients for expedited transfer from the ED to inpatient units, and prospective research with consistent delirium screening is needed to rigorously evaluate the safety of hallway care for older adults. [West J Emerg Med. 2026;27(6)1751–1757.]
Volume 27, No. 6: November 2026
1751
Western Journal of Emergency Medicine
Impact of an Overnight Stay in the ED Hallway on Admitted Geriatric Patients INTRODUCTION Admitted patients frequently experience prolonged emergency department (ED) length of stay (LOS) prior to transfer to inpatient units due to the boarding and crowding crisis, despite emerging evidence that spending extended time in the ED is associated with delirium, increased hospital LOS, and mortality.1–3 These negative outcomes are especially pronounced for older adults.2,3 As EDs struggle with capacity challenges related to boarding, using ED hallway care spaces has increased. Few studies have evaluated the safety of hallway care. Our recent paper suggested that extended ED hallway care may be associated with delirium for older persons living with dementia.4 Importantly, emerging evidence suggests that the timing of ED exposure may also matter. A multicenter cohort study found that even a single overnight stay in the ED while awaiting admission was associated with and adverse events.2 Determining whether an overnight ED hallway stay is associated with delirium could inform whether prioritizing standard treatment rooms for high-risk boarders serves as a feasible prevention strategy when immediate transfer to inpatient units is impossible. We conducted a multisite retrospective cohort study to evaluate the association between an overnight ED hallway stay and incident delirium and severe agitation. This study is a secondary analysis of our prior investigation into the impacts of prolonged hallway care.4 We hypothesized that an overnight hallway stay would be associated with delirium and severe agitation, and that the risk would be worse in persons living with dementia. METHODS We performed a retrospective cohort database study of older adults (at least 65 years of age) who presented to the ED and were subsequently admitted to a general medicine service at two urban, quaternary care EDs in the United States between January 1, 2022, and December 31, 2023, using the electronic health record (EHR). We used aggregated data to allow for a large sample size and followed the Strengthening the Reporting of Observational Studies in Epidemiology (STROBE) guidelines.5 We applied the same exclusion criteria as in our prior work. We excluded patients with ED LOS fewer than 8 hours and who had delirium on arrival or a psychiatric diagnosis, and we only included each patient’s most recent visit.4 For this study, we additionally excluded ED encounters in which the patient was not in the ED for a full night, defined as from midnight to 8 am. Although “sundowning”—the exacerbation of confusion or delirium later in the day—can occur prior to midnight, we chose this window following the Roussel et al definition of “overnight” associated with increased mortality.2 Eligible participants were dichotomized into either the the hallway group (those who spent an entire overnight period from midnight to 8 am in the ED hallway) or the non-hallway group (those who spent the overnight period in the ED but not Western Journal of Emergency Medicine
Perelman et al. Population Health Research Capsule
What do we already know about this issue? Prolonged emergency department (ED) length of stay is associated with delirium for older adults admitted to the hospital. What was the research question? Is spending an overnight in the ED hallway associated with increased delirium and severe agitation for admitted geriatric patients? What was the major finding of the study? An overnight in an ED hallway vs ED room was not associated with increased delirium and severe agitation (OR 1.06; 95% CI, 0.58–1.94] P = .84). How does this improve population health? Prioritizing transfer of admitted older adults to an inpatient unit remains the priority for mitigating delirium associated with a prolonged ED length of stay.
in hallway care space). Non-hallway care spaces included both primarily private rooms and curtained (semi-private) rooms. Given brief moves into the hallway from rooms for sensitive exams or when resuscitations or other critical patients arrive sometimes occurred, we did not exclude patients who were moved from a room to hallway for part of the night from the non-hallway group. The primary outcome was incident delirium and severe agitation, defined as a composite outcome of International Classification of Diseases, 10th Rev, (ICD-10) code for delirium, positive nursing screen, use of parenteral antipsychotics, and/or physical restraints, as previously described.3,4 Both institutions started educational initiatives for physicians and nurses aimed at identifying delirium and a Confusion Assessment Method (CAM) score was integrated into the medical record, but delirium screening was not consistently performed. Secondary outcomes included hospital LOS in days, inpatient and 30-day mortality, and 30-day ED revisit and readmission. We also examined whether there was an interaction between each of these outcomes and a history of dementia. We employed structured query language to abstract encounter and patient data from our EHR (Epic Systems Corporation), including potential confounders determined a priori (age, ED LOS, history of dementia or delirium, acuity as measured by Emergency Severity Index [ESI] level], Charlson Comorbidity Index [CCI], sex, insurance carrier, and
1752
Volume 27, No. 6: November 2026
Impact of an Overnight Stay in the ED Hallway on Admitted Geriatric Patients
Perelman et al.
combined race and ethnicity). First, we examined our outcomes with descriptive statistics. Next, we evaluated bivariate associations between hallway exposure and each patient demographic and visit characteristic with a chi-squared test for categorical variables and a Kruskal-Wallis test for continuous variables. We modeled the association between our composite outcome and hallway care using mixed-effect logistic regression, which included fixed effects to adjust for confounders (as noted above), a random effect to control for site-level correlation, and an interaction term to evaluate whether a prior diagnosis of dementia mediated the association. We employed the same methods for each of the secondary outcomes, using logistic regression for each binary outcome and Poisson regression for LOS. We repeated the analysis for primary and secondary outcomes with overnight hallway exposure as a continuous variable as a sensitivity analysis.
RESULTS Of the 11,105 patients included in the original study, 8,576 (77.2%) spent an overnight in the ED and were included in this study, and 2,529 participants were excluded for not being in the ED for a complete overnight stay. The median age was 77 years (interquartile range [IQR], 71–84), and the median ED LOS was 30 hours (IQR, 24–45); most participants were non-Hispanic White (Table 1). The hallway group included 1,231 patients (14%), and the non-hallway group included 7,345 patients (86%). No significant differences were observed in race, acuity, ED LOS, or history of dementia (all P > .05); however, a larger proportion of men spent the overnight in a hallway care space (52% versus 49%; P = .02). Overall, 847 patients (9.9%) developed incident delirium and severe agitation: 160 patients (13%) of the hallway group and 687 patients (9%) of the non-hallway group. Of these
Table 1. Demographics and descriptive analysis of outcomes of delirium, hospital length of stay (LOS), readmission, and mortality in a retrospective cohort study of older adults admitted to general medicine with > 8-hour emergency department LOS. Overall (N = 8,576)
Overnight hallway (n = 1,231)
Overnight non-hallway (n = 7,345)
P value
77 (71–84)
77 (70–83)
77 (71–84)
.001
Male
4,207 (49%)
643 (52%)
3,564 (49%)
.02
Female
4,369 (51%)
588 (48%)
3,781 (51%)
Hispanic
664 (8%)
103 (8%)
561 (8%)
Age (years)1 Sex Combined Race and Ethnicity
.43
Non-Hispanic Black
742 (9%)
96 (8%)
646 (9%)
Non-Hispanic White
6,184 (72%)
877 (71%)
5,307 (72%)
Non-Hispanic Other
597 (7%)
91 (7%)
506 (7%)
Unknown
389 (5%)
64 (5%)
325 (4%)
Site A
1,867 (22%)
109 ( 9%)
1,758 (24%)
Site B
6,709 (78%)
1,122 (91%)
5,587 (76%)
2 (0, 4)
2 (0, 3)
2 (0, 4)
< .001
History of dementia
1,019 (12%)
156 (13%)
863 (12%)
.38
Insurance
Private
560 (7%)
75 (6%)
485 (7%)
.02
Public
7,838 (91%)
1,118 (91%)
6,720 (91%)
Other
178 (2%)
38 (3%)
140 (2%)
1 to 2
4,441 (52%)
620 (50%)
3,821 (52%)
3 to 5
4,063 (47%)
601 (49%)
3,462 (47%)
72 (1%)
10 (1%)
62 (1%)
30 (24, 45)
30 (24, 45)
30 (24, 44)
.26
847 (9.9%)
160 (13%)
687 ( 9%)
< .001
Site
Charlson Comorbidity Index1
Acuity
Missing ED length of stay (hours)
1
Delirium
< .001
.55
Hospital length of stay (days)1
5 (3, 9)
5 (2, 9)
5 (3, 9)
.07
Hospital mortality
378 (4%)
43 (3%)
335 (5%)
.11
30-day return
1,128 (13%)
160 (13%)
968 (13%)
.90
30-day readmit2
446 (40%)
56 (35%)
390 (40%)
.14
30-day mortality 1 Presented as median (IQR). 2 Among those with 30-day return. ED, emergency department.
681 (8%)
75 (6%)
606 (8%)
.01
Volume 27, No. 6: November 2026
1753
Western Journal of Emergency Medicine
Impact of an Overnight Stay in the ED Hallway on Admitted Geriatric Patients patients, 248 (29%) had a positive CAM screen, 257 (30%) received parenteral antipsychotics, 39 (5%) had delirium diagnosis, and 564 (67%) (n=564) had restraints placed. Median hospital LOS was 5 days in both groups (IQR, 2–9] in the hallway group and [IQR, 3–9] in the non-hallway group; P = .07). Overall, in-hospital mortality was 4% (378) with 3% (43) of the hallway group and 4% (335) of the non-hallway group (P = .11). The 30-day return rate was 13% (1,128), including 13% (160) of the hallway group and 13% (968) of the non-hallway group (P =.90). Of those who returned, 30-day readmission was 40% (446), consisting of 35% (56) of the hallway group and 40% (390) of the non-hallway group (P = .14). Our multivariable regression revealed no association between an overnight in the hallway and the development of delirium and severe agitation (OR, 1.06; 95% C, 0.58–1.94; P =.84) (Figure) when controlling for covariates (Table 2). Furthermore, there was no interaction between overnight hallway LOS and history of dementia, and development of delirium/severe agitation (Table 2). The ED LOS was associated with delirium and severe agitation (OR, 1.01 [1.00–1.01; P =.01). An overnight in the hallway was associated with longer hospital LOS when controlling for covariates (OR, 1.09; 95% CI, 1.07–1.12; P < .001). The interaction between a history of dementia and hallway care was associated with a decrease in hospital LOS (relative risk, 0.90; 0.85–0.96; P < .001). There was no significant association between hallway care and ED revisit (OR, 0.97; 0.80-1.18; P = .78), readmission (OR, 0.70; 0.47-1.05; P = .08), 30-day mortality (OR 0.87; 0.60-1.28; P = .48), or inpatient mortality (OR, 0.35; 0.03-3.83; P = .39), nor was a significant interaction between hallway care and dementia observed for any of these secondary outcomes. Our sensitivity analysis with hallway time as a continuous variable also revealed an association between hallway care and longer hospital LOS (OR, 1.01; 1.00–1.01; P <.001) (Table S1). There was no association between hallway care and delirium and severe agitation or other secondary outcomes. There was no interaction observed between hallway care and a history of dementia for any of the outcomes. DISCUSSION Our work fails to support overnight room prioritization as a delirium prevention measure for admitted older adults boarding in the ED, instead suggesting that ED LOS regardless of location within the ED may be associated with delirium. Given that Roussel et al reported a single overnight in the ED was associated with increased hospital LOS and mortality for geriatric patients,2 we hypothesized that these effects may be mediated by delirium and magnified in the hallway. In our cohort, 9.9% developed delirium or severe agitation; however, similar to the findings of Elder et al,1 ED LOS rather than hallway placement was associated with Western Journal of Emergency Medicine
Perelman et al.
Figure. Odds of delirium, severe agitation, and secondary outcomes by adjusted generalized linear mixed-effect regression models stratified by overnight hallway placement in a retrospective cohort study of older adults admitted to general medicine with > 8-hour emergency department length of stay. Poisson regression was applied to Hospital LOS (with rate ratio as outcome) and logistic regression was applied for all other outcomes (with odds ratio as outcome). Figure generated using ChatGPT (GPT-4o), reviewed by the authors for accuracy.
delirium. A relatively small number of patients (160) were positive for delirium in the hallway group, raising the possibility that the study was underpowered to detect a =difference in groups, especially as there was a trend toward as association between hallway care and delirium that did not meet significance (OR, 1.06, 95% CI, 0.58–1.94; P = .84). However, a post-hoc power calculation was high (.98). This research builds on a growing body of literature suggesting that prolonged ED LOS is harmful, with a recent study noting that each hour in the ED is associated with a 2% increased risk of delirium or severe agitation.4 Our effect size was not larger than those in prior studies, suggesting that timing at night may not be a driving factor, but rather duration of ED LOS as a whole regardless of night or day. This emerging body of evidence highlights the importance of minimizing boarding time for geriatric patients, as proposed by the recent Centers for Medicare & Medicaid Services (CMS) Age-Friendly Hospital Measure.6 Our work also highlights key risk factors for incident delirium and severe agitation after an overnight in the ED: a history of dementia, prior delirium episodes, older age, and higher acuity. This supports prior literature on delirium risk factors11; these results could also be actionable for hospital systems when deciding which patients might be better served by prioritization for an inpatient room when beds are scarce. Our lack of observed difference in incident delirium and severe agitation between groups may be partially explained because many factors in the ED environment thought to be associated with delirium (such as night-time clinical tests and fragmented sleep from noise) may be similar between traditional rooms and hallway treatment space, particularly as some rooms are curtained or semi-private. It is also
1754
Volume 27, No. 6: November 2026
Impact of an Overnight Stay in the ED Hallway on Admitted Geriatric Patients
Perelman et al.
Table 2. Adjusted generalized linear mixed-effect regression models of delirium, severe agitation and secondary outcomes by overnight hallway exposure in a retrospective cohort study of older adults admitted to general medicine with >8 hour emergency department length of stay. Delirium Odds Ratio [95% CI]
Hospital LOS Rate Ratio [95% CI]
Hospital Mortality Odds Ratio [95% CI]
30-Day Return Odds Ratio [95% CI]
30-Day Readmit Odds Ratio [95% CI]
30-Day Mortality Odds Ratio [95% CI]
Hallway Group – Adjusted
1.06 [0.58, 1.94]
1.09 [1.07, 1.12]
0.35 [0.03, 3.83]
0.97 [0.80, 1.18]
0.70 [0.47, 1.05]
0.87 [0.60, 1.28]
History of Dementia
2.33 [1.86, 2.92]
1.17 [1.14, 1.20]
1.02 [0.73, 1.44]
1.12 [0.89, 1.41]
1.18 [0.77, 1.81]
1.14 [0.89, 1.48]
Interaction between Hallway Patient and History of Dementia
1.18 [0.75, 1.85]
0.90 [0.85, 0.96]
0.58 [0.21, 1.56]
1.01 [0.60, 1.69]
2.40 [0.90, 6.40]
0.71 [0.36, 1.42]
History of Delirium
2.37 [1.83, 3.07]
1.20 [1.16, 1.24]
1.47 [0.97, 2.24]
1.15 [0.86, 1.53]
1.17 [0.68, 2.00]
1.62 [1.19, 2.22]
ED Length of Stay, hours
1.01 [1.00, 1.01]
1.004 [1.00, 1.00]
0.99 [0.99, 1.00]
1.004 [1.00, 1.01]
1.00 [0.99, 1.01]
0.99 [0.99, 1.00]
Age at Arrival, years
1.03 [1.02, 1.04]
0.995 [0.99, 1.00]
1.06 [1.04, 1.07]
0.98 [0.97, 0.99]
1.02 [1.00, 1.03]
1.05 [1.04, 1.06]
Female Sex (compared to male)
0.77 [0.67, 0.89]
0.94 [0.93, 0.95]
0.94 [0.76, 1.16]
0.88 [0.77, 1.00]
1.08 [0.84, 1.38]
0.81 [0.69, 0.95]
Charlson Comorbidity Index
0.95 [0.91, 0.98]
1.02 [1.01, 1.02]
1.15 [1.09, 1.20]
1.07 [1.03, 1.10]
1.04 [0.98, 1.11]
1.15 [1.11, 1.19]
Insurance (compared to private) Public
0.95 [0.69, 1.30]
1.04 [1.00, 1.07]
1.16 [0.69, 1.95]
1.63 [1.21, 2.19]
1.24 [0.68, 2.26]
1.06 [0.73, 1.54]
Other
1.26 [0.72, 2.19]
1.64 [1.56, 1.72]
1.16 [0.44, 3.08]
1.68 [0.99, 2.83]
1.31 [0.45, 3.77]
0.90 [0.41, 1.95]
Race and Ethnicity (compared to non-Hispanic White) Hispanic
0.80 [0.59, 1.09]
0.87 [0.85, 0.90]
0.65 [0.40, 1.08]
1.23 [0.99, 1.54]
0.73 [0.47, 1.13]
0.60 [0.41, 0.88]
Non-Hispanic Black
1.09 [0.83, 1.42]
1.13 [1.10, 1.15]
0.87 [0.56, 1.35]
1.18 [0.95, 1.46]
0.48 [0.30, 0.75]
0.80 [0.57, 1.10]
Non-Hispanic Other
0.93 [0.69, 1.24]
0.92 [0.89, 0.95]
1.09 [0.73, 1.61]
1.07 [0.83, 1.37]
1.25 [0.78, 2.00]
0.95 [0.69, 1.31]
Unknown
1.35 [0.99, 1.84]
1.00 [0.97, 1.04]
1.14 [0.71, 1.83]
0.57 [0.38, 0.83]
1.09 [0.51, 2.34]
0.86 [0.57, 1.29]
3 to 5
0.72 [0.62, 0.84]
1.02 [1.00, 1.03]
0.59 [0.47, 0.73]
1.12 [0.98, 1.27]
0.74 [0.58, 0.95]
0.72 [0.61, 0.85]
Missing
1.77 [0.96, 3.26]
1.06 [0.98, 1.15]
0.45 [0.11, 1.87]
0.50 [0.20, 1.25]
0.82 [0.13, 5.20]
0.99 [0.44, 2.23]
Acuity (compared to 1 to 2)
Bold = statistically significant to P < .05. Values are shown to 2 decimal places except where additional precision is required to indicate statistical significance Poisson regression was applied to hospital LOS and logistic regression was applied for all other outcomes. LOS, length of stay.
possible that differences in patient factors between the groups placed in the hallway and rooms may account for the lack of impact of hallway care we observed. These differences may not be fully accounted for by ESI level and CCI, because when a clinician decides where to room a Volume 27, No. 6: November 2026
patient, they are likely using other clinical measures of stability based on their assessment and experience that our methods would not capture. Prior work suggests triage nurses place lower acuity patients in the hallways.7 Supporting this, the finding that persons living with. 1755
Western Journal of Emergency Medicine
Impact of an Overnight Stay in the ED Hallway on Admitted Geriatric Patients dementia in the hallway group have a shorter hospital LOS seems counterintuitive clinically. It is possible that features of their presentation or chief complaint are deemed low risk by clinicians, leading to hallway placement, which are not fully adjusted for by ESI level and CCI. It is also possible that family members prefer that persons living with dementia remain at home due to concerns regarding given fear of hospital-induced delirium, a condition for which this population carries a significantly higher risk.11 Interestingly, hallway care was associated with a longer overall hospital LOS but not with delirium, severe agitation, or mortality. This finding may indicate that patients who spend the overnight period in a hallway serve as a marker of severe hospital crowding, which exerts widespread systemic strain and causes care delays for all patients.12 As the hallway group is a smaller cohort, it is possible overnight in the hallway only occurred at times of most severe crowding. However, it is also possible that the care was different or not progressing as quickly for these patients. Qualitative work has suggested that nurses struggle more to mobilize hallway patients and provide personalized care13 and that ack of mobility can lead to increased LOS.14 Additionally, our delirium and severe agitation outcome was measured by proxy; consequently, hospital LOS may capture some vulnerable patients who were missed by this proxy metric. Furthermore, some lower acuity patients may remain hospitalized due to social factors, such as awaiting nursing home placement. This specific population frequently experiences prolonged hospital LOS while social work services coordinate complex disposition plans.15 LIMITATIONS The lack of association we observed between nighttime care in the ED hallway treatment area and delirium or severe agitation may also be due to the significant limitations in our methods. Delirium is under-recognized in the ED and rarely documented in the medical record; only a third of cases may be identified and documented by emergency physicians.8 Acknowledging the lack of ability to detect delirium by diagnosis code alone, we included the use of parenteral antipsychotics and physical restraints in our composite outcome as a proxy for hyperactive or mixed delirium. However, our outcome criteria may still miss hypoactive delirium, which may account for up to 90% of all delirium cases9 and carries a higher mortality than hyperactive delirium.10 Only 9.9% of our cohort developed delirium, a rate lower than previously reported incidences among hospitalized older adults.11 This discrepancy suggests that our methods underestimated the true incidence, thereby biasing our findings toward the null hypothesis even if a true difference exists between overnight ED room and hallway care. Differences in delirium detection may also exist across groups and create a systematic bias; on the one hand, hyperactive delirium may be better identified in hallways Western Journal of Emergency Medicine
Perelman et al.
because patients are more visible. On the other hand, more consistent screens may be done for patients assigned to rooms. Additionally, crossover contamination may have occurred because we did not exclude patients from the non-hallway group if they spent part of the night in the hallway, although this choice was made to reflect the dynamic nature of ED room assignment given the possibility of brief moves of patients from rooms to a hallway when resuscitations arrived or to allow for sensitive exams or procedures to be performed for patients with a primary room assignment in the hallway. Because only 13% (984 patients) of the non-hallway group experienced such moves, we think the impact would not significantly change the results. Finally, we specifically examined delirium or severe agitation after an overnight stay in the ED, but some patients may develop delirium in a shorter timeframe; it is unknown whether a short hallway stay is associated with delirium and severe agitation, which could be a topic for future research, as proportion of time in the hallway may be associated with delirium.16 This underscores the importance of future prospective work, ideally with multicenter collaborations to achieve adequate power (such as through the Geriatric Emergency Applied Research Network),17 with consistent screening using validated tools to assess for delirium to determine whether there is a true risk of overnight hallway care. CONCLUSION Our retrospective study found that an overnight stay in the ED hallway versus ED room was not associated with our composite outcome for delirium and severe agitation; however, it was associated with longer hospital length of stay. We also observed an association between ED LOS and delirium or severe agitation. As hospitals create policies to follow the CMS Age-Friendly Hospital Measure, our study supports that minimizing ED boarding may prevent delirium. Future prospective research in which validated tools are used consistently to screen for delirium is needed to determine whether certain patients are at risk of developing delirium from ED hallway care.
Address for Correspondence: Sarah E. Perelman, MD, NewYorkPresbyterian Hospital / Weill Cornell Medicine, Department of Emergency Medicine, 525 E 68th St, 179, New York, NY 10065. Email: sap4041@med.cornell.edu. Conflicts of Interest: By the WestJEM article submission agreement, all authors are required to disclose all affiliations, funding sources and financial or management relationships that could be perceived as potential sources of bias. No other author has professional or financial relationships with any companies that are relevant to this study. There are no other conflicts of interest or sources of funding to declare.
1756
Volume 27, No. 6: November 2026
Perelman et al.
Impact of an Overnight Stay in the ED Hallway on Admitted Geriatric Patients emergency department: a diagnostic accuracy meta-analysis of
Copyright: © 2026 Perelman et al. This is an open access article distributed in accordance with the terms of the Creative Commons Attribution (CC BY 4.0) License. See: http://creativecommons.org/ licenses/by/4.0/
history, physical examination, laboratory tests, and screening instruments. Acad Emerg Med. 2024;31(10):1014–1036. 9. Han JH, Zimmerman EE, Cutler N, et al. (2009). Delirium in older emergency department patients: recognition, risk factors, and psychomotor subtypes. Acad Emerg Med. 2009;16(3):193–200. 10. Al Huraizi AR, Al-Maqbali JS, Al Farsi RS, et al. Delirium and its
REFERENCES
association with short- and long-term health outcomes in medically
1. Elder N, Tyler K, Mumma B, et al. Emergency department length of
admitted patients: a prospective study. J Clin Med. 2023;12(16):5346.
stay is associated with delirium in older adults. West J Emerg Med.
11. Ormseth CH, LaHue SC, Oldham MA, et al. Predisposing and
2023;24(3):532-537.
precipitating factors associated with delirium: a systematic review.
2. Roussel M, Teissandier D, Yordanov Y, et al. Overnight stay in the
JAMA Netw Open. 2023;6(1):e2249950.
emergency department and mortality in older patients. JAMA Intern
12. Hsuan C, Segel JE, Hsia RY, et al. Association of emergency
Med. 2023;183(12):1378–1385.
department crowding with inpatient outcomes. Health Serv Res.
3. Joseph JW, Elhadad N, Mattison MLP, et al. Boarding duration in the emergency department and inpatient delirium and severe agitation.
2023;58(4):828–843. 13. Nessen SJ, Friedman AB, Bhananker AR, et al. Waiting room and
JAMA Netw Open. 2024;7(6):e2416343.
hallway care for older adults: a qualitative study with emergency
4. Perelman SE, Meeker MA, Kennedy M, et al. Emergency department hallways are associated with incident delirium and
nurses and technicians. BMC Geriatr. 2025;25(1):970. 14. Sinvani L, Kozikowski A, Patel V, et al. Measuring functional status in
severe agitation in older adults living with dementia. J Am Geriatr
hospitalized older adults through electronic health record
Soc. 2026;74(3):748-759.
documentation. South Med J. 2018;111(4):220–225.
5. Von Elm E, Altman DG, Egger M, et al. The Strengthening the
15. Moore G, Hartley P, Romero-Ortuno R. Health and social factors
Reporting of Observational Studies in Epidemiology (STROBE)
associated with a delayed discharge amongst inpatients in acute
statement: Guidelines for reporting observational studies. J Clin
geriatric wards: a retrospective observational study. Geriatr Gerontol
Epidemiol. 2008;61(4):344–349. 6. American College of Surgeons. (n.d.). CMS Age-Friendly Hospital
Int. 2018;18(4):530–537. 16. van Loveren K, Singla A, Sinvani L, et al. Increased emergency
Measure. Available at: https://www.facs.org/quality-programs/
department hallway length of stay is associated with development of
accreditation-and-verification/geriatric-surgery-verification/cms-agefriendly-hospital-measure/. AccessedJanuary 12, 2025.
delirium. West J Emerg Med. 2021;22(3):726–735. 17. Hwang U, Sifnugel N, Cohen I, et al. The Geriatric Emergency Care
7. Kim DA, Sanchez LD, Chiu D, et al. Social determinants of hallway
Applied Research Standardization Study (GEARSS): an
bed use. West J Emerg Med. 2020;21(4):949–958.
observational study of older emergency department patients. Acad
8. Carpenter CR, Lee S, Kennedy M, et al. Delirium detection in the
Volume 27, No. 6: November 2026
Emerg Med. 2026;33(1):e70101.
1757
Western Journal of Emergency Medicine
Brief Research Report
Dedicated Vertical Physician Pilot in a Rotational Patient Assignment Emergency Department Nicole R. Hodgson, MD Jessica Monas, MD Aaron Levy, MSN Chrissie VanLandschoot, BSN Mark Dollar, MS Benjamin Phelps, MBA Andrej Urumov, MD
Mayo Clinic Arizona, Department of Emergency Medicine, Phoenix, Arizona
Section Editor: Bánk Gábor Fenyves, MD, PhD Submission history: Submitted April 22, 2026; Revision received July 30, 2026; Accepted August 3, 2026 Electronically published November 1, 2026 Full text available through open access at http://escholarship.org/uc/uciem_westjem DOI 10.5811/westjem.64648
Introduction: Emergency department (ED) vertical patient pathways (VPP) assign patients to a dedicated care area with chairs, avoiding the use of traditional ED beds. The effect of reassigning a dedicated vertical emergency physician (EP) onto an established rotational patient assignment (RPA) system, which prospectively assigns arriving patients to EP queues, is unknown. We sought to describe operational outcomes and staff satisfaction with trialing this role. Methods: We conducted a single-center, hypothesis-generating exploratory pilot at a 56-bed tertiary-care ED in which one 8.75-hour EP shift on five Mondays was repurposed into an 8.75hour dedicated VPP role within a chair-based vertical patient care area while the rotational patient assignment system remained in place; three prior comparable Mondays served as comparison. Primary outcome was discharged-patient ED length of stay (LOS); secondary outcomes included VPP upgrades to a bed, patient numbers seen by the dedicated shift, and staff satisfaction. We report descriptive analyses. Results: We analyzed 529 discharged-patient encounters: 199 (37.6%) during the preintervention period and 330 (62.4%) during the postintervention period. Median ED LOS for discharged patients did not demonstrate a consistent directional change, decreasing by seven minutes (3.1%) in the overall ED (226 vs 219 minutes) and increasing by 18.5 minutes (13.0%) among patients initially evaluated via the VPP (142.5 vs 161 minutes). The dedicated VPP EP saw three more patients per shift (21.4%; median 17 vs 14), and VPP upgrades fell from 15/68 (22.1%) to 5/130 (3.8%). Timeliness and communication were rated favorably by 4/4 VPP physician respondents and 10/12 and 16/17 registered nurse/allied health respondents, respectively; 3/4 VPP physician respondents vs 1/29 non-VPP physician respondents supported continuing the model. Conclusion: Reassigning an existing EP to a dedicated vertical EP role within an ongoing rotational patient assignment system was not accompanied by shortened discharged-patient length of stay. Fewer VPP upgrades and a modest increase in patients seen by the dedicated shift were observed, but patient selection and acuity limit interpretation. Staff reported favorable teamwork within the vertical space, whereas non-VPP physicians reported less manageable workloads and little support for continuing the model. [West J Emerg Med. 2026;27(6)1758–1762.]
INTRODUCTION Vertical patient pathways (VPP) stream lower-acuity, ambulatory emergency department (ED) patients into Western Journal of Emergency Medicine
nontraditional chair-based spaces, reserving traditional beds; prior reviews report favorable throughput effects.1-3 To our knowledge, no published study has evaluated a dedicated vertical emergency 1758
Volume 27, No. 6: November 2026
Hodgson et al.
Dedicated Vertical Physician Pilot in a Rotational Patient Assignment ED
physician (EP) within an established rotational patient assignment (RPA) system. The RPA system prospectively assigns arriving patients to EP queues, making responsibility explicit from patient arrival and distributing workload prospectively.4,5 A dedicated vertical EP might accelerate care for ambulatory patients and preserve monitored beds, but removing lower-acuity cases from the general queue could redistribute workload or create handoffs when patients require a main ED bed. In this hypothesis-generating pilot, we introduced a dedicated vertical EP while RPA otherwise remained in place and described discharged-patient length of stay (LOS), vertical upgrades, shift volume, and staff satisfaction. METHODS The study ED is a 56-bed tertiary care center serving approximately 60,000 patients yearly. A computerized RPA system assigns patients to an EP upon arrival and stops assignments either two hours before shift end or after 17 patients, whichever comes first.5 Previous work at our facility helped define a VPP for patients who may be cared for without a traditional ED bed.6 Triage registered nurses (RNs) slate ambulatory patients with Emergency Severity Index (ESI) scores of 4, 5, or ESI 3 skin and ocular complaints for VPP, while collaborating with assigned EPs to route other appropriate patients. The VPP assessment area adjoins the main ED and contains five curtained reclining chair bays and a charting area. Vertical RNs alert the assigned EP to a VPP patient awaiting assessment. On five Mondays from February 2 to March 2, 2026, one EP shift that normally received assigned patients from 7:45 am to 2:30 pm was repurposed as a dedicated VPP-physician shift. This physician sat in the vertical area and attempted to safely manage as many vertical patients as possible. Automatically eligible patients included ESI 4-5 and ESI 3 skin or ocular complaints, with additional patients chosen at physician discretion. The VPP EP stopped receiving patients at 2:30 pm but could choose to take additional patients until 4:30 pm. No additional RN or technician staffing or preferential resource access was added during the pilot. Our ED uses no physician assistants or nurse practitioners, nor does it staff a triage EP. Rotating residents work one-to-one with EPs and see approximately 15% of encounters; residents perform VPP assessments concurrently with attendings for efficiency. The dedicated VPP EP was not assigned a learner. Three Mondays in January 2026 (January 12, 19, and 26) were selected as comparison dates due to similar physician staffing and study hour census. Analyses excluded admitted patients to limit confounding from inpatient capacity constraints. Primary outcome was discharged-patient ED length of stay (LOS) for arrivals from 7:45 am to 2:30 pm, calculated from electronic health record (EHR) arrival and discharge timestamps. Secondary outcomes included VPP upgrades, numbers of patients evaluated by the dedicated shift, and staff survey responses. Encounter assignment and upgrade data were obtained from the Volume 27, No. 6: November 2026
Population Health Research Capsule What do we already know about this issue? Vertical pathways can improve emergency department (ED) flow, but assigning a dedicated physician within a rotational patient assignment model has not been evaluated. What was the research question? What were the operational outcomes and staff perceptions during a dedicated vertical physician pilot? What was the major finding of the study? Discharged-patient length of stay decreased 3.1% (226 vs. 219 minutes) in the overall ED and increased 13.0% (142.5 minutes without vs. 161 with a dedicated physician) among vertical patients. How does this improve population health? These findings help ED leaders design department flow that preserves timely access while anticipating workload tradeoffs.
EHR. We summarized encounter characteristics descriptively with medians (interquartile ranges), means (standard deviations [SD]), and proportions. The pilot schedule determined study size, and no formal sample size calculation was performed. As a hypothesis-generating pilot, we did not perform hypothesis testing or calculate confidence intervals. We requested anonymous feedback from EPs working on trial Mondays and the following Tuesday, which retained the same staffing but moved the VPP physician back into RPA. Each of the five trial Mondays was staffed by a different VPP physician, and all five VPP physicians submitted a survey. Nursing leadership conducted a similar survey for RNs and allied staff who played a role in the VPP workflow during trial Mondays (VPP-assigned, triage and navigator RNs, VPPassigned technicians, and health unit coordinators). Appendix 1 contains survey language. We queried staff regarding workload manageability, timeliness, communication, and support for continuing the VPP physician role. We asked physicians whether transitions of care felt safe and RNs and allied staff whether VPP inclusion criteria were clear. All surveys included an openended response option. Survey results were summarized using item-level denominators, with incomplete responses excluded. The Mayo Clinic Institutional Review Board provided an
1759
Western Journal of Emergency Medicine
Dedicated Vertical Physician Pilot in a Rotational Patient Assignment ED exemption from full review. We received no external funding. We report the work in accordance with Standards for Quality Improvement Reporting Excellence (SQUIRE) 2.0 guidance.
Hodgson et al.
communication with a single dedicated physician, perceived reductions in delays, and stronger teamwork within VPP.
RESULTS Table 1 summarizes encounter characteristics and operational results. Table 2 summarizes survey responses. Per-day ED arrivals during trial hours were nearly identical between periods (baseline 101.7/day vs trial 101.6/day). During the baseline period, 22.3% of ED arrivals were initially roomed vertically, compared with 25.6% during the trial. On baseline days, the comparison physician shift evaluated a median of 14 patients daily (range 14–16). On trial days, the VPP EP initially evaluated a median of 17 patients daily (range 13–22). Among patients initially evaluated vertically, trial patients were younger (median 64.5 vs 73 years) and less often required transfer to the main ED (“VPP upgrades”; 5/130 [3.8%] vs 15/68 [22.1%]). During the trial, each upgrade required transition of care from the VPP physician to another main EP. During the baseline period, the initial EP retained care. Across open-ended EP comments, recurring themes included friction related to patient selection and the RPA workflow (disruption when charts were reviewed by a main ED EP before VPP reassignment and concerns about inequitable distribution of higher-acuity patients), as well as VPP area workspace and privacy limitations. The non-VPP EPs emphasized perceived loss of lower-acuity patients and downstream effects on workload complexity and timing of patient assignments, while VPP EPs described challenges of remaining physically embedded in the vertical space while managing sporadic inflow and care transitions. In contrast, RN and allied staff comments highlighted improved
DISCUSSION In this limited, hypothesis-generating pilot, repurposing one physician shift into a dedicated VPP role within an otherwise unchanged RPA system was not accompanied by a consistent directional change in discharged-patient LOS. The dedicated VPP physician evaluated slightly more patients, and fewer patients required upgrades. Because acuity-adjusted workload, resource use, and disposition complexity were not measured, the difference between 17 and 14 patients should not be interpreted as an efficiency gain. The observed pattern may reflect differences in verticalpatient selection more than changes in department-level throughput. The lower upgrade rate and younger age of VPP patients may reflect more selective triage. Prior ED work suggests clinician choice may favor simpler presentations.7 Under the usual workflow, physicians retain ownership if a vertical patient needs a bed; during the pilot, an unsuccessful vertical trial required a handoff, possibly discouraging borderline selection. The RPA system provides prospective ownership, while the pilot added a physician-to-physician transfer for each upgrade.5 Handoffs may contain omissions or discrepancies; this may have affected physician behavior or acceptance.8-10 Day-to-day case mix, physician variation, or colocation allowing continued chair observation could also contribute. Because the data did not distinguish automatic from discretionary selection, we cannot determine the explanation. Staff perceptions diverged sharply, with support for role continuation at 3/4 among VPP physician respondents and 1/29 among non-VPP physicians; however, the small, asymmetric denominators preclude true statistical comparison.
Table 1. Descriptive encounter and operational characteristics for discharged patients before and during a pilot of a dedicated vertical physician in an emergency department with rotational patient assignment. All ED Preintervention (N = 199)
All ED Postintervention (N = 330)
Vertical Preintervention (n = 58)
Vertical Postintervention (n = 117)
55%
51%
56%
46%
66 (48-78)
66 (49.25-77)
73 (55.5-80)
64.5 (44-76)
Race White (%)
92%
89%
91%
89%
ESI mean (SD)
3.03 (0.61)
3.10 (0.61)
3.5 (0.56)
3.59 (0.52)
ED median length of stay minutes (IQR)
226 (161.5-295.5)
219 (159-294)
142.5 (100-255)
161 (106-221)
Characteristic Sex female (%) Age median years (IQR)
ED, emergency department; ESI, Emergency Severity Index; IQR, interquartile range; SD, standard deviation. Table 1 is restricted to discharged patients; upgrade denominators include all patients initially evaluated in the vertical patient pathway.
Western Journal of Emergency Medicine
1760
Volume 27, No. 6: November 2026
Dedicated Vertical Physician Pilot in a Rotational Patient Assignment ED
Hodgson et al.
Table 2. Survey results (favorable responses on five-point Likert items) in a pilot of a dedicated vertical physician in an emergency department with rotational patient assignment. VPP physicians (trial days)
Non-VPP physicians (trial days)
Usual schedule physicians (typical days)
RNs and Allied Health (trial days)
Survey submissions, N
5
29
18
17
Perceived manageability of patient load
Survey item
2/4 (50%)
9/29 (31%)
15/18 (83%)
15/15 (100%)
Timeliness (able to see patients in a timely fashion) 4/4 (100%)
10/29 (34%)
11/18 (61%)
10/12 (83%)
Communication and coordination (able to contact RNs or able to effectively communicate with assigned physician)
4/4 (100%)
21/27 (78%)
17/18 (94%)
16/17 (94%)
Transitions of care felt safe
1/2 (50%)
3/6 (50%)
11/13 (85%)
—
Support continuing dedicated vertical physician role
3/4 (75%)
1/29 (3%)
1/15 (7%)
13/17 (76%)
(RNs and allied health) Clear understanding of — — — 14/14 (100%) which patients should be in the vertical space Values shown are favorable responses, n/N (%), based on item-level responses (missing responses excluded); denominators differ from total survey submissions because respondents could skip items. Likert scale: 1 = Strongly disagree to 5 = Strongly agree. “—” indicates item not applicable. Favorable responses were defined as Agree/strongly agree, except for the workload item in physician surveys, which was inversely worded (favorable = disagree/strongly disagree). RN, registered nurse; VPP, vertical patient pathway.
stay. Fewer upgrades and slightly higher dedicated-shift volume were observed, but patient selection and acuity limit interpretation. Physicians assigned to the vertical pathway, RNs, and allied staff viewed teamwork favorably, whereas non-VPP physicians described less manageable workloads and rarely supported continuation. Emergency department leaders should balance local teamwork and communication against workload redistribution and handoff burden.
Physicians assigned to the vertical pathway, RNs, and allied staff reported favorable local teamwork, whereas non-VPP physicians reported less manageable workloads. Removing lower-acuity patients from the general pool may have left a more complex assignment mix. To our knowledge, this is the first report of a dedicated vertical EP within an established RPA system. The resourceneutral pilot cannot establish effectiveness, but it addresses a design question relevant to ED medical directors. Future studies should evaluate acuity-adjusted workload, resource use, and handoff burden. LIMITATIONS This single-center pilot included only eight morning study days, relatively low VPP volume, and five unique VPP physicians. Item-level missingness reduced some VPP physician denominators to two or four. Analyses were descriptive and limited to discharged patients arriving during study hours. We did not assess admission rate, door-to-disposition time for all ED patients, imaging, laboratory or consultation use, acuity-adjusted workload, or automatic versus discretionary selection. Individualphysician variation may have affected findings; results may not generalize to other time periods or EDs with different staffing, volumes, or assignment models. CONCLUSION In this pilot, adding a dedicated vertical EP to an existing rotational patient assignment system was not accompanied by a consistent directional change in discharged-patient length of
Volume 27, No. 6: November 2026
Address for Correspondence: Nicole R. Hodgson, MD, Mayo Clinic Arizona, Department of Emergency Medicine, 5777 E Mayo Blvd, Phoenix, AZ 85054. Email: hodgson.nicole@mayo.edu. Conflicts of Interest: By the WestJEM article submission agreement, all authors are required to disclose all affiliations, funding sources and financial or management relationships that could be perceived as potential sources of bias. No author has professional or financial relationships with any companies that are relevant to this study. There are no conflicts of interest or sources of funding to declare. Copyright: © 2026 Hodgson et al. This is an open access article distributed in accordance with the terms of the Creative Commons Attribution (CC BY 4.0) License. See: http://creativecommons.org/ licenses/by/4.0/
REFERENCES
1761
1. Grant KL, Bayley CJ, Premji Z, et al. Throughput interventions to reduce emergency department crowding: a systematic review. CJEM.
Western Journal of Emergency Medicine
Dedicated Vertical Physician Pilot in a Rotational Patient Assignment ED
Hodgson et al.
assisted emergency department vertical patient flow optimization. J
2020;22(6):864-874.
Pers Med. 2025;15(6):219.
2. Youssef E, Benabbas R, Choe B, et al. Interventions to improve
7. Patterson BW, Batt RJ, Wilbanks MD, et al. Cherry picking patients:
emergency department throughput and care delivery indicators: a
examining the interval between patient rooming and resident
systematic review and meta-analysis. Acad Emerg Med.
self-assignment. Acad Emerg Med. 2016;23(6):679-684.
2024;31(8):789-804.
8. Cheung DS, Kelly JJ, Beach C, et al. Improving handoffs in the
3. Lowie BJ, Hicks C, Falat C, et al. Overcoming stagnant flow: a
emergency department. Ann Emerg Med. 2010;55(2):171-180.
scoping review of vertical movement in the emergency department.
9. Maughan BC, Lei L, Cydulka RK. ED handoffs: observed practices
Acad Emerg Med. 2024;31(3):256-262.
and communication errors. Am J Emerg Med. 2011;29(5):502-511.
4. Hodgson NR, Traub SJ. Patient assignment models in the emergency department. Emerg Med Clin North Am. 2020;38(3):607-615.
10. Kachalia A, Gandhi TK, Puopolo AL, et al. Missed and delayed
5. Traub SJ, Stewart CF, Didehban R, et al. Emergency department
diagnoses in the emergency department: a study of closed malpractice claims from 4 liability insurers. Ann Emerg Med.
rotational patient assignment. Ann Emerg Med. 2016;67(2):206-215.
2007;49(2):196-205.
6. Hodgson NR, Saghafian S, Martini WA, et al. Artificial intelligence-
Western Journal of Emergency Medicine
1762
Volume 27, No. 6: November 2026
Narrative Review
Emergency Medicine Reimagined: Development of the Patient Rights Index for Emergency Medicine Matthew Ryan, MD, PhD
University of Florida, College of Medicine, Department of Emergency Medicine, Gainesville, Florida
Section Editor: Nour Barmo, MD Submission history: Submitted February 7, 2026; Revision received August 1, 2026; Accepted August 3, 2026 Electronically published October 14, 2026 Full text available through open access at http://escholarship.org/uc/uciem_westjem DOI 10.5811/westjem.62375
Introduction: Emergency medicine has evolved beyond episodic acute care to encompass a growing range of clinical, social, and system-level responsibilities. This scholarly perspective proposes the Patient Rights Index in Emergency Medicine (PRI-ED), a conceptual framework designed to organize recurring domains through which emergency departments promote access to care, patient safety, relief of suffering, autonomy, and dignity. Methods: The PRI-ED was developed through iterative domain generation informed by clinical observation, professional experience, and targeted review of peer-reviewed literature, policy analyses, and professional organizational reports. No primary data collection, systematic review, formal consensus process, or empirical validation was performed. Results: We identified 12 domains that represent recurring clinical, operational, and systemlevel challenges encountered in emergency medicine. These domains were organized within a standardized framework linking domain-specific objectives, intervention strategies, measurable indicators, and relevant policy or funding mechanisms. Conclusion: The PRI-ED is a proposed conceptual framework for organizing and evaluating domains in which emergency medicine intersects with access, safety, autonomy, relief of suffering, and dignity. The framework is intended to inform future implementation, evaluation, and policy discussion and requires feasibility testing and outcome validation before effectiveness can be determined. [West J Emerg Med. 2026;27(6)1763–1776.]
INTRODUCTION Emergency medicine (EM) has evolved beyond its traditional role as a specialty of episodic acute care. Since its formal recognition as a discipline defined by immediacy, stabilization, and universal access, emergency departments (ED) have become a major point of entry into the healthcare system for patients experiencing acute illness, psychiatric crises, substance use disorders, homelessness, barriers to healthcare access, and end-of-life needs. More than 155 million visits occur annually in United States EDs, reflecting a role that extends beyond acute medical stabilization.1-4 The Emergency Medical Treatment and Labor Act (EMTALA) has played a central role in this evolution by establishing a critical safety net within the US healthcare Volume 27, No. 6: November 2026
system. However, while EMTALA ensures access to emergency care, it does not address healthcare fragmentation, underinsurance, continuity gaps, administrative barriers, and persistent inequities in access to comprehensive care.5-11 Thus, EDs function at the intersection of acute illness, social vulnerability, and healthcare access.12 This reality presents both challenges and opportunities for the specialty. Emergency physicians remain resuscitationists, dedicated to rapid diagnosis, stabilization, and lifesaving interventions, while also serving as essentialists who respond to the consequences of fragmented healthcare systems and unmet social, behavioral, and public health needs. In this capacity, EM routinely encounters issues of access, safety, autonomy, relief of suffering, and dignity. Within this
1763
Western Journal of Emergency Medicine
Development of the Patient Rights Index for EM
Ryan
framework, dignity refers to preserving patient autonomy while ensuring respectful, safe, equitable, and compassionate care. Although many of these challenges have been studied individually, including psychiatric boarding, homelessness, violence, palliative care, patient safety, healthcare access, and EMTALA reform, they are often examined within their respective clinical, operational, or policy domains.13 To our knowledge, no prior framework has attempted to organize these interconnected responsibilities within a unified model for EM. This scholarly perspective proposes the Patient Rights Index in Emergency Medicine (PRI-ED), a conceptual framework that identifies and organizes twelve recurring clinical, operational, and system-level domains through which EDs promote access to care, patient safety, autonomy, relief of suffering, and dignity. By linking these domains to operational strategies, measurement indicators, and policy mechanisms, the PRI-ED is intended to inform future implementation, evaluation, advocacy, and systems-level improvement efforts within EM. The framework is intended to illustrate measurable areas for evaluation and intervention rather than provide an exhaustive inventory of challenges facing the specialty. The domains are summarized in Table 1. The framework is intended to identify measurable objectives and inform future implementation, evaluation, and policy discussion. Although grounded in the US healthcare system and EMTALA framework, many underlying concepts may have broader relevance to emergency care systems internationally. METHODS Framework Development This paper presents a scholarly perspective proposing the PRI-ED, a conceptual framework organizing recurring domains
in which EM intersects with patient access, safety, autonomy, relief of suffering, and dignity. The framework was developed through targeted review of peer-reviewed literature, policy analyses, and organizational reports, supplemented by iterative refinement informed by clinical experience and observation. No primary data collection, systematic review, formal consensus process, or empirical validation was performed. Domain Identification and Selection Initial domains were generated from recurring clinical, operational, and systems-level challenges encountered in contemporary EM practice and refined through review of EM, health policy, public health, patient safety, behavioral health, palliative care, and social EM literature. We included domains if they substantially influenced patient access, safety, autonomy, relief of suffering, or dignity and were potentially amenable to operational, educational, policy, funding, or quality-improvement interventions. Domains with substantial conceptual overlap were consolidated to improve clarity and usability. The final framework consists of 12 domains. Framework Construction For each domain, we developed a standardized PRI-ED table consisting of an objective, scope, intervention strategies, measurable indicators, and relevant policy or funding mechanisms. These elements were selected to connect conceptual priorities with practical implementation and future evaluation. Methodological Considerations The PRI-ED is intended as a conceptual framework rather than an empirical model and should be viewed as hypothesis-
Table 1. The twelve domains of the Patient Rights Index in Emergency Medicine framework. Domain No.
Focus Area
Central Theme
1
Psychiatric Emergency Care
Improving access, safety, and continuity for patients with behavioral health needs
2
End-of-Life and Palliative Care
Aligning emergency care with patient goals and preferences
3
Sexual Assault Management
Ensuring timely access to trauma-informed forensic services
4
Follow-Up and Continuity
Strengthening care transitions and postdischarge follow-up
5
Homelessness and Multi-visit Patients
Addressing social determinants that contribute to recurrent emergency care use
6
Social Work and Case Management
Integrating social and care coordination resources into emergency care
7
Global Health Applied Locally
Applying health equity and population health principles in local practice
8
Sustaining Emergency Access
Adapting emergency access policies to contemporary healthcare systems
9
Workplace Safety and Violence Prevention
Promoting a safe environment for patients, families, and healthcare workers
10
Balanced Performance Measurement
Broadening performance assessment beyond operational metrics
11
Ethical Use of AI and Technology
Supporting responsible and equitable implementation of emerging technologies
12 Professional Identity and Values Alignment AI, artificial intelligence.
Western Journal of Emergency Medicine
Aligning professional values with organizational priorities
1764
Volume 27, No. 6: November 2026
Development of the Patient Rights Index for EM
Ryan generating. Domain selection reflects the author’s synthesis of recurring challenges in EM informed by clinical experience and targeted literature review and is not intended to represent an exhaustive inventory of issues facing the specialty. The literature review informing framework development was targeted rather than systematic and was primarily grounded in the US healthcare system and EMTALA environment. RESULTS The final PRI-ED framework consists of 12 domains affecting ED practice (Table 1). Each domain is organized into a standardized PRI-ED table containing five elements: objective, scope, intervention strategies, measurement indicators, and funding/policy mechanisms (Tables 2–13). Collectively, these 12 PRI-ED tables provide a common structure for translating conceptual priorities into measurable implementation strategies. DISCUSSION The following sections describe the 12 PRI-ED domains and their associated tables. The accompanying PRI-ED tables illustrate how these concepts may be translated into measurable objectives, intervention strategies, and potential policy or funding mechanisms within EM practice. Psychiatric Emergency Care Emergency departments have increasingly become the de facto entry point for patients in psychiatric crisis.14 Nationwide, there are only 28.4 inpatient psychiatric beds per 100,000 people—far below the benchmark of 60 per 100,000.15 Mental health-related ED visits among youth increased 56% between 2011 and 2020, and nearly one in five US adults lives with a mental health condition.16,17 Psychiatric emergencies now represent a substantial share of ED care. Funding remains fragmented. Medicaid is the largest payor, and parity enforcement remains inconsistent.18 Together with limited inpatient capacity and shortages of community behavioral health resources, these factors contribute to prolonged psychiatric boarding, with patients awaiting placement or discharged without sustainable follow-up.19 The ED can respond by embedding crisis stabilization units,14 redesigning behavioral health-safe rooms, and expanding telepsychiatry, particularly in under-resourced settings. Integration of psychiatry, social work, and peer navigators enables warm handoffs, while staff training in trauma-informed care and de-escalation supports dignity and safety. At the policy level, expansion of crisis infrastructure (including the 988 Suicide & Crisis Lifeline) and efforts to improve parity implementation may help strengthen access to behavioral health services.18 Yet hallway placement, restraints, and lack of privacy continue to compound delays and may hinder patient-centered recovery efforts.19 Table 2 outlines operational strategies to reduce psychiatric emergency care. Volume 27, No. 6: November 2026
End-of-Life and Palliative Care in the Emergency Department Emergency departments are seeing more patients with serious, life-limiting illnesses. Traditionally focused on acute stabilization, the specialty is often asked to initiate valuesbased care.10,20 Over 80% of US hospitals with 50 or more beds report some form of palliative program, yet access remains limited in for-profit and rural settings, contributing to disparities in access.21 Even where services exist, ED integration is inconsistent; patients may be discharged without goals-of-care discussions, symptom management, or connection to specialty teams.22 Workforce shortages and limited training compound these gaps.23,24 Emergency departments can respond by embedding palliative screening tools at triage, implementing comfortfocused protocols for pain, dyspnea, and agitation, and establishing automatic triggers for specialty consultation when appropriate. Education remains central. Palliative care skills are increasingly recognized as important competencies for emergency physicians, yet standardized national requirements are uneven. Many programs now incorporate structured training through initiatives such as Education in Palliative and End-ofLife Care for Emergency Medicine or dedicated rotations, emphasizing primary-level communication and symptom management skills sustained through continuing education. Federal efforts such as the Palliative Care and Hospice Education and Training Act, along with reimbursement parity, could strengthen workforce capacity and support ED-based implementation.24 Timely goals-of-care conversations may help align treatment with patient preferences and reduce unwanted interventions at the end of life.22 Table 3 outlines a framework for translating these principles into measurable practice. Sexual Assault Response Sexual assault is prevalent and carries lasting consequences. In the ED, the response extends beyond treating injuries and collecting evidence to provide safety, dignity, and support. Women bear the overwhelming burden of sexual violence, while male and nonbinary survivors may face stigma that further impedes disclosure and access to care.25 Yet many EDs cannot guarantee timely access to Sexual Assault Nurse Examiners (SANE) or trained forensic clinicians.25 The result is variability in survivor-centered care and missed opportunities for timely medical, forensic, and advocacy services. There is no universally standardized approach to integrating sexual assault care into EM training, and many residency programs rely on SANE services or local resources for education.26 Consequently, physicians may be variably prepared to address survivors’ medical, emotional, and legal needs.27 These gaps extend to other forms of interpersonal violence, including domestic violence, elder abuse, and child abuse, where the ED may represent the only point of contact with the healthcare system. Timely recognition, traumainformed care, and clear pathways to protection and advocacy
1765
Western Journal of Emergency Medicine
Development of the Patient Rights Index for EM
Ryan
Table 2. Patient Rights Index in Emergency Medicine (PRI-ED) domain: psychiatric emergency care. The PRI-ED domain within a conceptual framework proposing operational strategies, measurement elements, and policy mechanisms to address psychiatric emergency care and boarding within emergency departments in a scholarly perspective describing the PRI-ED framework for emergency medicine. Component
Description
Objective
Improve timeliness, safety, and dignity of care for patients presenting with acute psychiatric or behavioral health crises.
Scope
ED patients presenting with psychiatric or behavioral emergencies requiring stabilization, inpatient admission, crisis services, or structured community follow-up.
Intervention Strategies
• Develop or partner with CSUs linked to EDs. • Design or retrofit behavioral-health–safe treatment spaces to reduce restraint use. • Expand access to real-time telepsychiatry consultation, particularly in rural or under-resourced settings. • Establish escalation pathways that notify hospital leadership when boarding thresholds are exceeded.
Measurement Elements
• Time from ED arrival to psychiatric placement or crisis disposition. • Total psychiatric boarding hours per admission. • Use of restraints or involuntary medication events. • Stratified data by race, ethnicity, payor, sex, and language to identify disparities.
Funding and Policy Mechanisms
• Medicaid Section 1115 waivers and demonstration projects. • SAMHSA crisis services block grants. • State behavioral-health parity enforcement initiatives. • Regional crisis-care integration funding streams. CSU, crisis stabilization unit; ED, emergency department; SAMHSA, Substance Abuse and Mental Health Services Administration.
remain essential. Hospitals can support timely access to expert care through onsite SANE staffing or regional referral networks. Traumainformed protocols addressing medical treatment, prophylaxis,
forensic evidence collection, and linkage to advocacy services may be integrated into ED workflows. Physician education, partnerships with advocacy organizations, and funding mechanisms such as Violence Against Women Act programs,
Table 3. Patient Rights Index in Emergency Medicine (PRI-ED) domain: end-of-life and palliative care. The PRI-ED domain within a conceptual framework proposing operational strategies, measurement elements, and policy mechanisms to integrate palliative and end-of-life care within emergency departments in a scholarly perspective describing the PRI-ED framework for emergency medicine. Component
Description
Objective
Improve alignment of emergency care with patient goals, reduce non-beneficial interventions, and enhance goal-concordant care and quality of life for patients with serious illness.
Scope
ED patients with advanced chronic illness, life-limiting conditions, serious frailty, or repeated highacuity presentations who may benefit from goals-of-care clarification or palliative consultation.
Intervention Strategies
• Implement standardized goals-of-care screening triggers in triage or admission workflows. • Develop rapid-access palliative consultation pathways (in-person or telehealth). • Embed code-status verification protocols within ED intake processes. • Provide clinician education on primary palliative communication skills.
Measurement Elements
• Proportion of eligible patients with documented goals-of-care discussion. • ED-initiated palliative consult rates. • ICU admissions among patients with documented limitations of life-sustaining treatment. • Successful linkage to palliative services following ED discharge.
Funding/Policy Mechanisms
• CMS reimbursement for advance-care planning discussions. • Value-based purchasing programs tied to serious-illness care metrics. • Institutional quality incentives for documentation of code status. • Accountable care organization shared-savings programs. CMS, Centers for Medicare & Medicaid Services; ED, emergency department; ICU, intensive care unit.
Western Journal of Emergency Medicine
1766
Volume 27, No. 6: November 2026
Development of the Patient Rights Index for EM
Ryan state victim compensation funds, and Health Resources and Services Administration (HRSA) rural health grants may help sustain these services.28 Table 4 illustrates how these commitments can be incorporated into everyday ED practice. Improved Follow-Up and Continuity of Care Most patients seen in the ED are treated and discharged, and for many this is their only contact with the healthcare system.29 Discharge instructions may be difficult to understand, referrals may be delayed, and barriers such as transportation limitations, inadequate insurance coverage, or unstable housing often remain unresolved.30 Patients with chronic illness, medical complexity, socioeconomic disadvantage, limited health literacy, or poor access to primary care are particularly vulnerable to fragmented transitions and recurrent ED utilization. These challenges reflect the tension between vertical care, which is episodic and crisis-focused, and horizontal care, which emphasizes continuity, prevention, and coordination across healthcare settings. Emergency medicine can help bridge this divide through strategies that strengthen continuity beyond the ED encounter. Direct handoffs to primary care, specialty services, or community-based resources can improve care coordination and reduce barriers to follow-up, particularly when supported by case management and social work services.31 Technologyenabled approaches may further support continuity through telehealth follow-up visits, automated reminders, and nurseled outreach programs that reinforce discharge instructions
and facilitate early recognition of clinical deterioration.32 In parallel, sustainable reimbursement models are needed to support these activities. Existing Centers for Medicare & Medicaid Services (CMS) programs, including Transitional Care Management and Chronic Care Management reimbursement pathways, may provide a foundation for adapting and supporting ED-initiated follow-up efforts. Table 5 outlines these concepts. In this model, “treat and release” becomes “treat and reconnect.” Homelessness and Multi-Visit Patients People experiencing homelessness visit the ED two to four times more often than the general population, and unsheltered individuals are nearly twice as likely as sheltered individuals to require ED care within a year.33 Many encounters are associated with untreated chronic illness, substance use disorders, psychiatric crises, and lack of stable housing. Once in the ED, this population is more likely to be admitted and up to eight times more likely to be readmitted within 30 days.33 Without housing, discharge instructions and prescriptions may have limited impact, contributing to recurrent utilization. Evidence suggests this cycle can be interrupted. Programs linking homeless patients to primary care, behavioral health, and case management have reduced ED visits by nearly 50% within a year.34 Housing First initiatives have reduced ED use in multiple cities while lowering Medicaid expenditures.35,36 Medical respite programs provide
Table 4. Patient Rights Index in Emergency Medicine (PRI-ED) domain: sexual assault response. The PRI-ED domain within a conceptual framework proposing operational strategies, measurement elements, and policy mechanisms to support survivor-centered sexual assault care within emergency departments in a scholarly perspective describing the PRI-ED framework for emergency medicine. Component
Description
Objective
Provide timely, trauma-informed medical and forensic care that prioritizes safety, consent, and dignity for survivors of sexual assault.
Scope
All patients presenting to the ED following sexual assault, regardless of sex, age, or identity.
Intervention Strategies
• Maintain 24/7 access to trained SANE or teleSANE services. • Embed trauma-informed documentation templates within the electronic health record. • Establish standardized referral pathways to advocacy and crisis-support services at initial clinical contact. • Provide clinician education in survivor-centered communication and medical-legal responsibilities. • Formalize partnerships with community advocacy and legal-response organizations.
Measurement Elements
• Proportion of shifts with SANE or teleSANE availability. • Time from ED arrival to forensic examination when indicated. • Percentage of survivors connected to advocacy services within 72 hours. • Patient-reported measures of perceived safety, respect, and informed consent during care.
Funding/Policy Mechanisms
• VAWA and OVC grants. • HRSA rural outreach and telehealth funding programs. • State and local crime victim compensation funds. ED, emergency department; HRSA, Health Resources and Services Administration; OVC, Office for Victims of Crime; SANE, Sexual Assault Nurse Examiner; VAWA, Violence Against Women Act.
Volume 27, No. 6: November 2026
1767
Western Journal of Emergency Medicine
Development of the Patient Rights Index for EM
Ryan
Table 5. Patient Rights Index in Emergency Medicine (PRI-ED) domain: follow-up and continuity of care. The PRI-ED domain within a conceptual framework proposing operational strategies, measurement elements, and policy mechanisms to strengthen post–emergency department continuity of care in a scholarly perspective describing the PRI-ED framework for emergency medicine. Component
Description
Objective
Improve safe transitions from ED care to outpatient, specialty, or community-based follow-up.
Scope
ED patients discharged with new diagnoses, medication changes, unresolved diagnostic uncertainty, or identified social risk factors requiring structured follow-up.
Intervention Strategies
• Implement real-time scheduling of primary or specialty follow-up prior to discharge. • Develop ED-based care navigation or transition coordinators. • Integrate automated follow-up communication (text, phone, portal). • Establish high-risk discharge lists for structured 48–72 hour callback review.
Measurement Elements
• Percentage of discharged patients with documented follow-up appointment scheduled. • 7- and 30-day ED revisit rates. • Successful contact rates for high-risk discharge callbacks. • Stratified revisit data by payer, race, ethnicity, and sex.
Funding/Policy Mechanisms
• TCM billing codes. • Value-based reimbursement programs tied to readmission or utilization metrics. • Medicaid managed-care care-coordination incentives. • Institutional shared-savings arrangements with outpatient partners. ED, emergency department; TCM, transitional care management.
safe recovery environments after discharge and are expanding through CMS demonstration projects. Emergency departments can contribute by embedding social workers, care coordinators, and community partners into care pathways. Dedicated teams for high utilizers may develop individualized care plans linking patients to sobering centers, detoxification programs, psychiatric stabilization facilities, or supportive housing.33,36 Street medicine teams and mobile crisis units extend these efforts beyond hospital walls. Multi-visit patients present a related challenge. Many cycle through the ED because of insurance lapses, benefits confusion, poor care coordination, or barriers to follow-up.36 Tele-insurance navigation and tele-social work may help connect patients with coverage specialists, housing referrals, medication assistance, and transportation resources, potentially reducing avoidable return visits.32 States are increasingly using Medicaid waivers to support tenancy assistance, case management, and housing-related services. California’s CalAIM and Project Homekey initiatives illustrate the impact of aligning health financing with housing solutions.36 In Central Florida, homelessness costs an estimated $31,000 per person annually, nearly triple the cost of permanent supportive housing.37 These findings underscore the close relationship between housing stability and health. Table 6 highlights strategies to interrupt recurrent ED use and strengthen connections to housing, behavioral health, and community-based services. Social Work and Case Management Many ED visits are influenced by unmet social needs such Western Journal of Emergency Medicine
as food insecurity, unstable employment, insurance gaps, unsafe housing, or exposure to violence.38,39 Rural and criticalaccess hospitals may lack dedicated social workers entirely, relying on nurses or physicians to assemble referrals that address social concerns. Without real-time case management, patients may leave with medical issues addressed but underlying crises unresolved, contributing to repeat visits and preventable deterioration.40-42 Emergency departments can strengthen care by embedding social workers and care navigators into clinical workflows and linking patients to community resources, either in person or through telehealth-enabled models that extend support to smaller or rural EDs.36,37 Early involvement of case managers improves throughput, facilitates safe discharges, and reduces unnecessary admissions.40 Social workers and community health workers can connect patients to insurance enrollment, transportation, medication assistance, housing support, and domestic violence resources, improving continuity beyond the ED.42 Table 7 outlines operational strategies, measurement elements, and potential policy mechanisms to expand social work and case management capacity, including CMS Innovation Models, HRSA integration grants, and state Medicaid waivers. Global Health Applied Locally Global health has long emphasized efficiency, equity, and resourcefulness in low-resource settings. These principles provide a useful framework for addressing inequities and resource constraints. Yet underserved communities in the US, both urban and rural, often face barriers to care that resemble
1768
Volume 27, No. 6: November 2026
Development of the Patient Rights Index for EM
Ryan
Table 6. Patient Rights Index in Emergency Medicine (PRI-ED) domain: homelessness and multi-visit patients. The PRI-ED domain within a conceptual framework proposing operational strategies and measurable approaches to improve stabilization, housing linkage, and continuity for patients experiencing homelessness in a scholarly perspective describing the PRI-ED framework for emergency medicine. Component
Description
Objective
Strengthen ED-to-housing pathways to reduce recurrent utilization and improve stability.
Scope
Patients with chronic homelessness, unstable housing, or frequent ED use without established primary or behavioral health care.
Intervention Strategies
• Integrate social work and case management early in the ED visit. • Develop individualized stabilization and discharge plans. • Establish referral pathways to medical respite, temporary shelter, and Housing First programs. • Coordinate with supportive housing, behavioral health, and community outreach teams. • Assist with identification, benefits enrollment, and transportation access.
Measurement Elements
• Reduction in repeat ED visits among enrolled patients. • Rates of successful housing or primary care linkage. • Trends in ED and hospital utilization among frequent users.
Funding/Policy Mechanisms
• Medicaid 1115 waiver programs. • CMS innovation or value-based care demonstrations. • State or local housing-health initiatives. • Philanthropic or community development grants. CMS, Centers for Medicare & Medicaid Services; ED, emergency department.
challenges encountered in resource-limited settings.43 Emergency medicine can adapt lessons from global health to local practice. Low-cost innovations, task-shifting, rapid triage models, and community outreach have proven effective abroad and can be reimagined here.44,45 Partnerships with local clinics, shelters, schools, and faith-based organizations
can mirror the networks built in global health. Training emergency physicians in both global and community health may facilitate adaptation of successful strategies across diverse practice settings.46 Mobile outreach programs, often staffed by residents, students, and emergency physicians, already demonstrate
Table 7. Patient Rights Index in Emergency Medicine (PRI-ED) domain: social work and case management. The PRI-ED domain within a conceptual framework proposing operational strategies, measurement elements, and policy mechanisms to strengthen social and care coordination services within emergency departments in a scholarly perspective describing the PRI-ED framework for emergency medicine. Component
Description
Objective
Improve structured linkage to social services and community resources at the time of ED discharge.
Scope
ED encounters involving identified housing instability, safety concerns, transportation barriers, medication access challenges, or behavioral health needs.
Intervention Strategies
• Ensure real-time access to social work services (in-person or tele-social work). • Integrate community health workers or care navigators into ED discharge workflows. • Develop standardized referral pathways to shelters, food programs, transportation, and FQHCs. • Implement brief multidisciplinary discharge huddles for complex cases.
Measurement Elements
• Percentage of eligible encounters with documented social work involvement. • ED revisit rates among high social-risk patients. • Documented successful referral completion within 7–14 days.
Funding/Policy Mechanisms
• CMS care coordination reimbursement pathways. • HRSA community health integration grants. • SAMHSA behavioral health block grants. • Medicaid managed-care coordination incentives.
CMS, Centers for Medicare & Medicaid Services; ED, emergency department; FQHC, federally qualified health center; HRSA, Health Resources and Services Administration; SAMHSA, Substance Abuse and Mental Health Services Administration.
Volume 27, No. 6: November 2026
1769
Western Journal of Emergency Medicine
Development of the Patient Rights Index for EM
Ryan
what is possible. In some communities, these programs have expanded access to preventive services, health screening, vaccination efforts, and injury-prevention initiatives.46 Federal and state funding streams (HRSA, Centers for Disease Control and Prevention, Substance Abuse and Mental Health Services Administration, Medicaid waivers) may help sustain these efforts.47 Global health is not only a mission abroad but also a framework for improving care within our own communities. Table 8 highlights strategies to translate global health principles into local EM practice. Sustaining Emergency Access Access to emergency care is a defining responsibility of EM and a critical component of the healthcare safety net.11 Since 1986, EMTALA has mandated emergency care regardless of ability to pay. As an unfunded mandate, EMTALA has contributed to substantial uncompensated care, creating ongoing financial challenges for hospitals and health systems.48 Rural hospitals have closed under these pressures, while others remain bound by EMTALA yet lack meaningful access for patients.49 Interpretation and application of EMTALA requirements may vary across institutions, contributing to challenges such as psychiatric boarding, specialty coverage shortages, and crowding.49 In reproductive emergencies, clinicians may also face conflicts between EMTALA’s federal stabilization requirements and state abortion laws when maternal health is threatened.50 Although EMTALA is part of the EM core curriculum, understanding of the law varies widely. Emergency physicians are generally more familiar with the provisions, but specialists and trainees may lack clarity regarding responsibilities and
liabilities, leaving clinicians vulnerable to error and patients vulnerable to delay.48 Emergency medicine can reaffirm EMTALA as a cornerstone of emergency access. Modernization efforts may include financial support for uncompensated care, updated guidance addressing psychiatric boarding and specialty access, and educational initiatives that promote consistent understanding and application of the law. Greater regulatory clarity may also help define EMTALA obligations when emergency stabilization requirements intersect with other state or federal policies affecting patient care. Table 9 outlines operational strategies and policy mechanisms that may strengthen implementation of EMTALA’s core accessto-care principles. Workplace Safety and Violence Prevention Workplace violence remains a significant and growing concern in EM.50 Nearly half of emergency physicians report having been physically assaulted at work, and more than 70% of emergency nurses experienced verbal or physical abuse in the prior year.51,52 Healthcare workers are five times more likely to experience workplace violence than workers in other industries, with EDs representing one of the highestrisk settings.53 The consequences extend beyond staff wellbeing and may affect the care environment. Psychiatric boarding, crowding, prolonged lengths of stay, and resource constraints can contribute to tension among patients, families, and staff. In addition, variability in security resources, de-escalation training, incident reporting, and postevent support may limit institutional efforts to address workplace violence effectively.52,53 Safety may be viewed as a core quality measure within
Table 8. Patient Rights Index in Emergency Medicine (PRI-ED) domain: global health applied locally. The PRI-ED domain within a conceptual framework proposing operational strategies and measurable approaches to strengthen local community partnerships and outreach in a scholarly perspective describing the PRI-ED framework for emergency medicine. Component
Description
Objective
Strengthen ED-community partnerships to improve access and continuity for underserved populations.
Scope
Community clinics, shelters, schools, public health agencies, and ED-affiliated faculty, residents, and learners.
Intervention Strategies
• Establish an ED-community advisory group to identify shared priorities. • Develop mobile or community-based outreach clinics aligned with local need. • Integrate outreach participation into faculty and resident service credit systems. • Formalize referral pathways between ED and community partners.
Measurement Elements
• Number of active community partnerships. • Outreach event participation counts. • Proportion of outreach participants successfully linked to follow-up care.
Funding/Policy Mechanisms
• HRSA community outreach funding. • Local public health grants. • Institutional service-learning support structures. ED, emergency department; HRSA, Health Resources and Services Administration.
Western Journal of Emergency Medicine
1770
Volume 27, No. 6: November 2026
Development of the Patient Rights Index for EM
Ryan
Table 9. Patient Rights Index in Emergency Medicine (PRI-ED) domain: sustaining emergency access. The PRI-ED domain within a conceptual framework proposing strategies to support consistent, patient-centered EMTALA application within emergency departments in a scholarly perspective describing the PRI-ED framework for emergency medicine. Component
Description
Objective
Promote consistent understanding and operationalization of EMTALA requirements across emergency care systems.
Scope
EDs, hospital leadership, residency training programs, and specialty transfer networks.
Intervention Strategies
• Establish an interdisciplinary EMTALA review group. • Implement structured EMTALA education modules for clinicians and trainees. • Standardize stabilization and transfer protocols across high-risk domains (psychiatric, obstetric, specialty). • Conduct periodic case-based review sessions.
Measurement Elements
• Completion rates of EMTALA training modules. • Frequency of protocol review updates. • Variability in transfer documentation compliance.
Funding/Policy Mechanisms
• Institutional compliance resources. • CMS regulatory alignment initiatives. • Quality-improvement funding streams. CMS, Centers for Medicare & Medicaid Services; ED, emergency department; EMTALA, Emergency Medical Treatment and Labor Act.
emergency care. Violence-prevention programs may include standardized de-escalation training, environmental safety measures, incident-reporting systems, and postevent support services. Federal standards and legislative initiatives such as the Workplace Violence Prevention for Health Care and Social Service Workers Act may further strengthen these efforts. Table 10 highlights strategies to build safer environments for patients, families, and staff. Balanced Performance Measurement Performance measurement plays an essential role in EM,
informing quality improvement, operational management, accountability, and resource allocation. Traditional metrics such as throughput, length of stay, and productivity provide valuable information about system performance, but they may not fully capture other dimensions of care that are important to patients, clinicians, and healthcare organizations.54 Growing interest has emerged in measuring aspects of care that extend beyond operational efficiency, including patient experience, communication, care transitions, and clinician well-being.55 These domains may provide a more comprehensive understanding of ED performance and complement existing
Table 10. Patient Rights Index in Emergency Medicine (PRI-ED) domain: workplace safety and violence prevention. The PRI-ED domain within a conceptual framework proposing structured approaches to improve safety for patients and staff within emergency departments in a scholarly perspective describing the PRI-ED framework for emergency medicine. Component
Description
Objective
Reduce workplace violence and improve preparedness for safety incidents within the ED.
Scope
All clinicians, staff, learners, and patients within the ED environment.
Intervention Strategies
• Implement routine de-escalation training. • Conduct simulation-based safety drills. • Standardize incident reporting pathways. • Review environmental safeguards (secure access, panic systems). • Provide structured postincident debriefing and support.
Measurement Elements
• Staff participation rates in safety training. • Incident reporting rates and review completion. • Staff perception-of-safety survey results.
Funding/Policy Mechanisms
• OSHA workplace safety initiatives. • Institutional safety budgets. • State violence-prevention grants. ED, emergency department; OSHA, Occupational Safety and Health Administration.
Volume 27, No. 6: November 2026
1771
Western Journal of Emergency Medicine
Development of the Patient Rights Index for EM
Ryan
measures of quality and productivity. Measurement strategies that incorporate both operational and patient-centered outcomes may help organizations identify opportunities to improve care while supporting a sustainable clinical environment.56 Examples of additional measures that could be considered include patient understanding of discharge instructions, successful linkage to follow-up care, patient-reported experiences of respect and communication, and other indicators that reflect the quality of interactions and care transitions.57 Such measures are intended to complement rather than replace traditional operational and clinical metrics. The PRI-ED framework proposes a broader approach to performance assessment that incorporates both technical and human dimensions of care. Table 11 summarizes potential strategies for expanding measurement frameworks to better reflect the diverse goals of emergency medicine. Ethical Use of Artificial Intelligence and Technology Artificial intelligence (AI) is being integrated into emergency care, with applications ranging from clinical documentation and decision support to predictive analytics, telehealth, and operational management.58 In many settings, AI tools are assisting clinicians in identifying patients at risk for sepsis, forecasting resource utilization, drafting clinical notes, and supporting triage and discharge decisions.58 These technologies have the potential to improve efficiency, enhance decision-making, and reduce administrative burden, allowing clinicians to devote more time to direct patient care. At the same time, the integration of AI into EM raises important ethical and operational considerations. Algorithmic performance depends on the quality and representativeness of training data, creating the potential for bias and unintended disparities in care.59 Performance may also vary across patient populations and clinical settings, underscoring the importance
of ongoing evaluation and validation. Experiences with widely deployed tools, including sepsis prediction models, have highlighted the challenges of balancing sensitivity, specificity, and clinical usability in real-world practice.60 As AI adoption accelerates, EM will require governance frameworks that promote transparency, accountability, and patient-centered implementation. Algorithms should be evaluated for potential bias, monitored for unintended consequences, and deployed with appropriate clinician oversight.61 Rather than replacing clinical judgment, AI should function as a tool that supports decision-making while preserving the vital role of the patient-clinician relationship.62 Priority should be given to technologies that improve communication, education, safety, and care coordination while reducing administrative burden. The PRI-ED framework recognizes that technological innovation should be evaluated not only by its operational impact but by its effects on safety, equity, patient experience, and clinician well-being. Table 12 summarizes strategies to support the responsible integration of AI and emerging technologies into emergency care. Professional Identity and Values Alignment Emergency medicine operates within increasingly complex clinical, operational, financial, and regulatory environments. As healthcare systems evolve, maintaining alignment between professional values and organizational priorities remains an important challenge.62 Core principles including patient-centered care, universal access, ethical practice, and service to vulnerable populations continue to shape the identity of the specialty.63,64 Professional identity is influenced both by training, mentorship, and clinical experience, and by the priorities embedded within healthcare systems. Performance metrics, incentive structures, and institutional goals signal what
Table 11. Patient Rights Index in Emergency Medicine (PRI-ED) domain: balanced performance measurement. The PRI-ED domain within a conceptual framework proposing strategies to integrate patient-centered measures into emergency department quality systems in a scholarly perspective describing the PRI-ED framework for emergency medicine. Component
Description
Objective
Incorporate dignity-centered and patient-experience measures into routine ED quality reporting.
Scope
Departmental quality dashboards, operational reporting systems, and patient feedback processes.
Intervention Strategies
• Convene a multidisciplinary metrics review group. • Pilot 1 or 2 dignity-linked indicators alongside throughput metrics. • Implement brief patient micro-surveys (SMS or electronic).
Measurement Elements
• Number of dignity-focused metrics adopted. • Trends in patient-reported respect and understanding scores.
Funding/Policy Mechanisms
• Value-based purchasing programs. • CMS patient-experience reporting frameworks. CMS, Centers for Medicare & Medicaid Services; ED, emergency department; PRI-ED, Patient Rights Index in Emergency Medicine; SMS, short message service.
Western Journal of Emergency Medicine
1772
Volume 27, No. 6: November 2026
Development of the Patient Rights Index for EM
Ryan
Table 12. Patient Rights Index in Emergency Medicine (PRI-ED) domain: artificial intelligence (AI) and technology governance. The PRI-ED domain within a conceptual framework proposing guardrails for ethical AI and technology integration within emergency departments in a scholarly perspective describing the PRI-ED framework for emergency medicine. Component
Description
Objective
Ensure transparent, ethical, and bias-aware implementation of AI tools in ED care and education.
Scope
AI-driven triage, documentation, and clinical decision-support systems used in emergency care.
Intervention Strategies
• Develop departmental AI governance policies. • Conduct bias and performance reviews prior to implementation. • Provide staff training on AI limitations and oversight. • Integrate periodic re-evaluation of AI performance.
Measurement Elements
• Completion of AI governance policy. • Number of AI tools formally reviewed. • Staff AI training participation rates.
Funding/Policy Mechanisms
• Institutional innovation funding. • Federal digital health grant programs (e.g., HRSA telehealth grants, CMMI programs, NIH digital health research funding). AI, artificial intelligence; CMMI, CMS Innovation Center; CMS, Centers for Medicare & Medicaid Services; ED, emergency department; HRSA, Health Resources and Services Administration; NIH, National Institutes of Health.
organizations value and can influence how clinicians define success in practice. Measures related to throughput, productivity, and efficiency are important components of emergency care but may not fully capture other dimensions of practice that many clinicians view as central to the specialty’s mission.64,65 The PRI-ED framework recognizes that evaluation measures help shape professional culture. By incorporating patient experience, dignity, communication, equity, safety, and clinician well-being alongside traditional operational and clinical metrics, PRI-ED seeks to align accountability systems with the broader commitments that have historically defined emergency medicine.63,65 Rather than replacing existing measures, the framework provides a more balanced assessment of performance that reflects both the technical and human dimensions of care. Residency education, mentorship, faculty development, and professional organizations remain important mechanisms for reinforcing these values. Aligning educational priorities, organizational incentives, and performance measures may help clinicians meet operational demands while remaining grounded in the foundational principles of the specialty.64 Table 13 summarizes the PRI-ED framework for supporting professional identity and values alignment through educational, organizational, and policy-based strategies. LIMITATIONS This paper presents a conceptual framework and scholarly perspective rather than an empirical research study. The PRI-ED was developed through iterative domain generation informed by clinical observation, professional experience, targeted literature review, policy analyses, and organizational reports. No systematic review, formal consensus methodology (eg, Delphi process), external stakeholder review, psychometric testing, or prospective Volume 27, No. 6: November 2026
validation was performed. Accordingly, domain selection and organization reflect the author’s interpretation of recurring challenges in EM and may be influenced by professional experience, practice environment, and selection bias. Other reasonable frameworks, domains, or organizational structures could be proposed. The framework is intended to organize concepts and stimulate discussion rather than establish standards of care, quality benchmarks, accreditation requirements, or regulatory expectations. Although individual domains draw upon published literature and existing policy initiatives, the PRI-ED framework has not been validated, and its effects on patient outcomes, operational performance, equity, or healthcare utilization remain unknown. Implementation may vary substantially across institutions because of differences in resources, workforce capacity, local partnerships, reimbursement structures, regulatory environments, and community needs. In addition, the framework was developed within the US healthcare system and may not be fully generalizable to international settings with different financing models, regulatory structures, workforce configurations, cultural expectations, and social service infrastructures. Future work should evaluate the feasibility, reliability, and practical utility of PRI-ED through stakeholder engagement, implementation studies, and formal validation efforts. CONCLUSION The Patient Rights Index in Emergency Medicine is a proposed conceptual framework for organizing recurring domains in which emergency medicine intersects with access, safety, autonomy, relief of suffering, and dignity. By linking these domains to potential operational, educational, quality improvement, and policy interventions, PRI-ED provides a
1773
Western Journal of Emergency Medicine
Development of the Patient Rights Index for EM
Ryan
Table 13. Patient Rights Index in Emergency Medicine (PRI-ED) domain: professional identity and values alignment. The PRI-ED domain within a conceptual framework proposing strategies to sustain professional identity, ethical reflection, and mission alignment within emergency medicine in a scholarly perspective describing the PRI-ED framework for emergency medicine. Component
Description
Objective
Sustain alignment between emergency medicine practice and its core values of universal access and nonjudgmental care.
Scope
Departmental culture, residency training, and faculty development programs.
Intervention Strategies
• Incorporate structured ethics or values reflection sessions into conferences. • Maintain and periodically review departmental mission statements. • Develop case-based discussions addressing moral complexity in emergency medicine. • Establish mentorship pathways supporting professional meaning and resilience.
Measurement Elements
• Number of value-focused sessions held annually. • Participation rates in ethics case conferences. • Staff and resident survey measures of professional alignment.
Funding/Policy Mechanisms
• Institutional professional development budgets. • GME funding structures. GME, graduate medical education.
structured approach for future discussion and evaluation. Further work is needed to assess the feasibility, reliability, and impact of framework components across diverse emergency care settings.
a patient perspective. PRiMER. 2024;8:44. 5. Augustine J. A sobering year for emergency departments and their patients. 2023. Available at: https://www.acepnow.com/ article/a-sobering-year-for-emergency-departments-and-theirpatients. Accessed August 14, 2025. 6. Vizient, Inc. From every angle: emergency department overcrowding.
Address for Correspondence: Matthew Ryan, MD, PhD, University of Florida, College of Medicine, Department of Emergency Medicine, 1329 SW 16th Street, Gainesville, FL 32610. Email: mfryan@ufl.edu.
2025. Available at: https://www.vizientinc.com/insights/all/2025/ from-every-angle-emergency-department-overcrowding. Accessed August 24, 2025. 7. Hsia RY, Brownell J, Wilson S, et al. Trends in adult emergency
Conflicts of Interest: By the WestJEM article submission agreement, all authors are required to disclose all affiliations, funding sources and financial or management relationships that could be perceived as potential sources of bias. No other author has professional or financial relationships with any companies that are relevant to this study. There are no other conflicts of interest or sources of funding to declare.
department visits in California by insurance status, 2005–2010. JAMA 2013;310(11):1181-1183. 8. Santo L, Peters ZJ, DeFrances CJ. Emergency department visits among adults with mental health disorders: United States, 2017– 2019. NCHS Data Brief. 2021;426:1-8.
Copyright: © 2026 Ryan. This is an open access article distributed in accordance with the terms of the Creative Commons Attribution (CC BY 4.0) License. See: http://creativecommons.org/licenses/ by/4.0/
9. Kushel MB, Perry S, Bangsberg D, et al. Emergency department use among the homeless and marginally housed: results from a community-based study. Am J Public Health. 2002;92(5):778-784. 10. Grudzen CR, Richardson LD, Johnson PN, et al. Emergency department–initiated palliative care in advanced cancer: a randomized clinical trial. JAMA Oncol. 2016;2(5):591-598. 11. Zibulewsky J. The Emergency Medical Treatment and Active Labor
REFERENCES
Act (EMTALA): what it is and what it means for physicians. Proc (Bayl
1. Tang N, Stein J, Hsia RY, et al. Trends and characteristics of US
Univ Med Cent). 2001;14(4):339-346.
emergency department visits, 1997–2007. JAMA. 2010;304(6):664-
12. Beauchamp TL, Childress JF. (2019). Principles of biomedical ethics.
670. 2. Rosen P. The biology of emergency medicine. J Am Coll Emerg Med. 1979;8(7):280-283.
8th ed. New York, NY: Oxford University Press. 13. Hansen K, Boyle A, Holroyd B, et al. Updated framework on quality and safety in emergency medicine. Emerg Med J. 2020;37(7):437-
3. Centers for Disease Control and Prevention, National Center for Health Statistics. Emergency department visits. Available at: https:// www.cdc.gov/nchs/fastats/emergency-department.htm. Accessed
442. 14. Zeller SL, Calma NM, Stone A. Effects of a dedicated regional psychiatric emergency service on boarding of psychiatric patients in
August 10, 2026.
area emergency departments. West J Emerg Med. 2014;15(1):1-6.
4. Wu N, Woloski JR. Emergency department versus primary care use:
Western Journal of Emergency Medicine
1774
Volume 27, No. 6: November 2026
Development of the Patient Rights Index for EM
Ryan 15. Treatment Advocacy Center. Psychiatric bed supply need per
emergency department: the patient perspective. Ann Emerg Med.
population. 2024. Available at: https://www.tac.org/wp-content/
2015;65(4):377-386.e3.
uploads/2024/03/TAC_ORPA_ResearchSummary1.24.pdf. Accessed
30. Soril LJ, Leggett LE, Lorenzetti DL, et al. Reducing frequent visits to
August 24, 2025.
the emergency department: a systematic review of interventions.
16. Bommersbach TJ, McKean AJ, Olfson M, et al. National trends in
PLoS One. 2015;10(4):e0123660.
mental health–related emergency department visits among youth,
31. Biese KJ, Busby-Whitehead J, Cai J, et al. Telephone follow-up for
2011–2020. JAMA 2023;329(17):1469-1477.
older adults discharged to home from the emergency department: a
17. Substance Abuse and Mental Health Services Administration. Key
pragmatic randomized controlled trial. J Am Geriatr Soc.
substance use and mental health indicators in the United States:
2018;66(3):452-458.
results from the 2022 National Survey on Drug Use and Health.
32. Shumway M, Boccellari A, O’Brien K, et al. Cost-effectiveness of
2023. Available at: https://www.cdc.gov/overdose-prevention/media/
clinical case management for ED frequent users: results of a
pdfs/2024/04/SAMHSA-Key-substance-use-and-mental-health-
randomized trial. Am J Emerg Med. 2008;26(2):155-164.
indicators-2022.pdf. Accessed August 10, 2026.
33. Sadowski LS, Kee RA, VanderWeele TJ, et al. Effect of a housing
18. Beronio K, Glied S, Frank RG. How the Affordable Care Act and
and case management program on emergency department visits and
Mental Health Parity and Addiction Equity Act greatly expand
hospitalizations among chronically ill homeless adults: a randomized
coverage of behavioral health care. J Behav Health Serv Res.
trial. JAMA. 2009;301(17):1771-1778.
2014;41(4):410-428.
34. Larimer ME, Malone DK, Garner MD, et al. Health care and public
19. Nicks BA, Manthey DM. The impact of psychiatric patient boarding in
service use and costs before and after provision of housing for
emergency departments. Emerg Med Int. 2012;2012:360308.
chronically homeless persons with severe alcohol problems. JAMA.
20. Kistler EA, Morrison RS, Richardson LD, et al. Emergency
2009;301(13):1349-1357.
department-triggered palliative care in advanced cancer: proof of
35. California Department of Housing and Community Development.
concept. Acad Emerg Med. 2015;22(2):237-239.
Project homekey. 2024. Available at: https://www.hcd.ca.gov.
21. Dumanovsky T, Augustin R, Rogers M, et al. The growth of palliative
Accessed September 29, 2025.
care in U.S. hospitals: a status report. J Palliat Med. 2016;19(1):8-15.
36. Shinn GA. (2014). The cost of long-term homelessness in Central
22. Smith AK, McCarthy E, Weber E, et al. Half of older Americans seen
Florida. Orlando, FL: Central Florida Commission on Homelessness.
in emergency department in last month of life: most admitted to
37. Guleria I, Campbell JA, Thorgerson A, et al. Relationship between
hospital, and many die there. Health Aff (Millwood). 2012;31(6):1277-
social risk factors and emergency department use: National Health
1285.
Interview Survey 2016-2018. West J Emerg Med. 2025;26(2):307-
23. Lupu D. Estimate of current hospice and palliative medicine physician workforce shortage. J Pain Symptom Manage. 2010;40(6):899-911.
314. 38. National Advisory Committee on Rural Health and Human Services.
24. Lamba S, Pound A, Rella JG, et al. Emergency medicine resident
(2021). The future of rural health care. Washington, DC: US
education in palliative care: a needs assessment. J Palliat Med.
Department of Health and Human Services.
2012;15(5):516-520.
39. Di Mauro R, Di Silvio V, Bosco P, et al. Case management programs
25. Campbell R, Patterson D, Lichty LF. The effectiveness of sexual
in emergency department to reduce frequent user visits: a systematic
assault nurse examiner (SANE) programs: a review of psychological, medical, legal, and community outcomes. Trauma Violence Abuse.
review. Acta Biomed. 2019;90(6-S):34-40. 40. Kangovi S, Mitra N, Grande D, et al. Evidence-based community
2005;6(4):313-329.
health worker program addresses unmet social needs and generates
26. American College of Emergency Physicians. (2013). Evaluation and
positive return on investment. Health Aff (Millwood). 2020;39(2):207213.
management of the sexually assaulted or sexually abused patient. 2nd ed. Dallas, Texas: American College of Emergency Physicians.
41. Noel L, Chen Q, Petruzzi LJ, et al. Interprofessional collaboration
27. Wasco SM, Campbell R, Howard A, et al. A statewide evaluation of
between social workers and community health workers to address
services provided to sexual assault survivors. J Interpers Violence.
health and mental health in the United States: a systematised review.
2004;19(2):252-263.
Health Soc Care Community. 2022;30(6):e6240-e6254.
28. Health Resources and Services Administration. Rural health care
42. Farmer P, Kim JY. Surgery and global health: a view from beyond the
services outreach program. 2024. Available at: https://www.hrsa.gov. Accessed August 10, 2026.
OR. World J Surg. 2008;32(4):533-536. 43. World Health Organization. Task shifting: rational redistribution of
29. Rui P, Kang K, Ashman JJ. National hospital ambulatory medical care
tasks among health workforce teams: global recommendations and
survey: 2016 emergency department summary tables. 2016.
guidelines. 2008. Available at: https://www.who.int/publications/i/
Available at: https://www.cdc.gov/nchs/data/ahcd/nhamcs_ emergency/2016_ed_web_tables.pdf. Accessed August 10, 2026.
item/9789241596312. Accessed August 10, 2026. 44. Syed SB, Dadwal V, Martin G. Reverse innovation in global health
Rising KL, Padrez KA, O’Brien M, et al. Return visits to the
Volume 27, No. 6: November 2026
systems: towards global innovation flow. Global Health. 2013;9:36.
1775
Western Journal of Emergency Medicine
Development of the Patient Rights Index for EM
Ryan 54. Shanafelt TD, Hasan O, Dyrbye LN, et al. Changes in burnout and
45. Health Resources and Services Administration. Rural health care services outreach program. 2025. Available at: https://www.hrsa.gov/
satisfaction with work-life balance in physicians and the general US
rural-health/outreach. Accessed August 10, 2026.
working population between 2011 and 2014. Mayo Clin Proc. 2015;90(12):1600-1613.
46. Centers for Medicare & Medicaid Services. Accountable health
55. Campbell EG, Regan S, Gruen RL, et al. Professionalism in
communities model. 2026. Available at: https://www.cms.gov/ priorities/innovation/innovation-models/ahcm. Accessed June 23,
medicine: results of a national survey of physicians. Ann Intern Med.
2026.
2007;147(11):795-802. 56. Engel KG, Heisler M, Smith DM, et al. Patient comprehension of
47. U.S. General Accounting Office. (2001). Emergency care: EMTALA implementation and enforcement issues. Washington, DC: U.S.
emergency department care and instructions: Are patients aware of
General Accountability Office.
when they do not understand? Ann Emerg Med. 2009;53(4):454-461. e15.
48. American College of Emergency Physicians. EMTALA and on-call
57. Topol EJ. High-performance medicine: the convergence of human
responsibility for emergency department patients. Policy statement.
and artificial intelligence. Nat Med. 2019;25(1):44-56.
2013. Available at: https://www.acep.org/siteassets/new-pdfs/
58. Obermeyer Z, Powers B, Vogeli C, et al. Dissecting racial bias in an
policy-statements/emtala-and-on-call-responsibility-for-emergency-
algorithm used to manage the health of populations. Science.
department-patients.pdf. Accessed August 9, 2026. 49. Woskie LR, Brower N, Shaffer J, et al. Obstetric-Related Emergency
2019;366(6464):447-453. 59. Wong A, Otles E, Donnelly JP, et al. External validation of a widely
Medical Treatment and Labor Act violations and no health exception
implemented proprietary sepsis prediction model in hospitalized
bans. JAMA Health Forum. 2025;6(12):e254726.
patients. JAMA Intern Med. 2021;181(8):1065-1070.
50. American Nurses Association. ANA health and safety survey: workplace violence and incivility. 2019. Available at: https://www.
60. Wiens J, Saria S, Sendak M, et al. Do no harm: a roadmap for
nursingworld.org/practice-policy/work-environment/health-safety/.
responsible machine learning for health care. Nat Med. 2019;25(9):1337-1340.
Accessed September 16, 2025.
61. Schneider SM, Gardner AF, Weiss LD, et al. The future of emergency
51. Kowalenko T, Walters BL, Khare RK, et al. Workplace violence: a
medicine. J Emerg Med. 2010;39(2):210-215.
survey of emergency physicians in the state of Michigan. Ann Emerg Med. 2005;46(2):142-147.
62. Giwa A, Crutchfield D, Fletcher D, et al. Addressing moral injury in emergency medicine. J Emerg Med. 2021;61(6):782-788.
52. U.S. Bureau of Labor Statistics. Workplace violence in healthcare, 2018 [fact sheet]. 2020. Available at: https://www.bls.gov/iif/.
63. Salhi RA, Macias-Konstantopoulos WL, Ryus CR. Future directions to strengthen the emergency department safety net. West J Emerg
Accessed September 16, 2025.
Med. 2023;24(5):919-920.
53. Sharp AL, Cobb EM, Dresden SM, et al. Understanding the value of emergency care: a framework incorporating stakeholder
64. McClellan FM. (2019). Healthcare and Human Dignity: Law Matters. New Brunswick, NJ: Rutgers University Press.
perspectives. J Emerg Med. 2014;47(3):333-342.
Western Journal of Emergency Medicine
1776
Volume 27, No. 6: November 2026
Letter To The Editor: Comment
Numerical Inconsistencies in “Physician-Staffed Ambulance Deployment: Comparative Response Time Analysis from a Slovak Pilot Project” Adrián Fabiny, PhDr*† Dušan Sysel, PhDr, PhD* Teodor Bachleda, MD, PhD, MBA*
*Comenius University in Bratislava, Faculty of Medicine, Clinic of Emergency Medicine and Disaster Medicine, Bratislava, Slovak Republic † Comenius University in Bratislava, Jessenius Faculty of Medicine in Martin, Department of Nursing, Bratislava, Slovak Republic
Section Editor: N/A Submission history: Submitted August 3, 2026; Accepted August 9, 2026 Electronically published October 18, 2026 Full text available through open access at http://escholarship.org/uc/uciem_westjem DOI 10.5811/westjem.67945
[West J Emerg Med. 2026;27(6)1777–1778.]
Dear Editor: We read with interest the study by Sedlak et al on a physician-staffed rendezvous (RV) model in Košice.1 The question is timely and the dataset substantial, and we welcome this contribution. In a constructive spirit, we raise several numerical inconsistencies that warrant correction, and one interpretive point. These inconsistencies appear to be transcription or typesetting errors that do not, in our reading, alter the direction or significance of the principal findings; we note them to support the accuracy of the record. First, in Table 1, the standard deviation for RLP Západ response time postintervention is 34.63 minutes, while the reported minimum and maximum are 2 minutes and 51 minutes. For any sample bounded within this range, the maximum attainable standard deviation is approximately (51−2)/2 ≈ 24.5 minutes. The reported value cannot derive from these data and is likely a transcription error. Second, two maxima in Table 1 appear implausible: The on-scene interval for RV Sever lists a maximum of 12600 minutes (other maxima in this block range ~126–160), and the crew-availability interval lists 19000 mins. A genuine value of 19000 in a sample of 488 would raise the mean by tens of minutes; since the reported mean (49.58) is consistent with a maximum near 190, these appear to be misplaced decimal points. Third, in Table 4 the 95% CI for the postintervention indicator is printed as [−1.1013, −0.525]. Recalculation from the reported coefficient and standard error (−0.7692 ± 1.96 × 0.124) yields [−1.012, −0.526], matching the value cited in the abstract and discussion sections (−1.013 to −0.525). The tabulated lower bound appears to contain an extra digit. Fourth, also in Table 4, the intercept coefficient (9.3295) and standard error (0.199) yield t ≈ 46.9 rather than the printed
Volume 27, No. 6: November 2026
49.6. The remaining rows are internally consistent, suggesting an isolated error in this row. Furthermore, for dispatch priority “M,” the reported interval [0.075, 0.386] excludes the null value, which is incompatible with the accompanying P = .19; the correct interval (0.1552 ± 1.96 × 0.118) is approximately [−0.076, 0.386], the lower bound apparently carrying an incorrect sign. This does not affect interpretation, as the authors treat this covariate as nonsignificant. Fifth, the results section states that the largest responsetime improvements were “in Košice 2 and Košice 3 (absolute reductions of 2.64 and 2.15 minutes, and effect sizes rₑ = 0.616 and 0.419, respectively).” Table 3, however, attributes the 2.15-minute reduction and rₑ = 0.419 to Košice 2, and the 2.64-minute reduction and rₑ = 0.616 to Košice 3. The values appear transposed. We also note that the Table 3 footnote defines rₑ as “random effects,” whereas the methods section defines it as the rank-biserial correlation; and the regression reports N = 10,687 against an analytic cohort of 11,094, a difference of 407 cases that is not explained in the text. Beyond these corrigible items, we offer one interpretive observation. The improvement in time-to-crew-availability is concentrated in the RV unit (Sever: 60.78 → 49.58 minutes), whereas the two retained physician-staffed transport units show the opposite trend over the same period (Staré Mesto 57.36 → 64.25; Západ 57.91 → 62.67). This redistribution is reported in the results section but is not reflected in the abstract or conclusion, which characterize the availability gain in system-level terms. Because the study does not directly compute a net system-wide availability balance, we suggest the conclusion on availability be framed with this trade-off made explicit. We emphasize that the response-time findings are unaffected: as per Table 1, response time improved across all three units, and the authors’ conclusion on that outcome is
1777
Western Journal of Emergency Medicine
Numerical Inconsistencies in “Physician-Staffed Ambulance Deployment” well-supported. We thank the authors for an informative analysis and hope these observations are received in the collegial spirit intended.
Address for Correspondence: Adrián Fabiny, PhDr, Comenius University in Bratislava, Jessenius Faculty of Medicine in Martin, Department of Nursing, Malá Hora 5, 036 01 Martin, Slovakia. Email: fabiny1@uniba.sk. Conflicts of Interest: By the WestJEM article submission agreement, all authors are required to disclose all affiliations, funding sources and financial or management relationships that could be perceived as potential sources of bias. No author has professional or financial
Western Journal of Emergency Medicine
Fabiny et al.
relationships with any companies that are relevant to this study. There are no conflicts of interest or sources of funding to declare. Copyright: © 2026 Fabiny et al. This is an open access article distributed in accordance with the terms of the Creative Commons Attribution (CC BY 4.0) License. See: http://creativecommons.org/ licenses/by/4.0/
REFERENCES 1. Sedlak M, et al. Models of physician-staffed ambulance deployment: analysis from a Slovak pilot project. West J Emerg Med. 2026;27(3):716-722.
1778
Volume 27, No. 6: November 2026
Letter To The Editor: Reply
Reply to Letter to the Editor “Numerical Inconsistencies in ‘Physician-Staffed Ambulance Deployment: Comparative Response Time Analysis from a Slovak Pilot Project’” Marian Sedlák, MD*† Tomas Petras, MD‡ Imrich Berta, MPhil§ Gaston Ivanov, MSc|| Jozef Karas, MD||
*Záchranná služba Košice, Košice, Slovak Republic † Pavol Jozef Safarik University and Louis Pasteur University Hospital, Department of Trauma Surgery, Košice, Slovak Republic ‡ Pavol Jozef Safarik University, Medical Education Centre, Košice, Slovak Republic § Ministry of Health of the Slovak Republic, Institute for Healthcare Analyses, Bratislava, Slovak Republic || Ministry of Health of the Slovak Republic, Health Section, Bratislava, Slovak Republic
Section Editor: N/A Submission history: Submitted August 21, 2026; Accepted August 21, 2026 Electronically published October 18, 2026 Full text available through open access at http://escholarship.org/uc/uciem_westjem DOI 10.5811/westjem.68702
[West J Emerg Med. 2026;27(6)1779–1780.]
Dear Editor: We thank the correspondents for their careful reading of our study and for their constructive, collegial comments. We are grateful for the opportunity to correct errors that arose during data transcription and typesetting. We confirm that none of these errors affect the underlying analyses, results, or conclusions, and we address each point in turn below. We also welcome the interpretive observation regarding crew availability and clarify our position. First, the correspondents are correct that the standard deviation of 34.63 minutes reported in Table 1 for the postintervention response interval of RLP Západ cannot arise from a sample bounded by the reported minimum of two minutes and the maximum of 51 minutes. This is a transcription error. The correct standard deviation, consistent with the other units and with the reported range, is 4.63 minutes; other data points are unaffected. Second, we agree that the maxima of 12600 minutes (on-scene interval, RV Sever) and 19000 minutes (crewavailability interval, RV Sever) in Table 1 are implausible and reflect misplaced decimal points introduced during table preparation. The correct values are 126.00 minutes and 190.00 minutes, respectively. Importantly, the analyses were performed on the correctly scaled source data: the reported means (33.47 and 49.58 minutes) and standard deviations are computed from the true values and remain valid. Only the two tabulated maxima require correction. Third, the 95% CI printed in Table 4 for the postintervention indicator, [−1.1013, −0.525], contains a typographical extra digit in the lower bound. The correct
Volume 27, No. 6: November 2026
interval is [−1.013, −0.525], as consistently reported in the abstract, the population health research capsule, and the discussion sections, and as recovered from the coefficient and standard error (−0.7692 ± 1.96 × 0.124). Table 4 should be corrected accordingly. Fourth, we confirm both observations concerning Table 4. (A) The intercept t value should read 46.9 (9.3295 / 0.199), not 49.6; the coefficient, standard error, and P value in that row are correct, and this is an isolated typesetting error. (B) For dispatch priority “M,” the lower bound of the 95% CI carries an incorrect sign; the correct interval is [−0.076, 0.386], which is consistent with the nonsignificant P value = .187. As the correspondents note, this covariate is nonsignificant and its interpretation is unchanged. Fifth, we address the three items raised together. (A) The results text only transposes the district-level values; the correct pairing, as shown in Table 3, is Košice 2 (absolute reduction 2.15 minutes, rₑ = 0.419) and Košice 3 (absolute reduction 2.64 minutes, rₑ = 0.616). The sentence in the results section will be corrected to match Table 3. (B) The Table 3 footnote defining “rₑ” as “random effects” is an error; rₑ denotes the rank-biserial correlation, as defined in the methods section, and the footnote will be corrected. (C) Regarding the sample sizes, the descriptive analyses in Table 1 include all 11,094 eligible cases, whereas the multivariable ordinary least squares regression was based on a more restricted analytic cohort. Although complete-case analysis is described in the methods section, the regression additionally incorporated specific model parameters, including month-fixed effects, dispatch priority, together with the time-related exclusion criteria.
1779
Western Journal of Emergency Medicine
In Reply to the Letters to the Editor “Numerical Inconsistencies in ‘Physician-Staffed Ambulance Deployment’” These additional criteria resulted in a complete analytic sample of N = 10,687. We agree that the eligibility and exclusion criteria for the multivariable analysis should have been stated more explicitly and will clarify these in the methods section. Beyond these corrigible items, we appreciate the correspondents’ interpretive observation regarding crew availability. We acknowledge that the improvement was observed primarily in the unit transformed to the RV model, whereas the two remaining physician-staffed transport units showed the opposite trend. However, investigating the factors underlying these differences (including possible changes in case mix, workload, dispatch characteristics, or other operational factors) was beyond the scope of the study. Accordingly, we did not perform a formal system-wide analysis of crew availability and will revise the conclusion to distinguish the unit-level finding from broader system-level interpretations. As the correspondents also note, the primary outcome—response time—remains unaffected. We will revise the conclusion to distinguish the unit-level improvement in crew availability from broader system-level interpretations. Finally, we remain committed to the principles of transparency and reproducibility. The underlying dataset and analytical materials are available upon reasonable request from the participating dispatch center, subject to the applicable governance and data-protection requirements. We welcome independent examination of our analyses and are
Western Journal of Emergency Medicine
Sedlák et al.
currently planning to extend the study cohort, with the aim of repeating the analyses on a substantially larger dataset to evaluate the robustness and reproducibility of the present findings. We again thank the correspondents for their rigorous and collegial review, which strengthens the accuracy of the published record. Sincerely, on behalf of the authors’ team, Marián Sedlák
Address for Correspondence: Marian Sedlák, MD, Pavol Jozef Safarik University and Louis Pasteur University Hospital, Department of Trauma Surgery, Rastislavova 43, 04001 Košice, Slovak Republic. Email: marian.sedlak.md@gmail.com. Conflicts of Interest: By the WestJEM article submission agreement, all authors are required to disclose all affiliations, funding sources and financial or management relationships that could be perceived as potential sources of bias. No author has professional or financial relationships with any companies that are relevant to this study. There are no conflicts of interest or sources of funding to declare. Copyright: © 2026 Sedlák et al. This is an open access article distributed in accordance with the terms of the Creative Commons Attribution (CC BY 4.0) License. See: http://creativecommons.org/ licenses/by/4.0/
1780
Volume 27, No. 6: November 2026
Letter to the Editor
The Ethics of Night Shift Allocation Isha Agarwal, MD, ScD*†‡ Frank Chessa, PhD‡§
*MaineHealth Maine Medical Center, Department of Emergency Medicine, Portland, Maine † MaineHealth Institute for Research, Center for Interdisciplinary and Population Health Research, Portland, Maine ‡ Tufts University School of Medicine, Boston, Massachusetts § MaineHealth Maine Medical Center, Division of Clinical Ethics, Portland, Maine
Section Editor: Mark I. Langdorf, MD, MHPE Submission history: Submitted August 8, 2026; Accepted August 10, 2026 Electronically published November 2, 2026 Full text available through open access at http://escholarship.org/uc/uciem_westjem DOI 10.5811/westjem.68392
[West J Emerg Med. 2026;27(6)1781–1782.]
Dear Editor: We read with great interest the article published in December 2024 by Croteau and colleagues, “Two-year Results of an Emergency Department Night Shift Buyout Program.”1 The authors describe the results of a new shift trading program whereby all faculty, regardless of academic rank, could buy out of night shifts for $500 per night shift, in exchange for day and evening shifts. Bought-out nights were used to increase the salaries of nocturnists compared to non-nocturnist attendings. While the authors describe their program as “egalitarian,” they report that faculty who fully bought out of night shifts were more likely to be male, longer tenured, and of higher academic rank. Nocturnists were on average eight years more junior to faculty who sought full night shift buy-out, and none were associate or full professors. The significance of this disparity is magnified by the known health risks of night shift work, which include cancer, cardiovascular, and all-cause mortality.2 The article left us with an important ethical question: Should the burden of night shift work, a known health hazard, depend on whether an individual has the financial means to avoid it? Ethical terminology should be used cautiously and with clear definitions—incautious use can obscure injustices found in systems with a superficial ethical credibility. The authors say that their system is “egalitarian,” but also that it succeeds in “promoting equity across our faculty groups.” Typically, an egalitarian system is one that ensures an equal distribution of benefits and burdens, while an equitable system is one in which the distribution of benefits and burdens is sensitive to the needs (or other characteristics) of individuals. Thus, egalitarian systems typically stand in contrast to equitable ones. The buy-out program advocated by Croteau and colleagues can best be described as a marketplace approach based on the ethical conception of “equality of opportunity.” That is, all faculty are offered an equal opportunity to buy out night shift work. The resulting Volume 27, No. 6: November 2026
distributions of the benefits and burdens of night shift work result from the choices of those within the system. Equality of opportunity systems can support equity when participants start with a level playing field. The resulting distribution can then be expected to align with an individual’s preferences to the greatest extent possible consistent with a roughly equal satisfaction of preferences among all participants in the system. The problem with the described buyout system is that participants do not start on a level playing field. For example, the $500 cost of a buyout has different consequences for a junior faculty member with a lot of debt than for a senior faculty member with a higher salary and no debt. Mechanisms such as this likely played out in the program outcomes, which resulted in more buyout of night shifts by senior, male faculty members. A different type of ethical concern arises in discussions about what is appropriate to commodify as a good or service that is for sale. Consider the debate about whether to allow markets for organ transplantation. Proponents argue that a marketplace would incentivize organ donation and solve the current shortage of donor organs. Opponents argue a moral principle: that the human body should not be treated as an object of commerce.3 If we are skeptical of markets for organ transplantation, should we similarly be skeptical of buying and selling of night shift work, which carries known health risks? Perhaps instead of thinking of night shift work as an unpleasant commodity to buy and sell, it should be understood as a civic duty, or shared professional responsibility, among emergency physicians. Such a mindset recognizes that night shift work is an unavoidable aspect of our specialty, one that is best borne collectively rather than shifted to those with the least seniority or greatest financial need. We suspect that the popularity of the buyout program described by Croteau and colleagues was not due to more equitable distribution of night shift work but rather an increase in autonomy and control over the scheduling compared to their prior rulebased system. Autonomy and control may well be the biggest
1781
Western Journal of Emergency Medicine
Ethics of Night Shift Allocation ethical advantage of the buyout system. As departments seek innovative approaches to night shift scheduling and compensation, we believe they should ask not only what works, but also what values those systems reinforce.
Agarwal et al. Copyright: © 2026 Agarwal et al. This is an open access article distributed in accordance with the terms of the Creative Commons Attribution (CC BY 4.0) License. See: http://creativecommons.org/ licenses/by/4.0/ REFERENCES 1. Croteau CW, Goldstein JN, Nentwich L, et al. Two-year results of an
Address for Correspondence: Isha Agarwal, 22 Maine Medical Center, Department of Emergency Medicine, 22 Bramhall Street, Portland, Maine 04102. Email: isha.agarwal@mainehealth.org.
emergency department night shift buy-out program. West J Emerg Med. 2025;26(2):290-294. 2. Su F, Huang D, Wang H, et al. Associations of shift work and night
Conflicts of Interest: By the WestJEM article submission agreement, all authors are required to disclose all affiliations, funding sources and financial or management relationships that could be perceived as potential sources of bias. No author has professional or financial relationships with any companies that are relevant to this study. There are no conflicts of interest or sources of funding to declare.
Western Journal of Emergency Medicine
work with risk of all-cause, cardiovascular and cancer mortality: a meta-analysis of cohort studies. Sleep Med. 2021;86:90-98. 3. Delmonico FL, Martin D, Domínguez-Gil B, et al. Living and deceased organ donation should be financially neutral acts. Am J Transplant. 2015;15(5):1187-1191.
1782
Volume 27, No. 6: November 2026
Letter to the Editor: Reply
Reply to Letter to the Editor for “Two-year Results of an Emergency Department Night Shift Buyout Program” Charlotte W. Croteau, MD, MHCM Joshua N. Goldstein, MD, PhD Lauren Nentwich, MD Ali S. Raja, MD, DBA, MPH Michael VanRooyen, MD, MPH Joshua J. Baugh, MD, MHCM, MPP
Harvard Medical School, Massachusetts General Hospital, Department of Emergency Medicine, Boston, Massachusetts
Section Editor: N/A Submission history: Submitted October 1, 2026; Accepted October 1, 2026 Electronically published November 2, 2026 Full text available through open access at http://escholarship.org/uc/uciem_westjem DOI 10.5811/westjem.69561
[West J Emerg Med. 2026;27(6)1783–1784.]
Dear Editor: We thank the authors for their thoughtful letter and for engaging so seriously with the ethical dimensions of our night shift buyout program. The distinction they draw between egalitarian and equitable systems is a useful one, and we agree that in an idealized group of emergency medicine faculty, nights, holidays, and weekends would simply be shared evenly across all members. In practice, however, this ideal rarely survives contact with a real department. Faculty carry medical conditions, family obligations, and life circumstances that departments routinely and reasonably accommodate. In some groups, exemption from night shifts is treated as a perk of seniority; given the well-documented disproportionate physiologic impact of night work on older clinicians, many departments simply let senior faculty opt out entirely, which has the effect of concentrating more nights on the most junior members. We suspect that most emergency departments already operate some form of unequal or inequitable night shift distribution, whether it is named as such or not. Nursing, a no less demanding profession, has long compensated nights differently than days and lives with the same equity tensions the authors raise here. Viewed against that backdrop, we believe our program offers not only equality of opportunity but, in practice, more equity than many systems that may aspire to an unattainable ideal and end up instead with a patchwork of informal accommodations that are typically less equitable—and certainly less transparent—than a system with an explicit and uniform price. We would also candidly note that our current program is considerably more equitable than the one it replaced, in which night shift assignment tracked directly with
Volume 27, No. 6: November 2026
age and academic rank, both of which historically skewed heavily male in our department. We agree with the authors that organ donation is a higherstakes case for the ethics of commodification than night shift scheduling, and we are not certain that perfect equity should be the primary goal of a night shift system in the first place. As the authors themselves observe, increased autonomy and control over one’s schedule may be the greatest advantage of a buy-out model, acknowledging that scheduling needs and preferences are far from uniform across different emergency physicians, or even within the same physician at different stages of life. We therefore placed a high priority on autonomy and choice by design, not as an incidental benefit. This perhaps raises a pertinent question for the authors in return: What alternative would they propose? One common model exclusively exempts older or more senior faculty from nights, which raises many equity concerns, particularly if older and more senior faculty differ in characteristics from the rest of the group. Given recently documented trends of women emergency physicians leaving the field earlier than men,1 an age-based model in particular risks asking women to work nights for a longer portion of their careers than men. Another option is a fixed, non-negotiable allotment of nights distributed equally to all faculty, with no mechanism to reduce that number. Under that model, no faculty member is ever worse off in night burden than any peer—this appears the most equitable version on the surface. However, this model would ask older emergency physicians to continue working nights until retirement, which prior research suggests is likely not beneficial for patient care quality or career longevity. It would also result in the loss of autonomy and flexibility that the authors credit our program with achieving. Such a model also presumes it is equitable to make the same requirements of
1783
Western Journal of Emergency Medicine
Reply: “Two-year Results of an Emergency Department Night Shift Buyout Program”
Croteau et al.
all emergency physicians regardless of life circumstances; it is easy to envision this not necessarily being true. We share the authors’ view that ethical and optimal distribution of undesirable shifts is fertile ground for further analysis. Productive future efforts might include a multicenter analysis of scheduling approaches across various settings, along with measured outcomes, to inform the program choices that emergency departments across the country will make in years to come.
Conflicts of Interest: By the WestJEM article submission agreement, all authors are required to disclose all affiliations, funding sources and financial or management relationships that could be perceived as potential sources of bias. No author has professional or financial relationships with any companies that are relevant to this study. There are no conflicts of interest or sources of funding to declare.
Address for Correspondence: Charlotte W. Croteau, MD, MHCM, Harvard Medical School, Massachusetts General Hospital, Department of Emergency Medicine, 55 Fruit Street, Austen 850, Boston, MA 02114. Email: ccroteau1@mgb.org.
REFERENCES
Western Journal of Emergency Medicine
Copyright: © 2026 Croteau et al. This is an open access article distributed in accordance with the terms of the Creative Commons Attribution (CC BY 4.0) License. See: http://creativecommons.org/ licenses/by/4.0/
1. Sethuraman KN, Lall MD, Gorman EF, et al. Women emergency physicians and gender disparities from entry to advancement. Ann Emerg Med. 2026. In press.
1784
Volume 27, No. 6: November 2026
Erratum
This Article Corrects: “The Bullets He Carried” Stephen Hargarten, MD, MPH
Medical College of Wisconsin, Comprehensive Injury Center, Milwaukee, Wisconsin
Electronically published November 2, 2026 Full text available through open access at http://escholarship.org/uc/uciem_cpcem DOI: 10.5811/westjem.69717
[West J Emerg Med. 2026;27(6)1785.]
Original article: doi 10.5811/westjem.2020.5.48216 Original title: The Bullets He Carried Author: Stephen Hargarten, MD, MPH Wound Ballistics Testing Update: A Revision to the September 2020 Commentary Since my September 2020 Commentary was published,1 we have expanded our wound ballistics research by adding a testing site at Cranfield Defense and Security in England. This partnership was established to replicate our findings from the Milwaukee site and explore additional firearms, including historical black powder weapons. Ballistics tests at Cranfield were conducted using a muzzleloading flintlock Brown Bess musket (circa 1780s) firing a 41-g musket ball, adhering to their standardized black powder protocol. (The initial simulation model used a musket ball weighing less than 4 g.). Kinetic energy transfer tests with this heavier musket ball averaged 524 J, using the same 20% gelatin matrix employed across both research sites. Additionally, pooled testing data for the AR-15 (5.56-mm NATO round) were updated and summarized, yielding an average kinetic energy transfer of 1,363 J, compared with the 1055.5 J initially reported.
Volume 27, No. 6: November 2026
To update the comparative findings from the original commentary, the baseline rate of fire and historical equivalents remain unchanged: The musket rate of fire is 2 rounds/min, and the perpetrator’s rate of fire during the Sandy Hook Elementary School shooting remains 39 rounds/min—a volume of fire that historically represents 19 militia members storming the school. However, integrating the updated kinetic energy measurements alters the total energy-transfer-perminute calculations as follows: • •
Musket: 2 rounds/min × 524 J = 1048 J/min AR-15: 39 rounds/min × 1363 J = 53,157 J/min
This updated calculation reveals that the kinetic energy potential of the shooter represents 51 militia members storming the school simultaneously. This finding marks a significant downward revision from the 171 militia members calculated using the initial, lighter simulation ball. We continue our rigorous wound ballistics testing and welcome critical peer review from the readership to ensure accurate, replicable, and scientifically sound data. REFERENCE
1785
1. Hargarten SW. The bullets he carried. West J Emerg Med. 2020;21(5):1036.
Western Journal of Emergency Medicine
JETem
™
Journal of Education & Teaching in Emergency Medicine
A publication of CORD
Focus on Education & Scholarship
At JETem, we believe that all learners should benefit from active learning and that educators should have the opportunity to publish and distribute outstanding, scholarly academic work so that it may be widely distributed, thereby increasing the significance of their results. JETem is published by the UC Irvine Health School of Medicine and Department of Emergency Medicine in conjunction with the Council of Emergency Medicine Residency Directors (CORD). We are an online, open access, peer-reviewed, PMC-indexed journal-repository for EM educators in all major topic areas. JETem is published quarterly. We publish team-based learning, small group learning, simulation, podcasts, lectures, innovations, certifying exam cases, curricula and image-based case reports (VisualEMs).
We accept a variety of content Submit your scholarship today! visualem lecture
small groups
certifying exam
podcasts
simulation
tbl
curriculum
www.jetem.org published by
eScholarship University of California
innovations
Clinical Practice and Cases in Emergency Medicine
l a c i M eedincrease
Open Access at www.cpcem.org
Clinical Practice and Cases in Emergency Medicine
Clinicopathological Cases from the University of Maryland 227 Seven-year-old Girl with Vomiting, Diarrhea, and Decreased Oral Intake M Girgis, K Stephanos, LJ Bontempo, TA Windsor Case Series Novel Technique in Performing Ocular Ultrasound in Trauma: A Case Series 232 H Chawang, S Bhoi, V Chandran, A Chanda, A Kumar Das VOLUME 10 ISSUE 3, August 2026
EMERGENCY MEDICINE IS THE ONLY SPECIALTY WITH ITS OWN BUDGET ALLOCATION.
238
Implementation of a Novel Agitated Behavior Score and Its Association with Code Violet Activation: A Case Series N Ceraolo, J Sandine, B Crouse, J Krizo, E Simon
Case Report The Floating Threat: A Rare Case Report of Carotid Saddle Thrombus in a Healthy Adult 243 A Droger, R Torres-Castro, K Mahmood, J Graf, S Serio, AJ Scumpia 247
Nontraumatic First Rib Fracture in a Young Weightlifter Resulting in Winged Scapula: A Case Report J Remy, N Prendergast
252
An Unusual Case of Spontaneous Pneumothorax Presenting as Right Lower Quadrant Pain: A Case Report TP Crowe, PP Cheatle
255
Fishing Hook Globe Injury Diagnosed with Point-of-care Ultrasound: A Case Report J Carter, JR Zatarain, M Zatarain, P Koscumb, K Paul, D Jehle
258
It’s A Pain in The Neck: Case Report of Bedside Diagnosis of Unilateral Neck Swelling MF Hotton, KR Roth, KL Schultz
262
Electrocardiographic Changes Related to Targeted Temperature Management in Brugada Syndrome: A Case Report Y Kondo, A Tanaka, T Okazaki Contents continued on page iii
PAGES 227-433
@CALIFORNIAACEP
www.californiaacep.org
ISSN: 2474-252X
In Collaboration with the Western Journal of Emergency Medicine
rat e
CALIFORNIA ACEP SECURED $200M ANNUALLY TO INCREASE MEDI-CAL REIMBURSEMENT FOR EMERGENCY PHYSICIANS!
Volume 10, Number 3, August 2026
A Peer-Reviewed, International Professional Journal