Western Journal of Emergency Medicine: Integrating Emergency Care with Population Health Indexed
Climate Change
490 Selected Impacts of Urban Heat Islands on Emergency Medical Services Utilization in Rhode Island
K Moretti, Y Liang, JM Nicklas, B Fox-Kemper, C DiCerbo, H Torabzadeh, CH Schmid, A Aluisio
500 Reducing Waste: Instrument Recycling in the Emergency Department
EH Chen, K Taguma, N Addo, JK Quinn
505 Creating and Maintaining a “Climate-Smart” Emergency Department: A Scoping Review of Current Progress and Future Potential
L Moujaes, K Iuliucci
512 Climate Change and Emergency Medicine: A Scoping Review Across Emergency Medicine Subspecialties
L Moujaes, K Iuliucci S Wheat
521 Implementing a Climate Health Education Curriculum for Emergency Medicine Trainees and Faculty
E Lewis, CM Smalley, M Kostura
526 Mechanisms and Intervention Strategies for Heat Stroke-Associated Myocardial Dysfunction: A Narrative Review
Y Zhuang, X-h Zhuang, X-y Zhang, D-C Wang, Y Yang
Education
534 Evidence-based Medicine Questions Logged by Emergency Medicine Residents On Shift in Relation to American Board of Emergency Medicine Content Areas
S Kudrimoti, M Needham, JR Albers, JB Brown, E Cervantes, P Sgobba, AK Varadhan,DM Yenser, BG Kane
540 National Survey of Telemedicine Curricula Among Emergency Medicine Residencies
C Reisig, D Soubannarath Gwee, W Simmons, B Tarantino, N Naik
Penn State Health Emergency Medicine
About Us: Penn State Health is a multi-hospital health system serving patients and communities across central Pennsylvania. We are the only medical facility in Pennsylvania to be accredited as a Level I pediatric trauma center and Level I adult trauma center. The system includes Penn State Health Milton S. Hershey Medical Center, Penn State Health Children’s Hospital and Penn State Cancer Institute based in Hershey, Pa.; Penn State Health Hampden Medical Center in Enola, Pa.; Penn State Health Holy Spirit Medical Center in Camp Hill, Pa.; Penn State Health Lancaster Medical Center in Lancaster, Pa.; Penn State Health St. Joseph Medical Center in Reading, Pa.; Pennsylvania Psychiatric Institute, a specialty provider of inpatient and outpatient behavioral health services, in Harrisburg, Pa.; and 2,450+ physicians and direct care providers at 225 outpatient practices. Additionally, the system jointly operates various healthcare providers, including Penn State Health Rehabilitation Hospital, Hershey Outpatient Surgery Center and Hershey Endoscopy Center.
We foster a collaborative environment rich with diversity, share a passion for patient care, and have a space for those who share our spark of innovative research interests. Our health system is expanding and we have opportunities in both academic hospital as well community hospital settings.
Benefit highlights include:
• Competitive salary with sign-on bonus
• Comprehensive benefits and retirement package
• Relocation assistance & CME allowance
• Attractive neighborhoods in scenic central Pennsylvania
Western Journal of Emergency Medicine:
Integrating Emergency Care with Population Health
Indexed in MEDLINE, PubMed, and Clarivate Web of Science, Science Citation Index Expanded
Andrew W. Phillips, MD, Associate Editor DHR Health-Edinburg, Texas
Edward Michelson, MD, Associate Editor Texas Tech University- El Paso, Texas
Dan Mayer, MD, Associate Editor Retired from Albany Medical College- Niskayuna, New York
Gayle Galletta, MD, Associate Editor University of Massachusetts Medical SchoolWorcester, Massachusetts
Yanina Purim-Shem-Tov, MD, MS, Associate Editor Rush University Medical Center-Chicago, Illinois
Section Editors
Behavioral Emergencies
Bradford Brobin, MD, MBA Chicago Medical School
Marc L. Martel, MD Hennepin County Medical Center
Ryan Ley, MD
Hennepin County Medical Center
Cardiac Care
Sam S. Torbati, MD Cedars-Sinai Medical Center
Rohit Menon, MD University of Maryland
Elif Yucebay, MD Rush University Medical Center
Mary McLean, MD
AdventHealth
Climate Change
Gary Gaddis, MD, PhD University of California, Irvine School of Medicine- Irvine, California
Clinical Practice
Casey Clements, MD, PhD Mayo Clinic
Murat Cetin, MD
Behçet Uz Child Disease and Pediatric Surgery Training and Research Hospital
Carmine Nasta, MD Università degli Studi della Campania “Luigi Vanvitelli”
David Thompson, MD University of California, San Francisco
Tom Benzoni, DO Des Moines University of Medicine and Health Sciences
Critical Care
Christopher “Kit” Tainter, MD University of California, San Diego
Joseph Shiber, MD University of Florida-College of Medicine
David Page, MD University of Alabama
Antonio Esquinas, MD, PhD, FCCP, FNIV Hospital Morales Meseguer
Mark I. Langdorf, MD, MHPE, Editor-in-Chief University of California, Irvine School of MedicineIrvine, California
Shahram Lotfipour, MD, MPH, Managing Editor University of California, Irvine School of MedicineIrvine, California
Gary Gaddis, MD, PhD, Associate Editor University of California, Irvine School of Medicine- Irvine, California
Rick A. McPheeters, DO, Associate Editor Kern Medical- Bakersfield, California
R. Gentry Wilkerson, MD, Associate Editor University of Maryland
Dell Simmons, MD Geisinger Health
Disaster Medicine
Andrew Milsten, MD, MS UMass Chan Medical Center
John Broach, MD, MPH, MBA, FACEP University of Massachusetts Medical School
Christopher Kang, MD Madigan Army Medical Center
Scott Goldstein, MD
Temple Health
Education
Danya Khoujah, MBBS University of Maryland School of Medicine
Jeffrey Druck, MD University of Colorado
Asit Misra, MD University of Miami
Cameron Hanson, MD The University of Kansas Medical Center
ED Administration, Quality, Safety
Gary Johnson, MD Upstate Medical University
Brian J. Yun, MD, MBA, MPH Harvard Medical School
Laura Walker, MD Mayo Clinic
León D. Sánchez, MD, MPH Beth Israel Deaconess Medical Center
Robert Derlet, MD
Founding Editor, California Journal of Emergency Medicine University of California, Davis
Tehreem Rehman, MD, MPH, MBA Beth Israel Deaconess Medical Center
Anthony Rosania, MD, MHA, MSHI Rutgers University
Neil Dasgupta, MD, FACEP, FAAEM Nassau University Medical Center
Emergency Medical Services
Daniel Joseph, MD Yale University
Joshua B. Gaither, MD University of Arizona, Tuscon
Brian Yun, MD, MPH, MBA, Associate Editor Boston Medical Center-Boston, Massachusetts
Michael Pulia, MD, PhD, Associate Editor University of Wisconsins Hospitals and Clinics- Madison, Wisconsin
Patrick Joseph Maher, MD, MS, Associate Editor Ichan School of Medicine at Mount Sinai- New York, New York
Donna Mendez, MD, EdD, Associate Editor University of Texas-Houston/McGovern Medical School- Houston Texas
Danya Khoujah, MBBS, Associate Editor University of Maryland School of Medicine- Baltimore, Maryland
Julian Mapp, MD University of Texas, San Antonio
Shira A. Schlesinger, MD, MPH Harbor-UCLA Medical Center
Tiffany Abramson, MD University of Southern California
Jason Pickett, MD University of Utah Health Geriatrics
Stephen Meldon, MD Cleveland Clinic
Luna Ragsdale, MD, MPH Duke University
Health Equity
Cortlyn W. Brown, MD Carolinas Medical Center
Faith Quenzer, DO, MPH Temecula Valley Hospital San Ysidro Health Center
Victor Cisneros, MD MPH Eisenhower Health
Sara Heinert, PhD, MPH Rutgers University
Naomi George, MD, MPH University of Mexico
Sarah Aly, DO Yale School of Medicine
Lauren Walter, MD University of Alabama
Infectious Disease
Elissa Schechter-Perkins, MD, MPH Boston University School of Medicine
Ioannis Koutroulis, MD, MBA, PhD George Washington University School of Medicine and Health Sciences
Stephen Liang, MD, MPHS Washington University School of Medicine
Injury Prevention
Mark Faul, PhD, MA Centers for Disease Control and Prevention
Wirachin Hoonpongsimanont, MD, MSBATS Eisenhower Medical Center
International Medicine
Heather A. Brown, MD, MPH Prisma Health Richland
Taylor Burkholder, MD, MPH Keck School of Medicine of USC
Christopher Greene, MD, MPH University of Alabama
Chris Mills, MD, MPH Santa Clara Valley Medical Center
Shada Rouhani, MD Brigham and Women’s Hospital
Legal Medicine
Melanie S. Heniff, MD, JD Indiana University School of Medicine
Statistics and Methodology
Shu B. Chan, MD, MS Resurrection Medical Center
Soheil Saadat, MD, MPH, PhD University of California, Irvine
James A. Meltzer, MD, MS Albert Einstein College of Medicine
Monica Gaddis, PhD University of Missouri, Kansas City School of Medicine
Emad Awad, PhD University of Utah Health
Musculoskeletal
Juan F. Acosta, DO, MS NYU Langone Hospital
Neurosciences
Rick Lucarelli, MD Medical City Dallas Hospital
William D. Whetstone, MD University of California, San Francisco
Antonio Siniscalchi, MD Annunziata Hospital, Cosenza, Italy
Pediatric Emergency Medicine
Muhammad Waseem, MD Lincoln Medical & Mental Health Center
Cristina M. Zeretzke-Bien, MD University of Florida
Jabeen Fayyaz, MD The Hospital for Sick Children
Reshvinder Dhillon, MD University of Southern Alabama
Kathleen Stephanos, MD University of Mississippi Medical Center
Official Journal of the California Chapter of the American College of Emergency Physicians, the American College of Osteopathic Emergency Physicians, the California Chapter of the American Academy of Emergency Medicine, and Official International Journal of the World Academic Council of Emergency Medicine (WACEM)
Available in MEDLINE, PubMed, PubMed Central, CINAHL, SCOPUS, Google Scholar, eScholarship, Melvyl, DOAJ, EBSCO, EMBASE, Medscape, HINARI, and MDLinx Emergency Med. Members of OASPA.
Quincy Tran, MD, Deputy Editor University of Maryland School of Medicine- Baltimore, Maryland World Academic Council of Emergency Medicine
Editorial and Publishing Office: WestJEM/Depatment of Emergency Medicine, UC Irvine Health, 3800 W. Chapman Ave. Suite 3200, Orange, CA 92868, USA Office: 1-714-456-6389; Email: Editor@westjem.org
Western Journal of Emergency Medicine:
Integrating Emergency Care with Population Health
Indexed in MEDLINE, PubMed, and Clarivate Web of Science, Science Citation Index Expanded
Section Editors (Continued)
Public Health
John Ashurst, DO, MSc, EdD Lehigh Valley Health Network
Tony Zitek, MD Kendall Regional Medical Center
Erik S. Anderson, MD Alameda Health System-Highland Hospital
Toxicology
Jeffrey R. Suchard, MD University of California, Irvine
Howard Greller, MD Rutgers University
Trauma
Pierre Borczuk, MD Massachusetts General Hospital/Havard Medical School
Lesley Osborn, MD University of Colorado Anschutz Medical Campus
Ultrasound
J. Matthew Fields, MD Thomas Jefferson University
Chris Baker, MD University of California, San Francisco
Shane Summers, MD Brooke Army Medical Center
Robert R. Ehrman, MD, MS Wayne State University
Ryan C. Gibbons, MD Temple Health
Robert Allen, MD Keck Medicine of USC
Women’s Health
Elisabeth Calhoun, MD, MPH Trinity Health
Marianne Haughtey, MD Zucker School of Medicne at Hofstra/Northwell
Official Journal of the California Chapter of the American College of Emergency Physicians, the American College of Osteopathic Emergency Physicians, the California Chapter of the American Academy of Emergency Medicine, and Official International Journal of the World Academic Council of Emergency Medicine (WACEM)
World Academic Council of Emergency Medicine
Available in MEDLINE, PubMed, PubMed Central, CINAHL, SCOPUS, Google Scholar, eScholarship, Melvyl, DOAJ, EBSCO, EMBASE, Medscape, HINARI, and MDLinx Emergency Med. Members of OASPA.
Editorial and Publishing Office: WestJEM/Depatment of Emergency Medicine, UC Irvine Health, 3800 W. Chapman Ave. Suite 3200, Orange, CA 92868, USA Office: 1-714-456-6389; Email: Editor@westjem.org
Western Journal of Emergency Medicine:
Integrating Emergency Care with Population Health
Indexed in MEDLINE, PubMed, and Clarivate Web of Science, Science Citation Index Expanded
Amin A. Kazzi, MD, MAAEM
The American University of Beirut, Beirut, Lebanon
Anwar Al-Awadhi, MD
Mubarak Al-Kabeer Hospital, Jabriya, Kuwait
Arif A. Cevik, MD United Arab Emirates University College of Medicine and Health Sciences, Al Ain, United Arab Emirates
Brent King, MD, MMM University of Texas, Houston
Daniel J. Dire, MD University of Texas Health Sciences Center San Antonio
David F.M. Brown, MD Massachusetts General Hospital/ Harvard Medical School
Douglas Ander, MD Emory University
Edward Michelson, MD Texas Tech University
Edward Panacek, MD, MPH University of South Alabama
Editorial Board
Hoon Chin Steven Lim, MBBS, MRCSEd Changi General Hospital
Cassandra Saucedo, MS Executive Publishing Director
Isabella Choi, BS WestJEM Publishing Director
Alyson Tsai, BS CPC-EM Publishing Director
Official Journal of the California Chapter of the American College of Emergency Physicians, the American College of Osteopathic Emergency Physicians, the California Chapter of the American Academy of Emergency Medicine, and Official International Journal of the World Academic Council of Emergency Medicine (WACEM)
June Casey, BA Copy Editor World Academic Council of Emergency Medicine
Available in MEDLINE, PubMed, PubMed Central, Europe PubMed Central, PubMed Central Canada, CINAHL, SCOPUS, Google Scholar, eScholarship, Melvyl, DOAJ, EBSCO, EMBASE, Medscape, HINARI, and MDLinx Emergency Med. Members of OASPA. Editorial and Publishing Office: WestJEM/Depatment of Emergency Medicine, UC Irvine Health, 3800 W. Chapman Ave. Suite 3200, Orange, CA 92868, USA Email: Editor@westjem.org
Western Journal of Emergency Medicine:
Integrating Emergency Care with Population Health
Indexed in MEDLINE, PubMed, and Clarivate Web of Science, Science Citation Index Expanded
JOURNAL FOCUS
Emergency medicine is a specialty which closely reflects societal challenges and consequences of public policy decisions. The emergency department specifically deals with social injustice, health and economic disparities, violence, substance abuse, and disaster preparedness and response. This journal focuses on how emergency care affects the health of the community and population, and conversely, how these societal challenges affect the composition of the patient population who seek care in the emergency department. The development of better systems to provide emergency care, including technology solutions, is critical to enhancing population health.
Table of Contents
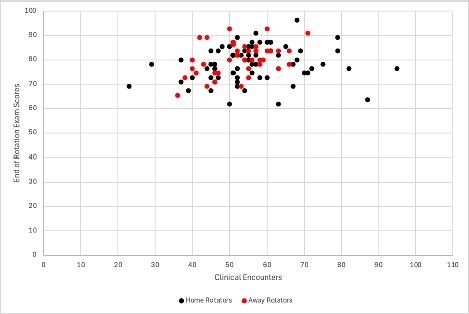
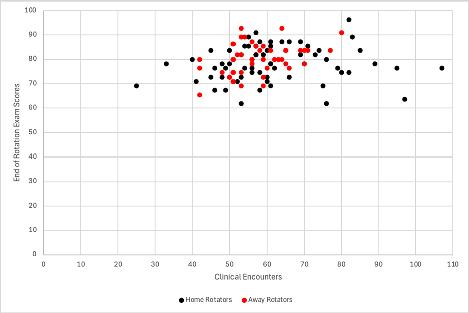
548 Relationship of Clinical Encounters to End-of-rotation Exam Scores for Fourth-year Students in Emergency Medicine
MY Jin, CM Jewell, DJ Hekman, BH Schnapp
554 Operationalizing Competency-based Medical Education Within Clinical Competency Committees
A Golden, S Dimeo, C Molins, P Kukulski, K Ray, B Schnapp, L Hopson
559 Beyond the Numbers: How Clinical Performance Metrics Impact Emergency Medicine Residents
C Burger, M Pirotte, K Ray, Joseph Sikon, Kendra Parekh
Behavioral Health
564 Perceptions of Health Effects of Electronic Cigarettes in Young Adults: Emergency Department Patients vs. Medical Students
H Smelser, C Heying, L Maguire
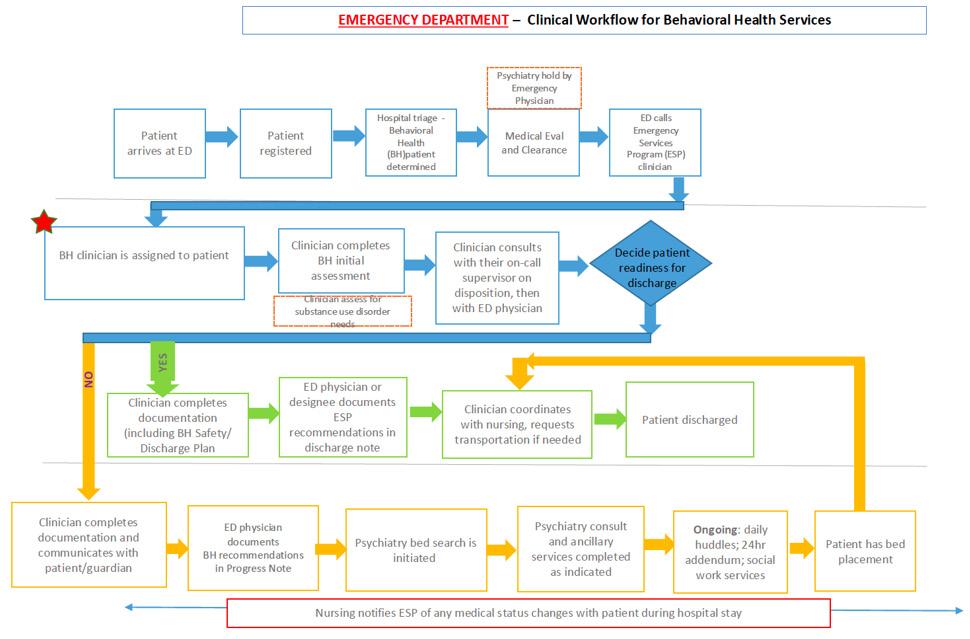
572 Emergency Department Boarding for Psychiatric Hospitalization in Older Adults: Placement Challenges and Associated Risks
VP Schulte, C Guasch, A Landerholm, D Rojas-Velasquez
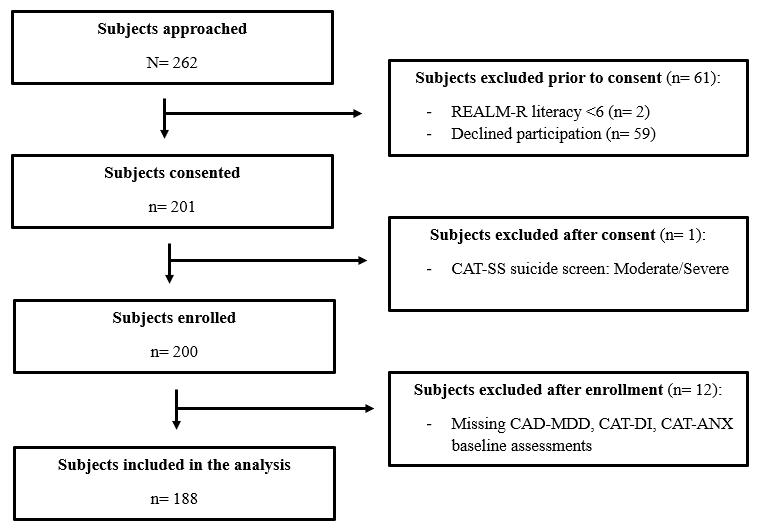
579 Prospective Assessment of Depression and Anxiety Trajectories Among Emergency Department Patients with Somatic Complaints
MJ Moukaddem, MI Lone, JA Alarcon, N Satsangi, RD Gibbons, PI Musey, DG Beiser
589 Impact of Bystander Naloxone on Emergency Medical Transport Refusal After Opioid Overdose: A Statewide Retrospective Analysis
DM Carnevale, P Canning, R Kostyun, R Kamin
Cardiology
597 Pilot Study Comparing Emergency Physician and Artificial Intelligence-supported Interpretations of Electrocardiograms
M Gün
605 Unequal Relief: Sex Disparities in Opioid Use for Cardiac Chest Pain in the Emergency Department
J Druck, D Al Kurdi, M Shubair, R Ahlat, TT Hunt-Smith, R Darwish, E Awad
614 Association of Hypertension Severity with 30-Day Major Adverse Cardiovascular Events in Patients with Intermediate High-Sensitivity Cardiac Troponin I
K Hawatian, J Emakhu, T Morton, A Husain, H Nassereddine, M Sidani, B Cook, H Klausner, J McCord, S Gunaga, S Krupp, J Miller
Policies for peer review, author instructions, conflicts of interest and human and animal subjects protections can be found online at www.westjem.com.
Western Journal of Emergency Medicine:
Integrating Emergency Care with Population Health
Indexed in MEDLINE, PubMed, and Clarivate Web of Science, Science Citation Index Expanded
Trauma
Table of Contents continued
621 Association Between Substance Use and Trauma Outcomes in Adolescents
S Sandelich, A Schuster, I Klansek, OO Olabamiji, C Marco, J Glasser, AE Zgierska
629 Documentation of Extended Focused Assessment with Sonography in Trauma (eFAST) Is Frequently Incomplete: A Prospective Observational Study
M Feuerherdt, MR Elman, B Hicks, A Sabbaj, WJ McLean, A Sreenivasan, C Gregory, K Gregory, N Schnittke
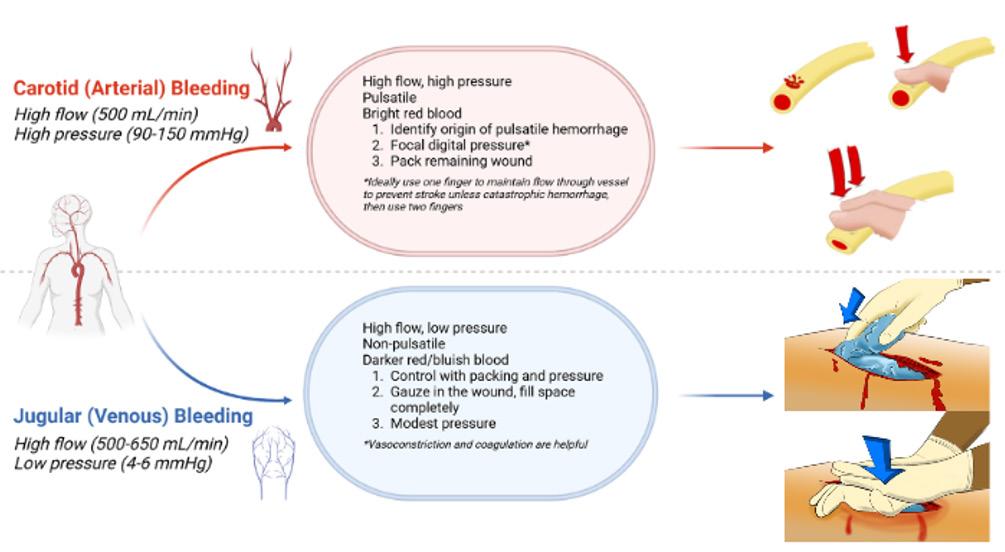
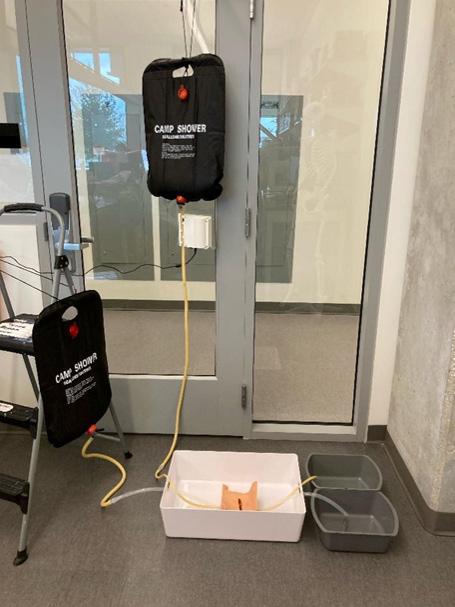
636 Pilot Simulation Task Trainer for Prehospital Management of Neck Hemorrhage
S Sussman, L Melaragno, E Nisenbaum, M Malara, R Herster, C Orban, M Marquardt, C Haring, KG Harmon, K VanKoevering
Emergency Department Operations
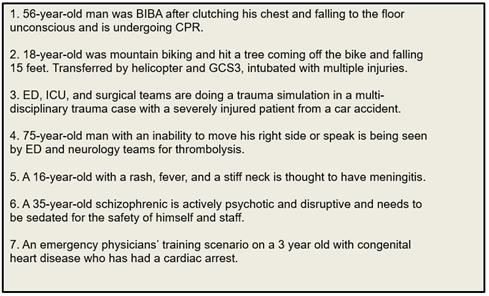
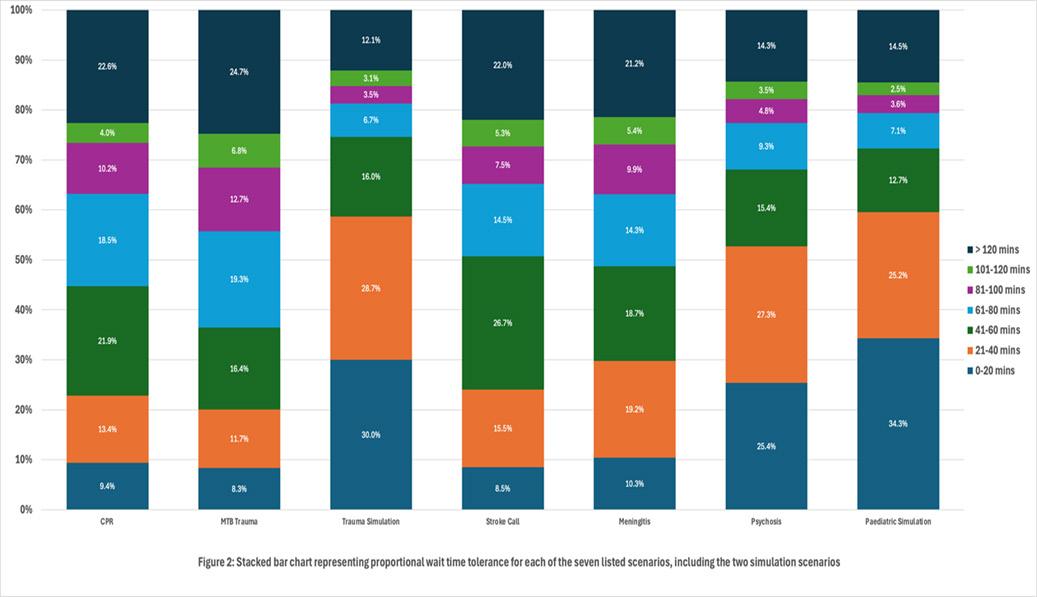
644 Worth the Wait? Comparison of Emergency Department Patients’ Waiting Room Tolerance for Real Patient Care vs Training/Simulation Scenarios
A Rogan, E Watt, S Murphy, E Wheeler, L Woods, S Galwankar, B Peckler
651 Assessment of Artificial Intelligence-based Translation Tools for Emergency Department Discharge Instructions
E Wu, C Mackey, S Jandu, JL Carey
659 Non-Opioid Pharmaceutical Alternatives for Acute Pain Management in the Emergency Department: A Scoping Review
A Shanmugam, SM Graglia, C Geier, JCC Montoy, AM Gelb, KT LeSaint
Clinical Practice
669 Length of Stay of Emergency Department Patients with Stimulant Intoxication Receiving Intravenous Fluid
KC Grimes, B Dyer, D Calkins, T Smith, H Henderson
676 Assessment of Inter-rater Variability in the Diagnosis of Urinary Tract Infections in the Emergency Department
JM Sheele, JW St. Clair IV, EJ Ziegler, MM Mohseni
684 Clinical Insights and Case Analysis of Disorders Attributed to Cicadas in the Emergency Department
M Heslin, J Frueh, M Watts, A Abdulla, A Biskis, SM Fox, E Lovell, R McKillip
Emergency Department Workforce
688 Effect of Awareness of Excessive Use of Force on the Psychological Well-being and Workplace Environment of Emergency Physicians: A Pilot Study
A Turner, T Medrano, K-D Nguyen, X Huang, R Bicette, V Eswaran, A Adesina
698 Through the Prism: Shining Light on LGBTQIA+ Applicant Identities and Influences
K Iuliucci, L Moujaes, D Rudolph, P Fredericks, B Denley, S Paskin, AS Chung, J Jordan, E Ordonez, L Smylie, S Li-Sauerwine, PL Weygandt
Emergency Medical Services
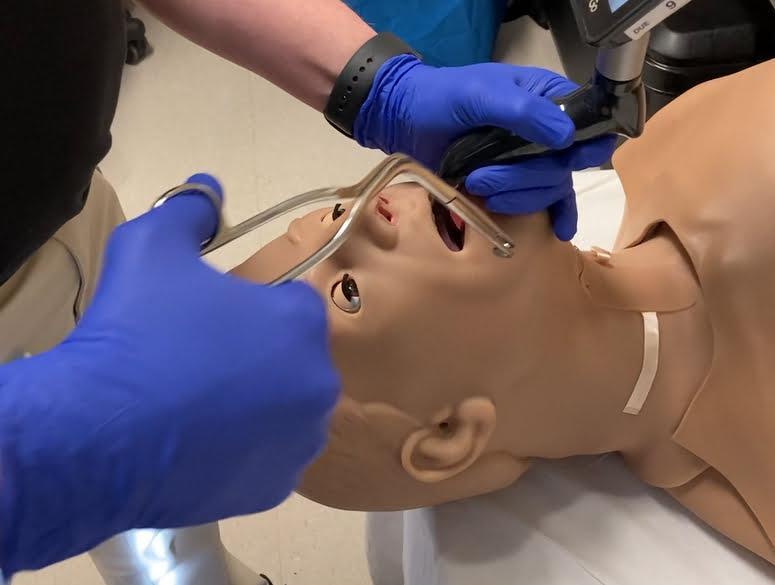
709 Determination of Optimal Magill Forceps Hand Position and Laryngoscope Type to Remove a Simulated Foreign Body Airway Obstruction
M Berkenbush, C Thomas, M Mysh, J Rutledge, R Dwyer III, S Kansky
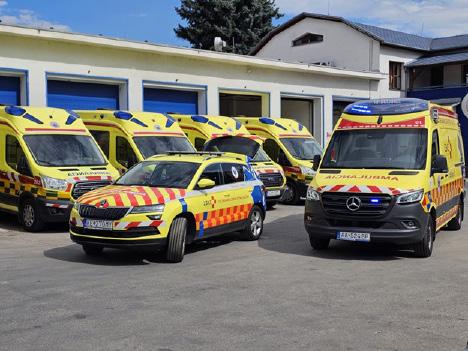
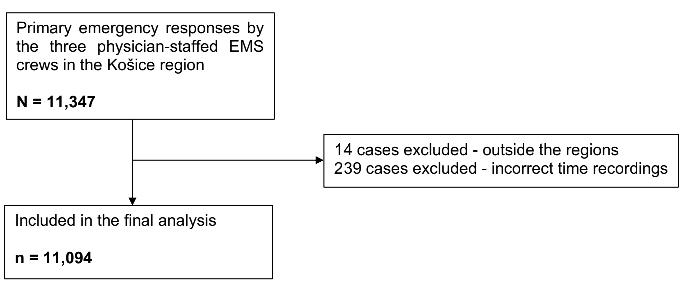
704 Physician-staffed Ambulance Deployment: Comparative Response Time Analysis from a Slovak Pilot Project
M Sedlak, T Petras, I Berta, G Ivanov, J Karas
Western Journal of Emergency Medicine:
Integrating Emergency Care with Population Health
Indexed in MEDLINE, PubMed, and Clarivate Web of Science, Science Citation Index Expanded
Table of Contents continued
Women’s Health
725 Contraception in the ED: Understanding Education and Opportunities for Clinicians to Advise Patients
HB Lewis, TR McCarthy, D Kass, JL Kahoud
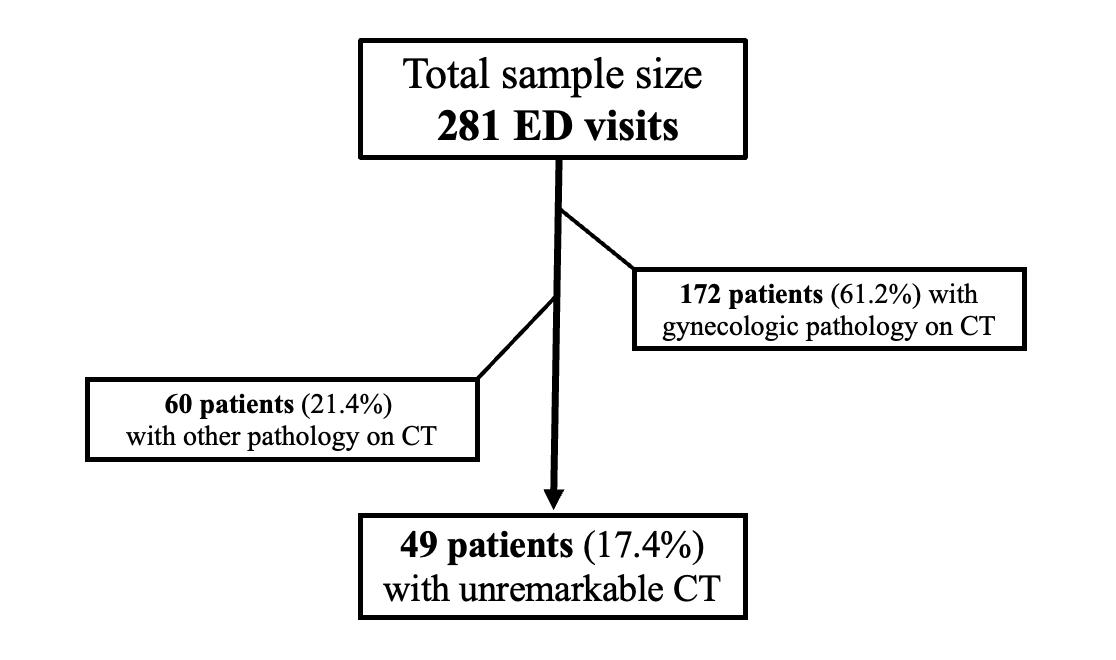
731 Utility of Pelvic Ultrasound with Negative Computed Tomography in Adult Females
M Rometti, A Esposito, M Mirza, S Heinert, C Bryczkowski
Technology in Emergency Medicine
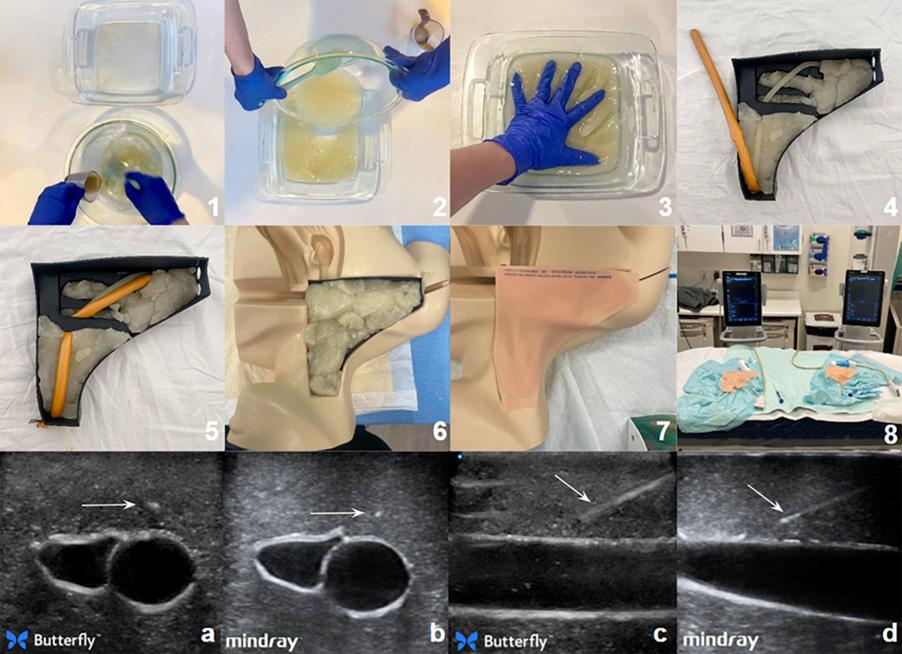
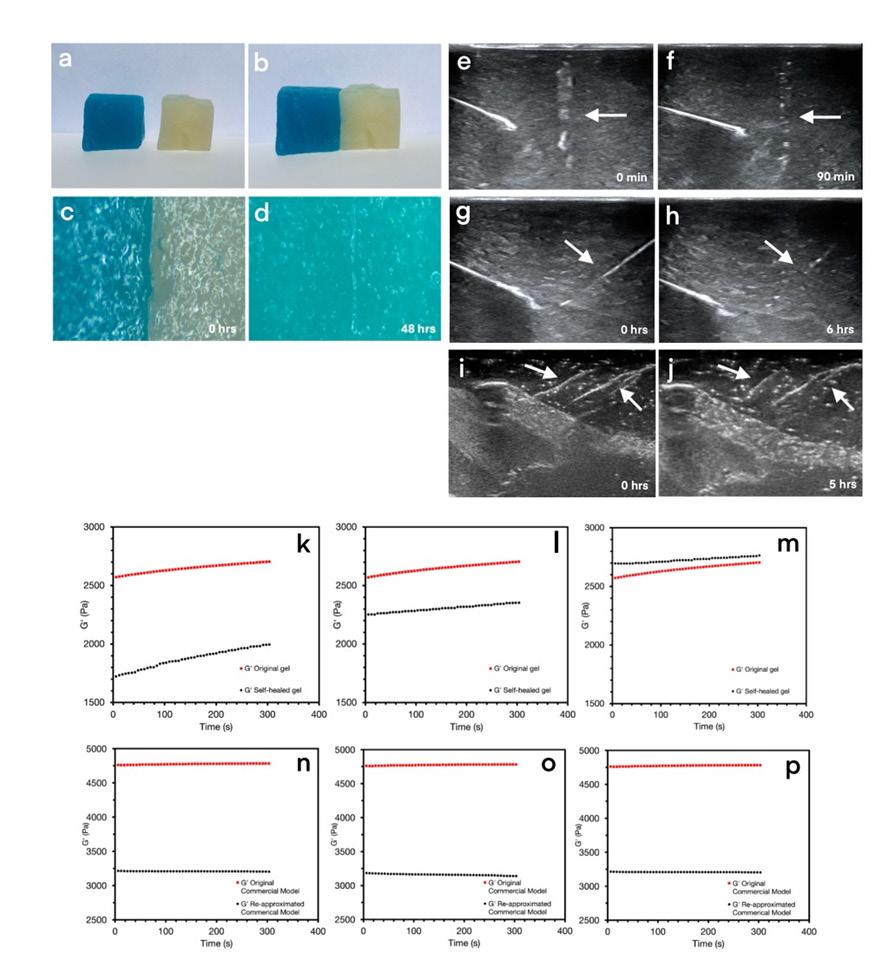
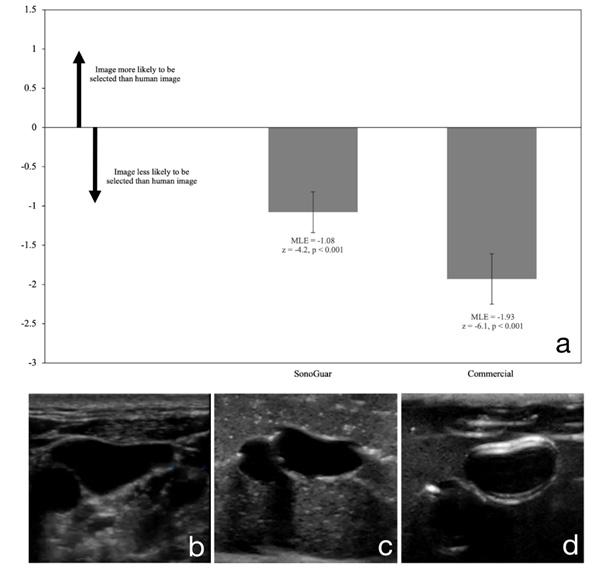
735 SonoGuar: A Self-healing Hydrogel for Higher Fidelity Ultrasound-guided Procedure Training
A Bikkani, F Pudewa, B Gabriel, S Kim, E Chang, S Chai, S Immadisetty, X Liu, A Crouch, S Johnson, J Mistry
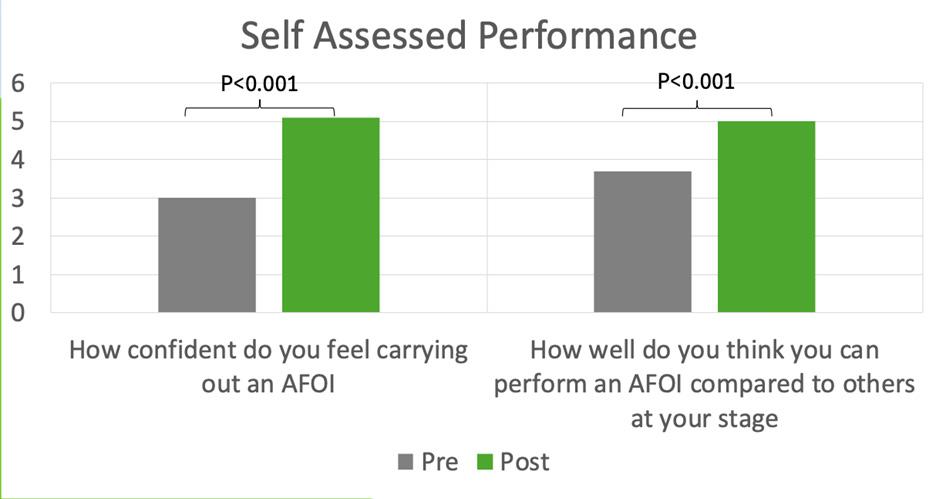
745 Novel Simulation-based Awake Fiberoptic Intubation Curriculum: Pilot Study
D Haas, J Fredette, KA Murphy, A Deitchman, J Anderson, M Blodgett
Musculoskeletal
753
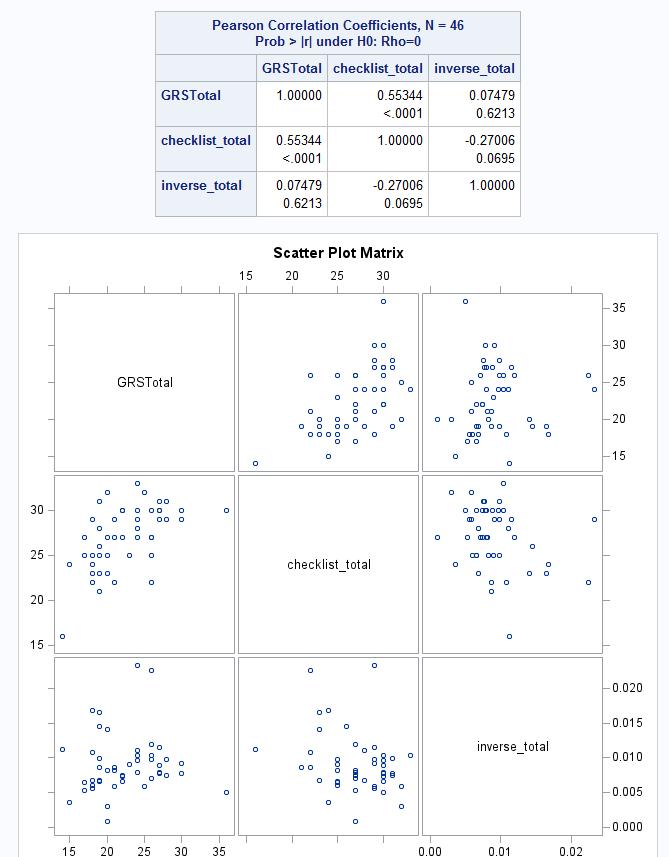
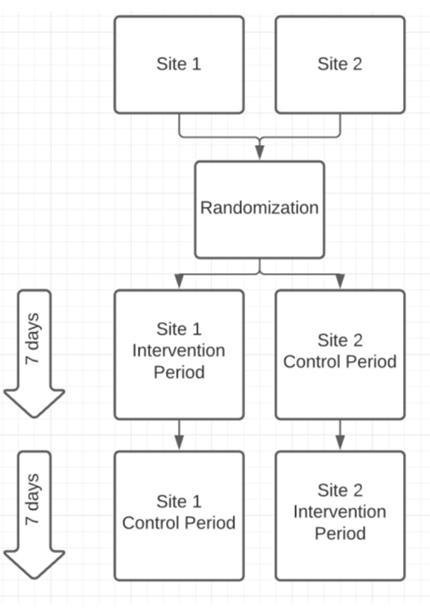
Randomized Controlled Pilot Study of Transcutaneous Electrical Nerve Stimulation for Acute Back Pain in Emergency Department Patients
M Moor-Smith, N Kozak, M McCue, J Wilson, T Jones, S Brophy
Infectious Disease
759 XGBoost (eXtreme Gradient Boosting) Can Predict Organisms Growing in Urine Culture from the Emergency Department
JM Sheele, RL Campbell, DD Jones
Critical Care
766 Outcomes of Succinylcholine and Rocuronium for Rapid Sequence Intubation in the Emergency Department
DH O’Connell, J Yeager, RA Abrams, JR Zatarain, KK Paul, RR Goswami, K Hill, LR Farmer, J Jayes, DVK Jehle
Endemic Infections
775 HIV and Syphilis Testing Among Patients Tested for Gonorrhea and Chlamydia in Emergency Departments
K Sherwood, N Zhang, H David, A Dekker, O Garner, E Samuels, P Adamson
Injury Prevention
784
Clinician-documented Firearm Access and Safety Interventions for Veterans Receiving Suicide Risk Evaluation in VA Emergency Care Settings
JA Simonetti, SE King, R Holliday, GK Khazanov, A Smith, N Bahraini, LA Brenner, BB Matarazzo
Pediatrics
794 Child Opportunity Index Levels and Disparities in Access to Pediatric-ready Emergency Departments
ME Bernardin, P Schuler, E Morales, E Kendrick, D Zoellner, T Staed
Neurology
804 Early Recognition and Referral of Acute Stroke in Primary and Emergency Care: A Systematic Review
Thamer Majed Almunif, AF Alkaabba, KW Alomran, AM Alanazi, FN Alharbi, SS Alshahrani, NM Alsaeed, RA Alabdulkader, SA Alibraheem, KS Alzahrani, MH Albagieh
Toxicology
819 Therapeutic Interventions in Organophosphate Poisoning: An Umbrella Review of Systematic Reviews
V Chauhan, D Goyal, S Thakur, S Galwankar, TR Peredy
Western Journal of Emergency Medicine:
Integrating Emergency Care with Population Health
Indexed in MEDLINE, PubMed, and Clarivate Web of Science, Science Citation Index Expanded
Letters to the Editor
831
833
Table of Contents continued
Methodological Considerations on the Randomized Trial of Self-Selected Music for Musculoskeletal Back Pain in the Emergency Department
ün Kara, G Özlü
Comments: Fellowship Training After Four-year Emergency Medicine Residency
MR Ehmann, EY Klein, GD Kelen
835 Reply: Fellowship Training After Four-Year Emergency Medicine Residency
RJ Hamilton, LB Becker, RE Wolfe
Fall 2024 American College of Osteopathic Emergency Medicine (ACOEP) FOEM Competition Abstracts
The Foundation for Osteopathic Emergency Medicine (FOEM) is dedicated to advancing patientcentered, holistic emergency care through support of medical education and clinical research. In partnership with the American College of Osteopathic Emergency Physicians (ACOEP), FOEM sponsors annual research competitions that showcase scholarly innovation and clinical advancement within the specialty. Highlighting impactful contributions that advance the science and practice of osteopathic emergency medicine, this issue of WestJEM features selected FOEM supported research presented at the 2024 ACOEP Fall Scientific Assembly.
John Ashurst DO, EdD, MS President Foundation for Osteopathic Emergency Medicine
Abstracts
837 Physician Wellness and Burnout from Electronic Medical Record and Administrative Tasks
H Choudry, W Adams, JM Dziedzic
838 Changes in THC Positivity Rates in Adolescents Corresponding to Legalization of Recreational Marijuana in Illinois
E Gassé, A Brill
840 Consequences of the 2022 Intravenous Contrast Shortage on Emergency Department Care: A Retrospective Study
S Bellew, L Tjiattas-Saleski, D Butz, M Stallard, M Galush, N Hudepohl, M Ramsay, S Avanzato, C Hrysikos, R Seay
841 Curb to Needle Time: A Five-Year Descriptive Analysis Evaluating a Mobile Stroke Unit in a Suburban EMS System
E Wetzel, Z Weisner, M Ulhaq, M Kening, A Wang, G Wydro
Western Journal of Emergency Medicine:
This open access publication would not be possible without the generous and continual financial support of our society sponsors, department and chapter subscribers.
Professional Society Sponsors
American College of Osteopathic Emergency Physicians
California American College of Emergency Physicians
Academic
Department of Emergency Medicine Subscriber
Alameda Health System-Highland Hospital Oakland, CA
Ascension Resurrection Chicago, IL
Atrium Health Wake Forest Baptist Winston-Salem, NC
Baylor College of Medicine Houson, TX
Baystate Medical Center Springfield, MA
Beth Israel Deaconess Medical Center Boston, MA
Brigham and Women’s Hospital Boston, MA
Brown University Providence, RI
Capital Health Regional Medical Center Trenton, NJ
Carilion Clinica-Virginia Tech Carilion School of Medicine Roanoke, VA
Carolinas Medical Center Charlotte, NC
Cedars-Sinai Medical Center Los Angeles. CA
Cleveland Clinic Cleveland, OH
Corewell Health William Beaumont University Hospital Los Angeles, CA
Denver Health Medical Center Denver, CO
Desert Regional Medical Center
Palm Springs, CA
Detroit Medical Center/Wayne State University Detroit, MI
Duke University Hospital Durham, NC
Eisenhower Health
Rancho Mirage, CA
Emory University Atlanta, GA
Florida International University of Herbert Westchester, FL
Franciscan Health Olympia Fields
Olympia Fields, IL
Geisinger Health System Danville, PA
State Chapter Subscriber
Arizona Chapter Division of the American Academy of Emergency Medicine
California Chapter Division of the American Academy of Emergency Medicine
Florida Chapter Division of the American Academy of Emergency Medicine
International Society Partners
George Washing University Washington, DC
HealthPartners - Regions Hospital St Paul, MN
Hennepin County Medical Center Minneapolis, MN
Henry Ford Hospital Detroit, MI
Henry Ford Wyandotte Hospital Wyandotte, MI
INTEGRIS Health
Oklahoma City, OK
Kaweah Delta Health Care District Visalia, CA
Kern Medical Bakersfield, CA
Lehigh Valley Hospital and Health Network Allentown, PA
Loma Linda University Medical Center (Adult)
Loma Linda, CA
Loma Linda University Medical Center (Peds) Loma Linda, CA
Louisiana State University Shreveport Shreveport, LA
Loyola University Medical Center
Cook County, IL
Maimonides Medical Center
Brooklyn, NY
Massachusetts General Hospital Boston, MA
Mayo Clinic College of Medicine Rochester Rochester, MN
Mayo Clinic College in Arizona Phoenix, AZ
Mayo Clinic College in Florida Jacksonville, FL
Medical College of Wisconsin Affiliated Hospitals Milwaukee, WI
Morristown Medical Center Morristown, NJ
Mount Sinai Medical Center Miami Beach Miami Beach, FL
Mount Sinai Morningside (West) New York, NY
New York - Presbyterian Queens Queens, NY
Niagara Health - South Niagara Group Niagara Falls, ON
Emergency Medicine
To become a WestJEM departmental sponsor, waive article processing fee, receive electronic
please go to http://westjem.com/subscribe or contact:
Stephanie Burmeister
WestJEM Staff Liaison
Phone: 1-800-884-2236
Email: sales@westjem.org
North Shore University Hospital Manhasset, NY
California Chapter Division of American Academy of Emergency Medicine
Northwestern University Feinberg School of Medicine
Chicago, IL
NYU Langone Health - Bellevue Hospital New York, NY
Ohio State University Wexner Medical Center Columbus, oH
Oregon Health and Science University Portland, OR
Orlando College of Osteopathic Medicine Orlando, FL
Penn State Milton S. Hershey Medical Center Hershey, PA
Riverside Regional Medical Center Newport News, VA
Rutgers Robert Wood Johnson Medical School New Brunswick, NJ
Saint Louis University School of Medicine St Louis, MO
Sarasota Memorial Hospital Sarasota, FL
Seattle Children’s Hospital Seattle, WA
Southern Illinois University School of Medicine Springfield, IL
Summa Health System Akron, OH
SUNY Upstate Medical University Syracuse, NY
Swedish Hospital Part of NorthShore Chicago, IL
Temple University Philadelphia, PA
Texas Tech University Health Sciences Center El Paso, TX
The University of Texas Medical Branch Galveston, TX
Thomas Jefferson University Philadelphia, PA
Trinity Health Muskegon Hospital Muskegon, MI
UMass Memorial Health Worcester, MA
University Services University of the Health Sciences Bethesda, MD
University of Alabama Medical Center
Birmingham, AL
University of Alberta Edmonton, AB
University of Arizona College of MedicineTuscon Tucson, AZ
University of California, Davis Medical Center
Sacramento, CA
University of California, San Francisco Fresno Fresno, CA
University of California, San Francisco General Hospital San Francisco, CA
University of Chicago, Chicago, IL
University of Florida, Jacksonville Jacksonville, FL
University of Illinois at Chicago Chicago, IL
University of Iowa Hospitals and Clinics Iowa City, IA
University of Kansas Health System Kansas City, KS
University of Louisville Louisville, KY
University of Maryland School of Medicine Baltimore, MD
University of Michigan Ann Arbor, MI
University of Missouri Columbia Columbia, MO
University of Nebraska Lincoln, NE
University of North Dakota School of Medicine and Health Sciences Grand Forks, ND
University of Ottawa Ottawa, ON
University of Pennsylvania Health System Philadelphia, PA
University of South Alabama Mobile, AL
University of South Florida Tampa, FL
University of Southern California - Los Angeles General Medical Center Los Angeles, CA
Western Journal of Emergency Medicine:
Integrating Emergency Care with Population Health
Indexed in MEDLINE, PubMed, and Clarivate Web of Science, Science Citation Index Expanded
This open access publication would not be possible without the generous and continual financial support of our society sponsors, department and chapter subscribers.
Academic Department of Emergency Medicine Subscriber (Continued)
University of Tennessee Knoxville, TN
University of Utah School of Medicine
Salt Lake City, UT
University of Vermont Medical Center Burlington, VT
University of Washington - Harborview Medical Center Seattle, WA
University of Wisconsin Hospitals and Clinics Madison, WI
Valleywise Health Medical Center Phoenix, AZ
Valleywise Health Medical CenterPediatrics Phoenix, AZ
Wellspan York Hospital York, PA
State Chapter Subscriber
Arizona Chapter Division of the American Academy of Emergency Medicine
California Chapter Division of the American Academy of Emergency Medicine
Florida Chapter Division of the American Academy of Emergency Medicine Great Lakes Chapter Division of the
International Society Partners
Emergency Medicine Association of Turkey
Lebanese Academy of Emergency Medicine
Mediterranean Academy of Emergency Medicine
Wright State University Boonshoft School of Medicine Dayton, OH
Yale School of Medicine New Haven, CT
Virginia
To become a WestJEM departmental sponsor, waive article processing fee, receive electronic copies for all faculty and residents, and free CME and faculty/fellow position advertisement space, please go to http://westjem.com/subscribe or contact:
Stephanie Burmeister
WestJEM Staff Liaison
Phone: 1-800-884-2236
Email: sales@westjem.org
of Emergency
Sociedad
The University of California Irvine Department of Emergency Medicine, sponsored by the Western Journal of Emergency Medicine, is planning the following conference:
SafeFutures 2027: International Conference on Evidence-Based Injury Prevention and Safety
When: March 3-5, 2027
Where: Irvine, California USA Center for Trauma and Injury Prevention Research and the Department of Emergency Medicine
Selected Impacts of Urban Heat Islands on Emergency Medical Services Utilization in Rhode Island
Katelyn Moretti, MD, MS*
Yiwen Liang, MS†
John Matthew Nicklas, BSc‡
Baylor Fox-Kemper, PhD‡
Authors continued at end of article
Section Editor: Gary Gaddis, MD, PhD
Warren Alpert Medical School of Brown University, Department of Emergency Medicine, Providence, Rhode Island
The University of Hong Kong, LKS Faculty of Medicine, School of Public Health, Hong Kong SAR, China
Submission history: Submitted August 18, 2025; Revision received December 8, 2025; Accepted December 15, 2025
Electronically published April 14, 2026
Full text available through open access at http://escholarship.org/uc/uciem_westjem DOI 10.5811/westjem.50699
Introduction: Excessive environmental heat exposure is clearly associated with an increased likelihood that individual patients will suffer adverse health outcomes. Such heat exposure also strains healthcare systems via increased utilization, a burden which can challenge systems’ capacities. Health impacts vary geographically with urban heat islands potentially contributing to higher temperatures and greater health risks. However, those most vulnerable to this exposure are not well identified. Our objective in this novel study was to compare and quantify differences in emergency medical services (EMS) use by selected patients during hot days in Rhode Island. Patients were recruited from low socioeconomic residential locations, stratified by whether they accessed EMS from within one of the state’s “urban heat islands,” or from other locations without “heat island” effects. We also compared selected patient demographic characteristics, and other EMS run data, between events associated with EMS access from these two types of areas.
Methods: This retrospective, cross-sectional cohort study evaluated how the probability of an EMS encounter varied in response to daily mean temperature and the urban heat island status of the encounter location. We aggregated EMS dispatch data, daily mean temperature, urban heat island classification and the Area Deprivation Index of the encounter location. A quasi-Poisson regression model assessed the relationship between EMS encounter frequency and potential risk factors including daily temperature, urban heat island status, year, day of the week, sex, age, and relevant interaction terms. The model was restricted to low socioeconomic, residential encounter locations to reduce confounding (noted elsewhere by year) and focus on the target population. The primary outcome was the rate ratio (RR) of EMS encounters for urban heat island locations vs locations without an urban heat island effect, in response to summer temperatures. Secondary outcomes included RRs of EMS encounters stratified by age, sex, weekday vs weekend, and year.
Results: Higher temperatures were associated with increased EMS call rates across all demographic subgroups. A 5 °F (2.8 °C) increase in mean daily temperature was associated with an increase in an overall EMS encounter rate of 1.5% (RR, 1.015; 95% CI, 1.005-1.031, P = .004). On a weekday in 2021, at 75 °F degrees, 68 EMS encounters would be predicted for the residential, low socioeconomic status locations in the state while at 95 °F, 73 EMS encounters would be expected. The EMS rates were consistently higher in urban heat islands across all study years, after accounting for daily temperature, year, day of the week, demographic characteristics, population size and interactions between age, sex, urban heat island and weekday vs weekend. The largest relative increase in EMS encounters was observed in 2019, with rates 34% higher in urban heat islands compared to locations without an urban heat island effect (RR, 1.34; 95% CI, 1.27-1.42). The smallest increase occurred in 2020 (RR, 1.12; 95% CI, 1.06-1.18).
Conclusion: In residential and low socioeconomic locations, living in an urban heat island increased the probability of an EMS encounter, highlighting potential compounding effects of social and environmental vulnerability. As climate change intensifies extreme heat events, locationally targeted interventions may be critical in reducing heat-related health impacts. [West J Emerg Med. 2026;27(3)490–500.]
INTRODUCTION
Hot weather negatively impacts humans through a variety of pathophysiological mechanisms, but not all are affected equally.1-5 First, the adverse effects of heat on health are not geographically uniform. Urban heat islands (UHI) occur because built environments (eg, parking lots, large buildings) result in hotter than average surface temperatures and contribute to intra-city temperature differences.6-10 People living in UHIs are especially susceptible to heat and heatwaves with increased hospitalizations and mortality.11-15 In Boston, Massachusetts, streets with a higher land surface temperature were more likely than cooler streets to be the sites of medical emergencies during heat advisories relative to the rate of medical emergencies during non-heat advisory periods.16
Second, patient characteristics increase risk. Older adults are particularly susceptible secondary to chronic health conditions, limited mobility, and social isolation.17-19 Individuals with lower socioeconomic status or marginalized populations face increased heat risks due to poor housing conditions, lack of air conditioning, and extended outdoor working hours. In over 96% of the largest United States (U.S.) urban areas, persons of color are more likely to live in neighborhoods with higher heat intensity than non-Hispanic White residents.20-21
Rhode Island is the fastest warming state in the contiguous U.S., having warmed 3.1 °F (1.7 °C) since 1900.22 These rising summer temperatures have been linked to more frequent emergency medical service (EMS) encounters23 and increased emergency department (ED) use in the state.24 However, prior studies have not accounted for the UHI effect or the effects of patient-level variables such as age or socioeconomic status.
In this study we assessed the impacts of summer temperature variability (between June and August of 2018–2021) on EMS utilization in Rhode Island by comparing UHI and non-UHI locations, while accounting for patient age and socioeconomic status. Understanding and anticipating fluctuations in EMS demand provides an important opportunity to strengthen preparedness and enhance climatechange adaptation within the emergency care system as summer temperatures rise. Moreover, quantifying the morbidity associated with UHIs can guide decision makers and urban planners in directing mitigation and cooling interventions toward the communities most affected.
METHODS Location
Rhode Island is the smallest U.S. state by area, covering a little over 1,000 square miles, with a population of just over 1 million residents.25 The state includes a mix of dense urban centers, suburban neighborhoods, and rural areas. Most of the population resides in and around the Providence metropolitan area, where many UHIs exist.26
Database Formation
We constructed an integrated dataset by merging six
Population Health Research Capsule
What do we already know about this issue? Hot weather increases illness and emergency care use, with urban heat islands (UHI) and social vulnerability amplifying heat-related hospitalizations.
What was the research question? How do UHIs affect summer emergency medical services (EMS) use in low socioeconomic status residential areas of Rhode Island?
What was the major finding of the study? EMS use was up to 34% higher in UHI than in non-UHI locations (RR, 1.34; 95% CI, 1.27-1.42).
How does this improve population health? By identifying heat-vulnerable communities, these findings support targeted interventions to reduce EMS demand and heat-related illness as temperatures rise.
distinct data sources: EMS utilization records; daily temperature data; urban heat severity indices; socioeconomic status metrics; census demographics; and building type classifications. These were linked using geospatial and administrative identifiers such as date, address, 9-digit ZIP code, and the 12-digit Federal Information Processing Series (FIPS) code (Supplemental Table 1). Eligible encounters were those occurring between June and August of 2018–2021 and for which the recorded location could be successfully linked to an UHI index.
EMS Utilization
We obtained EMS data from the Rhode Island National Emergency Medical Services Information System (NEMSIS) v3, maintained by the Center for Emergency Medical Services within the Rhode Island Department of Health. This dataset contains patient-level records of EMS encounters, including demographics and location of EMS contact.
Temperature Data
Daily minimum, maximum, and mean temperatures were retrieved from the National Centers for Environmental Information of the National Oceanic and Atmospheric Administration (NOAA), using readings from the weather station at Theodore Francis Green State Airport (now Rhode Island TF Green International) in Warwick, Rhode Island.
Moretti
Impacts of Urban Heat Islands on EMS Use
Urban Heat Island Severity
We measured UHI severity using raster data (grid-based spatial datasets) from the Trust for Public Land’s ParkServe map. This dataset, with a 30-meter spatial resolution, was developed from Landsat 8 Band 10 imagery obtained via the National Aeronautics and Space Administration and NOAA. We used Landsat data from 2018 were used to generate this raster map for 2018–2019 and applied updated 2020 Landsat data to 2020–2021. This dataset provided the urban heat severity relative to the surrounding area categorized on a scale from 0-5 using the Jenks Natural Breaks classification method.27 A value of 0 indicates a location at or below the mean city temperature (non-heat island), while a score of 5 represents severe heat exposure (8-12 °F or 4-7 °C above the mean). The temperature ranges associated with each index score are presented in Supplemental Table 2. The ParkServe UHI layer has been used in prior UHI analyses and cited in public-health and urban forestry studies as a standardized, nationally consistent urban heat indicator.28,29
Socioeconomic Status
We assessed socioeconomic status at the encounter location using the 2021 Area Deprivation Index (ADI v4.0.1), developed by the Health Resources and Services Administration.30 The ADI provides decile rankings (1-10) of census block groups, where 1 indicates the least deprived and 10 the most deprived, based on composite measures of income, education, employment, and housing quality.
Population Demographics
Age- and sex-specific population estimates for each census block group were obtained from the 2020 U.S. Census. These data were linked to EMS encounters using the 12-digit FIPS code.31
Residential Classification
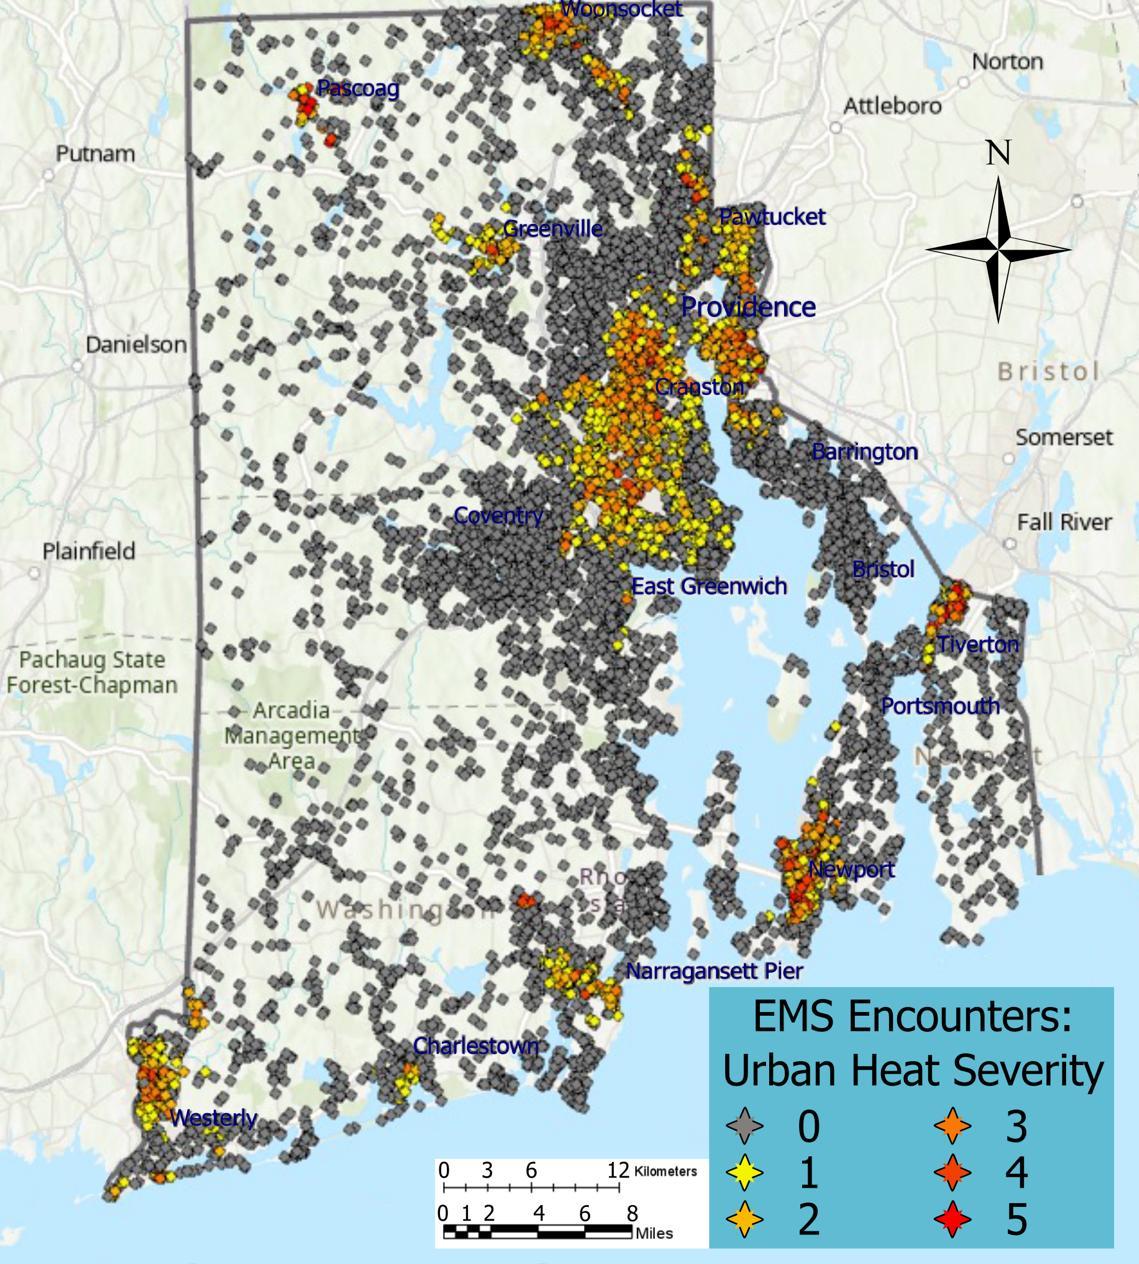
Each encounter location was classified as residential (house, residential, duplex, apartment) or non-residential (commercial, industrial, government, educational) using data from the Rhode Island E-911 database.32 Linkage of the UHI classification to EMS encounter address via ArcGIS PRO (Environmental Research Services Institute, Redlands, CA)33 obtained an 85% success rate with only match scores > 40 accepted. Of all matches, 95% had a match score ≥ 80. Non-matches were all secondary to incomplete addresses. Non-matched encounters were manually reviewed, and the match rate was increased to 94% (Figure 1).
Ethics Approval and Reporting Standards
We obtained institutional review board (IRB) approval from the Rhode Island Department of Health for access to patientlevel data from the NEMSIS database (IRB 2020-08). Patient information was collected via standardized forms completed by EMS personnel for each encounter. All other datasets used in this analysis were publicly available and did not contain identifiable
Figure 1. Locations in which emergency medical services were linked to urban heat severity classifications. Gray dots represent encounter locations without urban heat effect, Colored dots represent encounters categorized by urban heat index, ranging from 1 (yellow; lowest severity) to 5 (red; highest severity). EMS, emergency medical services.
patient information. This study was conducted and reported in accordance with the Strengthening the Reporting of Observational Studies in Epidemiology guidelines.
Variable Characterization
The final analytic dataset included the date of EMS encounter, patient demographics (age and sex), encounter location (including full address, 9-digit ZIP code, and FIPS code), UHI index at the encounter location, residential status, and the ADI score. To assess potential bias, we compared encounters excluded for insufficient data with the final analytic cohort using t-tests or chi-square tests.
The decision to dichotomize both UHI status (present vs absent) and ADI scores was based on both conceptual considerations and practical limitations identified during exploratory analyses. First, EMS encounters demonstrated a clear distributional shift at the boundary between urban heat severity = 0 and urban heat severity ≥ 1. In areas with an urban heat severity score of 0, most EMS runs originated from census block groups with ADI < 7, whereas in areas with any degree of urban heat severity (≥ 1), most encounters came from areas with ADI ≥ 7 (Supplemental Table 3). This suggested that the presence of any UHI exposure—not necessarily its graded
severity—aligned with a meaningful sociodemographic shift in encounter patterns. In addition, the middle categories (ADI 4-6) did not form a stable or interpretable “medium” socioeconomic status group in our data; rather, they aligned more closely with the low-deprivation cluster (ADI 1-3).
Second, the frequency of EMS encounters within higher UHI categories was low. Only 15% of encounters originated from UHI levels ≥ 2, and UHI level 5 accounted for approximately one mean daily encounter. These sparse strata substantially limited statistical power and risked unstable estimates if modeled across the full five-level UHI scale as defined by the Trust for Public Land’s ParkServe map. Given these distributional constraints and the lack of sufficient events to support a multilevel approach, we selected dichotomization to preserve model stability and interpretability. Accordingly, we categorized UHI severity as non-UHI (urban heat severity = 0) and UHI present (urban heat severity ≥ 1) at the encounter location, with the latter encompassing all non-zero urban heat severity levels (Supplemental Table 2).
Socioeconomic status was similarly dichotomized into high (ADI < 7) and low (ADI ≥ 7).
We dichotomized age as < 65 vs. ≥ 65 years, based on established evidence of increased heat vulnerability among older adults.20,34-36 Day of the week was classified as weekday vs weekend to account for known variations in EMS utilization.36,37 Encounter locations were classified as residential (e.g., house, duplex, apartment) or non-residential (e.g., commercial, industrial, government, educational settings). We compared cohort characteristics, including year, age group, and sex, stratified by urban heat severity and ADI scores, using Pearson’s chi-squared tests. Mean age and the proportion of residential encounters were also compared across these categories using t-tests.
Model Development
We developed a quasi-Poisson regression model to determine the factors associated with the daily count of EMS encounters across Rhode Island. The model included patientlevel covariates for age and sex (male vs female), and geographic covariate presence of an UHI at the encounter location. Temporal variables included year and day of the week, with the latter categorized as weekend vs weekday. Temperature exposure was modeled as the daily mean temperature, consistent with prior studies demonstrating comparable associations across mean, maximum, and minimum temperature metrics in Rhode Island.23 Lagged temperature exposures (up to five days) were evaluated but not found to be significant and were, therefore, excluded from the final model. We included a log-transformed population offset to account for varying population sizes across census blocks. The model evaluated all possible interactions. Those interactions found significant were included to assess potential effect modification across time and demographic subgroups. Final analyses were restricted to encounter locations
Impacts of Urban Heat Islands on EMS Use
designated as residential and low socioeconomic status for several reasons. First, preliminary analyses revealed that confounding by year was present in non-residential, high socioeconomic status areas (Supplemental Figure 1). Second, individuals with high socioeconomic status are less vulnerable to environmental heat exposure.17-18 Additionally, it was reasoned that non-residential areas were most affected by COVID-19,38 did not represent prolonged exposures (eg, short errands), and were primarily characterized by indoor environments such as offices, airports, and shopping centers. Therefore, to reduce confounding and focus on the primary residential population of interest, we excluded EMS encounters from non-residential or high socioeconomic status locations.
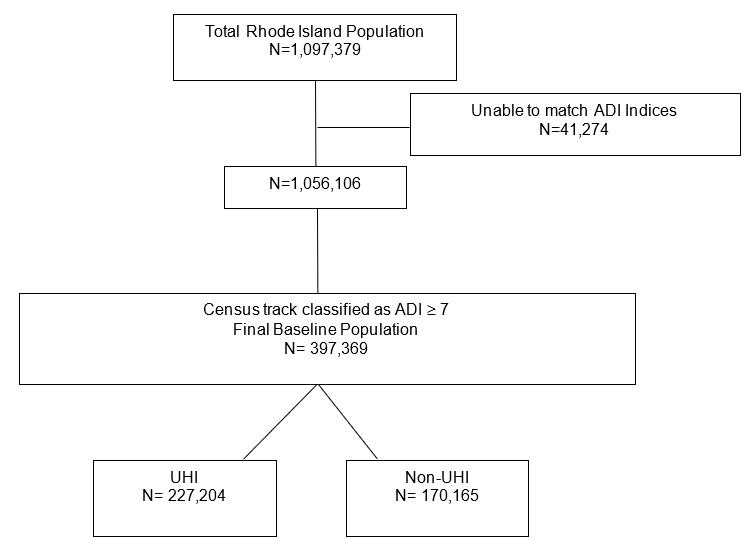
To estimate the at-risk population living within UHIs in Rhode Island, we spatially joined 2020 census blocks with the 2021 UHI severity map. A census block was classified as located within an UHI if its centroid fell inside a designated heat island area. The populations of all low socioeconomic status blocks meeting UHI criteria were summed (Figure 3). Additionally, the population ≥ 65 of age within these blocks was aggregated by sex to enable age-sex stratified analysis.
RESULTS
Characteristics of Emergency Medical Services Encounters
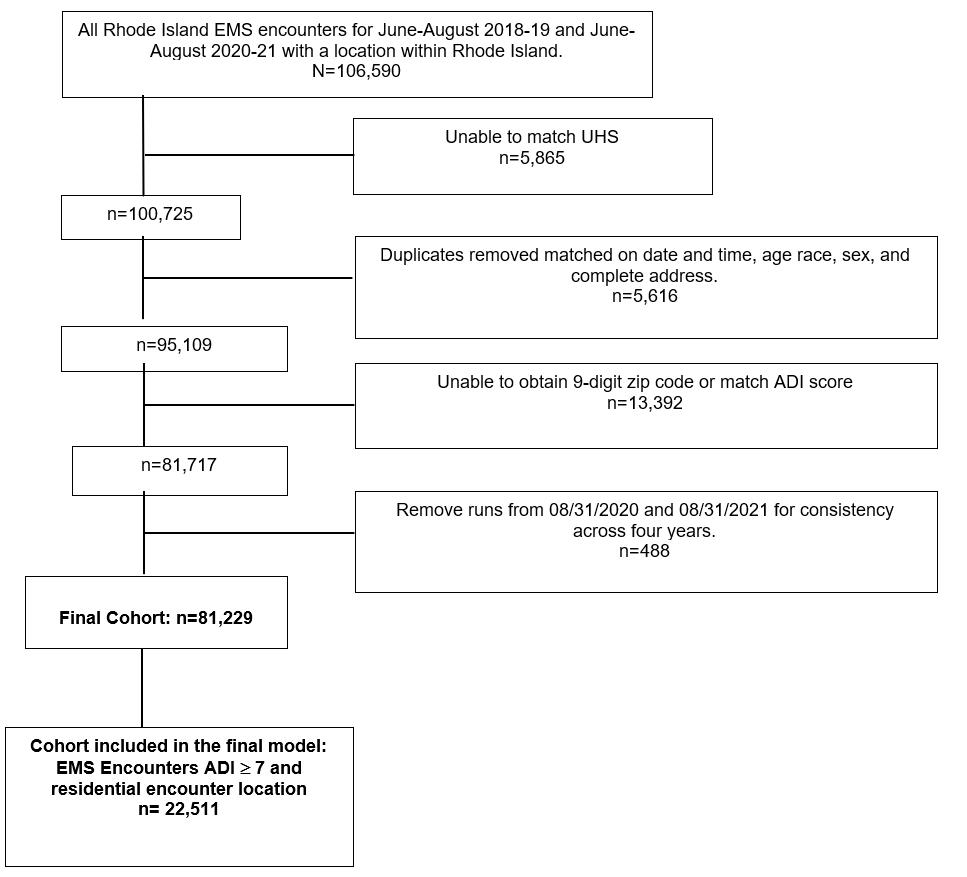
A total of 106,590 EMS encounters were initially identified for the summer months (June–August) across 2018–2021. After removing duplicate records and restricting to encounters matched to a verifiable urban heat index, 95,109 encounters remained. We excluded an additional 13,392 encounters because of missing 9-digit ZIP codes and inability to determine an ADI score. To ensure temporal consistency across all years, we excluded August 31, missing from the
Figure 3. Baseline Populations in Rhode Island based on the 2020 census, the 2020 Trust for Public Land’s urban heat island severity layer and the 2021 Area Deprivation Index. ADI, Area Deprivation Index; UHI, urban heat island.
Moretti et al.
Impacts of Urban Heat Islands on EMS Use
2018 and 2019 datasets, from the 2020 and 2021 datasets. The remaining number of EMS encounters was 81,229. For the Poisson regression model that was restricted to encounters in residential, low-SES encounter locations, the number of encounters was 22,511 (Figure 2).
We excluded a total of 13,880 encounters because they could not be linked to an ADI designation or occurred on the date of August 31 in 2020 or 2021. Compared with the included cohort, excluded encounters were less likely to originate from an UHI (55.2% vs 70.5%, P < .05), had a younger mean age (53 vs 58 years, P < .05), and had a higher proportion of males (50.8% vs 47.3%). There were no differences in the distribution of excluded encounters across study years (Supplemental Table 4).
The full summer temperature range across the four years of study was 42-100 °F (6-38 °C) with the mean daily temperatures covering a 52-87 °F (11-31 °C) range. The summer of 2019 was slightly cooler on average (72.2 °F, or 22.3 °C) and 2020 was slightly warmer (73.7 °F, or 23.1 °C) (Supplemental Figure 2). The mean daily number of EMS encounters during the study period was 223 (SD 23.6) (Supplemental Figure 2). For all EMS encounters including high socioeconomic status and non-residential locations, 55% originated from areas classified as non-UHIs and 59% occurred in higher socioeconomic status areas (computable from the header row of Table 1). Encounters in UHIs were
Figure 2. Cohort Selection Flow Diagram.
Figure 2, This flow diagram depicts the cohort selection of EMS encounters included in the final analytic cohort, starting from 106,590 EMS encounters during summer the months (June–August) from 2018–2021, ADI, area deprivation index; EMS, emergency medical services; SES, socioeconomic status; UHS, urban heat severity.
more likely to be in low socioeconomic status areas (55%), and those without UHI effect more likely to be in high socioeconomic status areas (73%).
The overall mean patient age was 58 years (SD 23). Patients outside UHIs were older (mean 60 (SD 23]) than those from UHIs (mean 56 [SD 23]). Compared to patients from urban heat islands, those outside urban heat islands were more likely to be ≥ 65 years of age (49% vs 39%) and more likely to live in high socioeconomic status areas (73% vs. 42%).
A higher proportion of encounters not in UHIs occurred at residential locations (69%) vs. UHIs (65%; P < .001), and residential encounters were more common in low socioeconomic status areas (71%) than in high socioeconomic status areas (66%). Sex distribution was similar across strata, although male patients were slightly more represented in urban heat islands compared to locations without urban heat island effect (48% vs 47%).
Baseline Population of Rhode Islanders Residing in an Urban Heat Island and low SES Status
In 2020, the census of Rhode Island was 1,097,379. Several block groups did not have ADI values, either because the population was too small or the population lived in group quarters. This included local university campuses. These census blocks were excluded (total population excluded = 41,274). Among the remaining 1,056,106 residents, the number residing in a census track with an ADI ≥ 7 comprising the baseline population for regression was 397,369. Of those whose centroid overlapped with an UHI (urban heat severity ≥ 1 on the 2020 Trust for Public Land’s raster map) was calculated to be 227,2045 (Figure 3).
Regression Analysis: EMS Encounters by Temperature, Urban Heat Island Effect, and Patient Characteristics for Low Socioeconomic, Residential Locations
Higher daily average temperatures increased the daily EMS call rates to residential, low-socioeconomic status locations and for all demographic subgroups. A 5 °F (2.8 °C) increase in daily mean temperature was associated with an increase in an overall EMS encounter rate of 1.5% (rate ratio [RR] 1.015, 95% CI, 1.005-1.031, P = .004, Supplemental Table 5 where RR is reported per 1 °F increase.) To illustrate the effect on the absolute total number of EMS responses, a weekday in 2021 was selected. From 75 °F to 95 °F, EMS encounters would be expected to rise from 68 EMS encounters to 73 EMS encounters.
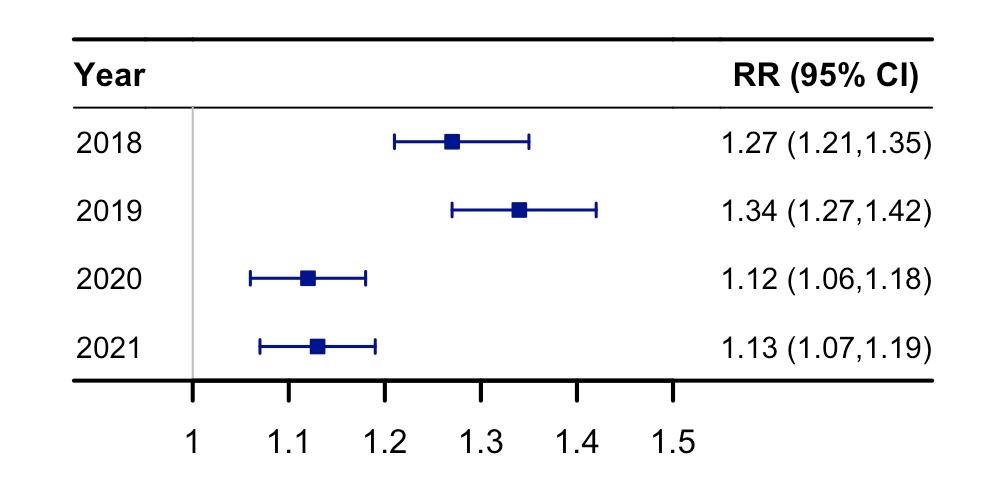
The EMS encounter rates were consistently higher in areas classified as UHIs compared to areas outside UHIs across all study years, after accounting for daily temperature, year, day of the week, demographic characteristics, population size and interactions between age, sex, UHI, and weekday vs weekend. In 2018, EMS encounter rates in UHIs were 27% higher than in areas without UHI effect (RR, 1.27; 95% CI, 1.21-1.35, Figure 4). This disparity increased in 2019, with a
Table 1. Demographic and encounter characteristics by urban heat island status and area deprivation index (< 7 or ≥ 7) for all socioeconomic, non-residential and residential encounters. All percentages are calculated relative to the column header.
34% higher rate in UHIs (RR, 1.34; 95% CI, 1.27-1.42). Although the magnitude of association decreased slightly in subsequent years, UHIs continued to experience elevated EMS use in both 2020 (RR, 1.12; 95% CI, 1.06-1.18, Table 2) and 2021 (RR, 1.13; 95% CI, 1.07-1.19, Figure 4).
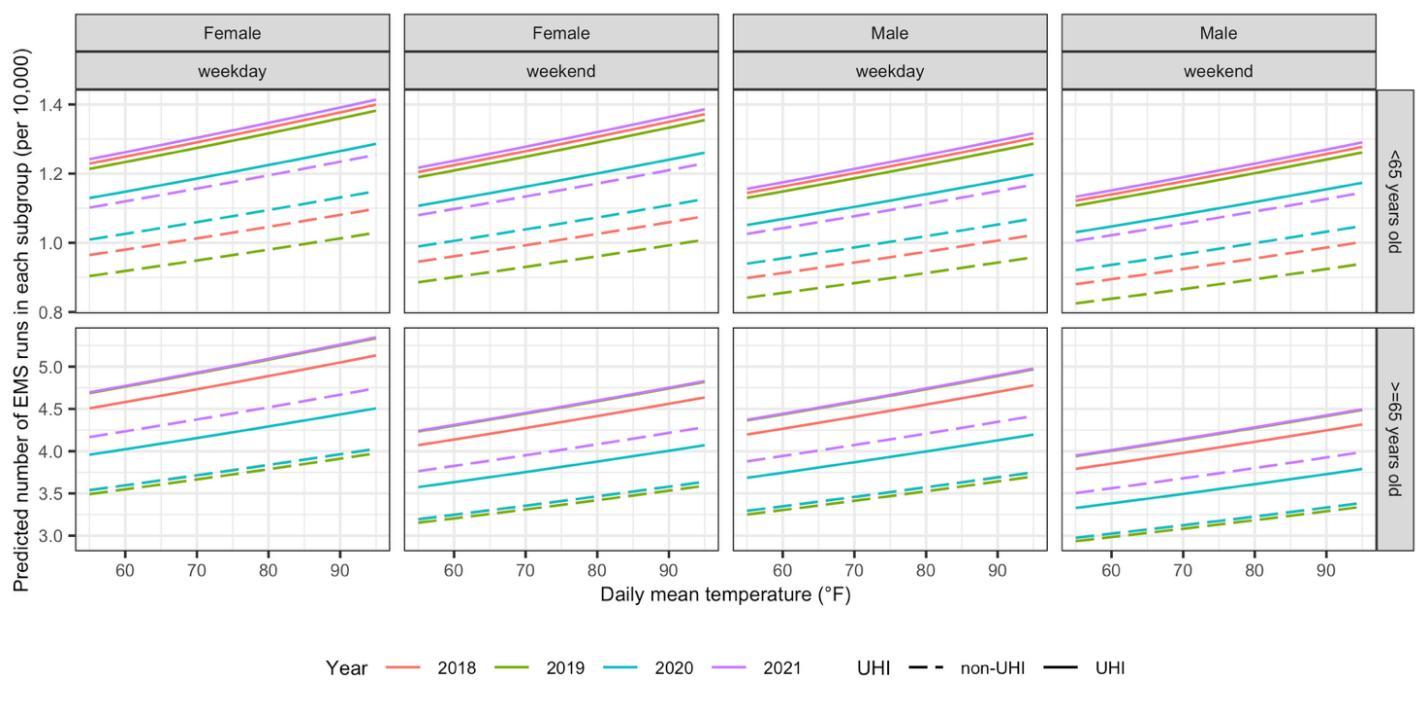
Use of EMS increased substantially with higher temperatures, the presence of an UHI, and age (Figure 5). Utilization was slightly higher for females than for males, and
slightly higher on weekdays than on weekends. For those < 65 of age living in a non-UHI, the associated number of EMS encounters per 10,000 people ranged between 0.8-1.1 at a temperature of 60 °F (16 °C), increasing to a range of 0.9-1.2 when the temperature reached 90 °F (32 °C). In an UHI, the rates were higher: approximately 1.1-1.2 on cool summer days and 1.3-1.4 on the warmest days. Conversely, the rates were much higher for individuals ≥ 65 years of age, ranging between
Moretti
Figure 4. Adjusted rate ratios and 95% CI for EMS encounters among residents of urban heat island (UHI) areas compared with residents outside UHIs, shown by calendar year (2018–2021). Models were adjusted for daily temperature, year, day of the week, age, sex, population size, and interactions between age, sex, UHI status, and weekday vs weekend. Values > 1 indicate higher EMS encounter rates in UHI areas relative to non-UHI areas. EMS, emergency medical services RR, rate ratios; UHI, urban heat island.
and highlight the role of the local environment in healthcare utilization. Notably, EMS encounters were consistently higher in UHIs compared to non-UHIs, even after controlling for daily temperature and year. The strength of this association was most pronounced in 2018 and 2019, when the rate of calls was about 30% higher in heat-affected urban zones. This was despite a slightly cooler 2019 summer. Although the magnitude of the UHI effect diminished in 2020 and 2021, likely influenced by broader social disruptions and shifts in healthcare utilization related to the COVID-19 pandemic,39 the association remained statistically significant.
3.0-3.5 in non-UHI areas and 4.0-4.5 in UHI areas at 60 °F, to 3.0-4.5 in non-UHI areas and 4.5-5.5 in UHI areas at 90 °F.
These differences translated to a wide range of rate ratios (equivalent here to relative risk) comparing use rates at a fixed temperature for different combinations of sex, age, year, time of week and UHI residence to a reference group of males, < 65 years of age, on weekdays in non-UHI areas in 2020 (Table 2). Relative risks were all > 3 for older individuals and generally < 1.3 for those < 65 years of age. They were also lower in 2020 compared with other years in UHIs. In non-UHI areas, the rates were higher in 2020 than in 2018 or 2019 but lower than in 2021
To illustrate the change in the absolute number of EMS encounters, we calculated the daily increase in encounters per 10,000 population (by subgroup) on weekdays in 2021, relative to a mean temperature of 75 °F, within residential, low socioeconomic locations. These values were then compared between areas with and without an UHI effect (Supplemental Figure 4). For example, among women > 65 years of age, an average daily temperature of 95° F (vs 75 °F) was associated with 0.3 additional EMS encounters per 10,000 people in low socioeconomic status residential locations without UHI, compared with 0.34 additional encounters in similar locations with UHI influence.
DISCUSSION
Encounters with EMS increase as summer temperatures increase. This effect is found within all age and sex subgroups and across all days of the week. In addition, UHI exposure is associated with increased EMS utilization across Rhode Island, specifically in residential, low socioeconomic status areas. These findings underscore the disproportionate burden of heat-related health impacts among vulnerable populations
This aligns with prior research linking UHIs with higher rates of heat-related illness, including heat exhaustion and heat stroke.40 Other disease-specific analyses, such as cardiovascular hospitalizations, have also been linked to UHIs with a 2.4% increase observed during periods of extreme heat.41 Recent systematic review and meta-analysis further found a 6% higher risk of morbidity or mortality associated with UHIs during periods of elevated ambient temperatures. However, the review’s combined morbidity estimates drew from studies focused on specific diagnoses rather than overall illness burden. On the mitigation side, a natural cooling intervention in Canada, primarily consisting of expanded green space, was associated with a 40-50% reduction in heat-related ambulance calls.42 The current study adds to this evidence base by quantifying all-cause morbidity rather than limiting the analyses to specific diagnoses and by estimating the broader burden on the EMS system of an entire state.
Adaptive measures such as air conditioning (AC) have helped reduce the impact of extreme heat and have likely prevented some of the heat-related deaths that were previously projected.43-44 However, low socioeconomic status and income have been associated with limited capacity to cool built environments because of the high cost of electricity and the inability to build central cooling infrastructure.45 These vulnerable populations may instead have to rely on other interventions (ie, public buildings for AC, public pools, fans, increased hydration), which may not be feasible or effective in increasingly intense and frequent extreme heat events.46 As shown in the current analysis, EMS utilization was greater in UHIs in residential areas with lower socioeconomic status, and it further increased in response to rising summer temperatures. This clearly demonstrates the ongoing adverse health impacts of heat for vulnerable populations residing in urban heat islands.
LIMITATIONS
While our analysis is based on complete, statewide EMS records and official National Weather Service temperature recordings over a four-year period, our data have some weaknesses. A subset of encounters (n = 13,880) could not be linked to an ADI designation or fell on August 31, 2020, or August 31, 2021 and were, therefore, excluded from the final cohort. Comparison of these excluded encounters with the included cohort revealed small but statistically significant
Figure 5. Associated number of EMS encounters per 10,000 people by daily mean temperature, stratified by age group (panel arranged horizontally), sex, and weekday vs weekend (panels arranged vertically). Estimates are derived from a quasi-Poisson regression of EMS encounters in Rhode Island for June-August 2018-2021. Lines represent associated EMS use across a temperature gradient (55 °F to 95 °F), stratified by year (color), urban heat island (UHI) status (solid: UHI, dashed: non-UHI), and demographic subgroup. Across all strata, EMS demand increased with temperature, with consistently higher associated rates in UHI areas. Trends were more pronounced in older adults (≥ 65 years) and during weekdays. EMS, emergency medical services; UHI, urban heat island.
differences between the groups. Excluded encounters were younger, less likely to originate from UHIs, and had a higher proportion of males. Although these differences were statistically significant, they appear to be of limited clinical significance. The
excluded group represents a population somewhat less likely to experience increased EMS utilization with rising temperatures— given younger age, male predominance, and lower representation from UHIs. Even within the subset of excluded encounters originating from UHIs, the slightly younger age and higher proportion of males could contribute to a marginally lower temperature-related increase in EMS utilization, potentially yielding a slightly lower overall rate ratio. However, these differences were relatively small and would have been accounted for in age-sex stratified analyses.
Although our models adjusted for key demographic, temporal, and neighborhood-level factors, the possibility of residual confounding remains. Our Poisson models estimated average risk within age, sex, and ADI strata, rather than at the individual level. Because individual characteristics were not available for residents who did not use the EMS system, we were unable to account for person-level differences that may influence heat-related risk. As a result, residual confounding from unmeasured individual factors remains possible. Additional individual-level characteristics such as comorbidities, housing conditions, or access to AC, may also have influenced both heat exposure and EMS utilization and, therefore, resulted in confounding. By limiting the final analysis to lower socioeconomic status groups, variation in AC access is likely more comparable between UHI and non-UHI areas, as AC availability has previously been linked to socioeconomic status.47 In addition, age-stratified analyses help reduce potential confounding from comorbidities, which are strongly associated
Table 2. Rate ratio for the overall association of emergency medical services encounters with risk factors relative to the reference group (male, age < 65, non-urban heat island [UHI], weekday, 2020): by year, as well as combinations of year, sex/age group, and UHI exposure, associated with the rate ratios of daily EMS encounters for a fixed temperature. Estimates reflect combined main and interaction effects. Rate ratios for UHI are bolded.
Male <
≥ 65
(1.12,
(3.83, 4.44)
(2.93, 3.42)
(3.74,
< 65 Weekday Non-UHI
≥ 65
UHI, urban heat island.
with age. These unmeasured factors may have partially contributed to the observed associations; however, they are unlikely to fully explain the consistent patterns seen across years, temperature ranges, and demographic strata.
In addition, this analysis only included EMS encounters linked to residential locations; therefore, certain at-risk populations were not captured in our cohort. These groups may include individuals experiencing homelessness, outdoor workers, and others who spend substantial time outside the home. Future research should specifically examine these populations to better understand their heat-related risks and EMS use patterns.
Because Rhode Island has only one official weather station, we could apply only one daily average temperature measurement across the entire state. Temperature variations throughout the state are approximated each day by interpolated data products (e.g., DAYMET) and machinelearning models (e.g., XIS-Temperature).48-49 We plan to use these in future studies. Additionally, the assumed temperature variability of urban heat islands was calculated geographically based on historic time-averaged Landsat-8 data. Actual surface temperatures at the time of the encounter were not used, as raw surface temperature data were only available roughly once per 24 days.48 Other important weather attributes that potentially modulate heat exposure—humidity, direct solar radiation, precipitation, and wind—were also not captured.
The EMS encounters were analyzed at the census block group level, UHI affect, and ADI levels based on the location of the EMS encounter. However, this location may not accurately reflect where they were exposed to heat, introducing potential misclassification. Limiting analyses to residential locations likely reduced misclassification from short-duration exposures in public or commercial venues (eg, parking lots, traffic accidents) and excluded large heat island zones that are typically air-conditioned, such as malls, airports, and office complexes.
We defined UHI exposure using a 2019 and 2021 map and retrospectively applied it across corresponding study years (2018–2021). This assumes spatial stability in UHI intensity, which may not fully account for temporal changes in land use, vegetation, or surface reflectivity that could influence local heat patterns. Further, our findings may not be generalizable beyond Rhode Island given its unique geography, climate change profile, and urban design.
CONCLUSION
This study demonstrates that both elevated daily temperatures and exposure to an urban heat island are associated with increased EMS use during summer months in Rhode Island, specifically within residential areas that are both low socioeconomic status and urban heat islands. As climate change accelerates and extreme heat events become more frequent, EMS systems will continue to encounter temperature-related increases in demand. In this study, differences in EMS use between urban
heat islands and non-urban heat island areas were measurable, reflecting unequal heat-related health impacts across communities. Targeted adaptations—such as enhancing local cooling infrastructure, improving heat-risk communication, and supporting high-risk neighborhoods with higher burdens of exposure to these heat islands—could help mitigate the disproportionate impacts of heat on vulnerable populations.
AUTHORS CONTINUED
Clara DiCerbo, PhD, CEM§
Hamid Torabzadeh|| Christopher H Schmid, PhD# Adam Aluisio, MD, MSc*
‡Brown University, Department of Earth, Environmental, and Planetary Sciences, Providence, Rhode Island
§Providence Emergency Management Agency, Providence, Rhode Island
||Brown University, Division of Biology and Medicine, Providence, Rhode Island
#Brown University School of Public Health, Department of Biostatistics, Providence, Rhode Island
Address for Correspondence: Katelyn Moretti, MD, MS, Warren Alpert Medical School of Brown University, Department of Emergency Medicine, 55 Claverick St, Providence, RI 02903. Email: katelyn_moretti@brown.edu
Conflicts of Interest: By the WestJEM article submission agreement, all authors are required to disclose all affiliations, funding sources and financial or management relationships that could be perceived as potential sources of bias. Christopher H Schmid is partially supported by Institutional Development Award Number U54GM115677 from the National Institute of General Medical Sciences of the National Institutes of Health, which funds Advance Rhode Island Clinical and Translational Research (Advance RICTR). Support from the Biostatistics, Epidemiology and Research Design Core of Advance RI-CTR was received. The content is solely the responsibility of the authors and does not necessarily represent the official views of the National Institutes of Health. Katelyn Moretti was funded through an internal grant provided by Brown Emergency Medicine. There are no conflicts of interest to declare.
1. Riley K, Wilhalme H, Delp L, Eisenman DP. Mortality and morbidity during extreme heat events and prevalence of outdoor work: an analysis of community-level data from Los Angeles County, California. Int J Environ Res Public Health. 2018;15(4):580.
2. Knowlton K, Rotkin-Ellman M, King G, et al. The 2006 California heat
Moretti et al.
wave: impacts on hospitalizations and emergency department visits. Environ Health Perspect. 2009;117(1):61-7.
3. Ragettli MS, Vicedo-Cabrera AM, Flückiger B, Röösli M. Impact of the warm summer 2015 on emergency hospital admissions in Switzerland. Environ Health. 2019;18(1):66.
4. Campbell S, Remenyi TA, White CJ, Johnston FH. Heatwave and health impact research: a global review. Health Place. 2018;53:210-8.
5. Vaidyanathan A, Saha S, Vicedo-Cabrera AM, et al. Assessment of extreme heat and hospitalizations to inform early warning systems. Proc Natl Acad Sci U S A. 2019;116(12):5420-7.
6. Oke TR. The energetic basis of the urban heat island. Q J R Meteorol Soc. 1982;108:1-24.
7. Peng S, Piao S, Ciais P, et al. Surface urban heat island across 419 global big cities. Environ Sci Technol. 2012;46(2):696-703.
8. Zhou B, Rybski D, Kropp JP. The role of city size and urban form in the surface urban heat island. Sci Rep. 2017;7:4791.
9. Hamstead ZA, Kremer P, Larondelle N, McPhearson T, Haase D. Classification of the heterogeneous structure of urban landscapes as an indicator of landscape function applied to surface temperature in New York City. Ecol Indic. 2016;70:574-85.
10. Middel A, Häb K, Brazel AJ, Martin CA, Guhathakurta S. Impact of urban form and design on mid-afternoon microclimate in Phoenix local climate zones. Landsc Urban Plan. 2014;122:16-28.
11. Heaviside C, Macintyre H, Vardoulakis S. The urban heat island: implications for health in a changing environment. Curr Environ Health Rep. 2017;4(3):296-305.
12. Piracha A, Chaudhary MT. Urban air pollution, urban heat island and human health: a review of the literature. Sustainability 2022;14(15):9234.
13. Davis RE, Knappenberger PC, Michaels PJ, Novicoff WM. Changing heat-related mortality in the United States. Environ Health Perspect 2003;111(14):1712-8.
14. Hsu A, Sheriff G, Chakraborty T, et al. Disproportionate exposure to urban heat island intensity across major US cities. Nat Commun 2021;12:2721.
15. Milojevic A, Wilkinson P, Armstrong B, et al. Impact of London’s urban heat island on heat-related mortality. Epidemiology. 2011;22(1):S182.
16. O’Brien DT, Gridley MSUI B, Trlica A, Wang JA, Shrivastava A. Urban heat islets: street segments, land surface temperatures, and medical emergencies during heat advisories. Am J Public Health 2020;110(7):e1-8.
17. Kohon JN, Tanaka K, Himes D, et al. Extreme heat vulnerability among older adults: a multilevel risk index for Portland, Oregon. Gerontologist. 2024;64(3):gnad074.
18. Voelkel J, Shandas V, Haggerty B. Developing high-resolution descriptions of urban heat islands: a public health imperative. Prev Chronic Dis. 2016;13:E129.
19. Gamble JL, Hurley BJ, Schultz PA, et al. Climate change and older Americans: state of the science. Environ Health Perspect 2013;121(1):15-22.
20. National Integrated Heat Health Information System. Who Is at Risk
Impacts of Urban Heat Islands on EMS Use
to Extreme Heat? 2023. Available at: https://www.heat.gov/pages/ who-is-at-risk-to-extreme-heat. Accessed August 15, 2024.
21. US Geological Survey. Climate Crisis Heats up Rhode Island the Quickest. Publishing Year. Available at: https://www.usgs.gov/news/ climate-crisis-heats-rhode-island-quickest. Accessed July 30, 2025.
22. Moretti K, Gallo Marin B, Soliman LB, Asselin N, Aluisio AR. Increased temperatures are associated with increased utilization of emergency medical services in Rhode Island. R I Med J (2013) 2021;104(9):24-8.
23. Kingsley SL, Eliot MN, Gold J, et al. Current and projected heatrelated morbidity and mortality in Rhode Island. Environ Health Perspect. 2016;124(4):460-7.
24. U.S. Census Bureau. QuickFacts: Rhode Island. 2025. Available at: https://www.census.gov/quickfacts/RI. Accessed July 30, 2025.
25. Jenks GF. The data model concept in statistical mapping. Int Yearb Cartogr. 1967;7:186-90.
26. Ryan SC, Sugg MM, Runkle JD. Association between urban greenspace, tree canopy cover and intentional deaths: an exploratory geospatial analysis. Urban For Urban Green. 2023;86:128015.
27. Kind AJH, Buckingham WR. Making neighborhood-disadvantage metrics accessible—the neighborhood atlas. N Engl J Med 2018;378(26):2456-8.
28. Ryan SC, Sugg MM, Runkle JD. Association between urban greenspace, tree canopy cover and intentional deaths: an exploratory geospatial analysis. Urban For Urban Green. 2023;86:128015.
29. Browning MHEM, Rigolon A, Ogletree S, et al. The PAD-US-AR dataset: measuring accessible and recreational parks in the contiguous United States. Sci Data. 2022;9(1):773.
30. Kind AJH, Buckingham WR. Making neighborhood-disadvantage metrics accessible—the Neighborhood Atlas. N Engl J Med 2018;378(26):2456-8.
31. U.S. Census Bureau. 2020 Census. 2021. Available at: https://www. census.gov/programs-surveys/decennial-census/decade/2020/2020census-main.html. Accessed July 30, 2025.
32. Mapping | Rhode Island E 9-1-1 Uniform Emergency Telephone System. 2022. Available at: https://ri911.ri.gov/mapping. Accessed July 30, 2025.
33. Esri Inc. ArcGIS Pro (version 3.0). 2022. Available at: https://www. esri.com/en-us/arcgis/products/arcgis-pro/overview. Accessed August 1, 2024.
34. Gamble JL, Hurley BJ, Schultz PA, et al. Climate change and older Americans: state of the science. Environ Health Perspect 2013;121(1):15-22.
35. Kohon JN, Tanaka K, Himes D, et al. Extreme heat vulnerability among older adults: a multilevel risk index for Portland, Oregon. Gerontologist. 2024;64(3):gnad074.
36. Cantwell K, Morgans A, Smith K, et al. Time of day and day of week trends in EMS demand. Prehosp Emerg Care. 2015;19(3):425-31.
37. Hitzek J, Fischer-Rosinský A, Möckel M, Kuhlmann SL, Slagman A. Influence of weekday and seasonal trends on urgency and in-hospital mortality of emergency department patients. Front Public Health
2022;10:711235.
38. Bick A, Blandin A, Mertens K. Work from home before and after the COVID-19 outbreak. Am Econ J Macroecon. 2023;15(4):1-39.
39. Whaley CM, Pera MF, Cantor J, et al. Changes in health services use among commercially insured US populations during the COVID-19 pandemic. JAMA Netw Open. 2020;3(11):e2024984.
40. Lasky E, Costello S, Ndovu A, et al. The health benefits of reducing micro-heat islands: a 22-year analysis of the impact of urban temperature reduction on heat-related illnesses in California’s major cities. Sci Total Environ. 2024;949:175284.
41. Cleland SE, Steinhardt W, Neas LM, West JJ, Rappold AG. Urban heat island impacts on heat-related cardiovascular morbidity: a time series analysis of older adults in US metropolitan areas. Environ Int 2023;178:108005.
42. Graham DA, Vanos JK, Kenny NA, Brown RD. Modeling the effects of urban design on emergency medical response calls during extreme heat events in Toronto, Canada. Int J Environ Res Public Health. 2017;14(7):778.
43. Li D, Newman GD, Wilson B, Zhang Y, Brown RD. Modeling the relationships between historical redlining, urban heat, and heatrelated emergency department visits: an examination of 11 Texas cities. Environ Plan B Urban Anal City Sci. 2022;49(3):933-52.
44. Graham DA, Vanos JK, Kenny NA, Brown RD. Modeling the effects of urban design on emergency medical response calls during extreme heat events in Toronto, Canada. Int J Environ Res Public Health. 2017;14(7):778.
45. O’Neill MS, Carter R, Kish JK, et al. Preventing heat-related morbidity and mortality: new approaches in a changing climate. Maturitas 2009;64(2):98-103.
46. Sera F, Hashizume M, Honda Y, et al. Air conditioning and heatrelated mortality: a multicountry longitudinal study. Epidemiology 2020;31(6):779-87.
47. Palinkas LA, Hurlburt MS, Fernandez C, et al. Vulnerable, resilient, or both? A qualitative study of adaptation resources and behaviors to heat waves and health outcomes of low-income residents of urban heat islands. Int J Environ Res Public Health. 2022;19(17):11090.
48. Williams AA, Spengler JD, Catalano P, et al. Building vulnerability in a changing climate: indoor temperature exposures and health outcomes in older adults living in public housing during an extreme heat event in Cambridge, Massachusetts. Int J Environ Res Public Health. 2019;16(13):2373.
49. Thornton MM, Shrestha R, Wei Y, et al. Daymet: daily surface weather data on a 1-km grid for North America, version 4 R1. ORNL Distributed Active Archive Center; 2022.
Reducing Waste: Instrument Recycling in the Emergency Department
Esther H. Chen, MD*†
Kristie Taguma, MD‡
Newton Addo, MS*
John K. Quinn, MD§
University of California, San Francisco, Department of Emergency Medicine, San Francisco, California
Zuckerberg San Francisco General Hospital, San Francisco, California
Kaiser Foundation Hospital-San Leandro, Department of Emergency Medicine, San Francisco, California
University of Washington, Department of Emergency Medicine, Seattle, Washington
Section Editor: Shahram Lotfipour, MD, MPH
Submission history: Submitted September 20, 2025; Revision received January 4, 2026; Accepted January 21, 2026
Electronically published May 13, 2026
Full text available through open access at http://escholarship.org/uc/uciem_westjem DOI 10.5811/westjem.52924
Introduction: Emergency medicine (EM) residency programs are required to teach quality improvement (QI), yet few adopt a sustainability lens to QI despite broad recognition of the importance of climate sustainability in healthcare. To address this gap, some programs have piloted innovative approaches such as sustainability QI electives or projects, although evidence of their effectiveness remains limited.
Methods: We designed and implemented a sustainability QI initiative to recycle used instruments from three bedside procedure kits (laceration repair, incision and drainage, chest tube placement) commonly used in the emergency department to reduce waste. Our goal was to describe the effectiveness of a financial intervention on instrument recycling by comparing the differences in recycling rates between the baseline and incentive periods using a quasi-Poisson regression analysis.
Results: At the end of the first year of instrument recycling, the recycling rate was 9%. Providing a financial incentive to residents over a two-year period significantly increased the recycling rate to a mean of 24% (standard deviation 13), with a rate ratio of 3.03 (95% CI 1.57–5.85), P < .001. While the residents did not meet their recycling target of 50% to receive the incentive payment, their overall recycling rate increased.
Conclusion: Providing a financial incentive to residents for recycling efforts was modestly successful in encouraging residents to participate in an instrument recycling initiative. Motivating busy clinicians to engage in sustainable practice is challenging; projects that prioritize systems-level changes may be more effective than those that require changes in individual clinical practices. [West J Emerg Med. 2026;27(3)501–504.]
INTRODUCTION
Emergency medicine (EM) residency programs are required to teach quality improvement (QI) concepts, preparing residents to identify opportunities to enhance clinical practice through streamlined processes and improved patient safety.1,2 However, few programs approach QI using the lens of climate sustainability or incorporate sustainable QI and climate change and health (CCH) topics into their core curricula.3 One program implemented a climate health elective rotation in which EM
residents learn sustainable clinical practice principles and apply those principles to design and implement a sustainability QI capstone project.4 While promising, curricular interventions have been found to be least effective in promoting sustainable behavior change, whereas social comparisons or financial incentives were the most effective.5
Recognizing a curricular gap in our own program, we implemented an instrument recycling sustainability QI initiative to teach residents about reducing waste generated
during routine clinical practice. Emergency departments (ED) contribute to greenhouse gas emissions by generating a significant amount of waste, deviating from hospital waste disposal policies (ie, throwing waste in regulated waste red bags), or mixing waste with recyclable paper or plastics.6 Waste reduction strategies such as increased recycling and reprocessing of single-use devices may reduce carbon dioxide emissions and lead to financial cost-savings.7
Clinician-level strategies to reduce waste-related emissions include recycling of single-use materials and reducing the disposal of unused equipment.8 Our ED had already been collecting unused supplies from procedure kits for resident teaching and international distribution.9 To further reduce clinician-generated waste, we decided to implement recycling of instruments from procedure kits used during clinical care. We describe our experience with providing a financial incentive to increase instrument recycling in a busy ED setting, aiming to teach residents to approach sustainability QI with the same rigor as patientfocused QI projects.
METHODS
Setting and Participants
The EM residency program has 60 postgraduate year 1-4 residents who spend about 50% of their clinical time at the county hospital and trauma center ED (annual census about 65,000 patients). This project was approved as exempt from institutional review.
Design
In June 2022, the county hospital implemented recyclable instruments in the commonly used bedside procedure kits (ie, laceration repair, incision and drainage, chest tube placement). Rather than disposing instruments into the room’s sharps container, instruments could be deposited into a recycling bin in the soiled utility room located in each clinical area. Instruments were collected and recycled by the instrument manufacturer when the bins were completely full. The hospital incurred no additional cost for instrument recycling. This recycling initiative was announced in July 2022 to faculty at faculty meeting and to residents during residency conference.
In July 2023, we proposed that the instrument recycling project be part of the hospital’s pay-for-performance (P4P) program for QI and sustainability QI initiatives. This pay-forperformance program has been successful in engaging trainees to participate in QI efforts for a financial incentive.10 The instrument recycling project was approved for the 2023-2025 academic years, in which all EM residents would receive $400 at the end of the year for meeting their monthly instrument recycling goal for at least six months of the academic year.
Outcome Measurements and Analysis
Our primary outcome was the monthly recycling rate. To
Population Health Research Capsule
What do we already know about this issue? Financial incentives may be more effective than curricular interventions to promote sustainable, clinician-level behavior change.
What was the research question?
We tested the effectiveness of offering a financial incentive to residents to increase instrument recycling.
What was the major finding of the study? Instrument recycling increased from 9% to 24%, with a rate ratio of 3.03 (95% CI 1.57–5.85), P < .001.
How does this improve population health?
Financial incentives could promote sustainable clinical practice and reduce waste-related emissions.
establish a baseline, we measured the weight of recycled instruments in July 2023 using the ED standing scale and continued monthly measurements during the first week of each month. We calculated the per-unit weight by weighing the recyclable instruments of each kit. Every month, we calculated the expected weight of recycled instruments by multiplying the per-unit weight by the number of kits replaced from the hospital’s central supply (assuming 100% of the instruments were recycled). We defined the recycling rate as the actual weight of recycled instruments divided by the expected weight of the instruments from the replaced kits. Additionally, from July 2024–June 2025, we recorded the monthly number of laceration repair, incision and drainage, and chest tube placement procedure notes documented in the electronic health record to provide another estimate of the total weight of used kits.
Data are presented using descriptive statistics with means and standard deviations as appropriate. We used a generalized linear model with a quasi-Poisson distribution, month of observation, and a log-link function to assess the differences in recycling rates between the baseline and incentive periods. We report rate ratios (RR) and 95% confidence intervals, with the baseline period serving as the reference group. All analyses were performed with R v4.4 (The R Foundation for Statistical Computing, Vienna, Austria).
RESULTS
At the end of the first year of instrument recycling (July 2022–July 2023), the recycling rate was 9%. Providing a financial incentive to residents from July 2023–June 2025 significantly increased the recycling rate to a mean of 24% (SD 13), with a RR of 3.03 (95% CI 1.57–5.85), P < .001. The monthly instrument recycling rate (Figure) and weight of recycled instruments were variable (Table). The residents did not meet their recycling target of 50% of instruments recycled over the two-year period and, therefore, did not receive an annual $400 incentive payment.
DISCUSSION
Our sustainability QI project was successful in increasing the overall instrument recycling rate in the ED although there was month-to-month variability. Despite not reaching the proposed recycling target of 50%, the overall instrument recycling rate increased from 9% to 24%. and a sustained improvement was observed in the project’s second year. We concurrently implemented a climate change and health curriculum into weekly conferences, using these sessions to provide quarterly reminders to residents about the instrument recycling program as a way to reduce environmental waste. In addition, resident QI leaders highlighted the program with reminders during shift handoffs and provided orientation on the recycling workflow to non-EM rotators and medical students.
However, this project also highlighted the challenge of implementing a sustainability QI project that depended on changing individual behavior in a busy clinical environment
and the cognitive load of adopting a new process. The recycling workflow required already busy residents to collect and transport their instruments to the soiled utility room rather than simply depositing them directly into the sharps containers located in each patient room. Residents rotate to different clinical sites every 2–4 weeks, which can potentially lead to confusion regarding which QI and sustainability QI initiatives were implemented at each location. Faculty may also be unable to consistently remind residents about instrument recycling when supervising procedures, particularly if they are not present during cleanup. Additionally, more than 50% of resident shifts are staffed by non-EM residents, who may be unaware of recycling efforts. Finally, residents face competing priorities, such as optimizing patient care, which may overshadow any consideration of sustainable clinical practices.
While not meeting the recycling goal was disappointing, this project showed that
Figure. Monthly instrument recycling rate with the timeline of the climate lecture series. SusQI, sustainability quality improvement.
Monthly recycling rate and weight of recycled instruments in the emergency department.
Reducing Waste: Instrument Recycling in the Emergency Department
at an individual level may be more effective in achieving desired outcomes. For example, a prior ED sustainability QI initiative implemented automatic double-sided printing of after-visit summaries by adjusting the default settings of all departmental printers. This system-wide change eliminated the need to modify settings manually and effectively reduced paper use by preventing single-sided printing. For the instrument recycling initiative, even though financial incentives improved the recycling rate, we might have seen greater success if we had been able to simplify the instrument disposal workflow by installing recycling bins in each patient room. Alternatively, EDs could take steps to more fully integrate climate sustainability into their culture and expand their clinicians’ knowledge of sustainable practices with consistent communication about sustainability QI initiatives, in the same way as patient-focused QI initiatives.
LIMITATIONS
This project had several limitations. It was conducted with a single residency program at an institution that benefits from a pay-to-perform improvement program and dedicated QI faculty mentorship, which may limit generalizability to other settings. In addition, we encountered specific hospital system challenges during our study period, which limited our interventions (ie, installing recycling bins in each patient room). Furthermore, we implemented a concurrent quarterly climate change and health lecture series during residency conference to teach residents to manage climate-related health emergencies and to remind residents about the instrument recycling initiative. These reminders may also have increased the recycling efforts.
CONCLUSION
Providing a financial incentive to residents for recycling efforts was modestly successful in encouraging them to participate in an instrument-recycling sustainability quality improvement initiative. Motivating busy clinicians to engage in sustainable practice is challenging; projects that prioritize systems-level changes may be more effective than those that require changes in individual clinical practices.
ACKNOWLEDGMENTS
Special thanks to the ED Green Team members Caroline Lee and Francesco Sergi for assisting with project implementation.
Address for Correspondence: Esther H. Chen, MD, Zuckerberg San Francisco General Hospital, 1001 Potrero Ave, San Francisco, CA 94110. Email: esther.chen@ucsf.edu
Conflicts of Interest: By the WestJEM article submission agreement, all authors are required to disclose all affiliations, funding sources and financial or management relationships that could be perceived as potential sources of bias. No author has professional or financial relationships with any companies that are relevant to this study. There are no conflicts of interest or sources of funding to declare.
1. Beeson MS, Bhat R, Broder JS, et al. The 2022 Model of the Clinical Practice of Emergency Medicine. J Emerg Med. 2023;64(6):659-95.
2. Accreditation Council for Graduate Medical Education. Emergency Medicine Milestones. 2021. Available at: https://www.acgme.org/ globalassets/pdfs/milestones/emergencymedicinemilestones.pdf. Accessed September 28, 2024.
3. Moretti K. An education imperative: integrating climate change into the emergency medicine curriculum. AEM Educ Train. 2021;5(3):e10546.
4. Miracle M, Chekuri B, Weber K. A residency elective in sustainable health care. J Grad Med Educ. 2024;16(6 Suppl):157-8.
5. Bergquist M, Thiel M, Goldberg MH, et al. Field interventions for climate change mitigation behaviors: a second-order meta-analysis. Proc Natl Acad Sci U S A. 2023;120(13):e2214851120.
6. Hsu S, Thiel CL, Mello MJ, et al. Dumpster diving in the emergency department. West J Emerg Med. 2020;21(5):1211-7.
7. Kaplan S, Sadler B, Little K, et al. Can sustainable hospitals help bend the health care cost curve? Issue Brief (Commonw Fund). 2012;29:1-14.
8. Or Z, Seppanen A-V. The role of the health sector in tackling climate change: a narrative review. Health Policy. 2024:143:105053.
9. Muldoon LB, Chan WW, Sabbagh SH, et al. Collecting unused medical supplies in emergency departments for responsible redistribution. J Emerg Med. 2019;57(1):29-35.
10. Chen EH, Losak MJ, Hernandez A, et al. Financial incentives to enhance participation of resident physicians in hospital-based quality improvement projects. Jt Comm J Qual Patient Saf. 2021;47(9):545-55.
Creating and Maintaining a “Climate-Smart” Emergency Department: A Scoping Review of Current Progress and Future Potential
Lea Moujaes, MD
Kayla Iuliucci, MD
Section Editor: Mark I. Langdorf, MD, MPHE
Johns Hopkins University School of Medicine, Department of Emergency Medicine, Baltimore, Maryland
Submission history: Submitted September 25, 2025; Revision received December 27, 2025; Accepted January 2, 2026
Electronically published May 3, 2026
Full text available through open access at http://escholarship.org/uc/uciem_westjem
DOI 10.5811/westjem.50597
Introduction: Climate change represents one of the most significant global health threats, with emergency departments (ED) serving as frontline responders to climate-related health emergencies. While EDs are major contributors to healthcare’s environmental footprint and critical responders for climate disasters, no comprehensive review has examined sustainability and climate-resilience initiatives specifically implemented in ED settings.
Methods: We conducted a scoping review examining literature on sustainable and climate-resilient measures in EDs. Comprehensive searches of PubMed, Scopus, and Embase were performed from inception through November 2024, using terms related to EDs combined with sustainability and climate-resilience concepts. Two reviewers independently screened papers, with inclusion criteria requiring ED-specific focus and concrete sustainability or resilience interventions.
Results: Seven studies met inclusion criteria, representing diverse geographic contexts. Three addressed sustainability interventions including waste reduction, sustainable procurement, device reprocessing, and renewable energy adoption. Case examples demonstrated co-benefits, such as 31% reduction in ambulance carbon dioxide emissions and $3 million savings from device reprocessing programs. All studies described resilience interventions encompassing disaster preparedness, surge capacity, infrastructure continuity, and clinical protocols. However, significant gaps were identified: Only 13-20% of hospitals in surveyed countries had disaster plans, and no studies documented fully operational climate-smart EDs. Global frameworks were referenced but not operationalized in ED settings.
Conclusion: There is a limited body of peer-reviewed studies that describe measures to close the implementation gap between current climate science and operational practices in EDs. Despite extensive policy recommendations and demonstrated benefits, no studies have described any existing programs. Emergency medicine requires translation of conceptual frameworks into measurable interventions, standardized outcome measures, and systematic implementation of climate-smart healthcare practices. [West J Emerg Med. 2026;27(3)505–511.]
INTRODUCTION
Climate change is increasingly recognized as one of the most prominent global health threats of the 21st century, with mounting evidence that its effects are already disrupting healthcare systems worldwide.1 Emergency departments (ED)
are on the frontlines of this crisis, witnessing firsthand the consequences of rising global temperatures, extreme weather events, and deteriorating air and water quality. These climaterelated stressors are driving measurable increases in ED patient volumes, particularly during periods of extreme heat,
wildfires, flooding, and other climate disasters. Such events lead to spikes in heat illnesses, exacerbations of chronic diseases, trauma, and mental health emergencies disproportionately affecting vulnerable populations including the elderly, children, individuals with pre-existing health conditions, and communities that are socioeconomically disadvantaged.2
At the same time, the healthcare sector itself contributes significantly to the climate crisis, accounting for an estimated 4-5% of global greenhouse gas (GHG) emissions.3 In the United States, the healthcare industry has been estimated to contribute about 8.5-10% of the nation’s GHG emissions.4,5 In response to this paradox, health systems around the world have begun to implement mitigation and adaptation strategies aimed at reducing their environmental impact while preparing for climate-related disasters. These efforts include integrating the World Health Organization (WHO) framework for climate-resilient health systems, adopting renewable energy sources, decarbonizing supply chains, reforming wasteful procurement practices, and establishing institutional alliances committed to environmental sustainability. Several national health systems have also launched climate action plans, introduced emissions tracking metrics, and invested in greener infrastructure.6 Further, remarkable developments too recent to have been described in peer-reviewed literature have been initiated. Chief among these is the opening of an “allelectric” hospital that is fully renewably powered, at the University of California Irvine, in Irvine, CA.7And the British National Health Service (NHS) is systematically placing new, renewably powered ambulances into service, as current petroleum-powered ambulances are retired from service. This is but one component of Great Britain’s initiative to deliver a “net zero” NHS.8
Despite these promising developments, most sustainability initiatives remain focused at the hospital system level, with limited documentation of climateconscious interventions within specific clinical departments. Emergency departments, which operate around the clock and are among the most resourceintensive units in healthcare, have largely been left out of this conversation. Yet EDs are uniquely positioned to model both mitigation and adaptation strategies. Not only do they absorb the immediate impacts of climate-related health emergencies, but they also produce considerable waste, consume large amounts of energy (especially if the GHG emissions from ambulances that deliver patients to the ED are considered), and function as key decision-making nodes within hospitals. Given this dual role, EDs represent critical leverage points for climate action within the healthcare sector. However, to date there has been no comprehensive review of the strategies EDs have implemented to reduce their environmental footprint or to enhance their climate
Population Health Research Capsule
What do we already know about this issue?
Climate change is increasing ED demand, and healthcare delivery contributes significantly to greenhouse gas emissions.
What was the research question?
What sustainability and climate-resilience interventions have been implemented in EDs?
What was the major finding of the study?
Only seven studies met criteria; no EDs reported fully implemented climate-smart programs.
How does this improve population health?
This scoping review reveals a persistent implementation gap, informing efforts to reduce ED emissions and strengthen preparedness for climate-related health threats.
resilience. A better understanding of these efforts is urgently needed to inform clinical operations, policy development, interdisciplinary collaboration, and emergency preparedness planning.
We sought to address this gap by systematically identifying and analyzing the sustainability and climateresilience initiatives that have been implemented in EDs and described in peer-reviewed literature. Specifically, we aimed to map the range of environmental interventions described in the literature, assess the use of global climate- and disasterresilience frameworks in the ED setting, and highlight opportunities for future development, collaboration, and standardization in ED-based climate action.
METHODS Study Design
In this scoping review we examined the literature on implementation of sustainable and climate-resilient measures in the ED. We conducted comprehensive searches of three electronic databases: PubMed; Scopus; and Embase from inception through November 2024. Only English-language studies were included. The search strategy combined terms related to EDs (eg, “emergency department,” “emergency room,” “ED,” “ER”) with sustainability and climate resilience terms (eg, “sustainability,” “climate resilience,” “climate adaptation,” “environmental sustainability,” “green
Moujaes et al.
healthcare,” “carbon footprint”). We used Boolean operators to combine search terms appropriately.
Study Selection and Screening
The “Climate-Smart” ED: Scoping Review of Progress and Potential
We imported search results into Covidence software (Veritas Health Innovations, Ltd, Melbourne, Victoria, Australia) for screening and management, completed by December 2024. Two reviewers independently screened titles, abstracts, and full-text papers. We included studies that were specifically focused on EDs and addressed specific sustainability and resilience tactics or interventions. We excluded studies conducted outside ED settings or those that did not address concrete techniques for resilience and sustainability implementation. Initial screening yielded 217 papers for full-text review. Following application of inclusion and exclusion criteria, seven papers met criteria for final inclusion in the review.
Data Extraction
Data extraction focusing on qualitative concepts was completed by February 2025 using dual review methodology. Given the exploratory nature of this scoping review, we did not employ strict systematic review protocols such as PRISMA guidelines. Data were extracted and compiled in Microsoft Excel (Microsoft Corporation, Redmond, WA) for analysis.
RESULTS
Study Selection and Characteristics
Seven studies met the inclusion criteria and were included in the review.9–15 They represented a mix of systematic and scoping reviews, narrative and conceptual analyses, a primer introducing a framework for climate-smart EDs, a clinical-tool development paper, and an international policy perspective. Collectively, the studies spanned diverse geographic contexts, including the U.S.,11,13,15 low- and middle-income countries in multiple regions,10 a continent-wide review focused on Africa,14 and papers addressing international or cross-regional perspectives.9 The EDs were described broadly as critical, high-volume hospital entry points and frontline disasterresponse nodes.10,11,13,14 However, few studies reported specific ED size or volume data; most focused on system-level vulnerabilities, facility preparedness, or conceptual frameworks.9–11,13,14 Vulnerable populations that were consistently identified across studies included children, older adults, women and pregnant persons, people with chronic disease, and socially marginalized groups.9,11,13,14
Sustainability Interventions
Three of the included studies addressed sustainability and mitigation strategies relevant to EDs.9,12,13 Reported operational domains encompassed waste segregation and reduction, sustainable procurement, device reprocessing, energy and water efficiency, green transportation, and
renewable energy adoption.12,13 Case examples demonstrated potential for both environmental and financial co-benefits. For instance, a U.S. emergency medical services (EMS) fleet conversion achieved a 31% reduction in ambulance CO₂ emissions over one year, while single-use device reprocessing programs at one hospital saved $3 million and diverted nearly 19,000 pounds of waste in the same period.12 Health-sector recommendations emphasized the importance of energy audits, sustainable building standards, reducing petroleum dependence in EMS, and promoting carbon literacy among clinicians and administrators.12,13 At the policy level, international reviews highlighted the U.S. Department of Health and Human Services (HHS) sustainability plans and WHO calls for climate-smart, low-carbon healthcare facilities.9 Across these studies, no papers reported the existence of a fully climate-smart ED in practice, and no empirical data quantified reductions in ED-specific carbon footprints.9,12,13
Climate Resilience Interventions
All seven studies described resilience interventions relevant to EDs.9-15 Reported domains included disaster preparedness, surge capacity, infrastructure continuity, clinical protocols, and surveillance systems. Preparedness and surge planning were recurrent themes. In Tanzania, a national survey of 25 hospitals (2012) reported that only 20% had disaster plans, fewer than half had intensive care unit (ICU) capacity, and none met all surge capacity criteria. In Sri Lanka, a 2010 survey of 31 public health facilities found that only 13% had disaster plans. In Vietnam, a 2009 hospital survey indicated that more than 80% of health workers reported inadequate disaster training.10 Infrastructure vulnerabilities were noted across several contexts. Studies from Ghana and Nigeria described unstable electricity supply, inadequate drainage and sanitation, poor ventilation, and physical access barriers as key threats to continuity of care during climate-related events.14 Clinical tools and protocols were introduced in two studies. Nicholas et al developed a mnemonic tool—A CLIMATE (Act, Consider, Learn, Implement, Manage, Act, Treat, Evaluate/Educate)—to guide ED climate-related assessment and management, while Sorensen et al provided clinical practice recommendations for managing heat illness, respiratory disease, cardiovascular disease, and disasterrelated trauma.11 Surveillance and early warning systems were also highlighted. In the U.S., New York City’s syndromic surveillance system uses ED triage data to detect heat-related illness, while the Phoenix, AZ, forecast office of the National Weather Service issues pre-heat alerts to case managers and first responders.11 In Africa, the Global Rural-Urban Mapping Project (GRUMP) mapping was proposed as a tool to assess flood and landslide risks, and the WHO Strategic Tool for the Analysis of Risk (STAR) was recommended for structured disaster preparedness planning.11,13,14
Use of Frameworks
A range of global, regional, and ED-specific frameworks were referenced across the included studies. Global health frameworks included the WHO climate-resilient health systems framework and the Sendai Framework for Disaster Risk Reduction,9,10,14 both cited in reviews of emergency care in low- and middle-income countries and African contexts. Regional and national tools included the HHS Sustainable and Climate-Resilient Healthcare Facilities Toolkit in the U.S., as well as municipal- and regional-level strategies such as the Accra Climate Action Plan in Ghana. Major sustainability initiatives are also underway within the British NHS. The NHS has launched a comprehensive decarbonization strategy, “Delivering a Net Zero National Health Service,”8 outlining a nationwide approach to reducing healthcare-related emissions. As part of this work, some regions have begun transitioning ambulance fleets to electric, zero-emission vehicles. In the Hillingdon region of suburban London, all patient-transport ambulances have been replaced with electric vehicles,16 and Yorkshire Ambulance Service has begun introducing electric ambulances as part of its broader sustainability plans.17
These developments represent emerging examples of health-system decarbonization efforts with implications for emergency and prehospital care. African studies also referenced WHO STAR, GRUMP, and broader adaptation measures in the United National Framework Convention on Climate Change adaptation measures.9,11,14 Less common are ED-specific frameworks.14 As referenced above, Nicholas et al introduced the A CLIMATE tool for use in the ED to guide clinical assessment and management of patients affected by climate-sensitive exposures.15 Across all studies, frameworks were described in relation to emergency medicine but were not reported as being fully operationalized within an ED.9–15
Opportunities for Future Development
The included studies identified several areas where future efforts could enhance ED sustainability and resilience. Research priorities were emphasized across the literature, particularly the need for more empirical studies evaluating ED-specific interventions. This gap was consistently noted as a barrier to advancing evidence-based practice in climate resilience and sustainability. Operational improvements included the development of standardized preparedness checklists and the implementation of simulation-based disaster training programs. Authors also recommended incorporating sustainability and resilience indicators into routine ED quality improvement processes.9,10,14 Systems integration was another recurrent theme, with calls for stronger partnerships between EDs, hospital operations, public health agencies, EMS, and community services to improve coordination and preparedness across the health systems.11,13,14 Equity considerations were consistently highlighted, with repeated recommendations to strengthen protections for children, older adults, pregnant
persons, and socially marginalized populations that face disproportionate risks from climate-related events.9,11,13
DISCUSSION
This review represents, to our knowledge, the first synthesis of literature examining sustainability and climate resilience interventions relevant to EDs. Across seven included studies, we found increasing recognition of the ED’s dual role as a major contributor to health system environmental impacts and as a frontline responder to climaterelated health threats. While the literature describes a wide range of potential strategies, most reports remain conceptual, highlighting a persistent gap between frameworks and actual implementation in ED settings.
Sustainability Interventions
Evidence of environmental footprint reduction in EDs was largely limited to hospital- or EMS-level examples rather than department-specific programs. Reports of waste reduction, device reprocessing, and fleet emission reduction illustrate the feasibility of health-sector mitigation and demonstrate both environmental and financial co-benefits.12,13 However, no studies describe the existence of a “climate-smart” ED in practice nor do any describe data-quantified ED-specific carbon footprints.9,12,13 This gap is significant given the energy-intensive nature of emergency care and the growing imperative for health systems to reduce GHG emissions. For broader context, healthcare systems are responsible for 4-5% of global GHG emissions,18 with the U.S. health sector producing 8.5-10% of total U.S. emissions, reaching 1,692 kilograms per capita in 2018, the highest rate among industrialized nations.4,5 Moving forward, ED-level carbon accounting and evaluation of targeted sustainability interventions will be essential for translating conceptual recommendations into measurable practice.
Climate Resilience Interventions
All included studies emphasized resilience, underscoring that EDs are critical nodes of health system preparedness and continuity during climate-related events. Findings consistently revealed deficits in hospital disaster planning and surge capacity, particularly in low- and middle-income countries. Rublee et al reported that only 20% of hospitals in Tanzania had disaster plans and fewer than half had ICU capacity, while in Sri Lanka only 13% of hospitals had disaster plans and most respondents lacked disaster training.10 In Vietnam, more than 80% of health workers had not received formal disaster preparedness education.10 Even in high-resource settings, infrastructure vulnerabilities such as unstable power supply, inadequate ventilation, and supply chain disruptions were highlighted as risks to ED continuity.11,13 Clinical preparedness tools, such as the mnemonic A CLIMATE15 and condition-specific care
Moujaes et al.
The “Climate-Smart” ED: Scoping Review of Progress and Potential
pathways,11 demonstrate early steps toward integrating climate considerations into everyday ED practice. Similarly, examples of syndromic surveillance in New York City and pre-heat alerts in Phoenix illustrate the potential of linking ED data with early-warning systems.11,13 Yet these efforts remain fragmented, and systematic evaluations of their effectiveness are lacking.
Framework Utilization
The literature frequently cited global and national frameworks including the WHO climate-resilient health systems framework, the Sendai Framework for Disaster Risk Reduction, and the HHS Sustainable and Climate-Resilient Healthcare Facilities Toolkit as reference points for action.9–11,14 Municipal and regional planning tools, such as the Accra Climate Action Plan, were also described.14 Nicholas et al introduced the only ED-specific framework, A CLIMATE, as a tool to guide clinicians in integrating climate considerations into patient care. The acronym stands for “A— Act immediately to stabilize life- and limb-threatening conditions; C—Consider the climate-and-health etiology of symptoms; L—Learn from a climate health history; I— Implement a climate- and health-focused assessment; M— Manage the ongoing care of the climate-related emergency; A—Act to integrate an action plan that includes physiological and psychological climate symptoms; T—Treat urgent climate symptoms and consequences; and E—Evaluate, educate, and refer for long-term follow-up.”15 Across studies, frameworks were referenced but not reported as being fully operationalized within ED settings. For context, updated versions of these frameworks continue to emphasize health system decarbonization and resilience.19
Opportunities for Development
Several recurring themes emerged across studies as opportunities for advancing ED sustainability and resilience. Research priorities include the need for empirical studies that evaluate ED-specific interventions, as the current evidence base is dominated by conceptual and review papers.10,13-15 Operational recommendations emphasize standardized preparedness checklists, simulation-based disaster training, and the incorporation of sustainability and resilience indicators into ED quality improvement processes.9,10,14 Systems-level integration was identified as crucial, with calls for closer collaboration between EDs, hospital operations, public health, EMS, and community services.11,13,14 Finally, equity considerations were consistently highlighted, with recognition that children, older adults, pregnant persons, and socially marginalized groups face disproportionate risks during climate-related.9,11,13,14
Implications for Emergency Medicine
The findings of this review suggest that emergency
medicine is at an early but pivotal stage in dealing with climate change. Emergency departments have been described as experiencing “a large burden” from climate change through their focus on urgent and emergency care, their role as a safety net for vulnerable populations, and their leadership in disaster medicine.11 Yet the specialty has not yet translated this recognition into widespread operational change. As health systems pursue decarbonization goals and prepare for increasing climate shocks, EDs have a unique opportunity to serve as both test sites and exemplars of climate-smart care.12 This will require integrating environmental sustainability into departmental quality initiatives, adopting resilience metrics as part of preparedness processes, and ensuring that equity remains central to all climate and health strategies.
LIMITATIONS
This scoping review has several limitations. First, the number of eligible studies was small, and the evidence base remains limited in both scope and depth. Most included papers were conceptual or review-based rather than empirical, and only a few provided primary data from hospital preparedness surveys. Thus, our synthesis reflects proposed frameworks and recommendations more than evaluated interventions. Second, while we sought to capture ED-specific initiatives, much of the available literature reported on hospital- or EMS-level strategies, and no study provided quantitative data on ED-specific carbon footprints. Third, the included studies varied widely in geographic focus, methodology, and level of detail, which limited direct comparison across settings. Fourth, although we conducted a systematic search across major databases, relevant articles may have been missed, particularly those published in the gray literature or in languages other than English.
Additionally, many of the included studies predated recent policy developments, such as the 2023 WHO Operational Framework for Climate-Resilient and Low-Carbon Health Systems and updated global frameworks from the HHS. Because many of the included studies were published more than five years ago, it is possible that additional ED-level sustainability and climate-smart interventions have been implemented more recently but have not yet appeared in the peer-reviewed literature. The existence of these newer frameworks suggests that efforts to reduce the GHG impact of ED operations may already be underway but remain unreported. Although this review primarily focused on peer-reviewed evidence, emerging national-scale sustainability efforts, such as those currently being implemented within the British NHS, including the introduction of electrically powered, renewably powered ambulances, indicate that system-wide changes in emergency and prehospital care are ongoing but incompletely captured in published research.
These developments also highlight differences in healthsystem organization across countries. In the United Kingdom, the NHS operates a unified national EMS system, which may
facilitate large-scale transitions to low-emission emergency transport. In contrast, the fragmented and locally governed EMS structure in the U.S. may pose barriers to similar implementation efforts. Additionally, because more recent initiatives may not yet be published, the true extent of current ED sustainability and resilience practices may be underestimated. These limitations highlight the need for more empirical research on ED-specific interventions and the development of standardized outcome measures to guide climate-smart healthcare initiatives.
CONCLUSION
This scoping review represents one of the first examinations of sustainability and climate resilience initiatives specific to EDs. Our findings reveal a striking paradox: While EDs are both major contributors to healthcare’s environmental footprint and frontline responders to climate-related health threats, there exists a profound gap between conceptual frameworks and operational implementation. Despite recommendations from global health organizations and the existence of multiple climate-resilience frameworks, we identified no studies documenting fully implemented climatesmart EDs. This is particularly concerning given that healthcare systems contribute 4-5% of global greenhouse gas emissions, with emergency care representing one of the most resource-intensive components of hospital operations. In the U.S., this impact is more pronounced, with healthcare responsible for an estimated 8.5-10% of national greenhouse gas emissions. far exceeding the global average and underscoring the urgency for EDs to adopt and operationalize mitigation strategies. The literature consistently describes what EDs should do to address climate change but provides no evidence of what they are doing.
The climate and health crisis demands immediate action from the specialty of emergency medicine. Emergency departments occupy a unique position as both environmental contributors and essential responders in climate disaster response. This represents an opportunity for emergency medicine to lead healthcare’s climate response while improving patient outcomes and reducing operational costs. The co-benefits documented in hospital-level interventions— such as the 31% reduction in ambulance CO₂ emissions and $3 million savings from device reprocessing programs— suggest significant potential returns on investment.
Emergency medicine now stands at a pivotal moment. The frameworks exist, the urgency is clear, and the opportunity for impact is large. What is needed is the translation of recommendations into practice through research, standardized outcome measures, and systematic implementation of EDspecific interventions. Future efforts must focus on evaluation of sustainability initiatives, development of climate-resilience metrics, and integration of equity considerations into all climate and health strategies.
The time for conceptual discussion has passed. Emergency departments must now move beyond frameworks to become active implementers of climate-smart healthcare practices. This shift from theory to practice is critical for addressing both patient health outcomes and environmental impact.
Address for Correspondence: Lea Moujaes, MD, Johns Hopkins University School of Medicine, Department of Emergency Medicine, 1830 E Monument Street, Baltimore, Maryland 21205. Email: lmoujae1@jhmi.edu.
Conflicts of Interest: By the WestJEM article submission agreement, all authors are required to disclose all affiliations, funding sources and financial or management relationships that could be perceived as potential sources of bias. No author has professional or financial relationships with any companies that are relevant to this study. There are no conflicts of interest or sources of funding to declare.
1. World Health Organization. Climate change. 2023. Available at: https://www.who.int/news-room/fact-sheets/detail/climate-changeand-health. Accessed September 23, 2025.
2. Chung JW, Meltzer DO. Estimate of the carbon footprint of the US health care sector. JAMA. 2009;302(18):1970-2.
3. Josh Karliner, Scott Slotterback, Richard Boyd, et al. Health care without harm. Health care’s climate footprint: how the health sector contributes to the global climate crisis and opportunities for action. 2019. Available at: https://www.commonwealthfund.org/publications/ explainer/2022/apr/how-us-health-care-system-contributes-climatechangehttps://global.noharm.org/sites/default/files/documentsfiles/5961/HealthCaresClimateFootprint_092319.pdf. Accessed May 10, 2025.
4. The Commonwealth Fund. How the U.S. health care system contributes to climate change. 2022. Available at: https://www.commonwealthfund. org/publications/explainer/2022/apr/how-us-health-care-systemcontributes-climate-change. Accessed November 12, 2025.
5. Eckelman MJ, Huang K, Lagasse R, et al. Health care pollution and public health damage in the United States: an update. Health Aff (Millwood). 2020;39(12):2071-9.
6. World Health Organization. Operational framework for building climate resilient health systems. 2015. Available at: https://www.who. int/publications/i/item/operational-framework-for-building-climateresilient-health-systems. Accessed September 23, 2025.
7. UCI Health. UCI Health making history with nation’s first all-electric acute care hospital. 2025. Available at: https://www.ucihealth.org/about-us/ news/2025/06/all-electric-hospital. Accessed November 20, 2025.
8. NHS England. Delivering a “Net Zero” National Health Service. 2022. Available at: https://www.england.nhs.uk/greenernhs/wp-content/ uploads/sites/51/2020/10/delivering-a-net-zero-national-healthservice.pdf. Accessed November 12, 2025.
9. Ghazali DA, Guericolas M, Thys F, et al. Climate change impacts on disaster and emergency medicine focusing on mitigation disruptive effects: an international perspective. Int J Environ Res Public Health. 2018;15(7):1379.
10. Rublee C, Bills C, Sorensen C, et al. At ground zero—emergency units in low- and middle-income countries building resilience for climate change and human health. World Med Health Policy. 2021;13(1):36-68.
11. Sorensen CJ, Salas RN, Rublee C, et al. Clinical implications of climate change on US emergency medicine: challenges and opportunities. Ann Emerg Med. 2020;76(2):168-78.
12. Linstadt H, Collins A, Slutzman JE, et al. The climate-smart emergency department: a primer. Ann Emerg Med. 2020;76(2):155-67.
13. Hess JJ, Heilpern KL, Davis TE, et al. Climate change and emergency medicine: impacts and opportunities. Acad Emerg Med. 2009;16(8):782-94.
14. Theron E, Bills CB, Calvello Hynes EJ, et al. Climate change and emergency care in Africa: a scoping review. Afr J Emerg Med. 2022;12(2):121-8.
15. Nicholas PK, Breakey S, McKinnon S, et al. A CLIMATE: a tool for assessment of climate change-related health consequences in the emergency department. J Emerg Nurs. 2021;47(4):532-42.e1.
16. Hillingdon Hospitals NHS Foundation Trust. UK first as all patient ambulances go electric. 2025. Available at: https://thh.nhs.uk/ news-events/uk-first-as-all-patient-ambulances-go-electric-2403/. Accessed November 20, 2025.
17. BBC News. Electric ambulances trialled in North Yorkshire. 2025. Available at: https://www.bbc.com/news/articles/c2emywnpeg2o. Accessed November 20, 2025.
18. Rodríguez-Jiménez L, Romero-Martín M, Spruell T, et al. The carbon footprint of healthcare settings: a systematic review. J Adv Nurs. 2023;79(8):2830-44.
19. World Health Organization. WHO unveils framework for climate resilient and low carbon health systems. 2023. Available at: https:// www.who.int/news/item/09-11-2023-who-unveils-framework-forclimate-resilient-and-low-carbon-health-systems. Accessed September 23, 2025.
Climate Change and Emergency Medicine: A Scoping Review Across Emergency Medicine Subspecialties
Lea Moujaes, MD*
Kayla Iuliucci, MD*
Stefan Wheat, MD†
Section Editor: Shahram Lotfipour, MD, MPH
Johns Hopkins University School of Medicine, Department of Emergency Medicine, Baltimore, Maryland
University of Washington, Department of Emergency Medicine, Seattle, Washington
Submission history: Submitted September 30, 2025; Revision received January 7, 2026; Accepted January 7, 2026
Electronically published May 13, 2026
Full text available through open access at http://escholarship.org/uc/uciem_westjem DOI 10.5811/westjem.52979
Introduction: Climate change is reshaping emergency medicine (EM) practice through rising temperatures, extreme weather events, and deteriorating air quality. Emergency medicine serves as a critical frontline indicator for climate-sensitive health conditions, yet evidence describing climate impacts across EM subspecialties remains fragmented. This scoping review synthesizes existing literature at the intersection of climate change and EM to identify key findings, knowledge gaps, and priorities for building climate-resilient emergency care systems.
Methods: We conducted a scoping review with reporting aligned to the PRISMA Extension for Scoping Reviews. We searched PubMed, Scopus, and Embase through March 2025, combining climate-related terms with EM terms. Two independent reviewers screened 794 articles, with 35 studies meeting inclusion criteria. We extracted data on study characteristics, climate exposures, EM outcomes, vulnerable populations, and system-level impacts across five EM subspecialties: emergency medical services; trauma; disaster medicine; toxicology; and mental health.
Results: Across 35 studies spanning five EM subspecialties, most examined temperature-related exposures, with additional focus on extreme weather events and air quality. In emergency medical services, heatwaves and compound climate events were associated with increased call volume and operational strain, with vulnerabilities identified among older adults, working-age males, and populations in resource-limited settings. Trauma studies demonstrated consistent associations between ambient temperature and injury patterns, including traffic injuries, falls, and assaults with reproducible lag effects of 1-6 days. Disaster medicine studies highlighted critical preparedness and infrastructure gaps, including limited emergency management capacity, and predictable post-event surges in emergency department (ED) utilization. Toxicology studies linked higher temperatures and air quality changes to increased emergency visits for substance-related overdoses and respiratory conditions, while mental health studies consistently reported increased ED use and hospitalizations for psychiatric and substance use disorders during periods of extreme heat. Across subspecialties, socially marginalized populations, including individuals experiencing homelessness, those of lower socioeconomic status, older adults, and people with mental health or substance use disorders were disproportionately affected.
Conclusion: Climate change is placing increasing strain on emergency care systems while amplifying existing health inequities. Current evidence is limited by geographic concentration in high-income settings, a predominant focus on temperature-related hazards, a lack of evaluated interventions, and insufficient integration of climate projections into health system planning. Addressing these gaps will be essential for developing climate-informed emergency medicine strategies capable of protecting vulnerable populations as climate-related health risks intensify.
[West J Emerg Med. 2026;27(3)512–520.]
INTRODUCTION
Climate change represents a critical population health emergency, fundamentally altering disease patterns and healthcare utilization while disproportionately impacting vulnerable communities.1,2 Rising global temperatures, increased frequency of extreme weather events, and deteriorating air quality are creating unprecedented challenges for healthcare systems worldwide, with emergency medicine (EM) at the frontline for climate-related health impacts among the most at-risk populations.3,4
Emergency departments and emergency medical services (EMS) function as critical safety nets for climate-sensitive health conditions, including heat emergencies, respiratory exacerbations, mental health concerns, and increased incidence of trauma. These climate-related presentations strain emergency care systems while highlighting the uneven distribution of climate health burdens across different populations and geographic regions.4,5 Beyond direct patient care, climate change poses operational challenges that threaten the delivery of equitable emergency care. Extreme weather events can overwhelm emergency services in vulnerable communities, disrupt transportation networks essential for accessing care, and damage healthcare infrastructure in areas with limited adaptive capacity.6,7 These cascading effects underscore the urgent need for resilient, climate-informed emergency care systems capable of protecting the most vulnerable during climate emergencies.8,9
While individual studies have documented associations between weather patterns and specific health outcomes,10–14 comprehensive understanding of climate impacts across EM subspecialties including EMS, trauma, toxicology, disaster medicine, and mental health remains fragmented, particularly among high-risk communities. Current EM training curricula provide limited guidance on climate-informed care, leaving practitioners underprepared to respond effectively to the growing frequency and intensity of climate-related disasters.15–17
This scoping review maps existing literature at the intersection of climate change and EM, identifying key findings, knowledge gaps, and educational needs across subspecialties with particular attention to vulnerable populations. By synthesizing evidence on climate exposures and emergency healthcare use, this review will inform development of climate-informed emergency care strategies essential for building resilient, equitable EM systems capable of effectively serving vulnerable communities facing accelerating climate impacts.
METHODS
Study Design
We conducted a scoping review to characterize existing literature at the intersection of climate change and EM across five subspecialties: EMS; trauma; disaster medicine;
Population Health Research Capsule
What do we already know about this issue?
Climate change increases ED visits, EMS demand, and worsens outcomes, disproportionately affecting vulnerable populations.
What was the research question?
What are climate change impacts, gaps, and priorities across EM subspecialties?
What was the major finding of the study?
Across 35 studies, heat exposure was associated with increased injury risk (RR 1.08/°C, 95% CI 1.03–1.14) and higher emergency care utilization.
How does this improve population health?
We identify urgent gaps to guide climateresilient emergency systems and mitigate escalating, inequitable climate health impacts.
toxicology; and mental health. This scoping review was conducted to map the breadth of evidence and identify knowledge gaps across heterogeneous exposures, outcomes and study designs. Reporting of this review aligns with the Preferred Reporting Items for Systematic Reviews and Meta-Analyses–Extension for Scoping Reviews.
Search Strategy
We conducted comprehensive searches in PubMed, Scopus, and Embase through March 2025 in collaboration with a medical librarian. We used controlled vocabulary (MeSH, Emtree) and free-text terms combining climaterelated terms (“climate change,” “global warming,” “extreme weather,” “heat wave”) with EM terms (“emergency medicine,” “emergency department,” “emergency medical services”). Google Scholar was searched for additional gray literature. Gray literature was defined as non–peer-reviewed scholarly content indexed within Google Scholar, such as reports, theses, or conference proceedings. We conducted searches using predefined strategy and fixed time window; studies published after completion of the initial search were not eligible for inclusion.
ELIGIBILITY CRITERIA
Inclusion criteria were as follows: articles discussing climate change or environmental exposures/events related to
EM subspecialties, published in English, describing empirical research, interventions, or conceptual frameworks. Exclusion criteria were articles not addressing EM contexts or consisting solely of editorials without empirical content.
Study Selection
After duplicate removal, 794 articles underwent title/ abstract screening by two independent reviewers. Articles meeting criteria advanced to full-text review, with 35 meeting final inclusion criteria.
Data Extraction
Two reviewers independently extracted data using a standardized abstraction framework, with discrepancies resolved through discussion. Extracted elements included study characteristics (design, location, population, subspecialty); climate exposures (temperature, extreme weather, air quality); EM outcomes (ED visits, EMS calls, hospitalizations), vulnerable populations and temporal patterns, and system-level impacts, including educational or operational considerations.
RESULTS
Thirty-five studies spanning five EM subspecialties met inclusion criteria: EMS (n = 13); trauma (n = 4); disaster medicine (n = 7); toxicology (n = 2); and mental health (n = 9). Studies were conducted primarily in Asia, Europe, North America, and Australia, with limited representation from low-resource regions. Observational designs predominated, including time-series analyses, retrospective ecological studies, case–crossover designs, Delphi methods, and qualitative approaches (Table 1).
Emergency Medical Services
Most studies focused on temperature-related exposures, particularly heat waves and ambient temperature effects on EMS demand. In Japan, analysis of heat stroke–related ambulance transports across all 47 prefectures using wet-bulb globe temperature showed regional variation in risk, with
evidence of heat adaptation in chronically warmer areas.18 In Queensland, Australia, ambulance calls increased by 12.68% during heatwaves, with the largest proportional increases occurring during low- and severe-intensity events and among residents of very remote areas and major cities.19 Injuryrelated EMS demand was also climate-sensitive. In Chengdu, China, temperatures above 17.9 °C were associated with higher injury risk (risk ratio [RR] 1.08 per 1 °C increase, 95% CI, 1.03–1.14), peaking at 2–4 days.20 In Shenzhen, China, compound cold and strong monsoon events, and periods of low temperatures accompanied by heavy precipitation, were associated with increased all-cause calls (cumulative RR [CRR] 1.401) and endocrine-related calls (CRR 1.641), while compound heat waves combined with lightning significantly impacted digestive and endocrine disease presentations, as reported in observational analyses.21
Consensus-building studies, including Delphi methods that synthesize expert agreement across multiple rounds of structure surveys, further underscored systemic vulnerabilities. A Finnish Delphi study with EMS and emergency department experts identified 14 climate-related challenges across health impacts, workload, operational strain, and societal disruption.6 An international Delphi study with experts from multiple countries highlighted 18 consensus statements on heat wave–related overload, underscoring disparities between the income level of countries and the need for system-level adaptation planning.22
Trauma
Quantitative analyses consistently linked extreme temperatures to trauma-related emergencies. In Chongqing, China, high temperatures (32 °C vs 9 °C) increased risks of traffic accidents (CRR = 1.346, 95% CI, 1.167–1.552), assault-related injuries (CRR = 1.508), falls from height (CRR = 1.871), and sharp injuries (CRR = 2.112), while low temperatures (7 °C) increased fall risk (CRR = 1.220).23 In Chengdu, temperatures above 17.9 °C raised injury risk by 1.08-fold per 1 °C (95% CI, 1.03–1.14), with traffic accidents, poisoning, and falls most common.20 In Korea, nontraumatic injuries, defined as injuries such as drowning, poisoning,
Table 1. Characteristics of a scoping review conducted to characterize existing literature at the intersection of climate change and emergency medicine.
Subspecialty # Studies
Study locations
EMS 13 Asia (7), Europe (3), Australia (2), Multinational (1)
Mental Health 9 Brazil, Beijing, Toronto, USA, Canada, Sydney
EMS, emergency medical services; USA, United States of America.
Observational (9)
burns, electrical injuries, and other non-mechanical injury mechanisms, increased by 1.95% per °C (95% CI. 1.28–2.62%), while traumatic injuries followed nonlinear patterns with a threshold around 0 °C.24
Across studies, consistent lag effects (1–6 days) and heightened risks among males and adults were observed. A policy analysis from Pakistan emphasized inadequate health expenditure, rural–urban disparities, and climate-related trauma burdens. 25
Disaster Medicine
Studies consistently revealed infrastructure and preparedness gaps. In China, only 36.5% of hospitals maintained emergency management offices, while 74% of nurses reported inadequate heat-preparedness knowledge.26 In Pakistan, limited health expenditure and rural–urban disparities constrained capacity.25 Temporal analyses showed rising disaster frequency. In Taiwan, extreme weather accounted for 92.2% of events reported to regional emergency medical operation centers (2014–2018).27 A global review reported a fivefold increase in major climate-related disasters over 50 years.28 In Ireland’s 2018 blizzard, emergency department volumes initially decreased during snowfall but surged afterward, with 71 cases distributed across injuries, medical, logistical, and social presentations.29
Operational adaptations, such as reallocation of emergency department and inpatient beds, workflow changes to maintain patient throughput, and flexible staffing and transfer practices implemented during disaster response, were also observed. During Hurricane Harvey, despite 74% inpatient bed loss, median emergency department length of stay decreased for admitted patients (591 vs 723 minutes) and discharges (261 vs 336 minutes), reflecting changes in care delivery processes implemented during disaster response rather than demonstrated causal effects.30
Toxicology
Two United States (U.S.) studies linked climate exposures to toxicologic emergencies. In California, analysis of more than 3.4 million ED visits showed higher daily temperatures associated with overdoses, compared with non-overdose ED visits, particularly amphetamines (odds ratio 1.15, 95% CI, 1.09–1.22 comparing 95th vs 50th percentile), as well as cocaine and opioids. Effects were strongest for overdoses.31 A projection study estimated that under Representative Concentration Pathway (RCP) 4.5, a moderate emissions scenario, compared to RCP 8.5, a high emissions scenario, approximately 3,100 asthma ED visits and $1.7M in costs could be averted, underscoring benefits of climate mitigation.32
Mental Health
All included studies reported positive associations between elevated temperatures and mental health–related ED
use or hospitalizations.33–40 In Brazil, lower socioeconomic status public patients were more vulnerable than private patients.36 In Beijing, increased projected burdens, defined as higher ED visits and hospital admissions, were observed for schizophrenia, substance-use disorders, women, and adults < 65 years of age.38 In Toronto, extreme heat increased ED visits for schizophrenia, mood, and neurotic disorders by 29% (99th vs 50th percentile).39
In the U.S., heat was linked to 3-4 fold increases in admissions for depression, schizophrenia, and bipolar disorder, based on nationwide time-stratified case–crossover analyses comparing exposure on admission days with matched control days33; and other national analyses documented increased ED visits and suicide risk during heat exposure.35,37,38 Canadian studies identified increased ED visits counts and hospital admissions for schizophrenia, dementia, and substance misuse during periods of elevated temperature.34 In Sydney, Australia, homeless men were identified as particularly vulnerable to heat-related illness with significant healthcare costs.40
Across subspecialties, several consistent patterns of vulnerabiliy emerged. Males and working-age adults faced higher risks in trauma and EMS studies, while older adults, individuals with substance use or psychiatric disorders, and socially marginalized populations such as individuals experiencing homelessness were disproportionately affected across multiple domains. Systems-level gaps in preparedness, resource allocation, and climate adaptation were identified in multiple studies. These vulnerabilities and system-level findings are summarized in Table 2.
DISCUSSION
Emergency Medical Services
Climate change is fundamentally altering the landscape of EMS through multiple interconnected pathways that extend beyond direct heat-related health impacts. By modifying environmental conditions, extreme weather patterns, and population vulnerability profiles, climate change is creating unprecedented challenges for prehospital emergency care systems worldwide.6 In this scoping review, we identified 13 papers examining associations between climate-related exposures and EMS use across diverse geographic contexts. Collectively, these studies demonstrate that temperature extremes and compound weather events are consistently associated with increased EMS demand, underscoring EMS as a critical frontline indicator for emerging climate-sensitive health risks.18,19,21
The predominant focus on temperature-related exposures reflects both the relative maturity of heat-health research and the immediate operational challenges posed by extreme heat events to emergency medical systems. Several large-scale analyses demonstrated graded, nonlinear, or threshold-based associations between ambient temperature and EMS utilization, with
Table 2. Climate vulnerabilities and policy implications identified in a scoping review conducted to characterize existing literature at the intersection of climate change and emergency medicine.
EMS Males, working-age adults (18–44), elderly ≥ 65; disparities between income-level countries
Trauma Males, adults 18–59, elderly ≥ 65; lag effects 1–6 days
Disaster Nurses with low preparedness (74% lacked knowledge); rural vs urban disparities; varied event patterns by disaster type
Toxicology Individuals with substance use disorders (amphetamine, cocaine, opioids); asthma patients in high-ozone areas
Mental Health Women, youth, psychotic and substanceuse disorders, homeless, low SES, dementia patients
Lack of EMS adaptation planning; disparities in resources between highand low-income regions; limited system-level strategies for compound climate events
No training/educational interventions identified; inadequate trauma system preparedness in climate-vulnerable regions (e.g., Pakistan); translational gap from data to protocols
Critical gaps in disaster preparedness infrastructure; limited hospital emergency management offices; need for structured training programs and resilient infrastructure
Overdose risks exacerbated by rising temperatures; need for integrated heat- and climate-adapted substance use interventions; importance of climate mitigation for respiratory outcomes
Inadequate integration of climate risk into mental health systems; lack of preventive strategies for vulnerable groups; need for heat-adaptive services and early-warning interventions
EMS, emergency medical services; SES, socioeconomic status.
evidence suggesting partial regional adaptation in chronically warmer settings.18 However, elevated risks persisted during extreme heat events, particularly among older adults, indicating that adaptation remains incomplete and unevenly distributed.18,19 Studies examining compound weather exposures suggest that simultaneous hazards, such as low temperature combined with heavy precipitation, may amplify EMS demand beyond what is captured by single-exposure frameworks.21 These findings highlight the importance of moving beyond isolated climate variables toward more integrated exposure models that better reflect real-word conditions.21
Across EMS literature, several limitations were consistent, including reliance on ecological (population-level) study designs, limited representation of low-resource settings, and minimal integration of climate projections. These gaps constrain the ability of EMS systems to anticipate future demand and to design proactive, climate-informed response strategies, reinforcing the need for broader geographic coverage and forward-looking analysis.22,41
Trauma
Building on the evidence that heat contributes to surges in EMS demand, we identified four studies examining association between temperature and trauma-related emergency care utilization. While multiple environmental pathways may influence injury risk, including occupational exposures, behavioral changes, and infrastructure vulnerabilities, the four studies reviewed here focus specifically on temperature as a primary exposure of interest. Together, they demonstrate that fluctuations in temperature, particularly extreme heat, are associated with consistent
patterns of trauma-related demand for EMS and ED use across diverse geographic and socioeconomic settings.20,23–25
Across studies conducted in China and South Korea, increases in temperature were associated with higher volumes of trauma-related emergency presentations across multiple injury categories, including traffic accidents and falls. 20,23 Several analyses reported nonlinear or threshold-based associations between temperature and injury-related utilization;23,24 however, given the observational nature of the included studies, the available evidence does not permit determination of causal mechanisms or formal dose–response relationships.
Despite differences in climate, methodology, and population demographics, males and young to middle-aged adults were consistently identified as groups experiencing higher temperature-related trauma burden. These patterns may reflect occupational exposures, behavioral changes, or increased outdoor activity during warmer conditions. However, all included studies were observational, limiting causal inference.20,23–25 Notably, none of the included trauma studies evaluated preventive or adaptive interventions such as responder training, early warning systems, or public education strategies, despite the predictability of temperature-related injury patterns. This absence highlights a translational gap between epidemiologic evidence and actionable trauma prevention strategies, a theme echoed across other EM subspecialties and further detailed in the Common Gaps and Priorities section.
Disaster
Medicine
Beyond injuries linked to heat and behavior, climate change also magnifies large-scale disasters that disrupt entire
emergency care systems. Seven studies reviewed here showed that climate-related events consistently produced predictable surges in healthcare utilization, exposed systemic weaknesses, and highlighted opportunities for adaptation.26,27,29,30 Common vulnerabilities emerged across diverse hazards and geographies: inadequate infrastructure; rural–urban disparities; insufficient staffing; and gaps between perceived and actual preparedness. Several studies documented predictable temporal patterns of healthcare demand surrounding disaster events, yet none evaluated systematic educational interventions or formal clinician training, leaving a critical translational gap between surveillance and actionable preparedness.
Equity dimensions were particularly pronounced. Highincome countries leveraged sophisticated data systems and analytic approaches to quantify disaster-related health risks, while studies from Pakistan and other resource-limited settings highlighted fundamental deficits in infrastructure, staffing, and financing that constrained emergency response capacity.25 These disparities emphasize the urgency of prioritizing adaptive capacity building in settings where baseline resources are lowest, and climate vulnerability is greatest.
Operational adaptations, defined as changes in the ED workflows, staffing models, or care delivery processes implemented during climate-related disasters, were also described. During Hurricane Harvey, despite a reported 74% loss of inpatient bed capacity, median ED length of stay decreased for both admitted patients and discharges, reflecting changes in care delivery processes implemented during crisis response rather than evidence of causal improvement attributable to specific interventions.30 Importantly, the study did not report quantitative staffing increases or workforce expansion; observed differences were attributed to processlevel adaptations in patient flow and care delivery under disaster conditions rather than to increased staffing. While these findings suggest that disaster conditions can catalyze innovation, they should not obscure the profound human, operational, and economic costs associated with climatedriven disasters.
Despite these observations, important limitations persist. Most disaster-focused studies examined single hazards, lacked integration with climate projection models, and did not account for compound or cascading events that may pose the greatest risks to emergency care systems. At the policy level, frameworks such as the Sendai Framework for Disaster Risk Reduction emphasize the role of health systems in disaster preparedness and resilience, reflecting global recognition of healthcare as a core component of disaster risk production. However, substantial gaps remain between policy commitments and on-the-ground implementation.42 Together, these findings underscore the urgent need for proactive, climate-informed disaster preparedness and align with the shared research and policy priorities detailed in the Common Gaps and Priorities section.
Toxicology
Our review identified two studies directly linking climate-related exposures—heat and ozone—to ED visits for drug-related toxicity and asthma. These studies underscore the emergency department’s critical role as a frontline detector for emerging climate-sensitive toxicologic harms, while also illustrating the limitations of existing evidence. Traditional toxicology frameworks, which often examine single chemicals under static conditions, may not adequately capture the dynamic, interacting exposures now emerging under climate change43,44
Social Vulnerabilities and Mental Health
This review adds to the growing evidence that climate change directly and indirectly worsens mental health, increasing demand on EDs. Consistent with existing literature, we found that rising temperatures and heatwaves were strongly associated with higher ED use for a range of mental health disorders, including schizophrenia, depression, bipolar disorder, substance misuse, and personality disorders. These findings align with previous work showing that both acute climate-related events and chronic environmental stressors can trigger or exacerbate mental illness.45–47 Importantly, our review also highlighted the disproportionate burden, manifested as higher ED use, among socially and economically marginalized groups, including individuals reliant on public healthcare systems and those experiencing homelessness, reinforcing how climate change amplifies existing inequities.46
While the studies reviewed focused primarily on heat exposure, broader literature documents indirect pathways through which climate hazards affect mental health, including trauma related to bushfires, flooding, displacement, and livelihood loss, contributing to post-traumatic stress disorder, depression, anxiety, and increased risk of substance misuse and violence.46,48 Air pollution has also emerged as an important contributor, with short-term exposures to fine particulate matter and nitrogen dioxide associated with increased psychiatric hospital admissions for depression, schizophrenia, and bipolar disorder in older adults.33 Together, these findings underscore the multifaceted pathways by which climate hazards strain mental health and emergency care systems.
Our focus on ED presentations excluded community-based or subclinical mental health impacts and did not systematically capture studies addressing indirect climate pathways. These limitations, along with the need for improved surveillance and integration of mental health with climate resilience planning, are expanded in the Common Gaps and Priorities section, which outlines potential directions for actionable next steps.
Common Gaps and Priorities
Consistent with the stated objective of this scoping review to identify knowledge gaps across EM subspecialties, we
Moujaes
synthesized cross-cutting gaps and priorities that emerged across EMS, trauma, disaster medicine, toxicology, and mental health. This section reflects author synthesis informed by the reviewed literature, rather than findings abstracted directly from individual studies, and is intended to highlight shared vulnerabilities and strategic directions for future research and practice.
Limited Geographic and Socioeconomic Scope
Across all domains, the geographic and socioeconomic scope of existing evidence remains limited. Most studies were conducted in high-income countries with well-established emergency care systems, while regions experiencing the greatest climate vulnerability and resource constraints— particularly low- and middle-income countries—were underrepresented. This imbalance restricts generalizability and limits insight into settings where climate-related health impacts may be most severe.
Methodological Constraints
Methodological limitations were pervasive. The literature was dominated by ecological and retrospective observational designs, with limited use of individual-level data, prospective approaches, or integration of climate projection models. As a result, causal inference remains limited, and the ability to anticipate future emergency care demand under evolving climate scenarios is underdeveloped.
Narrow Hazard Focus
A narrow focus on temperature-related exposures further constrained the evidence base. While heat represents a critical and well-characterized hazard, substantially fewer studies examined other climate-related threats, including wildfire smoke, flooding, extreme precipitation, and compound or cascading events. This emphasis may underestimate the full spectrum of climate-sensitive risks facing emergency care systems.
Translational Gaps
Despite increasingly consistent documentation of climaterelated surges in emergency care utilization, few studies evaluated adaptive interventions. Early warning systems, workforce adaptation strategies, resilient infrastructure design, and community-based prevention efforts were rarely assessed, leaving a persistent translational gap between epidemiologic evidence and actionable preparedness.
Equity and Health-System Resilience
Equity considerations emerged as a central but incompletely addressed theme. Populations experiencing homelessness, rural communities, individuals with mental health or substance use disorders, those dependent on underresourced health systems were consistently identified as vulnerable, yet few studies examined how structural inequities
shape exposure, access to care, or adaptive capacity. Addressing these disparities will require research and policy efforts that center equity and capacity building in high-risk, low-resource settings.
Taken together, these gaps highlight several priorities for EM. These priorities reflect our interpretation informed by the reviewed literature and are intended to guide future research and preparedness efforts rather than represent evaluated interventions. Key priorities include the following:
1. Establishing international, multisite surveillance systems capable of detecting emerging hazards in real time
2. Integrating climate projection models directly with health service planning to guide infrastructure investment and workforce allocation
3. Designing and rigorously evaluating targeted interventions, such as climate-triggered EMS dispatch algorithms, heat-resilient power and water systems, and mental health integration into disaster planning, to enhance system resilience
4. Prioritizing capacity building and policy development in the low-resource, high-risk settings
LIMITATIONS
This review has several limitations. Most included studies focused on temperature-related exposures, with far fewer examining hazards such as wildfire smoke, flooding, or compound climate events. Evidence was also uneven across subspecialties: EMS, trauma, and mental health were relatively well represented, whereas toxicology and certain disaster domains had limited coverage. Further, most included studies were ecological or observational, limiting causal inference and leaving individual-level factors, such as socioeconomic status and comorbidities, insufficiently addressed. Few incorporated climate projection models, restricting insights into future emergency care demand under evolving climate scenarios. Research was also concentrated in high-income, data-rich settings, limiting applicability to lowand middle-income regions where climate impacts may be greatest and emergency care capacity most limited.
Finally, heterogeneity in definitions of climate exposures and emergency care outcomes reduced comparability across studies. While some studies highlighted disparities affecting vulnerable populations, few systematically assessed equity, limiting the ability of this review to fully characterize differential impacts across social and demographic groups.
CONCLUSION
Climate change is reshaping the landscape of emergency medicine across multiple subspecialties, driving predictable surges in demand, revealing systemic vulnerabilities, and amplifying inequities. Evidence from EMS, trauma, disaster medicine, toxicology, and mental health demonstrates that rising temperatures and extreme weather events are already
Moujaes et al. Climate Change and EM: A Scoping Review Across EM
straining frontline care. However, significant gaps remain, particularly regarding wildfire smoke, flooding, compound hazards, and toxicologic exposures.
Current emergency care frameworks are insufficient for the multi-hazard realities of a warming world. Adaptation will require shifting from reactive, event-based responses toward proactive, climate-informed preparedness. Key priorities include improved surveillance, resilient infrastructure and workforce capacity, and the integration of equity and mental health considerations. Emergency medicine stands at a critical inflection point. By embracing climate resilience as a core competency, the specialty can mitigate immediate risks, safeguard vulnerable populations, and contribute to the development of sustainable, adaptive health systems for the future.
Address for Correspondence: Lea Moujaes, MD, Johns Hopkins Department of Emergency Medicine, 1830 East Monument Street Suite 6-100, Baltimore, MD 21287. Email: lmoujae1@jhu.edu.
Conflicts of Interest: By the WestJEM article submission agreement, all authors are required to disclose all affiliations, funding sources and financial or management relationships that could be perceived as potential sources of bias. No author has professional or financial relationships with any companies that are relevant to this study. There are no conflicts of interest or sources of funding to declare.
1. Conn DB, Soares Magalhães RJ. Climate change: a health emergency for humans, animals, and the environment. One Health 2024;19:100867.
2. Haines A, Ebi K. The imperative for climate action to protect health. N Engl J Med. 2019;380(3):263-273.
3. Ebi KL, Vanos J, Baldwin JW, et al. Extreme weather and climate change: population health and health system implications. Annu Rev Public Health. 2021;42:293-315.
4. Sorensen CJ, Salas RN, Rublee C, et al. Clinical implications of climate change on US emergency medicine: challenges and opportunities. Ann Emerg Med. 2020;76(2):168-178.
5. Wiskel T, Miles TT, Fonteyn M, et al. Frontline clinic perspectives on climate change, human health, and resilience: a national crosssectional survey. BMC Prim Care. 2024;25(1):399.
6. Karstila H, Ruuhela R, Rajala R, et al. Recognition of climate-related risks for prehospital emergency medical service and emergency department in Finland – a Delphi study. Int Emerg Nurs. 2024;73.
7. Chua MT, Chung LYE, Ng EY, et al. Climate change and
environmental sustainability in emergency medicine: a narrative review. Ann Transl Med. 2025;13(3):31-31.
8. Arnell NW. The implications of climate change for emergency planning. Int J Disaster Risk Reduct. 2022;83:103425.
9. Guenther R, Balbus J. Primary Protection: Enhancing Health Care Resilience for a Changing Climate. U.S. Department of Health & Human Services; Centers for Disease Control and Prevention; The Kresge Foundation; 2014. Accessed September 11, 2025. https:// kresge.org/sites/default/files/Healthcare-Climate-ResilienceGuidance-HHS.pdf
10. Alahmad B, Khraishah H, Royé D, et al. Associations between extreme temperatures and cardiovascular cause-specific mortality: results from 27 countries. Circulation. 2023;147(1):35-46.
11. Liu J, Varghese BM, Hansen A, et al. Heat exposure and cardiovascular health outcomes: a systematic review and metaanalysis. Lancet Planet Health. 2022;6(6):e484-e495.
12. Abrignani MG, Lombardo A, Braschi A, et al. Climatic influences on cardiovascular diseases. World J Cardiol. 2022;14(3):152-169.
13. Thomson MC, Stanberry LR. Climate change and vectorborne diseases. N Engl J Med. 2022;387(21):1969-1978.
14. Rocklöv J, Dubrow R. Climate change: an enduring challenge for vector-borne disease prevention and control. Nat Immunol 2020;21(5):479-483.
15. Moretti K, Rublee C, Robison L, et al. Attitudes of US emergency medicine program directors towards the integration of climate change and sustainability in emergency medicine residency curricula. J Clim Change Health. 2023;9:100199.
16. Cois A, Kirkpatrick S, Herrin R. Climate change curricula in US graduate medical education: a scoping review. J Grad Med Educ 2024;16(6 Suppl):69-77.
17. Dresser C, Wiskel T, Giudice C, et al. A graduate medical education fellowship in climate change and human health: experience and outcomes from the first 5 years. J Grad Med Educ. 2024;16(6 Suppl):129-134.
18. Oka K, Honda Y, Hui Phung VL, et al. Potential effect of heat adaptation on association between number of heatstroke patients transported by ambulance and wet bulb globe temperature in Japan. Environ Res. 2023;216.
19. Mason HM, King JC, Peden AE, et al. Determining the impact of heatwaves on emergency ambulance calls in Queensland: a retrospective population-based study. Int J Environ Res Public Health. 2023;20(6).
20. Ruan S, Li Y, Wen Y, et al. Association between temperature and volume of emergency medical service response due to injury in Chengdu. J Environ Occup Med. 2024;41(10):1151-1161.
21. Huang X, Zheng J, He Y, et al. Association between compound extreme weather event types and the spectrum of emergency ambulance calls: a metropolitan study in Shenzhen. Environ Res 2024;263.
22. Paganini M, Valente M, Conti A, et al. Emergency medical care overload during heatwaves: a neglected topic. Eur J Emerg Med
2023;30(1):5-6.
23. Chen ZY, Hu H, Yang J, et al. Association between ambient temperatures and injuries: a time series analysis using emergency ambulance dispatches in Chongqing, China. Environ Health Prev Med. 2023;28(1).
24. Kim Y, Kim H, Shin SD, et al. Different influence of outdoor temperature on traumatic and nontraumatic injuries. J Trauma Acute Care Surg. 2012;73(4):944-949.
25. Muhammad A, Qureshi AZ, Farhan M, et al. Emergency trauma care: Pakistan’s preparedness amidst the growing impact of rapid climate change. Int J Surg Lond Engl. 2024;110(5):2532-2534.
26. Zhao L, Lin X, Zang Y. Emergency preparedness for heat illness in China: a cross-sectional observational study. Int Emerg Nurs. 2021;54.
27. Lee CH, Lin SH, Kao CL, et al. Impact of climate change on disaster events in metropolitan cities - trend of disasters reported by Taiwan national medical response and preparedness system. Environ Res 2020;183.
28. James JJ. The intersection of disaster medicine with climate and health. Disaster Med Public Health Prep. 2021;15(5):535-536.
29. Heffernan L. Impact of a blizzard on an Irish emergency department. Ir J Med Sci. 2019;188(4):1413-1415.
30. Chambers KA, Husain I, Chathampally Y, et al. Impact of Hurricane Harvey on healthcare utilization and emergency department operations. West J Emerg Med. 2020;21(3):586-594.
31. Chang HH, Zhang H, Latimore AD, et al. Associations between short-term ambient temperature exposure and emergency department visits for amphetamine, cocaine, and opioid use in California from 2005 to 2019. Environ Int. 2023;181.
32. Zhang N, Zhang H, Schiller G, et al. Unraveling the global warming mitigation potential from recycling subway-related excavated aoil and eock in China. via life xycle ssessment. Integr Environ Assess Manag. 2021;17(3):639-650.
33. Qiu X, Danesh-Yazdi M, Wei Y, et al. Associations of short-term exposure to air pollution and increased ambient temperature with psychiatric hospital admissions in older adults in the USA: a case-crossover study. Lancet Planet Health. 2022;6(4):e331-e341.
34. Lavigne E, Gasparrini A, Wang X, et al. Extreme ambient temperatures and cardiorespiratory emergency room visits: Assessing risk by comorbid health conditions in a time series study. Environ Health Glob Access Sci Source. 2014;13(1).
35. Mullins JT, White C. Temperature and mental health: Evidence from the spectrum of mental health outcomes. J Health Econ. 2019;68.
36. Corvetto JF, Helou AY, Kriit HK, et al. Private vs. public emergency visits for mental health due to heat: an indirect socioeconomic assessment of heat vulnerability and healthcare access, in Curitiba, Brazil. Sci Total Environ. 2024;934:173312.
37. Yoo EH, Eum Y, Gao Q, et al. Effect of extreme temperatures on daily emergency room visits for mental disorders. Environ Sci Pollut Res Int. 2021;28(29):39243-39256.
38. Niu YL, Lu F, Liu XJ, et al. Global climate change: effects of future temperatures on emergency department visits for mental disorders in Beijing, China. Environ Res. 2024;252.
39. Wang X, Lavigne E, Ouellette-Kuntz H, et al. Acute impacts of extreme temperature exposure on emergency room admissions related to mental and behavior disorders in Toronto, Canada. J Affect Disord. 2014;155(1):154-161.
40. English T, Larkin M, Vasquez Hernandez A, et al. Heat illness requiring emergency care for people experiencing homelessness: a case study series. Int J Environ Res Public Health 2022;19(24):16565.
41. Paganini M, Markou-Pappas N, Della Corte F, et al. Heatwaves impact on prehospital emergency medicine: a qualitative study to improve sustainability and disaster preparedness in Veneto region, Northern Italy. Sustain Switz. 2024;16(16).
42. Aitsi-Selmi A, Murray V. Protecting the health and well-being of populations from disasters: health and health care in the Sendai Framework for Disaster Risk Reduction 2015-2030. Prehospital Disaster Med. 2016;31(1):74-78.
43. Geng Z, Li H. The impact of climate change on the bioavailability of environmental toxins and their toxicological effects. Highlights Sci Eng Technol. 2022;6:33-44.
44. Nadal M, Marquès M, Mari M, et al. Climate change and environmental concentrations of POPs: a review. Environ Res 2015;143(Pt A):177-185.
45. Hwong AR, Wang M, Khan H, et al. Climate change and mental health research methods, gaps, and priorities: a scoping review. Lancet Planet Health. 2022;6(3):e281-e291
46. Cianconi P, Betrò S, Janiri L. The impact of climate change on mental health: a systematic descriptive review. Front Psychiatry. 2020;11:74.
47. Charlson F, Ali S, Benmarhnia T, et al. Climate change and mental health: a scoping review. Int J Environ Res Public Health. 2021;18(9):4486
48. Massazza A, Ardino V, Fioravanzo RE. Climate change, trauma and mental health in Italy: a scoping review. Eur J Psychotraumatology 2022;13(1):1-16.
Brief Educational Advances
Implementing a Climate Health Education Curriculum for Emergency Medicine Trainees and Faculty
Eric Lewis, DO*
Courtney M. Smalley, MD†
Matthew Kostura, MD†
Section Editor: Mark I. Langdorf, MD, MHPE
The MetroHealth System, Cleveland, Ohio Cleveland Clinic Lerner College of Medicine of Case Western Reserve University, Cleveland Clinic Health System, Department of Emergency Medicine, Cleveland, Ohio
Submission history: Submitted September 2, 2025; Revision received December 21, 2025; Accepted January 2, 2026
Electronically published May 3, 2026
Full text available through open access at http://escholarship.org/uc/uciem_westjem
DOI 10.5811/westjem.50824
As climate-related health impacts intensify, emergency physicians (EP) increasingly encounter patients whose conditions are influenced by environmental change. To provide care for climatevulnerable patients in the emergency department (ED), EPs should be educated on the impacts of climate change. The goal of our intervention was to provide a structured climate health educational curriculum to attending physicians, residents, and medical students and assess the perceived effectiveness of the curriculum. A longitudinal climate health curriculum was delivered in a fourpart lecture series over the course of three months to medical students, postgraduate year 1-3 emergency medicine residents, and academic emergency attending physicians. We measured learners’ perceived knowledge pre- and post-curriculum with surveys assessing four core areas: 1) climate change topics; 2) climate impacts on human health; 3) confidence in treating medical conditions exacerbated by climate change; and 4) climate change solutions. At the completion of the three-month curriculum, the learners reported a statistically significant improvement in perceived level of knowledge in overall climate health topics in 87.5% (28/32 concepts with P < .05) of concepts assessed during the climate health education curriculum. Specifically, learners reported a perceived knowledge improvement in concepts of general climate change (6/6 topics, P < .05), impacts on human health (7/8 topics, P < .05), confidence in treating medical conditions exacerbated by climate change (8/9 topics, P < .05), and knowledge of climate solutions (7/9 topics, P < .05). Overall, learners reported a higher median likelihood of implementing individual climate solutions after the conclusion of the climate health education curriculum, although this was not statistically significant (5.0 vs 7.0, P = .073). Our model introduces the concept of a longitudinal, lecture-based climate change curriculum to assist in educating resident learners in evidence-based climate health knowledge, assist in preparing EPs to better treat climate-vulnerable patient populations, and share climate solutions. [West J Emerg Med. 2026;27(3)521–525.]
INTRODUCTION
The United Nations Intergovernmental Panel on Climate Change Sixth Assessment Report established that the average global surface temperature of the Earth between 2011–2020 has risen by 1.09 °C since the pre-industrial period (1850–1900) and correlated with increases in the atmospheric concentration of carbon dioxide.1 There is compelling evidence that global surface temperature rise has been primarily caused by humandriven greenhouse gas (GHG) emissions.1
Multiple studies have evaluated the impact of climate change on the medical field and vulnerable patient populations.2-6 The World Health Organization conservatively projected that by the 2030s an additional 250,000 deaths per year globally would be associated with climate change impacts.7 As climate-related health impacts intensify, emergency physicians (EP) will increasingly encounter patients whose conditions are influenced by environmental change. Recent literature has further looked at how the climate
health changes will specifically affect emergency medicine (EM).2,8,9 Patients affected by heatwaves, flooding, weather disasters, cardiopulmonary illness exacerbated by poor air quality, and the expansion of vector-borne infectious diseases will seek care in the emergency department (ED).2 Therefore, EPs need to be educated on the impacts of climate change to be prepared to treat these patients.2,6,8,9 However, the literature is sparse on the implementation of a climate health curriculum in EM residency training.10,11
OBJECTIVES
The purpose of our curricular intervention was to provide structured climate health education to EPs, EM residents, and medical students and to assess its effectiveness. Using a longitudinal lecture-based curriculum, we aimed to educate learners on climate health topics, discuss selected proposed climate solutions to ameliorate effects of climate change, and assess learners’ perceived understanding of the impacts of climate change on patient health in the ED. Physicians should understand both how to treat climate-vulnerable patients and the underlying global mechanisms by which their medical conditions are worsened. We aimed to prepare EPs for climate-related health emergencies and inspire them to support climate solutions.12
CURRICULAR DESIGN
A longitudinal, climate-change educational curriculum was delivered in a four-part lecture series by an emergency attending physician or senior EM resident over three months during weekly EM resident didactic sessions in a three-year residency program. Our audience consisted of postgraduate year 1-3 EM residents, third- and fourth-year medical students who were on a one-month EM rotation, and academic emergency attending physicians. At this institution all participants receive an email describing the content of upcoming didactic sessions one week prior to the session; this also occurred during the months when the climate change curriculum was delivered. There was no additional formal recruitment of participants to the didactic sessions. While many participants likely attended more than one session, we did not track individual attendance.
The overall goal of the curriculum was to deliver educational content on climate-sensitive diseases that impact EM. While the scope of climate change and impact on health is broad, the focus was to introduce general climate-change concepts and tie those concepts to medical conditions encountered in the ED. The didactic presentations were modeled on evidence-based approaches to teaching learners with the goal of presenting scientific data in an objective manner, including discussing limitations of the available studies.
Didactic session #1 included an overview of foundational climate-change concepts and the impacts to the United States as outlined by the Fifth National Climate Assessment conducted by the National Oceanic and Atmospheric Administration.13
Additionally, the session introduced eight broad ways climate change is impacting human health.5 The initial lecture introduced the following climate topics: severe weather; air pollution; changes in disease vectors; increasing allergens; water quality; food and water supply impacts; environmental degradation; and extreme heat.3,5 Each subsequent didactic session was structured into three parts: deep dive into a climate change concept; teaching EM residency core curriculum (as per the guidelines of the Council of Residency Directors in Emergency Medicine)15 covering pathology exacerbated by climate change, and discussion of actionable climate change solutions to minimize GHG emissions (Figure 1).
To measure the effectiveness and learners’ perceived knowledge gained from the curriculum, survey data were collected at multiple points throughout the three-month period. Surveys were electronic, conducted anonymously via an email link or a QR code, completed voluntarily, and were accessible immediately after each didactic session was completed. Learners initially completed a pre-curriculum survey that was emailed out one week prior to the initial didactic session and available via QR code immediately prior to the first session. This survey assessed baseline knowledge of concepts to be covered in the curriculum. Post-curriculum surveys were distributed to the learners who attended each lecture immediately after the lecture and via email available for completion up to one week post lecture.
We initially intended to have one survey per lecture, but since lectures 1 and 2 were presented in the same didactic session, questions were combined into one survey that was sent out after lecture 2. These surveys included the same questions as the pre-curriculum survey, but only on topics specific to what had been taught thus far. For all surveys, learners were asked to rate responses on a 10-point Likert scale with 1 indicating “no confidence / no knowledge” and 10 indicating “very confident / very knowledgeable.” We assessed responses to the pre- and post-curriculum surveys using descriptive statistics and compared them using a MannWhitney U test to determine whether there was a change in median perceived knowledge or confidence level. A statistically significant change was defined as a P value ≤.05. Statistical analysis was performed using SAS v9.4 (SAS Institute Inc, Cary, NC).
The primary outcome used to assess effectiveness of the curriculum was a statistically significant improvement in the median perceived knowledge level of individual climatechange concepts before and after delivery of each section of the climate health curriculum. Secondary outcomes included assessment of learners’ belief in human-driven climate change, likelihood of performing individual action to combat climate change, and an open comments section.
IMPACT AND EFFECTIVENESS
Nineteen learners completed the pre-curriculum survey.
The three post-lecture surveys had a wide range of respondents from 7-27, which limited our analysis (Table 1). Overall, the majority of the respondents were EM residents (72.9%). Other respondents included medical students (20.3%) and attending physicians (6.8%). Table 1 shows the breakdown of respondents for each survey.
In the pre-curriculum survey, 73.7% of respondents reported that they had never attended a lecture on climate change and its effect on human health. Climate change is not generally part of core medical school or graduate medical education curriculum.11,14 Therefore, the pre-curriculum survey provided valuable feedback demonstrating that many learners are not formally educated on this topic. When assessing individual topics that were presented, learners reported improved perceived knowledge or confidence in 87.5% of concepts (28/32 concepts with P < .05) that were assessed during the climate health educational curriculum (Figure 2). When assessing the four core areas of the curriculum individually—1) climate change topics, 2) climate impacts on human health, 3) confidence in treating medical conditions exacerbated by climate change, and 4) climate change solutions—the survey demonstrated improvement perceived knowledge in all four areas.
Specifically, when evaluating perceived knowledge of the six core climate-change topics, every area showed statistically significant improvement in perceived knowledge (P < .05), demonstrating in our small cohort of learners that an introduction to climate change in a residency-based educational curriculum could have a large impact on climate change knowledge for future physicians. In the additional core topic areas, there was a reported increase in perceived knowledge level in 7 of 8 ways that climate change impacts human health (Figure 2). Learners also reported statistically significant improved confidence in treating 8 of 9 medical conditions exacerbated by climate change (Figure 2). Lastly, learners demonstrated statistically significant improved perceived knowledge of 8 of 10 climate change solutions (Figure 2). In the last question on the survey regarding
ability to perform climate-change solutions, learners reported that they were more likely to perform individual climate solutions in the following six months after the conclusion of the climate health educational curriculum; however, this difference was not statistically significant and was limited by the low number of survey respondents to the final survey (5.0 vs 7.0, P = .073).
In the open comments sections, learners stated that they had gained knowledge on the compounding effect of climate change on health, impacts of food waste, better management of gastrointestinal illness and meningitis, and various environmental impacts on different pathologies. Encouragingly, even before completion of the curriculum, 48.1% of respondents stated that they had implemented climate solutions including carpooling, composting, wasting less food, changing diet, conserving energy, and changing home energy suppliers to renewable resources.
A limitation of this pilot curricular study is the small study size limited to one academic center focused on EM resident education. The varied number of survey responses, from 7-27 respondents, limits the power of our statistical analysis and any definitive conclusions as to the curriculum’s effectiveness. It is suspected that the low response rate to the final survey was due to the lecture being scheduled as the last of one of the didactic sessions, which extended into lunch break. Despite follow-up emails, the survey response rate remained low. Timing of the lectures within the didactic session is something to consider for future curriculum building. Additionally, since learners were self-reporting a perceived knowledge benefit and we did not perform a knowledge assessment, we are unable to comment on long-term retention. Finally, responses were analyzed as a whole and not broken down by level of education due to the small sample size. One would expect that a change in perceived knowledge level at baseline would differ between a medical student and an attending physician.
Regardless of these limitations, the goal of the project was to introduce a curriculum to EM residents that had not been presented to them previously and was likely an area of reduced knowledge across residency programs, based on literature review.11,14 This project demonstrates that a simple, lecturebased curriculum introducing climate-related health concepts
Figure 1. Overview and breakdown of topics covered in the four lectures of a climate health education curriculum. EM, emergency medicine; ECG, electrocardiogram; GI, gastrointestinal.
Table 1. Total number of respondents to survey regarding a climate-change curriculum by level of education.
2. Comparison of participants’ median responses on a 10-point Likert scale between pre- and post-curriculum surveys in which they assessed a climate-related health curriculum.
can raise awareness of general climate issues, including how climate change is likely to impact ED patients. Future studies should assess knowledge retention and integration over the span of EM residency and could improve on our design to align with published, public- health core climate and health competencies such as those proposed by the Global Consortium on Climate and Health Education, as our curricular design was not based on published climate health competencies.16
CONCLUSION
It is pivotal that current and future emergency physicians be aware of climate change and its effects on human health and be trained to treat climate-vulnerable patients, as well as to understand how to become advocates for climate change solutions. Our longitudinal curriculum improved learners’ overall perceived understanding and knowledge of climate change, its impact on patient health, and treating medical
conditions exacerbated by climate change. After attending the course, learners reported that they were more likely to implement climate change solutions into their personal lives or had already implemented them. Although there are limitations to survey studies, we are encouraged by the positive results of our curriculum design and analysis. This intervention demonstrates one way to integrate climate health knowledge into the core EM residency curriculum. We encourage EM residencies to use this model and build on it to disseminate evidence-based, climate health knowledge to prepare physicians to treat climate-vulnerable patient populations and share climate solutions.
ACKNOWLEDGMENTS
We would like to thank Lu Wang, PhD, of the Cleveland Clinic Department of Quantitative Health Sciences for her contributions to the biostatistics.
Figure
Lewis et al. Climate Health Education Curriculum for Emergency Medicine
Address for Correspondence: Matthew Kostura MD, Cleveland Clinic Foundation, Department of Emergency Medicine, 9500 Euclid Ave, E19, Cleveland, OH 44195. Email: kosturm@ccf.org.
Conflicts of Interest: By the WestJEM article submission agreement, all authors are required to disclose all affiliations, funding sources and financial or management relationships that could be perceived as potential sources of bias. No author has professional or financial relationships with any companies that are relevant to this study. There are no conflicts of interest or sources of funding to declare.
1. Arias PA, Bellouin N, Coppola E, et al. Technical summary. In: Climate Change 2021: The Physical Science Basis. Contribution of Working Group I to the Sixth Assessment Report of the Intergovernmental Panel on Climate Change. Cambridge University Press; 2021:33-144.
2. Sorensen CJ, Salas R, Rublee C, et al. Clinical implications of climate change on US emergency medicine: challenges and opportunities. Ann Emerg Med. 2020;76(2):168-78.
3. Pacheco SE, Guidos-Fogelbach G, Annesi-Maesano I, et al. Climate change and global issues in allergy and immunology. J Allergy Clin Immunol. 2021;148(6):1366-77.
4. Kazi DS, Katznelson E, Liu CL, et al. Climate change and cardiovascular health: a systematic review. JAMA Cardiol. 2024;9(8):748-57.
5. Crimmins A, Balbus J, Gamble JL, et al. The Impacts of Climate Change on Human Health in the United States: A Scientific
Assessment. U.S. Global Change Research Program; 2016.
6. Crowley RA. Climate change and health: a position paper of the American College of Physicians. Ann Intern Med. 2016;164(9):608-10.
7. World Health Organization. Climate Change. 2023. Available at: https://www.who.int/news-room/fact-sheets/detail/climate-changeand-health. Accessed June 5, 2025.
8. Hess JJ, Heilpern KL, Davis TE, et al. Climate change and emergency medicine: impacts and opportunities. Acad Emerg Med. 2009;16(8):782-94.
9. Salas RN, Slutzman JE, Sorensen C, et al. Climate change and health: an urgent call to academic emergency medicine. Acad Emerg Med. 2019;26(7):837-40.
10. Philipsborn RP, Sheffield P, White A, et al. Climate change and the practice of medicine: essentials for resident education. Acad Med. 2021;96(3):355-67.
11. Cois A, Kirkpatrick S, Herrin R. Climate change curricula in US graduate medical education: a scoping review. J Grad Med Educ. 2024;16(6 Suppl):69-77.
12. Romanello M, Napoli CD, Green C, et al. The 2023 report of the Lancet countdown on health and climate change. Lancet. 2023;402(10419):2346-94.
13. Crimmins AR, Avery CW, Easterling DR, et al. Fifth National Climate Assessment. U.S. Global Change Research Program; 2023.
14. Wellbery C, Sheffield P, Timmireddy K, et al. It’s time for medical schools to introduce climate change into their curricula. Acad Med. 2018;93(12):1774-77.
15. Council of Residency Directors in Emergency Medicine. Model curriculum. Accessed August 29, 2025.
16. Sorensen C, Campbell H, Depoux A, et al. Core competencies to prepare health professionals to respond to the climate crisis. PLOS Clim. 2023;2(6):e0000230.
Mechanisms and Intervention Strategies for Heat StrokeAssociated Myocardial Dysfunction: A Narrative Review
Yan Zhuang, PhD*†o
Xiao-huan Zhuang, MMBS*†o
Xin-yuan Zhang, MMBS*†
Da-Cheng Wang, MD*†
Yan Yang, MMed*†
Section Editor: Mark I. Langdorf, MD, MHPE
Affiliated Hospital of Nanjing University of Chinese Medicine, Department of Critical Care Medicine, Nanjing, Jiangsu, China
Jiangsu Province Hospital of Chinese Medicine, Department of Critical Care Medicine, Nanjing, Jiangsu, China
Co-first authors
Submission history: Submitted October 5, 2025; Revision received January 30, 2026; Accepted February 5, 2026
Electronically published May 13, 2026
Full text available through open access at http://escholarship.org/uc/uciem_westjem DOI 10.5811/westjem.53045
Introduction: Heatstroke is a life-threatening condition defined by a core body temperature exceeding 40° C and central nervous system dysfunction. Its onset is potentiated by high heat and humidity, especially if superimposed upon high thermal loads due to exertion or to impaired ability to sweat as associated with the use of certain medications. The condition can trigger systemic inflammation and potentially fatal multi-organ failure. The heart is a primary organ affected; heatstroke-associated myocardial dysfunction may present as tachycardia, arrhythmias, heart failure, or ischemic injury.
Methods: This narrative review was informed by a structured search of PubMed and Embase. The search focused on literature from the past 10 years, supplemented by earlier seminal studies where necessary. Key search terms included heatstroke, myocardial injury, dysfunction, biomarkers, cooling strategies, monitoring, and circulatory support. We prioritized human clinical studies, reviews, and consensus statements on acute management, along with preclinical studies.
Results: Heatstroke-associated myocardial dysfunction has a multifactorial pathophysiology involving direct thermal cytotoxicity, systemic inflammation, endothelial injury, coagulopathy, mitochondrial dysfunction, and dysregulated cell death. Cardiac manifestations include myocardial injury, arrhythmia, and ventricular dysfunction. Early diagnosis requires an electrocardiogram, cardiac biomarkers, and echocardiography. Management is centered on rapid cooling, hemodynamic support, and close monitoring. Refractory cases may require invasive temperature control or mechanical circulatory support.
Conclusion: Heatstroke-associated myocardial dysfunction is a clinically important and potentially reversible complication. Timely cooling, vigilant cardiovascular assessment, and supportive management remain central to care, while targeted therapies and refined risk-stratification strategies require further clinical investigation. [West J Emerg Med. 2026;27(3)526–533.]
INTRODUCTION
Global warming and related environmental changes have driven an increase in the number of extreme heat events, which currently account for an estimated 490,000 annual deaths worldwide. Modeling studies indicate a pronounced increase in heat-related fatalities, with projections suggesting
a near twofold rise in global mortality between 2030–2050.1–
3 Heatstroke, a life-threatening condition defined by a core body temperature > 40 °C (104 °F) accompanied by central nervous system dysfunction, is commonly classified into two subtypes based on etiology: classic heatstroke, triggered by passive heat exposure; and exertional heatstroke, associated
Zhuang et al.
Mechanisms and Intervention Strategies for Heatstroke-associated Myocardial Dysfunction with physical exertion.4
Cardiac dysfunction is a prevalent complication of heatstroke, affecting up to 65.2% of patients with multiorgan failure. Heatstroke-associated myocardial dysfunction (HSMD) encompasses a broad spectrum of electrical and mechanical abnormalities, including sinus tachycardia, atrial and ventricular arrhythmias, and conduction disturbances.5,6 Elevations in cardiac troponins and natriuretic peptides are frequently observed and are associated with adverse outcomes. Emerging evidence suggests that endothelial-derived and extracellular vesicle–related biomarkers, such as von Willebrand factor, soluble thrombomodulin, and histone H3, may further refine risk stratification; however, heterogeneity in sampling windows, assay platforms, and outcome definitions limits direct comparability across studies.
Prompt recognition of myocardial involvement is, therefore, critical. Early, staged interventions—including rapid cooling, hemodynamic-guided resuscitation, and continuous electrocardiographic and echocardiographic monitoring—are essential. Timely escalation to advanced temperature control or temporary mechanical circulatory support may be lifesaving; in selected cases, reversible myocardial depression has been reported.7 In this narrative review we aimed to synthesize the clinical manifestations and pathophysiological mechanisms of HS-MD, critically appraise current and emerging biomarkers, and propose a pragmatic, timewindowed management framework, while outlining priorities for future research.
METHODS
Literature Search Strategy
This is a narrative review supported by a structured literature search. We searched PubMed and Embase, primarily focusing on studies published within the past 10 years, while also including selected earlier landmark studies where necessary to provide essential background. Our search strategy combined terms related to heatstroke and cardiac involvement, including (“heatstroke” OR “heat stroke” OR “exertional heat stroke” OR “classic heat stroke”) AND (myocard* OR cardiac OR “myocardial injury” OR “myocardial dysfunction” OR arrhythmia OR troponin OR echocardiograph*) AND (cooling OR resuscitation OR monitoring OR vasopressor* OR “mechanical circulatory support”). We also screened reference lists of relevant reviews and consensus statements to identify additional pertinent studies.
We prioritized human clinical studies, narrative reviews, and guidelines or consensus statements relevant to the pathophysiology and acute management of HS-MD. Selected preclinical studies were included when they provided mechanistic insights with potential clinical relevance. We excluded non English-language articles without accessible full text and studies not related to cardiac involvement in heatstroke.
Clinical Characteristics of Heatstroke-associated Myocardial Dysfunction
Arrhythmias
Within 24 hours of heatstroke onset, patients may develop a range of electrocardiographic (ECG) abnormalities, including sinus tachycardia, ventricular tachycardia, QTinterval prolongation, diffuse nonspecific ST–T changes, and ST–T alterations suggestive of myocardial ischemia.8 The incidence of atrial arrhythmias has been reported to reach up to 24%, while severe cases may present with ventricular tachycardia or even cardiac arrest.9,10
Atrioventricular conduction disturbances associated with heatstroke include PR-interval prolongation, intraventricular conduction delays, and left or right bundle branch block.11 QT- interval prolongation is a particularly common finding and may be partially attributable to electrolyte disturbances induced by heatstroke.12 Beyond the acute phase, heatstroke has also been associated with increased long-term cardiovascular risk.9,13 A 14-year follow-up study of discharged patients demonstrated a 3.9-fold increase in major adverse cardiovascular events and a 15-fold increase in the incidence of atrial fibrillation.14
Myocardial Injury
At the molecular level, heatstroke can exert persistent effects on cellular function and epigenetic regulation, which may remain subclinical until unmasked by subsequent stressors or aging-related processes.15,16 Clinically, myocardial injury related to heatstroke poses a diagnostic challenge, as it can closely mimic acute coronary syndromes. Typical findings include territory-like ST-segment deviations and marked T-wave inversions on ECG.9
Elevations in cardiac troponin levels are common and carry important prognostic implications, with severe elevations associated with increased one-year mortality.17 Importantly, this pattern of myocardial injury is thought to reflect supply–demand mismatch and microvascular dysfunction rather than acute coronary thrombosis. Accordingly, a comprehensive diagnostic approach integrating clinical presentation, echocardiographic assessment, and biomarker kinetics is essential to distinguish HS-MD from type 1 (atherothrombotic) myocardial infarction.
Heart Dysfunction
Heat exposure leads to reductions in circulating blood volume and systemic vascular resistance, prompting compensatory increases in cardiac output to maintain blood pressure, tissue perfusion, and thermal homeostasis. Experimental and clinical studies have shown that for every 0.3 °C increase in core body temperature, myocardial contractility and cardiac output rise, while perfusion to certain organs decreases and cutaneous vasodilation intensifies to facilitate heat dissipation.18,19
Mechanisms and Intervention Strategies for Heatstroke-associated Myocardial Dysfunction
Table 1. Biomarkers for heatstroke-associated myocardial dysfunction, analytical characteristics, typical heatstroke patterns, and clinical utility.
Severity signal; predicts short- and long-term mortality; integrate with ECG/ echo to avoid misclassification as type-1 MI
Complements echocardiography for triage, disposition, and prognosis
Better predictor of AKI and 90-day mortality than CK in EHS
Correlates with organ dysfunction; surrogate of vascular injury
Stage coagulopathy; guide monitoring and escalation
Pitfalls, availability and turnaround
Key refs
Widely available in ED; rapid turnaround (≈1 h). Non-ACS elevations common in HS; influenced by exertion and renal dysfunction 37
ED/ICU-available; turnaround ≈1–2 h. Affected by age, renal function, and atrial arrhythmias
Widely available; turnaround ≈1–2 h.
Limited cardiac specificity; influenced by skeletal muscle injury
Research-oriented; limited ED availability; delayed turnaround; not myocardium-specific
Widely available; rapid turnaround. Affected by transfusion, hypothermia, liver dysfunction 39 IL-6 / HMGB1 Systemic inflammation and DAMP release
Circulating endothelial cells
Early (0–6 h) and trend Peaks around hyperthermia or early cooling
injury 0–24 h; specialized platforms
Elevated with severe endothelial damage
severity adjunct; may signal escalation
Research use; potential risk stratifier
EV-histone H3 NET-related cellular injury 0–24 h; exploratory assays Elevated in severe HS Early severity signal (exploratory) Research-only; assay standardization lacking
Biomarkers listed in this table vary substantially in clinical availability and turnaround time. Cardiac troponins, natriuretic peptides, and routine coagulation parameters are widely available in most emergency departments and can typically be obtained within 1–2 hours, making them the most actionable tools for acute risk stratification. In contrast, markers of endothelial injury and inflammation (e.g., syndecan-1, IL-6, HMGB1, circulating endothelial cells, EV–histone H3) are primarily research-based, often require specialized assays, and are not routinely available for real-time emergency decision-making. Reported biomarker patterns should be interpreted in the clinical context of hyperthermia, exertion, renal function, and concomitant organ dysfunction. Elevations do not necessarily indicate primary ischemic heart disease and should be integrated with electrocardiography and echocardiography to guide management. h, hours; HS, heatstroke; HS-MD, heatstroke-associated myocardial dysfunction; hs-cTnI/T, high-sensitivity cardiac troponin I/T; BNP, B-type natriuretic peptide; LDH, lactate dehydrogenase; AKI, acute kidney injury; DIC, disseminated intravascular coagulation; DAMPs, danger-associated molecular patterns; EV, extracellular vesicle.
Older adults and patients with pre-existing cardiac disease often exhibit impaired cutaneous vasodilation and diminished cardiac reserve, rendering them particularly vulnerable to circulatory failure during heat stress. Extreme heat is associated with increased mortality across all age groups, with
individuals with chronic diseases—especially cardiovascular disease—at disproportionately higher risk.20 A multinational analysis across 27 countries reported that heat-related heart failure accounted for approximately 0.26% of cardiovascular deaths.21 In addition, epidemiological data indicate that
Zhuang et al.
Mechanisms and Intervention Strategies for Heatstroke-associated Myocardial Dysfunction
extreme heat exposure is associated with a 12% increase in heart failure–related mortality.22
Pathophysiology of Heatstroke-Associated Myocardial Dysfunction
Heatstroke-associated myocardial dysfunction results from the combined effects of direct thermal injury and systemic physiological derangements induced by extreme hyperthermia. Epidemiological studies consistently associate heat exposure with increased cardiovascular morbidity and mortality; however, myocardial impairment in heatstroke differs fundamentally from primary ischemic heart disease and is often functional, dynamic, and potentially reversible.23–25
Direct Thermal Injury to Cardiomyocytes
At the cellular level, extreme hyperthermia exerts direct cytotoxic effects on cardiomyocytes. Elevated core temperatures disrupt protein conformation, impair calcium homeostasis, and alter membrane integrity, leading to reduced myocardial contractility and electrical instability.1,20 These temperature-dependent changes provide a mechanistic explanation for the frequent occurrence of arrhythmias, transient systolic dysfunction, and repolarization abnormalities observed during acute heatstroke.26,27
Systemic Inflammation and Endothelial Dysfunction
Beyond direct thermal effects, heatstroke provokes a systemic inflammatory response that resembles sepsis-like physiology. Heat-induced cellular injury triggers widespread inflammatory activation, accompanied by endothelial dysfunction and increased vascular permeability. These processes promote microvascular dysregulation and impair effective tissue perfusion.28,29 Within the myocardium, inflammatory mediators and endothelial injury compromise oxygen delivery and myocardial energetics, contributing to myocardial depression even in the absence of obstructive coronary artery disease.30–32
Microcirculatory and Metabolic Disturbances
Microcirculatory impairment further exacerbates myocardial dysfunction in heatstroke.33 Hypovolemia, peripheral vasodilation, and endothelial injury reduce effective circulating volume and limit coronary microvascular perfusion.34 In parallel, metabolic disturbances—particularly mitochondrial dysfunction and impaired adenosophine triphosphate generation—restrict the heart’s ability to meet increased metabolic demands during heat stress. Together, these alterations predispose susceptible patients to acute heart failure, shock, or circulatory collapse.35
Reversibility and Clinical Implications
Importantly, myocardial dysfunction in heatstroke is frequently reversible with timely intervention. Rapid
temperature reduction, restoration of circulating volume and perfusion, and attenuation of systemic inflammation may lead to recovery of cardiac function over hours to days. This predominantly functional and inflammatory pattern of myocardial injury highlights the importance of early recognition and aggressive supportive management, rather than therapeutic strategies aimed at irreversible structural myocardial damage.6,12,36 A schematic overview of the principal mechanistic pathways involved in HS-MD is presented in Figure 1.
Management of Heatstroke-Associated Myocardial Dysfunction
Early Recognition and Risk Stratification
Early recognition of myocardial involvement is essential in patients with heatstroke, as timely identification informs monitoring intensity, disposition, and subsequent management. Clinical suspicion should be heightened in the presence of arrhythmias, hemodynamic instability, or signs of cardiac dysfunction.45 Electrocardiography remains a first-line tool for detecting conduction abnormalities and malignant arrhythmias and should be performed early in the course of evaluation.11,46,47
Cardiac biomarkers play an important adjunctive role in
Figure 1. Pathophysiology of heatstroke-associated myocardial dysfunction. Extreme hyperthermia leads to myocardial dysfunction through four inter-related pathophysiological mechanisms.1) inflammatory response: heat-induced cellular injury triggers release of damage-associated molecular patterns and pro-inflammatory cytokines, resulting in systemic inflammation and cardiomyocyte injury. 2) Mitochondrial dysfunction and oxidative stress: excessive heat and metabolic stress impair mitochondrial function, promote oxidative stress, and reduce energy production, contributing to myocardial depression and electrical instability. 3) Endothelial and microcirculatory injury: endothelial dysfunction, reduced nitric oxide bioavailability, and microthrombosis impair myocardial perfusion and exacerbate ischemia-like injury. 4) Direct thermal cytotoxicity: extreme temperatures cause protein denaturation, membrane damage, and cardiomyocyte death. These mechanisms converge to produce clinically relevant myocardial dysfunction, which is often functional and potentially reversible with timely intervention.
Mechanisms and Intervention Strategies for Heatstroke-associated Myocardial Dysfunction Zhuang
risk stratification. Elevations in cardiac troponins are common in heatstroke and may reflect myocardial injury related to supply–demand mismatch and microvascular dysfunction rather than acute coronary thrombosis.37,48 When interpreted dynamically, troponin trends can provide prognostic information and help differentiate transient functional myocardial injury from evolving ischemic events. Natriuretic peptides, including B-type natriuretic peptide, may further assist in identifying patients with myocardial stress or overt cardiac dysfunction.49
Markers of endothelial injury and inflammation have also been explored as potential tools for early risk assessment. Circulating endothelial cells, adhesion molecules, thrombomodulin, and von Willebrand factor antigens may reflect microvascular injury and endothelial dysfunction in severe heatstroke. Although these biomarkers are not routinely available in all clinical settings, their presence highlights the systemic vascular involvement underlying heatstrokeassociated myocardial dysfunction. When available, bedside echocardiography provides complementary information by assessing ventricular function, preload status, and potential reversible myocardial depression. Integration of clinical findings, ECG changes, biomarker trends, and echocardiographic assessment allow a more comprehensive and clinically meaningful stratification of cardiovascular risk in patients with heatstroke.
Rapid Temperature Control: Principles and Comparative Strategies
Rapid reduction of core body temperature remains the cornerstone of heatstroke management and is particularly critical in patients with suspected HS-MD.50 The magnitude and duration of hyperthermia are closely associated with myocardial injury, arrhythmias, and hemodynamic compromise; therefore, cooling should be initiated as early as possible and continued until target temperature is achieved.
Goals and Timing of Cooling
The primary objective of therapeutic cooling is the rapid reduction of core temperature to below 39° C, followed by maintenance to prevent rebound hyperthermia.51 A cooling rate exceeding 0.15 °C/minute is critical for survival and is associated with significantly reduced fatality and complication rates.52 Clinical outcomes exhibit a clear time-dependent relationship with cooling speed; delays in temperature reduction are linked to more severe neurological and cardiovascular injury. In patients with pre-existing myocardial dysfunction, inadequate or delayed cooling can exacerbate myocardial depression and trigger malignant arrhythmias.
External Cooling Methods
External cooling techniques are considered first-line therapy in most patients with heatstroke. Immediate cooling
measures were implemented, which included giving cold intravenous fluids, placing ice packs, using lukewarm water and fans, applying wet towels, and using full-body medical cooling suits such as CarbonCool.53,54 Ice-water immersion achieves the most rapid cooling rates and is particularly effective in exertional heatstroke.55,56
However, its use may be limited in patients with altered mental status, advanced age, or cardiovascular instability. Evaporative and convective cooling methods, including mist-and-fan techniques and surface cooling devices, are more commonly employed in emergency and intensive care settings. Although these methods may achieve slower cooling rates, they allow improved access for airway management, cardiovascular monitoring, and hemodynamic support, which is especially relevant in patients with myocardial involvement.18,57
Intravascular and Invasive Cooling
Intravascular or other invasive cooling strategies may be considered when external cooling measures fail to achieve adequate temperature control or are contraindicated. The available evidence supporting these approaches in heatstroke is limited and largely anecdotal. Reported cases suggest that invasive cooling may facilitate effective temperature reduction in selected patients with severe or refractory hyperthermia.58 At present, these techniques should be regarded as rescue strategies rather than routine therapy, and their use should be individualized based on the patient’s condition, resource availability, and procedural risk.59
Hemodynamic Support and Volume Management
Hemodynamic management should be tailored to the presence and severity of myocardial dysfunction. Initial fluid resuscitation is often required to address hypovolemia; however, excessive fluid administration may exacerbate myocardial stress and pulmonary congestion in patients with impaired cardiac function.12 Dynamic assessment of volume responsiveness, integration of bedside echocardiography, and close monitoring of perfusion parameters are recommended. In patients with persistent hypotension despite appropriate volume resuscitation, vasopressor support may be required, with careful titration to maintain end-organ perfusion while avoiding excessive afterload.6,18
Cardiovascular Monitoring and Support
Continuous cardiovascular monitoring is recommended in patients with suspected HS-MD. Continuous ECG monitoring enables early detection and prompt management of arrhythmias, which may occur during both the hyperthermic phase and the cooling process. Serial assessment of cardiac biomarkers may provide insight into the progression or resolution of myocardial injury. Echocardiography, when available, should be used to monitor ventricular function and
Zhuang et al.
Mechanisms and Intervention Strategies for Heatstroke-associated Myocardial Dysfunction
guide ongoing hemodynamic management. Supportive care should focus on optimizing oxygen delivery, correcting electrolyte disturbances, and managing arrhythmias in accordance with standard critical care principles.9
Advanced and Rescue Therapies
In rare cases complicated by refractory shock or cardiac arrest, escalation to advanced supportive therapies may be considered. Mechanical circulatory support, such as venoarterial extracorporeal membrane oxygenation, has been reported in isolated cases of severe heatstroke with cardiovascular collapse.60,61 However, the available evidence remains limited, and patient selection should be individualized. Decisions regarding escalation to advanced support should consider the reversibility of organ dysfunction, neurological status, and overall prognosis.
Pharmacologic and Experimental Approaches
Several pharmacologic and experimental strategies, including antioxidant therapies and metabolic modulators such as L-carnitine, have been explored primarily in preclinical or experimental settings.62,63 Although these approaches offer mechanistic insights into potential myocardial protection during hyperthermia, their clinical efficacy and safety in HS-MD have not been established. At present, such strategies should be considered investigational and should not replace established temperature-directed and supportive management.3
LIMITATIONS
This review has several limitations that should be acknowledged. First, as a narrative rather than a systematic review, the study is subject to selection and publication bias, and the included literature may not comprehensively represent all available evidence. Second, although a structured literature search was performed, we did not conduct formal study quality assessment or quantitative synthesis, which limits direct comparison across studies. Third, heterogeneity in study designs, patient populations, outcome definitions, and biomarker assays precludes firm conclusions regarding causality or the relative importance of specific mechanisms. Finally, much of the mechanistic evidence is derived from preclinical or observational studies, and its direct applicability to emergency and critical care practice requires further validation. These limitations underscore the need for well-designed prospective studies and translational research in this evolving field.
CONCLUSION
Heatstroke-associated myocardial dysfunction is a frequent and clinically significant complication of severe hyperthermia that is typically functional, inflammatory, and potentially reversible rather than ischemic in nature.57 Early recognition, prompt temperature control, individualized
hemodynamic support, and continuous cardiovascular monitoring remain the cornerstones of management in emergency and critical care settings. Improved awareness and further clinical studies are needed to refine risk stratification and optimize supportive strategies for this vulnerable patient population.
Address for Correspondence: Yan Zhuang, MD, Affiliated Hospital of Nanjing University of Chinese Medicine, Department of Critical Care Medicine, Nanjing, Jiangsu 210000, China. Email: athena2004112@163.com.
Conflicts of Interest: By the WestJEM article submission agreement, all authors are required to disclose all affiliations, funding sources and financial or management relationships that could be perceived as potential sources of bias. No author has professional or financial relationships with any companies that are relevant to this study. There are no conflicts of interest or sources of funding to declare.
1. Desai Y, Khraishah H, Alahmad B. Heat and the heart. Yale J Biol Med. 2023;96:197-203.
2. Romanello M, Di Napoli C, Drummond P, et al. The 2022 report of the Lancet Countdown on Health and Climate Change: health at the mercy of fossil fuels. Lancet. 2022;400:1619-1654.
3. Kew MC, Tucker RB, Bersohn I, et al. The heart in heatstroke. Am Heart J. 1969;77:324-335.
4. Bouchama A, Abuyassin B, Lehe C, et al. Classic and exertional heatstroke. Nat Rev Dis Primers. 2022;8(1):8.
5. Garcia CK, Renteria LI, Leite-Santos G, et al. Exertional heat stroke: pathophysiology and risk factors. BMJ Med. 2022;1:e000239.
6. Peters A, Schneider A. Cardiovascular risks of climate change. Nat Rev Cardiol. 2021;18:1-2.
7. Marchand M, Gin K. The cardiovascular system in heat stroke. CJC Open. 2022;4:158-163.
8. Shimada M, Tsai B, Marshall JP. A case of heatstroke complicated by persistent ventricular tachycardia. J Emerg Med. 2015;48:31-34.
9. Paul A, Alex R, Jacob JR, et al. Effects of heat stroke on surface ECG: a study on clinical outcomes. Heart Asia. 2019;11:e011221.
10. Petropoulos ZE, Keogh SA, Jarquín E, et al. Heat stress and heat strain among outdoor workers in El Salvador and Nicaragua. J Expo Sci Environ Epidemiol. 2023;33:622-630.
11. Mimish L. Electrocardiographic findings in heat stroke and exhaustion: a study on Makkah pilgrims. J Saudi Heart Assoc. 2012;24:35-39.
12. Bathini T, Thongprayoon C, Petnak T, et al. Circulatory failure among
Mechanisms and Intervention Strategies for Heatstroke-associated Myocardial Dysfunction
hospitalizations for heatstroke in the United States. Medicines (Basel). 2020;7:32.
13. Singh N, Areal AT, Breitner S, et al. Heat and cardiovascular mortality: an epidemiological perspective. Circ Res. 2024;134:1098-112.
14. Wang J-C, Chien W-C, Chu P, et al. The association between heat stroke and subsequent cardiovascular diseases. PLoS One. 2019;14:e0211386.
15. Weyrich A, Lenz D, Jeschek M, et al. Paternal intergenerational epigenetic response to heat exposure in male wild guinea pigs. Mol Ecol. 2016;25:1729-1740.
16. Velichko AK, Petrova NV, Razin SV, et al. Mechanism of heat stress-induced cellular senescence elucidates the exclusive vulnerability of early S-phase cells to mild genotoxic stress. Nucleic Acids Res. 2015;43:6309-6320.
17. Dervišević E, Hasić S, Katica M, et al. Heat-related biomarkers: focus on the correlation of troponin I and 70 kDa heat shock protein. Heliyon. 2023;9:e14565.
18. Crandall CG, González-Alonso J. Cardiovascular function in the heat-stressed human. Acta Physiol (Oxf). 2010;199:407-423.
19. Crandall CG, Wilson TE, Marving J, et al. Effects of passive heating on central blood volume and ventricular dimensions in humans. J Physiol. 2008;586:293-301.
20. Singh N, Areal AT, Breitner S, et al. Heat and cardiovascular mortality: an epidemiological perspective. Circ Res. 2024;134(9):1098-1112.
21. Alahmad B, Khraishah H, Royé D, et al. Associations between extreme temperatures and cardiovascular cause-specific mortality: results from 27 countries. Circulation. 2023;147:35-46.
22. Khraishah H, Alahmad B, Ostergard RL, et al. Climate change and cardiovascular disease: implications for global health. Nat Rev Cardiol. 2022;19:798-812.
23. Bauman J, Spano S, Storkan M. Heat-related illnesses. Emerg Med Clin North Am. 2024;42:485-492.
24. Cramer MN, Gagnon D, Laitano O, et al. Human temperature regulation under heat stress in health, disease, and injury. Physiol Rev. 2022;102:1907-1989.
25. Wang Z, Zhu J, Zhang D, et al. The significant mechanism and treatments of cell death in heatstroke. Apoptosis. 2024;29:967-980.
26. De Vita A, Belmusto A, Di Perna F, et al. The impact of climate change and extreme weather conditions on cardiovascular health and acute cardiovascular diseases. J Clin Med. 2024;13:759.
27. Ferrer R, Iba T. Molecular mechanisms of heatstroke: pathophysiology and cell death pathways. Juntendo Med J. 2025;71:308-312.
28. Bouchama A, Abuyassin B, Lehe C, et al. Classic and exertional heatstroke. Nat Rev Dis Primers. 2022;8:8.
29. Chen J, Ding C, Cao J, et al. Heat stress combined with lipopolysaccharide induces pulmonary microvascular endothelial cell glycocalyx inflammatory damage in vitro. Immun Inflamm Dis. 2023;11:e1034.
30. Yamaga S, Aziz M, Murao A, et al. DAMPs and radiation injury. Front Immunol. 2024;15:1353990.
Zhuang et al.
31. Bouchama A, Roberts G, Al Mohanna F, et al. Inflammatory, hemostatic, and clinical changes in a baboon experimental model for heatstroke. J Appl Physiol (1985). 2005;98:697-705.
32. Tsai H-Y, Hsu Y-J, Lu C-Y, et al. Pharmacological activation of aldehyde dehydrogenase 2 protects against heatstroke-induced acute lung injury by modulating oxidative stress and endothelial dysfunction. Front Immunol. 2021;12:740562.
33. Iba T, Maier CL, Levi M, et al. Thromboinflammation and microcirculation damage in heatstroke. Minerva Med. 2024;115:191-202.
34. Kravitz MS, Lee JH, Shapiro NI. Cardiac arrest and microcirculatory dysfunction: a narrative review. Curr Opin Crit Care. 2024;30:611-617.
35. Zhou B, Tian R. Mitochondrial dysfunction in pathophysiology of heart failure. J Clin Invest. 2018;128:3716-3726.
36. Laitano O, Garcia CK, Mattingly AJ, et al. Delayed metabolic dysfunction in myocardium following exertional heat stroke in mice. J Physiol. 2020;598:967-985.
37. Dervišević E, Hasić S, Katica M, et al. Heat-related biomarkers: focus on the correlation of troponin I and 70 kDa heat shock protein. Heliyon. 2023;9:e14565.
38. Schlader ZJ, Davis MS, Bouchama A. Biomarkers of heatstrokeinduced organ injury and repair. Exp Physiol. 2022;107:1159-71.
39. Wu M, Wang C, Zhong L, et al. Serum myoglobin as predictor of acute kidney injury and 90-day mortality in patients with rhabdomyolysis after exertional heatstroke: an over 10-year intensive care survey. Int J Hyperthermia. 2022;39:446-454.
40. Kobayashi K, Mimuro S, Sato T, et al. Dexmedetomidine preserves the endothelial glycocalyx and improves survival in a rat heatstroke model. J Anesth. 2018;32:880-5.
41. Palasz J, Farooqi W, Musharraf MB, et al. Diagnostic biomarkers for heat stroke and heat exhaustion: a scoping review. Disaster Med Public Health Prep. 2025;19:e153.
42. Truong SK, Katoh T, Mimuro S, et al. Inhalation of 2% hydrogen improves survival rate and attenuates shedding of vascular endothelial glycocalyx in rats with heat stroke. Shock. 2021;56:593-600.
43. Iba T, Maier CL, Levi M, et al. Thromboinflammation and microcirculation damage in heatstroke. Minerva Med. 2024;115:191-202.
44. Murray KO, Clanton TL, Horowitz M. Epigenetic responses to heat: from adaptation to maladaptation. Exp Physiol. 2022;107:1144-1158.
45. Roberts WO, Armstrong LE, Sawka MN, et al. ACSM expert consensus statement on exertional heat illness: recognition, management, and return to activity. Curr Sports Med Rep. 2023;22:134-149.
46. Zhang Z, Wu X, Zou Z, et al. Heat stroke: pathogenesis, diagnosis, and current treatment. Ageing Res Rev. 2024;100:102409.
47. Bao C-H, Feng Q, Zhang C, et al. Heat stroke with significantly elevated troponin and dynamic ECG changes: myocardial infarction or myocardial injury? Am J Med Sci. 2024;368:258-264.
48. Palasz J, Farooqi W, Musharraf MB, et al. Diagnostic biomarkers for heat stroke and heat exhaustion: a scoping review. Disaster Med Public Health Prep. 2025;19:e153.
49. Feng L, Yin J-Y, Liu Y-H, et al. N-terminal pro-brain natriuretic peptide
Zhuang
et
al.
Mechanisms and Intervention Strategies for Heatstroke-associated Myocardial Dysfunction
- a significant biomarker of disease development and adverse prognosis in patients with exertional heat stroke. Mil Med Res. 2024;11:26.
50. Chen L, Xu S, Yang X, et al. Association between cooling temperature and outcomes of patients with heat stroke. Intern Emerg Med. 2023;18:1831-1842.
51. DeGroot DW, Ruby B, Koo A, et al. Far from home: heat-illness prevention and treatment in austere environments. Wilderness Environ Med. 2025;36:397-404.
52. Cong S, Zheng G, Liang X, et al. Pre-hospital cooling in communityacquired heat stroke (CAHS): evidence, challenges, and strategies. Eur J Med Res. 2025;30:472.
53. Rublee C, Dresser C, Giudice C, et al. Evidence-based heatstroke management in the emergency department. West J Emerg Med. 2021;22:186-195.
54. Kido N, Tagami T, Otake K, et al. Exploring the potential of CarbonCool® in rapid prehospital cooling for severe heat stroke.
Prehosp Emerg Care. 2024;28:905-909.
55. Barletta JF, Palmieri TL, Toomey SA, et al. Management of heatrelated illness and injury in the ICU: a concise definitive review Crit Care Med. 2024;52:362-375.
56. Hosokawa Y, Racinais S, Akama T, et al. Prehospital management of exertional heat stroke at sports competitions: International Olympic
Committee adverse weather impact expert working group for the Olympic Games Tokyo 2020. Br J Sports Med. 2021;55:1405-1410.
57. Liu J, Varghese BM, Hansen A, et al. Heat exposure and cardiovascular health outcomes: a systematic review and metaanalysis. Lancet Planet Health. 2022;6:e484-495.
58. Bursey MM, Galer M, Oh RC, et al. Successful management of severe exertional heat stroke with endovascular cooling after failure of standard cooling measures. J Emerg Med. 2019;57:e53-56.
59. Hamaya H, Hifumi T, Kawakita K, et al. Successful management of heat stroke associated with multiple-organ dysfunction by active intravascular cooling. Am J Emerg Med. 2015;33:124.e5-7.
60. Chizhikova IO, Shigeev SV, Gornostaev DV, et al. A rare case of rhabdomyolysis due to heatstroke in an athlete. Sud Med Ekspert. 2025;68:47-52.
61. Allen SB, Cross KP. Out of the frying pan, into the fire: a case of heat shock and its fatal complications. Pediatr Emerg Care. 2014;30:904-910.
62. Goto H, Nakashima H, Mori K, et al. L-carnitine pretreatment ameliorates heat stress-induced acute kidney injury by restoring mitochondrial function of tubular cells. Am J Physiol Renal Physiol. 2024;326:F338-351.
63. Wang X, Liu Y, Zhang C, et al. Protective effect of L-carnitine on myocardial injury in rats with heatstroke. Acta Cir Bras. 2021;35:e351206.
Evidence-based Medicine Questions Logged by Emergency Medicine Residents On Shift in Relation to American Board of Emergency Medicine Content Areas
Shreyas Kudrimoti, MD*
Max Needham, MD*
Jacob R. Albers, MD*†
Jeffrey B. Brown, MD*†
Estelle Cervantes, MD*†
Phillip Sgobba, MD, MBS*†
Ajay K. Varadhan, MD*†
Dawn M. Yenser, C-TAGME*
Bryan G. Kane, MD*†
Section Editor: Jeffrey Druck, MD
Lehigh Valley Health Network, Department of Emergency and Hospital Medicine, Allentown, Pennsylvania
University of South Florida Morsani College of Medicine, Lehigh Valley Campus, Allentown, Pennsylvania
Submission history: Submitted September 19, 2025; Revision received December 30, 2025; Accepted January 7, 2026
Electronically published May 13, 2026
Full text available through open access at http://escholarship.org/uc/uciem_westjem
DOI 10.5811/westjem.52907
Introduction: Evidence-based medicine (EBM) skills are fundamental to lifelong learning. These can be tracked the same way that procedural skills are tracked—via residency program logs. Review of the logs can inform faculty on the EBM activity of their trainees. An understanding of the topics residents query while on shift can provide insight into where they need further knowledge to provide optimal patient care. Our objective in this project was to categorize the relationship of the clinical questions posed by emergency medicine (EM) residents while working in the emergency department to the American Board of Emergency Medicine (ABEM) Model of Clinical Practice.
Methods: We conducted this institutional review board-approved study (deemed exempt research) in a postgraduate year (PGY) 1-4 EM residency. A toxicology rotation and fellowship were established during the study period. Residents were required to submit three to five descriptions of EBM activity per 28-day EM rotation block into the program’s management software. We analyzed each complete log submitted from June 2013–May 2020 using the 2019 ABEM Model of Clinical Practice. The clinical questions posed were mapped to the ABEM Model for content, including sub-categories and acuity level. Demographic information in the logs allowed for analysis for ABEM’s pediatric and geriatric modifiers. The primary outcome measure was the number of clinical questions mapped to each section of the Model.
Results: From June 2013–May 2020, 10,444 discrete completed logs were completed by 137 residents. “Procedures and Skills” (n = 1,110, 10.63%) and “Cardiovascular Disorders” (n = 991, 9.49%) were the most prevalent ABEM content areas. “Trauma” (n = 812, 7.77%) and “Drugs and Chemical Classes” (n = 749, 7.17%) were the most prevalent ABEM sub-categories. “Emergent” (n = 7,770, 74.3%) was the most commonly searched ABEM acuity, followed by “lower acuity” (n = 5,341, 51.1%) and “critical” (n = 5,192, 49.7%). Of note, not all conditions have ABEM acuity codes, and some have multiple. Clinical questions addressed issues regarding pediatric patients in 10.16% (n = 1,061) and geriatric patients in 8.05% (n = 841) of logs.
Conclusion: In this single-site cohort, “Procedures and Skills” was the most common source of onshift questions for EM residents, perhaps representing just-in-time training. “Trauma” was the most common sub-category, potentially the result of a large footprint in the ABEM Model of Clinical Practice. The residency program’s toxicology rotation and fellowship may have influenced the types of conditions treated by residents and the subsequent content of their logs. Furthermore, completing logs on shift may have impacted the mapping to ABEM acuity levels. Programmatic understanding of residents’ on-shift, evidence-based medicine questions could serve to identify educational gaps and opportunities. [West J Emerg Med. 2026;27(3)534–539.]
INTRODUCTION
The modern idea and terminology of “evidence-based medicine” (EBM) was popularized by a 1992 announcement in the Journal of the American Medical Association 1 Evidence-based medicine represents a movement in medicine to use clinical research to directly guide clinical management.1 This EBM movement has given rise to advances in clinical practice that are commonplace today. As the principles of EBM became established, an instructional aspect of EBM emerged. The cornerstones of this teaching process were the essentials of “ask,” “acquire,” “appraise,” and “apply.”2 In its modern form EBM allows research and evidence to direct bedside care. Practicing medicine in this way can combine external clinical evidence, clinical expertise, and patient values.3 Ideally, the use of EBM in clinical practice works to consistently provide optimal, up-to-date care to patients.4 In real time while working in the emergency department (ED), the “ask,” “acquire,” “appraise,” and “apply” approach blends information-seeking and EBM.
The Accreditation Council for Graduate Medical Education acknowledges the importance of EBM, embedding it into program requirements.5 In emergency medicine (EM), EBM is measured via the practice-based learning (PBL) Milestone 1. Level 2 of PBL Milestone 1 is the ability of residents to “[articulate] the clinical questions … necessary to guide evidence-based care.”6 Although these EBM skills are commonly used across many hospital resident curricula, multicenter analysis of the use of EBM by EM residents has not been previously published. For example, Tavarez et al showed improved test scores on in-training examinations among EBM-trained pediatric fellows.7 Our group (Brown et al) has previously published research regarding the impact EBM may have on patient care.8 Extending that work, we sought to describe the clinical content of EBM questions asked by EM residents while on shift in the ED. Our goal in this study was to describe the relationship of EBM questions to the American Board of Emergency Medicine (ABEM) Model of Clinical Practice of EM. To do so, we mapped the content of the questions recorded in the residents’ logs of onshift EBM activity to the 2019 ABEM Model.9
METHODS
We conducted this study at a postgraduate year (PGY) 1-4 EM residency in an independent academic center sponsored by an integrated healthcare network based in eastern Pennsylvania. The study was reviewed by the network’s institutional review board, which deemed it exempt research. Within the network, residents rotated at two urban ED sites. One was located at a tertiary-care Level I trauma center with a dedicated pediatric ED, pediatric intensive care unit (ICU), and neonatal ICU. The other was a community ED at an institution with an inpatient psychiatric hospital. A toxicology fellowship with an associated toxicology rotation was developed during the study period. As described in Brown et
Population Health Research Capsule
What do we already know about this issue? Evidence-based medicine (EBM) skills are fundamental to lifelong learning.
What was the research question?
How do the EBM questions asked by on-shift emergency medicine residents relate to the American Board of Emergency Medicine Model of Clinical Practice?
What was the major finding of the study? Residents asked about “Procedures and Skills” most frequently and “Environmental Disorders” least frequently.
How does this improve population health?
Understanding the content areas of residents’ on-shift EBM questions could serve to identify educational gaps and opportunities to improve patient care.
al, the Program Evaluation Committee required that residents log on-shift EBM activity, referred to as PBL logs.8 Residents were required to complete three to five PBL logs (depending on the academic year) per 28-day EM rotation. The number of annual EM rotations varied from six for PGY-1 residents to eight for PGY-4 residents. Therefore, the total number of PBL logs a resident was required to complete in a given academic year ranged from 18-40. Logs were maintained in the residency program’s software management system New Innovations (New Innovations, Inc., Uniontown, OH).
The logs were based on a format posted to the listserv of the Council of Residency Directors in Emergency Medicine.10 The logs included a patient description, chief concern, discharge diagnosis, ED or hospital course, the clinical question the resident investigated, the search strategy used to investigate the question, and the information found regarding the question. Additionally, residents were required to report in the log the subsequent clinical application of the information they found by responding to the prompt, “Based on your research, would you have done anything differently?” These clinical applications of the information found by the residents are described in detail in the 2024 study by Brown et al.8
The EBM curriculum, described in the 2024 paper, occurred monthly and was embedded in the required weekly didactics.8 Expectations for the PBL logs were graduated, with a focus on the clinical question for PGY-1 residents based on the PICO format (Population/Patient/Problem,
Intervention, Comparison, and Outcome). No expectations as to the clinical content were either defined or provided to the residents. When submitted, all logs were reviewed by a single member of the faculty to provide individualized feedback to the residents during their semi-annual evaluations. That feedback did not include review of content or topic but was limited to EBM skills, as noted in our prior paper.8 To be included in this analysis, logs needed to have been placed into New Innovations between June 2013–May 2020. Logs were anonymized to PGY and sex to be included in the research dataset, in accordance with Hadley et al.11
The logs were mapped to the topics noted in the 2019 ABEM Model of Clinical Practice.9 The mapping process was similar to previously described descriptive methodology.12 The Model has content areas, such as “Signs, Symptoms, and Presentations,” with subsequent categories and sub-categories, such as “Abnormal Vital Signs.” Each sub-category has one to three acuity levels: “critical”; “emergent”; and “lower acuity,” which are defined in the Model.8 “Critical” presentation indicates a high chance of mortality without immediate intervention; “emergent” indicates a likely progression in severity or complication without prompt treatment; and “lower acuity” suggests a low probability of the patient’s condition escalating. The definitions for pediatrics and geriatrics as special populations came from information provided by ABEM when describing the qualifying examination. The mapping was performed by three coders. These coders worked together on the first 200 logs to create a consensus for coding. They then met to discuss any logs in which coding was unclear. A single faculty member adjudicated any remaining coding questions. There was no formal measure of inter-rater reliability.8 We analyzed the results descriptively.
RESULTS
From June 2013–May 2020, 11,145 total logs were entered into New Innovations, completed by 137 residents. Forty-eight residents (37%) were female. Of these logs, 10,444 were identified as complete and discrete (non-duplicates) and were used for this analysis. Table 1 demonstrates log proportion for each of the 20 ABEM content areas. The numbering aligns with the Model of Clinical Practice. Content area 19, “Procedures and Skills Integral to the Practice of EM,” which had the greatest number of logs with 1,110 (10.63%) entries, followed closely by “Cardiovascular Disorders” with 991 logs (9.49%). Infrequently queried on shift were “Environmental Disorders” (n = 142, 1.36%) and “Psychobehavioral Disorders” (n = 143, 1.37%). Table 2 demonstrates the 20 most frequently queried topic areas from the 2019 Model, from the most to least frequent. Given the level of detail contained within the ABEM Model, Table 2 provides a more granular sense of the clinical categories of EBM questions that EM residents decided to record in their logs.
“Emergent” (n = 7,770) was the most commonly searched
ABEM acuity, followed by “lower acuity” (n = 5,341) and “critical” (n = 5,192). Of note, not all conditions have ABEM acuity codes, and some ABEM categories have multiple acuity codes. If an ABEM sub-category had all three levels of acuity, that log contributed to each acuity category. Therefore, the number of acuity categories is greater than the number of logs analyzed. In 1,061 logs (10.16%), the clinical question related to pediatric patients and in 841 (8.05%) to geriatric patients.
DISCUSSION
The data reported from this study represent a broad picture of the types of patient presentations EBM activity was applied to at a single training program. The 10,444 individual logs demonstrate which content areas the EM residents most frequently investigated while on shift. In this study we attempted to define the first step in the “ask,” “acquire,” “appraise,” and “apply” approach to EBM by mapping the questions asked to the ABEM Model of Clinical Practice. In this cohort, “Procedures and Skills,” “Cardiovascular Disorders,” and “Abdominal and GI Disorders” were all present in relatively high proportions in the patient logs. The first, “Procedures and Skills,” may be explained by the use of just-in-time training for low-volume procedures. The high number of logs for cardiovascular and abdominal disorders may reflect the types of patients evaluated by the residents. A recent study noted that among non-trauma patients, abdominal pain was the most frequent concern, followed by dyspnea, fever, and chest pain.13
Prior work has demonstrated that 87% of EBM questions asked by residents arise when the trainee is not physically with the patient.14 Since the PBL logs included patient information such as medical record number, chief concern, and case outcome, the cohort should be focused on patient encounters rather than an educational topic that arose on shift, even if the questions arose outside the patient’s room. These examples of content areas may inform the need for EBM resources at training sites. For example, having easily accessible and curated procedural training resources may be of value. High-frequency topic areas could serve to inform residency leadership about gaps in the program’s didactics, as they represent areas of resident uncertainty.
At the other end, “Psychobehavioral Disorders,” “Environmental Disorders,” and “Hematologic and Oncologic Disorders” were less represented in the residents’ clinical questions. That psychiatric disorders were infrequently an area of residency inquiry is unlikely to reflect the proportion of patients they evaluated. The academic ED locations both contain dedicated behavioral sections, and one training ED is on the campus of one of the region’s large, inpatient psychiatric hospitals. In the case of behavioral emergencies, the volume of patients did not seem to impact the number of PBL logs placed. This inverse relationship may be the result of the single-site nature of the study but may also represent an opportunity for a program to identify content areas that require
Table 1. Evidence-based medicine logs kept by emergency medicine residents while working in the emergency department, in a study categorizing the relationship of the clinical questions they asked to the American Board of Emergency Medicine Model of Clinical Practice.
review by the program evaluation committee.
The type of patients about whom residents ask questions is interesting to note. The “emergent” ABEM acuity was the most highly represented acuity level in the dataset by a margin of more than 2,000 logs. The next most common acuity was “lower acuity,” with “critical” being the least common. In this sample, the residents did not opt to ask questions about critical patients as their first inclination. Given that the study could not control for logs placed later in a shift, or immediately after a shift while reflecting, lack of time to log a question during a resuscitation may not be the only reason why residents did not have as many queries in that category. The reason why critical patients were least likely to have a related PBL log requires further study, as the way in which EM residents engage in these PBL logs may provide insight into how emergency physicians behave as lifelong learners. If programs were to deploy PBL logs, the over-time trends in the topic areas of resident queries may inform programs, as discussed above.
LIMITATIONS
This cohort is limited by its single-site nature. Additionally, the coding process, using a single faculty
member to adjudicate the work of the primary reviewers, may have introduced bias. The impact of the internal EBM curriculum, the didactic curriculum provided, and the local patient population all likely affected the types of EBM queries the residents submitted. That the submissions included only a sample of the patients seen by the residents is another limitation; the residents may only have recorded a certain type of inquiry that they individually deemed appropriate for a PBL log. Another study limitation is that the only demographic information collected for residents was sex and PGY. It is possible that other demographic factors, such as age or prior experience, may have influenced the types of questions residents recorded in their logs. Additionally, residents may have been searching for “just-in-time information” rather than for best evidence/best practice. This limitation may be most pronounced when considering logs covering topics such as procedures.
Some observed trends may not be externally valid. For example, “Drugs and Chemical Classes” was among the most highly represented sub-categories present in the patient logs. Residents may have used EBM practices to ask questions about this competency because toxicology-related issues
ABEM, American Board of Emergency Medicine; EM, emergency medicine; GI, gastrointestinal.
Table 2. Most common American Board of Emergency Medicine (ABEM) 2019 Model of Clinical Practice sub-categories identified in evidence-based medicine logs kept by residents while on shift, in a study categorizing the relationship of the clinical questions they asked in relation to the ABEM Model.
ABEM, American Board of Emergency Medicine.
are rare, nuanced, and often high acuity. Put another way, the residents may have been accessing important “just-intime” information. Another possible explanation of the high proportion of “Drugs and Chemical Classes”-related clinical questions may also indicate a special interest for this cohort of residents because of the strength of the local toxicology rotation, fellowship, and faculty. Therefore, should residency programs adopt an EBM activity like the PBL logs described here, local analysis, especially of the sub-categories, may be important. That the logs analyzed were > 10,000 in number, included each of the 20 ABEM major categories, and were collected over seven academic years, hopefully mitigates some of the limitations to the generalizability of the study.
CONCLUSION
In this single-site cohort, the use of practice-based learning logs provided insight into the clinical content areas in which EM residents ask evidence-based medicine questions while on shift. Here, the “Procedures and Skills” category was the most common source of on-shift questions for EM residents, perhaps representing just-in-time training. “Trauma” was the most common sub-category, which may be
the result of its large footprint in the ABEM Model of Clinical Practice. The residency program has a toxicology rotation and fellowship, which may have influenced these results observed. Furthermore, completing logs on shift may have impacted the mapping to ABEM acuity levels. Programmatic understanding of the content areas of resident on-shift EBM questions could serve to identify educational gaps and opportunities.
Address for Correspondence: Bryan G. Kane, MD, Lehigh Valley Health Network, Department of Emergency and Hospital Medicine, LVHN-M-South 5th Floor, 2545 Schoenersville Rd, Bethlehem, PA 18017. Email: bryan.kane2@jefferson.edu.
Conflicts of Interest: By the WestJEM article submission agreement, all authors are required to disclose all affiliations, funding sources and financial or management relationships that could be perceived as potential sources of bias. No author has professional or financial relationships with any companies that are relevant to this study. There are no conflicts of interest or sources of funding to declare.
1. Guyatt G, Cairns J, Churchill D, et al. Evidence-based medicine: a new approach to teaching the practice of medicine. JAMA. 1992;268(17):2420-5.
2. Wyer PC. Evidence-based medicine and problem based learning: a critical re-evaluation. Adv Health Sci Educ Theory Pract. 2019;24(5):865-78.
3. Sackett DL, Rosenberg WM, Gray JA, et al. Evidence-based medicine: what it is and what it isn’t. BMJ. 1996;312(7023):71-2.
4. Sackett DL, Straus SE, for Firm A of the Nuffield Department of Medicine. Finding and applying evidence during clinical rounds: the “evidence cart”. JAMA. 1998;280(15):1336-8.
5. Accreditation Council for Graduate Medical Education. Program requirements, FAQs, and applications. 2025. Available at: https:// www.acgme.org/specialties/emergency-medicine/programrequirements-and-faqs-and-applications/. Accessed July 10, 2025.
6. Accreditation Council for Graduate Medical Education. Milestones. 2025. Available at: https://www.acgme.org/specialties/emergencymedicine/milestones/. Accessed July 10, 2025.
7. Tavarez MM, Kenkre TS, Zuckerbraun N. Evidence-based medicine curriculum improves pediatric emergency fellows’ scores on in-
training examinations. Pediatr Emerg Care. 2020;36(4):182-6.
8. Brown JB, Varadhan AK, Albers JR, et al. A measure of the impact on real-time patient care of evidence-based medicine logs. West J Emerg Med. 2024;25(4):565-73.
9. Beeson MS, Ankel F, Bhat R, et al. The 2019 Model of the Clinical Practice of Emergency Medicine. J Emerg Med. 2020;59(1):96-120.
10. Council of Residency Directors in Emergency Medicine. CORD. 2023. Available at: https://www.cordem.org/. Accessed March 20, 2023.
11. Hadley JA, Wall D, Khan KS. Learning needs analysis to guide teaching evidence-based medicine: knowledge and beliefs amongst trainees from various specialties. BMC Med Educ. 2007;7:11.
12. De Lorenzo RA, Mayer D, Geehr EC. Analyzing clinical case distributions to improve an emergency medicine clerkship. Ann Emerg Med. 1990;19(7):746-51.
13. Arvig MD, Mogensen CB, Skjøt-Arkil H, et al. Chief complaints, underlying diagnoses, and mortality in adult, non-trauma emergency department visits: a population-based, multicenter cohort. West J Emerg Med. 2022;23(6):855-63.
14. McCord G, Smucker WD, Selius BA, et al. Answering questions at the point of care: Do residents practice EBM or manage information sources? Acad Med. 2007;82(3):298-303.
National Survey of Telemedicine Curricula Among Emergency Medicine Residencies
Christopher Reisig, MD, MA*
Destinee Soubannarath Gwee, MD†
William Simmons, MPH*
Brendan Tarantino, BS*
Neel Naik, MD*
Section Editor: Asit Misra, MD
Saint Joseph Medical Center, Department of Emergency Medicine, Joliet, Illinois * †
NewYork-Presbyterian Weill Cornell Medicine, Department of Emergency Medicine, New York, New York
Submission history: Submitted September 25, 2025; Accepted January 6, 2026
Electronically published May 3, 2026
Full text available through open access at http://escholarship.org/uc/uciem_westjem DOI 10.5811/westjem.52946
Introduction: Telehealth continues to reshape healthcare delivery in the United States. Recognizing its growing importance and the need for advances in education, the Association of American Medical Colleges released telehealth competencies in 2021, and the Accreditation Council of Graduate Medical Education (ACGME) recently proposed a structured telemedicine experience as part of all emergency medicine (EM) residencies. Despite these efforts, it is unclear whether EM residencies have adopted these new educational mandates. Our primary objective in this study was to understand whether (and how) U.S. EM residencies have implemented telehealth education.
Methods: We developed a cross-sectional, national survey to describe existing telehealth curricula among ACGME-accredited EM residencies. Program directors were surveyed via email. Our primary outcome measure was the percentage of residencies with existing telehealth curricula. Secondary outcomes assessed telehealth curricula emphases, implementation barriers, and telehealth’s perceived importance to EM training.
Results: Of 282 U.S.-based EM residencies, 67 programs responded (24% response rate). Of these, only five (7.5%) reported having a formal telehealth curriculum. Programs with curricula were likely to teach real-time telehealth skills (80%) and focus on data collection (80%), patient safety (80%), and communication (60%). Programs without curricula identified prioritization of other curricula (76%), insufficient faculty expertise (65%), and limited infrastructure (50%) as barriers. We also found that 61% of programs viewed telehealth education as of limited importance to EM training. At the same time, program directors expressed interest in the development of asynchronous telehealth content from trusted national EM organizations (60%).
Conclusion: Formal telehealth curricula remain the exception rather than the rule among U.S. EM residencies. Despite accreditation bodies urging its adoption, telehealth education faces multiple barriers, including limited faculty expertise, lack of telehealth infrastructure, and low perceived education importance. Our research suggests that national organizations may play a key role in providing early telehealth education while programs adapt to these new educational requirements [West J Emerg Med. 2026;27(3)540–547.]
INTRODUCTION
In the evolving healthcare landscape, the integration of telehealth is reshaping medical care.1 Understanding
how emergency medicine (EM) training programs respond to these changes is crucial. In 2021, the Association of American Medical Colleges (AAMC) established guidelines
on telehealth competencies, providing a framework for their inclusion in medical schools and residency programs.2,3 More recently, the Accreditation Council of Graduate Medical Education (ACGME) proposed that all EM residents have a “structured experience in telemedicine” as part of their postgraduate training.4 Despite these guidelines and proposed residency requirements, it remains unclear whether telehealth has yet been integrated into EM curricula and whether programs are in a position to adopt these changes.
Social constructivist learning theory has long recognized the importance of the learning environment to any educational endeavor. We developed a cross-sectional survey for distribution to U.S. EM residency program directors in the belief it would provide insight into the learning environment in which telehealth curricula would be situated. Conceived before the recently proposed ACGME changes, our survey was designed to explore whether (and how) EM residencies in the U.S. have incorporated telehealth education into their curricula. We sought to understand what structural and educational barriers hinder implementation, including program directors’ perception of the value of telehealth to EM training, residency programs’ infrastructural capacity to provide telehealth, their faculty expertise to devise and execute a curriculum, and their hopes for supplemental educational support.
As telehealth continues to grow, it is vital that the next generation of emergency clinicians be adept at delivering digital healthcare. Our research provides a snapshot of the current educational landscape and the future work to be done.
METHODS
We conducted an extensive literature review but found no validated surveys assessing the current state of telehealth education among EM residencies. We then designed a cross-sectional survey to assess the prevalence of telehealth education in EM residency training, identify which of the AAMC competencies were addressed by the telehealth curricula that did exist, and identify barriers to implementation. Consistent with best practices, we developed our survey’s construct by assembling panels of content experts in the respective fields of telehealth and medical education and collaboratively formulating the survey questions.5
The initial draft underwent a refinement process through cognitive interviews conducted with content experts in both fields. Incorporating insights from these interviews, we iteratively revised the survey and piloted it with content experts outside our institution whose feedback further refined the survey construct. The final survey (see Supplemental Section) was imported into a secure web-based survey platform (Qualtrics International, Inc, Provo, UT) and consisted of 15-17 questions depending on respondents’ answers to branch-logic questions. Most questions took the form of multiple-choice selection and nominal categories. Narrative boxes were also provided to capture data outside the provided choices. As part of the survey design, all respondents
Population Health Research Capsule
What do we already know about this issue?
Multiple governing medical bodies have stated telehealth education is critical to future physicians’ clinical training.
What was the research question?
To what extent have U.S. emergency medicine residencies incorporated telehealth education into their curricula, and what barriers exist to implementation?
What was the major finding of the study?
Very few EM residencies have telehealth curricula or the internal capacity to develop one.
How does this improve population health?
Our findings suggest there is emerging need for telehealth curricular development to meet the evolving field of healthcare.
were asked (but not required) to identify their program to avoid duplicative responses in the final dataset. The survey and its associated consent language was approved by our institutional review board.
Our population of interest was ACGME-accredited, U.S.based, categorical EM residency programs, of which 282 were listed on the Electronic Residency Application Service website as of September 2023. To reach this cohort, we directly emailed program directors. In that email, we asked them to respond to the survey or re-direct it to the member of their leadership team with the most knowledge regarding telehealth education. All communications included approved consent language, and respondents were informed that participation was purely voluntary and uncompensated. Initial emails were sent in September 2023, followed by two reminder emails sent to those program directors who (based on review of received surveys) had not responded to the initial email.
Responses were initially sorted by program name to screen for duplicates. Four programs chose to remain anonymous but completed the survey. We found sufficient heterogeneity in their responses to suggest these responses represented distinct programs rather than duplicate surveys, and all were included in the final data analysis. One program director (who disclosed the identity of their program) responded twice. There were no discrepancies between the two responses except that one survey contained additional
information in the form of free text; we included the more complete survey for data analysis.
Survey results were imported from Qualtrics into R v4.4.0 (The R Foundation for Statistical Computing, Vienna, Austria). We formatted and tabulated the results using the R package gtsummary, with counts and percentages presented in tables. Some program directors declined to answer a particular question. In these instances, we calculated relevant counts and percentages based on provided responses, with the denominator reflecting the subset of those who responded. For free-text responses, we performed a thematic analysis to identify common narrative themes.
RESULTS
Overview of Programs Surveyed
Of the 282 programs emailed, 67 distinct programs responded for a response rate of 24% (67/282). Among respondents, there was good representation with respect to residency length (three vs four years), residency type (eg, university based, community based, etc.), community demographic served (eg, rural, urban, suburban), and regional location (Northeast, Midwest, South, etc). Of note, 25% (17/67) of surveyed program directors reported that their departments offered clinical services via telehealth; 69% (46/67) stated they did not offer any telehealth care; and 6% (4/67) did not answer. An overview of characteristics of the programs surveyed is described in Table 1.
Of the 67 residency program directors who responded, 7.5% (5/67) reported they had a formal telehealth curriculum. These five programs identified as being university based or affiliated and were in either the Northeast or Midwest. Four of the five (80%) were three-year programs. Of those five, one program director noted that while the residency had a telehealth curriculum, they did not provide clinical telehealth care. By contrast, 21% (13/62) of respondents reported offering clinical telehealth services but not having a formal telehealth curriculum.
Characteristics of Telehealth Curricula
In those programs where a telehealth curriculum existed, we sought to better understand its broad characteristics. We asked about the forms of telehealth incorporated into the curriculum (eg, real-time patient care, physician-to-physician consultation, use of asynchronous medical data portals), the AAMC competencies addressed, and the educational modalities used. We also queried programs directors about their remaining educational needs with respect to telehealth. Characteristics of residency programs’ telehealth curricula are summarized in Table 2.
Of the five programs with a telehealth curriculum, 80% (4/5) taught real-time (or live patient care) telehealth; as noted earlier, one program did not provide clinical telehealth services. Two of the five programs (40%) taught via physician-to-physician consultations and mobile health
technologies (eg, third-party smartphone apps). One program (20%) additionally used remote patient-monitoring training as part of its telehealth curriculum.
Of the six AAMC telehealth competencies, the most frequently addressed in telehealth curricula were “Data Collection and Assessment’ (80%, 4/5) and “Patient Safety and Appropriate Use of Telehealth” (80%, 4/5). “Communication via Telehealth” (60%, 3/5), “Ethical Practices and Legal Requirements” (60%, 3/5), and “Technology for Telehealth” (60%, 3/5) were the next most frequently taught; 40% (2/5) of programs addressed “Access and Equity” as part of their telehealth curricula. Most programs with telehealth curricula delivered their curricula via live lectures (80%, 4/5) and through a combination of mandatory and elective telehealth shifts (80%, 4/5). Two programs (40%, 2/5) additionally employed simulated telehealth experiences. Of note, one program used only mandatory shifts in their curricular delivery.
We also asked program directors whether their telehealth curricula might benefit from additional, external educational support. We framed the question in terms of the AAMC competencies, asking which (if any) of these domains could they better teach with external education content; we also asked how they would prefer to have that content delivered. Four of the five (80%) responded that their programs would benefit from additional resources addressing “Ethical Practices and Legal Requirements,” while 60% (3/5) noted additional support in teaching “Communication via Telehealth.” Educational support for each of the remaining competencies was endorsed by 60% (3/5) of program directors. In terms of educational modalities, program directors primarily expressed interest in simulation (60%, 3/6); live lectures (40%, 2/5); and asynchronous content created by a national EM organization (40%, 2/5). One program director responded that their telehealth curriculum was selfsufficient from an educational delivery standpoint.
Challenges to Telehealth Curricula
If a program director reported not having a telehealth curriculum, we sought to better understand why. We asked about barriers to curricular implementation, the perceived importance of specific AAMC competencies, and how external educational support might augment any future telehealth curricula. A summary of these findings can be found in Table 3.
When asked what factors have prevented the implementation of a telehealth curriculum, the largest proportion of program directors (76%, 47/62) responded that they did not consider telehealth education to be a curricular priority. Additionally, 40% (25/62) of responding directors did not realize that AAMC telehealth competencies existed. Most reported insufficient faculty expertise to develop and run a curriculum (61%, 38/62 and 65%, 40/62, respectively), and 50% (31/62) indicated a lack of institutional infrastructure to support a curriculum. Of note, only 3.2% (2/62) of respondents reported that their department’s lack of
Table 1. Demographics of emergency medicine residencies whose program directors responded to a survey regarding the prevalence of (and barriers to) formal telehealth curricula.
How many residents does your program have in each class?
is your department’s annual patient volume?
Does your department or division of emergency medicine offer clinical telehealth services?
clinical telehealth services served as a barrier to a telehealth curriculum.
We also sought to better understand how programs without telehealth education might envision a future curriculum. When asked what AAMC competencies they would prioritize, programs felt most strongly about teaching “Patient Safety and Appropriate Use of Telehealth” (65%, 40/62). There was, however, broad support for most of the
Table 2. Characteristics of existing telehealth curricula in U.S. emergency medicine residencies derived from a survey of program directors.
Which forms of telehealth do you currently address in your curriculum?
Of the six telehealth competencies outlined by the AAMC, which are addressed in the learning objectives of your telehealth curriculum?
For which of the telehealth competencies would your program most benefit by having access to high-quality, externally created educational content? (Select all that apply.)
(or
Note: Response categories are not mutually exclusive. Response percentages represent proportion of sample with response and do not necessarily sum to 100%.
AAMC, Association of American Medical Colleges; ACEP, American College of Emergency Physicians; SAEM, Society for Academic Emergency Medicine; AAEM, American Academy of Emergency Medicine.
competencies, with 58% (36/62) prioritizing “Communication via Telehealth,” 52% (32/62) prioritizing “Ethical and Legal Requirements,” and 50% (31/62) prioritizing “Data Collection and Assessment.” Of all the competencies, the least prioritized was “Technology for Telehealth” (31%, 19/62).
When asked what resources/modalities would best help them deliver a future telehealth curriculum, the most preferred option was asynchronous content created by a trusted national EM organization (60%, 37/62). There was relatively
comparable interest in a variety of other modalities, including simulation (39%, 24/62), elective shifts (37%, 23/62), live lectures (27%, 17/62) and asynchronous content created by their home institution (26%, 15/62).
Attitudes Toward Telehealth
Recognizing that multiple-choice questions might miss important qualitative information driving programs’ decisions to institute a telehealth curriculum, we also included free-
Table 3. Barriers to formal telehealth curricula noted by program directors who responded to a survey regarding the prevalence of (and barriers to) formal telehealth curricula in U.S. emergency medicine residency programs.
What has prevented your program from implementing a formal telehealth curriculum?
not feel this is a curricular priority at this time
Were you to create a telehealth curriculum for your residency, which of the following six competencies (as outlined by the AAMC) would you prioritize?
Which form(s) of content would best help you deliver a formal telehealth curriculum at your program?
(eg, ACEP/SAEM/AAEM)
Note: Response categories are not mutually exclusive. Response percentages represent proportion of sample with response and do not necessarily sum to 100%.
AAMC, Association of American Medical Colleges; EM, emergency medicine; ACEP, American College of Emergency Physicians; SAEM, Society for Academic Emergency Medicine; AAEM, American Academy of Emergency Medicine.
text sections in the survey. We asked program directors, “In your opinion, how important will telehealth education be to EM residency training in the future?” To this last question, 38% (26/67) responded that telehealth education would be “moderately,” “very,” or “extremely” important, while 61% (41/67) considered telehealth education to be “slightly” or “not at all” important (Figure 1).
These broad sentiments were reflected in narrative comments. Themes that emerged included uncertainty whether telehealth has a role in EM, skepticism that telehealth required
a specific curriculum (ie, that it was functionally identical to in-person care), and recognition that operational barriers to telehealth implementation limited efforts to teach it.
DISCUSSION
Our data suggest that relatively few EM residency programs currently have telehealth education in place (7%, 5/67). The drivers of this seem to be multifactorial. Primary among these is the structural barrier to telehealth education. Many programs lack an existing telehealth platform or the
1. Emergency medicine program directors’ attitudes regarding the importance of a telehealth curriculum derived from a survey of 67 respondents.
institutional commitment to develop one. Developing an integrated clinical telehealth service is challenging and may require support outside the ED to actualize. In the absence of providing clinical telehealth services to patients (69% of respondents did not), it is perhaps unsurprising then that many residency faculty lack expertise in the area, further limiting efforts to educate residents. Recognizing these barriers, the majority of program directors (60%) without telehealth curricula reported interest in partnering with trusted national EM organizations to leverage outside expertise and circumvent operational hurdles to implementing clinical telehealth.
Our data also suggest that telehealth education faces an uphill struggle when it comes to its perceived value and importance in EM. Of the 67 program directors surveyed, 41 (61%) expressed the opinion that telehealth education is of only marginal importance to EM training. This attitude likely reflects separate threads that emerged in our objective and narrative data. As noted earlier, some program directors felt as if telehealth care was sufficiently similar to in-person care that it did not merit a separate curriculum. Others expressed their belief that the role of telehealth in EM was limited at baseline, with one program even underscoring that it was not an ABEM requirement. While most program directors noted faculty and infrastructural barriers to implementing a telehealth curriculum (65% and 50%, respectively), the most common reason was that they simply did not consider telehealth education to be a curricular priority (76%, 47/62).
Educational time can be a zero-sum game in residency and, not surprisingly, program directors allocate time to what they deem to be most important (or required). With only 25% (17/67) of emergency departments even offering clinical telehealth services, it is understandable how this combination of skepticism about and unfamiliarity with telehealth might lessen its perceived import to residency leadership.
Despite these barriers, there does appear to be some consensus regarding what competencies within telehealth would be most relevant to EM. Among the surveyed program directors, there was strong interest in curricula focused on patient safety and appropriate use of telehealth, communication skills, and data collection and assessment. These priorities were similar across programs with and without existing telehealth curricula and perhaps speak to an implicit recognition of the ways in which telehealth care differs from traditional bedside care. Among programs with existing telehealth curricula, there was an additional strong interest in obtaining external educational support to teach the ethical and legal considerations of telehealth, which is unsurprising given the ever-evolving medicolegal telehealth landscape.
LIMITATIONS
Our survey study has several limitations. Most apparent is our low response rate (24%), which threatens the generalizability of our findings and conclusions. While existing survey literature suggests that low response rate does not
Figure
necessarily entail non-response bias, we attempted to formally analyze the extent to which non-response bias might have affected our primary question as to the prevalence of existing telehealth curricula.6,7 To do so, we employed a wave analysis, which uses late survey respondents as a surrogate for nonrespondents. We had one positive response in Wave 1 (1/42, 2.4%) and three in Wave 3 (3/11, 27.3%). A pairwise Fisher exact test was significant (P = .03), suggesting a component of non-response bias. (Of note, two of the three respondents in Wave 3 were affiliated with our home institution and were known to us prior to undertaking this landscape survey. While a wave analysis is intended to characterize the unknown group of non-respondents, our wave analysis may ironically have overstated the degree to which there are unaccountedfor telehealth education programs.) While we recognize this significant limitation, our results are consistent with what little data exist on this topic, and the general uniformity of our data (ie, telehealth’s relative absence) suggests to us it is unlikely that our survey missed large pockets of existing telehealth education.8 We also recognize that there may be inaccuracies embedded within our reported data. While program directors may be expert when it comes to their educational curricula, they may lack insight into larger departmental or institutional forces that pertain to telehealth implementation. Thus, some of the reported barriers and challenges to telehealth education may be perceived as opposed to substantive.
CONCLUSION
Our data suggest that most EM residency programs in the U.S. have not adopted AAMC recommendations and do not have a formal telehealth curriculum. Among those few programs that do teach telehealth, their curriculum is driven by lectures and shiftwork, with a focus on patient safety, digital assessment, and communication skills. Among programs without telehealth curricula, we identified several barriers to its implementation, including limited access to clinical telehealth services, a lack of faculty expertise in the subject, insufficient time in existing residency curricula, and a perceived lack of importance among program directors. Considering these barriers, it remains to be seen how residency programs will meet the proposed ACGME requirement of a “structured telemedicine experience.” Our data suggest one possible avenue is the use of asynchronous content developed by trusted national EM organizations. More work will be required to understand the future and relevance of telehealth in EM residency education.
Address for Correspondence: Christopher Reisig, MD, MA, NewYork-Presbyterian Weill Cornell Medicine, Department of Emergency Medicine, 419 East 69st Street, M-130, New York, NY 10021. Email: chr2019@med.cornell.edu.
Conflicts of Interest: By the WestJEM article submission agreement, all authors are required to disclose all affiliations, funding sources and financial or management relationships that could be perceived as potential sources of bias. No author has professional or financial relationships with any companies that are relevant to this study. There are no conflicts of interest or sources of funding to declare.
1. Hyder MA, Razzak J. Telemedicine in the United States: an introduction for students and residents. J Med Internet Res. 2020;22(11):e20839.
2. Association of American Medical Colleges. Telehealth competencies across the learning continuum. 2021. Available at: https://store.aamc. org/downloadable/download/sample/sample_id/412/. Accessed September 25, 2025.
3. Galpin K, Sikka N, King SL, et al. Expert consensus: telehealth skills for health care professionals. Telemed J E Health. 2021;27(7):820-4.
4. Accreditation Council for Graduate Medical Education. Emergency Medicine Program Requirements. 2025. Available at: https://www. acgme.org/globalassets/pfassets/programrequirements/2025reformatted-requirements/110_emergencymedicine_2025_ reformatted.pdf. Accessed September 25, 2025.
5. Artino AR Jr, La Rochelle JS, Dezee KJ, et al. Developing questionnaires for educational research: AMEE Guide No. 87. Med Teach. 2014;36(6):463-74.
6. Phillips AW, Friedman BT, Utrankar A, et al. Surveys of health professions trainees: prevalence, response rates, and predictive factors to guide researchers. Acad Med. 2017;92(2):222-8.
7. Phillips AW, Reddy S, Durning SJ. Improving response rates and evaluating nonresponse bias in surveys: AMEE Guide No. 102. Med Teach. 2016;38(3):217-28.
8. Hayden EM, Davis C, Clark S, et al. Telehealth in emergency medicine: a consensus conference to map the intersection of telehealth and emergency medicine. Acad Emerg Med. 2021;28(12):1452-74.
Reisig
Relationship of Clinical Encounters to End-of-rotation Exam Scores for Fourth-year Students in Emergency Medicine
Max Y. Jin, BS*
Corlin M. Jewell, MD†
Daniel J. Hekman, MS†
Benjamin H. Schnapp, MD, MEd†
Section Editor: Muhammad Waseem. MD
University of Wisconsin School of Medicine and Public Health, Madison, Wisconsin University of Wisconsin School of Medicine and Public Health, BerbeeWalsh Department of Emergency Medicine, Madison, Wisconsin
Submission history: Submitted August 11, 2025; Revision received January 19, 2026; Accepted January 27, 2026
Electronically published May 13, 2026
Full text available through open access at http://escholarship.org/uc/uciem_westjem DOI 10.5811/westjem.50629
Background: Emergency medicine (EM) clerkship directors view end-of-rotation exam scores as one of the most important components in the assessment of medical student performance. Understanding factors that may impact end-of-rotation exam scores is important because strong performance during fourth-year EM clerkships is crucial for matching in EM residency. One factor that may affect exam scores is increased experience through clinical encounters. Our objective in this study was to assess the relationship between the number of clinical encounters and end-ofrotation exam scores.
Methods: This was a single-site, retrospective study involving fourth-year medical students who completed a four-week EM elective between 2021–2024. We obtained exam scores and student home/away rotation status from clerkship evaluation records. The number of clinical encounters was extracted from electronic health records (EHR) via two exposure measurement methods: 1) signed notes only; and (2) signed notes or assignment to the care team on electronic EHR. We used a multivariable linear regression model to assess the impact of clinical encounters and home/away rotation status.
Results: We included 108 students in this analysis. The linear regression coefficient for each clinical encounter was 0.134 (P = .02) and 0.089 (P = .09) for the two exposure measurements, respectively. Away rotation status, when controlled for the number of patients seen, demonstrated a coefficient of 2.627 (P = .06) and 2.464 (P = .08).
Conclusion: The number of clinical encounters and home/away status had minimal to no impact on end-of-rotation exam scores. [West J Emerg Med. 2026;27(3)548–553.]
INTRODUCTION
Upon completion of each clerkship, medical students typically take the associated end-of-rotation exam to provide an objective assessment of their clinical knowledge pertinent to that specialty. Students often view this exam as the most fair form of assessment.1 In emergency medicine (EM), clerkship directors view scores from written exams as the second most important factor when assessing student performance, only behind preceptor evaluations.2 It is important for educators to understand what factors may influence student end-of-rotation exam scores because performance during fourth-year EM
rotations is one of the most important elements for successfully matching in EM residency.3
Many factors can contribute to student outcomes on end-of-rotation exams.4,5 Experiential learning theory suggests that much learning occurs through reflection of past experiences and experimentation with future interactions.6 Therefore, one factor that may be a critical determinant of medical student performance on the exam is the number of clinical encounters they have during their rotation.7,8 There is significant variation in the number of patients seen by medical students on their EM rotation due to several factors such as
location, organizational protocols, and their preceptor.9–11
Previous literature investigating EM residency education has shown that the number of clinical encounters does not correlate with American Board of Emergency Medicine (ABEM) in-training exam (ITE) scores.12
Additionally, no significant correlation was found when examining the relationship between clinical encounters and ABEM ITE scores for specific clinical domains.13 However, the relationship between clinical encounters and exam scores may be different for medical students as, compared to residents, they lack substantial prior experience with common presentations to the emergency department (ED) that are the basis for the exams. Literature focusing on the impact of EM clinical exposures on exam scores for medical students has been sparse. One prior study found no difference in exam scores of students whose EM rotation occurred during COVID-19 (when fewer patients were in the ED) and students who completed EM rotations in the year prior to COVID-19.14
The study, however, examined outcomes for their institutional exam that was similar to an Observed Structure Clinical Exam rather than a standardized written exam and was limited by small sample sizes (< 25 students in each cohort).
The correlation between number of clinical encounters and end-of-rotation exam scores has been calculated and found to be weak for other specialties including pediatrics, internal medicine, and neurology.15–18 However, no study has examined this relationship in the unique learning environment of the EM clerkship where medical students are exposed to highly diverse conditions and are often more actively involved in patient care than in other specialties.19 Our objective in this study was to analyze the relationship between total number of clinical encounters and end-of-rotation exam scores for fourth-year EM rotation students. Additionally, we aimed to determine whether there was any effect of home/away rotation status on exam scores, since away rotators may enter with higher baseline knowledge from previous rotations as students frequently complete their away rotation after their home rotation.
METHODS
Study Design and Setting
We conducted this retrospective analysis at two affiliated urban sites in the Midwestern United States. The primary site was an academic, Level I trauma ED with 54 beds that sees approximately 70,000 patients each year. The other site was a community-based ED with 20 beds that sees approximately 32,500 patients annually. The medical school curriculum is divided into three phases. Phase 1 is primarily preclinical didactics. During phase 2, all students complete a two-week EM rotation as part of their core rotations. Because Phase 2 students do not take any end-of-rotation exams for EM, they were not included in this study. Phase 3 spans the final 18 months of the curriculum, and students have the option to enroll in the EM Advanced Elective. This four-week elective
Population Health Research Capsule
What do we already know about this issue? There’s a weak, positive correlation between clinical encounters and exam scores in pediatrics, internal medicine, and neurology, but this relationship hasn’t been examined in EM.
What was the research question?
In fourth-year medical students, is a higher number of patients seen by medical students associated with higher EM exam scores?
What was the major finding of the study?
Each additional patient seen is not associated with any significant increase in exam score (B = 0.134 [p = .02] and 0.089 [p = .09]).
How does this improve population health? This study suggests that clerkship directors looking to boost student exam performance should consider alternative strategies beyond pure clinical exposure.
is specifically designed for those interested in pursuing an EM residency and results in the generation of an EM Standardized Letter of Evaluation.
Other fourth-year EM electives are available for students pursuing non-EM residencies. Data from these electives were not included in this study. For the EM Advanced Elective, students complete 15 shifts in the ED where they independently care for patients under the supervision of an attending physician assigned to them at the start of each shift. The shifts are a mix of days, nights, and weekends, occurring at both sites, in a similar distribution for all students. All students have similar opportunities to see patients regardless of the site or month of rotation. Medical students were not paired with any particular attending. Each shift is 9 hours in duration, and students are expected to assist in all aspects of patient care at a similar level to early first-year residents. Their tasks include conducting a history and physical examination, calling consultants, writing notes, and dispositioning patients. Students document in the official chart and their documentation can be used for billing.20
At the end of the rotation, students take the Society for Academic Emergency Medicine (SAEM) M4 National Emergency Medicine Exam as their end-of-rotation exam. The SAEM exam, which is free to use, was created by a national
Relation of Number of Patients with Exam Scores for Fourth-year Medical Students
committee of education leaders in EM.21,22 It is composed of 55 multiple-choice questions and is commonly used by clerkship directors as the end-of-rotation exam for fourth-year EM rotations. Each question was created according to the National Board of Medical Examiners item-writing guidelines. It is designed to function as an end-of-rotation, high-stakes examination and assesses a student’s knowledge on critical topics in EM. The exam is administered electronically to students and is taken asynchronously during the final week of the rotation. The structure of the EM Advanced Elective is the same throughout the course of the year, with most home students taking it in May–July and away students taking it August–October.
Data Acquisition
We obtained end-of-rotation exam scores (reported as percentage of correct questions) and student home/away rotation status from clerkship evaluation records for the previous four years (May 2021–October 2024). The number of clinical encounters were extracted from the EHR for the same time span. We chose to use EHR data as this has been found to be more accurate than other methods at our institution.23 Clinical encounters were included if a fourthyear medical student was identified by the EHR as involved in the patient’s care and an end-of-rotation exam score was available for that student.
We identified medical student engagement with the clinical encounter via two methods. The primary exposure measurement identified included encounters where notes were signed by a medical student, as this reflects definite student involvement in the patient’s care. The secondary exposure measurement included cases where medical students either signed a note or were assigned to the patient’s care team in the EHR. The inclusion of care team additions added sensitivity but at the expense of specificity, as sometimes students will sign up for the wrong patient or the situation in the ED changes such that the student does not actually manage that patient. We analyzed the relationship between patient encounters and end-of-rotation exam scores for both exposure measurements. Exclusion criteria included students completing their two-week EM rotation
during their core clinical rotations or other EM rotations outside the EM Advanced Elective. All student names were deidentified, and no individual patient-level data was extracted to maintain anonymity.
Data Analysis
We used two multivariable linear regression models to assess the relationship between the number of clinical encounters and end-of-rotation exam scores. One model used the primary exposure measurement values for clinical encounters, while the other model used the secondary exposure measurement values. Predictor variables included in our models were number of clinical encounters and home/ away rotation status. For all statistical analyses performed, a P value ≤ .05 was taken as statistical significance. We analyzed data using IBM SPSS Statistics v30 software (International Business Machines Corporation, Armonk, NY).
This study was evaluated by the University of Wisconsin Institutional Review Board and deemed to be exempt from full review as quality improvement.
RESULTS
We identified 110 medical students as having an end-ofrotation exam score available. Two of these students did not have any clinical encounters found in the EHR and were excluded. For the 108 medical students included in this study, the average (standard deviation [SD]) number of clinical encounters during this four-week elective was 54.70 (11.39) based on signed notes only (Table 1). When also including encounters where students assigned themselves to the care team, the average (SD) number of encounters was 60.30 (13.02). The average end-of-rotation exam score was 79.12% (6.98). Our linear regression model found that for each additional patient seen, exam scores increased by 0.134% (95% CI, 0.018–0.249; P = .02) and 0.089% (95% CI, -0.013 to 0.191; P = .09) based on the two exposure measurements, respectively. The R2 for the model using the primary exposure measurement was .070, and the R2 for the model using the secondary exposure measurement was .050.
Of the 108 medical students included in this study, 67
Table 1. Number of medical student clinical encounters and their end-of-rotation exam scores in a study assessing the relationship between clinical encounters and exam outcomes.
were home rotators who had an average (SD) end-of-rotation exam score of 78.29% (7.24) (Table 1). Home students saw an average of 55.99 (12.84) to 61.52 (14.97) patients based on the two exposure measurements. The other 41 students were away rotators with an average exam score of 80.47% (6.41). These students saw an average of 52.61 (8.24) to 58.29 (8.77) patients. Away students scored higher on end-of-rotation exams by 2.627% (95% CI, -0.074 to 5.329; P = .06) and 2.464% (95% CI, = -0.258 to 5.185; P = .08) when adjusted for the number of patients seen. A scatterplot displaying each individual student’s number of clinical encounters and end-of-rotation exam scores is presented in Figure 1 and Figure 2 for the two exposure measurements, respectively.
DISCUSSION
Our results indicate that the number of clinical encounters had minimal to no impact on end-of-rotation exam scores in EM. Being an away rotator may be associated with higher exam scores, although these results were not statistically significant. Based on our data, students saw 3-4 patients per 9-hour shift. While this appears low, it is not an unreasonable number for trainees who are new to the clinical environment. It has been previously found at our institution that more junior-level medical students have low overall exposure to the highest acuity patients.11 This may contribute to fewer patients seen due to the high acuity and complexity within our patient population. Furthermore, students are still adapting to the new intern-level responsibilities that are tasked to them during this rotation.
Our linear regression results (B = 0.134 and 0.089) suggest a trend of a weak, positive relationship between clinical encounters and end-of-rotation exam scores, although this did not reach statistical significance. The positive direction of this relationship has also been reported through previous studies analyzing correlations in pediatrics (r = 0.189),17 internal
medicine (r = 0.01 - 0.17 for four groups based on what quarter they completed the rotation),18 combined internal medicine/ pediatrics (P = .17),15 and neurology (r = 0.142).16 It is plausible that the utility of clinical engagements may be greater for students who have a higher level of baseline clinical knowledge, which could explain why away rotators in our study (who are on their second or third rotation) scored higher on the end-ofrotation exam. Understanding factors that influence EM rotation achievement is important because it can aid in future curriculum development; more training time should be considered for components that most positively influence student success. Previous studies have indirectly assessed the relationship between clinical encounters and exam outcomes. Overall, studies examining the relationship between clinical encounters and end-of-rotation exam scores have been mixed, highlighting the need for further investigation into how multiple factors in the clinical environment can interact to influence student learning. In EM, it has been reported that crowding in the ED was negatively associated with exam outcomes for a two-year sample.4 Of the studies examining other specialties, only one study of a psychiatry rotation reported a significant relationship with exam scores when comparing different lengths of rotation.24 In surgery, it was found that students who completed the clerkship later in the curriculum (ie, completed clerkships for other specialties first and had more overall clinical experience) achieved better exam scores, although no statistical analysis was performed.25 No significant differences were found in end-of-rotation exam scores for pediatrics when compared to a course without clinical activities and obstetrics/gynecology across different clinical hours worked, unless the longer hours occurred in the final two weeks of the clerkship.26,27
It is important to recognize that engagement with clinical
Figure 1. Scatterplot of clinical encounters and end-of-rotation exam scores (primary exposure measurement).
Figure 2. Scatterplot of clinical encounters and end-of-rotation exam scores (secondary exposure measurement).
encounters is just one aspect of a student’s learning experience. Other potential determinants of end-of-rotation exam success have been previously investigated. In psychiatry, attendance at a comprehensive review session three days prior to the exam was found to result in significantly increased exam scores.28 A study in surgery found that use of outside resources was correlated with better exam scores.29 Specifically, it was found that the use of four different resources was optimal, with question banks and focused review textbooks being the most effective options. Regarding time spent studying, it has been found that 6-10 hours and 11-15 hours are ideal for the first and second half of the surgical rotation, respectively. The use of practice exams has also been associated with higher exam scores across several specialities.30 This suggests that clinical knowledge and test knowledge may be different constructs as common topics for exam questions may be rarely seen in the clinical environment (eg, toxins/antidotes).
Future studies would benefit from a prospective design, so that the number of clinical encounters can be more accurately identified and potential confounding variables such as study time and study materials can be accounted for. It would also be of interest to examine the relationship for other standardized end-of-rotation exams, such as the NBME EM Advanced Clinical Exam. Lastly, the effect of home or away rotation status on clinical exposures warrants further investigation.31
LIMITATIONS
Our study has several important limitations. During the extraction of clinical encounters, it is possible that there were cases where a medical student was involved in a patient’s care but did not write a note or assign themselves to the patient’s care team. The specifics of on-shift teaching and observation of other cases is hard to account for in a retrospective study. A student may have been asked to help with the initial evaluation of a critically injured trauma patient or observe a unique case but were not the part of the primary team involved in that patient’s care. While these cases would not be reflected in our analysis, as the chart would not indicate the medical student’s involvement, they were sstill likely to be important learning experiences that could help them answer end-of-rotation exam questions. Another limitation was that we were unable to collect data on potential other confounding variables such as U.S. Medical Licensing Exam test scores or prior grades, which would have been hard to control for as much of the preclinical work is graded pass/fail. While we recognize that test-taking ability contributes to exam outcomes, students still need EM knowledge to be successful on the end-of-rotation exam. Neither did we measure the breadth of chief complaints seen, other study resources used, or the amount of time spent reviewing clerkship content, which could have been additional mediating variables. Lastly, because we focused on the SAEM
M4 exam our study results may not be directly applicable for programs that use other exams.
CONCLUSION
The relationship between the number of clinical encounters recorded by medical students on their emergency medicine rotation and their end-of-rotation exam scores was minimal to none. Similarly, the effect of home vs away rotation on exam scores was also negligible.
Address for Correspondence: Benjamin H. Schnapp, MD, MEd, University of Wisconsin, BerbeeWalsh Department of Emergency Medicine, 800 University Bay Dr, Suite 310, Madison, WI 53705. Email: bschnapp@medicine.wisc.edu
Conflicts of Interest: By the WestJEM article submission agreement, all authors are required to disclose all affiliations, funding sources and financial or management relationships that could be perceived as potential sources of bias. No author has professional or financial relationships with any companies that are relevant to this study. There are no conflicts of interest or sources of funding to declare.
1. Tolsma R, Shebrain S, Berry SD, et al. Medical student perceptions of assessments of clinical reasoning in a general surgery clerkship. BMC Med Educ. 2024;24(1):211.
2. Khandelwal S, Way DP, Wald DA, et al. State of undergraduate education in emergency medicine: a national survey of clerkship directors. Acad Emerg Med. 2014;21(1):92-5.
3. Lotfipour S, Luu R, Hayden SR, et al. Becoming an emergency medicine resident: a practical guide for medical students. J Emerg Med. 2008;35(3):339-44.
4. Wei G, Arya R, Ritz ZT, et al. How does emergency department crowding affect medical student test scores and clerkship evaluations? West J Emerg Med. 2015;16(6):913-8.
5. Morey G, Morey VC, Gruman T, et al. A literature review on optimizing study strategies in medical education: insights from exam scores and study resources. Cureus. 2024;16(11):e74034.
6. Kolb DA, Boyatzis RE, Mainemelis C. Experiential learning theory: previous research and new directions. In: Sternberg RJ, Zhang LF, eds. Perspectives on Thinking, Learning, and Cognitive Styles. Philadelphia, PA: Routledge Publishing Ltd; 2014:227-248.
7. Hanson AE, P’Pool A, Starr MC, et al. Decline in pediatric shelf examination performance during COVID-19. Cureus. 2021;13(10):e18453.
8. Duca N, Adams N, Glod S, et al. Barriers to learning clinical
Relation of Number of Patients with Exam Scores for Fourth-year Medical Students
reasoning: a qualitative study of medicine clerkship students. Med Sci Educ. 2020;30(4):1495-1502.
9. DeLahunta EA, Bazarian J. University and community hospital medical student emergency medicine clerkship experiences. Acad Emerg Med. 1998;5(4):343-346.
10. De Lorenzo RA, Mayer D, Geehr EC. Analyzing clinical case distributions to improve an emergency medicine clerkship. Ann Emerg Med. 1990;19(7):746-751.
11. Hoxha I, Hekman DJ, Schnapp B. Second- and third-year medical students’ clinical encounters in the emergency department. AEM Educ Train. 2024;8(1):e10937.
12. Frederick RC, Hafner JW, Schaefer TJ, et al. Outcome measures for emergency medicine residency graduates: Do measures of academic and clinical performance during residency training correlate with American Board of Emergency Medicine test performance? Acad Emerg Med. 2011;18(Suppl 2):S59-64.
13. Kern MW, Jewell CM, Hekman DJ, et al. Number of patient encounters in emergency medicine residency does not correlate with in-training exam domain scores. West J Emerg Med. 2023;24(1):114-118.
14. Tennill RM, Turner M, Fleming A, et al. The impact of COVID-19 on emergency medicine rotations. Cureus. 2022;14(10):e30752.
15. Elnicki DM, Zalenski D, Mahoney J. Associations between medical student log data and clerkship learning outcomes. Teach Learn Med. 2012;24(4):298-302.
16. Albert DV, Brorson JR, Amidei C, et al. Education research: case logs in the assessment of medical students in the neurology outpatient clinic. Neurology. 2014;82(16):e138-41.
17. Beck GL, Matache MT, Riha C, et al. Clinical experience and examination performance: Is there a correlation? Med Educ. 2007;41(6):550-5.
18. Dong T, Artino AR, Durning SJ, et al. Relationship between clinical experiences and internal medicine clerkship performance. Med Educ. 2012;46(7):689-97.
19. Johnson GA, Pipas L, Newman-Palmer NB, et al. The emergency medicine rotation: a unique experience for medical students. J Emerg Med. 2002;22(3):307-11.
20. Tillman DS, Jewell CM, Hekman DJ, et al. Documentation from
trained medical students has a low rate of relative downcoding for emergency medicine encounters. AEM Educ Train. 2022;6(3):e10741.
21. Senecal EL, Heitz C, Beeson MS. Creation and implementation of a national emergency medicine fourth-year student examination. J Emerg Med. 2013;45(6):924-34.
22. Miller ES, Heitz C, Ross L, et al. Emergency medicine student end-of-rotation examinations: Where are we now? West J Emerg Med. 2018;19(1):134-6.
23. Liang N, Jewell CM, Hekman DJ, et al. PGY-2 emergency medicine residents are more efficient when paired with an early clinical medical student. AEM Educ Train. 2024;8(5):e11028.
24. Bostwick JM, Alexander C. Shorter psychiatry clerkship length is associated with lower NBME psychiatry shelf exam performance. Acad Psychiatry. 2012;36(3):174-6.
25. Phares A, Sauder CA, Salcedo ES, et al. Timing of surgery and internal medicine clerkships and surgery shelf examination scores. J Surg Res. 2019;244:456-9.
26. Lee C. Virtual, non-clinical “bootcamp” to prepare for the NBME subject matter (shelf) exam during the pediatric clerkship. 2023. Available at: https://scholarscompass.vcu.edu/med_edu/87. Accessed January 1, 2023.
27. Harris BS, Harris HM, Baldwin MA, et al. Medical student duty hours and shelf performance: I ds there a correlation? Am J Perinatol. 2023;41:e2135-7.
28. Sidhu SS, Chandra RM, Wang L, et al. The effect of an end-ofclerkship review session on NBME psychiatry subject exam scores. Acad Psychiatry. 2012;36(3):226-8.
29. Volk AS, Rhudy AK, Marturano MN, et al. Best study strategy for the NBME clinical science surgery exam. J Surg Educ. 2019;76(6):1539-45.
30. Manguvo A, Litzau M, Quaintace J, et al. Medical students’ NBME subject exam preparation habits and their predictive effects on actual scores. J Contemp Med Educ. 2015;3(4):143.
31. Boysen-Osborn M, Andrusaitis J, Clark C, et al. A retrospective cohort study of the effect of home institution on emergency medicine standardized letters of evaluation. AEM Educ Train. 2019;3(4):340-6.
Operationalizing Competency-based Medical Education Within Clinical Competency Committees
Case Western Reserve University School of Medicine, University Hospital
Cleveland Medical Center, Department of Emergency Medicine and Medical Education, Cleveland, Ohio
Creighton University School of Medicine-Phoenix, Department of Emergency Medicine, Phoenix, Arizona
University of South Alabama, Department of Emergency Medicine, Mobile, Alabama
University of Chicago, Department of Medicine, Chicago, Illinois
Vanderbilt University Medical Center, Department of Emergency Medicine, Nashville, Tennessee
University of Wisconsin School of Medicine and Public Health, Department of Emergency Medicine, Madison, Wisconsin
University of Michigan, Department of Emergency Medicine, Ann Arbor, Michigan
Section Editor: Sara Krzyzaniak, MD
Submission history: Submitted November 1, 2025; Revision received February 12, 2026; Accepted November 28, 2025
Electronically published May 13, 2026
Full text available through open access at http://escholarship.org/uc/uciem_westjem DOI 10.5811/westjem.53819
This scholarly perspective explores the integration of competency-based medical education (CBME) within graduate medical education assessment systems, specifically the clinical competency committee (CCC). We discuss the role of the CCC in operationalizing the core components of CBME, providing guidance on best practices-related meeting structure, assessment data, and learner outcomes. By analyzing the evolving responsibilities of faculty assessors and the impact on learner progression toward unsupervised practice, this perspective highlights challenges and strategies for successful implementation of CBME principles in medical education, including an outline to use when discussing each trainee in CCC meetings. [West J Emerg Med. 2026;27(3)554–558.]
INTRODUCTION
As graduate medical education adopts competency-based medical education (CBME), existing assessment systems must evolve to align with CBME principles. Competencybased medical education is “an approach to preparing physicians for practice that is fundamentally oriented to graduate outcome abilities and organized around competencies derived from an analysis of societal and patient needs.”1 It integrates five components: outcome competencies, sequenced progression, tailored learning experiences, competency-focused instruction, and programmatic assessment (Table).2 In this way, CBME uses a framework to guide individual learners and faculty assessors in holistic summative entrustment decision-making to drive learner progression in awarding new graduated responsibility up to and including unsupervised practice.
The group tasked with summative assessment of resident physicians in the United States is the clinical competency committee (CCC).3 The decisions made by these committees are crucial to ensuring physicians are competent to provide safe patient care. Despite calls for CCCs to develop standardized structures and functions, recommendations have not yet fully integrated the principles of CBME.2,4 Our goal in writing this scholarly perspective was to highlight strategies for CCCs to meaningfully integrate CBME principles. We draw on literature from both the health professions and other fields to inform practices centered around the themes of meeting structure and culture, data gathering, and learnercentered outcomes. We include the Box below as an example of the assessment data and recommendations that can be used in preparation for, during, and at the conclusion of a CCC meeting as a summary of this perspective.
Table. The five components of competency-based medical education and their Integration into the clinical competency committee.2
CBME Core Component Definition CCC Role in Competency
Outcome Competencies
Sequenced Progression
Tailored learning experiences
“Competencies required for practice are clearly articulated.”2
“Competencies and their developmental markers are sequenced progressively.”2
“Learning experiences facilitate the developmental acquisition of competencies.”2
Utilize established frameworks to define competency, such as (1) ACGME competencies and subcompetencies or (2) EPAs, and communicate these to learners.
Recognize progression toward independent practice as defined by established frameworks, such as (1) ACGME Milestones or (2) EPAs. In assessing this progression, acknowledge learners will move along different trajectories.
Identify individual resident deficiencies with recommendations that may include additional exposure to or remediation of specific rotations. Systemic lapses in progression toward independent practice should be referred for evaluation by residency leaders and/or the Program Evaluation Committee.
Competency-focused instruction
“Teaching practices promote the developmental acquisition of competencies.”2
Programmatic assessment “Assessment practices support and document the developmental acquisition of competencies.”2
Provide CCC recommendations that can be turned into goals and implementation plans with program leaders, trainees, and/or coaches.
Ground CCC conversations about resident progression in robust assessment data. Inadequate data from faculty or residents should be referred to program leaders and/or the Program Evaluation Committee for further development.
ACGME, Accreditation Council for Graduate Medical Education; CBME, competency-based medical education; CCC, clinical competency committee; EPAs, entrustable professional activity.
PART I: MEETING STRUCTURE AND CULTURE Developmental Model
A core tenet of the CCC is to maintain a meeting culture, group members, and processes that allow for effective review of each individual learner’s progression to make summative entrustment decisions. Rather than a “problem-focused” model that primarily targets struggling learners, the adoption of a developmental model facilitates discussions centered on well-defined benchmarks. By adopting a developmental paradigm rather than one focused solely on deficiencies, CCCs are directed toward competency-based outcomes for all learners.5
Group Members
Members of the CCC should represent a range of backgrounds, academic ranks, and expertise. This diversity lessens homogenous decision-making by incorporating a spectrum of perspectives and is a key component to increasing equity in assessment.6,7 Practices such as encouraging participation from junior members before senior members may promote healthy debate, allow for respectful questioning, and aid in reaching well-informed decisions.6,8 Avoiding “groupthink,” or conforming to an idea without meaningful discussion or challenge, is essential to fostering meaningful dialogue among CCC members.9 Assigning a CCC member to be a strategic dissenter (“devil’s advocate”) can help pinpoint problem areas, identify patterns, and improve the quality of the group’s decision-making.10 This individual can also be
tasked with identifying and responding to groupthink.
Meeting Structure
Clinical competency committees are required to meet at least twice annually, which can generate time pressures in striving to discuss each resident holistically.3,11 CCCs, particularly those within larger programs, may consider meeting more regularly (ie, quarterly or monthly) or designating meetings by postgraduate year. This generates more timely and frequent feedback to trainees while also allowing CCCs to identify patterns of performance.8
Each meeting of the CCC should begin with a “mission moment” to remind members of their purpose in guiding learners toward competence and cultivating a culture of growth.8,12 When discussing trainees, CCC members should maintain a constructive and respectful tone that encourages open dialogue and idea exchange. It is critical that CCCs base dialogue in assessment data, while understanding that compiled data may be incomplete or contradictory.13 The resulting group discussion should focus on reconciling conflicting information and sharing a collective responsibility for decision-making. In this way, the CCC fulfills its role to support program directors in justifying or enforcing decisions.5
Finally, CCCs should regularly engage in evaluative practices and continuous quality improvement to ensure that the committee’s values, processes, and systems remain aligned with their mission of developing trainee competence. This includes gathering CCC member feedback on meeting structure, data analysis methods, and communication
Box. Example clinical competency committee data and recommendations.
Resident:
PGY:
Prior CCC Recommendations:
Review:
1. Previous milestone assignments
2. Knowledge assessments
a. In-training Exam
b. Question Bank Completion
3. Workplace-based Assessments
4. End-of-rotation Assessments
5. 360-degree Assessments
a. Peers
b. Patients
c. Interprofessional Team Members
4. Administrative data
a. Attendance at required didactics
b. Procedure/Case Log Completion
c. Quality Improvement Referral Metrics
Current CCC Recommendations
Based on the data analyzed during this meeting, this resident should receive (circle one):
Promotion Personal Improvement Plan Probation Termination
Specific Guidance using Start, Stop, Continue Framework (examples provided)
1. Stop anchoring on diagnoses. Consider broadening or altering your differential and changing patient disposition when needed as you interpret results of labs, imaging, and response to therapeutics.
2. Start incorporating closed-loop communication during resuscitations. Use names, when possible, to avoid confusion and ensure each team member understands which tasks to address.
3. Continue your excellent documentation. Your assessments and plans are clear and concise, allowing all members of the team to understand the workup and care of your patients.
a variety of formats, perspectives, and contexts within a clear organizing framework are essential. This principle, also known as programmatic assessment, offers the opportunity to map data sources within a residency program to provide an overview of how and by what methods each learner is assessed.15,16
We describe several methods through which programs can integrate CBME principles rooted in programmatic assessment to assist CCCs in their work. Programs should gather frequent assessments of learners so that data can be organized and processed continuously and longitudinally across contexts rather than at singular points in time.17 Furthermore, assessments should include quantitative and qualitative data to generate a holistic picture of resident performance.4 These individual assessments should be mapped to specific competencies and/or entrustable professional activities (EPA), ensuring no domains of competence are under-assessed.18 Finally, programs should define acceptable performance standards and communicate these with trainees.
The EPAs are an assessment framework well-suited for CMBE. These are “units of professional practice that can be fully entrusted to a trainee, as soon as he or she has demonstrated the necessary competence to execute this activity unsupervised.”19 When integrated into workplacebased assessments, EPA frameworks are easy to assess by clinical faculty, longitudinally track a trainee’s progress toward independent practice, and easily map to Accreditation Council of Graduate Medical Education (ACGME) subcompetencies for reporting.19–22 Twenty-two EPAs have been developed within emergency medicine (EM).23 These are currently being piloted at a number of EM residency training programs across the United States.24
Traditional methods of assessment include tests with multiple-choice question and formative clinical assessments. As programs transition to CBME, additional attention should be placed on gathering assessment data in supplemental methods, such as through simulation activities, procedural assessment, direct observation on shift, and multisource feedback (ie, patients, peers, and other healthcare team members). Integrating these practices can create a comprehensive snapshot of learner performance while also contributing to an assessment culture focused on equity.25,26
strategies. Regular reflection and adaptation can enhance the committee’s effectiveness and ensure that meetings remain productive and conducive to achieving CBME principles within the CCC.8 Ongoing faculty development around CBME can assist in maintaining fair assessment processes.14
PART II: DATA GATHERING
A crucial component of CBME is the collection and collation of timely and accurate trainee data to inform discussions during CCC meetings. Given the CCC’s role in high-stakes progression decisions, robust data collected from
PART III: LEARNER-CENTERED OUTCOMES
After CCC meetings, the committee’s discussion and interpretation of data must be translated into learner-centered outcomes and delivered to trainees in a way that promotes their development. The goal of the CCC should be to reinforce positive behaviors and modify negative behaviors.27 By acknowledging exemplary behaviors, trainees may be motivated to repeat them, resulting in increased confidence in their skills.28 Equally important, the CCC must identify and provide specific guidance to trainees as to how they can
Golden et al. Competency-based Education in Clinical Competency Committees
modify negative behaviors and performance.28
One strategy educators may employ to communicate CCC recommendations includes the “Stop, Start, Continue” approach.27 These outline which behaviors to stop, which to start, and which to continue on a trajectory toward independent practice.27 In generating these recommendations, educators should ensure statements are specific, actionable, focused on growth, and examined for bias.27
Providing learner-centered outcomes for each trainee after CCC meetings is an integral way programs can transition toward CBME. When communicating recommendations for trainees, written summaries accompanied by discussion from a trusted source may be the most beneficial.5,27 Beginning performance conversations with self-assessments also allows trainees to reflect on their performance, thus facilitating corrective feedback to feel more acceptable and instructive.28
CONCLUSION
This scholarly perspective offers practical guidance for programs to integrate the principles of competency-based medical education into their clinical competency committees. By integrating these principles, program and CCC leaders can work to ensure trainees are fairly and equitably assessed on their path to independent practice.
Address for Correspondence: Andrew Golden, MD, Case Western Reserve University School of Medicine, Department of Emergency Medicine and Medical Education, 11100 Euclid Ave, Cleveland, OH 44106. Email: andrew.golden@uhhospitals.org
Conflicts of Interest: By the WestJEM article submission agreement, all authors are required to disclose all affiliations, funding sources and financial or management relationships that could be perceived as potential sources of bias. No author has professional or financial relationships with any companies that are relevant to this study. There are no conflicts of interest or sources of funding to declare.
1. Frank JR, Snell LS, Cate OT, et al. Competency-based medical education: theory to practice. Med Teach. 2010;32(8):638-645.
2. Van Melle E, Frank JR, Holmboe ES, et al. A core components framework for evaluating implementation of competency-based medical education programs. Acad Med. 2019;94(7):1002-1009.
3. Andolsek K, Padmore J, Hauer KE, et al. Clinical Competency Committees: A Guidebook for Programs, 3rd ed. Accreditation Council for Graduate Medical Education; 2020.
4. Kinnear B, Warm EJ, Hauer KE. Twelve tips to maximize the value of
a clinical competency committee in postgraduate medical education. Med Teach. 2018;40(11):1110-1115.
5. Hauer KE, Chesluk B, Iobst W, et al. Reviewing residents’ competence: a qualitative study of the role of clinical competency committees in performance assessment. Acad Med 2015;90(8):1084-1092.
6. Rowland K, Edberg D, Anderson L, et al. Features of effective clinical competency committees. J Grad Med Ed. 2023;15(4):463-468.
7. Lucey CR, Hauer KE, Boatright D, et al. Medical education’s Wicked problem: achieving equity in assessment for medical learners. Acad Med. 2020;95(12S Addressing harmful bias and eliminating discrimination in health professions learning environments):S98-S108.
8. Ekpenyong A, Padmore JS, Hauer KE. The purpose, structure, and process of clinical competency committees: guidance for members and program directors. J Grad Med Educ. 2021;13(2s):45-50.
9. Pack R, Lingard L, Watling C, et al. Beyond summative decision making: illuminating the broader roles of competence committees. Med Educ. 2020;54(6):517-527.
10. Emmerling T, Rooders D. 7 Strategies for better group decisionmaking. Accessed September 16, 2024. https://hbr.org/2020/09/7strategies-for-better-group-decision-making?autocomplete=true.
11. Duitsman ME, Fluit CRMG, van Alfen-van der Velden JAEM, et al. Design and evaluation of a clinical competency committee. Perspect Med Educ. 2019;8(1):1-8.
12. Cantor A. How nonprofits can keep strategy front and center. Harvard Bus Rev. Published online October 12, 2022. Accessed December 15, 2024. https://hbr.org/2022/10/how-nonprofits-can-keep-strategyfront-and-center
13. Anthony SD, Painchaud N, Parker A. Building consensus around difficult strategic decisions. Harvard Bus Rev. Published online October 27, 2023. Accessed September 16, 2024. https://hbr. org/2023/10/building-consensus-around-difficult-strategic-decisions
14. Heath JK, Davis JE, Dine CJ, et al. Faculty development for milestones and clinical competency committees. J Grad Med Ed 2021;13(2s):127-131.
15. Rich JV, Luhanga U, Fostaty Young S, et al. Operationalizing programmatic assessment: the CBME programmatic assessment practice guidelines. Acad Med. 2022;97(5):674-678.
16. Misra S, Iobst WF, Hauer KE, et al. The importance of competencybased programmatic assessment in graduate medical education. J Grad Med Educ. 2021;13(2 Suppl):113-119.
17. Konopasek L, Norcini J, Krupat E. Focusing on the formative: building an assessment system aimed at student growth and development. Acad Med. 2016;91(11):1492-1497.
18. Perry M, Linn A, Munzer BW, et al. Programmatic assessment in emergency medicine: implementation of best practices. J Grad Med Educ. 2018;10(1):84-90.
19. ten Cate O, Chen HC, Hoff RG, et al. Curriculum development for the workplace using entrustable professional activities (EPAs): AMEE Guide No. 99. Med Teach. 2015;37(11):983-1002.
20. ten Cate O. Competency-based education, entrustable professional activities, and the power of language. J Grad Med Educ. 2013;5(1):6-7.
21. ten Cate O. AM Last Page: What entrustable professional activities add to a competency-based curriculum. Acad Med. 2014;89(4):691.
22. ten Cate O, Schwartz A, Chen HC. Assessing trainees and making entrustment decisions: on the nature and use of entrustmentsupervision scales. Acad Med. 2020;95(11):1662-1669.
23. Caretta-Weyer HA, Sebok-Syer SS, Morris AM, et al. Better together: a multistakeholder approach to developing specialty-wide entrustable professional activities in emergency medicine. AEM Educ Train 2024;8(2):e10974.
24. Caretta-Weyer HA, Schnapp BH, Brown CA, et al. Implementing the 5 core components of competency-based medical education in US emergency medicine residency programs. J Grad Med Educ
2025;17(2 Suppl):57-63.
25. Kukulski P, Schwartz A, Hirshfield LE, et al. Racial bias on the emergency medicine Standardized Letter of Evaluation. J Grad Med Educ. 2022;14(5):542-548.
26. Spector AR, Railey KM. Reducing reliance on test scores reduces racial bias in neurology residency recruitment. J Natl Med Assoc 2019;111(5):471-474.
27. Knight R. Delivering an effective performance review. Harvard Bus Rev Published online November 3, 2011. Accessed September 16, 2024. https://hbr.org/2011/11/delivering-an-effective-perfor
28. Ramani S, Könings KD, Ginsburg S, et al. Twelve tips to promote a feedback culture with a growth mind-set: swinging the feedback pendulum from recipes to relationships. Med Teach 2019;41(6):625-631.
Beyond the Numbers: How Clinical Performance Metrics Impact Emergency Medicine Residents
Catherine Burger, MD*
Matthew Pirotte, MD†
Kaitlin Ray, MD†
Joseph Sikon, MD†
Kendra Parekh, MD, MHPE†
Section Editor: Abra Fant, MD
Duke University School of Medicine, Department of Emergency Medicine, Durham, North Carolina
Vanderbilt University Medical Center, Department of Emergency Medicine, Nashville, Tennessee
Submission history: Submitted September 1, 2025; Revision received February 12, 2026; Accepted December 3, 2025
Electronically published May 12, 2026
Full text available through open access at http://escholarship.org/uc/uciem_westjem DOI 10.5811/westjem.50814
Introduction: Emergency physicians commonly receive feedback in the form of performance metrics such as patients seen per hour. Reviewing metrics has been associated with increased stress and burnout. Although effects on efficiency have been examined, studies have not yet investigated the potential psychological and motivational impacts of providing performance metrics to residents during training. In this study we explore residents’ interest in receiving performance metrics during training and how receiving performance metrics might affect their 1) perceived pressure and motivation to change performance, 2) perspectives on the importance and actionability of metrics, 3) perceived readiness to receive metrics after graduation, and 4) possible effects on their postgraduate career plans.
Methods: Senior emergency medicine residents at a single, quaternary-care training center completed an anonymous pre-metric survey using a 5-point Likert scale of agreement (1 = strongly agree, 5 = strongly disagree) on the psychological and motivational impacts of receiving performance metrics. All senior residents, regardless of survey completions, were then given the option to view their personal performance metrics in comparison to deidentified metrics for the senior classes. Residents who viewed their metrics were offered the opportunity to complete the post-metric survey, which was identical to the pre-metric survey. Resident interest in viewing their metrics was recorded, and we compared survey responses using unpaired t-tests.
Results: All 26 residents (100%) chose to view their metrics, 25 (96%) completed the pre-metrics survey and 17 (73%) completed the post-metrics survey. After receiving performance metrics, residents reported feeling less pressure to change their performance (pre-metrics mean 2.32 [standard deviation 0.80]), post-metrics mean 3.05 [0.71], P < .01), and they reported feeling more prepared to receive metrics after graduation (pre-metrics mean 2.32 [0.95], post-metrics mean 1.68 [0.58], P = .01]. There was no significant change in residents’ responses to questions about metrics perceptions, motivation, or interest in administrative leadership after graduation.
Conclusion: This single-site, academic study indicated that senior residents are interested in seeing their personalized and deidentified group performance metrics and that viewing these metrics increases their sense of preparedness for graduation without necessarily affecting the pressure or motivation they felt during training. [West J Emerg Med. 2026;27(3)559–563.]
INTRODUCTION
Within the field of emergency medicine (EM), clinicians, patients, and administrators all value efficient and timely care
delivery.1-4 Some measures of care delivery include clinical productivity metrics, such as patients seen per hour and timeliness of documentation completion. To foster efficient
and timely care, hospital leadership groups often provide physicians with individual performance metrics as well as national or local group-comparison metrics.5,6 Some EM residency programs also provide their residents with clinical productivity metrics during training. The goals of providing these metrics to trainees may include improving resident efficiency as well as educational preparation for their postgraduate careers.
Multiple studies have shown that providing EM residents productivity metrics is unlikely to change their efficiency during training.7,8 Recent research in EM has also shown that productivity metrics can be heavily influenced by factors outside the individual clinician’s control and that receiving feedback perceived as unactionable is distressing and contributes to burnout.9-11 This is in contrast to studies showing increased resident satisfaction with feedback when metrics were included.8 Few studies have looked at the potential motivational and psychological impacts of providing productivity metrics during EM training.
In this study we sought to explore, among senior EM residents, 1) whether there is interest in viewing their performance metrics and 2) whether viewing personal and de-identified group productivity metrics influences a) perceived pressure to change performance, b) motivation to change performance, and c) perceived preparedness to receive metrics after graduation. Secondary objectives included exploration of how receiving these metrics might affect residents’ perceptions of the importance and actionability of performance metrics. This information could help guide EM educators on how to best use productivity metrics during resident training.
METHODS
This study, which was approved by the study site’s institutional review board, was conducted at a single quaternary-care teaching hospital with a three-year EM residency training program in the United States. In January 2025, all senior EM residents (postgraduate years 2 and 3) were invited to participate in two anonymous 6-question, online surveys via email using Research Electronic Data Capture (REDCap), hosted at Vanderbilt University Medical Center. The first survey was sent prior to residents viewing their performance metrics (pre-metrics survey), and the second was sent after they had the opportunity to view performance metrics (post-metrics survey). Both pre- and post-metric surveys were developed in accordance with survey design best practices.12 In the three years prior to this study, residents had not received any group or individual performance metrics. Participants had four days to complete the pre-metrics survey and were automatically sent reminders to complete the survey at 24, 48, and 72 hours after the initial survey invitation was sent.
The pre-metrics survey included two questions about the psychological impact of performance metrics, two questions
Population Health Research Capsule
What do we already know about this issue?
Emergency (EM) resident productivity does not significantly change when residents are given performance metrics.
What was the research question?
Do EM residents want to see their productivity metrics, and what motivational effects do these metrics have?
What was the major finding of the study?
Residents want to see their metrics, viewing decreased perceived pressure and increased perceived graduation preparedness.
How does this improve population health?
All 26 residents chose to see their metrics. Viewing decreased perceived pressure and increased perceived graduation preparedness.
about perspectives on performance metrics, one question about how prepared they felt to receive performance metrics after graduation, and one question about postgraduate career plans. Survey questions are listed in Table 1. The response scale was a 5-point Likert scale of agreement (1 = strongly agree, 5 = strongly disagree). After the initial 4-day survey period, the opportunity to view their productivity metrics was then offered to all senior residents, regardless of survey completion, with a clearly stated option to opt out of viewing their metrics. When offered the opportunity to view their metrics, residents were advised which metrics they would receive and that the metrics would not be included in their evaluations, regardless of their decision to view them or not. Residents were given one week to express their interest in viewing their metrics, and all who requested to view their metrics received an email with a copy of their metrics after the last day of the one-week request period.
The clinical productivity metrics available to residents included the average number of patients seen per hour and percentage of charts completed within 24 hours, both of which were averaged over the preceding three months. Residents also received de-identified metrics for the PGY-2 and PGY-3 classes. We obtained the number of patients seen, number of hours worked, and chart completion within 24 hours from the electronic health record (EHR) at the primary clinical teaching site. Data from other sites were not included due to the use of
Table 1. Pre- and post-metrics survey questions* in a study designed to gauge emergency medicine residents’ interest in viewing their productivity metrics.
Psychological impact
Receiving performance metrics makes me feel pressured to change my performance (Pressured)
Receiving performance metrics motivates me to change my performance (Motivates)
Perspective
Performance metrics are an important measure of my work (Important)
Performance metrics are an actionable form of feedback (I am able to change my results) (Actionable)
Prepared
I feel prepared to receive ED performance metrics after graduation (Prepared) Career plan
I am interested in exploring the operations and administration aspect of how an emergency department performs after graduation (Administrative leadership)
*Question labels are included in parentheses. ED, emergency department.
different EHR systems. If a resident chose to view their metrics, they were then asked to complete the post-metrics survey after viewing their metrics. The pre- and post-metric surveys were identical. Participants had four days to complete the post-metrics survey and were automatically sent reminders to complete the survey at 24, 48, and 72 hours after the initial post-metrics survey invitation was sent. We recorded resident interest in viewing their metrics and analyzed survey results using descriptive statistics and unpaired t-tests to compare responses on the pre- and post-metrics surveys. Statistical analyses were performed using Prism GraphPad (Siemens Industry Software, Inc, Plano, TX).
RESULTS
Of 26 residents, 25 (96%) completed the pre-metrics survey. All 26 residents (100%) requested to view their productivity metrics. Nineteen of 26 (73%) residents completed the post-metrics survey. The response options ranged from 1 (strongly agree) to 5 (strongly disagree). Preand post-metric responses can be found in Table 2. The mean (standard deviation) response for “receiving performance metrics makes me feel pressured to change my performance” was 2.32 (0.80) on the pre-metrics survey and 3.05 (0.71) on the post-metrics survey (P < .01). The mean response for “receiving performance metrics motivates me to change my performance” was 2.04 (0.68) on the pre-metrics survey and 2.11 (0.81) on the post-metrics survey (P = .77). The mean response for “performance metrics are an important measure of my work” was 1.88 (0.73) on the pre-metrics survey and 2.11 (0.81) on the post-metrics survey (P = .34). The mean response for “performance metrics are an actionable form of feedback (I am able to change my results)” was 1.96 (0.61) on the pre-metrics survey and 2.16 (0.60) on the post-metrics survey (P = .29). The mean response to “I feel prepared to receive emergency department performance metrics after
graduation” was 2.32 (0.95) on the pre-metrics survey and 1.68 (0.58) on the post-metrics survey (P = .01). The mean response for “I am interested in exploring the operations and administration aspect of how an emergency department performs after graduation” was 1.92 (0.91) on the pre-metrics survey and 2.11 (1.05) on the post-metrics survey (P = .53).
DISCUSSION
Given that all residents in this study chose to view their metrics, our results suggest that residents acknowledge they will possibly encounter performance metrics after graduation and are interested in viewing their data. This could also reflect a curiosity to see personalized, objective feedback, even if they see the feedback as imperfect. Sharing these metrics with trainees resulted in an increased report of feeling prepared to receive productivity metrics after graduation. We suspect that the increased sense of preparedness that residents reported was entirely due to having had the experience of receiving these metrics since no additional coaching or education surrounding performance metrics was delivered to the residents.
Interestingly, our results also showed that residents reported a statistically significant decrease in how pressured they felt to change their productivity metrics after receiving them. Given the limited information gained from the survey, the exact reason for this decreased perceived pressure is unclear but could have been affected by 1) residents being advised that these metrics would not be used for their evaluations or 2) absence of clearly defined metric expectations from the residency’s leadership (although group-comparison metrics were available). It is also possible that residents perceived less pressure after viewing their metrics secondary to reported metrics revealing better performance than they had expected or simply removing an element of the previously unknown. These results indicate that exposure to metrics during training, without being attached to
Table 2. Summary of pre- and post-metrics survey answers using a 5-point Likert scale in a study designed to gauge residents’ perspectives on viewing their productivity metrics.
formal evaluations, may give residents an increase sense of feeling prepared without necessarily adding to the performance pressure they feel during training.
Additionally, our results indicate that exposure to a single set of performance metrics resulted in no significant change in residents’ desire to go into administrative leadership after graduation. Our data also show that although viewing their metrics did not change residents’ perceptions of metrics as motivating, actionable, or important, it is interesting to note that on average residents in this small, single-center sample found metrics to be motivating, actionable and important, with all pre- and post-metrics survey averages above the neutral response of 3 (neither agree nor disagree). Since graduates are likely to encounter performance metrics after residency, training and exposure to metrics during residency may be a valuable aspect of residency curricula. In this study, simple exposure to metrics, without additional training or attached consequences, resulted in senior residents reporting that they felt more prepared for postgraduate work while simultaneously decreasing perceived pressure on them to change their performance.
LIMITATIONS
Limitations of this study include small sample size and being conducted in a single academic center. Additionally, only 73% of residents completed the post-metrics survey. This may have biased our results if those who chose to complete both surveys had different perceptions and motivations compared to those who chose to complete only the first survey. For example, it is possible that those who completed both surveys may have seen metrics as more valuable than those who only completed the first survey. The reasons for decreased completion from pre- to post-metrics survey may include survey fatigue or decreased resident interest in the study after their metrics had been delivered.
Future Directions for Research
It would be helpful if future studies were to investigate the
(1.05)
effect of attaching consequences to metric exposure, such as including them in formal evaluations. Additionally, comparing the performance and perceptions of graduates who received different types of metrics training during residency would be valuable. Lastly, further investigation of factors that motivate residents may uncover other ways to affect resident performance and better prepare them for graduation.
CONCLUSION
The results of this study are important to advance the conversation on the use of productivity metrics in training and demonstrate that providing productivity metrics to trainees may help them feel more prepared for their careers without necessarily increasing the pressure they feel to change their performance during training. Additionally, residents may see performance metrics as motivating, important, and actionable when not directly tied to their personal evaluations.
Address for Correspondence: Catherine Burger, MD, Duke University School of Medicine, Department of Emergency Medicine, 2301 Erwin Road, Durham, NC 27710. Email: Catherine.burger@duke.edu.
Conflicts of Interest: By the WestJEM article submission agreement, all authors are required to disclose all affiliations, funding sources and financial or management relationships that could be perceived as potential sources of bias. No author has professional or financial relationships with any companies that are relevant to this study. There are no conflicts of interest or sources of funding to declare.
1. Calvello EJ, Broccoli M, Risko N, et al. Emergency care and health systems: consensus-based recommendations and future research priorities. Acad Emerg Med. 2013;20(12):1278-88.
2. Casalino E, Choquet C, Bernard J, et al. Predictive variables of an emergency department quality and performance indicator: a 1-year prospective, observational, cohort study evaluating hospital and emergency census variables and emergency department time interval measurements. Emerg Med J. 2013;30(8):638-645.
3. Eitel DR, Rudkin SE, Malvehy MA, et al. Improving service quality by understanding emergency department flow: a White Paper and position statement prepared for the American Academy of Emergency Medicine. J Emerg Med. 2010;38(1):70-9.
4. Handel DA, French LK, Nichol J, et al. Associations between patient and emergency department operational characteristics and patient satisfaction scores in an adult population. Ann Emerg Med 2014;64(6):604-608.
5. Ivers N, Jamtvedt G, Flottorp S, et al. Audit and feedback: effects on professional practice and healthcare outcomes. Cochrane Database Syst Rev. 2012;2012(6):CD000259.
6. Jen MY, Han V, Bennett K, et al. Public performance metrics: driving physician motivation and performance. West J Emerg Med 2020;21(2):247-251.
7. Becker BA, Bleinberger AJ, Golden BJ, et al. Individualized
throughput metric reports for emergency medicine residents: Impact on time to disposition and resident perceptions. AEM Educ Train 2024;8(3):e11007.
8. Mamtani M, Shofer FS, Sackeim A, et al. Feedback with performance metric scorecards improves resident satisfaction but does not impact clinical performance. AEM Educ Train. 2019;3(4):323-330.
9. Diercks K, McDonald SA, Metzger JC, et al. A novel approach to measuring emergency physician efficiency. Acad Emerg Med 2025;32(8):926-928
10. Berg, S. To boost physician well-being, say goodbye to “metric madness.” AMA Health System Spotlight. March 2025. Available at: http://www.ama-assn.org/practice-management/physician-health/ boost-physician-well-being-say-goodbye-metric-madness? Accessed November 15, 2025.
11. Reiff JS, Zhang JC, Gallus J, et al. When peer comparison information harms physician well-being. Proc Natl Acad Sci U S A 2022;119(29):e2121730119.
12. Artino AR Jr, La Rochelle JS, Dezee KJ, et al. Developing questionnaires for educational research: AMEE Guide No. 87. Med Teach. 2014;36(6):463-474.
Perceptions of Health Effects of Electronic Cigarettes in Young Adults: Emergency Department Patients vs. Medical Students
Hope Smelser, BS* Cameron Heying, BS†
Lindsay Maguire, MD†‡
Section Editor: Sara Heinert,
MD
University of Kansas School of Medicine, Wichita, Kansas The University of Kansas Health System, Kansas City, Kansas University of Kansas School of Medicine, Kansas City, Kansas
Submission history: Submitted August 19, 2025; Revision received December 28, 2025; Accepted December 30, 2025
Electronically published April 8, 2026
Full text available through open access at http://escholarship.org/uc/uciem_westjem DOI 10.5811/westjem.50709
Introduction: As electronic cigarette (e-cigarette) use becomes more prevalent, understanding how populations perceive the harms associated with use is vital for tailoring public health interventions. Our aims in this study were to explore the perceptions of health risk associated with e-cigarettes among young patients in the emergency department (ED) who consume e-cigarettes as well as similarly aged medical students regardless of e-cigarette use and to determine medical students’ perception of their curriculum to prepare them for future counseling of patients on e-cigarette use.
Methods: A cross-sectional survey was completed by 276 participants: 90 ED patients 18-35 years of age who had ever used e-cigarettes (4.2% response rate) and 187 medical students from a U.S. allopathic medical school (17.7% response rate). Our primary outcomes were perceptions of health risks associated with e-cigarette use and medical student perceptions of the medical school curriculum. The secondary outcome was perceptions of e-cigarettes compared to tobacco cigarettes and perceptions of medical students’ readiness to counsel patients on e-cigarette use. Bivariate analyses using chi-square tests assessed differences between groups.
Results: We received 90 completed surveys from ED patients, and 187 from medical students. The majority of ED patients reported believing that e-cigarette use can lead to lung injury (77.8%), heart disease (30%), and cancer (82.2%). Medical students were more likely than ED patients to associate e-cigarette use with harm (lung injury, 94.7% vs 77.8%, P < .001; heart disease, 84.0% vs 70.0%, P = .007; and cancer 90.9% vs 82.2%, P = .037). A modest proportion of ED respondents stated that e-cigarette use did not carry risk of lung injury (22.2%), heart disease (30%), and cancer (17.2%). Most medical students (61.0%) believed that their medical school curriculum did not prepare them for future conversations with patients about e-cigarettes, and over half of the students (54.0%) expressed low confidence in counseling patients.
Conclusion: In our population, a significant proportion (20-30%) of ED patients did not perceive risk with e-cigarette use, suggesting room for education and intervention in this population. Medical education is likely associated with increased awareness of risk of e-cigarette use. Medical students generally did not feel prepared for the growing need to counsel patients on e-cigarette use, suggesting medical curricula could be adapted to meet this need. [West J Emerg Med. 2026;27(3)564–571.]
INTRODUCTION
Electronic cigarette (e-cigarette) use among all United States (US) adults is becoming more prevalent, ranging from 4.5-5.4% over 2016–2021.1,2 Among young adults (18-24
years of age), use has increased from 9.2% to 15.0% over the same period. Those from rural areas and those who have completed a General Education Development test or lower level of education have been reported to use e-cigarettes at
higher rates than their peers.2 It has been suggested that higher educational attainment is associated with decreased rates of e-cigarette use.3 These factors are often inter-related, as a high percentage of people from rural areas (42%) have a high school education or less.4
While data regarding the long-term health effects of e-cigarettes are scarce due to the relative recency of their popularity, e-cigarettes have been shown to pose unique harms with short-term use. E-cigarette-associated lung injuries are known to occur, including lung infections and popcorn lung.5 As of February 2020, the U.S. Centers for Disease Control and Prevention (CDC) reported that 2,807 individuals were hospitalized secondary to e-cigarette-associated lung injuries.6 Of those hospitalized, accompanying demographic data from the CDC reveals that 15% were < 18 years of age, 37% were 18-24, and 24% were 25-34 years of age. Additionally, e-cigarettes have been implicated in cases of lung cancer.7 Use of e-cigarettes has also been associated with increased odds of acute respiratory distress syndrome, coagulopathies, and myocardial infarction.8,9 Analysis of National Health Interview Survey data indicated that e-cigarette users were 79% more likely to experience a myocardial infarction as compared to non-users.10
While the scientific community accumulates data regarding the health effects of e-cigarette use, scientific literature assessing adults’ perceptions of these health effects is limited. Understanding these perceptions is crucial, as perceptions of health effects can be linked to behavior change and influence the development of community outreach and education efforts, including those targeting patients presenting to an emergency department (ED). Brief interventions in the ED have shown modest to moderate success across substances in inciting behavior change. A randomized trial by Bernstein et al found that a multicomponent ED-based intervention significantly improved quit rates among smokers with cooccurring substance use disorders.11 Another trial demonstrated that ED-based motivational interviewing reduced marijuana use among young adults 18-25 years of age and identified social media follow-up as a potential target for intervention.12 Similar brief interventions could be implemented in the ED to address e-cigarette use.
Perceptions of adverse health effects caused by e-cigarettes have been correlated with an individual’s likelihood to use e-cigarettes, but little research has been done to show what perceptions are commonly held by users. We had two major aims in this study. First, we sought to explore perceptions of the health effects of e-cigarette use held by young adults who presented to an ED, as well as similarly aged medical students. Data gathered from this investigation were intended to drive development of brief intervention materials for use in the ED. We aimed to recruit patients in the same age bracket as medical students to identify whether medical education may drive differing perceptions of e-cigarette use. Second, we aimed to determine medical
Population Health Research Capsule
What do we already know about this issue? Little is known about the perceived health risks of e-cigarette use, but data supports that those who are aware of health risks are less likely to partake.
What was the research question?
Do medical students and emergency department patients who use e-cigarettes perceive health effects of e-cigarettes similarly?
What was the major finding of the study? Compared to patients, medical students reported awareness of higher risk of lung injury (95% vs 78%, P < .001), heart disease (84% vs 70%, P = .007), and cancer (91% vs 82%, P = .04).
How does this improve population health?
Targeted education and improvements to medical school curricula could lead to enhanced counseling of e-cigarette users and increased rates of cessation.
students’ attitudes toward the quality of their undergraduate medical education curriculum and their comfort in counseling patients on e-cigarette use, to identify potential areas for improvement in medical education.
METHODS
Participants
Two populations were recruited to participate in this study. First, a convenience sample of patients 18-35 years of age who visited the ED at a major metropolitan academic hospital were recruited from April 5, 2024–December 31, 2024. Patients who reported present or past use of e-cigarettes and fluency in written English were included. No other specific exclusion criteria were used. For the student cohort, we recruited medical students from all four years of a single U.S. allopathic state medical school with three campuses across the state, regardless of e-cigarette use history.
Instruments
Study participants were surveyed about their basic demographics (age, race, education, sex, ethnicity); their history with and frequency of e-cigarette and cigarette use; and their knowledge and perceptions of and concern about e-cigaretterelated lung injury and cardiovascular health implications. Additionally, the medical student sample was asked to provide
their level of medical education, their confidence in counseling patients on the use and harms of nicotine products, and their perception of the adequacy of their medical school curricula in including e-cigarette-related topics.
Procedures
This study was approved by the local institutional review board. For the ED population, potential participants were identified by ED staff trained on study procedures after patients were brought to an examination room and given a flyer with a link to the survey materials. The survey was available between April–November 2024. For the student sample, a flyer describing the study with a link to the survey was sent to the email addresses of University of Kansas Medical Center medical students, requesting participation. The study flyer was distributed by email to all medical students once in the spring semester of the 2023-2024 academic year and once during the fall semester of the 2024-2025 academic year. Only one response per participant was permitted. Participants were eligible for a drawing to receive one of 10 $50 Visa gift cards through a raffle. All survey responses were gathered using Research Electronic Data Capture (REDCap) for data management (CTSA Award # UL1TR002366), hosted at University of Kansas Medical Center. 13,14
Statistical Analysis
We used Statistical Analysis System software v9.4 (SAS Institute Inc., Cary, NC) for data analysis. Qualitative variables were quoted as absolute numbers and relative frequencies. To test the association between potential perceived differences in harm caused by e-cigarettes and tobacco cigarettes and possible associations between education and perceptions of e-cigarette harm, we conducted the likelihood ratio chi-square and Fisher exact test using 2*2 and r*c contingency tables. To test the difference between the two groups, we used a Z-test, with null hypothesis being no difference. Bonferroni or false discovery rate approaches were applied to counteract the multiple comparisons problem. We used generalized linear models with appropriate link functions to test the association between outcome and predictor variables. All statistical tests comparing two groups were conducted using a two-tailed approach. Test results were deemed statistically significant if P ≤ .05. Predictor variables significant at the bivariate level were entered into the multivariable model.
Missing Data
One survey from the medical student group had missing data. This was assumed to be random and excluded after a complete-case analysis.
RESULTS
Demographics and Use History
Ninety surveys were returned from the ED patient
population. A total of 14,429 patients between the ages of 18-35 were seen in the ED during the survey dates. Data for vaping status for all patients was not available. Under the assumption that 15% of patients in this age range, or ~2,164 individuals, would be eligible for the study, the survey achieved a response rate of approximately 4.2% for the ED population.15 Of the 1,055 medical students who were administered the survey, 187 surveys were returned, with a response rate of 17.7%. Table 1 contains demographic information for ED patients and medical students.
Medical students were younger than the ED patients queried (Table 1). Post-hoc analysis of individual age groups revealed significant differences across all age groupings. Patients in the ED were more likely to identify as non-binary/ prefer not to answer (8.9%, n = 8 vs 4.0%, n = 11, P = .004). There was a significant difference in race distribution, with more Black respondents in the ED patient group (24.4%, n = 22 vs 8.7%, n = 24, P < .001), while White and Asian respondents were more represented in the medical student group (P = .002 for both, Table 1). The highest level of education was significantly different between the two populations. Of the 43% of medical students who reported e-cigarette use, most reported using e-cigarettes for six months or less, while most of the ED patients used e-cigarettes for one year or longer. Additionally, a larger proportion of ED patients than medical students identified frequent (daily) e-cigarette use (31.1% vs 11.9%, P < .001).
Aim 1: Perceptions of health effects among young ED patients who use e-cigarettes and comparing perceptions between ED patients and medical students
A moderate proportion of ED patients reported their belief that e-cigarettes were not capable of causing lung injury (22.2%), heart disease (30.0%), or cancer (17.8%) (Table 2). When evaluating perceived harm relative to cigarettes, ED respondents perceived e-cigarettes as similarly capable of causing harm with 41.1% saying e-cigarettes are equally as likely to cause lung injury, 56.7% saying e-cigarettes are equally as likely to cause heart disease, and 55.6% saying e-cigarettes are equally as likely to cause cancer.
Compared to all medical students, fewer ED patients perceived e-cigarettes as capable of causing lung injury, heart disease, and cancer. When compared to the subgroup of medical students who had tried e-cigarettes (n = 81), the difference in perception of lung injury persisted (77.8% vs 96.3%; P < .001), but there was no significant difference in perceptions of e-cigarettes’ ability to cause cancer (82.2% vs 84.0%; P = .63) and heart disease ((70.0% vs 79.0%, P = .18).
In evaluating perceived harm relative to cigarettes, ED patients were significantly more likely than all medical students to report e-cigarettes as more dangerous than cigarettes in terms of lung injury (35.6% vs 23.8%, P = .001), heart disease (22.2% vs 12.6%, P = .001), and cancer (15.6% vs 9.8%, P = .02) (Table 3). And when comparing to the
Table 1. Participant demographics, separated by surveyed group (patients vs. medical students), in a study of perceived health risks associated with e-cigarette use.
Ethnicity
ED, emergency department.
Percentage (Frequency)
E-cigarette use can cause lung injury All respondents ED patients Medical students P value Yes
No/not sure
E-cigarette
can cause heart disease
E-cigarette use can cause cancer
Yes
No/not sure
Missing
ED, emergency department.
(32)
portion of medical students with e-cigarette use history, still more ED patients perceived e-cigarettes as more capable than cigarettes of causing lung injury (35.6% vs 12.3%, P < .001), heart disease (22.2% vs 7.4%, P = .007), and cancer (15.6% vs 2.5%, P = .002).
Twelve of the 16 medical students (75%) who did not perceive e-cigarettes to be capable of causing cancer had tried e-cigarettes. Of the 169 medical students (90.4%) who believed e-cigarettes could increase risk of cancer, 68 (40%) had tried an e-cigarette before. The 173 students who perceived e-cigarettes as more likely than cigarettes to cause cancer were less likely to have tried e-cigarettes, as only 45.7% (P = .025) of them had ever used e-cigarettes; no significant associations were found between having tried an e-cigarette and perceptions of e-cigarettes compared to cigarettes’ ability to cause lung injury or heart disease.
Aim 2: Medical students’ views on curriculum and counseling confidence
More than half of students (54.0%) expressed low confidence in advising patients about the potential dangers of e-cigarette use, and 36.9% of students were not confident in counseling on nicotine product use in general. Sixty-one percent of medical students felt that the medical school curriculum did not adequately address e-cigarette topics. When broken down by phase in school (pre-clinical vs clinical), there was no significant difference in confidence with counseling; however, there was a significant difference in perception of the curriculum with a larger proportion of clinical students (77.1%) finding the curriculum inadequate compared to the pre-clinical students (57.2%, P = .001). When comparing students who had tried an e-cigarette to those who had not, there was no significant difference in counseling confidence or opinion of the medical school curriculum.
DISCUSSION
Aim 1: Perceptions of health effects among young ED patients who used e-cigarettes compared to medical students and implications for development of brief intervention
A significant proportion of ED patients reported that e-cigarettes would not cause lung injury (22%), heart disease (30%), or cancer (18%). Emergency department patients in this cohort also perceived e-cigarettes as equally or less harmful than traditional cigarettes. Other research has demonstrated that adolescents and younger adults hold perceptions that e-cigarettes tend to have less associated health risk and less addictive potential as compared to traditional cigarettes, increasing the prevalence of initiation, adherence, and future use.16-18 Additionally, multiple studies reported similar proportions of younger adults perceiving e-cigarettes as less harmful than and equally as harmful as cigarettes.19, 20
Previous data have indicated that awareness of potential health effects leads to reduced use.21 While long-term health effects data are limited, reports have demonstrated that an increased risk of developing adverse health conditions exists with e-cigarette use. Thus, knowledge gaps about potential health risks have become the key barrier to reducing e-cigarette use, illustrating the importance of accessible information to educate e-cigarette users or at-risk populations.
Our data suggest that medical education may increase awareness of health risks associated with e-cigarettes, with medical students being more likely to perceive risk from their use, although both cohorts perceived e-cigarettes as less harmful than tobacco cigarettes. This finding is consistent with prior research, such as a study conducted at the University of Arkansas for Medical Sciences, where a significant portion of students in health degree programs also believed e-cigarettes were less harmful than cigarettes.26 This perception may reflect broader public narratives that frame e-cigarettes as a “safe” alternative, even though emerging evidence points to
Table 2. Perceptions of health effects from e-cigarette use among young adult emergency department patients and medical students in a study of perceptions of the health risk of e-cigarette use.
Table 3. Perceptions of health risks associated with e-cigarette vs. traditional cigarette use in a study of health risk perceptions associated with e-cigarette use among young adult emergency department patients and medical students.
Percentage (Frequency)
E-cigarettes’ health effects vs cigarettes All respondents ED patients All medical students P value
E-cigarettes
E-cigarettes are more harmful than cigarettes
Likelihood to cause lung injury
E-cigarettes are more likely than cigarettes
Likelihood to cause heart disease
E-cigarettes are more likely than cigarettes
E-cigarettes are about the same as cigarettes
are less likely than cigarettes
Likelihood to cause cancer
(60)
(66)
(81)
(35)
(139)
(30)
(32)
(20)
(51)
(15) .001
(88) .13
E-cigarettes are more likely than cigarettes 9.8% (27) 15.6% (14) 7.0% (13) .02
E-cigarettes are about the same as cigarettes
E-cigarettes are less likely than cigarettes
ED, emergency department.
serious health risks.
In our cohort, medical students who recognized the potential harms of e-cigarettes were significantly less likely to have ever tried them. This supports the idea that greater awareness of the health risks is associated with lower usage rates, reinforcing the idea that improving public knowledge could be a powerful tool in curbing e-cigarette use. Emergency department patients who attained a lower level of education reported lower awareness of the potential health risks of e-cigarettes. Whether this is specifically secondary to education level is unclear, but it supports previous research that those with lower education levels are more likely to use e-cigarettes.2 Targeted education campaigns, as well as ED-based initiatives aimed at increasing knowledge about both the immediate and long-term risks of e-cigarette use, could help shift perceptions and ultimately reduce use.
Data gathered in this study may help influence the development of targeted brief interventions for ED patients who use e-cigarettes. Multiple studies have shown that ED interventions are successful in identifying and curbing substance use rates for traditional cigarettes, marijuana, and alcohol. For example structured screening tools, such as SBIRT (screening, brief intervention, and referral), have been successful in effectively detecting high-risk substance use while simultaneously reducing risky behaviors and motivating treatment engagement.22 Regarding e-cigarette use, consensusbased clinical guidance for e-cigarette cessation has been established.23 Incorporating these recommendations, as well as validated screening tools, allows the ED to offer a solution to initiate e-cigarette cessation efforts effectively.
(117)
(133)
(50) 35.8% (67) .002
(26)
(107) < .001
Previously established programs, such as the UKanQuit program at the University of Kansas Medical Center, provide tobacco cessation services to hospitalized patients, offering bedside counseling, nicotine replacement, and medication management.24 A 2010 observational study evaluating the program reported that 31.8% of participants achieved 7-day point prevalence abstinence at 6-month follow-up, decreased the average number of cigarettes smoked per day significantly from 17.8 to 14.0, and revealed that 70% of participants made at least one quit attempt lasting 24 hours or more postdischarge.25 This study group aims to use the data generated in this study to develop and implement an ED-based brief intervention, adhering to similar services offered by the UKanQuit program. The intervention will target the surveyed health effects to educate e-cigarette users presenting in the ED, as their perceptions of harm from e-cigarette use are limited.
Aim
2: Medical students’ views on curriculum and counseling confidence
Our findings suggest that medical students are generally aware of the potential health effects associated with e-cigarette use, with an average of 90% of students reporting e-cigarettes as capable of causing the surveyed health effects; however, their confidence in advising patients about possible health risks was low. This gap may lie in the medical school curriculum, as many students felt their education did not sufficiently address e-cigarette use and potential hazards. Currently, the students have a total of four hours within the preclinical curriculum dedicated to e-cigarette related topics. Despite growing recognition of the potential for harmful
Table 4. Perceptions of medical students toward medical school curriculum and preparedness to counsel patients on nicotine and e-cigarette use.
(Frequency)
Believe medical school curriculum inadequately covers e-cigarette topics 61.0% (114)
Not confident counseling on nicotine use 36.9% (69)
Not confident counseling on e-cigarette use
(101)
effects of e-cigarettes within the scientific community, medical education on the topic remains limited. In a pilot survey of 259 medical students, 68.7% rated their e-cigarette-related medical education as “inadequate,” and 76.1% reported that their curriculum had no impact on their views or behaviors around e-cigarette use.27 Similarly, in a needs analysis of 31 healthcare professionals, non-experts and experts alike reportedly felt they required additional training in clinical skills for addressing patient e-cigarette use.28 Echoing Ruppel et al’s observation that e-cigarette education is largely insufficient, our study likewise found the current curriculum to be inadequate. Given these findings, medical education should adapt so that professionals can address the growing public health concerns surrounding e-cigarette use.
Integrating more detailed and up-to-date information on the potential health risks of e-cigarette use into the curriculum could significantly improve students’ confidence in counseling patients and, ultimately, contribute to better patient education and outcomes. In addition, the curriculum should aim to teach students how to counsel patients when limited data are available. Future physicians must be equipped with the knowledge and skills to provide practical guidance, especially as e-cigarette use rises. Addressing these educational gaps will better prepare future physicians to take an active role in preventing e-cigarette-related illnesses and advocating for public health.
LIMITATIONS
Key limitations to this study are the sample size and the populations surveyed. Because the ED patient sample was small, analyses were limited. Limited response rates may be attributable to challenges in implementation and inconsistent incorporation of the protocol into usual workflows. In the same fashion, sicker patients may have been missed due to emergent prioritization. Due to the small sample of ED patients, the data may not represent a greater population and should be viewed as exploratory. Results from this cohort may not be similar across similar aged cohorts in other parts of the U.S.; therefore, we suggest a larger effort to explore health risk perceptions to determine optimal areas for intervention. In
addition, the response rate was calculated based on an estimate of patients who may have been eligible for the study, as the number of patients approached to participate is not available. This may introduce non-response bias into the sample, which we are unable to account for.
Emergency departments tend to have a patient population that is less educated and has a lower overall socioeconomic status, which may or may not be representative of the general e-cigarette user. However, these patients are a population for which targeted education may improve health outcomes. Along with the disparities of racial and ethnic diversity in medical school education, the likelihood of lower socioeconomic status among the ED patient sample leads to decreased generalizability. In addition, patients were recruited from a single ED in a major metropolitan area, and medical students were recruited from a single medical school. There were also racial and age differences between medical students and ED patients, which were not further investigated within the parameters of this study.
This study did not directly assess whether participants were current users or, if they had quit using e-cigarettes, why they stopped. Understanding what led to cessation and potential changes in perceptions of e-cigarettes during an individual’s time using them could be influential in education initiatives. Finally, survey methodology creates the potential for recall bias and possible under/over-reporting of use.
CONCLUSION
This study explores perceptions of e-cigarette use in young ED patients and underscores differences in perceptions and usage between medical students and ED patients. A modest portion of ED patients did not perceive e-cigarettes as capable of causing adverse health outcomes and reported that e-cigarettes could be a safe alternative to cigarettes, whereas medical students perceived greater potential harm from e-cigarette use. Understanding the demographic and educational factors driving these disparities can guide the development of targeted policies and interventions moving forward. Most of the medical students who completed the survey reported low confidence in counseling patients about e-cigarette use, indicating that current medical curricula inadequately address the hazards of smoking e-cigarettes. While limitations of sample size and demographic difference may limit generalizability of these findings, these insights may nevertheless help inform the design of an ED-based brief intervention aimed at promoting e-cigarette cessation as well as improvements in medical education regarding health risks associated with e-cigarette use.
Address for Correspondence: Lindsay Maguire, MD, University of Kansas Medical Center, 4000 Cambridge Street Mailstop 1019, Kansas City, KS 66160. Email: lmaguire@kumc.edu.
Smelser et al. Health Effects of E-Cigarettes in ED patients and Medical Students
Conflicts of Interest: By the WestJEM article submission agreement, all authors are required to disclose all affiliations, funding sources and financial or management relationships that could be perceived as potential sources of bias. No author has professional or financial relationships with any companies that are relevant to this study. There are no conflicts of interest or sources of funding to declare.
1. Obisesan OH, Osei AD, Uddin SMI, et al. Trends in e-cigarette use in adults in the United States, 2016–2018. JAMA Intern Med. 2020;180(10):1394.
2. Cornelius ME. Tobacco product use among adults—United States, 2019. Morb Mortal Wkly Rep. 2020;69(46).
3. Assari S, Mistry R, Bazargan M. Race, educational attainment, and e-cigarette use. J Med Res Innov. 2019;4(1):e000185.
4. National Center for Education Statistics. Educational Attainment in Rural Areas. 2023. Available at: https://nces.ed.gov/programs/coe/indicator/ lbc/educational-attainment-rural?tid=1000. Accessed April 20, 2025.
5. Cao DJ, Aldy K, Hsu S, et al. Review of health consequences of electronic cigarettes and the outbreak of electronic cigarette, or vaping, product use-associated lung injury. J Med Toxicol. 2020;16(3):295-310.
6. U.S. Centers for Disease Control and Prevention. Smoking and tobacco use: electronic cigarettes. 2021. Available at: https://www.cdc.gov/ tobacco/basic_information/e-cigarettes/severe-lung-disease.html#cdcrecommends. Accessed April 20, 2025.
7. Sapru S, Vardhan M, Li Q, et al. E-cigarette use in the United States: reasons for use, perceptions, and effects on health. BMC Public Health. 2020;20(1).
8. Kalantary A, Abdelazeem B, Shams N, et al. Coagulopathy and acute respiratory distress syndrome: dual complications of e-cigaretteassociated lung injury. Cureus. 2021;13(2):e13531.
9. Vindhyal MR, Okut H, Ablah E, et al. Cardiovascular outcomes associated with adult electronic cigarette use. Cureus. 2020;12(8):e9618.
10. Alzahrani T, Pena I, Temesgen N, et al. Association between electronic cigarette use and myocardial infarction. Am J Prev Med. 2018;55(4):455-61.
11. Bernstein SL, Bijur P, Cooperman N, et al. Efficacy of an emergency department–based multicomponent intervention for smokers with substance use disorders. J Subst Abuse Treat. 2013;44(1):139-42.
12. Bonar EE, Goldstick JE, Tan CY, et al. A remote brief intervention plus social media messaging for cannabis use among emerging adults: a pilot randomized controlled trial in emergency department patients. Addict Behav. 2023;147:107829.
13. Harris PA, Taylor R, Thielke R, et al. Research electronic data
capture (REDCap)—a metadata-driven methodology and workflow process for providing translational research informatics support. J Biomed Inform. 2009;42(2):377-81.
14. Harris PA, Taylor R, Minor BL, et al. The REDCap consortium: building an international community of software platform partners. J Biomed Inform. 2019;95:103208.
15. Phillips AW, Friedman BT, Durning SJ. How to calculate a survey response rate: best practices. Acad Med. 2017;92(2):269.
16. Li W, Osibogun O, Gautam P, et al. Effect of harm perception on ENDS initiation among US adolescents and young adults: longitudinal findings from the PATH study, 2013–2018. Drug Alcohol Depend. 2023;244:109784.
17. Cooper M, Loukas A, Harrell MB, et al. College students’ perceptions of risk and addictiveness of e-cigarettes and cigarettes. J Am Coll Health. 2017;65(2):103-11.
18. Elton-Marshall T, Driezen P, Fong GT, et al. Adult perceptions of the relative harm of tobacco products and subsequent tobacco product use: longitudinal findings from waves 1 and 2 of the PATH study. Addict Behav. 2020;106:106337.
19. Huang J, Feng B, Weaver SR, et al. Changing perceptions of harm of e-cigarette vs cigarette use among adults in two US national surveys from 2012 to 2017. JAMA Netw Open. 2019;2(3):e191047.
20. Bandi P, Asare S, Majmundar A, et al. Relative harm perceptions of e-cigarettes versus cigarettes, US adults, 2018–2020. Am J Prev Med. 2022;63(2):186-94.
21. Kreslake JM, Diaz MC, Shinaba M, et al. Youth and young adult risk perceptions and behaviours in response to an outbreak of e-cigarette or vaping–associated lung injury in the USA. Tob Control. 2022;31:88-97.
22. Hawk K, D’Onofrio G. Emergency department screening and interventions for substance use disorders. Addict Sci Clin Pract. 2018;13(1):18.
23. Zawertailo L, Kouzoukas E, Fougere C, et al. Clinical guidance for e-cigarette (vaping) cessation: results from a modified Delphi panel approach. Prev Med Rep. 2023;35:102372.
24. UKanQuit. A Tobacco-Cessation Program for Our Patients. 2025. Available at: https://www.kumc.edu/school-of-medicine/academics/ departments/population-health/research/tobacco-control/ukanquit. html. Accessed April 20, 2025.
25. Faseru B, Turner M, Casey G, et al. Evaluation of a hospital-based tobacco treatment service: outcomes and lessons learned. J Hosp Med. 2011;6(4):211-8.
26. Franks AM, Hawes WA, McCain KR, et al. Electronic cigarette use, knowledge, and perceptions among health professional students. Curr Pharm Teach Learn. 2017;9(6):1003-9.
27. Ruppel T, Alexander B, Mayrovitz HN. Assessing vaping views, usage, and vaping-related education among medical students: a pilot study. Cureus. 2021;13(2):e13614.
28. Metcalf M, Rossie K, Stokes K, et al. Healthcare professionals’ clinical skills to address vaping or e-cigarette use by patients: needs and interest questionnaire study. JMIR Form Res. 2022;6(4):e32242.
Emergency Department Boarding for Psychiatric Hospitalization in Older Adults: Placement Challenges and Associated Risks
Victoria P. Schulte, MD*
Cristina Guasch, BA†
Angela Landerholm, MD‡
Danilo Rojas-Velasquez, MD*
Section Editor: Muhammad Waseem, MD
Harvard Medical School, Beth Israel Deaconess Medical Center, Department of Psychiatry, Boston, Massachusetts
Boston College, Boston, Massachusetts
Beth Israel Deaconess Plymouth Hospital, Department of Psychiatry, Plymouth, Massachusetts
Submission history: Submitted December 18, 2025; Revision received January 15, 2026; Accepted January 8, 2026
Electronically published May 13, 2026
Full text available through open access at http://escholarship.org/uc/uciem_westjem DOI 10.5811/westjem.61704
Introduction: Older adults are increasingly presenting to emergency departments (ED) with psychiatric emergencies amid limited inpatient psychiatric capacity, resulting in prolonged ED boarding. Our primary objective was to quantify ED boarding duration for older adults awaiting psychiatric hospitalization in community EDs. We examined whether longer boarding was associated with functional decline and physical restraint.
Methods: We conducted a retrospective cohort study of ED encounters among adults ≥ 65 years of age who received a behavioral health evaluation by emergency services program (ESP) clinicians (non-prescriptive behavioral health professionals) who determined psychiatric level of care in two community EDs. The study period was from January 2023–June 2024. The primary outcome was boarding duration. We measured boarding duration from initiation of a psychiatric bed search to ED departure or psychiatric clearance. Secondary outcomes were functional decline (new loss of physical function that impaired activities of daily living, identified from serial nursing documentation during the ED stay) and physical restraint episodes.
Results: Of 334 behavioral health encounters (mean age 76 years ± 7.4 years), 180/334 (53.9%) boarded ≥ 24 hours. The median boarding duration for psychiatric hospitalization was 44 hours (interquartile range 24-70). Functional decline occurred in 42/334 (12.6%) and restraint episodes in 27/334 (8.1%), with both events occurring only among encounters boarding ≥ 24 hours. Patients with neurocognitive disorders (157/334, 47.0%) had higher rates of functional decline (difference 17.1%, 95% CI, 7.3-26.4; P < .001) and restraint episodes (difference 11.2%, 3.0-19.1; P < .001) compared to patients without neurocognitive disorders.
Conclusion: In this community ED cohort, older adults awaiting psychiatric hospitalization frequently experienced prolonged boarding, associated with higher rates of functional decline and physical restraint. Limitations include the retrospective design and reliance on nursing documentation to identify functional decline, with wide confidence intervals due to small event counts, limiting causal inference. [West J Emerg Med. 2026;27(3)572–578.]
INTRODUCTION
The emergency department (ED) is often the first point of contact for patients experiencing a psychiatric emergency.
Psychiatric presentations account for 4-10% of ED visits, are more time-intensive, and more likely to result in hospital admission than non-psychiatric visits.1, 2 While psychiatric
emergency visits have been increasing, the number of inpatient psychiatric beds has been declining,3 resulting in a limited resource that has become high in demand. As a result, many patients who require inpatient psychiatric care experience extended periods of ED boarding, a practice associated with adverse events (medication errors, increased morbidity/ mortality), longer length of stay, and ED crowding.4, 5
Older adults are particularly vulnerable in this context because of the complexity of geriatric psychiatry emergencies and the limited number of specialized geriatric psychiatry units.6-8 Limited bed capacity is compounded by shortages of psychiatry clinicians, particularly in community settings. More than half of U.S. counties have no practicing psychiatrist, and over 100 million people live in federally designated mental health professional shortage areas, with disproportionately limited access in rural regions.9 In a national survey of ED directors by the American College of Emergency Physicians, 62% reported lacking dedicated psychiatric services for boarding patients.10 With these shortages, boarding becomes common, and older adults are more susceptible to the adverse effects of boarding as they have high risk of falls, delirium, and medication side effects (orthostasis, extrapyramidal symptoms) in the ED setting.11-12
Existing work has described the frequency and duration of ED boarding among adults with psychiatric illness,13, 14 and identified predictors of prolonged length of stay and adverse events in behavioral health-related ED visits.15, 16 Although ED psychiatric boarding is recognized, less is known about its frequency and consequences among older adults. In addition, few studies have examined geriatric-relevant outcomes such as functional decline and restraint use, particularly in community EDs that have less access to specialized psychiatry services. To address this gap, we conducted a retrospective cohort study of older adults undergoing behavioral health evaluation in two Massachusetts community EDs within the same healthcare system. Our objectives were to 1) quantify ED boarding duration for older adults awaiting psychiatric hospitalization and 2) evaluate associations between boarding duration and functional decline and restraint episodes. We hypothesized that the majority of older adults would experience prolonged boarding (≥ 24 hours) and that longer boarding would be associated with functional decline and physical restraint.
METHODS
Study Design and Setting
We performed a retrospective cohort study of ED encounters for adults ≥ 65 years of age who received a behavioral health evaluation at two community hospitals between January 1, 2023–June 30, 2024. The hospitals belong to the same integrated health system, share a single electronic health record (EHR), and share many of the same emergency clinician staff.
Hospital A is a 60-bed community hospital with
Population Health Research Capsule
What do we already know about this issue? Emergency department (ED) psychiatric boarding is common and associated with adverse events.
What was the research question?
What is the duration of psychiatric boarding in older adults, and is boarding associated with decline or physical restraint?
What was the major finding of the study?
Median ED boarding time was 44 hours (IQR 24-70), with 53.9% of encounters boarding ≥ 24 hours.
How does this improve population health?
Identifying prolonged boarding as a driver of geriatric harm supports targeted ED interventions to improve care of older adults with psychiatric emergencies.
approximately 24,000 annual ED visits. Hospital B is a 190-bed community hospital with approximately 44,000 annual ED visits and an on-site geriatric psychiatry unit (24 licensed beds, 10-12 typically staffed during the study period). Elsewhere in the system, a separate facility maintained a 15-bed geriatric psychiatry unit. Both EDs had weekday daytime consultation-liaison (C-L) psychiatry coverage from 8 am-5 pm. Weekend coverage consisted of telepsychiatry by a psychiatric nurse practitioner (8 am-12 pm) for new consults only. Although Hospital B has a geriatric psychiatry unit, this unit serves all hospitals within the integrated system. The psychiatrists and social workers on the geriatric psychiatry unit do not evaluate ED patients and are not part of the ED psychiatry consult team at either site. Accordingly, the availability of ED psychiatry consultation was comparable across the two hospitals; any potential site-level differences may relate to inpatient bed availability and disposition logistics rather than differences in ED consult staffing.
The Figure illustrates the typical workflow for ED patients receiving a behavioral health evaluation. For psychiatric emergencies, the first point of contact was an emergency services program (ESP) clinician, who performed the initial behavioral health evaluation within 60 minutes of an emergency clinician’s consult request. In this system, ESP evaluation is the required initial behavioral health assessment
1. ED Behavioral Health Evaluation Workflow. ED, emergency department; hr, hour.
requested by emergency physicians for patients with psychiatric symptoms after initial medical screening. The ESP clinician determines psychiatric level of care and initiates the psychiatric bed search when indicated. The C-L psychiatry consultation is separate and is requested at the ED team’s discretion and clinical judgment. Reasons for consulting can include diagnostic clarification (e.g., delirium vs primary psychiatric disorder), complex medication management, or decision-making capacity questions. The C-L psychiatry consultation is not required for ESP evaluation and was available for both boarding and non-boarding patients. The C-L psychiatrists at both sites are part of the same psychiatry department within the larger healthcare system and, thus, have similar geriatric assessment protocols.
Bed searches for ED boarders were coordinated via the Massachusetts Behavioral Health Access registry, which is updated daily. The ESP staff listed boarding patients, particularly those with public insurance, and collaborated with the state Medicaid program to address lapses in coverage when present. Bed searches encompassed both health-system facilities and external hospitals. The ESP clinicians reassessed boarders daily to confirm continued need for admission and to consider alternate disposition options.
The institutional review board (IRB) approved this study as exempt because data were retrospective, de-identified, and posed minimal risk. All data were abstracted from the shared
EHR using uniform documentation standards. We designed and reported the chart review in line with recommended safeguards for medical record review in emergency medicine,17 including pre-specified case selection and variable/ outcome definitions, use of standardized abstraction forms with abstractor training/pilot testing, performance monitoring via dual abstraction, identification of the medical record source, description of the sampling frame, pre-specified handling of missing/conflicting data, and documentation of IRB status. Because abstractors were study investigators, blinding to study objectives was not feasible; interobserver agreement was addressed through dual abstraction and consensus but not quantified with a kappa statistic given the small calibration sample and low event counts. The study adheres to Strengthening the Reporting of Observational Studies in Epidemiology guidelines.18
Variable Definitions
We pre-specified all variables and outcome measures before data collection. We first described ED boarding duration and the prevalence of prolonged boarding, defined as a patient remaining in the ED for > 24 hours after the initial behavioral health evaluation determined the need for psychiatric hospitalization. Boarding time was measured from the time the initial behavioral health evaluation was signed (which in this system is required for the psychiatric bed search
Figure
Table 1. Sociodemographic and clinical characteristics of elderly patients awaiting psychiatric hospitalization in a study of the effects of prolonged boarding in the emergency department.
Variable Mean (SD) or n (%)
Age, mean (SD), years
65-74
75-84
Table 1. Continued.
Diagnosis
Neurocognitive disorder
MND, NOS
Alzheimer dementia
Vascular dementia
(34.1%)
(19.8%)
≥ 85 76.1 (7.4) 154 (46.1%)
Female, n (%) 164 (49.1%)
Race/Ethnicity, n (%)
White non-Hispanic
Black non-Hispanic
Hispanic/Latino
Asian
Other/unknown 289 (86.5%)
Patient origin, n (%)
Private residence
Living alone
Assisted living
Skilled nursing facility
Memory care unit
Short-term rehab
Group home
Insurance, n (%) Medicare
Mode of ED Arrival
Arrival Time
Day (0700 – 1459)
Evening (1500 – 2259)
Night (2300 – 0659)
(3.6%)
197 (59.0%)
Parkinson disease
Lewy body dementia
Primary psychiatric disorder
Major depressive disorder
Bipolar disorder
Schizophrenia/schizoaffective
Anxiety disorder
Personality disorder
Other
Substance use disorder
Patients on home psychiatric medications
Antidepressants
Antipsychotics
Benzodiazepines
Other
Reason for behavioral health evaluation
Agitation/behavioral disturbance
Mood symptoms
Psychosis
Suicidal ideation or attempt
Disposition
Psychiatric hospital
Medical admission
Private residence
Assisted living
Skilled nursing facility
Memory care unit
Short-term rehab
Group home
(5.1%)
(12.0%)
(4.2%)
(1.0%) 3 (1.0%)
ED, emergency department; EMS, emergency medical services; MND, NOS, major neurocognitive disorder, not otherwise specified; SD, standard deviation.
to begin) to the time the ED discharge order was placed or when the patient was deemed to be psychiatrically cleared and no longer requiring inpatient psychiatric treatment.
Secondary outcomes included physical restraint episodes and functional decline. A restraint episode was defined as any documented use of physical restraints during the ED encounter. We focused on physical restraints because sedating medication (“chemical restraint”) could not be reliably classified from the medical record as restraint vs treatment, and pro re nata sedation documentation was inconsistent. Because standardized functional scales (eg, modified
Rankin Scale, Barthel Index) are not routinely collected as part of ED or behavioral health evaluations at these sites, we could not calculate numeric change scores for baseline vs 24-hour function. Instead, functional decline was operationalized as a new loss of physical function, documented by nursing staff during the ED stay, that impaired the patient’s ability to perform one or more basic activities of daily living (ADL) or instrumental ADLs. This included new or increased need for hands-on assistance with ambulation, transfers, toileting, or feeding. Abstractors reviewed serial nursing notes and flowsheets across the entire ED stay and
ED Boarding for Psychiatric Hospitalization in Older Adults
coded functional decline as present only when a change from the patient’s prior status (either during that same ED visit or, when explicitly documented, their usual function at home or in a facility) was clearly described. If nursing documentation did not explicitly describe a change, functional decline was coded as absent, meaning that the patient was considered as having no functional decline present.
Potential confounders/covariates included age, sex (categorized as male, female, or other), and diagnostic category (neurocognitive disorder, primary psychiatric disorder, or substance use disorder). Diagnosis was based on the initial behavioral health evaluation, which is required to list a primary diagnosis and reason for presentation; primary psychiatric disorders included conditions such as schizophrenia, bipolar disorder, major depressive disorder, and other non-neurocognitive diagnoses. We did not perform a formal sample size calculation; to maximize power, we included all encounters for patients ≥ 65 years of age who received a behavioral health evaluation in the ED during the study period.
Statistical Analysis
Patient characteristics were summarized as mean (SD) or median (IQR) for continuous variables and n (%) for categorical variables. Group comparisons used χ² (or the Fisher exact test when sparse) and t-test or Wilcoxon ranksum, as appropriate. For binary outcomes (prolonged boarding, functional decline, restraint), we report absolute risk differences (percentage-point differences) with 95% confidence intervals. Because functional decline and restraint events were sparse and included zero cells in some comparisons, we used the Fisher exact test for P values and calculated CIs for risk differences using the Newcombe method (Wilson score intervals). Two-sided α = 0.05. Wide CIs reflect sparse outcomes and zero cells in some comparisons rather than collinearity among covariates.
RESULTS
There were 334 ED behavioral health evaluations for
Study Population
Current study Patients ≥ 65 years boarding for psychiatric admission
Simpson et al 2014 Patients ≥ 18 years boarding in psychiatric emergency room for psychiatric admission
Rhodes et al 2016 Patients ≥ 65 years with primary psychiatric chief complaint
Lai et al 2018 Patients age 60-89 years who received psychiatry consult in ED
Joseph et al 2024 Patients ≥ 65 years who were admitted to general medical services
patients ≥ 65 years of age (mean age 76.1). Overall, 180/334 (53.9%) boarded ≥ 24 hours. Among the 189 encounters ultimately discharged to psychiatric hospitalization, the median boarding duration was 44 hours (IQR 24-70). Boarding duration did not differ significantly by primary diagnostic category, and age was not associated with boarding time in bivariate analyses.
Among encounters boarding ≥ 24 hours, functional decline occurred in 42/180 (23.3%) compared with 0/154 (0%) among encounters boarding < 24 hours (difference 23.3%, 95% CI, 15.3-30.9; P < .001). Physical restraint episodes occurred in 27/180 (15.0%) compared with 0/154 (0%) episodes among encounters boarding < 24 hours (difference 15%, 8.1-20.9; P < .001). Encounters with neurocognitive disorders had higher rates of functional decline (34/157 [21.7%]) than encounters without neurocognitive disorders (8/177 [4.5%]; difference 17.1%, 95% CI, 7.3-26.4; P < .001). Encounters with neurocognitive disorders also had higher rates of restraint episodes (22/157 [14.0%] vs 5/177 [2.8%]; difference 11.2%, 95% CI, 3.0-19.1; P < .001).
DISCUSSION
In this two-site community ED cohort, more than half of encounters awaiting psychiatric hospitalization remained in the ED for > 24 hours with a median boarding duration of 44 hours (IQR 24-70). This shows that geriatric psychiatry boarders in community EDs often spend multiple days in an environment not designed for ongoing inpatient-level care. Our boarding durations appear longer than those reported in prior ED studies (Table 2), which have typically found median or mean stays in the 16-27 hour range for psychiatric presentations, and substantially longer than the three hours of boarding reported for older adults admitted to general medical services.4,15,19
Functional Decline and Restraint as Geriatric Safety Outcomes
The rates of functional decline are notable given that detection relied on routine nursing documentation rather than
Boarding time, hours
Median ED boarding time 44.6 hours (IQR 24-70)
Median ED boarding time 27.2 hours (0.3-143.0)
Median LOS 16.2 hours (9.7-29.7)
Mean ED boarding time 27 hours (SD not given)
Mean ED boarding time 2.9 hours (SD 3.1 )
Notes
2 community hospitals in MA with no academic psychiatry department
Psychiatric emergency room within an academic urban safety-net hospital
Community hospital Trauma Level III ED
Academic, tertiary medical center
2 academic hospitals and 5 community hospitals in MA
ED, emergency department; IQR, interquartile range; LOS, length of stay; MA, Massachusetts; SD, standard deviation.
Table 2. Boarding time compared to prior studies in a current study of the effects of prolonged boarding in the emergency department on elderly patients awaiting psychiatric hospitalization.
systematic screening and, therefore, likely underestimate the true burden. Patients with neurocognitive disorders were particularly vulnerable to these outcomes. This aligns with broader literature showing that older adults with major neurocognitive disorders are highly susceptible to delirium, falls, and iatrogenic complications when immobilized or exposed to unfamiliar, overstimulating environments.20, 21 In our setting, only a small minority of prolonged boarders received physical therapy evaluation, and most mobility or functional concerns were triggered reactively when nurses documented decline, rather than through proactive screening. These observations reinforce that geriatric psychiatric boarding should be conceptualized as a period of elevated risk for functional loss, not merely “waiting time” prior to definitive treatment.
Restraint episodes were concentrated among prolonged boarders and frequently occurred in the context of agitation, which was also the most documented barrier to psychiatric placement. This suggests a self-reinforcing cycle: severe agitation contributes to difficulty with psychiatric placement; longer boarding increases the likelihood of restraint; and restraint itself may worsen agitation or precipitate injury in frail older adults.16
Boarding duration did not differ significantly across primary diagnostic categories, whereas neurocognitive disorders were strongly associated with functional decline and restraint. This pattern suggests that system-level constraints (bed availability, acceptance criteria) and geriatric vulnerability may be more important determinants of adverse outcomes than specific psychiatric diagnoses.
Implications for Emergency Department Systems
Our findings support viewing older adults awaiting psychiatric admission as a distinct high-risk boarding group that warrants targeted ED protocols. First, early risk stratification is feasible using information available at the time of behavioral health evaluation: presence of a neurocognitive disorder, severe agitation or behavioral disturbance, and anticipated difficulty with placement. Patients with these features could be flagged for enhanced delirium-prevention and mobility interventions from the outset, rather than waiting until functional decline is documented.
Second, for patients expected to remain in the ED beyond 24 hours, structured “boarding bundles” could include scheduled ambulation when safe, orientation cues, sleep promotion, liberalized family presence, and explicit triggers for physical therapy or geriatrics consultation when new ADL dependence is observed. Drawing on work in general medical populations showing that even modest reductions in ED boarding can reduce downstream delirium and agitation,12,19 such bundles could be adapted and tested specifically for geriatric psychiatry boarders.
Third, our results highlight the need for diagnosis-informed agitation pathways that balance safety, preservation of function, and acceptability to receiving
psychiatric units. This may include training staff to use non-pharmacologic strategies whenever possible, using appropriate medications for agitation management, and closely monitoring for side effects. Finally, increasing timely access to psychiatric expertise, through expanded daytime coverage, standardized triggers for consultation, or telepsychiatry, may help community EDs manage complex geriatric psychiatry presentations while bed searches are underway. Prior work suggests that telepsychiatry can improve access and streamline disposition in settings with limited on-site specialists.22, 23 In parallel, reducing boarding duration will require system- and policy-level changes such as expanding inpatient psychiatry bed capacity and strengthening regional bed market coordination, to increase timely access to appropriate psychiatric placement for older adults.
LIMITATIONS
This study has several limitations. The retrospective design limits causal inference and is subject to unmeasured confounding. Outcomes were identified from routine clinical documentation (without standardized functional assessments); thus, misclassification is possible, and functional decline may be underestimated. In addition, the small sample size and low event counts resulted in wide confidence intervals. We did not measure baseline frailty or detailed medication exposure over time, which may influence both boarding duration and geriatric safety outcomes.
Generalizability is limited because this cohort was drawn from two community EDs within a single integrated health system in MA. Local/state-specific workflows for behavioral health evaluation and psychiatric bed searching may differ from other regions. We defined psychiatric boarding from completion of the behavioral health evaluation that initiates the bed search to ED departure or psychiatric clearance. Because boarding definitions vary across studies (e.g., ED arrival-to-departure or bed request-to-departure), direct comparisons of absolute boarding times should be interpreted cautiously. Nonetheless, the geriatric vulnerabilities highlighted here—functional decline and restraint during prolonged ED stays, along with limited access to specialty psychiatry services—are clinically plausible in any setting where older adults await psychiatric placement. The ED-level mitigation strategies discussed may be adaptable for other hospitals experiencing psychiatric boarding.
CONCLUSION
This study extends the literature on ED psychiatric boarding by demonstrating that, among older adults in community EDs, prolonged waits for psychiatric admission are common and are linked to functional decline and restraint. These are outcomes with direct consequences for independence, safety, and quality of life. By identifying neurocognitive disorders, agitation, and boarding duration as markers of heightened risk, our findings point to concrete ED-level targets
Schulte
bed supply, 2011 to 2023. JAMA Psychiatry. 2025;82(11):1152-1153.
ED Boarding for Psychiatric Hospitalization in Older Adults Schulte et al. for delirium-prevention, mobility, and agitation-management strategies that can be tested in future work.
Address for Correspondence: Danilo Rojas-Velasquez, MD, Harvard Medical School, Beth Israel Deaconess Medical Center, Deparment of Psychiatry, 330 Brookline Avenue, Boston, MA 02215. Email: drojasve@bidmc.harvard.edu.
Conflicts of Interest: By the WestJEM article submission agreement, all authors are required to disclose all affiliations, funding sources and financial or management relationships that could be perceived as potential sources of bias. No author has professional or financial relationships with any companies that are relevant to this study. There are no conflicts of interest or sources of funding to declare.
1. Nordstrom K, Berlin JS, Nash SS, et al. Boarding of mentally ill patients in emergency departments: American Psychiatric Association resource document. West J Emerg Med. 2019;20(5):690-695.
2. Slade EP, Dixon LB, Semmel S. Trends in the duration of emergency department visits, 2001–2006. Psychiatric Services 2010;61(9):878-884.
3. Sisti DA, Segal AG, Emanuel EJ. Improving long-term psychiatric care: bring back the asylum. JAMA. 2015;313(3):243-244.
4. Rhodes SM, Patanwala AE, Cremer JK, et al. Predictors of prolonged length of stay and adverse events among older adults with behavioral health-related emergency department visits: a systematic medical record review. J Emerg Med. 2016;50(1):143-152.
5. Nolan JM, Fee C, Cooper BA, et al. Psychiatric boarding incidence, duration, and associated factors in United States emergency departments. J Emerg Nurs. 2015;41(1):57-64.
6. Chappell B. How the loss of U.S. psychiatric hospitals led to a mental health crisis. NPR. 2017. Available at: https://www.npr. org/2017/11/30/567477160/how-the-loss-of-u-s-psychiatric-hospitalsled-to-a-mental-health-crisis. Accessed 8 Aug 2025.
7. Vestal C. A dearth of hospital beds for patients in psychiatric crisis. KFF Health News. 2023. Available at: https://kffhealthnews.org/ news/a-dearth-of-hospital-beds-for-patients-in-psychiatric-crisis/ Accessed 8 Aug 2025.
8. Shen K, Olfson M, Sacarny A. National trends in inpatient psychiatric
9. Health Resources and Services Administration. State of the Behavioral Health Workforce: 2023–2024 updates. 2024.Available at: https://bhw.hrsa.gov/sites/default/files/bureau-health-workforce/ data-research/Behavioral-Health-Workforce-Brief-2025.pdf.Accessed August 8, 2025.
10. Singer AJ, Thode HC Jr, Viccellio P, et al. The association between length of emergency department boarding and mortality. Acad Emerg Med. 2011;18(12):1324-1329.
11. Perelman SE, Muriel DM, Chary AN, et al. Hallways feel like homelessness: the geriatric boarder experience. J Am Geriatr Soc 2025;73(8):2387-2396.
12. Simpson SA, Joesch JM, West II, et al. Who’s boarding in the psychiatric emergency service? West J Emerg Med. 2014;15(6):669-674.
13. Lane DJ, Roberts L, Currie S, et al. Association of emergency department boarding times on hospital length of stay for patients with psychiatric illness. Emerg Med J. 2022;39(7):494-500.
14. Lai L, Bota RG. Emergency department wait times for geriatric psychiatric patients. Prim Care Companion CNS Disord 2018;20(5):18m02306.
15. do Nascimento Rocha HM, da Costa Farre AGM, de Santana Filho VJ. Adverse events in emergency department boarding: a systematic review. J Nurs Scholarsh. 2021;53(4):458-467.
16. Worster A, Bledsoe RD, Cleve P, et al. Reassessing the methods of medical record review studies in emergency medicine research. Ann Emerg Med. 2005;45(4):448-451.
17. von Elm E, Altman DG, Egger M, et al. The Strengthening the Reporting of Observational Studies in Epidemiology (STROBE) Statement: guidelines for reporting observational studies. Int J Surg 2014;12(12):1495-1499.
18. Joseph JW, Elhadad N, Mattison MLP, et al. Boarding duration in the emergency department and inpatient delirium and severe agitation. JAMA Netw Open. 2024;7(6):e2416343.
19. Colón-Emeric CS, Whitson HE, Pavon J, et al. Functional decline in older adults. Am Fam Physician. 2013;88(6):388-394.
20. Ellison AG, Jansen LAW, Nguyen F, et al. Specialty psychiatric services in us emergency departments and general hospitals: results from a nationwide survey. Mayo Clin Proc. 2022;97(5):862-870.
21. Graziane JA, Gopalan P, Cahalane J. Telepsychiatry consultation for medical and surgical inpatient units. Psychosomatics 2018;59(1):62-66.
22. Gentry MT, Lapid MI, Rummans TA. Geriatric telepsychiatry: systematic review and policy considerations. Am J Geriatr Psychiatry 2019;27(2):109-127.
Prospective Assessment of Depression and Anxiety Trajectories Among Emergency Department Patients with Somatic Complaints
Mona J. Moukaddem, MD*
Mohammed I. Lone, MD*
Jorge A. Alarcon, MD†
Naman Satsangi, MD†
Robert D. Gibbons, PhD‡
Paul I. Musey, MD†
David G. Beiser, MD*
Section Editor: Brad Bobrin, MD
University of Chicago, Section of Emergency Medicine, Chicago, Illinois Indiana University School of Medicine, Department of Emergency Medicine, Indianapolis, Indiana University of Chicago, Department of Medicine, Chicago, Illinois
Submission history: Submitted September 9, 2025; Revision received January 6, 2026; Accepted January 3, 2026
Electronically published May 14, 2026
Full text available through open access at http://escholarship.org/uc/uciem_westjem DOI 10.5811/westjem.50847
Introduction: Emergency department (ED) patients exhibit higher rates of depression than those in primary care and the general population, but it is unclear whether these symptoms reflect chronic conditions or transient responses to acute stress. Our objective in this study was to evaluate the longitudinal trajectory of depression and anxiety identified in the ED to inform evidence-based screening and intervention strategies.
Methods: Adult, English-speaking ED patients with adequate literacy who presented to two urban academic EDs with somatic (non-psychiatric) chief complaints completed six mental health screening assessments at enrollment. Of 262 approached patients, 188 were enrolled, representing approximately 0.5% of all adult ED visits (188/37,898) during the study period. Followup assessments were completed through a secure phone app at one, two, and four weeks after ED discharge. The primary outcome was the longitudinal stability of depression and anxiety symptoms. The secondary outcome was differences in follow-up completion rates by baseline mental health status.
Results: Among 188 patients with baseline assessments, 44 (23%) screened positive for major depressive disorder, 17 (9%) for moderate/severe depression, and 34 (18%) for moderate/severe anxiety at baseline. Overall, 50 patients (27%) screened positive for at least one of these conditions. Follow-up responses at weeks 1 (n = 42, 22%), 2 (n = 41, 22%), and 4 (n = 27, 14%) showed no significant changes in levels of depression as measured by the Computerized Adaptive TestDepression Inventory or severity of anxiety as per the Computerized Adaptive Test for Anxiety severity. High intraclass correlation coefficients (0.76-0.84) for all measures indicated inter-individual differences accounted for most variance. Stability of the Computerized Adaptive Diagnostic Test for Major Depressive Disorder ranged from moderate to substantial (Cohen kappa: 0.74 at week 1 to 0.46 at week 4). Patients who were positive for major depressive disorder had significantly higher follow-up completion rates at weeks 2 and 4 (P = .04).
Conclusion: High baseline rates of depression and anxiety highlight the substantial mental health burden in ED patients. Among those who completed follow-up assessments, severity scores remained stable, suggesting these symptoms reflect ongoing conditions rather than transient stress. Future work should improve follow-up responses and assess whether ED-based identification and treatment improve outcomes. [West J Emerg Med. 2026;27(3)579–588.]
INTRODUCTION
Mental health disorders, including major depressive disorder (MDD) and generalized anxiety disorder, are a growing yet under-addressed public health concern, affecting millions worldwide and contributing significantly to global disability. The World Health Organization identifies MDD as the leading cause of disability, accounting for 7.5% of years lived with disability.1 These disorders profoundly impact both physical and psychological well-being while imposing a substantial economic burden on healthcare systems through direct and indirect costs.2-4 Despite their widespread prevalence, depression and anxiety are frequently underdiagnosed and undertreated, especially among vulnerable populations who often seek care in the emergency department (ED).5,6 This gap in recognition is reflected in administrative data in which psychiatric disorders are absent from the top 20 discharge diagnoses of patients from U.S. EDs, based on International Classification of Diseases, 9th Revision, codes.7
The ED plays a critical role in the nation’s healthcare system, with approximately 140 million visits annually.8 This number has risen as healthcare accessibility declines for many populations, particularly those with unmet mental health needs.9 Notably, 23-27% of ED patients with non-psychiatric complaints screen positive for depression and 18-50% for anxiety,2,10,11 rates that significantly exceed the prevalence of these conditions in primary care populations.12,13 The reasons for this disparity remain unclear but may involve the influence of acute somatic symptoms on screening measures, as depression screening tools tend to yield more false positives in medical populations with concurrent physical symptoms.14–16 Alternatively, ED-identified depression and anxiety may represent chronic conditions in individuals who rely on the ED due to limited access to healthcare, with these disorders often going unrecognized in primary care, where patients lack consistent follow-up. If this is true, then ED-based diagnosis and intervention could help reduce the burden of untreated mental illness and provide early intervention for those who might otherwise remain undiagnosed and untreated.
A key question is whether positive mental health screening and severity assessments in the ED are affected by measurement bias due to emergency care factors such as acute stress and somatic symptoms, or whether they identify untreated, chronic conditions like major depressive disorder and generalized anxiety disorder. While the short-term test-retest stability of ED-based Computerized Adaptive Testing for Mental Health (CAT-MH) assessments has been demonstrated over a test-retest period of three minutes,17 the longitudinal persistence of ED-identified depression and anxiety post-discharge has not been well established. One study found that three-quarters of chest pain patients in the ED with abnormal anxiety symptoms had persistent anxiety at follow-up, suggesting that positive anxiety screenings in the ED are not merely a “white coat” phenomenon.10 If positive
Population Health Research Capsule
What do we already know about this issue? Emergency department (ED) patients have high rates of depression and anxiety, but symptom persistence after discharge is poorly understood.
What was the research question?
Do ED-identified depression and anxiety symptoms remain stable over 30 days after discharge?
What was the major finding of the study? Symptoms showed no change over 30 days: intraclass correlation coefficient .76-.84; major depressive disorder agreement κ=0.46-0.74.
How does this improve population health? Findings support ED screening to identify persistent mental health needs and enable referral and early intervention for underserved patients.
screenings primarily capture short-term, stress-related responses, routine ED screening alone may not reliably identify individuals in need of longitudinal mental health resources. Conversely, if they indicate persistent conditions, these findings reinforce the case for systematic screening and early intervention in the ED.
Our objective in this study was to investigate the longitudinal trajectory of depression and anxiety identified in the ED and re-assessed over a 30-day post-discharge period. We hypothesized that ED mental health symptoms reflect chronic mental health disorders rather than temporary responses to acute illness. Specifically, our objectives were to 1) assess the longitudinal test-retest stability of depression and anxiety severity measures, and 2) compare follow-up completion rates among patients who screened positive and negative for these conditions. Ultimately, this study provides insights into the long-term relevance of routine ED-based mental health screenings, which will inform decisions on the role of EDs in mental health care.
METHODS
Study Design, Setting, and Population
This longitudinal prospective observational study enrolled a convenience sample of adult patients (≥ 18 years of age) presenting with somatic (non-psychiatric) chief complaints to the EDs of two urban academic medical centers between July 2023-September 2023. During this period, the two EDs
recorded a combined total of 37,898 adult visits, and 188 patients were enrolled. Institutional review board approval was obtained at both study sites (University of Chicago Biological Sciences Division Institutional Review Board [BSD IRB] Protocol IRB23-0849; Indiana University IRB Protocol IRB19235). Eligibility was limited to patients anticipated to be discharged from the ED, as determined by the treating clinician during routine clinical care at the time of screening.
Study Protocol
To mitigate bias we used a convenience sampling strategy with a quasi-random sampling approach to identify ED patients for screening. Sampling sessions were conducted during limited daytime hours based on research staff availability; overnight enrollment was not performed. At the start of each sampling session, a research coordinator (RC) printed the ED patient census from the electronic health record (EHR) system. A random number digit (0-9) was generated (www.random.org) and matched to the last digit of a patient’s age to create a pre-screening list. Patients on the pre-screening list were then approached for screening in the order of their triage time. The process was repeated once all patients in the ED on the pre-screening list were approached.
The RC then verified patient stability and anticipated discharge from the ED with the treating clinician. Eligibility was limited to adults with non-psychiatric presentations who were stable, anticipated for discharge, and able to complete electronic surveys. Detailed inclusion and exclusion criteria are presented in Table 1. Eligible patients provided electronic written informed consent via Research Electronic Data Capture (REDCap, hosted at University of Chicago and Indiana University School of Medicine) and then completed the Computerized Adaptive Test for Suicide Severity (CATSS) suicide-risk screening tool.18 A “moderate” or “severe” score prompted immediate notification of the clinical team and termination of screening. Patients with a “low,” score proceeded to health literacy assessment (Rapid Estimate of Adult Literacy in Medicine, Revised [REALM-R]).19 Those meeting all criteria were enrolled in the study.
Measurements
During the index visit, the RC collected sociodemographic and medical history information, and the participant completed baseline depression and anxiety assessments, as detailed below. Except in cases where suicidality was disclosed or detected during screening, treating clinicians were blinded to the outcomes of all survey assessments. The principal investigator and designated research staff were not blinded to the results. The RC collected demographic information and past medical history directly from participants during the index ED visit using REDCap surveys. See Table 2 for description of all screening tests used.
For depression and anxiety screening, patients first
Table 1. Inclusion and exclusion criteria in a study of depression and anxiety trajectories among emergency department patients with somatic complaints.
Inclusion Criteria
• Adult ED patients (≥ 18 years of age)
• Emergency Severity Index triage score from 3-5 (5 indicates non-urgent)
• Somatic, non-mental health chief complaint
• Able to demonstrate English reading literacy of at least 8th grade level (REALM-R ≥ 6)
• Willing to participate and able to give written informed consent
• Owns a smartphone with data plan or home computer
• Anticipated discharge from the ED as predicted by physician
Exclusion Criteria
• Prior enrollment in the study
• Documented dysthymia or Axis II diagnoses
• Under involuntary detention for psychiatric assessment
• Prisoners
• Lack of decisional capacity to participate in informed consent as reported by the treating physician (e.g., active psychosis, hallucinations, intoxication, dementia, delirium, developmental delay)
• Active suicidality as indicated by CAT-SS suicide risk of “moderate” or “severe,” as determined by the clinician or disclosed during screening
• Clinical instability as judged by clinician
• Non-English speaking CAT-SS, Computerized Adaptive Test for Suicide Severity; ED, emergency department; REALM-R, Rapid Estimate of Adult Literacy in Medicine, Revised.
completed the Patient Health Questionnaire (PHQ)-8 and Generalized Anxiety Disorder-7 (GAD-7) via REDCap on a study tablet.20,21 They then proceeded to the CAT-MH suite (Adaptive Testing Technologies, Inc, Chicago, IL), limited in this study to the Computerized Adaptive Diagnostic screen for Major Depressive Disorder (CAD-MDD), the Computerized Adaptive Test-Depression Inventory (CAT-DI), and the Computerized Adaptive Test for Anxiety (CAT-ANX) assessments.22,23 Accessed via a secure, Health Insurance Portability and Accountability Act (HIPAA)-compliant platform, the CAT-MH system did not receive any protected health information. Instead, REDCap generated a studyspecific participant identifier (eg, MCAT500, MCAT501) to maintain confidentiality. Patients could complete the assessments in either text-only or text-plus-audio format. After completing the initial surveys, the RC confirmed the participant’s preferred contact details and emergency contact. The participant then received an email with a link to a $10 electronic gift card and was reminded that follow-up surveys would be sent at 1-, 2-, and 4-weeks post-ED discharge to complete the PHQ-8, GAD-7, and CAT-MH. At each followup point, patients received an email with a secure link to REDCap, where they logged in using the last four digits of
Moukaddem
Table 2. Screening tools for depression, anxiety, literacy, and suicide risk used in a study of emergency department patients with somatic complaints.
Test Name Description
Computerized Adaptive Test-Suicide Scale (CAT-SS)
Rapid Estimate of Adult Literacy in Medicine, Revised (REALM-R)
Computerized Adaptive Diagnostic Test for Major Depressive Disorder (CAD-MDD)
The CAT-SS is an adaptive measure, comprised of 111 items, that dimensionally measures suicide risk severity on a 100-point scale with 5 points of precision.18 The scores are also categorized to yield categories of low, moderate, and high risk. This survey is administered via the CAT-MH system. Because the CAT-SS is based on item response theory, the algorithm selects only the most informative questions for each participant, so individuals typically complete about 10 items rather than the full 111.
The REALM-R is a word recognition test of 11 items used to identify people at risk for poor health literacy.19 This survey is administered by the research staff.
The CAD-MDD is a proprietary computerized adaptive depression screening tool that adapts to patient responses to questions about depression by asking the most diagnostically informative question out of an item bank of almost 400 items.23 A prior study showed that the CAD-MDD was on average shorter than the PHQ-9 (an average of 4 vs 9 items), and that overall sensitivity and specificity for the CAD-MDD was 0.95 and 0.87, respectively, compared to 0.70 and 0.91 for the PHQ-9, as compared to the Structural Clinical Interview for DSM-IV (SCID).23 This survey is administered directly via the CAT-MH system.
The CAT-DI is a proprietary computerized adaptive dimensional severity measure for depression.17 The CAT-DI uses a bank of 389 depression items. The item bank was originally calibrated using a multidimensional item-response theory model. An adaptive test was then constructed that uses the item parameters to select an optimal small subset of items from the item bank that is tailored to a specific participant’s depression severity, which is dynamically estimated as the participant responds to successive test items. The process continues until the uncertainty in this severity score estimate drops below a prespecified level (eg, 5 points on a 100-point scale). A prior study has shown that an average of 12 items and a median time of 137 seconds had a correlation of r = 0.95 with the 389 total item bank score.22 The resulting severity score has outstanding predictive accuracy for a DSM-IV (SCID) diagnostic categories of none, minor depression (including dysthymia), and MDD. The CAT-DI categorized responses as normal (< 50), mild symptoms (50-65), moderate symptoms (66-75), and severe symptoms (> 75).24 This survey is administered via the CAT-MH system.
Computerized Adaptive Test for Anxiety (CAT-ANX)
Patient Health
Questionnaire 8 (PHQ-8)
Generalized Anxiety Disorder-7 (GAD-7)
The CAT-ANX is a proprietary computerized adaptive dimensional severity measure for anxiety. It accurately predicts generalized anxiety disorder severity scores using an average of 12 items per participant in less than 3 minutes from a bank of 431 items.23 The CAT-ANX scores range from 0-100 and are grouped as normal (< 35), mild (35-50), moderate (51-65), and severe symptoms (> 65).23 This survey is administered via the CAT-MH system.
The PHQ-8 is an 8-question, self-reported screening tool for depression screening and symptom severity.20 It consists of eight questions that ask about common symptoms of depression. Each question is scored on a scale from 0-3, with a total score ranging from 0-27. Higher scores indicate more severe depression symptoms. This survey was administered via REDCap.
The GAD-7 survey tool is a widely used and validated screening tool used to measure the severity of generalized anxiety disorder (symptoms in adults.21 It consists of seven questions that ask about common anxiety. Each question is scored on a scale from 0-3, with a total score ranging from 0 -21. Higher scores indicate more severe anxiety symptoms. This survey was administered via REDCap.
CAT-MH, Computerized Adaptive Testing for Mental Health; DSM-IV, Diagnostic and Statistical Manual of Mental Disorders, 4th Ed.; SCID, Structured Clinical Interview for DSM-IV; MDD, major depressive disorder; REDCap, Research Electronic Data Capture.
their phone number. Upon completing the surveys, they received a confirmatory email/message with a link to a $10 electronic gift card (at the completion of each time point). Patients had up to six days to complete each set of surveys, with up to two email/message reminders and, if needed, one phone call reminder. While survey results were not shared, patients received a standardized resource list for managing anxiety and depression upon completing the surveys. Based on the structure and length of the demographic items, literacy screening, PHQ-8, GAD-7, and the adaptive CAT-MH
assessments, a complete baseline session typically requires about 15-20 minutes to complete.
Statistical Analysis
Descriptive statistics summarized baseline participant characteristics, with categorical variables reported as frequencies and percentages and continuous variables as means and standard deviations. The median time and interquartile range (IQR) for completing the Computerized Adaptive Tests (CAT-MH, PHQ-8, GAD-7) were also reported
to assess testing efficiency in the ED.
A linear mixed-effects regression model assessed the stability of depression and anxiety severity measures from baseline to 30-day post-discharge, accounting for repeated measurements by including a random intercept for each participant. A linear trend was included to evaluate changes over time, and we used the intraclass correlation coefficient (ICC), calculated by dividing the intercept variance by the total variance, to assess test-retest reliability for continuous scores. Based on a 95% CI, ICC values were classified as poor (< 0.5), moderate (0.5-0.75), good (0.75-0.90), or excellent (> 0.90).24-26 The Cohen kappa coefficient assessed agreement (consistency) for the binary CAD-MDD outcome across the measurement occasions.24
Our mixed-effects model handled missing data and irregularly spaced measurement occasions, using all available data from each subject under the missing at random assumption in which assuming missingness is assumed to be ignorable conditional on covariates in the model and the measured outcomes for each individual (see Hedeker and Gibbons, 2006, Longitudinal Data Analysis, Wiley, Hoboken NJ). This allowed for valid inferences without imputing missing values.27 A chi-square test compared the longitudinal completion rates between MDD-positive vs MDD-negative groups and the normal/mild anxiety vs moderate/severe anxiety groups. We conducted all analyses using Python 3.1.3.0, released October 7, 2024 (Python Software Foundation, Wilmington, DE),28
RESULTS
During the study period, RCs approached 262 patients for enrollment (Figure 1). Of these, 59 declined to participate, two did not meet literacy criteria, and one screened moderate/severe for suicide risk, leaving 200 enrolled participants. An additional 12 patients were excluded for missing CAD-MDD, CAT-DI, and CAT-ANX baseline assessments, leaving 188 patients in the analytic sample, representing 72% of those approached. Response rates to the Computerized Adaptive Tests decreased over time, with 42 responses at week 1, 41 at week 2, and 27 at week 4. Median completion times were 29 seconds (IQR 20) for CAD-MDD, 46.5 seconds (35.5) for CAT-DI, and 61 seconds (46.5) for CAT-ANX. These short times reflect the adaptive nature of the CAT-MH instruments, which administer only selected items rather than the full item banks. Results were as follows: 23.4% of patients screened positive for MDD (CAD-MDD); 9% for moderate/severe depression (CAT-DI); and 18.1% for moderate/severe anxiety (CAT-ANX). Depression and anxiety symptoms were positively correlated (r = 0.895, P < .001). Demographic characteristics are reported in Table 3.
Table 4 displays the mean and standard deviation for CAD-DI, CAT-ANX, PHQ-8, and GAD-7. Across 30 days, mean depression and anxiety scores showed no significant
Figure 1. CONSORT flow diagram of enrollment and follow-up in a study of depression and anxiety trajectories among emergency department patients with somatic complaints.
CAT-SS, Computerized Adaptive Test for Suicide Severity; CAD-MDD, Computerized Adaptive Diagnostic Test for Major Depressive Disorder; CAT-DI, Computerized Adaptive TestDepression Inventory; CAT-ANX, Computerized Adaptive Test for Anxiety; CONSORT, Consolidated Standards of Reporting Trials; REALM-R, Rapid Estimate of Adult Literacy in Medicine, Revised.
linear trends, indicating that mean scores did not change systematically over time (P values = .11-.66). The ICCs for all measures were high, suggesting that most of the variance in scores was attributable to differences between individuals, with ICCs of 0.8447 (CAT-DI), 0.8341 (CAT-ANX), 0.7629 (PHQ-8), and 0.7652 (GAD-7). For depression as measured by CAD-MDD, Cohen kappa values compared to baseline were 0.74 at Week 1 (95% CI, 0.45-0.95), 0.62 at Week 2 (0.33-0.85), and 0.46 at Week 4 (0.07–0.78).
Participants with baseline major depressive disorder were more likely to complete follow-up assessments at weeks 2 and 4 (P = .04), whereas completion rates did not differ significantly by baseline anxiety status (Table 5).
DISCUSSION
In this convenience sample of ED patients presenting with non-psychiatric complaints, we identified a high baseline prevalence of depression (23%) and anxiety (18%). These rates are consistent with prior ED studies, and significantly higher than those typically reported in adult primary care populations in the U.S.,12,13,29 reinforcing the ED as a critical point of contact for patients with unmet psychiatric needs. These high rates are concerning given their association with poor health outcomes, repeat visits, suicide risk, and long-term disability.6,10,11,30,31 Depression and anxiety were also strongly correlated, consistent with prior work underscoring importance of addressing both conditions together during
Moukaddem
Table 3. Baseline sociodemographic and clinical characteristics of participants in a study of depression and anxiety trajectories among emergency department patients with somatic complaints (N = 188).
42.8 (16.5)
aPercentage of participants who have a PCP (primary care physician).
bRefers to a chronic health problem diagnosed by a healthcare worker in the prior 3 years.
SD, standard deviation; GED, General Educational Development.
aCAT-DI scores range from 0-100 and are grouped as normal (< 50), mild symptoms (50-65), moderate symptoms (66-75), and severe symptoms (> 75).
bCAT-ANX scores range from 0-100 and are grouped as normal (< 35), mild (35-50), moderate (51-65), and severe symptoms (> 65). CAT-DI, Computerized Adaptive Test-Depression Inventory; CAT-ANX, Computerized Adaptive Test for Anxiety; PHQ-8, Patient Health Questionnaire-8; GAD-7, Generalized Anxiety Disorder-7.
screening.32 Integrating effective screening and referral in the ED remains challenging given the time-sensitive nature of emergency care, limited resources, and inadequate follow-up services.11,33 Nonetheless, the success of screening programs in other settings and the proven efficacy of treatments support the development of ED-based approaches.10,11,33
We acknowledge that ED care is inherently time- and resource-limited, and that additional screening must be weighed against competing clinical priorities. However, depression and anxiety are highly prevalent among ED patients and can be identified using brief, self-administered tools that require minimal clinician time. When integrated into existing workflows, ED-based mental health screening may represent a high-yield opportunity to identify untreated conditions and facilitate linkage to care without meaningfully detracting from emergent care.
Our longitudinal analyses demonstrated strong withinsubject reliability for both depression and anxiety severity scores over 30 days, with ICC values above accepted thresholds for reliability. 21,24,25 The Cohen kappa showed substantial agreement for depression at Week 1 (k = 0.738)
Table 5. Completion rates of longitudinal follow-up assessments by baseline depression and anxiety status in a study of emergency department patients with somatic complaints.
and moderate-to-good agreement at Weeks 2 (k = 0.616) and 4 (k = 0.455). Although kappa declined over time, likely reflecting smaller samples and normal response variability, the overall pattern suggests persistent depressive symptoms, which merit clinical attention even without a CAD-MDD diagnosis.34 These findings suggest that ED-based screening may identify persistent mental health conditions and may offer an opportunity for early recognition and linkage to care.
In addition, the Computerized Adaptive Tests (CAT-DI and CAT-ANX) outperformed traditional measures such as the PHQ-8 and GAD-7, providing more precise severity estimates with fewer items.35,36 Median completion times were under one minute, and the self-administered format can improve disclosure of sensitive symptoms,37,38 making them particularly well suited for the time-pressured ED setting. Although not diagnostic, these tools are clinically actionable, as elevated scores are frequently used to guide treatment initiation in primary care settings. 39 Notably, the CAD-MDD was developed as a diagnostic tool rather than a screening test, and it has shown strong agreement with the SCID,23,35 supporting its use as a practical diagnostic proxy when full psychiatric interviews are not feasible in the ED.
MDD, major depressive disorder.
Follow-up response rates in our study were low (22% at week 1, 22% at week 2, and 14% at week 4), which constrains the strength of conclusions regarding symptom trajectories and introduces the potential for nonresponse selection bias.40,41 Notably, patients who screened positive for depression were more likely to complete follow-up assessments at Weeks 2 and 4, suggesting that individuals with greater psychiatric burden may remain more engaged. This pattern is consistent with prior reports of higher retention among symptomatic patients.33 Low overall response rates may have been compounded by our reliance on email-based REDCap links, as previous studies show lower responsiveness to email compared with text- or phone-based approaches, particularly among socioeconomically disadvantaged groups.42 Future work should explore alternative strategies such as HIPAA-compliant text messaging or secure patient portal communication, both of which have demonstrated
Table 4. Mean and standard deviation of depression and anxiety severity scores over 30 days in a study of emergency department patients with somatic complaints.
higher adoption and patient engagement,43,43-45 and may be most effective when implemented together as part of a multimodal follow-up strategy. 40,41
Taken together, our findings highlight the ED as a critical setting for early psychiatric recognition. Screening alone is insufficient; benefit will depend on pairing identification with referral and timely intervention. Stepped-care frameworks may help tailor treatment intensity to symptom severity, while digital solutions such as telepsychiatry and mobile health application could extend access and mitigate workforce shortages.46,47 Our results also suggest that at home, selfadministered follow-up assessments are feasible and may provide ongoing opportunities for monitoring beyond the ED encounter. Future studies should test whether systemic ED-based screening, coupled with treatment initiation or referral, improves long-term outcomes. Larger and more diverse populations will be needed to establish the effectiveness, scalability and sustainability of ED-initiated mental health interventions.
LIMITATIONS
While these findings provide insight into the mental health burden in the ED, several factors limit their interpretation. The use of a convenience sample reduces representativeness, as patients who participated may differ from those who declined or were excluded, and non-responders were not characterized in detail. To mitigate this limitation, patient selection within each session was randomized, reducing the risk of systematic bias. Restricting eligibility to patients anticipated for discharge and excluding non-English-speaking patients may have limited generalizability by excluding individuals with more severe conditions and potentially different baseline symptom levels or psychiatric trajectories. Screenings were also conducted during limited hours, excluding overnight patients; however, this group accounts for only about 10% of the ED population. Recruitment from two urban, academic centers further limits generalizability to other ED settings.
In addition, follow-up response rates were low, which limits the strength of conclusions regarding symptom trajectories; reliance on phone number-based identification may have further introduced selection bias if patients without consistent phone access were less likely to participate. The four-week follow-up period may not capture longer term changes in depression and anxiety beyond the acute postdischarge period, and recall of prior responses during followup assessments may also have biased results toward showing little or no change over time. Neither were we able to account for repeat ED visits during the follow-up interval, which could have influenced symptom trajectories if patients experienced new or recurrent acute illness.
The study also lacked detailed information on prior psychiatric treatment and established risk factors for depression and anxiety, such as frequent ED visits, smoking,
or comorbidities including asthma and arthritis.9 Prior work has shown that depression in ED patients is more common among middle-aged women, individuals with lower socioeconomic or educational backgrounds, and those reporting anxiety or chronic fatigue.29 Incorporating such variables could help refine screening strategies and improve the identification of patients at highest risk.
CONCLUSION
This study highlights the substantial burden of depression and anxiety among ED patients presenting with nonpsychiatric complaints. Among participants who completed follow-up assessments, severity score remained stable over 30 days, suggesting that these symptoms may reflect ongoing conditions rather than temporary responses to acute illness. Given the limited number of follow-up assessments, these findings should be interpreted cautiously. Future studies should focus on improving follow-up response and testing whether ED-based identification and treatment of depression and anxiety can improve patient outcomes.
ACKNOWLEDGMENTS
The authors wish to acknowledge Sara Roy, Edvardine Joseph, and Morad Suliman for their support and assistance with this research project.
Address for Correspondence: Mona J. Moukaddem, MD, University of Chicago, Section of Emergency Medicine, 5656 S. Maryland Ave, Chicago, IL 60673. Email: monamoukaddem@gmail.com.
Conflicts of Interest: By the WestJEM article submission agreement, all authors are required to disclose all affiliations, funding sources and financial or management relationships that could be perceived as potential sources of bias. This work was supported by the National Center for Advancing Translational Sciences of the National Institutes of Health [grant number TL1TR002388] and the CTSA Administrative Supplement award [grant number UL1 TR00238904]. The content is solely the responsibility of the authors and does not necessarily represent the official views of the funders. Access to the CAT-MH was provided at no cost by Adaptive Testing Technologies (ATT). Dr. Robert Gibbons, a founder of ATT, is involved in the distribution of the CAT-MH battery of adaptive tests. No other author has professional or financial relationships with any companies that are relevant to this study. There are no other conflicts of interest or sources of funding to declare.
1. World Health Organization. Global Health Estimates: Life Expectancy
and
Trajectories in
Patients with Somatic Complaints and Leading Causes of Death and Disability. World Health Organization website. https://www.who.int/data/gho/data/themes/ mortality-and-global-health-estimates. Accessed February 5, 2025.
2. Beiser DG, Ward CE, Vu M. Depression in emergency department patients and association with health care utilization. Acad Emerg Med. 2019;26(8):878-888.
3. Cuijpers P, Vogelzangs N, Twisk J, et al. Comprehensive metaanalysis of excess mortality in depression in the general community versus patients with specific illnesses. Am J Psychiatry. 2014;171(4):453-462.
4. Armbrecht E, Shah R, Poorman GW, et al. Economic and humanistic burden associated with depression and anxiety among adults with non-communicable chronic diseases in the United States. J Multidiscip Healthc. 2021;14:887-896.
5. Harman JS, Mulsant BH, Kelleher KJ, et al. Narrowing the gap in treatment of depression. Int J Psychiatry Med. 2001;31(3):239-253.
6. Booth BM, Walton MA, Barry KL, et al. Substance use, depression, and mental health functioning in patients seeking acute medical care in an inner-city ED. J Behav Health Serv Res. 2011;38(3):358-372.
7. Centers for Disease Control and Prevention. National Hospital Ambulatory Medical Care Survey: 2018 emergency department summary tables. Accessed February 5, 2025. https://www.cdc.gov/ nchs/data/nhamcs/web_tables/2018_ed_web_tables-508.pdf
8. Centers for Disease Control and Prevention. National Hospital Ambulatory Medical Care Survey: 2021 emergency department summary tables. Published 2023. Accessed February 5, 2025. https://www.cdc.gov/nchs/data/nhamcs/web_tables/2021_ed_web_ tables-508.pdf
9. Boudreaux ED, Clark S, Camargo CA. Mood disorder screening among adult emergency department patients: a multicenter study of prevalence, associations, and interest in treatment. Gen Hosp Psychiatry. 2008;30(1):4-13.
10. Musey PI Jr, Patel R, Fry C, et al. Anxiety associated with increased risk for emergency department recidivism in patients with low-risk chest pain. Am J Cardiol. 2018;122(7):1133-1141.
11. Oliveira J e Silva L, Prakken SD, et al. Depression and anxiety screening in emergency department patients with recurrent abdominal pain: an evidence synthesis for a clinical practice guideline. Acad Emerg Med. 2022;29(5):615-629.
12. Mitchell AJ, Rao S, Vaze A. International comparison of clinicians’ ability to identify depression in primary care: meta-analysis and meta-regression of predictors. Br J Gen Pract. 2011;61(583):e72-e80.
13. Dahlén I, Janson C. Anxiety and depression are related to the outcome of emergency treatment in patients with obstructive pulmonary disease. Chest. 2002;122(5):1633-1637.
14. Blais BR. Discrimination against contact lens wearers. J Occup Environ Med. 1998;40(10):876-878.
15. Kalichman SC, Sikkema KJ, Somlai A. Assessing persons with human immunodeficiency virus infection using the Beck Depression Inventory: disease processes and other potential confounders. J Pers Assess. 1995;64(1):86-100.
16. Patterson AL, Morasco BJ, Fuller BE, et al. Screening for depression in patients with hepatitis C using the Beck Depression Inventory-II: Do somatic symptoms compromise validity? Gen Hosp Psychiatry. 2011;33(4):354-362.
17. O’Reilly LM, Dalal AI, Maag S, et al. Computer adaptive testing to assess impairing behavioral health problems in emergency department patients with somatic complaints. JACEP Open. 2022;3(5):e12804.
18. Gibbons RD, Kupfer D, Frank E, Moore T, Beiser DG, Boudreaux ED. Development of a Computerized Adaptive Test Suicide Scale-the CAT-SS. J Clin Psychiatry. 2017;78(9):1376-1382.
19. Bass PF III, Wilson JF, Griffith CH. A shortened instrument for literacy screening. J Gen Intern Med. 2003;18(12):1036-1038.
20. Kroenke K, Strine TW, Spitzer RL, et al. The PHQ-8 as a measure of current depression in the general population. J Affect Disord. 2009;114(1):163-173.
21. Spitzer RL, Kroenke K, Williams JBW, et al. A brief measure for assessing generalized anxiety disorder: the GAD-7. Arch Intern Med. 2006;166(10):1092-1097.
22. Siu AL; US Preventive Services Task Force. Screening for depression in adults: US Preventive Services Task Force recommendation statement. JAMA. 2016;315(4):380-387.
23. Gibbons RD, Weiss DJ, Pilkonis PA, et al. Development of the CAT-ANX: a computerized adaptive test for anxiety. Am J Psychiatry. 2014;171(2):187-194.
24. Cicchetti DV, Sparrow SA. Developing criteria for establishing interrater reliability of specific items: applications to assessment of adaptive behavior. Am J Ment Defic. 1981;86(2):127-137.
25. Kaplan HI, Sadock BJ. Kaplan and Sadock’s Comprehensive Textbook of Psychiatry. 10th ed. Philadelphia, PA: Lippincott Williams & Wilkins; 2017. https://www.researchgate.net/ publication/278158128_Kaplan_Sadock’s_Comprehensive_ Textbook_of_Psychiatry. Accessed February 5, 2025.
26. Koo TK, Li MY. A guideline of selecting and reporting intraclass correlation coefficients for reliability research. J Chiropr Med. 2016;15(2):155-163.
27. Hedeker D, Gibbons RD. Missing data in longitudinal studies. In: Longitudinal Data Analysis. Hoboken, NJ: John Wiley & Sons; 2006:279-312.
28. Rossum G. Python programming language Semantic Scholar Accessed February 5, 2025. https://www.semanticscholar.org/paper/ Python-Programming-Language-Rossum/7a8986432b6359f6834dc5 61dfea42d023c0b806
29. Kumar A, Clark S, Boudreaux ED, et al. A multicenter study of depression among emergency department patients. Acad Emerg Med. 2004;11(12):1284-1289.
30. Ahmedani BK, Westphal J, Autio K, et al. Variation in patterns of health care before suicide: a population case-control study. Prev Med. 2019;127:105796.
31. Katon W. Epidemiology and treatment of depression in patients with chronic medical illness. Dialogues Clin Neurosci. 2011;13(1):7-23.
32. Steffen A, Nübel J, Jacobi F, et al. Mental and somatic comorbidity of depression: a comprehensive cross-sectional analysis of 202 diagnosis groups using German nationwide ambulatory claims data. BMC Psychiatry. 2020;20(1):142.
33. Gibbons JB, Cox SA, Straub L, et al. Association between depression severity, mental health recovery, and dropout from behavioral health care treatment. Psychiatry Res Commun. 2024;4(3):100185.
34. Johnson J, Weissman MM, Klerman GL. Service utilization and social morbidity associated with depressive symptoms in the community. JAMA. 1992;267(11):1478-1483.
35. Gibbons RD, Weiss DJ, Pilkonis PA, et al. Development of a computerized adaptive test for depression. Arch Gen Psychiatry. 2012;69(11):1104-1112.
36. Brenner LA, Betthauser LM, Penzenik M, et al. Validation of a computerized adaptive test suicide scale (CAT-SS) among United States military veterans. PLoS One. 2022;17(1):e0261920.
37. Rhodes KV, Lauderdale DS, Stocking CB, et al. Better health while you wait: a controlled trial of a computer-based intervention for screening and health promotion in the emergency department. Ann Emerg Med. 2001;37(3):284-291.
38. Rhodes KV, Lauderdale DS, He T, et al. “Between me and the computer”: increased detection of intimate partner violence using a computer questionnaire. Ann Emerg Med. 2002;40(5):476-484.
39. DeJesus RS, Vickers KS, Melin GJ, et al. A system-based approach
to depression management in primary care using the Patient Health Questionnaire-9. Mayo Clin Proc. 2007;82(11):1395-1402.
40. Phillips AW, Reddy S, Durning SJ. Improving response rates and evaluating nonresponse bias in surveys: AMEE Guide No. 102. Med Teach. 2016;38(3):217-228.
41. Phillips AW, Friedman BT, Durning SJ. How to calculate a survey response rate: best practices. Acad Med. 2017;92(2):269-269.
42. Thompson P. Communication technology use and study skills. Act Learn High Educ. 2017;18(3):257-270.
43. Varner C, McLeod S, Nahiddi N, et al. Text messaging research participants as a follow-up strategy to decrease emergency department study attrition. CJEM. 2018;20(1):148-153.
44. Carini E, Villani L, Pezzullo AM, et al. The impact of digital patient portals on health outcomes, system efficiency, and patient attitudes: updated systematic literature review. J Med Internet Res. 2021;23(9):e26189.
45. Irizarry T, DeVito Dabbs A, Curran CR. Patient portals and patient engagement: a state of the science review. J Med Internet Res. 2015;17(6):e148.
46. Kowalenko T, Khare RK. Should we screen for depression in the emergency department? Acad Emerg Med. 2004;11(2):177-178.
47. Butterfield A. Telepsychiatric evaluation and consultation in emergency care settings. Child Adolesc Psychiatr Clin N Am. 2018;27(3):467-478.
Impact of Bystander Naloxone on Emergency Medical Transport Refusal After Opioid Overdose: A
Daniella M. Carnevale, MD*
Peter Canning, RN†
Regina Kostyun, PhD†
Richard Kamin, MD†
Section Editor: Ryan Ley, MD
Statewide Retrospective Analysis
University of Connecticut School of Medicine, Farmington, Connecticut
University of Connecticut, John Dempsey Hospital, Department of Emergency Medicine, Farmington, Connecticut * †
Submission history: Submitted October 4, 2025; Revision received January 15, 2026; Accepted January 9, 2026
Electronically published May 14, 2026
Full text available through open access at http://escholarship.org/uc/uciem_westjem DOI 10.5811/westjem.50754
Introduction: The opioid epidemic remains a public health crisis in the United States. Naloxone is a cornerstone of overdose reversal, and its increasing availability to bystanders has improved immediate survival. However, little is known about how bystander naloxone administration influences use of emergency medical services (EMS), particularly patient refusal of transport. Understanding these dynamics is critical for development of EMS protocol and harm reduction strategies.
Methods: We performed a retrospective cohort study of suspected opioid overdoses reported to the Connecticut Statewide Opioid Reporting Directive (SWORD) between November 1, 2019–June 30, 2024. The primary outcome was EMS transport refusal, defined as non-transport after naloxone administration. The primary exposure was initial naloxone administrator (bystander vs first responder). Secondary variables included naloxone dose frequency, patient demographics, and time. Bivariate tests compared group differences. We used multivariable logistic regression to assess the association between bystander naloxone and refusal, adjusting for covariates. To evaluate temporal trends, we performed separate logistic regression models with calendar quarter (Q) modeled as a continuous variable (Q1 2020–Q2 2024).
Results: Among 15,025 nonfatal suspected overdoses involving naloxone in Connecticut, bystanders were initial administrators in 18%. Transport refusal occurred more often after bystander administration compared to first responder administration (16.1% vs 6.2%). In adjusted analyses, bystander administration was associated with nearly threefold higher odds of refusal (adjusted odds ratio [aOR] 2.90; 95% CI, 2.53-3.31). Multiple-dose incidents were associated with decreased refusal (aOR 0.83; 0.72-0.93). During the study period, bystander administration increased from 15% in Q4 2019 to 24% in Q2 2024, corresponding to a 3.8% increase in odds per quarter (OR 1.04; 95% CI 1.03-1.05, P < .001). Refusal more than doubled from 4% to 12%, with odds increasing 4.5% per quarter (OR 1.05; 1.04-1.06, P < .001).
Conclusion: Bystander-administered naloxone is increasingly common and strongly associated with higher odds of EMS transport refusal. While refusal does not always equate to unsafe outcomes, it represents missed opportunities for initiation of medications for opioid use disorder, harm reduction counseling, and linkage to care. Emergency medical services agencies should consider strategies such as leave-behind naloxone, peer recovery coach deployment, and EMS-initiated buprenorphine to capitalize on these encounters. [West J Emerg Med. 2026;27(3)589–596.]
INTRODUCTION
The opioid epidemic remains a critical public health crisis in the United States, with opioid-involved overdoses rising at an alarming rate.1 In 2021 alone, opioid overdoses accounted for nearly 3 million years of life lost, about one in 22 deaths nationwide.2 In Connecticut, unintentional overdose deaths have risen by 306% over the past decade, with opioids implicated in 92% of cases in 2022.3 These events disrupt families, increase foster care placements,4 and impose a staggering economic burden of over $1 trillion annually.5-6
Naloxone, a high-affinity opioid antagonist first approved by the U.S. Food and Drug Administration in 1971, remains central to overdose reversal.7 Early efforts by harm reduction activists and the introduction of intranasal formulations expanded community access, empowering bystanders to intervene before first responders arrived.8-10 Evidence consistently demonstrates that bystander-administered naloxone is generally safe and effective in preventing immediate fatalities.11-13 Between 2020–2022, layperson naloxone use prior to emergency medical services (EMS) arrival increased by 43.5% nationally.14
While survival benefits of naloxone are clear, transport refusal following reversal has emerged as a challenge. Patients revived by naloxone, particularly by bystanders, may decline subsequent EMS transport. Motivations for refusal are complex, ranging from fear of withdrawal and stigma to prior negative healthcare experiences.15-18 Historically, transport was recommended for observation of recurrent toxicity, but emerging evidence supports selective treat-and-release strategies.19-22 Still, refusal may represent missed opportunities to initiate medications for opioid use disorder, provide harm reduction kits, or connect patients with peer recovery coaches. Localized data on transport refusal rates can help provide insight on current trends in different communities. Such data can then help inform potential outreach programs and both identify and address reasons for refusal.
In 2019, Connecticut launched the Statewide Opioid Reporting Directive (SWORD), a mandatory system capturing EMS-reported suspected opioid overdoses. The SWORD offers real-world, population-level insights to guide harm reduction and EMS practices.23 In this study we leveraged SWORD data to examine trends in bystander naloxone administration and EMS transport refusal from 2019–2024. A secondary aim assessed whether bystander administration was associated with higher refusal likelihood compared to first responder administration. We hypothesized that bystanderadministered naloxone would be linked to increased odds of transport refusal among patients for whom 9-1-1 was activated.
METHODS
Study Design
This was a retrospective cohort study of suspected opioid overdoses in Connecticut reported in SWORD from
Population Health Research Capsule
What do we already know about this issue?
Bystander naloxone use improves overdose survival, but its impact on EMS transport refusal and care linkage is not well defined.
What was the research question?
Is bystander naloxone administration associated with higher odds of EMS transport refusal after opioid overdose?
What was the major finding of the study?
Naloxone administration from a bystander was associated with 2.9-fold higher odds of transport refusal compared to first responders (aOR 2.90; 95% CI 2.53–3.31; P <.001).
How does this improve population health?
EMS transport refusal after overdose reversal is an emerging concern, highlighting a growing disconnect between overdose reversal and potential engagement with post-reversal harm reduction.
November 1, 2019–June 30, 2024. Institutional review board approval was obtained (UConn Health IRB #25X-343-2). Methods adhered to recommended practices for medical record review studies as described by Worster and Bledsoe and colleagues.24
The SWORD database, managed by Connecticut’s Office of Emergency Medical Services and Poison Control Center at University of Connecticut Health, tracks opioid overdose cases in real time. Emergency medical services clinicians must report any 9-1-1 calls involving suspected opioid overdoses with reduced responsiveness or breathing problems. Reports are submitted via a dedicated electronic portal following case completion. Required fields include naloxone administration status, initial administrator identity, and transport disposition. Records were included if naloxone was administered for suspected opioid overdose in individuals ≥ 18 years of age (Figure 1).
Cases were excluded if they resulted in fatality, involved administration by “other” or “hospital,” or occurred in patients < 18 years of age (not eligible for independent refusal under Connecticut EMS protocols). Fatal cases were excluded because patients who did not survive to EMS evaluation could not undergo a transport refusal assessment and were, therefore, ineligible for the study’s primary outcome.
Figure 1. Flow diagram of study cohort selection from the Connecticut Statewide Opioid Reporting Directive database, November 2019–June 2024, in a study examining the odds of refusal of transport to hospital after naloxone administration by bystander vs first responder.
The primary outcome was EMS transport disposition (transported vs refused transport). In Connecticut, there is no formal “treat-and-release” protocol and, thus, we used non-transport as a surrogate variable for patient refusal. The primary outcome was the identity of the initial naloxone administrator (bystander vs first responder). The “bystander” designation is determined by EMS personnel and includes anyone who administered naloxone prior to EMS arrival and is not affiliated with EMS, fire, or police. “Other” or “hospital” were excluded due to role ambiguity. Secondary outcomes included naloxone dose frequency (single vs multiple), age, sex, and time of year (calendar quarter [Q[).
Statistical Analysis
Continuous variables are reported as means (standard deviation) if normally distributed and as medians (interquartile [IQR]) otherwise. Categorical variables are reported as counts (percentages). Chi-square tests assessed associations between initial naloxone administrator and categorical variables (sex, number of doses, and transport disposition). A Mann-Whitney U test compared age by administrator type due to non-normal distribution (Shapiro-Wilk test, P < .001). A multivariable
logistic regression model evaluated the association between initial naloxone administrator and transport disposition, adjusting for age, sex, dose frequency, and calendar quarter (modeled continuously). Seasonality was not modeled separately, and calendar quarter was used to capture overall temporal trends. To assess temporal trends, separate logistic regression models were performed with transport refusal (yes/no) and bystander administration (yes/no) as dependent variables and calendar quarter as the independent variable. (We excluded Q4 2019 from trend models due to partial data capture).
We assessed model fit with the Hosmer–Lemeshow test. Adjusted odds ratios (aOR) with 95% confidence intervals were reported. We defined statistical significance as two-sided P < .05. Analyses were conducted using IBM SPSS v29.0 (International Business Machines Corporation, Armonk, NY). Cases with missing covariate data were excluded listwise in regression models. Age was missing in 261 cases (1.7%) and sex in 89 cases (0.6%).
RESULTS
Sample Characteristics
A total of 15,470 cases were initially identified. After exclusions, we included 15,025 nonfatal, suspected opioid overdoses involving naloxone administration in the final analysis. The study sample was 74% male (n = 11,035) and 26% female (n = 3,901), with 0.6% (n = 89) not reporting sex. The median age was 43 years (IQR 33-45). A total of 5,888 (39.2%) received a single dose of naloxone, and 9,137 (60.8%) received multiple doses. First responders administered the initial dose in 12,388 cases (82%), while bystanders administered it in 2,637 cases (18%). Among first responders, EMS administered the first dose of naloxone in 55% (n = 6 ,846) of cases, fire services administered it in 31% (n = 3,798) of cases, and police administered it in 14% (n = 1,743) of cases.
Trends in Bystander vs First Responder First Naloxone Administration
Table 1 summarizes patient characteristics of those who received the initial naloxone from a bystander and those who received it from a first responder.
Patients who were administered naloxone from a bystander were slightly younger (Mann-Whitney U = 14,007,545; Z = –9.156; P < .001), and multiple naloxone dose administrations were more common (χ²(df=1) = 434.93, P < .001).
Bystander Naloxone Administration and Refusal
Overall, 1,196 patients (8.0%) refused transport after receiving naloxone. Among those who refused, 771 (64.5%) received naloxone from a first responder and 425 (35.5%) received naloxone from a bystander (χ²(1) = 290.14, P < .001). Among refusals,836 patients (72%) were male and 324
Impact of Bystander Naloxone on EMS Transport Refusal After Opioid Overdose
Table 1. Baseline characteristics of patients with suspected opioid overdose treated with bystander- vs first responder–administered naloxone in Connecticut, 2019–2024.
Group (n = 2,637)
Group (n = 12,387)
Male
Note: Age presented as median (interquartile range).
Missing data: from bystander group, 38 were missing age and 18 sex; and from first responder group, 223 were missing age and 71 sex.
(28%) were female. The median age was 42 (IQR 32-52).
With regard to dosing, 471 (39%) received a single dose of naloxone and 61% received multiple doses. Table 2 provides the characteristics of patients who refused transport.
After adjusting for age, sex, dosage, and calendar quarter, bystander naloxone administration was associated with nearly threefold higher odds of refusal (Table 3). The model demonstrated good fit.
Time Trends in Naloxone Administration and Refusal
As visualized in Figure 2, bystander-administered naloxone increased from 15% in Q4 2019 to 24% in Q2 2024, while transport refusals more than doubled during the same period, rising from 4.4% to 12%.
Table 3. Multivariable logistic regression of factors associated with emergency medical services transport refusal after naloxone administration in suspected opioid overdose patients, Connecticut SWORD database, 2019–2024.
Adjusted Odds Ratio (95% CI) P value
Table 2. Characteristics of patients refusing transport following naloxone administration, stratified by initial naloxone administrator, in a study that found overdose victims receiving naloxone from bystanders were nearly three times more likely to refuse EMS transport than those receiving it from first responders.
Refused Transport (n = 1,196)
Characteristic
Sex
Bystander Group (n = 425) First Responder Group (n = 771)
Male 299 (70%) 564 (73%)
Female 122 (29%) 202 (26%)
Age, median (IQR) 40 (31-50) 43 (33-53)
Number of naloxone
doses
Single 114 (27%) 357 (46%)
Multiple 311 (73%) 414 (54%)
Values are presented as n (%) unless otherwise indicated. Age is reported as median (IQR). IQR, interquartile range.
First naloxone administrator
First responder ReferenceBystander 2.90 (2.53-3.31) <.001
Dosages
Single ReferenceMultiple 0.83 (0.72-0.93) .003 Age, per year 0.992 (0.987-0.997)
SWORD, Statewide Opioid Reporting Directive.
In separate time-trend logistic regression models, each quarter was associated with a 3.8% increase in the odds of bystander administration (odds ratio [OR] 1.04, 95% CI, 1.031.05, P < .001) and a 4.9% increase in the odds of refusal (OR 1.05, 1.04-1.06, P < .001). Both models demonstrated good fit by Hosmer-Lemeshow testing. These findings illustrate a steady upward trend in both bystander intervention and refusal of transport over time.
DISCUSSION
A key strength of this study is the use of a mandatory, population-level statewide EMS dataset, which is rare in overdose epidemiology and enhances both the generalizability
Figure 2. Trends in bystander-administered naloxone and EMS transport refusal among suspected opioid overdose patients, Connecticut SWORD database, Q4 2019–Q2 2024. Solid lines represent observed quarterly percentages; dotted lines indicate linear trend estimates.
EMS, emergency medical services; SWORD, Statewide Opioid Reporting Directive.
of results and their applicability to EMS and public health policy. In this statewide analysis of more than 15,000 suspected opioid overdoses, patients receiving naloxone from bystanders were nearly three times more likely to refuse EMS transport than those first treated by first responders. Both bystander naloxone administration and refusal rates increased over time, highlighting a shifting landscape of overdose response in Connecticut. Multiple doses were more common with bystander administration. Such higher rates of multipledose naloxone administration by bystanders may reflect untrained escalation or uncertainty in community response. The administration of multiple naloxone doses was associated with a lower likelihood of transport refusal. Lastly, older age of patient slightly reduced likelihood of transport refusal.
Transport Refusal After Bystander Naloxone Administration
While research remains limited, prior studies suggest that physiologic, social, and contextual factors contribute to higher refusal rates when a bystander administers naloxone. People who use drugs have cited intolerable withdrawal, stigma, and expectations of poor hospital care as common reasons for declining transport.17 Higher rates were also observed during the COVID-19 pandemic, potentially due to fear of infection and strained systems.25 Additional associations include female sex, urban setting, and adverse social determinants of health, whereas family presence reduced refusal.16 In summary, prior studies have indicated that refusal is likely driven by a combination of individual and systemic factors. Future large-
scale studies are needed to delineate the relative contributions of these factors, and findings should inform the refinement of public health policies and EMS practices to most effectively address them.
Transport Refusal and Multiple Naloxone Doses
We found that patients receiving multiple naloxone doses were about 18% less likely to refuse transport. This pattern may reflect more severe or polysubstance overdoses, with residual sedation, confusion, or respiratory compromise. We also observed that bystanders were more likely to administer multiple doses of naloxone. On the other hand, EMS dosing is typically titrated to restore ventilation while minimizing withdrawal.26 Taken together, these findings suggest that both overdose severity and the identity of the administrator may interact with transport decisions in complex ways.
Substances Involved and Contextual Considerations
Naloxone use patterns should be interpreted within the contemporary polysubstance overdose landscape. Many opioid overdoses during this period involve high-potency synthetic opioids such as fentanyl, often in combination with non-opioid substances (eg, stimulants or sedatives), which may increase overdose severity and complicate clinical response. However, community-based naloxone programs have continued to demonstrate effectiveness across these evolving drug eras.27 Toxicological testing of fatal overdoses in Connecticut from 2020-2023 showed that a large majority of opioid deaths involved fentanyl, and almost half of fentanyl overdoses
co-involved cocaine. The animal tranquilizer xylazine was present in approximately one-fifth of overdose fatalities.28
Recommendations for EMS Practice
Bystander naloxone programs save lives,12 but our findings suggest they may also increase the likelihood of refusal. Refusal is not always unsafe,19-22 but it reduces opportunities for initiation of medications for opioid use disorder and harm reduction engagement. For EMS clinicians, these encounters are, therefore, critical touchpoints. Even when transport is declined, EMS crews can deliver meaningful interventions such as leave-behind naloxone kits,29 peer recovery coach referrals,30 and initiation of buprenorphine when indicated.31-35 Leavebehind naloxone programs in Missouri,36 quick response teams in West Virginia,37 and integrated EMS-public health models in Ohio38 show how refusals can be reframed as outreach opportunities rather than dead ends. Furthermore, EMS-initiated buprenorphine has been shown to treat acute withdrawal with low risk of adverse events.
To help reduce refusals, EMS systems should emphasize training in compassionate communication that fosters trust. Future research should prioritize prospective studies and local data collection to clarify the drivers of refusal and assess the effectiveness of EMS-led interventions in closing the care gaps created by transport refusals. Particular attention should be given to social determinants, stigma, and geography as these may shape both refusal patterns and access to follow-up care.
While the field-based interventions show promise, their implementation requires consideration of feasibility and local context. Many of these strategies leverage existing EMS encounters and can be implemented with modest incremental cost, particularly when supported through public health or state-level funding mechanisms.27,34 Training requirements are variable but generally align with continuing education already provided to EMS clinicians, including overdose recognition, withdrawal assessment, and trauma-informed communication.26,31 Successful implementation often depends on partnerships between EMS agencies, public health departments, and community harm reduction organizations to facilitate referral pathways, medication access, and followup care.28,35,36 Tailoring these approaches to local resources and workforce capacity may help maximize impact while minimizing operational burden.
In summary, bystander naloxone administration is increasingly common and associated with higher EMS transport refusal. For EMS clinicians, refusals should not be seen as the end of care but as opportunities to connect patients with harm reduction and treatment resources. Expanding fieldbased interventions may ensure that overdose reversal serves as a gateway to recovery rather than an endpoint.
LIMITATIONS
This study has several limitations. First, data are selfreported by EMS clinicians in the field and may be subject
to human error or misclassification. All included cases were based on suspected opioid overdose at the time of naloxone administration and were not toxicologically confirmed. In some cases, bystander-administered naloxone may be administered in ambiguous clinical situations where opioid involvement is uncertain, particularly in community settings, which could influence patient response and subsequent transport refusal patterns. The database captures neither patients’ reasons for refusing transport nor long-term clinical outcomes, limiting our ability to assess downstream health impacts. Moreover, all non-transport cases were categorized as “refusals.” In Connecticut, EMS protocols require assessment of patient decision-making capacity prior to honoring refusal of transport, typically including evaluation of orientation, understanding of risks, and ability to communicate a choice. However, field conditions and documentation practices may still contribute to variability in recorded non-transport outcomes. We use the term “refusal” descriptively, without pejorative intent, to reflect operational EMS documentation rather than to imply judgment.
Additional limitations include incomplete data capture, especially during initial implementation (approximately 70% compliance in the first year), potentially underestimating early cases. Missing data were present for age (1.7%) and sex (0.6%). These cases were excluded listwise from regression models. Given the small proportion, this is unlikely to have materially influenced results. The dataset also excludes incidents where EMS was never contacted following bystander naloxone administration, limiting generalizability to community-managed overdoses. The sample was predominantly male; additionally, potential sexbased differences in transport refusal remain underexplored. Caution is warranted when generalizing findings to more diverse and/or nonbinary populations. Contextual factors like the COVID-19 pandemic may also have influenced patterns of administration and refusal. Because seasonality was not explicitly modeled, unmeasured seasonal variation and pandemic-related fluctuations may have influenced observed overdose and transport refusal trends. Finally, the chart abstractors were not blinded to the study hypothesis.
CONCLUSION
In this statewide retrospective study, patients who received naloxone from bystanders were at significantly greater odds of refusing subsequent EMS transport compared to those treated first by first responders, and both bystander administration and refusals increased over the study period. These encounters represent important opportunities for EMS clinicians to offer harm resources and linkage to treatment, even when transport is declined. Strengthening field-based efforts may help ensure that overdose reversal serves as a gateway to recovery rather than an endpoint, ultimately improving patient-centered outcomes and reducing future harms.
Carnevale et al.
ACKNOWLEDGMENTS
Impact of Bystander Naloxone on EMS Transport Refusal After Opioid Overdose
The authors wish to acknowledge the hard work and efforts of Connecticut first responders (EMS, fire and police) as well as the personnel at the Connecticut Poison Control Center without whom the SWORD project would not have been successful.
Address for Correspondence: Daniella M. Carnevale, title, University of Connecticut School of Medicine, 263 Farmington Ave, Farmington, CT 06030. Email: carnevale@uchc.edu.
Conflicts of Interest: By the WestJEM article submission agreement, all authors are required to disclose all affiliations, funding sources and financial or management relationships that could be perceived as potential sources of bias. No author has professional or financial relationships with any companies that are relevant to this study. There are no conflicts of interest or sources of funding to declare.
1. Spencer MR, Garnett MF, Miniño AM. Drug Overdose Deaths in the United States, 2002–2022. NCHS Data Brief. 2024;(491):1–8.
2. Gomes T, Murray R, Kolla G, et al. The burden of unintentional opioid toxicity deaths in the United States: a retrospective cross-sectional study. JAMA Netw Open. 2023;6(7):e232476.
3. Centers for Disease Control and Prevention. SUDORS Dashboard: Fatal Overdose Data. CDC Injury Center. Published 2022. Accessed September 16, 2025. https://www.cdc.gov/overdose-prevention/dataresearch/facts-stats/sudors-dashboard-fatal-overdose-data.html
4. Quast T, Storch EA, Yampolskaya S. Opioid prescription rates and child removals: evidence from Florida. Health Aff (Millwood). 2019;38(11):1849–1854.
5. Florence C, Luo F, Rice K. The economic burden of opioid use disorder and fatal opioid overdose in the United States, 2017. Drug Alcohol Depend. 2021;218:108350.
6. Ruetsch C. Prevalence and cost of prescription opioid abuse in the United States. Addict Behav. 2010;35(5):512–516.
7. U.S. Food and Drug Administration. FDA approves first over-thecounter naloxone nasal spray. FDA News Release. March 29, 2023. Accessed October 9, 2023. https://www.fda.gov/news-events/pressannouncements/fda-approves-first-over-counter-naloxone-nasal-spray
8. Office of the Surgeon General. U.S. Surgeon General’s Advisory on Naloxone and Opioid Overdose. Published April 3, 2018. Accessed October 9, 2023. https://www.hhs.gov/surgeongeneral/priorities/ opioids-and-addiction/naloxone-advisory/index.html
9. Freeman PR, Goodin A, Troske S, et al. The changing landscape of
naloxone availability in the United States, 2011–2017. Drug Alcohol Depend. 2018;191:361–364.
10. Adams JM. Increasing naloxone awareness and use. JAMA 2018;319(20):2073.
11. Giglio RE, Li G, DiMaggio CJ. Effectiveness of bystander naloxone administration and overdose education programs: a meta-analysis. Inj Epidemiol. 2015;2(1):10.
12. Walley AY, Xuan Z, Hackman HH, et al. Opioid overdose rates and implementation of overdose education and nasal naloxone distribution in Massachusetts: interrupted time series analysis. BMJ 2013;346:f174.
13. McDonald R, Strang J. Are take-home naloxone programmes effective? Systematic review utilizing application of the Bradford Hill criteria. Addiction. 2016;111(7):1177–1187.
14. Gage CB, Powell JR, Ulintz A, et al. Layperson-administered naloxone trends reported in emergency medical service activations, 2020–2022. JAMA Netw Open. 2024;7(10):e2439427.
15. Kline A, Mattern D, Cooperman N, et al. “A blessing and a curse:” opioid users’ perspectives on naloxone and the epidemic of opioid overdose. Subst Use Misuse. 2020;55(8):1280–1287.
16. Turley B, Zamore K, Holman RP. Predictors of emergency medical transport refusal following opioid overdose in Washington, DC. Addiction. 2024;119(7):1420–1430.
17. Bergstein RS, King K, Melendez-Torres GJ, et al. Refusal to accept emergency medical transport following opioid overdose, and conditions that may promote connections to care. Int J Drug Policy 2021;97:103296.
18. Boyd JJ, Kuisma MJ, Alaspä AO, et al. Recurrent opioid toxicity after pre-hospital care of presumed heroin overdose patients. Acta Anaesthesiol Scand. 2006;50(10):1266–1270.
19. Wampler DA, Molina DK, McManus J, et al. No deaths associated with patient refusal of transport after naloxone-reversed opioid overdose. Prehosp Emerg Care. 2011;15(3):320–324.
20. Levine M, Sanko S, Eckstein M. Assessing the risk of prehospital administration of naloxone with subsequent refusal of care. Prehosp Emerg Care. 2016;20(5):566–569.
21. Vilke GM, Sloane C, Smith AM, et al. Assessment for deaths in out-of-hospital heroin overdose patients treated with naloxone who refuse transport. Acad Emerg Med. 2003;10(8):893–896.
22. Willman MW, Liss DB, Schwarz ES, et al. Do heroin overdose patients require observation after receiving naloxone? Clin Toxicol (Phila). 2017;55(2):81–87.
23. Connecticut State Department of Public Health; Office of Emergency Medical Services; Connecticut Poison Control Center. Connecticut Statewide Opioid Reporting Directive (SWORD). Public Act No. 18166, Sec. 5. 2019.
24. Worster A, Bledsoe RD, Cleve P, et al. Reassessing the methods of medical record review studies in emergency medicine research. Ann Emerg Med. 2005;45(4):448–451.
25. Glenn MJ, Sternig S, Bentsen B, et al. Refusals after prehospital administration of naloxone during the COVID-19 pandemic. Prehosp
Impact of Bystander Naloxone on EMS Transport Refusal After Opioid Overdose Carnevale et al.
Emerg Care. 2020;25(5):648–655.
26. Williams K, Carhart E, Ching R, et al. Evidence-based guidelines for EMS administration of naloxone. Prehosp Emerg Care 2019;23(6):749–763.
27. Dasgupta N, Bell A, Visnich M, et al. Trends and characteristics during 17 years of naloxone distribution and administration through an overdose prevention program in Pittsburgh, Pennsylvania. PLoS One. 2025;20(10):e0315026.
28. Office of the Chief Medical Examiner. Connecticut Accidental Drug Intoxication Deaths. Hartford, CT: Office of the Chief Medical Examiner; 2025.
29. Cash RE, Kinsman J, Crowe RP, et al. Naloxone leave-behind programs for emergency medical services: a systematic review. Prehosp Disaster Med. 2021;36(2):228–235.
30. Eddie D, Hoffman L, Vilsaint C, et al. Lived experience in new models of care for substance use disorder: A systematic review of peer recovery support services and recovery coaching. Front Psychol 2019;10:1052.
31. Carroll GG, Solomon KT, Heil J, et al. Impact of administering buprenorphine to overdose survivors using emergency medical services. Ann Emerg Med. 2022;81(2):165–175.
32. Carroll GG, Wasserman DD, Shah AA, et al. Buprenorphine field initiation of rescue treatment by emergency medical services (Bupe
FIRST EMS)a A case series. Prehosp Emerg Care. 2021;25(2):289–293.
33. Simpson NS, Kummer TM, Drone HM, et al. Feasibility and safety of a paramedic-directed prehospital buprenorphine initiation protocol for acute opioid withdrawal. Prehosp Emerg Care. 2025;29(4):427–434.
34. Hern HG, Lara V, Goldstein D, et al. Prehospital initiation of buprenorphine treatment for opioid use disorder by paramedics: first year results of the EMS buprenorphine use pilot. Prehosp Emerg Care. 2023;27(3):334–342.
35. Carroll G, Solomon KT, Heil J, et al. Impact of administering buprenorphine to overdose survivors using emergency medical services. Ann Emerg Med. 2023;81(2):165–175.
36. Vance S, Doering PL, Wilson JD, et al. Naloxone distribution saturation required to reduce opioid overdose mortality: an evaluation of Missouri’s naloxone distribution, 2017–2023. J Subst Abuse Treat 2025;159:209590.
37. Centers for Disease Control and Prevention. Case Studies: Public Safety-Led Post-Overdose Outreach Programs. Atlanta, GA: U.S. Department of Health and Human Services, CDC; 2021. https://www. cdc.gov/overdose/prevention/programs/public-safety.html
38. Ulintz A, Cash RE, Panchal AR, et al. RREACT: a mobile multidisciplinary response to overdose in Franklin County, Ohio. Prev Med Rep. 2024;36:102422.
Original Research
Pilot Study Comparing Emergency Physician and Artificial Intelligence-supported Interpretations of Electrocardiograms
Mehmet Gün, MD
Section Editor: Anthony Lucero, MD
Maltepe University Faculty of Medicine, Department of Emergency Medicine, Istanbul, Türkiye
Submission history: Submitted June 21, 2025; Revision received December 20, 2025; Accepted December 12, 2025
Electronically published April 2, 2026
Full text available through open access at http://escholarship.org/uc/uciem_westjem DOI 10.5811/westjem.48718
Background: Artificial intelligence (AI) tools are increasingly being explored for medical applications; however, their effectiveness in emergency electrocardiogram (ECG) interpretation is underinvestigated. In this pilot study we aimed to evaluate the diagnostic performance of AI interpretation of ECGs by comparing its results to those of an experienced emergency physician.
Methods: We sourced 20 ECG cases representing common critical conditions from publicly available academic repositories—ST-elevation myocardial infarction, non-ST-elevation myocardial infarction, atrial fibrillation, supraventricular tachycardia, ventricular tachycardia, third-degree atrioventricular block, left and right bundle branch block, hyperkalemia, Brugada syndrome, Wellens syndrome, fusion beats, and torsades de pointes.The AI tool ChatGPT-4 and an experienced emergency physician, who served as the reference (gold standard) interpreter, independently analyzed each case across five key parameters: rhythm and heart rate; cardiac axis; ST/T segment changes; preliminary diagnosis; and emergency management recommendation. Full concordance was defined as complete agreement across all five parameters.
Results: Agreement between AI and the emergency physician was observed in 18 of 20 cases (90%). The Cohen kappa was 0.80, indicating substantial chance-corrected agreement. Concordance by diagnostic category was as follows: myocardial infarction (6/6, 100%); arrhythmias including atrial fibrillation, supraventricular tachycardia, and ventricular tachycardia (6/6, 100%); conduction disorders (3/3, 100%); and hyperkalemia (1/1, 100%). Among the atypical or complex ECGs, concordance was 1/1 (100%) for Brugada syndrome, 1/1 (100%) for Wellens syndrome, 0/1 (0%) for fusion beats, and 0/1 (0%) for torsades de pointes. In the torsades case, ChatGPT did not recommend intravenous magnesium sulfate—the standard first-line treatment—despite recognizing the condition.
Conclusion: An AI tool demonstrated moderate diagnostic concordance with one experienced emergency physician in interpreting some common ECG findings in the emergency setting. However, discrepancies, particularly in complex cases and critical management recommendations, highlight the need for larger scale investigations. Our findings from this pilot study do not support the independent use of AI for definitive ECG interpretation or emergency management decisions; it should serve as an adjunct tool that enhances rather than supplants human clinical judgment. [West J Emerg Med. 2026;27(3)597–604.]
INTRODUCTION
Interpreting electrocardiograms (ECG) in the emergency department (ED) is a standard yet critical task, as errors can
yield severe repercussions. In recent years, artificial intelligence (AI) techniques have been integrated into healthcare workflows as diagnostic support systems. In
emergency practice, the role of AI is swiftly broadening to include ECG interpretation, radiograph analysis, computed tomography evaluation, ultrasound image assessment, patient triage, and clinical documentation—all of which are essential for prompt and precise patient treatment.1,2 Artificial intelligence has primarily been evaluated in educational or theoretical settings. Nonetheless, its dependability in real-time emergency care remains ambiguous.3,4
Despite conjecture that AI tools could ultimately compete with or supplant human physicians in some diagnostic procedures, emergency treatment necessitates swift judgment, adaptive reasoning, and situational decision-making factors that may constrain the effective utility of existing AI systems. The potential of AI technology to assist with essential procedures, such as ECG interpretation in these contexts, remains questionable.5,6 The ECG is a rapid, readily available, and economical diagnostic instrument in the ED, essential for identifying acute coronary syndrome, arrhythmia, conduction abnormalities, and electrolyte imbalances. Notwithstanding its importance, the accuracy of interpretation may differ across clinicians due to their workload and experience.7
Beyond basic diagnoses, AI is being progressively employed in the ED to forecast patient deterioration, enhance bed allocation, and assist with administrative functions. This extensive application underscores its increasing significance for emergency care.8 Most current research on the AI tool ChatGPT (OpenAI, San Francisco, CA) has concentrated on factual inquiries or theoretical clinical scenarios, with less examination of its decision-making efficacy in real-world environments.9 In this study we aimed to evaluate the diagnostic accuracy and clinical significance of ECG interpretations produced by ChatGPT in comparison to those of a seasoned emergency physician, using diverse scenarios that reflect routine emergency practice.
METHODS
This study was designed as a pilot comparative diagnostic analysis to assess the ECG interpretation capabilities of ChatGPT-4 compared to those of an experienced emergency physician. We selected 20 theoretical ECGs from two academically certified, publicly accessible repositories (ECGpedia and The ECG Library)10,11 based on their relevance to emergency practice. These cases represent an array of patterns commonly observed in the ED, encompassing arrhythmias, ischemic alterations, conduction blocks, electrolyte imbalances, and life-threatening rhythms. Specifically, the dataset included the following:
• 3 conduction disorders (third-degree arterioventricular block, left bundle branch block, right bundle branch block)
Population Health Research Capsule
What do we already know about this issue?
Artificial intelligence tools like ChatGPT are being explored for medical use, but their reliability in emergency ECG interpretation remains uncertain.
What was the research question?
How does ChatGPT’s ECG interpretation performance compare to that of an experienced emergency physician?
What was the major finding of the study?
We observed 90% (18/20) concordance, with substantial agreement measured by the Cohen kappa (κ = 0.80).
How does this improve population health?
AI shows promise as an adjunct tool for ECG interpretation, potentially reducing delays in emergency settings when expert consultation is not available.
• 1 electrolyte abnormality (hyperkalemia)
• 4 atypical or complex cases (Brugada syndrome, Wellens syndrome, fusion beats, torsades de pointes).
Both ChatGPT and the emergency physician independently analyzed each ECG. The emergency physician’s interpretation served as the reference standard for comparison.
The ECG images were processed using ChatGPT directly, without any instructions or context. In each instance, ChatGPT was requested to assess five standardized diagnostic criteria: 1) rhythm and heart rate; 2) cardiac axis; 3) ST/T segment changes; 4) preliminary diagnosis; and 5) emergency management recommendation. The expert emergency physician in this study was board-certified with approximately 10 years of clinical experience. In addition to structured ECG training during residency, he has served as an instructor in ECG interpretation at various congresses and educational meetings. He currently works in high-volume EDs and interprets ECGs routinely in daily clinical practice. This level of expertise provided a reliable benchmark for comparison with AI-generated outputs. He visually analyzed each ECG without access to supplementary information. All responses produced by ChatGPT were preserved in their unaltered state. The study employed solely anonymized, publicly accessible theoretical ECG cases and did not incorporate actual patient data; therefore, it was deemed exempt from institutional review board approval.
Upon the completion of both evaluation sets, interpretations were compared individually for each case. We categorized cases exhibiting agreement across all five characteristics as having full concordance. Inconsistencies were further analyzed in the discussion section. Due to the characteristics of emergency medicine training, an experienced emergency physician is anticipated to be adept at interpreting and managing the types of ECG presented in this study, possessing extensive expertise and training in acute cardiac treatment. Additionally, all AI-generated responses were verified against the original case explanations and expert diagnoses from the source websites to guarantee consistency and diagnostic accuracy.
Electrocardiogram Data Acquisition and Preparation
The ECG images selected for each case were of high quality, with diagnostic features clearly visible. We chose these images carefully to ensure the accuracy and reliability of the assessments generated by the AI model. All ECGs were retrieved from publicly available educational platforms in web-compatible image formats (JPEG), as commonly presented for academic and clinical reference. The images were then directly uploaded to the ChatGPT interface for analysis by the GPT-4 model. No patient-identifying data or clinical metadata were used in the analysis.
Statistical Analysis
We calculated diagnostic concordance rates for each ECG category. To quantify the statistical reliability of the observed proportions, 95% confidence intervals were computed using the Wilson score method. This method was chosen due to its balanced performance and suitability for clinical diagnostic research, as it provides more accurate interval estimates for
binomial proportions, especially in studies with small sample sizes. We quantified inter-rater agreement between ChatGPT and the emergency physician using the Cohen kappa coefficient (κ) as a chance-corrected measure of concordance, complementing the percentage agreement in this pilot sample. The reporting of this diagnostic accuracy study adheres to the Standards for Reporting Diagnostic Accuracy Studies (STARD) 2015 guidelines. These guidelines ensure comprehensive and transparent reporting of methodology and results, enhancing the study’s reproducibility and generalizability. A completed STARD checklist is provided (Supplement File).
RESULT
Overall agreement, defined as total concordance across all five diagnostic parameters, was observed in 18 of 20 ECG cases (90%). The Cohen kappa was 0.80, indicating substantial chance-corrected agreement; however, due to the pilot nature of the study and its small sample size, the overall diagnostic concordance should be interpreted with caution. The two discordant cases involved complex ECG findings: one with fusion beats, and another with polymorphic ventricular tachycardia (torsades de pointes). In the latter, ChatGPT failed to recommend intravenous magnesium sulfate as the first-line treatment, highlighting both diagnostic and therapeutic discrepancies. The table summarizes concordance across ECG categories.
The AI interpretations for three ECG cases assessed in this work are depicted in Figures 1, 2, and 3 to demonstrate the model’s interpretative methodology.
Figures 3a and 3b illustrate the model’s detailed analysis, including recognition of a wide-complex tachycardia with rapid ventricular rate, extreme axis deviation, and absent discernible P
and an emergency physician in a study of electrocardiogram interpretation.
agreement observed; CI suggests sample size caution.
wide CI due to very small sample.
Consistent agreement; CI reflects limited cases.
wide CI from small sample,
concordance, with the CI reflecting the study’s pilot nature and sample size.
Table 1. Diagnostic concordance between the artificial intelligence tool
Figure 1. ChatGPT-4 interpretation of an electrocardiogram demonstrating an acute inferior ST-elevation myocardial infarction. Figures 1a and 1b illustrate the model’s detailed analysis, including identification of sinus rhythm, normal axis, ST elevations in leads II, III, and aVF, and reciprocal changes in aVL and V1-V2. The artificial intelligence tool also proposed appropriate emergency management in accordance with clinical standards consistent with the emergency physician’s assessment
Figure 1b. Initial portion of ChatGPT interpretation of the same electrocardiogram.
waves. The AI model erroneously described the rhythm as monomorphic ventricular tachycardia rather than torsades de pointes, and it failed to suggest intravenous magnesium sulfate, the standard first-line therapy for this condition. Instead, it proposed a generalized ventricular tachycardia management protocol. This case reflects both a diagnostic and therapeutic discrepancy, underscoring the model’s current limitations in managing rhythm-specific emergencies.
DISCUSSION
In this study we assessed the diagnostic precision and clinical applicability of ChatGPT-4, an AI-driven language model, by analyzing ECGs frequently found in emergency contexts. The model exhibited a notable level of diagnostic agreement, achieving 90% concordance with a seasoned emergency physician across various clinical presentations, including STEMI, atrial fibrillation, supraventricular tachycardia, Brugada syndrome, third-degree atrioventricular
Figure 2. ChatGPT interpretation of an electrocardiogram demonstrating atrial fibrillation. Figures 2a and 2b highlight the model’s identification of an irregularly irregular rhythm and the absence of visible P waves. The AI tool also proposed appropriate emergency management, including rate control, anticoagulation assessment, and consideration of cardioversion if clinically indicated. This interpretation was consistent with the emergency physician’s assessment.
block, and electrolyte disturbances such as hyperkalemia.
Zaboli et al12 assessed ChatGPT’s efficacy in ECG interpretation in the ED, reporting greater diagnosis accuracy for fundamental arrhythmias, but they observed diminished
Figure 3. ChatGPT-4 interpretation of an electrocardiogram demonstrating polymorphic ventricular tachycardia (torsades de pointes).
consistency in complex or high-risk scenarios. Recent research also explores AI’s role in improving acute myocardial infarction diagnosis. For instance, the Rule-Out Acute Myocardial Infarction Using Artificial Intelligence
Figure 3b. Initial portion of ChatGPT-4 interpretation for the same torsades de pointes electrocardiogram.
Electrocardiogram Analysis (ROMIAE) multicentre study by Min Sung Lee et al reported that AI-powered ECG (AI-ECG) had an area under the receiver operating curve (AUROC) of 0.878 for ruling out acute myocardial infarction, achieving 99% sensitivity for safely identifying low-risk patients and 90% specificity for high-risk patients. They also reported an AUROC of 0.951 for detecting STEMI in earlier validations. This aligns with our own study, where ChatGPT-4 also demonstrated agreement in identifying STEMI. These findings suggest that AI-driven systems may contribute to diagnostic consistency and could support care in urgent situations, especially when expert physicians aren’t immediately available.13 Similarly, Palermi et al have discussed the potential of AI in shaping a modern renaissance for electrocardiography, underscoring its pivotal role in advancing diagnostic capabilities.14
Agreement was more consistent in common emergency ECG patterns such as STEMI, atrial fibrillation, supraventricular tachycardia, Brugada syndrome, third-degree atrioventricular block, and hyperkalemia. In these scenarios, ChatGPT-4 generally identified key features and provided management suggestions aligned with emergency medicine principles. In this study, the two discordant cases—fusion
beats and torsades de pointes—were those involving nonstandard or morphologically complex patterns, supporting the trend of lower agreement in such categories.15,16 These discordant cases appeared to stem from the model’s difficulty in interpreting overlapping or non-standard waveform morphologies. Fusion beats require distinguishing simultaneous atrial and ventricular depolarization, a pattern that may not be easily captured through text-based pattern reasoning. Similarly, in torsades de pointes, the model did not prioritize IVintravenous magnesium sulfate as first-line therapy, indicating limitations in integrating rhythm-specific management principles.
One observed advantage was the AI model’s ability to recognize subtle ECG patterns. ChatGPT-4 correctly identified features such as the biphasic T waves associated with Wellens syndrome type B, a finding that can be challenging for non-specialist clinicians. These observations are consistent with findings by Harskamp and De Clercq,17 who demonstrated ChatGPT’s potential in evaluating cardiac symptoms and supporting clinical reasoning. Similarly, prior work on AI-assisted blood gas interpretation reported notable clinical alignment, highlighting the potential of AI as a supportive tool in emergency diagnostics.18
Figure 3a. Polymorphic ventricular tachycardia (torsades de pointes) electrocardiogram provided to ChatGPT as the input prompt.
Nonetheless, the current investigation revealed deficiencies in AI performance. Minor errors were observed, especially in the interpretation of infrequent or intricate patterns such as torsades de pointes and fusion beats. Although ChatGPT-4 accurately identified the architecture of polymorphic ventricular tachycardia, it did not discern key characteristics such as QT interval prolongation and the dynamic changes in waveforms. Moreover, it did not recommend IV magnesium sulfate, the primary treatment for torsades de pointes, but rather suggested a broad approach for managing ventricular tachycardia. These limitations highlight the model’s present deficiency in addressing nuanced or diagnosis-dependent arrhythmias and align with the overarching difficulties encountered by AI models in understanding unusual or morphologically nuanced clinical data, underscoring the necessity for ongoing model enhancement and exposure to a more varied array of training cases.19,20
In addition to their potential clinical applications, AI models such as ChatGPT may serve as supportive tools in medical education. They can assist junior physicians and medical trainees by offering prompt feedback, improving pattern identification, and facilitating systematic diagnostic reasoning in emergency situations. Recent research has also explored how AI technologies might contribute to learning environments and support diagnostic decision-making among less experienced practitioners.12,21
This work has practical implications for the prospective incorporation of AI-driven decision-support systems into ED operations. As of March 2025, the U.S. Food and Drug Administration (FDA) had approved 1,018 AI-enabled medical devices, including 104 designated for cardiovascular medicine. The growth of FDA-sanctioned AI technology is expected to continue, potentially supporting improvements in clinical decision-making and patient care.18,22 Moreover, integrating AI algorithms directly into ECG devices could offer real-time preliminary interpretations, potentially aiding patient care and reducing diagnostic delays. This method corresponds with the extensive use of AI in clinical medicine, focused on enhancing healthcare efficiency and patient outcomes.23 The emergence of multimodal large-language models, exemplified by ECG-LM developed by Yang et al, which can directly read raw ECG signals and amalgamate natural language with ECG data, underscores the prospective improvements in this domain. Integrated systems have the capacity to strengthen clinical decision-support mechanisms, potentially contributing to diagnostic precision and patient outcomes, especially in settings such as the ED.24
LIMITATIONS
This study has several limitations. The research was first conducted exclusively on theoretical ECG images, lacking access to clinical data, including patient history, vital signs, or laboratory results. In real emergency practice, ECG
interpretation is incorporated within a wider clinical context. Additionally, the interpretations were evaluated against those of a sole emergency physician, potentially introducing individual bias and constraining generalizability. Third, while the study encompassed a broad spectrum of prevalent situations, it excluded unusual or hereditary diseases, including arrhythmogenic right ventricular cardiomyopathy. Subsequent research should incorporate real-world patient data, multicenter collaboration, and assessment of AI integration into clinical workflows to more effectively validate and enhance these first findings.
CONCLUSION
The AI model ChatGPT-4 exhibited notable diagnostic agreement and clinical relevance in interpreting commonly encountered emergency ECG scenarios. Its ability to identify both common and subtle findings highlights its potential as a supportive decision-making tool in emergency medicine. Although minor inconsistencies were noted in rare and complex patterns, its overall consistent clinical suggestions reflect promising practical utility. The incorporation of AI tools into emergency department workflows may enhance diagnostic consistency, support physician confidence, and improve workflow efficiency. Artificial intelligence is best positioned to augment—not replace—human clinical judgment. Further validation through studies involving real-world patient data and prospective multicenter designs is essential to confirm these results and support safe clinical implementation.
Address for Correspondence: Mehmet Gün, MD, Maltepe University Faculty of Medicine, Department of Emergency Medicine, Bağlarbaşı,Feyzullah Cd. No:39, 34844 Maltepe/ Istanbul, Turkiye, 34857. Email: mehmet.gun@maltepe.edu.tr
Conflicts of Interest: By the WestJEM article submission agreement, all authors are required to disclose all affiliations, funding sources and financial or management relationships that could be perceived as potential sources of bias. No other author has professional or financial relationships with any companies that are relevant to this study. There are no conflicts of interest or sources of funding to declare.
1. Brin D, Sorin V, Barash Y, et al. Assessing GPT-4 multimodal performance in radiological image analysis. Euro Radiol. 2025;35(4):1959–1965.
2. Huang T, Safranek C, Socrates V, et al. Patient-representing population’s perceptions of GPT-generated versus standard emergency department discharge ınstructions: randomized blind
Study Comparing EP and AI-supported Interpretations of Electrocardiograms
survey assessment. J Med Internet Res. 2024;26:e60336.
3. Topol EJ. High-performance medicine: the convergence of human and artificial intelligence. Nat Med. 2019;25(1):44–56.
4. Wang F, Casalino LP, Khullar D. Deep learning in medicine—promise, progress, and challenges. JAMA Intern Med. 2019;179(3):293–294.
5. Ishida K, Hanada, E. ChatGPT (GPT-4V) Performance on the healthcare ınformation technologist examination in japan. Cureus. 2025;17(1):e76775.
6. Altamimi I, Altamimi A, Alhumimidi AS, et al. Artificial intelligence (AI) chatbots in medicine: a supplement, not a substitute. Cureus. 2023;15(6):e40922.
7. Johnson KW, Torres Soto J, Glicksberg BS, et al. Artificial intelligence in cardiology. J Am Coll Cardiol. 2018;71(23):2668–2679.
8. Chang CH, Chen CJ, Ma YS, et al. Real-time artificial intelligence predicts adverse outcomes in acute pancreatitis in the emergency department: comparison with clinical decision rule. Acad Emerg Med. 2024;31(2):149-155.
9. Halaseh FF, Yang JS, Danza CN, et al. ChatGPT’s role in ımproving education among patients seeking emergency medical treatment. West J Emerg Med. 2024;25(5):845-855.
10. ECGpedia. Electrocardiography learning resource. Available at: https://www.ecgpedia.org. Accessed March 15, 2025.
11. Life in the Fast Lane. ECG library. Available at: https://litfl.com/ ecg-library. Accessed March 15, 2025.
12. Zaboli A, Brigo F, Ziller M, et al. Exploring ChatGPT’s potential in ECG interpretation and outcome prediction in emergency department. Am J Emerg Med. 2025;88:7-11.
13. Lee, M. S., Shin, T. G., Lee, Y., et al. Artificial intelligence applied to electrocardiogram to rule out acute myocardial infarction: the ROMIAE multicentre study. Eur Heart J. 2025;46(20):1917-1929.
14. Palermi S, Vecchiato M, Ng FS, et al. Artificial intelligence and the electrocardiogram: a modern renaissance. Eur J Intern Med. 2025;140:106329.
15. Kraik K, Dykiert IA, Niewiadomska J, et al. The most common errors in automatic ECG interpretation. Front Physiol. 2025;16:1590170.
16. Adewole KS, Mojeed HA, Ogunmodede JA, et al. Expert system and decision support system for electrocardiogram interpretation and diagnosis: review, challenges and research directions. Appl Sci. 2022;12(21):11030.
17. Harskamp RE, De Clercq L. Performance of ChatGPT as an AI-assisted decision support tool in medicine: a proof-of-concept study for interpreting symptoms and management of common cardiac conditions (AMSTELHEART-2). Acta Cardiol. 2024;79(3):358-366.
18. Turan Eİ, Baydemir AE, Balıtatlı AB, et al. Assessing the accuracy of ChatGPT in interpreting blood gas analysis results ChatGPT-4 in blood gas analysis. J Clin Anesth. 2025;102:111787.
19. Matsuura C, Kato T, Koyama K. Successful management of refractory torsades de pointes due to drug-ınduced long QT syndrome guided by point-of-care monitoring of ıonized magnesium. Cureus. 2021;13(3):e13939.
20. Tison GH, Sanchez JM, Ballinger B, et al. Passive detection of atrial fibrillation using a commercially available smartwatch. JAMA Cardiol. 2018;3(5):409-416.
21. Wu Y, Zheng Y, Feng B, et al. Embracing ChatGPT for medical education: exploring ıts ımpact on doctors and medical students. JMIR Med Educ. 2024;10:e52483.
22. U.S. Food and Drug Administration. Artificial Intelligence and Machine Learning (AI/ML)-enabled Medical Devices. Available at: https://www.fda.gov/medical-devices/software-medical-device-samd/ artificial-intelligence-and-machine-learning-aiml-enabled-medicaldevices. Accessed March 15, 2025.
23. Xu N, Yang D, Arikawa K, Bai C. Application of artificial intelligence in modern medicine. Clin eHealth. 2023;6:130-137.
24. Yang K, Hong M, Zhang J, et al. ECG-LM: Understanding electrocardiogram with a large language model. Health Data Science. 2025;5:0221.
Unequal Relief: Sex Disparities in Opioid Use for Cardiac Chest Pain in the Emergency Department
Jeffrey Druck, MD*
Dilan Al Kurdi, MD*
Mohamed Shubair‡
Radi Ahlat, BSc§
Taryn Tenaya Hunt-Smith, MD†
Raed Darwish, MD||
Emad Awad, PhD*#
University of Utah, School of Medicine, Department of Emergency Medicine, Salt Lake City, Utah
University of Utah, School of Medicine, Salt Lake City, Utah
University of British Columbia, School of Medicine, Vancouver, British Columbia, Canada
University of Utah, Department of Psychology, Salt Lake City, Utah
Ain Shams University, School of Medicine, Cairo, Egypt
University of British Columbia, Department of Emergency Medicine, British Columbia Resuscitation Research Collaborative, Vancouver, British Columbia
Section Editor: Elif Yucebay, MD
Submission history: Submitted August 8, 2025; Revision received January 2, 2026; Accepted January 4, 2026
Electronically published April 8, 2026
Full text available through open access at http://escholarship.org/uc/uciem_westjem DOI 10.5811/westjem.50599
Introduction: Acute chest pain, commonly caused by coronary artery disease, is a frequent reason for emergency department (ED) visits. While sex disparities in the evaluation and treatment of chest pain are well known, there is limited research on sex differences in the use of opioid analgesics for this condition in the ED. In this study we aimed to evaluate sex differences in the administration of opioid analgesics (morphine and fentanyl) and to compare the time to medication administration in patients presenting with acute cardiac chest pain.
Methods: This retrospective observational study included adult patients (≥ 18 years of age) presenting with acute cardiac chest pain and confirmed elevated troponin between 2019–2024. The primary outcome was receipt of intravenous (IV) morphine and/or IV fentanyl. The secondary outcome was time from medication order to administration. For male vs female comparisons, we used t-tests or Mann-Whitney U tests for continuous variables, and chi-square tests for categorical variables. Logistic and linear regression analyses were performed to assess sex differences in opioid administration and time to medication, adjusting for potential confounders.
Results: A total of 2,168 patients were included in the study, with 924 females (42.6%). Among morphine recipients, the median initial IV morphine dose was 5 mg (interquartile range [IQR] 4-5 mg; range 2-6 mg). Males had higher adjusted odds of receiving morphine compared to females (adjusted odds ratio [OR] 1.28, 95% CI, 1.04–1.57, P = .02). Females had a longer unadjusted time from order to morphine administration (median 11 minutes [IQR 6-20] vs 9 minutes [IQR 4-17]; P = .003). Time to fentanyl administration did not differ by sex. In adjusted analyses, there were no significant sex differences in time to morphine or fentanyl administration.
Conclusion: This study identifies significant sex disparities in the administration of morphine to patients with acute chest pain. After adjusting for other factors, male patients had higher odds of receiving IV morphine compared to females. These findings highlight the need for further research to understand the underlying causes of these disparities and to develop strategies to ensure equitable chest pain management in the ED. [West J Emerg Med. 2026;27(3)605–613.]
INTRODUCTION
Acute chest pain is a common presenting symptom of coronary artery disease and myocardial infarction (MI), ranking among the top chief complaints in the emergency department (ED), with approximately half of the cases occurring in females.1,2 Numerous studies have documented sex disparities in the evaluation and treatment of chest pain in EDs.2-4 An analysis using data from the U.S. Centers for Disease Control and Prevention’s National Hospital Ambulatory Medical Care Survey (2014–2018) found that women presenting with chest pain experienced longer wait times and were less likely to receive electrocardiograms than men.2 Similarly, among over one million patients with acute coronary syndromes (ACS), women experienced longer delays from symptom onset to first medical contact and were less likely to receive statins, dual antiplatelet therapy, or percutaneous coronary intervention (PCI).4,5 Additional evidence has shown that women are less likely to undergo troponin testing6 or receive essential cardiac medications, including beta-blockers, lipid-lowering agents, and ACE inhibitors at discharge.7 Disparities in emergency care for women have also been reported in other cardiovascular emergency conditions such as cardiac arrest8,9 and atrial fibrillation.10
Previous studies have examined sex differences in the diagnostic and procedural management of chest pain in the ED, including delays in physician evaluation, cardiac enzyme testing, and receipt of invasive procedures such as PCI or discharge medications.2-4,6,11,12 While sex disparities in pain management have been documented more broadly, research specifically addressing disparities in opioid analgesia for cardiac chest pain in North American EDs remains limited.
Morphine and fentanyl are commonly used opioids for treating acute chest pain in ACS. Current guidelines recommend both as first-line options for patients with ongoing ischemic pain that is unresponsive to anti-ischemic therapy.13 Fentanyl is increasingly used as an alternative, particularly in patients with contraindications to morphine, such as hypotension or morphine intolerance.13-15 Our primary objective in this study was to evaluate sex differences in the administration of opioid analgesics, specifically morphine and fentanyl, in ED patients presenting with acute chest pain. The secondary objectives were to compare time to opioid administration and describe and compare key baseline and process measures, including triage acuity, door-to-doctor time, disposition, and nitroglycerin use by sex.
METHODS
Setting and Population
This was a retrospective observational study conducted in the ED of the University of Utah Hospital, a tertiary academic medical center in Salt Lake City, Utah, with approximately 62,000 annual visits. The study site uses the high-sensitivity troponin I (hs-TnI) assay, with elevated troponin defined as
Population Health Research Capsule
What do we already know about this issue?
Sex disparities exist in cardiac care, but evidence regarding opioid use for chest pain in the emergency department (ED) is limited.
What was the research question?
Do sex differences exist in opioid administration for cardiac chest pain in the ED?
What was the major finding of the study?
Males had higher adjusted odds of receiving morphine (aOR 1.28, P =.02) but not fentanyl.
How does this improve population health?
This study highlights a potential bias in analgesic choice, advocating for standardized protocols to ensure equitable pain relief for all chest pain patients.
values > the 99th percentile upper reference limit (URL): > 34 nanograms per liter (ng/L) for men and > 16 ng/L for women, per manufacturer guidelines. Patients were included if they met the following criteria: 1) age ≥ 18 years; 2) triage documentation of “acute chest pain” as the chief complaint (reflecting patient-reported symptom onset within hours to days, without a fixed threshold); 3) a final ED discharge diagnosis consistent with ACS or MI (eg, ST-elevated myocardial infarction (STEMI), NSTEMI, unstable angina, MI) as reported in the ED discharge report or admission diagnosis; and 4) at least one elevated troponin level measured during the ED encounter. Exclusion criteria were as follows: patients with elevated troponin attributable to chronic kidney disease, sepsis, heart failure, and trauma-related chest pain; patients with documented allergies to morphine or fentanyl; and patients with missing data on sex or other key variables. For individuals with multiple visits for chest pain during the study period, only the first visit was included. We operationalized the ACS/MI status using the recorded final ED discharge diagnosis (and associated diagnosis terms/ codes) at the time of ED disposition (ED discharge or hospital admission). We did not perform independent adjudication beyond the recorded ED diagnosis.
Data Collection and Variable of Interest
Patient data were extracted from electronic health records (EHR). Variables included demographics (age, sex, race/ ethnicity), vital signs, Emergency Severity Index (ESI) triage
level, ED length of stay, door-to-doctor time, administration of opioid analgesics, and time from medication order to administration. The main independent variable was sex (male vs female). Sex was defined using the administrative sex field in the EHR, which is typically based on governmentissued identification or insurance information. The primary outcome was the administration (yes/no) of intravenous (IV) morphine and IV fentanyl. The secondary outcome was the time (in minutes) from medication order to administration. This retrospective chart review adhered to key methodological standards recommended by Worster et al (2005),16 including defining clear inclusion and exclusion criteria, using a standardized abstraction form, training data abstractors, blinding abstractors to the study objective and hypothesis, monitoring performance, and identifying the medical record database. This study was deemed exempt from institutional review board (IRB) review by the University of Utah (IRB: 00094185) as it involved secondary analysis of de-identified data and posed minimal risk to patients.
Statistical Analysis
We summarized baseline characteristics for the overall cohort and by sex. Continuous variables were presented as means with standard deviations (SD) or medians with interquartile ranges (IQR), depending on the distribution. Categorical variables were summarized as frequencies and percentages. We performed group comparisons using independent samples t-tests or MannWhitney U tests for continuous variables and chi-square tests for categorical variables.
For patients who received morphine, we extracted the initial administered IV morphine dose from the medication administration record and summarized it descriptively using the median (IQR) and range. To examine the association between sex and medication administration, logistic regression was used for binary outcomes (eg, whether opioids were administered). For continuous outcomes (eg, time to medication administration), we used linear regression. Prior to conducting multivariable regression, all assumptions, including multicollinearity among independent variables,17–19 were assessed. We used a forward selection approach to build adjusted models from candidate covariates, prioritizing clinically relevant variables and those associated with outcomes in unadjusted analyses. Model fit for both logistic and linear regression models was evaluated using the Akaike Information Criterion (AIC).20 The specific covariates included in each adjusted model are detailed in Tables 2-4. Because time-to-administration outcomes were right skewed, we conducted a sensitivity analysis using a generalized linear model with a gamma distribution and log link; exponentiated coefficients were interpreted as ratios of mean time.
As a sensitivity analysis, we repeated the regression analyses after excluding patients who were discharged directly from the ED and those who left against medical advice, as they were presumed to be clinically stable and less likely
to require opioid analgesia. We also excluded patients who were acuity level 1 and/or died in the ED, as they were likely unconscious or critically ill and, therefore, unlikely to receive analgesia. All statistical tests were two-sided, with a significance level set at P < .05. Analyses were performed using SPSS Statistics v30 (IBM Corporation, Armonk, NY).
RESULTS
Baseline Characteristics, Process Measures, and Unadjusted Outcomes
We included 2,168 patients in the analysis: 1,244 males (57.4%) and 924 females (42.6%). Overall, 925 (42.7%) received IV morphine; among morphine recipients, the median initial IV dose was 5 mg (IQR 4-5 mg; range 2-6 mg). In line with our secondary objective to describe process measures, key differences by sex were observed (Table 1). Compared to males, females experienced longer door-todoctor times (median 15.8 vs 13.7 minutes, P < .001), were less frequently triaged as high acuity (Level 1/2: 35.8% vs. 51.0%, P < .001), and were admitted less often (83.1% vs 85.9%, P < .01). Females were also less likely to receive sublingual nitroglycerin (37.6% vs 48.7%, P < .001) and had longer delays in receiving both nitroglycerin and morphine. No significant sex differences were observed in crude opioid administration rates (Table 1).
Adjusted
Results
Association Between Sex and Morphine Administration
The unadjusted comparison for the primary outcome showed no significant sex difference in morphine administration (42.0% vs 43.6%, P = .24; crude OR 0.94). However, the differences in baseline and process measures described above, particularly the marked disparity in triage acuity, represented significant potential confounders. To test the independent association of patient sex with opioid administration, we performed multivariable regression. After adjusting for these demographic and clinical variables, male sex was associated with significantly higher odds of receiving morphine (adjusted OR 1.28, 95% CI, 1.04-1.57, P = .02). In addition to male sex, higher triage acuity levels were significantly associated with morphine administration. The analysis also showed that receiving nitroglycerin prior to morphine was strongly associated with a reduced likelihood of morphine use (OR 0.08, 95% CI, 0.06-0.09, P < .001), indicating a 92% reduction in the odds of receiving morphine when nitroglycerin was administered first (Table 2).
Association between sex and fentanyl administration
The multivariable logistic regression analysis revealed that male sex was not significantly associated with receiving fentanyl in the crude model (crude OR 1.06, 95% CI, 0.81-1.39, P = .67). After adjusting for other variables, the association remained non-significant (adjusted OR 0.92, 95% CI, 0.69-1.22, P = .56) (Table 2).
Table 1. Demographics in a retrospective study of adults presenting to the emergency department with cardiac chest pain in a study of sex disparities in the administration of morphine to patients with acute chest pain.
Race/Ethnicity (N, %)
(n, %)
SD, standard deviation; BMI, body mass index; SBP, systolic blood pressure; HR, heart rate; RR, respiratory rate; IQR, interquartile range; LOS, length of stay; MD, Doctor of Medicine; DO, Doctor of Osteopathic Medicine; SL, sublingual; IV, intravenous.
Subgroup Analysis
In this subgroup analysis, we excluded 210 patients from the original sample of 2,168: 168 who were discharged directly from the ED; 10 who died in the ED (the majority of whom were triage level 1); and 32 who left against medical advice. These patients were excluded because they were either clinically stable (those discharged from the ED) or not suitable candidates for opioid analgesia (those who died in the ED). We included the remaining 1,958 patients (1,147 males and 811 females) in the analysis.
Table 2. Crude and adjusted associations between sex and opioid administration in a study of sex disparities in the administration of morphine to patients with acute chest pain in the emergency department.
Race (Ref: White)
Acuity (Ref: Level 1)
prior to opioid
(0.06-0.09)
(0.02-0.05)
OR, odds ratio; Ref, reference category; BMI, body mass index; SBP, systolic blood pressure; HR, heart rate; RR, respiratory rate; APP, advanced practice practitioner; MD, Doctor of Medicine; DO, Doctor of Osteopathic Medicine; IV, intravenous.
The results revealed a significant association between sex and the odds of receiving IV morphine. Specifically, male sex was associated with a significantly higher OR of 1.30 (95% CI, 1.05-1.62, P = .02). This indicates that male patients are 30% more likely to receive IV morphine compared to female patients after adjusting for other factors (Table 3). These findings are consistent with the primary analysis in both the direction and magnitude of the relationship between sex and receiving IV morphine. The subgroup analysis also showed that male sex was not significantly associated with the odds of receiving IV fentanyl (OR 1.10; 95% CI, 0.80-1.49; P = .56), indicating no substantial difference between male and female patients (Table 3). These findings are also consistent with the primary analysis results.
Time to Morphine
The multivariable linear regression analysis showed that, in the unadjusted model, males had a non-significantly shorter time to morphine administration (B = -2.16 minutes, 95% CI, -4.94–0.63, P = .13). This suggests that, on average, male patients received morphine 2.16 minutes sooner than female patients, although this difference was not statistically significant. After adjusting for covariates, the association between sex
and morphine administration time remained non-significant (B = -2.56 minutes, 95% CI, -5.43–0.31, P = .08) (Table 4). In a sensitivity analysis using a generalized linear model with a gamma distribution and log link, results were consistent (female vs male ratio 1.14, 95% CI, 0.92-1.40, P = .24).
Time to Fentanyl
The analysis also demonstrated that males had a shorter time to fentanyl administration than females (unadjusted B = –2.62, 95% CI, -9.72–4.48, P = .47). This difference was not statistically significant. After adjusting for clinically relevant variables, the association remained non-significant (B = -1.91, P = .64), indicating no meaningful sex-based difference in time to fentanyl administration (Table 4). Gamma (log-link) sensitivity analyses yielded similar conclusions.
All assumptions for linear and logistic regression were tested and met. The models were then optimized using the AIC, with the final models having the lowest AIC values, indicating an improved fit compared to the other initial models.
DISCUSSION
This study reveals a two-stage sex disparity in the
Table 3. Crude and adjusted associations between sex and opioid administration in subgroup analyses (n = 1,958) in a study of sex disparities in the administration of morphine to patients with acute chest pain.
(Ref: White)
Acuity (Ref: Level 2)
(0.06-0.11)
OR, odds ratio; Ref, reference category; BMI, body mass index; SBP, systolic blood pressure; HR, heart rate; RR, respiratory rate; APP, advanced practice practitioner; MD, Doctor of Medicine; DO, Doctor of Osteopathic Medicine; IV, intravenous.
Table 4. Crude and adjusted association between sex and time to opioids administration in a study of sex disparities in the administration of morphine to patients with acute chest pain.
Male sex (unadjusted) -2.16 (-4.94, -0.63) .13
(-9.72, 4.48) .47 Male sex (adjusted) -2.56 (-5.43, -0.31) .08
Race (Ref: White)
or Latino
Unreported / Unknown
(-0.02; -0.16) .15
(-9.53, -7.66)
(-5.37, -7.52)
(-7.72, -1.07) .14
(-11.02, -9.93)
(-6.17, -7.34) .87
(-0.29, -0.12) .43
(-9.96, 6.15) .64
(-20.90, 12.93) .68
(-24.34, 6.75) .24
(-7.2, 16.83) .40
(-15.38, 13.98) .93
(-24.31, 9.58) .33
(-0.28, 0.41) .71 Door-to-doctor time
(0.006, -0.06)
(-0.02, -0.25)
(-0.13,-0.21)
(-1.52, -0.19) .13
prior to opioids
(-9.25, -1.99) .21
(-0.05, 0.19)
(-0.11, 0.20)
(-1.61,-0.04) .04
(-24.19. 7.85) .31
B Coef, regression coefficient; Ref, reference category; BMI, body mass index; SBP, systolic blood pressure; HR, heart rate; RR, respiratory rate; APP, advanced practice practitioner; MD, Doctor of Medicine; DO, Doctor of Osteopathic Medicine.
emergency care of ACS. First, women were significantly less likely to be triaged as high acuity. Second, and critically, after adjusting for this and other clinical factors, male sex was independently associated with higher odds of receiving morphine. This suggests that bias may affect both the initial assessment of severity and the subsequent analgesic choice for patients at similar clinical urgency.
The subgroup analysis (excluding patients who were discharged, left against medical advice, or died in the ED) yielded results consistent with the primary analysis. While triage acuity differed by sex, adjusting for acuity showed that disparities in morphine use were not fully explained by clinical severity. Some residual confounding may remain. By focusing on a clinically homogeneous cohort, we minimized misclassification bias common in prior studies involving heterogeneous populations, 3,6,21 enhancing confidence in our findings. Nonetheless, further research is needed across diverse settings to confirm these results.
Importantly, fentanyl use did not differ significantly between sexes in either unadjusted or adjusted models. This suggests that women who did not receive morphine often received fentanyl instead, indicating the disparity may lie in the choice of opioid rather than overall analgesia. A randomized controlled trial from 2016 found no difference in pain scores or hypotension between groups receiving fentanyl and morphine.22 The 2025 American College of Cardiology/ American Heart Association Joint Committee on Clinical Practice Guidelines recommends morphine or fentanyl as comparable agents in pain relief for acute coronary syndrome only after administration of other anti-ischemic medications.13 Thus, the fact that fentanyl use did not differ between sexes likely does not lie in differences in nationwide protocol, although it may reflect a more standardized application of fentanyl protocols at certain institutions or consistent clinicians’ preferences for fentanyl in specific emergency clinical scenarios, regardless of patient sex. It is also noteworthy that the overall use of fentanyl was lower than that of morphine. The overall lower use of fentanyl compared to morphine should be considered when interpreting this pattern.
These findings align with prior research showing sex-based disparities in treatment, including underuse of ACE inhibitors7 and statins 23 in women. Several factors may contribute to such disparities: implicit bias in clinical decision-making; diagnostic uncertainty due to atypical presentations in women24,25; and clinician perceptions about opioid risk or pain tolerance. Prior studies have shown that clinicians often underestimate women’s pain, recommending psychological rather than pharmacologic treatment.26 In related ACS chest-pain work, opioid-prescribing patterns were not meaningfully different after adjustment and appeared to be driven more by clinical/process factors than clinician characteristics.27 It is worth noting that our analysis revealed a significant association between prior nitroglycerin use and reduced morphine administration, likely reflecting protocols
that prioritize nitroglycerin for ischemic chest pain before escalating to opioids.13 Our analysis also showed that there were no significant sex differences in the time to morphine or fentanyl administration. While males received morphine and fentanyl slightly earlier than females, these differences were not statistically significant, even after adjusting for relevant variables.
The recommendation of this study includes incorporating educational sessions for healthcare clinicians to raise awareness about sex and gender bias in pain management. These sessions should focus on recognizing implicit bias, standardizing pain assessment protocols, and promoting equitable care to ensure all patients receive it. Educational sessions should stress equitable pain management despite diagnostic uncertainty. While distinguishing anxiety from ACS is important, clinicians must prioritize treating pain based on clinical presentation rather than waiting for confirmatory tests like troponin, which can delay analgesia, especially in women with atypical symptoms. Finally, consistent with other studies,28,29 Asian and Native American patients showed a trend toward lower rates of morphine administration, although small sample sizes limit definitive conclusions.
LIMITATIONS
This study has several limitations. As a single-center, retrospective analysis, the findings may not be generalizable to other settings. Reliance on EHR data limits the ability to capture nuanced clinical decision-making or physicians’ rationale for medication use. Additionally, ACS/MI status was based on the recorded final ED discharge diagnosis rather than prospective adjudication; thus, misclassification was possible. Differential misclassification may occur if atypical presentations (more common among women) are less likely to be labeled ACS/MI, potentially influencing cohort inclusion and treatment patterns. Neither were we able to account for patient-reported pain scores, which may have influenced analgesic use. We lacked direct measures of ED crowding (eg, ED census/occupancy) and shift-level workload; therefore, residual confounding related to time-of-day/day-of-week variation and ED busyness may remain.
Further, we were unable to account for clinician-level variables such as years of experience. Additionally, although we adjusted for multiple confounders, residual confounding may still be present. Finally, our study did not assess the impact of morphine administration on patient-centered outcomes such as infarct size or survival, which prior research has shown to have minimal or no benefit in ACS.30–33
CONCLUSION
In this retrospective cohort of patients presenting with acute chest pain and confirmed ACS, male patients had significantly greater adjusted odds of receiving IV morphine compared to females. However, no significant sex differences were observed in fentanyl administration or in the time to
Sex Disparities in Opioid Use for Cardiac Chest Pain in ED
receive either morphine or fentanyl. Although unadjusted analyses suggested a small (~ two minutes) difference in time to morphine administration, adjusted models (including gamma sensitivity analyses) showed no significant sex difference; therefore, any clinical significance is uncertain, and we did not assess downstream patient-centered outcomes. These findings suggest the need for increased awareness of potential sex and gender bias in pain management in the ED and advocate for further research to standardize analgesia protocols, ensuring equitable care for all patients.
7. Bugiardini R, Yan AT, Yan RT, et al. Factors influencing underutilization of evidence-based therapies in women. Eur Heart J. 2011;32(11):1337-44.
8. Paratz ED, Nehme E, Heriot N, et al. Sex disparities in bystander defibrillation for out-of-hospital cardiac arrest. Resusc Plus. 2024;17:100532.
9. Awad E, Humphries K, Grunau B, et al. Effect of sex and age on return of spontaneous circulation and survival to hospital discharge in out-of-hospital cardiac arrest: a retrospective analysis of a Canadian population. Resusc Plus. 2021;5:100084.
10. Rosychuk RJ, Holroyd BR, Zhang X, et al. Sex differences in outcomes after discharge from the emergency department for atrial fibrillation/flutter. Can J Cardiol. 2017;33(6):806-13.
Address for Correspondence: Emad Awad, PhD, University of Utah, School of Medicine, Department of Emergency Medicine, 30 N Mario Capecchi Dr, HELIX 2 South, Salt Lake City, Utah, 84112. Email: emad.awad@utah.edu.
Conflicts of Interest: By the WestJEM article submission agreement, all authors are required to disclose all affiliations, funding sources and financial or management relationships that could be perceived as potential sources of bias. No author has professional or financial relationships with any companies that are relevant to this study. There are no conflicts of interest or sources of funding to declare.
1. Cardoso R, Shaw LJ, Blumenthal RS, et al. Preventive cardiology advances in the 2021 AHA/ACC chest pain guideline. Am J Prev Cardiol. 2022;11:100365.
2. Banco D, Chang J, Talmor N, et al. Sex and race differences in the evaluation and treatment of young adults presenting to the emergency department with chest pain. J Am Heart Assoc. 2022;11(10):e024199.
3. Dawson LP, Nehme E, Nehme Z, et al. Sex differences in epidemiology, care, and outcomes in patients with acute chest pain. J Am Coll Cardiol. 2023;81(10):933-45.
4. Zhou S, Zhang Y, Dong X, et al. Sex disparities in management and outcomes among patients with acute coronary syndrome. JAMA Netw Open. 2023;6(10):e2338707.
5. Tavris D, Shoaibi A, Chen AY, et al. Gender differences in the treatment of non–ST-segment elevation myocardial infarction. Clin Cardiol. 2010;33(2):99-103.
6. Mnatzaganian G, Hiller JE, Braitberg G, et al. Sex disparities in the assessment and outcomes of chest pain presentations in emergency departments. Heart. 2020;106(2):111-18.
11. Steenblik J, Smith A, Bossart CS, et al. Gender disparities in cardiac catheterization rates among emergency department patients with chest pain. Crit Pathw Cardiol. 2021;20(2):67-70.
12. Humphries KH, Lee MK, Izadnegahdar M, et al. Sex differences in diagnoses, treatment, and outcomes for emergency department patients with chest pain and elevated cardiac troponin. Acad Emerg Med. 2018;25(4):413-24.
13. Rao SV, O’Donoghue ML, Ruel M, et al. 2025 ACC/AHA/ACEP/ NAEMSP/SCAI guideline for the management of patients with acute coronary syndromes. Circulation. 2025;151(13).
14. Ghadban R, Enezate T, Payne J, et al. Safety of morphine use in acute coronary syndrome: a meta-analysis. Heart Asia. 2019;11(1):e011142.
15. Gallagher A, Maria S, Micalos P, et al. Effect of fentanyl compared with morphine on pain score and cardiorespiratory vital signs in outof-hospital adult STEMI patients. Int J Paramedicine. 2024;7:10-22.
16. Worster A, Bledsoe RD, Cleve P, et al. Reassessing the methods of medical record review studies in emergency medicine research. Ann Emerg Med. 2005;45(4):448-51.
17. Johnston R, Jones K, Manley D. Confounding and collinearity in regression analysis: a cautionary tale and an alternative procedure. Qual Quant. 2018;52(4):1957-76.
18. Katz MH. Assumptions of multiple linear regression, multiple logistic regression, and proportional hazards analysis. In: Katz MH, ed. Multivariable Analysis. Cambridge University Press; 2006:38-67.
19. Allison PD. Multiple Regression: A Primer. Pine Forge Press; 1999.
20. Akaike H. Information theory and an extension of the maximum likelihood principle. In: Parzen E, Tanabe K, Kitagawa G, eds. Selected Papers of Hirotugu Akaike. Princeton, NJ: Springer Publishing Company; 1998:199-213.
21. Chen EH, Shofer FS, Dean AJ, et al. Gender disparity in analgesic treatment of emergency department patients with acute abdominal pain. Acad Emerg Med. 2008;15(5):414-18.
22. Weldon ER, Ariano RE, Grierson RA. Comparison of fentanyl and morphine in the prehospital treatment of ischemic type chest pain. Prehosp Emerg Care. 2016;20(1):45-51.
23. Nanna MG, Wang TY, Xiang Q, et al. Sex differences in the use of statins in community practice. Circ Cardiovasc Qual Outcomes. 2019;12(8):e005562.
24. Humphries KH, Izadnegahdar M, Sedlak T, et al. Sex differences in cardiovascular disease: impact on care and outcomes. Front Neuroendocrinol. 2017;46:46-70.
25. Regitz-Zagrosek V, Gebhard C. Gender medicine: effects of sex and gender on cardiovascular disease manifestation and outcomes. Nat Rev Cardiol. 2023;20(4):236-47.
26. Schäfer G, Prkachin KM, Kaseweter KA, et al. Health care providers’ judgments in chronic pain: influence of gender and trustworthiness. Pain. 2016;157(8):1618-25.
27. Laughter C, Alsayyed A, Shubair M, et al. Comparing physician and advanced care provider use of opioids for treatment of acute chest pain in the emergency department. Am J Emerg Med. 2026:99:110-3.
28. Benzing AC, Bell C, Derazin M, et al. Disparities in opioid pain management for long bone fractures. J Racial Ethn Health
Disparities. 2020;7(4):740-45.
29. Dickason R, Chauhan V, Mor A, et al. Racial differences in opiate administration for pain relief at an academic emergency department. West J Emerg Med. 2015;16(3):372-80.
30. Bonin M, Mewton N, Roubille F, et al. Effect and safety of morphine use in acute anterior ST-segment elevation myocardial infarction. J Am Heart Assoc. 2018;7(4):e006833.
32. Giannopoulos G, Deftereos S, Kolokathis F, et al. P2Y12 receptor antagonists and morphine. Circ Cardiovasc Interv. 2016;9(9).
33. de Waha S, Eitel I, Desch S, et al. Intravenous morphine administration and reperfusion success in ST-elevation myocardial infarction. Clin Res Cardiol. 2015;104(9):727-34.
Association of Hypertension Severity with 30-Day Major Adverse Cardiovascular Events in Patients with Intermediate High-Sensitivity Cardiac Troponin I
Kegham Hawatian, MD*
Joshua Emakhu, PhD*
Thayer Morton, DO*
Arqam Husain, MD*
Hashem Nassereddine, MD|| Munir Sidani, MD§ Bernard Cook, PhD†
Authors continued at end of article
Section Editor: Elif Yucebay, MD
Henry Ford Health and Michigan State University Health Sciences, Department of Emergency Medicine, Detroit, Michigan
Henry Ford Health and Michigan State University, Department of Pathology, Detroit, Michigan
Henry Ford Health and Michigan State University, Department of Medicine, Division of Cardiology, Detroit, Michigan
American University of Beirut Medical Center, Department of Internal Medicine, Beirut, Lebanon
Corewell Health, Department of Emergency Medicine, Royal Oak, Michigan
Submission history: Submitted May 27, 2025; Revision received January 6, 2026; Accepted January 7, 2026
Electronically published May 14, 2026
Full text available through open access at http://escholarship.org/uc/uciem_westjem
DOI 10.5811/westjem.48347
Introduction: Hypertension is a recognized risk factor for acute coronary syndrome and major adverse cardiovascular events, yet its influence on high sensitivity cardiac troponin (hscTn) concentrations and on the prognostic value of intermediate hscTnI results remains uncertain. We assessed whether blood pressure category confounds the relationship between intermediate hscTnI values (4-18 nanograms per liter [ng/L]) and 30-day major adverse cardiovascular events.
Methods: We performed a secondary analysis of the Rapid Acute Coronary Syndrome EvaluationImplementation Trial (steppedwedge randomized trial across nine Michigan emergency departments [ED] (July 2020–April 2021). From 32,609 patients in the primary trial, we analyzed only those with available hs-cTnI values reported to be in the intermediate range (4-18 ng/L). The first recorded ED blood pressuredetermined category: normotensive (< 140/< 90 millimeters of mercury [mm Hg] moderate [140-179/90109 mm Hg]; or severe [≥ 180/≥ 110 mm Hg]. Generalized linear models and penalized logistic regression examined associations with hscTnI and 30-day major adverse cardiovascular events (allcause death, myocardial infarction, or urgent revascularization), respectively, adjusting for confounders.
Results: Analysis included 23,803 patients. Mean age was 57.5 ± 17.9 years; 57.5% were women and 32.7% Black. Blood pressure categories were normotensive 40.9%, moderate 46.5%, and severe 12.6%. After adjustment, severe blood pressure was associated with a 16% higher mean hscTnI (calculated as %change= 10β – 1; β = 0.064, 95%, CI 0.047-0.082). Major adverse cardiovascular events at 30-days occurred in 148 patients (0.6%), 47 of them normotensive (0.5%), 77 with moderate hypertension (0.7%), and 24 with severe hypertension (0.8%). Compared with normotension, moderate blood pressure independently increased 30day major adverse cardiovascular events risk (adjusted odds ratio [AOR] 1.47, 95% CI, 1.02-2.13; absolute risk difference +0.25%, 95% CI, 0.01-0.49), whereas severe blood pressure showed no clear association (AOR 1.32, 95% CI, 0.80-2.18; absolute risk difference +0.17%, 95 % CI, −0.09 to 0.43). Estimates were similar in sensitivity analyses limited to patients without coronary artery disease.
Conclusion: Among ED patients with intermediate hscTnI, blood pressure ≥ 140/90 mm Hg confers modestly higher short term risk of major adverse cardiovascular events, but incremental severity beyond this threshold does not add prognostic value. Elevated hscTnI in the context of severely elevated blood pressure likely reflects myocardial stress rather than additional ischemic risk. Clinicians should interpret intermediate troponin results in hypertensive patients cautiously, integrating clinical presentation and established risk factors. [West J Emerg Med. 2026;27(3)614–620.]
INTRODUCTION
Hypertension remains the leading modifiable contributor to global cardiovascular morbidity and mortality.1,2 In the emergency department (ED), hypertension frequently coexists with chest pain and may both elevate highsensitivity cardiac troponin (hscTnI) through myocardial strain and increase the baseline probability of acute coronary syndrome.3-5
Contemporary hscTnI assays detect concentrations as low as 2-3 nanograms per liter (ng/L); values < 4-5 ng/L identify patients at very low risk of adverse events, whereas values ≥ 19-20 ng/L are consistent with myocardial injury.6-8 The intermediate zone (4-18 ng/L), therefore, poses diagnostic uncertainty, particularly when comorbid conditions raise troponin in the absence of type 1 myocardial infarction, such as renal dysfunction, pulmonary embolism, or marked blood pressure elevation.9-11
Whether the severity of blood pressure elevation modifies the prognostic meaning of intermediate hscTnI is unclear. Prior work linked chronic hypertension to lowgrade troponin release and to longterm risk of heart failure,12,13 but evidence in the acute care setting is sparse. We hypothesized that higher blood pressure categories would correlate with higher mean hscTnI yet would not independently predict shortterm major adverse cardiovascular events after adjustment for traditional risk factors. Understanding this relation could refine ED risk-stratification algorithms and guide clinical decisionmaking when faced with uncertain laboratory values. We aimed to determine whether hypertension category influences 30-day major adverse cardiovascular events outcomes in patients with intermediate hs-cTnI levels.
METHODS
Study Design and Population
We performed a post-hoc, secondary analysis of the Rapid Acute Coronary Syndrome Evaluation–Implementation Trial (RACE-IT), a stepped-wedge, randomized trial across nine EDs (five academic and four freestanding EDs) that enrolled 32,609 patients evaluated for possible myocardial infarction from July 2020–April 2021 in southeast Michigan. 14 The RACE-IT trial exclusion criteria were < 18 years of age, ST-segment elevation myocardial infarction, hs-cTnI levels > 18 ng/L in the ED, trauma, transfers from another facility, residence outside Michigan, and hospice. For this secondary analysis, we included only patients with available hs-cTnI values. All hs-cTnI were tested on the same immunoassay analyzer, Access (Beckman Coulter Inc, Brea, CA), and patients were included if their troponin values fell within the lowest 99th percentile of hs-cTnI values without them being expressively negative— namely hs-cTnI levels between 4-18 ng/L.
This secondary analysis adhered to the Strengthening the Reporting of Observational Studies in Epidemiology (STROBE) reporting guideline, 15 and the institutional review board approved the study with waiver of informed consent.
Population Health Research Capsule
What do we already know about this issue?
Hypertension is linked to troponin elevation and cardiovascular risk, but its effect on intermediate hs-cTnI prognostic value is unclear.
What was the research question?
Does hypertension severity modify 30-day MACE risk in ED patients with intermediate hs-cTnI?
What was the major finding of the study?
Moderate HTN is associated with MACE (aOR 1.47, 95% CI 1.02–2.13; P=.04); severe HTN was not significant.
How does this improve population health?
Refines ED risk stratification by showing moderate HTN raises risk associated with intermediate hs-cTnI elevations.
Hypertension Severity Classification
The first non-invasive blood pressure recorded at triage (automated oscillometric or calibrated manual) defined blood pressure category. Although systolic blood pressure < 130 millimeters of mercury (mm Hg) is now considered normotensive, for the study period we followed prior guidelines to classify hypertension severity: normotensive (< 140/< 90 mm Hg); moderate (140-179/90-109 mm Hg); or severe (≥ 180/≥ 110 mm Hg). 1
Outcomes
The primary outcome was logtransformed hscTnI concentration. The secondary outcome was 30day major adverse cardiac event, a composite of allcause death, type 1 or type 2 myocardial infarction (Fourth Universal Definition) and urgent revascularization (percutaneous coronary intervention or coronary artery bypass graft). 18 We ascertained outcomes through electronic health record review and linkage to a statewide health information exchange network.
Statistical Analysis
Descriptive and baseline characteristics for hypertension severity and its outcomes were summarized as means ± standard deviations (SD) for continuous variables, median (interquartile range [AQR]) for non-normally distributed variables, and frequency (%) for categorical variables. We
Association of HTN Severity with 30-Day MACE in Patients with Intermediate hs-cTnI
assessed differences between hypertension classification groups using analysis of variance for continuous variables, Kruskal-Wallis tests for skewed distributions, and chi-square (χ²) tests for categorical variables. We used a generalized linear modeling framework to evaluate how hypertension severity relates to mean hs-cTnI values while controlling for confounding factors. Model coefficients (β) were reported to indicate the direction and magnitude of association between hypertension severity and hs-cTnI, providing an interpretable measure of effect size in addition to statistical significance. Prespecified confounders included age, sex, selfidentified race/ ethnicity, prior coronary artery disease, and serum creatinine. We confirmed model assumptions through residual diagnostics and applied a log10 transformation to hs-cTnI values because they displayed a skewed distribution.
We examined how hypertension severity affects 30-day major adverse cardiovascular events with multivariable
logistic regression models and used normotensive patients as the reference group, accounting for the same pre-specified confounders. The analysis yielded adjusted odds ratio (aOR) along with their 95% CIs. We also performed a sensitivity analysis that excluded patients with known history of coronary artery disease. The study tested interaction terms between hypertension severity and sex, race/ethnicity, and history of coronary artery disease to determine whether they modified any effects. We used Python 3.13 (Python Software Foundation, Wilmington, DE) for all analyses. We defined statistical significance as a two-tailed P value < .05.
RESULTS
Baseline Characteristics of the Study Population
The study included 23,803 patients who presented with suspected acute coronary syndrome (Table 1). Cohorts based on blood pressure included the following: 9,733 normotensive
Table 1. Baseline characteristics by hypertension severity in study assessing whether blood pressure category confounds the relationship between intermediate high sensitivity cardiac troponin values and 30-day major adverse cardiovascular events.
Laboratory biomarkers, IQR [Q1, Q3]
Comorbidities, n (%)
*Significant value.
BP, blood pressure; Hs-cTnI, high-sensitivity cardiac troponin I; IQR, interquartile range; MACE, major adverse cardiovascular event; ng/L, nanograms per liter; SD, standard deviation.
Hawatian et al.
Association of HTN Severity with 30-Day MACE in Patients with Intermediate hs-cTnI (40.9%), 11,064 moderate hypertension (46.5%), and 3,006 with severe hypertension (12.6%). The average age was 57.5 years (SD 17.9), 57.5% were female, 32.7% Black, and 53.7% White. The average age, and the proportion of Black patients, increased incrementally in each hypertension group.
The median hs-cTnI levels at presentation was 4.0 ng/L (IQR 4.0-7.0) for both normotensive and moderately hypertensive cohorts, while severely hypertensive patients exhibited a median of 5.0 ng/L (4.0-8.0). Creatinine levels were consistent across groups (median: 0.9 mg/dL [0.7-1.1]) demonstrating comparable renal function. The severely hypertensive cohort experienced higher rates of diabetes mellitus (27.8%), chronic kidney disease (22.3%), and history of coronary artery disease (11.8%) than patients in other cohorts.
Association Between Hypertension Severity and Highsensitivity Cardiac Troponin
In adjusted analysis (Table 2), severe blood pressure was associated with 16% higher mean hs-cTnI (P <.001). This was calculated from the obtained β =0.064 through the formula % Change = 10β – 1 (% Change = 100.064 – 1 = 15.8%).
Conversely, moderate blood pressure was 5% lower (P < .001) relative to normotension. This was calculated from the obtained β = -0.0239 through the same formula (% Change = 10-0.0239 – 1 = -5.3%). Black race, male sex, creatinine, and prior coronary artery disease independently correlated with
higher hs-cTnI (Table 2).
Association Between Hypertension Severity and 30-Day Major Adverse Cardiac Event
Overall, 148 events occurred (37 deaths, 91 myocardial infarctions, and 20 revascularizations). Unadjusted rates of major adverse cardiac event rose from 0.5% (normotensive) to 0.7% (moderate) and 0.8% (severe) based on hypertension classification (P = .04). After adjustment (Table 3), moderate blood pressure remained associated with higher major adverse cardiac event (adjusted odds ratio [aOR] 1.47, 95% CI 1.022.13), whereas severe blood pressure did not reach statistical significance (aOR 1.32, 0.80-2.18). Sensitivity analyses after excluding coronary artery disease presented similar significances for age, sex, and Black ethnicity; however, significance in moderate severity hypertension was not obtained due to the smaller sample size obtained after patients with coronary artery disease were excluded (Table 4).
DISCUSSION
Our results expand on previous work showing that persistent or chronic hypertension leads to subtle cardiac injury, as reflected by elevated troponin in otherwise asymptomatic or stable patients.12,13,20 In particular, older
Table 2. Adjusted associations between blood pressure category and log10hscTnI in study assessing whether blood pressure category confounds the relationship between intermediate high sensitivity cardiac troponin values and 30-day major adverse cardiovascular events.
Coefficient (β) and Percentage Change (%) 95% CI P value
Table 3. Adjusted associations between blood pressure category and 30-day major adverse cardiac event.
Characteristics
Unadjusted model Adjusted model OR (95% CI) P value OR (95% CI) P value
Age, years 1.02 (1.01-1.03) < .001
Sex, male n (%) 2.21 (1.57-3.12) < .001
Race/ethnicity
ref
(0.17-1.68) .28
(0.32-1.27) .20
Hypertension severity
Normotensive Ref ref
(1.00-2.08)
1.66 (1.01-2.72)
(1.02-2.13) .04
(0.98-2.65) .06
Coronary artery disease 5.45 (3.84-7.73) < .001
OR, odds ratio; ref, reference.
Table 4. Sensitivity analysis excluding patients with history of coronary disease in study assessing whether blood pressure category confounds the relationship between intermediate high sensitivity cardiac troponin values and 30-day major adverse cardiovascular events.
Characteristics
Race/ethnicity
Hypertension severity
(0.15-1.48) .20
(0.28-1.11) .10
Normotensive Ref ref
1.44 (1.00-2.08) .048 1.41 (0.98-2.02) .07
1.66 (1.01-2.72) .044 1.53 (0.93-2.51) .09
OR, odds ratio; ref, reference.
studies suggested a linear relationship between systolic blood pressure severity and adverse cardiovascular outcomes,21-23 but these analyses typically involved broader populations or used conventional (non high-sensitivity) troponin assays. The ability of high-sensitivity troponin testing to rule out myocardial events—especially in the 4-18 ng/L range—raises unique diagnostic and prognostic questions that have not been completely addressed by earlier investigations.
While the association between hypertension and major adverse cardiac events is well-documented,4,26,31 our study provides nuance by focusing on intermediate hs-cTnI levels. For clinicians, this group is often the most challenging to interpret, as patients fall neither into clearly “low risk” (< 4 ng/L) nor “overt myocardial injury” (> 18 ng/L) categories. We observed that severe hypertension was linked to higher troponin concentrations, consistent with literature describing myocardial strain, microvascular compromise, and left ventricular hypertrophy as central pathophysiologic processes driving troponin release.3,5,16,24,25 However, the elevated hs-cTnI in these severely hypertensive patients did not translate into a statistically significant increase in 30-day
major adverse cardiac events risk in our adjusted models. This divergence may reflect differences between “pressure-related myocardial stress” and “ischemic myocardial injury,” as well as the complex interplay of chronic medical therapies in patients with more severe or longstanding hypertension.28,29 However, this difference between moderate vs severe hypertension in terms of association with 30-day major adverse cardiac events may be a statistical artifact and must be verified by further study.
Interestingly, our study also identified a slight paradox wherein moderately hypertensive patients (140-179/90-109 mm Hg) had slightly lower adjusted troponin levels compared to normotensive patients yet a modestly increased 30-day risk of major adverse cardiac events. These counterintuitive findings may be explained in part by unmeasured factors (eg, the presence of antihypertensive regimens, which may mitigate subclinical myocardial injury (thus lowering troponin) while other risk factors (eg, atherosclerosis burden, diabetes, or smoking) still predispose to acute coronary syndrome or short-term events.29-31 Prospective studies, designed specifically to incorporate medication details, could clarify whether certain classes of antihypertensives attenuate troponin release or whether other confounders are at play.
Clinical and Research Implications
From a clinical standpoint, these results suggest that any hypertension (blood pressure ≥ 140/90 mm Hg) in patients evaluated for possible acute coronary syndrome and an intermediate hs-cTnI result deserves attention, given the modest yet measurable increase in major adverse cardiac events. However, clinicians should not assume that blood pressure ≥ 180/110 mm Hg automatically confers an even higher shortterm risk of acute coronary syndrome, although the low major adverse cardiac event rate limited our ability to clearly define risk in this severe hypertension cohort. Our findings reinforce the importance of comprehensive risk stratification, incorporating other well-established risk markers, and risk modification, including blood pressure control.
Future research should explore potential mechanistic links between severe hypertension and troponin release, including the roles of arterial stiffness, diastolic dysfunction, and microvascular disease.26,27 Large prospective cohorts would allow the investigation of whether more aggressive blood pressure-lowering strategies in patients with intermediate hs-cTnI reduce either troponin levels and/or major adverse cardiac events.
LIMITATIONS
Our study has several limitations. First, although we adjusted for a range of confounders, residual confounding is possible—especially concerning antihypertensive treatment, acute pain, or anxiety in the ED, which might influence both blood pressure and troponin release, as well as any
Hawatian et al.
Association of HTN Severity with 30-Day MACE in Patients with Intermediate hs-cTnI
confounders not captured by electronic health records. This is especially important when considering blood pressure control regimens, which constitute an important confounder that should be considered in similar studies in the future. Second, we relied on a single blood pressure measurement at triage. Patients with transiently elevated readings might have been misclassified, while those with chronically elevated blood pressure could have been underestimated.17 Third, our outcome of 30-day major adverse cardiac event had relatively few events (148 total), limiting statistical power to detect small differences or interactions.
Fourth, all hs-cTnI assays were performed on the Beckman Coulter platform, which may be generalized to other hs-cTnI assay manufacturers, but the cut-off values may differ.16,19 Fifth, although the study was conducted across multiple hospitals, they belong to a single health system; thus, external validity beyond similar U.S. community ED settings requires caution. Lastly, we examined only short-term events; whether severe hypertension portends worse outcomes over longer follow-up warrants prospective study. All these factors may influence the precision of our results, and they should be taken into consideration when interpreting the reported outcomes of our study.
CONCLUSION
In ED patients who present with possible acute coronary syndrome and intermediate hs-cTnI levels, any blood pressure ≥ 140/90 mm Hg may carry a modestly increased short-term risk of major adverse cardiac event, but incremental severity (≥ 180/110 mm Hg) does not significantly heighten that risk after adjusting for other clinical factors. While severe hypertension does appear to raise troponin levels, it may represent myocardial stress rather than acute ischemic injury. Integrating these findings with established risk variables, physicians should interpret borderline troponin values in hypertensive patients carefully, ensuring that blood pressure is addressed promptly but also recognizing that higher blood pressure readings do not necessarily translate into an outsized risk of a major adverse cardiac event.
AUTHORS CONTINUED
Howard Klausner, MD*
James McCord, MD‡
Satheesh Gunaga, DO* Seth Krupp, MD*
Joseph Miller, MD, MS*
Address for Correspondence: Joseph Miller, MD, MS, Henry Ford Health and Michigan State University Health Sciences, Department of Emergency Health, 2799 W Grand Blvd, Detroit, MI 48202. Email: jmiller6@hfhs.org.
Conflicts of Interest: By the WestJEM article submission agreement, all authors are required to disclose all affiliations,
funding sources and financial or management relationships that could be perceived as potential sources of bias. The clinical trial described in this manuscript was funded through an investigatorinitiated grant by Beckman Coulter Diagnostics. The study itself was not funded. There are no conflicts of interest to declare.
1. Whelton PK, Carey RM, Aronow WS, et al. 2017 ACC/AHA/AAPA/ ABC/ACPM/AGS/APhA/ASH/ASPC/NMA/PCNA guideline for the prevention, detection, evaluation, and management of high blood pressure in adults. J Am Coll Cardiol. 2018;71(19):e127-48.
2. Benjamin EJ, Muntner P, Alonso A, et al. Heart disease and stroke statistics—2019 update: a report from the American Heart Association. Circulation. 2019;139(10):e56-528.
3. Drożdż D, Drożdż M, Wójcik M. Endothelial dysfunction as a factor leading to arterial hypertension. Pediatr Nephrol. 2023;38(9):2973-85.
4. Konstantinou K, Tsioufis C, Koumelli A, et al. Hypertension and patients with acute coronary syndrome: putting blood pressure levels into perspective. J Clin Hypertens. 2019;21(8):1135-43.
5. Lackland DT, Blumenthal RS, Cannon CP, et al. Treatment of hypertension in patients with coronary artery disease. Cardiol. 2015;65:1998-2038.
6. Hickling S, Francis CJ, Chew DP, Mitra B, Hillis GS. Single highsensitivity troponin-I for ruling out acute coronary syndrome: a detection limit approach. Eur Heart J Open. 2024;4(6):oeae094.
7. Roetger AE, McKinney CD, Winter B III, et al. A patient-centric chest pain management approach utilizing a high-sensitivity troponin-I assay. Heliyon. 2024;10(20):e38164.
8. Hampilos KE, Asif A, Mehta PK, et al. Myocardial biomarkers in coronary microvascular dysfunction: response to ranolazine. Am Heart J Plus. 2025;52:100513.
9. Cao W, Luo J, Hui X, Xiao Y, Huang R. The association between endothelial dysfunction and subclinical myocardial injury in male obstructive sleep apnoea patients. ERJ Open Res. 2025;11(1).
10. Liu Y, Liu H. Prediction of chemotherapy-mediated cardiotoxicity in patients with cancer by cardiac troponin I: a systematic review and meta-analysis. Int J Risk Saf Med. 2025;36(1):26-48.
11. Skaarup KG, Davidovski FS, Durukan E, et al. Cardiac characteristics of hospitalized influenza patients: an interim analysis from the FluHeart Study. Influenza Other Respir Viruses. 2025;19(2):e70067.
12. Sato Y, Yamamoto E, Sawa T, et al. High-sensitivity cardiac troponin T in essential hypertension. J Cardiol. 2011;58(3):226-31.
13. McEvoy JW, Chen Y, Nambi V, et al. High-sensitivity cardiac troponin T and risk of hypertension. Circulation. 2015;132(9):825-33.
14. Miller J, Cook B, Gandolfo C, et al. Rapid acute coronary syndrome evaluation over one hour with high-sensitivity cardiac troponin I. Ann
Association of HTN Severity with 30-Day MACE in Patients with Intermediate hs-cTnI
Emerg Med. 2024;84(4):399-408.
15. von Elm E, Altman DG, Egger M, et al. The strengthening the Reporting of Observational Studies in Epidemiology (STROBE) statement. Epidemiology. 2007;18(6):800-4.
16. DeFilippi CR, de Lemos JA, Christenson RH, et al. Association of serial measures of cardiac troponin T with incident heart failure and cardiovascular mortality in older adults. JAMA. 2010;304(22):2494-502.
17. Muntner P, Shimbo D, Carey RM, et al. Measurement of blood pressure in humans: a scientific statement from the American Heart Association. Hypertension. 2019;73(5):e35-66.
18. Thygesen K, Alpert JS, Jaffe AS, et al. Fourth universal definition of myocardial infarction (2018). Circulation. 2018;138(20):e618-51.
19. Sandoval Y, Apple FS, Mahler SA, et al. High-sensitivity cardiac troponin and the 2021 AHA/ACC/ASE/CHEST/SAEM/SCCT/SCMR guidelines for acute chest pain. Circulation. 2022;146(7):569-81.
20. Park KC, Gaze DC, Collinson PO, Marber MS. Cardiac troponins: from myocardial infarction to chronic disease. Cardiovasc Res. 2017;113(14):1708-18.
21. Kang DG, Jeong MH, Ahn Y, et al. Clinical effects of hypertension on mortality in patients with acute myocardial infarction. J Korean Med Sci. 2009;24(5):800-6.
22. Ayhan E, Uyarel H, Cicek G, et al. Clinical outcomes of primary angioplasty in ST-elevation myocardial infarction patients with antecedent hypertension. Clin Exp Hypertens. 2012;34(5):357-62.
23. Lee MG, Jeong MH, Lee KH, et al. Prognostic impact of diabetes mellitus and hypertension in acute myocardial infarction treated with PCI. J Cardiol. 2012;60(4):257-63.
24. Zeng X, Rathinasabapathy A, Liu D, et al. Association of cardiac injury with hypertension in hospitalized patients with COVID-19. Sci Rep. 2021;11(1):22389.
25. Soerensen N, Gossling A, Haller P, et al. Prevalence and prognostic impact of myocardial injury following hypertensive crisis. Eur Heart J. 2023;44(Suppl 2):ehad655.
26. Tackling G, Borhade MB. Hypertensive heart disease. StatPearls. 2023. Available at: https://www.ncbi.nlm.nih.gov/books/. Accessed February 6, 2025.
27. Hammadah M, Al Mheid I, Wilmot K, et al. Association between high-sensitivity cardiac troponin levels and myocardial ischemia during mental stress. JACC Cardiovasc Imaging. 2018;11(4):603-11.
28. American Diabetes Association Professional Practice Committee. Cardiovascular disease and risk management: Standards of Medical Care in Diabetes—2022. Diabetes Care. 2022;45(Suppl 1):S144-74.
29. Dash A, Meher BR, Padhy BM, et al. Comparison of azilsartanamlodipine versus telmisartan-amlodipine in hypertension. Cureus. 2023;15(3):e35865.
30. Garady L, Soota A, Shouche Y, et al. Role of blood biomarkers in cardiovascular risk prediction. Cureus. 2024;16(12):e74899.
31. Picariello C, Lazzeri C, Attana P, et al. Impact of hypertension on acute coronary syndromes. Int J Hypertens. 2011;2011:563657.
Association Between Substance Use and Trauma Outcomes in Adolescents
Stephen Sandelich, MD*
Angel Schuster, MD, MPS*
Ian Klansek, MD*
Olamide O. Olabamiji, MD*
Catherine Marco, MD*
Josh Glasser, MD*
Aleksandra E. Zgierska, MD, PhD†
Section Editor: Reshvinder Dhillon, MD
Penn State Milton S. Hershey Medical Center, Department of Emergency Medicine, Hershey, Pennsylvania
Penn State Milton S. Hershey Medical Center, Department of Family and Community Medicine, Hershey, Pennsylvania
Submission history: Submitted August 16, 2025; Revision received January 3, 2026; Accepted January 4, 2026
Electronically published April 8, 2026
Full text available through open access at http://escholarship.org/uc/uciem_westjem DOI 10.5811/westjem.50673
Introduction: Adolescent substance use and substance use disorders are significant public health issues. Our goal was to evaluate the association between adolescent substance use, detected via blood alcohol levels and urine drug screens, and trauma-related outcomes at a Level I pediatric trauma center. Most of the literature is focused on adult trauma patients with limited data in the pediatrics.
Methods: In this retrospective cohort study, we analyzed data from adolescent trauma patients 13-17 years of age presenting to a Level I pediatric trauma emergency department (ED). Demographic data, Injury Severity Score (ISS), intensive care unit (ICU) admission, hospital length of stay (LOS), and ED disposition were extracted from the Pennsylvania Trauma Systems Foundation Database Collection System, which includes comprehensive information on demographics, clinical characteristics, and outcomes of trauma patients. These data were compared between patients whose alcohol levels and urine drug screening were positive and negative. Our primary outcome measures were ISS and LOS in the hospital and ICU. Our secondary outcome measures were need for surgery, mortality, and disposition from the ED. Specific substances, including tetrahydrocannabinol (THC), benzodiazepines, and opioids, were further analyzed as drugs associated with these outcomes. We performed multivariate regression models to identify independent associations of blood alcohol levels or urine drug screen positivity with trauma severity and ICU admissions.
Results: Among 405 adolescents who had toxicology testing done, 11/286 (3.8%) tested positive for alcohol, while 95/377 (25.2%) had positive urine drug screens predominantly for THC (19.9% of the 95 who had a positive screen). Blood alcohol level-positive patients demonstrated significantly lower ISS (P < .001), shorter ICU stays (P. < .01), and shorter overall hospital stays (P< .01) compared to blood alcohol level-negative patients. Conversely, benzodiazepine positivity was strongly associated with higher ISS, increased ICU admissions, and prolonged hospitalization stays. Multivariate analysis showed that older age was associated with increased ISS (β = 0.30 per year, P < .06) and ICU admission (OR 1.16, 95% CI, 1.04-1.28, P < .01). Blood alcohol level and most urine drug screen results were not independently associated with primary outcomes of ISS and LOS in the hospital and ICU, although benzodiazepine positivity was strongly associated with increased ISS (P < .001) and ICU admission (OR ≈ 30, P < .001).
Conclusion: Adolescent trauma patients who were positive for benzodiazepines were associated with significantly worse outcomes, emphasizing the need for targeted screening and intervention strategies. Alcohol positivity was paradoxically associated with less severe trauma presentations. These findings highlight the complexity of substance use on adolescent trauma and underscore the importance of nuanced clinical assessments and targeted interventions addressing both substance use and underlying sociodemographic vulnerabilities. [West J Emerg Med. 2026;27(3)621–628.]
INTRODUCTION
Adolescent substance use and substance use disorders (SUD) remain a significant public health issue, contributing to considerable morbidity, mortality, and long-term health implications.1–3 In the United States, approximately 3.8 million adolescents 12-17 years of age reported past-year substance use, and 2.2 million met the criteria for a SUD.4 Although recent national data indicate a stabilization or decline in the rates of substance use among adolescents, mortality rates continue to rise.5,6 The early initiation of substance use has been linked to significant adverse outcomes immediately and later in life.7,8 Adolescents who begin using substances at younger ages face higher risks of developing a SUD, other mental health issues, and chronic health conditions.9
Individuals who started drinking alcohol before the age of 14 have higher levels of alcohol consumption and a greater likelihood of experiencing alcohol use disorder in adulthood compared to those who initiated alcohol use later.10
Adolescents who use substances are at a higher risk for trauma;11 substance use can also be a consequence of traumatic experiences, creating a cyclical relationship between the two.12 There is a positive relationship between substance use and worse trauma-related outcomes, including higher Injury Severity Scores (ISS), more extended hospital stays, and increased rates of intensive care unit (ICU) admissions.13,14 Many substances (eg, alcohol and opioids) impair cognitive and motor function, heightening the likelihood of accidents and serious injuries. Moreover, adolescents who use substances often require more intensive medical interventions when they present with trauma; this, in turn, places a significant burden on healthcare systems and increases overall treatment costs. Screening for substances should be done for all adolescents when presenting for trauma.12 Most of the literature is focused on the adult trauma population with limited data in the pediatric trauma population.
Emergency departments (ED) play a pivotal role as frontline points of care for adolescents presenting with acute injuries and trauma, especially those who do not engage with primary care. The ED is often the first and sometimes only contact adolescents have with the healthcare system, making it a suitable setting for the identification and management of substance use as the foundation for prevention and/or mitigating long-term harms related to SUD. While EDs can serve as crucial access points for immediate care and intervention, the specific outcomes related to substance use and trauma, as well as specific characteristics that may impact outcomes in adolescents, remain underexplored.
Previous studies have yielded conflicting findings regarding the impact of various substances on injury severity, hospital resource utilization, and survival outcomes. For instance, while alcohol intoxication is often presumed to worsen trauma severity, evidence from several trauma registry analyses indicates a paradoxical association:
Population Health Research Capsule
What do we already know about this issue?
For adolescents, there is an association between substance use and worse traumarelated outcomes.
What was the research question?
In adolescents, is use of specific substances associated with worse trauma-related outcomes?
What was the major finding of the study?
Adolescents positive for benzodiazepines showed higher Injury Severity Scores (ISS) than those negative for benzodiazepines (mean ISS, 12.87 vs 10.01; P = .001).
How does this improve population health?
This study highlights the association between adolescent substance use (particularly benzodiazepines) and increased trauma severity and healthcare use.
Intoxicated patients frequently present with less severe injuries, reduced ICU requirements, and lower immediate mortality compared to sober counterparts.13–15 In contrast, the impact of cannabis use remains ambiguous, with some large-scale studies reporting minimal effects on trauma severity and even associations with reduced mortality, while others suggest no protective benefit.16,17 Benzodiazepines, however, consistently emerge in literature as associated with worse clinical outcomes, including higher ISS, increased ICU admission rates, and prolonged hospital length of stay (LOS), likely due to their sedative properties and impact on cognitive and motor function.18,19
Opioids and stimulants (such as methamphetamine and cocaine) demonstrate a varied clinical impact in trauma patients. Pre-injury opioid use often correlates with prolonged hospitalization and increased healthcare resource use but not necessarily increased mortality.20
Methamphetamine use similarly prolongs hospital and ICU LOS without consistently affecting mortality, whereas cocaine generally shows little measurable impact on trauma severity or survival outcomes.21 Given these contrasting and nuanced findings, it remains critically important to investigate substance-specific associations within adolescent trauma populations to inform clinical management and targeted intervention strategies more precisely.
In this study we aimed to fill critical knowledge gaps regarding the relationship between substance use and trauma-
related outcomes in adolescents 13-17 years of age treated at a Level I pediatric trauma ED.
METHODS
Study Design and Setting
This study was a retrospective cohort analysis of data extracted from the Pennsylvania Trauma Systems Foundation Database Collection System (PTOS Trauma Registry), which includes comprehensive information on the demographics, clinical characteristics, and outcomes of trauma patients. The study population included adolescents 13-17 years of age who had presented to the ED at a Level I pediatric trauma center located in a suburban setting in the Mid-Atlantic region of the U.S. with traumatic injuries between January 1, 2018–August 31, 2023, for which either a urine drug screen or a blood alcohol level was obtained. They were identified through the PTOS Trauma Registry, which includes all trauma cases treated at the institution during the study period.
We excluded patients with missing or incomplete urine toxicology data. In addition, those who had received medications in the ED or prehospital that could have interfered with, or resulted in a positive result, on the ED-obtained urine drug screen were also excluded. Examples are patients who received benzodiazepine for anxiolysis or an opioid for pain management. Lastly, we excluded patients who were transferred to Penn State Medical Center after initial management at a different institution. The urine drug scene and blood alcohol level were obtained during initial trauma activation and evaluation.
The Institutional Review Board approved the study, and informed consent was waived due to the study’s retrospective nature. The study is reported according to Strengthening the Reporting of Observational Studies in Epidemiology STROBE guidelines.22
Variables
The primary outcome variables included injury severity, measured by hospital admission and ISS, and LOS in the hospital and ICU. Secondary outcome measures included need for surgical intervention, mortality, and disposition from the ED (eg, admission to a medical or surgical ward, ICU, or discharge to home). Other secondary variables were collected as additional measures to obtain further information on factors that contributed to trauma outcomes; these variables collected included age, sex, race, and mechanism of injury (eg, motor vehicle collision, fall, gunshot wound).
Statistical Methods
We used descriptive statistics to summarize the demographic, clinical, and outcome characteristics. Continuous variables were summarized as means (standard deviation [SD]), and categorical variables were presented as frequencies and percentages. Bivariate analyses (chi-square tests for categorical and independent-sample t-tests for continuous variables)
compared outcomes between substance-positive and substancenegative patients. We used multivariate logistic regression to identify independent associators of severe trauma outcomes while adjusting for demographic variables, injury mechanisms, and other relevant confounders. All statistical analyses were performed using SAS statistical software v9.4 (SAS Institute Inc., Cary, NC). The statistical significance level was set at a P value of < .05.
Criteria for Medical Record Review Studies
We reviewed the criteria for medical record review studies in emergency medicine published by Worster et al in 2005.23 Of the listed criteria, we met the following: inclusion and exclusion criteria defined; variables defined; data extraction form used to extract data from the PTOS Trauma Registry; medical record database identified; method of sampling described; management of missing data described; and, finally, the study was approved by our institutional review board.
RESULTS
The final analytic cohort consisted of 405 adolescent trauma patients, predominantly male (66.4%), with a mean age of 15.4 years (SD 1.9). Most patients were White (74.1%), followed by Black (11.4%) and Asian (2.2%). Motor vehicle collisions were the leading mechanism of injury (57.0%), followed by falls (21.7%). Demographics of the study cohort are shown in Table 1.
The mean ISS for the cohort was 13.2 (SD 10.6) indicating moderate injury severity. The anatomical distribution of injuries varied, with external injuries being the most common (77.3%, n = 313). Head and neck injuries were frequently observed, with minor injuries (Abbreviated Injury Scale [AIS] score 2) accounting for 23.7% (n = 96) of this category. Thoracic and extremity injuries were also notably prevalent, with moderate severity scores (AIS 2 or 3) the most common.
Hospital admission was required for 78.8% (n = 319) of the patients. The ICU stays occurred in 27.7% (n = 112) of the cohort. Regarding disposition from the ED, 39.5% (n = 160) were admitted to medical/surgical units, 21.0% (n = 85) were admitted directly to the ICU, 18.3% (n = 74) went to step-down units, and 15.3% (n = 62) were transferred to operating rooms or preoperative holding. Only 5.4% (n = 22) were discharged directly home from the ED, with minimal cases transferred elsewhere (0.2%, n = 1) or resulting in mortality in the ED (0.2%, n = 1). Total ICU admissions (n = 112) are all admissions to the ICU whether the patient went straight from the ED to the ICU, or from the ED to the OR to ICU, and patients who were upgraded to the ICU at any time during their care. Emergency department disposition to the ICU (n = 85) only reflects patients who went directly from the ED to the ICU. The Figure presents ISS score and admission disposition for patients with a positive blood alcohol level or urine drug screen. Blood alcohol level tests were conducted on 286 of the
Sandelich
Table 1. Baseline demographics of study cohort (N = 405) in a study of the association between blood alcohol level or urine drug screen, trauma severity, and Injury Severity Score.
Table 1. Continued
Figure 1. Injury Severity Score and admission disposition for patients with a positive blood alcohol level or urine drug screen in a study of the association between positive screening results and trauma severity, injury severity, and emergency department disposition. BAL, blood alcohol level; ICU, intensive care unit; ISS, Injury Severity Score; OR, operating room; UDS, urine drug screen.
405-patient sample. Of the 286 patients, 11 (3.8%) tested positive (Table 2). Urine drug screens were performed for 377 patients, of which 95 (25.2%) were positive for any substance. Of these, 95 (19.9%) tested positive for THC, followed by opioids (5.0%), benzodiazepines (3.2%), amphetamines (0.5%), cocaine (0.3%), and barbiturates (0.3%). There were just a few patients who had both a positive blood alcohol level and a positive urine drug screen. These patients did not have statistically significant outcomes compared to those with either a positive blood alcohol level or a positive urine drug screen; therefore, we did not report on this.
Patients positive for blood alcohol levels were older (mean age, 16.45 vs 15.53 years; < .10) compared to blood alcohol level-negative patients, although this difference was not statistically significant. However, blood alcohol levelpositive adolescents had significantly lower ISS (8.55 vs. 13.88; P = .001), shorter ICU stays (mean ICU LOS, 0.55 vs. 1.72 days; P < .01), and shorter hospital stays (mean LOS, 2.55 vs. 6.06 days; P < .01) than blood alcohol level-negative patients. No significant differences were observed in ICU admission rates, social service consults, or ED disposition patterns in the blood alcohol level-positive patients.
Adolescents with positive urine drug screen were significantly older (mean age, 16.14 vs 15.05 years; P < .0001) and more likely to be non-White (P < .01). Urine drug screen-positive patients had similar ISS, hospital LOS, and ICU LOS compared to urine drug screen-negative patients (all P > .05). Additionally, no statistically significant differences were found in ICU
or social
Table 2. Blood alcohol level and urine drug screen results in a study of adolescent trauma cases presenting to a Level I trauma center.
286)
service consults for urine drug screen-positive patients.
Adolescents positive for benzodiazepines showed significantly higher ISSs (mean ISS, 12.87 vs 10.01; P = .001) and were significantly more likely to require ICU admission (75 vs 26.6%; OR 8.29, 95% CI, 2.18-31.25; P < 0.01) than those negative for benzodiazepines. Opioid-positive adolescents did not differ significantly from opioid-negative adolescents in injury severity, ICU LOS, hospital LOS, or ICU admission rates. However, a slightly higher proportion of ICU admissions was noted (36.8 vs 26.6%), although this difference did not reach statistical significance. Tetrahydrocannabinol-positive adolescents were significantly older (mean age, 16.33 vs 15.05 years; P < .001), more often male (76 vs 63.2%; P = .04), and non-White (P < .001). However, THC positivity did not significantly impact ISS (mean 11.99 vs 10.58; P = .32), hospital LOS, ICU LOS, ICU admissions, or social service consultations.
In multivariable regression, older age was independently associated with higher injury severity (β = 0.30 per year, P = .06) and increased likelihood of ICU admission (OR 1.16, 95% CI 1.04-1.28; P < .01). After adjusting for demographics, blood alcohol level positivity was not significantly associated with injury severity or ICU admission. Similarly, most urine drug screen categories were not associated with outcomes, with the exception of benzodiazepine positivity, which remained strongly associated with higher ISS (P < .001) and ICU admission (OR ≈ 30, P < .001).
DISCUSSION
In this study we examined the association between adolescent substance use, detected via blood alcohol level and urine drug screen, and trauma outcomes in adolescents presenting to a Level I pediatric trauma center. The findings offer critical insights into the relationships between substance use and trauma severity, highlighting essential implications for clinical practice and public health policy. Our findings align with several prior studies that suggest a paradoxical effect of alcohol intoxication on trauma outcomes.
Contrary to our initial hypothesis, adolescents with positive blood alcohol levels demonstrated significantly lower ISS, shorter ICU LOS, and shorter hospitalizations compared to their non-impaired peers. Similar results have been observed in adult and adolescent populations, notably in traumatic brain injury cases, where alcohol intoxication correlated with reduced injury severity and lower mortality.13-15 This counterintuitive finding may reflect a combination of behavioral (less severe trauma mechanisms), biological (potential neuroprotective effects of alcohol), and clinical factors (heightened clinical suspicion and early aggressive management).15,18 These findings may appear counterintuitive, given alcohol’s known impairing effects; however, they do align with some previous data.24,25 Moreover, selective testing practices may introduce bias, with clinicians potentially opting to test less severely injured adolescents more frequently. Further research should explore standardized testing
protocols and detailed injury context assessments to clarify alcohol’s influence on trauma outcomes.
In contrast, while overall positivity on urine drug screen was not consistently associated with significant differences in injury severity or hospital resource utilization, notable associations emerged when examining specific substances. Particularly, benzodiazepines were robustly associated with worse clinical outcomes, including significantly higher ISS, increased likelihood of ICU admission, longer ICU LOS, and distinct differences in ED disposition patterns. The sedative and cognitive-impairing effects of benzodiazepines likely contribute directly to higher trauma severity and complexity, exacerbating injury and complicating immediate clinical management.
Additionally, benzodiazepine-positive adolescents may represent a subgroup with pre-existing mental health conditions or polysubstance use behaviors that increase vulnerability and complicate discharge planning. Our results also support existing literature highlighting benzodiazepines as strongly associated with poorer clinical outcomes in trauma patients. Our findings are consistent with prior evidence linking benzodiazepine use to increased hospital resource requirements, greater injury severity, and higher ICU use, likely related to the cognitive and motor impairments induced by benzodiazepines.18,19 Despite this, we cannot extrapolate from our data that patients with a SUD with benzodiazepines are at higher risk of injury because urine drug screen is a screening tool, and quantitative testing is needed to confirm benzodiazepine use.
Opioid positivity was not independently associated with significantly worse trauma outcomes, although there was a non-significant trend toward increased ICU admissions among opioid-positive adolescents. This observation aligns with previous literature suggesting opioids may prolong hospitalizations without notably affecting mortality, reflecting potentially chronic use patterns and complex underlying health factors.20 Given the small sample size of opioid-positive patients, definitive conclusions are limited, and larger scale investigations are warranted.
Tetrahydrocannabinol positivity, despite being highly prevalent, showed limited associations with adverse clinical outcomes echoing recent large-scale studies indicating minimal clinical impact of cannabis use on trauma outcomes.16,17 While cannabis was the most commonly detected substance in our adolescent population, its presence did not correlate with increased injury severity or longer hospital stay, suggesting a relatively neutral effect compared to other substances like benzodiazepines or opioids. Tetrahydrocannabinol positivity should be interpreted with caution as a urine drug screen can remain positive for a significant amount of time after last use. Tetrahydrocannabinol-positive adolescents were significantly older and more frequently male and non-White, underscoring the need to understand better the broader sociodemographic factors influencing substance use patterns and clinical outcomes in adolescent populations.
Our multivariate analyses identified older age as being independently associated with trauma severity and ICU admission, highlighting broader sociodemographic disparities in adolescent trauma outcomes, consistent with literature identifying sociodemographic disparities as crucial determinants of trauma outcomes.24,25 Older adolescents likely engage more frequently in high-risk behaviors, leading to severe injuries. These findings emphasize the critical role of addressing broader social determinants of health, beyond substance use alone, when evaluating trauma risks and outcomes.
LIMITATIONS
Several limitations of this study must be acknowledged. These data need to be interpreted with caution as a positive urine drug screen is not the same as acute intoxication. Depending on the substance, route, and chronicity of substance use, urine drug screens may be positive for a significant time after last substance use. Additionally, the retrospective design restricts causal inference, and reliance on clinical toxicology screening introduces potential misclassification bias due to timing variability, testing sensitivity, and clinical judgment in ordering tests.
We tried to minimize selection bias through inclusive cohort definitions. However, residual confounding likely persists due to unmeasured variables such as chronicity of substance use, precise timing relative to injury events, or underlying psychological conditions. We must also mention that different urine drug screen assays have different sensitivities for detecting benzodiazepines; therefore, it is possible for the urine drug screen to be falsely negative or positive. The urine drug screen at this Level I trauma center only screens for opioids, no opiates. Therefore, fentanyl and other synthetic opiates may not have been detected. Finally, the amphetamine assay of the urine drug screen is unreliable and many drugs, such as those used to treat attention deficit hyperactivity disorder, will yield a positive result.
Blood alcohol level and urine drug screen, per institution protocol, should be obtained for every trauma patient. However, actual practice of obtaining a blood alcohol level and urine drug screen for trauma cases may vary by clinician. There may have been bias at the clinician level, but there was no way to mitigate that bias in this study. In addition, we could not determine whether patients who had a positive urine drug screen in our dataset had prescriptions for these medications.
An additional limitation is the number of blood alcohol level-positive patients. Due to the retrospective nature of the study and that information was extracted from the Pennsylvania Trauma Systems Foundation Database Collection System, we could not extrapolate which criteria were used to determine when a patient would have a blood alcohol level (or urine drug screen) ordered. Only 286 of 405 patients had blood alcohol level testing sent. Reasons for not sending a blood alcohol level are unknown but may have been due to clinical judgement.
Only 11 patients had a positive blood alcohol level making it difficult to draw significant conclusions on the relationship between positive blood alcohol level and injury severity. In this study, those with a positive blood alcohol level had lower injury severity as measured by ISS and hospital admission and LOS. However, these results may have been different if more patients with a positive blood alcohol level could have been included in the analysis. Levels of blood alcohol level-positivity were not correlated to severity of injury due to the small number of positives; having a larger sample of blood alcohol level-positive patients would have allowed for this correlation, which may have strengthened results.
Given the small sample size of 405 patients, our results should be interpreted with caution given the low number of positive results. Information was extracted from the Pennsylvania Trauma Systems Foundation Database Collection System, which provided data on all adolescents treated for trauma-related presentations during the study period. The Level I trauma center serves all Central Pennsylvania, which contains populations from rural, suburban, and urban settings. To strengthen the generalizability of our findings and clarify causal relationships, future research should prioritize prospective, multicenter studies with standardized toxicology screening protocols. Investigations into the effectiveness of ED-based interventions, such as brief motivational interviewing and structured referrals to substance abuse treatment, are essential. Addressing sociodemographic disparities and their influence on substance use and trauma outcomes should also be a focal point of future studies. Prospective, multicenter studies with standardized screening protocols are warranted to validate these associations.
The results of this study should be significant to those with a focus on policy and practice. Programs targeting broader social determinants, including mental healthcare access, community support, and socioeconomic interventions, could substantially reduce substance-related trauma risk among vulnerable adolescents. Policies and practices that focus on decreasing the use of alcohol and substances by adolescents are critical.
CONCLUSION
Our study highlights critical associations between adolescent substance use, particularly benzodiazepines, and increased trauma severity and healthcare utilization. Systematic substance-use screening in pediatric trauma settings appears justified, particularly as a tool for identifying adolescents at higher risk for severe clinical outcomes and complex clinical trajectories. Our findings underscore the need for comprehensive clinical assessments and targeted interventions addressing both substance use and underlying sociodemographic vulnerabilities to improve outcomes among injured adolescents.
Sandelich et al.
Address for Correspondence: Stephen Sandelich, MD, Penn State Milton S. Hershey Medical Center and Penn State College of Medicine, 500 University Dr, Hershey, PA 17033. Email: ssandelich@pennstatehealth.psu.edu.
Conflicts of Interest: By the WestJEM article submission agreement, all authors are required to disclose all affiliations, funding sources and financial or management relationships that could be perceived as potential sources of bias. No author has professional or financial relationships with any companies that are relevant to this study. There are no conflicts of interest or sources of funding to declare.
1. Turcu TA, Lescaie A, Grama AR, et al. Patterns and emerging trends in acute poisoning with substances of abuse used for recreational purposes in adolescents: a six-year multicentre study. Life (Basel). 2024;14(8):1033.
2. Renny MH, Love JS, Walton MA, et al. Emergency department screening and interventions for adolescents with substance use: a narrative review. J Emerg Med. 2024;67(5):e414-24.
3. Bell LA, Hadland SE. The changing landscape of adolescent and young adult substance use. J Adolesc Health. 2024;75(5):706-8.
4. Substance Abuse and Mental Health Services Administration. Key Substance Use and Mental Health Indicators in the United States: Results from the 2023 National Survey on Drug Use and Health. 2024. Available at: https://www.samhsa.gov/data/sites/default/files/ reports/rpt47095/National%20Report/National%20Report/2023nsduh-annual-national.pdf. Accessed January 15, 2025.
5. Friedman J, Hadland S. The overdose crisis among U.S. adolescents. N Engl J Med. 2024;390(2).
6. Miech RA, Johnston LD, Patrick ME, et al. Monitoring the Future: National Survey Results on Drug Use, 1975–2023: Secondary School Students. National Institute on Drug Abuse; 2023:5-62.
7. Richmond-Rakerd LS, Slutske WS, Wood PK. Age of initiation and substance use progression: a multivariate latent growth analysis. Psychol Addict Behav. 2017;31(6):664-75.
8. Kingston S, Rose M, Cohen-Serrins J, et al. A qualitative study of the context of child and adolescent substance use initiation and patterns of use in the first year for early and later initiators. PLoS One. 2017;12(1):e0170794.
9. Behrendt S, Wittchen HU, Höfler M, et al. Transitions from first substance use to substance use disorders in adolescence: Is early onset associated with a rapid escalation? Drug Alcohol Depend. 2009;99(1):68-78.
10. Pitkänen T, Lyyra AL, Pulkkinen L. Age of onset of drinking and the
use of alcohol in adulthood: a follow-up study from age 8 to 42 years. Addiction. 2005;100(5):652-61.
11. McCabe S. Substance use and abuse in trauma: implications for care. Crit Care Nurs Clin North Am. 2006;18(3):371-85.
12. Brisebois N, Bratu I. Screening for alcohol and drug use in pediatric trauma. Can J Surg. 2023;66(3):E321.
13. Lu ZN, Yeates EO, Grigorian A, et al. Alcohol is not associated with increased mortality in adolescent traumatic brain injury patients. Pediatr Surg Int. 2022;38(4):599-607.
14. Leijdesdorff HA, Legué J, Krijnen P, et al. Traumatic brain injury and alcohol intoxication: effects on injury patterns and short-term outcome. Eur J Trauma Emerg Surg. 2021;47(6):2065-72.
15. Riuttanen A, Jäntti SJ, Mattila VM. Alcohol use in severely injured trauma patients. Sci Rep. 2020;10(1):17891.
16. Bloom SR, Grigorian A, Schubl S, et al. Marijuana use associated with decreased mortality in trauma patients. Am Surg. 2022;88(7):1601-6.
17. Ahmed N, Kuo YH. Impact of cannabis on outcome in patients following traumatic injury. Injury. 2023;54(9):110808.
18. Cannon R, Bozeman M, Miller KR, et al. The prevalence and impact of prescription controlled substance use among injured patients at a Level I trauma center. J Trauma Acute Care Surg. 2014;76(1):172-5.
19. Cheng V, Inaba K, Johnson M, et al. The impact of pre-injury controlled substance use on clinical outcomes after trauma. J Trauma Acute Care Surg. 2016;81(5):913-20.
20. Pandya U, O’Mara MS, Wilson W, et al. Impact of preexisting opioid use on injury mechanism, type, and outcome. J Surg Res. 2015;198(1):7-12.
21. Neeki MM, Dong F, Liang L, et al. Evaluation of the effect of methamphetamine on traumatic injury complications and outcomes. Addict Sci Clin Pract. 2018;13(1):11.
22. von Elm E, Altman DG, Egger M, et al. The Strengthening the Reporting of Observational Studies in Epidemiology (STROBE) statement: guidelines for reporting observational studies. Ann Intern Med. 2007;147(8):573-7.
23. Worster A, Bledsoe RS, Cleve P, et al. Reassessing the methods of medical record review studies in emergency medicine research. Ann Emerg Med. 2005;45(4):448-51.
24. Hides L, Limbong J, Vallmuur K, et al. Alcohol-related emergency department injury presentations in Queensland adolescents and young adults over a 13-year period. Drug Alcohol Rev. 2015;34(2):177-84.
25. Linakis JG, Chun TH, Mello MJ, et al. Alcohol-related visits to the emergency department by injured adolescents: a national perspective. J Adolesc Health. 2009;45(1):84-90.
26. Draus JM, Santos AP, Franklin GA, et al. Drug and alcohol use among adolescent blunt trauma patients: dying to get high? J Pediatr Surg. 2008;43(1):208-11.
27. Brockamp T, Böhmer A, Lefering R, et al. Alcohol and trauma: the influence of blood alcohol levels on the severity of injuries and outcome of trauma patients. Scand J Trauma Resusc Emerg Med. 2021;29(1):101.
Documentation of Extended Focused Assessment with Sonography in Trauma (eFAST) Is Frequently Incomplete: A Prospective Observational Study
Magdelyn Feuerherdt, BS*
Miriam R. Elman, MS, MPH†||
Bryson Hicks, MD*‡
Alfredo Sabbaj, MD*‡
William J. McLean, BS§
Aishwarya Sreenivasan, MS*
Cynthia Gregory, PhD*
Kenton Gregory, MD*
Nikolai Schnittke, MD, PhD*‡
Section Editor: Robert R. Ehrman, MD, MS
Oregon Health & Science University, Center for Regenerative Medicine, Portland, Oregon
Oregon Health & Sciences University, School of Public Health, Portland, Oregon
Oregon Health & Science University, Department of Emergency Medicine, Portland, Oregon
Oregon Health & Science University, School of Medicine, Portland, Oregon
Portland State University, School of Public Health, Portland, Oregon
Submission history: Submitted September 18, 2025; Revision received January 15, 2026; Accepted January 17, 2026
Electronically published May 14, 2026
Full text available through open access at http://escholarship.org/uc/uciem_westjem DOI 10.5811/westjem.52905
Introduction: The extended focused assessment with sonography in trauma (eFAST) is a pointof-care ultrasound protocol that identifies life-threatening thoracoabdominal trauma. Clinical documentation of the eFAST is essential to convey medical decisions, but the extent of documentation in clinical practice is unknown. This study describes the proportion of eFAST exams that are documented in the medical record, the type of documentation (free text vs procedure note), and clinical factors associated with documentation.
Methods: This prospective, single-center study evaluated the documentation of consecutive eFAST exams performed at a single Level I trauma center between November 2021–November 2022. Research coordinators observed all trauma activations and noted whether any portion of an eFAST was performed. Our primary outcome was the presence of any documentation in the chart. We analyzed secondary outcomes using a multivariable logistic regression model and included the type of documentation (any documentation vs billable procedure note) as well as patient- (body mass index, age, sex, shock index > 1, and presence of pathology on reference test) and operator-level (involvement of ultrasound faculty) factors associated with each type of documentation.
Results: A total of 335 patients had a witnessed eFAST performed during the study period. No documentation was observed in 114/335 (34%) patients compared to any documentation in 221/335 (66%). Most documentation was free text only in 134/335 (40%) patients, with only 87/335 (25.9%) of patients with billable documentation. Regression analysis found that shock index > 1 (adjusted odds ratio [aOR] 7.37; 95% CI, 2.55-31.29), presence of pathology on eFAST (aOR 2.07; 95% CI, 1.243.51), and involvement of ultrasound section faculty (aOR 1.93; 95% CI, 1.05-3.66) were significantly associated with an increase in any documentation.
Conclusion: Approximately one-third of performed trauma eFAST exams are undocumented, and only one-quarter of exams have structured documentation that enables billing. Further work is needed to understand factors that can lead to improved documentation quality to communicate results, justify medical decision-making, and augment reimbursement. [West J Emerg Med. 2026;27(3)629–635.]
INTRODUCTION
The extended focused assessment with sonography in trauma
(eFAST) is a point-of-care ultrasound (POCUS) protocol that enables rapid identification of life-threatening thoracoabdominal
injuries, including hemoperitoneum, hemopericardium, hemothorax, and pneumothorax.1 Results of the eFAST guide emergent management such as tube thoracostomy placement, operative intervention, and/or blood product administration.2 Multiple organizations, including the American College of Emergency Physicians, the Centers for Medicare & Medicaid Services, and the American College of Surgeons, recommend standardized documentation of POCUS. These guidelines recommend including information on patient demographics, indications, views, findings, and interpretations in a structured procedure note. This documented information is used to communicate medical decision-making to other clinicians, billing/coding groups, and ultrasound faculty who provide education and feedback for their clinical groups.3-5
Despite the importance of documentation as a key element of patient care, many POCUS procedures may be documented only partially or not at all.6-10 There is little published evidence of specific barriers to documentation. A single, before-after retrospective study did reveal a positive effect of clinician education on documentation compliance, suggesting that clinicians may not receive enough guidance on documentation protocols, are unaware of the importance of documentation elements, or lack the confidence to document a scan as a billable procedure.11 Other potential barriers include the time-sensitive nature of trauma resuscitation and institutional lack of standardized, accessible documentation pathways. This gap in patient records, referred to as “phantom scans” in the literature,9 can have consequences for both patients and clinicians. Delayed communication of pertinent clinical information can reduce effective communication between clinicians. Inadequate documentation also impedes quality review and education efforts by ultrasound faculty who look at documented POCUS interpretation to identify operator knowledge gaps.
Incomplete POCUS documentation is difficult to study, because it is challenging to identify how many exams are performed if they remain undocumented.9 A lack of research on the topic means that the frequency of improper documentation and contributing factors is largely unknown. In this study, we took advantage of the presence of clinical research coordinators (CRC) at all trauma resuscitations. The CRCs tracked performance of the eFAST in a prospective manner. Our goal in this study was to describe the incidence of documentation of eFAST in trauma patients and to determine the impact of patientand operator-level variables on documentation.
METHODS
Study Design and Setting
This single-center, prospective study took place at a Level I trauma center in the Portland, Oregon, metropolitan area between November 5, 2021–November 5, 2022, with an annual volume of 40,000 including 2,600 trauma patients. The institution is affiliated with a medical school as well as emergency medicine (EM) and general surgery residency programs. All trauma
Population Health Research Capsule
What do we already know about this issue?
Past studies reported that point-of-care ultrasound exams are often not saved; however, the proportion of exams documented in the chart is unknown.
What was the research question?
We determined the proportion of performed extended focused assessment with sonography in trauma (eFAST) exams docu[1]mented in the health record.
What was the major finding of the study?
34% of trauma eFAST exams are not documented, and only 25.9% use structured documentation.
How does this improve population health?
Effective communication is essential to ensure appropriate care. By defining the problem of sparse eFAST documentation we identify a quality improvement goal.
activations are attended by at least two trauma residents (a trauma chief resident and a junior resident) and an EM attending. The emergency department is equipped with a variety of ultrasound machines (Mindray TE7 and M9 platforms and Philips Lumify) with curvilinear, linear, and phased array transducers. The choice of machine, transducer, and preset was deferred to the clinicians performing the exam based on availability and clinical scenario. An EM resident is present at most trauma activations except during excused educational conference one morning a week. All EM attendings have hospital privileges to perform and interpret the eFAST. All incoming EM residents receive eight hours of training by ultrasound faculty in POCUS (including eFAST) prior to starting shifts followed by a four-week dedicated POCUS rotation during the first year of residency. All saved POCUS studies are backed up to the image repository ExoWorks (Exo Imaging, Inc, Santa Clara, CA) where members of the ultrasound section (four full-time faculty and one emergency ultrasound fellow) perform weekly quality assurance for targeted minimum of 80% of all uploaded studies.
Patients were identified as part of a larger project to acquire ultrasound imaging for training artificial intelligence image guidance and interpretation algorithms. Trauma patients were screened for enrollment in the larger study based on whether a clinical ultrasound exam was performed. This study describes an analysis of the screening log, conducted under a waiver of informed consent approved by the institutional review board. The
Feuerherdt et al.
reporting of the study follows the Strengthening the Reporting of Observational Studies in Epidemiology (STROBE)12 and Standards for Point-of-care Ultrasound Research Reporting (SPUR)13 guidelines (Supplemental File).
Patient Population
All consecutive trauma activations were attended by at least one CRC who observed whether any portion of the eFAST was performed (defined as observation of an ultrasound of the thorax and/or abdomen). Adult patients (≥ 18 years of age) who had an observed eFAST performed were entered into a screening log for the parent study and included in the analysis. We excluded pediatric patients and patients who did not have an eFAST performed. Due to the descriptive nature of the study, we did not perform a power calculation.
Chart Review
Two trained, independent reviewers, blinded to the study goals performed chart review of the electronic health record (EHR) (Epic Systems Corporation, Verona, WI), following a standardized data collection guide (Supplemental File), and entered data in the REDCap electronic data capture tools hosted at Oregon Health & Sciences University.14 Collected data included patient demographics (sex, age, and body mass index [BMI] calculated as kilograms per square meter), vital signs (systolic and diastolic blood pressure, heart rate, calculated shock index), trauma mechanism (blunt or penetrating), surgical findings, computed tomography (CT) and findings, eFAST exam elements and findings, and the level of documentation present in the patient’s medical record. The involvement of an ultrasound faculty member was defined based on whether the author or co-signer of the note was ultrasound-fellowship trained or an ultrasound fellow during the study period. Additional data on the operator(s) involved (eg, medical student, EM resident, or surgery resident) was not reliably available in our dataset. Each pathologic element (hemoperitoneum, hemopericardium, pneumothorax, hemothorax) of the eFAST was considered assessed if it was explicitly mentioned in the documentation. If free-text documentation did not explicitly address a pathology, we considered mention of a positive/negative FAST as assessing for hemoperitoneum and hemopericardium only, while mention of a positive/negative eFAST exam also assessed for thoracic pathology (pneumothorax and hemothorax). To test chart review accuracy, both reviewers abstracted 10% of the charts, and agreement was found to be high (all field kappa = 0.90 [95% CI, 0.84-0.96] and kappa for the primary documentation outcome = 0.90 [0.71-1.0]).
Outcomes
The primary outcome was whether any eFAST documentation was found in the EHR notes (“any documentation”). The secondary outcome further categorized whether the documentation followed a structured procedure note,
Documentation of eFAST Is Frequently Incomplete
which is used at our institution for billing and coding (“billing documentation”). Both outcomes were defined dichotomously as having that class of documentation or not having it. The study focused on textual documentation and did not assess whether images were saved.
Statistical Analysis
We reported patient demographic and clinical characteristics as frequency with percentage for categorical variables and median with interquartile range (IQR) for continuous variables. The presence of ultrasound documentation of patients with and without the reference standard (defined as pathology on CT or surgical confirmation) were compared by chi-square or Fisher exact tests, as appropriate.
We used multivariable logistic regression to determine the association between patient and clinical characteristics and the presence of eFAST documentation for both outcomes. Clinical knowledge was used to a priori select the set of characteristics to include in models for both outcomes: patient sex (female, male); BMI; calculated shock index (≤ 1, > 1); ultrasound faculty performed or supervised the eFAST (yes, no); and presence of confirmatory findings on CT (yes, no). Sixteen individuals had missing BMI values, and these subjects were excluded from regression models. Odds ratios (OR) from univariable and multivariable models were reported with 95% confidence intervals. Further details of the methods and model diagnostics are presented in the Supplemental File.
Sensitivity Analyses
In cases where data lack adequate case numbers for combinations of independent variables and outcome levels, estimates based on maximum likelihood estimation like from logistic regression may suffer from sparse data bias, which can cause overestimation.15 To assess the magnitude of sparse data bias in models for our primary outcome, we performed sensitivity analyses using a Bayesian approach to reduce this bias in logistic models (detail in Supplemental File). We used two-sided P values < 0.05 to assess statistical significance, and R software v4.3.1 (R Foundation for Statistical Computing, Vienna, Austria) for analysis.
RESULTS
We identified 335 patients who had a witnessed ultrasound performed during their trauma evaluation (73.1% male, 26.9% female), with a median age of 40 years (IQR 29-58). Table 1 summarizes demographic features, characteristics of clinical presentation, and findings on confirmatory reference standard. Figure 1 demonstrates the frequency of no documentation (114/335, 34%), any documentation (221/335, 66%), billing documentation (87/335, 26%), and unstructured (free-text) documentation (134/335, 40%). Table 2 reports the elements of the eFAST and frequency of documentation based on pathology on reference standard (CT or surgical confirmatory test). Most
Documentation of eFAST Is Frequently Incomplete
documented ultrasounds reported views of the peritoneum (192, 57.3%) and pericardium (178, 53.1%), while a minority reported views of the lungs to evaluate for pneumothorax (106, 31.6%) and hemothorax (77, 23.0%). Patients with pathology on reference standard were significantly more likely to have any documentation for assessment of hemoperitoneum than those without pathology (76.7% vs 51.9%, P < .001), as were those with assessment of pneumothorax (52.9% vs 26.2%, P < .001).
Almost two-thirds of patients (221/335, 66%) had some form of documentation from the witnessed eFAST in their chart, while just over a quarter had complete billing documentation (87/335, 25.9%). Table 3 reports the patient characteristics by documentation class. In multivariable models of any documentation, shock index > 1 (adjusted OR [aOR]7.37; 95% CI, 2.55-31.29), positive reference standard (aOR: 2.07 [1.243.51]), and involvement of an ultrasound faculty operator (aOR 1.93, 1.05-3.66) were significantly associated with presence of any documentation (Table 4). By contrast, only the involvement of an ultrasound faculty operator was associated with the
Table 1. Demographics and clinical characteristics of patients with a witnessed extended focused assessment with sonography for trauma in a study of the frequency of documentation of these ultrasound exams.
Characteristic
Sex, n (%)
Male
Female
Age, median (IQR)
BMI, median (IQR)
Missing, n (%)
Heart rate, median (IQR)
Shock index ≤ 1, n (%)
Pulse pressure, median (IQR)
Mechanism of injury, n (%)
Blunt
Penetrating
Study patients (N = 335)
244 (73.1)
90 (26.9)
40.0 (29.0, 58.0)
27.0 (23.6, 30.7)
16 (4.8)
95.0 (80.0, 111.0)
290 (86.6)
43.0 (29.0, 55.0)
275 (82.1)
57 (17.0)
Missing 3 (0.9)
CT performed, n (%)
Surgery performed, n (%)
Pathology identified on reference standard, n (%)a
Hemoperitoneum
Hemopericardium
Pneumothorax
Hemothorax
Figure 1. Flow diagram of documentation of extended focused assessment with sonography in trauma for patients with a witnessed ultrasound during trauma resuscitation.
“No documentation” indicates patients with no reference to the eFAST in the medical record. “Any documentation” indicates patients with a reference to the eFAST in the medical record. “Billing documentation” indicates patients with a structured procedure note in the medical record. “Unstructured documentation” indicates patients with unstructured (free text) reference to the eFAST in the medical record. eFAST, extended focused assessment with sonography in trauma.
presence of billing documentation (aOR 3.72; 95% CI: 2.086.69).
In modeling the primary outcome (“any documentation”), the number of patients with a SI > 1 was rare among patients with no documentation (n = 4, Table 2). To assess overestimation from sparse data bias, we performed a Bayesian sensitivity analysis. This model suggests that SI retained a strong, significant association with any documentation even with models that shrink coefficients to address sparse data biases (Table S1).
DISCUSSION
307 (91.6)
53 (15.8)
73 (21.8)
8 (2.4)
68 (20.3)
45 (13.4)
aReference standard includes CT findings, surgical findings, and/ or procedural findings such as chest tube placement.
BMI, body mass index; CT, computed tomography; eFAST, extended focused assessment with sonography in trauma; IQR, interquartile range.
Standardized and accessible documentation is important for patients and clinicians. It allows for effective communication of a patient’s medical care, ensures continuity of care, and justifies medical decision- making. Documentation of POCUS findings is particularly important because operator skill plays an important role in image quality and interpretation. Deficiencies in real-world documentation of POCUS studies have been described but are difficult to study due to challenges in case identification. To the best of our knowledge, this is the first study to prospectively identify all eFAST studies that were performed during trauma activation. In this study, over onethird of patients who had a witnessed eFAST did not have the procedure documented, and only 25.9% had structured
Table 2. Assessment of documentation from study patients based on elements of the extended focused assessment with sonography in trauma and presence of pathology on reference standard (CT or surgical confirmatory test).a
POCUS documentation (n, % of total 335 patients) Pathology on reference standard Pb
Any Documentation 13 (28.9) 64 (22.1) No Documentation 32 (71.1) 226 (77.9)
aThe number of patients (% of total, N = 335) is reported for the elements of the eFast with pathology present or absent on reference standard.
bFisher exact test used for hemopericardium; all others are chisquare test.
CT, computed tomography; eFAST, extended focused assessment with sonography in trauma; POCUS, point-of-care ultrasound.
documentation that could be used for billing purposes.
Our results are consistent with other studies that have investigated phantom scanning, defined by a recent consensus statement as a POCUS “study that has not been documented in the medical record or has archived images; when audited it does not exist.”9 One single-center study evaluated the prevalence of unsaved images in trauma and cardiac arrest studies that were documented in the nursing run sheet and found that 86.5% of all studies had no corresponding saved images.7 A recent follow-up multicenter study by some of the same authors found substantial site variability with unsaved images found in 21.4-93.2% of eFAST exams, indicating heterogeneity in practice.10 Another retrospective study examined the documentation accuracy of eFAST with saved images and found that 29.8% (1,450/4,860) were undocumented, technically limited, or incomplete.6
To address these gaps in documentation a recent retrospective study from Sydney, Australia, found that implementation and teaching of an eFAST documentation guideline improved compliance during a three- month follow-up period.11 However, this was a relatively small study with a short follow-up period. More work is needed to understand the long-term impact of guideline education, as documentation
guidelines have existed in the United States since at least 2001,16 yet compliance continues to be sparse. Taken together the existing evidence demonstrates a significant knowledge gap in defining the problem of phantom scanning and addressing factors contributing to this phenomenon.
To address factors that may contribute to documentation quality we focused on patient and operator characteristics. For patient characteristics we selected the presenting SI as a surrogate measure of illness severity because this metric is relatively simple to obtain and reduced drop-out due to missing data. The SI is also more directly related to severity of hemorrhagic or obstructive shock that is assessed by the eFAST than level of trauma activation or Injury Severity Score, which can be confounded by other factors such as brain injury.17,18 A SI > 1 was strongly associated with the presence of some documentation, but not with structured billing documentation. This may be due to the perceived need to document clinically significant findings but difficulty saving images and task saturation in sicker patients. The presence of pathology on confirmatory testing was also associated with increased documentation. Taken together, our findings suggest that clinicians are more likely to document positive findings in sicker patients who have a higher rate of acute interventions necessitating communication for continuity of care by multiple care teams.
Our results demonstrated a significant discrepancy in quality of documentation. Unstructured documentation was the most common but lacked details of the views acquired, interpretation by pathology, and indication for the exam. The eFAST assesses four different pathologies, but in unstructured documentation it is often listed simply as a binary (“FAST positive” or “FAST negative”). This lack of detail may explain why we observed less documentation of thoracic findings (pneumothorax and hemothorax), since documentation of a FAST as a binary exam does not include those thoracic views. In addition to billing, structured documentation facilitates consistent communication of relevant results and study limitations. Knowledge of the variables provided by structured documentation is essential for asynchronous review and feedback to identify opportunities for clinical operator improvement. At our institution, this image review is performed by members of the ultrasound faculty. Therefore, it is not surprising that involvement of these clinicians is most associated with structured billing documentation.
Future studies should focus on three features of phantom scanning: 1) qualitative study to understand barriers to documentation and help identify opportunities for improvement; 2) studies focusing on patient-centered consequences (eg, delays in care and appropriateness of care) to help define the impact of incomplete documentation and the need for documentation in clinician education; and 3) investigation into methods of improving documentation (such as workflow improvements and integration of machine-learning algorithms to automate saving and documenting the performed exams) to facilitate better care of injured patients.
n (%)
index,
BMI, body mass index; eFAST, extended focused assessment with sonography in trauma; IQR, interquartile range.
LIMITATIONS
This was a single-center study, which limits external validity; therefore, the results may not be generalizable to other settings, particularly non-academic trauma centers. To account for this limitation we provide a detailed description of our setting in the methods. We suspect that our data are a “best case” estimate of eFAST documentation, given the POCUS infrastructure at our institution. In addition, while we used a novel, consecutive-case identification strategy, it is possible that the CRCs missed a POCUS being performed, particularly during more chaotic resuscitations. An analysis of video recordings of the resuscitation (which our institution initiated after the study period) may provide a more accurate assessment of the true number of ultrasounds performed.
The study was also limited by the selected classes of documentation, which assumes that documentation in each class (any documentation and billing documentation) is uniform and that the same level of documentation is indicated for all eFAST exams performed. In fact, documentation is variable even within these classes (eg, some free-text documentation may include
substantial detail, while some structured documentation may be missing important elements). Additionally, we were unable to assess why a clinician chose to document in a certain way. It is possible that some studies were performed for educational purposes and were not felt to be clinically indicated. To account for this confounder, we only included the initial evaluation when the CRC was present to witness the clinical care. During this phase of resuscitation there are fewer educational scans performed as these studies are typically deferred for more stable patients after their return from CT. It is likely that additional heterogeneity of clinicians (EM vs surgery resident or faculty) further contributed to documentation compliance; however, we were unable to reliably identify the clinician performing the ultrasound within the limitations of our data set.
Finally, we did not consider whether ultrasound images were saved. Saved images are a prerequisite for billing, and it is possible that the operator did not complete billing documentation knowing that they were unable to save images. This is an inherent limitation of POCUS, especially during task-saturated resuscitations of sicker patients. However, complete
Table 4. Results of logistic regression for documentation outcomes (n = 319 patients).*
(0.98, 1.06) .29 16 patients with missing BMI were excluded from the regression. BMI, body mass index OR, odds ratio; aOR, adjusted odds ratio; SI, shock index; US, ultrasound.
Table 3. Patient demographic and clinical characteristics of patients with a witnessed extended focused assessment for trauma by documentation class.
Feuerherdt et al.
documentation is particularly important in these patients as the ultrasound results are most likely to guide the operator toward critical, high-stakes interventions.
CONCLUSION
This prospective study of documentation of extended focused assessment with sonography for trauma during trauma resuscitations describes deficiencies in an existing documentation workflow. Severity of illness and the presence of pathology are associated with an increase in documentation. Involvement of an ultrasound faculty member was associated with documentation of eFAST findings in a structured, billable format.
ACKNOWLEDGMENTS
Funding and technical support for this work were provided by the Biomedical Advanced Research and Development Authority (BARDA), the Administration for Strategic Preparedness and Response, and the U.S. Department of Health and Human Services under ongoing USG Contract No. 75A50120C00097.
The authors gratefully acknowledge the Clinical Research Investigative Studies Program (CRISP) and the Trauma Research Team at Oregon Health & Science University School of Medicine, Department of Emergency Medicine, for subject enrollments and study procedures. In particular, we acknowledge Jenna Robinson’s contributions as a member of CRISP.
Address for Correspondence: Nikolai Schnittke, MD, PhD, Oregon Health & Science University, Department of Emergency Medicine, 3181 SW Sam Jackson Park Road, Portland, OR 97239-3098. Email: schnittk@ohsu.edu.
Conflicts of Interest: By the WestJEM article submission agreement, all authors are required to disclose all affiliations, funding sources and financial or management relationships that could be perceived as potential sources of bias. The work presented is funded by BARDA in collaboration with Philips. The sponsors reviewed the manuscript to ensure protection of intellectual property but were not involved in the conduct of this research or writing of the manuscript. There are no conflicts of interest to declare.
1. Montoya J, Stawicki SP, Evans DC, et al. From FAST to E-FAST: an overview of the evolution of ultrasound-based traumatic injury assessment. Eur J Trauma Emerg Surg. 2016;42(2):119-26.
2. Williams SR, Perera P, Gharahbaghian L. The FAST and E-FAST in 2013: trauma ultrasonography: overview, practical techniques, controversies, and new frontiers. Crit Care Clin. 2014;30(1):119-50.
3. Fojut R. Trauma Survey Notebook: ACS Level II reverification review
Documentation of eFAST Is Frequently Incomplete
in Colorado. Trauma System News. 2025. Available at: https:// trauma-news.com/2025/05/trauma-survey-notebook-acs-level-iireverification-review-in-colorado/. Accessed May 21, 2025.
4. Liu RB, Blaivas M, Moore C, et al. Emergency ultrasound standard reporting guidelines. 2018. Available at: https://www.acep.org/ siteassets/uploads/uploaded-files/acep/clinical-and-practicemanagement/policy-statements/information-papers/emergencyultrasound-standard-reporting-guidelines---2018.pdf. Accessed October 4, 2025.
5. Jackson JJ, Mabry C, Savarise MT, et al. Effectively using E/M codes for trauma care. Bull Am Coll Surg. 2013;68(6):56-65.
6. Khosravian K, Boniface K, Dearing E, et al. eFAST exam errors at a Level I trauma center: a retrospective cohort study. Am J Emerg Med. 2021;49:393-8.
7. Boivin Z, Xu C, Doko D, et al. Prevalence of phantom scanning in cardiac arrest and trauma resuscitations: the scary truth. POCUS J. 2023;8(2):217.
8. Shwe S, Witchey L, Lahham S, et al. Retrospective analysis of eFAST ultrasounds performed on trauma activations at an academic Level I trauma center. World J Emerg Med. 2020;11(1):12.
9. Nomura JT, Flannigan M, Liu RB, et al. Consensus terminology for point-of-care ultrasound studies with incomplete documentation and workflow elements. POCUS J. 2022;7(1):116-7.
10. Boivin Z, Dwyer KH, Pare JR, et al. Prevalence of ghost scans in point-of-care ultrasound for trauma patients: a multicenter study. Am J Emerg Med. 2026;99:354-8.
11. Rossi J, Van Assche A. Implementation of an EFAST guideline and teaching to improve documentation practices and saving of ultrasound images. Emerg Med Australas. 2024;36(4):645-7.
12. von Elm E, Altman DG, Egger M, et al. Strengthening the Reporting of Observational Studies in Epidemiology (STROBE) statement: guidelines for reporting observational studies. BMJ. 2007;335(7624):806-8.
13. Schnittke N, Russell FM, Gottlieb M, et al. Standards for Point-ofcare Ultrasound Research Reporting (SPUR): a modified Delphi to develop a framework for reporting point-of-care ultrasound research. Acad Emerg Med. 2025;32(8):916-25.
14. Harris PA, Taylor R, Minor BL, et al. The REDCap Consortium: building an international community of software platform partners. J Biomed Inform. 2019;95:103208.
15. Heinze G, Wallisch C, Dunkler D. Variable selection – a review and recommendations for the practicing statistician. Biom J. 2018;60(3):431-49.
16. ACEP emergency ultrasound guidelines–2001. Ann Emerg Med. 2001;38(4):470-81.
17. Carsetti A, Antolini R, Casarotta E, et al. Shock index as predictor of massive transfusion and mortality in patients with trauma: a systematic review and meta-analysis. Crit Care. 2023;27(1):85.
18. Olaussen A, Blackburn T, Mitra B, et al. Review article: shock index for prediction of critical bleeding post-trauma: a systematic review. Emerg Med Australas. 2014;26(3):223-8.
Educational Advances
Pilot Simulation Task Trainer for Prehospital Management of Neck Hemorrhage
Sarah Sussman, MD*
Luigi Melaragno, BS†
Eric Nisenbaum, MD*
Megan Malara, PhD‡
Rachel Herster, MSE‡
Chipper Orban, AS‡
Matthew Marquardt, BA§
Catherine Haring, MD*
Kimberly G. Harmon, MD||
Kyle VanKoevering, MD*‡
Section Editor: Lesley Osborn, MD
The Ohio State University Wexner Medical Center, Department of Otolaryngology –Head and Neck Surgery, Columbus, Ohio
University of Cincinnati College of Medicine, Cincinnati, Ohio
The Ohio State University Center for Design and Manufacturing Excellence, Columbus, Ohio
The Ohio State University, College of Medicine, Columbus, Ohio
The University of Washington, Department of Family Medicine, Seattle, Washington
Submission history: Submitted May 5, 2025; Revision received January 4, 2026; Accepted January 4, 2026
Electronically published May 3, 2026
Full text available through open access at http://escholarship.org/uc/uciem_westjem
DOI 10.5811/westjem.47912
Introduction: Traumatic injuries are the leading cause of death in the U.S. of persons < 45 years of age, with 5-10% of all traumas caused by penetrating neck injuries (PNI). The neck contains several large blood vessels that supply the brain; thus, exsanguination is the leading cause of fatality in PNI. Vascular neck trauma is common in assaults, motor vehicle accidents, battlefields, and sporting events, particularly in ice hockey. There is a general lack of guidance on prehospital management of these injuries, and educating first responders, medics, and sports trainers on how to manage these complex injuries is challenging due to high costs, limited availability, and ethical considerations regarding use of cadavers or live animals. Here, we describe the development of a prehospital PNI-hemorrhage curriculum paired with a novel hands-on simulator and its pilot implementation with a group of professional hockey athletic trainers.
Methods: We conducted a literature review to understand previously proposed algorithms for PNI, traumatic life support, combat trauma, and massive hemorrhage. Concepts from each of these algorithms were considered when determining the key steps of managing a PNI and how these should differ from previously proposed algorithms. We developed a synthetic medical simulator and training curriculum in conjunction with the National Hockey League (NHL) to create a training program for athletic trainers and team physicians to improve rapid response. The simulator was designed using computed tomography of a human neck and was fabricated to mimic the material properties of human tissue.
Results: The algorithm for prehospital management of PNI was developed in three fundamental steps: 1) identify venous vs arterial bleeding patterns; 2) control the hemorrhage; and 3) transfer the patient to a trauma center. The synthetic medical simulator allowed for the simulation of arterial and venous bleeding and was used to train 180 NHL athletic trainers and physicians at their annual meeting in 2024. Voluntary quantitative and qualitative post-training feedback obtained from 46% of trainers who participated was very positive (overall rating 4.7/5).
Conclusion: Penetrating neck injuries are high-risk events that first responders are generally undertrained to manage due to their rarity. Simulation is effective to potentially improve the outcomes of these scenarios, and the use of synthetic medical simulators is cost effective. We developed a novel algorithm, medical simulator, and training curriculum for the management of PNI in conjunction with the NHL for training athletic trainers and physicians. [West J Emerg Med. 2026;27(3)636–643.]
INTRODUCTION
Trauma is the leading cause of death among U.S. residents < 45 of age, according to data from the U.S. Centers for Disease Control and Prevention. Penetrating neck injury (PNI) represents 5-10% of all trauma cases and are among the most life-threatening.1 They are often catastrophic injuries due to exsanguination, airway compromise, aerodigestive injury, or neurological injury. Vascular neck injuries in particular have a high rate of morbidity and mortality due to the level of acuity and the time it takes to reach medical attention.2,3 The neck is a complex anatomical region containing vital structures including large vessels that supply the brain, the aerodigestive tract, and cranial nerves.4-6 This area is vulnerable to injury as it is relatively exposed and anatomically unprotected, with only the sternocleidomastoid muscle providing a barrier over the deeper vascular system. The common carotid artery is the highest pressure vessel in the neck, with a mean arterial pressure of 90-150 millimeters of mercury (mm Hg) and a flow rate of approximately 500 milliliters (mL) per minute.7 The deep venous system of the neck includes the internal jugular vein, which is a lower pressure system with a typical pressure of 6-8 mm Hg. However, the jugular vein can have a flow rate of up to 650 mL/minute, which lends to the potential for massive hemorrhage with compromise of the jugular vein.8
Vascular injury may include bleeding, occlusion, dissection, pseudoaneurysm, or arteriovenous fistula.6,9 Arterial injury occurs in approximately 25% of penetrating neck injuries with carotid artery involvement in about 80% and vertebral artery in 43% of these injuries.10,11 Mortality for all vascular injuries is 50-60%.12,13 Exsanguination is the primary cause of acute mortality in these vascular injuries and, on average, the bleed-out time varies between 2-5 minutes, as per the STOP THE BLEED campaign.14 Thus, in the acute, prehospital setting, prevention of exsanguination is critical for survival of these injuries.
Penetrating neck injuries can also be seen in assault, motor vehicle accidents, and sporting events. Ice hockey has had several well publicized incidents of PNI due to the presence of bladed skates. In 1989 a professional hockey goalie had his jugular vein severed by the blade of an opponent. His athletic trainer/therapist, a former U.S. Army medic, responded promptly by holding firm pressure until he was taken to the hospital.13,14 In 2008 another professional player suffered injury to his external carotid artery and lost five units of blood requiring emergent surgery.15 Both players eventually made a full recovery. In 2022 and 2023, two amateur hockey players exsanguinated before arriving at the hospital after suffering neck laceration during games. These incidents prompted investigation into the use of neck guards as well as training hockey players and staff in how to respond to these injuries.16,17
Treating PNI has historically focused on the anatomical classification system described by Monson et al in 1969, which divides the neck horizontally into three superposed
Population Health Research Capsule
What do we already know about this issue?
Penetrating neck injury with involvement of the great vessels is associated with significant morbidity and mortality, yet there is very little training or guidance for pre-hospital management.
What was the research question?
We aimed to develop a hands-on simulator and simple algorithm to teach first responders and athletic personnel basic strategies for managing hemorrhage from penetrating neck injuries.
What was the major finding of the study?
The simulator, algorithm and instructional course were well received with an overall rating of 4.7/5.
How does this improve population health?
This training algorithm can help prepare first responders for management of catastrophic hemorrhage from penetrating neck injuries.
zones.18 More recent literature has shifted the focus toward “hard signs” and evolving endovascular management strategies in lieu of open exploration. The American College of Surgeons Advanced Trauma Life support (ATLS) program teaches a simple mnemonic ABCDE—Airway, Breathing, Circulation, Disability, Exposure—that is the cornerstone of trauma triage in the emergency setting. Battlefield ATLS has traditionally followed ATLS principles. However more recently, this algorithm has been amended to include <C>ABCDE for catastrophic hemorrhage’ followed by the conventional ABCDE algorithm.19,20 Specifically for massive hemorrhage, the American College of Surgeons produced a program in 2015 entitled “STOP THE BLEED,” which provides prehospital training that focuses on applying pressure to the source of bleeding and the use of tourniquets to decrease blood loss. The neck is unique in that a tourniquet cannot be used due to risk of airway compromise, asphyxiation, and ischemic stroke. These algorithms outline a hierarchy of initial life-saving measures that can be applied in the field to any trauma situation, civilian or combat, and emphasize the need to control catastrophic hemorrhage as the primary step.21,22 However, despite several well-established and logically sound trauma guidelines, airway management algorithms, and inhospital recommendations for vascular neck injuries, there remains a gap in the development of prehospital management
for vascular neck injuries.
Patients with vascular neck injuries can decompensate before reaching definitive medical care; therefore, we propose a simplified algorithm and novel simulation task trainer to teach athletic trainers or first responders prehospital management of vascular neck trauma while transporting to the nearest trauma center. To evaluate this algorithm and model, we implemented it among a group of professional hockey athletic trainers. In an athletic practice setting, even at the professional level, athletic trainers are frequently the highest level of medical care immediately available at the time of PNI. As such, they represent an ideal test case for our algorithm. We also describe the creation of a novel simulator that has been used for hands-on teaching of this algorithm to athletic trainers and team physicians in the National Hockey League (NHL).
METHODS
In conjunction with the NHL medical teams, we developed a curriculum around the simulation trainer and our proposed algorithm. This simplified curriculum is geared toward educating the general population and healthcare professionals, such as athletic trainers, with at least limited medical expertise for prehospital stabilization of PNI with
significant hemorrhage. The curriculum focused solely on vascular injuries and did not include content related to airway management or other associated injuries. With this curriculum, participants first were given a basic anatomy overview of the human neck and major blood vessels, including key facts about blood flow, pressure, and historical outcomes of PNIs (Figure 1). This was followed by an explanation of our threestep algorithm.
The algorithm was developed by synthesizing current trauma data, national and international trauma management guidelines, and experience from in-hospital management strategies aligned through consensus among the authors who are trained head and neck surgeons. The proposed prehospital treatment strategy consisted of three fundamental steps: 1) identify primarily venous vs high-volume arterial bleeding; 2) control the hemorrhage; and 3) transfer the patient to the nearest trauma center (Figure 2).
Step 1: Identify
A systematic approach to management of vascular neck trauma is critical. First, it is important to consider the mechanism of injury and environment to ensure the safety of the patient and caregivers. Full exposure of the neck is required, and evidence supports cervical spine collar is not
teach
Figure 1. Basic anatomy overview of the human neck and major blood vessels used in a novel curriculum designed to
prehospital management of penetrating neck injuries.
Figure 2. Proposed algorithm for prehospital management of acute vascular injury developed as part of a simulation-based curriculum for first responders and professional athletic trainers. ASAP, as soon as possible.
necessary unless there is a focal neurologic deficit or a high index of suspicion for spinal cord injury.23 In our algorithm, once a hemorrhagic PNI is identified, step 1 is for the emergency responder to identify whether a venous (high flow, low pressure, and non-pulsatile) and/or arterial bleed (brighter red, high pressure, and pulsatile) is present, as management strategies differ. The wound must be inspected by gently distracting the wound and observing for high-flow pulsatile bleeding.
Step 2: Control
Once the primary source of bleeding is identified, it is critical to control the hemorrhage as quickly as possible to prevent hemorrhagic shock or exsanguination. Venous bleeding (internal or external jugular veins) can be controlled with compression achieved by packing the wound with standard gauze to fill the laceration using a finger-over-finger technique and then applying broad pressure (Figure 3).
Unlike in other areas of the body, we recommend using standard gauze to control PNI rather than hemostatic gauze, as hemostatic agents could be deposited into an injured carotid or vertebral artery and result in embolic stroke. Proper packing and broad surface pressure are highly successful in controlling superficial and/or high-volume venous bleeding as it is a low-pressure system, and vasoconstriction and coagulation will further assist. Flow in the jugular vein can typically be completely obliterated without clinical consequence.
Should a carotid or vertebral artery injury be suspected, however, broad packing techniques are much less likely to be successful in controlling a high-pressure hemorrhage. Thus, the control technique is different for a suspected large-caliber arterial hemorrhage. It is critical to identify the origin of the pulsatile hemorrhage and apply focal digital pressure directly on the vessel either at the site of vessel injury or slightly above and below the area of hemorrhage. Focal digital pressure can seal a sidewall injury, which will allow intraluminal flowthrough and brain perfusion. Alternatively, two-finger obliteration of the arterial flow can successfully control the hemorrhage, but it does increase the risk of reduced brain perfusion and stroke. Control of the hemorrhage must be prioritized over stroke risk. If the patient has sustained an arterial injury, an internal jugular vein injury is also very likely. Thus, the next step is to pack the remaining wound around the finger following the same finger-over-finger techniques illustrated above. The finger controlling arterial hemorrhage remains in the wound until definitive care is reached.
The Foley catheter balloon-tamponade technique has been described to control bleeding in difficult-to-reach areas; however in the field, a Foley catheter is rarely available and not advisable. Consensus literature strongly advises against attempting to control bleeding with hemostats, as blindly clamping the vessel is often ineffective, may cause further injury, or prevent future repairs in the hospital setting.
Figure 3. Methods for managing carotid (arterial) vs jugular (venous) bleeding in a simulation-based curriculum for prehospital responders and athletics trainers.
Step 3: Transfer
Once bleeding is temporized, all patients with PNI or vascular injury should be transported immediately to the nearest trauma center. The primary caregiver should keep their hands in position, holding constant pressure until hospital delivery. Patients can rapidly decompensate. Monitor vital signs as able, wakefulness, and signs of stroke, which may include somnolence, blown pupil, or contralateral hemiparesis.
Developing the Task Trainer
In addition to the above proposed algorithm, we describe a novel task trainer that was developed in conjunction with the NHL for a training curriculum for over 180 athletic trainers and team physicians. Using computed tomography of a human neck, 3D printing, and silicone molding, our team developed a synthetic model of a PNI that provides a realistic representation of vascular anatomy. The model includes an outer layer of EcoFlex 00-30 silicone (Reynolds Advanced Materials U.S., Inc, Macungie, PA) with a Shore00 durometer (PTC Instruments, Los Angeles, CA) of 30, to mimic the durometer of skin, and an inner layer of EcoFlex 00-10, which has a Shore00 Durometer of 10, similar to subcutaneous tissue. The inner “subcutaneous” layer surrounds two channels lined with rubber tubing representing the carotid artery and jugular vein. The tubing used to simulate the carotid was made of an elastic latex rubber material 10 mm in diameter with a 1.5-mm wall thickness. The tubing used to simulate the jugular was made of a biocompatible silicone rubber and was
14 mm in diameter with a 1-mm wall thickness. The increased thickness and elasticity of the carotid tubing compared to the thinner, more compliant jugular tubing mimicked the material properties of the true anatomical structures.
The model includes a built-in laceration penetrating through both layers of silicone to the vascular channels. The vascular tubing exits the model and runs to a camp shower filled with artificial, blood-like fluid. The carotid artery system is equipped with a simple piston motor that periodically occludes the tubing, resulting in pulsative flow from and the blood reservoir (camp shower), which is set at a height of 160 cm to facilitate a pressure of about 120 millimeters of mercury (mm Hg) through the simulator. The jugular vein system reservoir was set at a height of 10 cm to facilitate a pressure of about 7 mm Hg through the simulator. The different fluid pressures in the arterial and venous systems allowed the model to realistically represent the physiologic pressures seen from jugular venous or carotid arterial hemorrhage. The simulation blood was also dyed darker red for the jugular system (Figure 4), while the arterial system was brighter red to maximize realism. In total, the materials for the simulator cost approximately $185 U.S. Synthetic simulated models are a cost-effective and reproducible method that provide recurring training opportunities, thereby improving operator response to traumatic events.
Due to the nature of the conference, no formal data could be collected; however, a post-course feedback survey was administered, and voluntary feedback related to the carotid simulation experience was reviewed.
Figure 4. Synthetic model of a penetrating neck injury equipped with artificial, blood-like fluid (left) and a demonstration of the separate venous and arterial flow systems (right). The arterial reservoir is set higher than the venous reservoir to facilitate a greater blood pressure in the carotid artery channel and is equipped with a pump mechanism to create a pulsing flow
RESULTS
The curriculum was successfully deployed to over 180 participants including NHL team physicians and athletic trainers. Following completion of the curriculum, participants underwent simulated training sessions to practice a realistic response to a vascular neck injury “in the field.” After an initial introduction, participants were asked to respond immediately to a player down on the ice. The initial hands-on training began with active exsanguination from a simulated jugular vein laceration. During this simulation, participants gained experience exploring the wound to identify the type of bleed. They then practiced proper finger-over-finger packing techniques with conventional gauze for a large-volume venous bleed, which was uniformly successful in controlling the hemorrhage.
After the initial venous training session, a debriefing was held to review key concepts and questions. The exsanguinated blood was collected back into the venous reservoir, and a catastrophic arterial hemorrhage was then simulated. Similarly, participants were again instructed to respond immediately to a player down on the ice. They again explored the wound and were able to quickly identify the high-pressure and pulsatile bleeding of an arterial hemorrhage. They were guided to then digitally explore the wound and practice the 1- and 2-finger techniques for direct digital control of an arterial hemorrhage followed by gauze packing. During the simulation, participants could observe the difference in brain
perfusion with the 1- and 2-finger techniques by observing the flow through the vessel at the distal end to simulate brain perfusion and feel the pulsatile nature of the carotid artery. A similar debrief was held at the conclusion of the simulation. This hands-on training experience was facilitated by two otolaryngology head and neck surgeons with expertise in trauma management. Open discussion allowed for tailored teaching during each session. The material was delivered to all team trainers and team physicians at the annual NHL medical conference. At the completion of the hands-on training session, participants received a one-page summary handout to help reinforce learning principles. Due to conference requirements, formalized feedback data could not be collected; however, informal voluntary survey responses indicated that the session scored a composite 4.71 of 5 from 83 respondents (46% of 180 NHL athletic trainers), with many positive comments on its reception.
DISCUSSION
Once a patient has safely reached advanced medical care, definitive treatment of the vascular injuries is critical. Inhospital management has evolved over the past 20 years with the advent of endovascular treatment, which has resulted in a decrease in the 60-80% historical mortality rates. Of patients who survive transport to the hospital, carotid injuries still have at least a 30% mortality rate, additional 30% risk of stroke, and up to 85% chance of major ischemic stroke or death if the
carotid is sacrificed during repair.
Hospital management of vascular neck injury is centered on resuscitation, surgical exploration, or endovascular repair. Resuscitation involves massive transfusion protocol, fluids, and vasopressors. Surgical exploration can be done with repair / reconstruction, which is preferred over ligation or sacrifice due to risk of major ischemic stroke or death if carotid scarring occurs.24, 25An injured jugular vein can typically be ligated or sacrificed without complication. Endovascular management options include embolization or stenting, with stenting preferred over embolization for the same reason as above.26
The pillars of hemostatic resuscitation include preserving tissue perfusion and clotting. The goal for mean arterial pressure is lowered to 50-60 mm Hg.27, 28 Additional principles include early and rapid transfusion of red blood cells and clotting factors (plasma, platelets, cryoprecipitate) in a balanced ratio, minimizing use of crystalloids, preventing hypothermia (eg, Bair Hugger warming blanket), and administering tranexamic acid.29 Continued digital pressure remains paramount. The wound should remain packed with plain gauze until ready for intervention. Hemostatic dressings such as Quick Clot theoretically risk an embolic event into the open carotid vessel, which could further increase stroke risk, and may not be advised.
If there are hard signs of vascular injury and the patient is hemodynamically unstable, the priority is expeditious transport to the operating room. If the patient is stable and can undergo CT angiography, that is recommended to assess the injury as some injuries are more amenable to endovascular repair. Injuries to the vertebral or subclavian arteries are difficult to access surgically and may be more suitable for endovascular treatment.30 Prior to transport, airway management must be considered before leaving the resuscitation bay.29
Medical simulation with the use of cadavers, animals, or synthetic models has been shown to be an effective tool to provide hands-on training in many different specialties.31, 32 In a meta-analysis by McGaghie et al, simulation-based medical education proved to be superior to traditional clinical medical education in achieving clinical skills.33 Unfortunately, the use of cadaveric and live-animal training models is limited by their cost, availability, and ethical and biohazard considerations. Our group has previously demonstrated the utility of selective lasersintered, three-dimensional training models to improve skills and confidence in management of catastrophic internal carotid artery injuries in endonasal sinus surgery.34, 35
Maza et al concluded that surgical simulation of an arterial injury significantly decreased both time to hemostasis and blood loss. Time to hemostasis was reduced from 105.49 to 40.41 seconds (P < .001). The volume of blood loss was reduced from 690 to 272 mL (P < .001), and the confidence scores increased in 95.7% of participants, from an average of 3 to 8.34 Simulation also provides the ability for recurring training, feedback, reflection, and discussion. A training
course consisting of education and simulation of acute vascular neck injuries may improve ability to identify type and source of hemorrhage, decrease psychomotor stress, control catastrophic bleeding, and develop effective team strategies to prevent exsanguination in the field.
In this study we aimed to address a gap in education of prehospital management of catastrophic vascular neck injuries by developing a curriculum and task simulator geared toward athletic trainers and first responders. By creating a simplified algorithm, the course could be extrapolated to target other individuals such as coaches, referees, or the public. A recent paper by Simpson et al in the Scandinavian Journal of Trauma, Resuscitation, and Emergency Medicine acknowledged the lack of expert agreed-upon guidance for prehospital management of penetrating neck injury after conducting a national survey of multiple professional specialists who manage PNI with the goal of aggregating statements and curating an algorithm.36 In our study, we introduced the curriculum and task trainer to180 NHL athletic trainers and team physicians who overwhelmingly provided positive feedback; however, due to the nature of the conference, quantitative feedback was limited. In the future, we would seek to expand this model to other sports trainers and other professionals who may be on the scene of PNI, such as police officers and firefighters. Furthermore, to increase rigor of the training we would like to implement pre- and postmodel testing evaluating participants’ knowledge and comfort level in initial response to PNI.
CONCLUSION
There remains a lack of guidance on the prehospital management of vascular neck injuries. We propose a novel algorithm for training first responders, which can be used by the public or medical professionals. For highrisk, low-frequency events, simulation of these events is a highly effective strategy to develop technical skills and communication tactics, ultimately improving outcomes. We further describe a novel, 3D-printed model that successfully facilitated a hands-on training curriculum in conjunction with the National Hockey League to provide recurring training opportunities for their athletic trainers and team physicians.
ACKNOWLEDGMENTS
We would like to thank the National Hockey League for their support in developing and implementing this simulation and the NHL athletic trainers/therapists and physicians for their participation.
Video 1. Simulation of a jugular vein laceration and demonstration of how to control the wound.
Video 2. Simulation of a carotid artery laceration with pulsatile, higher pressure blood flow compared to the jugular vein laceration.
Sussman et al. Pilot Simulation Task Trainer for Prehospital Neck Hemorrhage Management
Address for Correspondence: Kyle VanKoevering, MD, The Ohio State University Wexner Medical Center, Department of Otolaryngology—Head and Neck Surgery, 915 Olentangy River Rd, Columbus, OH 43212. Email: kyle.vankoevering@osumec. edu.
Conflicts of Interest: By the WestJEM article submission agreement, all authors are required to disclose all affiliations, funding sources and financial or management relationships that could be perceived as potential sources of bias. No author has professional or financial relationships with any companies that are relevant to this study. There are no conflicts of interest or sources of funding to declare.
1. Vishwanatha B, Sagayaraj A, Huddar SG, et al. Penetrating neck injuries. Indian J Otolaryngol Head Neck Surg. 2007;59(3):221-4.
2. Brennan J, Gibbons MD, Lopez M, et al. Traumatic airway management in Operation Iraqi Freedom. Otolaryngol Head Neck Surg. 2011;144(3):376-80.
3. Breeze J, Allanson-Bailey LS, Hunt NC, et al. Mortality and morbidity from combat neck injury. J Trauma Acute Care Surg. 2012;72(4):969-74.
4. Clouse DW, Rasmussen TE, Peck MA, et al. In-theater management of vascular injury: 2 years of the Balad Vascular Registry. J Am Coll Surg. 2007;204(4):625-32.
5. Kelly JF, Ritenour AE, McLaughlin DF, et al. Injury severity and causes of death from Operation Iraqi Freedom and Operation Enduring Freedom: 2003–2004 versus 2006. J Trauma. 2008;64(2 Suppl):S21-27.
6. Nowicki JL, Stew B, Ooi E. Penetrating neck injuries: a guide to evaluation and management. Ann R Coll Surg Engl. 2018;100(1):6-11.
7. Lee W. General principles of carotid Doppler ultrasonography. Ultrasonography. 2013;33(1):11-7.
8. Senthelal S, Maingi M. Physiology, Jugular Venous Pulsation. 2025. Available at: https://www.ncbi.nlm.nih.gov/books/NBK534125/. Accessed May 19, 2025.
9. De Régloix SB, Baumont L, Daniel Y, et al. Comparison of penetrating neck injury management in combat versus civilian trauma: a review of 55 cases. Mil Med. 2016;181(8):935-40.
10. Demetriades D, Skalkides J, Sofianos C, et al. Carotid artery injuries: experience with 124 cases. J Trauma. 1989;29(1):91-94.
11. McConnell DB, Trunkey DD. Management of penetrating trauma to the neck. Adv Surg. 1994;27:97-127.
12. Graddon B. How long does it take to bleed out from an artery? 2022. Available at: https://truerescue.com/blogs/knowledge/ how-long-does-it-take-to-bleed-out-from-artery?srsltid=AfmBOopzQzi0tmV9M2CmJeavyzfSzG9zAg26w-ZphXYWjbZrxDe5WLn. Accessed May 19, 2025.
13. Choudhry A, Ray-Zack M, Younis M, et al. A chilling reminder of winter recreational injuries: laceration of the internal jugular vein at an ice hockey game. ACS Case Rev Surg. 2020;2(3).
14. Malarchuk C, Robson D. A Matter of Inches: How I Survived in the Crease and Beyond. Chicago, IL: Triumph Books; 2014.
Original Research
Worth the Wait? Comparison of Emergency Department
Patients’ Waiting Room Tolerance for Real Patient Care vs Training/Simulation Scenarios
Alice Rogan, FACEM, MBChB, PhD*
Euan Watt, FACEM, MBChB*
Stephanie Murphy, MD†
Emily Wheeler, MD†
Lisa Woods, BA, BSc (Hons), PhD‡
Sagar Galwankar, MBBS, MPH, MBA†
Brad Peckler, MD, FACEP, FACEM*
Section Editor: Laura Walker, MD
Wellington Hospital, Department of Emergency Medicine, Wellington, New Zealand
Florida State University, College of Medicine, Department of Emergency Medicine, Sarasota, Florida
Victoria University, School of Mathematics and Statistics, Wellington, New Zealand
Submission history: Submitted July 7, 2025; Revision received January 2, 2026; Accepted November 29, 2025
Electronically published April 14, 2026
Full text available through open access at http://escholarship.org/uc/uciem_westjem DOI 10.5811/westjem.48916
Introduction: In-situ simulation offers a realistic training environment with a higher level of fidelity compared to other simulation models. It is associated with enhanced knowledge retention and a higher level of composure during real clinical encounters. One common barrier to undertaking in-situ simulation is the concern that it contributes to a delay in providing patient care. In this study we gave patients in the waiting room seven hypothetical emergency medical scenarios, two of which were training simulation scenarios, and we asked them how long they would be willing to delay their care if the different scenarios were actually occurring in the emergency department (ED). Our objective was to investigate whether patients in the ED waiting room would be willing to delay their care if they knew that there were simulation training scenarios occurring.
Methods: This was a prospective convenience sample of participants conducted at a Level 1 trauma centre. Participants completed a survey that presented seven hypothetical scenarios, including two in-situ simulation scenarios. They were then asked to indicate the amount of additional wait time they would deem acceptable for each scenario.
Results: Responses to the two in-situ simulation scenarios indicated that 342 (40%) and 335 (40.5%) of the 827 study participants, respectively, were willing to wait > 40 minutes for these to occur. In contrast, and after controlling for age, sex, waiting time, and time of recruitment, subjects reported they would tolerate shorter wait times for simulation scenarios than for real patient-care scenarios. [Willingness to wait > 40 minutes for the five real scenarios ranged from 70.5–79.9%, P < .05).
Conclusion: While patients demonstrated lower tolerance for simulation-related delays than for routine clinical care, our results showed that most were still willing to wait up to an additional hour to allow in-situ simulation to proceed. These findings indicate that in-situ simulation is broadly acceptable to patients and supports its continued use in clinical settings. [West J Emerg Med. 2026;27(3)644–650.]
INTRODUCTION
Simulation training has long been recognised as a vital component of undergraduate and postgraduate medical education.1-3 The benefits of this learning modality are vast,
including improved technical and nontechnical skills.4-8 Simulation is a highly effective way of consolidating theoretical knowledge by provoking a physiological response that enhances retention of data9 but also allows
learners to practice and refine the technical skills that cannot be learned by reading a book.10-11 Furthermore, there is substantial evidence to support the role of simulation training in developing the non-technical skills essential for highfunctioning teams, such as expert communication, managing interpersonal conflict, and allocating effective roles.12,13 Simulation is also an effective way to refine approaches to high-acuity, low-occurrence presentations, improve interdisciplinary team cohesion, and identify crucial system issues that can be improved for future real-life scenarios.14,15
In-situ simulation refers to simulated clinical scenarios in participants’ usual working environment. This realistic training environment offers a higher level of fidelity compared to other settings, which has been shown to enhance knowledge retention16,17 and help learners maintain a higher level of composure during subsequent real clinical encounters. It is an unrivalled means of providing genuine simulation training. It is beneficial for simulated scenarios involving interdisciplinary team members who may benefit from exposure to emergency department (ED) design and equipment.18,19
One common barrier to undertaking in-situ simulation is the concern that it contributes to a delay in providing patient care.20 As ED access block and waiting times continue to increase globally,21-23 there is potential for in-situ simulation training to reduce timely service provision for patients. While there is research examining patients’ attitudes toward the length of time they are willing to wait to be seen,20,24 data are sparse on whether patients are willing to tolerate longer wait times for medical teams to undergo in-situ simulation training. Our objective in this study was to investigate whether patients in the ED waiting room would be willing to delay care if they knew that there were simulation training scenarios occurring.
METHODS
This was a prospective convenience sample of participants in a Level 2 trauma centre in South Florida with an annual volume of 90,000 with an average of 250 pretentions seen each day. While most patients are seen from the waiting room in approximately four hours, their wait time can be as long as six hours due to the influx of population to the area during the winter months. After patients were triaged and waiting to be seen in the waiting room, they were approached to be involved in the study, and informed written consent was obtained. Ethics approval was obtained from Florida State University ethics board. Participants were > 18 years of age, and English was their primary language. The concept of insitu simulation was explained to them in lay terms. To avoid bias, participants were not informed that the study’s primary outcome was the wait time for the in-situ simulation scenarios.
For each participant, investigators recorded basic demographic information and the time of day they were interviewed (12 am-12 pm, 12 pm-6 pm, and 6 pm-12 am), the length of time they had been waiting at that point, and their
Population Health Research Capsule
What do we already know about this issue? In-situ simulation improves team performance but its use is limited by concerns that it may delay patient’s emergency care and prolong waiting times.
What was the research question?
Are ED patients willing to accept longer waits if in-situ simulation training is occurring?
What was the major finding of the study?
40-40.5% of patients would wait >40 minutes for simulation vs 70.5–79.9% for real care (P<.05).
How does this improve population health?
Patients tolerated simulation delays less than real care, yet most would still wait up to forty minutes for in-situ simulation to proceed.
total predicted waiting time to be seen. Participants were then given an electronic tablet preloaded with a survey using HIPAA-compliant software (Phase Zero, Boston, MA). The survey presented seven hypothetical scenarios and asked participants to indicate the amount of additional wait time they would deem acceptable for each scenario (Figure 1). Cases were designed and agreed upon by consensus of the emergency clinician investigators based on what was felt to represent common emotive presentations. Each scenario was written in plain language to be understandable to a lay reader. In-situ training was explained during the consent process to clarify for the survey respondents that simulation was staff training. Possible wait times were divided into seven options using minutes: 0-20; 21-40; 41-60; 61-80; 81-100; 101-120; and > 120 minutes. All data were password protected and accessible only accessible by the study investigators. We excluded from analysis articipants with missing data.
The primary outcome was to compare the amount of time patients were willing to wait for actual treatment vs the simulation-training scenarios. We used mixed-effects models to examine differences in the selected wait times between medical scenarios. We chose this class of models to group responses from the same participant, fitting the participant as a random intercept. The scenario, age, sex, wait time, and time of day were included in the model as fixed effects. Statistical significance was determined as P < .05, and we conducted
Figure 1. Questions in the survey given to patients in the emergency department waiting room, in a study examining the length of time they would be willing to wait to be seen for an in-situ simulation scenario.
BIBA, brought in by ambulance; CPR, cardiopulmonary arrest; GCS3, Glasgow Coma Scale score 3; ED, emergency department; ICU, intensive care unit.
Table 1. Baseline demographics of survey respondents and wait time when the survey was administered as part of a study examining the length of time they would be willing to wait to be seen for an in-situ simulation scenario.
Variable Respondents N=827
Age, Median (IQR)
Sex, n (%)
Bonferroni-adjusted pairwise comparisons where appropriate. The analysis used the Mclogit package in R v4.3.1 (R Foundation for Statistical Computing, Vienna, Austria) for Windows (Microsoft Corporation, Redmond, WA.25,26
RESULTS
We recorded 1,104 initial interactions from 1,069 participants (13 patients participated twice or more). After removing incomplete responses or missing clinical or demographic data, 827 participants remained in the final dataset for analysis. Of these 827 study participants, 443 (53.6%) were female, and 384 (46.4%) were male. The median age was 54 (interquartile range [IQR] 35-70). The time of day in which participants were surveyed was divided into three timeframes for analysis: 12 am-12 pm (13%), 12 pm-6 pm (39%) and 6 pm-12 am (50%). Baseline demographics are displayed in Table 1.
A summary of responses indicating tolerable wait time for each of the seven scenarios is shown in Table 2 and displayed as a stacked bar chart in Figure 2. See supplementary tables for the estimated coefficients from the mixed-effects model and pairwise comparisons from which the following results are summarised.
The responses to scenarios 3 and 7, detailing in-situ simulation, indicate that 41.4% and 40.5% of participants were willing to wait more than 40 minutes for these scenarios, respectively. However, after controlling for age, sex, waiting time, and time of day of recruitment, participants tended to tolerate shorter wait times for simulation scenarios than for almost any other medical scenario (all P < .05). Respondents
54 (35-70)
Female 443 (53.6%)
Male 384 (46.4%)
Wait time, n (%)
0-20 min 197 (23.8%)
21-40 min 255 (30.8%)
41-60 min 144 (17.4%)
61-80 min 75 (9.1%)
81-100 min
(4.5%) 101-120 min
(3.9%) > 120 min
IQR, interquartile range.
(10.5%)
were more likely to indicate that a wait time of 0-20 minutes was acceptable for simulation scenarios (Q3 = 41.6%, Q7 =. 49.8%) than for other medical scenarios (ranging from 4.534.6%; see Table S2). The percentage of participants who selected an acceptable additional wait time of 0-20 minutes or 21-40 minutes for the two simulation scenarios (Q3 and Q7) was significantly higher (P < .001) than any other medical event besides the psychiatric scenario (Q6 vs Q7; P > .05). See Supplementary Material for details of the pairwise comparisons. Conversely, participants were significantly more likely to tolerate wait times of 61-80, 81-100, 101-120, and > 120 minutes for the actual medical scenarios (excluding the psychiatric scenario) when compared to the simulation scenarios (all P < .05).
Analysis showed that participants who had already been waiting for 0-20 minutes were more likely to tolerate an additional wait time of > 120 minutes than people who had been waiting longer than 20 minutes (all P < .001). Those participants submitting a response between midnight and 12 pm were significantly more likely to select an appropriate wait time of 0-20 minutes compared to those submitting a response between 12 pm-6 pm, and between 6.pm to midnight. Those participants submitting a response between 6 pm and midnight were significantly more likely to select an appropriate wait time of 101-120 minutes compared to those submitting a response between midnight and 12 pm, and between 12 pm-6 pm. Females were significantly more likely than males to select an additional acceptable wait of > 120 minutes (P < .001).
Response (N=827) Question
Q1: A 56-year old man was brought in by an ambulance after clutching his chest and falling to the floor unconscious and is undergoing CPR.
Q2: An 18 year old female was mountain biking and hit a tree coming off the bike and falling 15 feet. She was brought in by helicopter and is unconscious on a breathing tube with obvious head, abdominal and upper leg injuries. The trauma surgeons and ED physicians are trying to save her.
Q3: The ED, intensive care, and trauma surgeons are doing a trauma simulation and practicing teamwork, skills training, and medical expertise in a multi-disciplinary trauma case with a severely injured patient from a car accident.
Q4: 75 year old man presented ot the hospital with an inability to move his right side or speak. It is thought he is having a stroke (brain attack) and is being seen by the ED physicians and the neurologists to determine if he can be given a medication to try to reverse the stroke by breaking up the clot.
Q5: A 16 year old girl is being seen with a rash and a fever and a stiff neck. She is thought to have meningitis and is being treated agressively by the ED physicians
Q6: A 35 year old man with known schizophrenia is actively psychotic and disruptive and needs to be sedated for the safety of himself and staff.
Q7: The ED physicians are doing a training scenario on a simulated patient that is a 3-yearold with congenital heart disease that has had a cardiac arrest.
Despite the clear benefits of in-situ simulation for medical education, there is a real risk that its delivery is curtailed within our current clinical environment due to competing priorities. As health systems issues and access block continue to cause ED waiting times to balloon globally, it is easy to see these planned education sessions being cancelled to allow the redeployment of staff to direct clinical care. However, this would have farreaching consequences for undergraduate and postgraduate medical education, as well as patient safety and quality of care. Just as simulation teaching brings some benefits that cannot be harnessed from any other teaching method, in-situ simulation
is crucial for identifying systems issues that would otherwise go undiscovered. This could have a dramatic impact on future patients treated in the same institution if they are not discovered during simulation teaching.
In-situ training was explicitly explained during the consent process in lay language to clarify for the survey respondents that simulation was in fact staff training. To our knowledge, this is the first study to explore the attitudes of actual ED patients towards in-situ simulation, which affects their wait time for medical care. Until now, we had assumed that we are doing waiting room patients a disservice if we cause slight delays in their care by undertaking in-
Table 2. Summary of times patients were willing to wait for each scenario.
Figure 2. Stacked bar chart representing proportional wait time tolerance for each of the seven listed scenarios, including the two simulation scenarios
CPR, cardiopulmonary arrest; MTB, mountain bike.
situ simulation teaching. Yet we had not asked the patients themselves. Whilst truly emergent or life-threatening presentations should always take absolute priority, the data from this study suggest that some delay in being seen is tolerated for most patients with less emergent issues.
Patients in this study showed a lower tolerance for delays caused by simulation than for real clinical care, yet many were still willing to wait up to an extra hour for in-situ simulation to proceed. Comparable international data are scarce; however, a New Zealand qualitative study found that ED patients were generally willing to wait an additional 20-30 minutes, and potentially longer, depending on clinical urgency.27 Most patients are unfamiliar with simulation but become more accepting once it is clearly explained. Transparent communication helps minimise dissatisfaction related to extended waits.27
A full in-situ scenario and structured debrief can be completed within 30-60 minutes, with the clinical space required only for the scenario itself. Debriefing can easily occur in a non-clinical area, avoiding further impact on patient flow. For most departments, these findings support implementing regular in-situ simulation with sufficient duration to deliver meaningful educational value while remaining acceptable to most patients.
Other notable findings from this study include that, unsurprisingly, the data showed a general trend for patients to tolerate longer additional wait times if they had only been waiting for a short period when surveyed. Interestingly,
patients were significantly less likely to wait for the psychiatric scenario than for the medical scenario. This may or may not represent inherent biases within the population and requires further exploration.
LIMITATIONS
There were several limitations to this study. Firstly, as we used convenience sampling methods and data were not collected for those that declined to participate, this may have introduced selection bias. Furthermore, most responses were received in the evening or overnight hours, which could have skewed the results. Therefore, additional work could examine a more balanced sample across all hours of the day to ensure that the results are replicated. Secondly, this study employed a single-centre design in a tertiary Level 1 ED in South Florida. Therefore, caution should be exercised when assuming that attitudes towards delays in care will be similar in other countries or, indeed, in EDs in other regions of the state. Despite using lay language, in-situ simulation training may have been misunderstood by survey participants.
Finally, the severity of each respondent’s presenting illness or pain score was not accounted for by triage score or any other means. Patients triaged and in the waiting room would presumably have a lower triage score. We thought selfperception of severity would be challenging to interpret and skew responses. Minimal clinical characteristics and patient factors were collected, and this may limit interpretation and generalisability of patient responses.
CONCLUSION
Patients demonstrated lower tolerance for simulationrelated delays than for routine clinical care, yet most were still willing to wait up to an additional hour to allow in-situ simulation to proceed. These findings indicate that in-situ simulation is broadly acceptable to patients and supports its continued use in clinical settings. If replicated in further studies, these findings could provide a clear mandate to continue valuable in-situ simulations despite the growing access block in EDs.
8. Coggins A, Desai M, Nguyen K, et al. Early acquisition of nontechnical skills using a blended approach to simulation-based medical education. Adv. Simul. 2017;2(1):12.
9. Kharasch M, Aitchison P, Pettineo C, et al. Physiological stress responses of emergency medicine residents during an immersive medical simulation scenario. Dis Mon. 2011;57(11):700–5.
10. Bender J, Kennally K, Shields R, et al. Does simulation booster impact retention of resuscitation procedural skills and teamwork? J Perinatol.2014;34(9):664–8.
11. Anders Ericsson K. Deliberate practice and acquisition of expert performance: a general overview. Acad Emerg Med 2008;15(11):988–94.
Address for Correspondence: Brad Peckler, MD, FACEP, FACEM, Wellington Hospital Department of Emergency Medicine, Private Bag 7902, Wellington South, Wellington 6242, New Zealand. Email: bpeckler@yahoo.com.
Conflicts of Interest: By the WestJEM article submission agreement, all authors are required to disclose all affiliations, funding sources and financial or management relationships that could be perceived as potential sources of bias. No author has professional or financial relationships with any companies that are relevant to this study. There are no conflicts of interest or sources of funding to declare.
1. Issenberg BS, Mcgaghie WC, Petrusa Lee, et al. Features and uses of high-fidelity medical simulations that lead to effective learning: a BEME systematic review. Med Teach. 2005;27(1):10–28.
2. Cook DA, Hamstra SJ, Brydges R et al. Comparative effectiveness of instructional design features in simulation-based education: Systematic review and meta-analysis. Med Teach. 2013;35(1):e867–98.
3. McGaghie WC, Issenberg SB, Petrusa ER, et al. A critical review of simulation-based medical education research: 2003–2009. Med Educ. 2010;44(1):50–63.
4. Rosendal AA, Sloth SB, Rölfing JD, et al. Technical, non-technical, or both? A scoping review of skills in simulation-based surgical training J Surg Educ. 2023;80(5):731–49.
5. Yucel C, Hawley G, Terzioglu F, et al. The effectiveness of simulationbased team training in obstetrics emergencies for improving technical skills. Simul Healthc 2020;15(2):98–105.
6. Lynch A. Simulation-based acquisition of non-technical skills to improve patient safety. Semin Pediatr Surg. 2020;29(2):150906.
7. Gjeraa K, Moller TP, Østergaard D. Efficacy of simulation‐based trauma team training of non‐technical skills. A systematic review. Acta Anaesthesiol Scand. 2014;58(7):775–87.
12. Abildgren L, Lebahn-Hadidi M, Mogensen CB, et al. The effectiveness of improving healthcare teams’ human factor skills using simulation-based training: a systematic review. Adv Siml 2022;7(1):12.
13. Pearson E, McLafferty I. The use of simulation as a learning approach to non-technical skills awareness in final year student nurses. Nurse Educ Pract. 2011;11(6):399-405.
14. Petrosoniak A, Hicks C, Gray S, et al. LO80: Perfecting practice for rare procedures: a simulation-based, multi-centre randomized trial. CJEM. 2020;22(S1):S36–S36.
15. Petrosoniak A, Lu M, Gray S, et al. Perfecting practice: a protocol for assessing simulation-based mastery learning and deliberate practice versus self-guided practice for bougie-assisted cricothyroidotomy performance. BMC Med Educ. 2019;19(1):100.
16. Patterson MD, Geis GL, Falcone RA, et al. In situ simulation: detection of safety threats and teamwork training in a high risk emergency department. BMJ Qual Saf. 2013;22(6):468-77.
17. Kurup V, Matei V, Ray J. Role of in-situ simulation for training in healthcare: opportunities and challenges. Curr Opin Anaesthesiol. 2017;30(6):755-760.
18. Steinemann S, Berg B, Skinner A, et al. In situ, multidisciplinary, simulation-based teamwork training improves early trauma care. J Surg Educ. 2011;68(6):472-7.
19. Merién AER, van de Ven J, Mol BW, Houterman S, et al. Multidisciplinary team training in a simulation setting for acute obstetric emergencies: a systematic review. Obstet Gynecol 2010;115(5):1021-1031.
20. Patterson MD, Blike GT, Nadkarni VM. In situ simulation: challenges and results. In: Henriksen K, Battles JB, Keyes MA, Grady ML, eds. Advances in Patient Safety: New Directions and Alternative Approaches (Vol. 3: Performance and Tools). Rockville (MD): Agency for Healthcare Research and Quality (US); 2008.
21. Savioli G, Ceresa IF, Gri N, et al. Emergency department overcrowding: understanding the factors to find corresponding solutions. J Pers Med. 2022;12(2):279.
22. Sartini M, Carbone A, Demartini A, et al. Overcrowding in Emergency Department: Causes, Consequences, and Solutions-A Narrative Review. Healthcare (Basel). 2022;10(9).
23. Pearce S, Marchand T, Shannon T, et al. Emergency department
crowding: an overview of reviews describing measures causes, and harms. Intern Emerg Med. 2023;18(4):1137–58.
24. Shaikh SB, Jerrard DA, Witting MD, et al. How long are patients willing to wait in the emergency department before leaving without being seen? West J Emerg Med. 2012;13(6):463-7.
25. Elff M. mclogit: Multinomial logit models, with or without random effects or overdispersion [software]. 2022. https://CRAN.R-project.
org/package=mclogit
26. R Core Team. R: A language and environment for statistical computing [software]. 2023. R Foundation for Statistical Computing; Vienna, Austria. https://www.R-project.org/
27. Yates KM, Webster CS, Jowsey T, Weller JM. In situ simulation training in emergency departments: what patients really want to know. BMJ Simul Technol Enhanc Learn. 2015;1(1):33-39.
Assessment of Artificial Intelligence-based Translation Tools for Emergency Department Discharge Instructions
Estee Wu, BS*
Cassandra Mackey, MD†
Simi Jandu, MD, MEd†
Jennifer L. Carey, MD†
Section Editor: David Thompson, MD
Upstate Medical University Norton College of Medicine, Syracuse, New York University of Massachusetts Chan Medical School, Department of Emergency Medicine, Worcester, Massachusetts * †
Submission history: Submitted June 26, 2025; Revision received January 2, 2026; Accepted December 22, 2025
Electronically published April 8, 2026
Full text available through open access at http://escholarship.org/uc/uciem_westjem DOI 10.5811/westjem.48825
Introduction: Emergency departments (ED) in the United States serve as a safety net for millions, including those with limited English proficiency (LEP). Eight percent of individuals living in the United States have LEP, placing them at risk for language barriers that can adversely affect the quality and safety of their care. Many hospitals lack language-concordant care, especially at the time of discharge. Miscommunication at discharge can lead to adverse health outcomes, including medication errors, poor compliance, and unnecessary return visits to the ED. Our objectives in this study were to evaluate the quality and safety of artificial intelligence (AI)-generated translations of physicianwritten, patient-specific ED discharge instructions and to assess performance across varying levels of instruction complexity.
Methods: Emergency physicians wrote free-form discharge instructions, representing patient-specific guidance, which are typically provided at the time of ED discharge. Four topics were selected: abdominal pain; chest pain; wrist fracture; and vaginal bleeding in pregnancy. These instructions were intentionally developed to vary in linguistic complexity and were assessed using the Flesch Reading Ease and Flesch-Kincaid Grade Level scales. Instructions were translated into Albanian, Brazilian Portuguese, and Vietnamese using the AI-based translation tools ChatGPT-4, Microsoft Copilot, and Google Translate. Translations were evaluated for semantic and syntactic accuracy. Criteria included adequacy, fluency, meaning, and severity on a 5-point scale (1 = lowest accuracy, 5 = highest accuracy). Preference and formality were rated on a 3-point scale (1 = lowest, 3 = highest). The primary outcome was the quality and safety of AI-generated translations of patient-specific discharge instructions. Secondary outcomes included the ability to handle varying instruction complexity. Professional medical translators primarily responsible for the written translation of medical text evaluated and scored the translations for accuracy and quality metrics.
Results: Overall adequacy, fluency, meaning, and severity scores were similar across models. ChatGPT-4 (3.79), Microsoft Copilot (3.60), and Google Translate (3.50), showed no statistically significant differences. Albanian translation was an exception, with ChatGPT-4 scoring significantly higher (3.75) than Google Translate (3.19) (P < .001). There were no other significant differences observed for Brazilian Portuguese or Vietnamese. ChatGPT-4 was also found to be the highest rated for Albanian and Brazilian Portuguese. Both Microsoft Copilot and Google Translate produced a total of five potentially harmful translation errors, whereas none were identified for ChatGPT-4.
Conclusion: Miscommunication during discharge can lead to negative patient outcomes. This study evaluated ChatGPT-4, Microsoft Copilot, and Google Translate in translating ED instructions into Albanian, Brazilian Portuguese, and Vietnamese. ChatGPT-4 performed best overall and produced no harmful translations, and significantly outperformed Google Translate in Albanian. While AI-based translation tools show promise, human oversight remains necessary to mitigate risks from translation inaccuracies. [West J Emerg Med. 2026;27(3)651–658.]
INTRODUCTION
Over 25 million Americans have limited ability to read, speak, write, or understand English.1 Effective communication is crucial in healthcare, and barriers from limited English proficiency (LEP) lead to challenges in accessing equitable and quality healthcare. Entities receiving federal financial assistance are required by law to provide free language interpreting services for patients who have LEP.2,3 Written discharge instructions provide critical information regarding diagnoses, follow-up care, medication use, and when to seek further medical attention. Miscommunication at discharge can lead to adverse health outcomes, including medication errors, poor compliance, and unnecessary return visits to the emergency department (ED).4-8 Although providing discharge instructions in a patient’s preferred language is critical for ensuring comprehension, adherence, and safety, a recent study found that only 8% of patients with a non-English language preference received discharge instructions in their preferred language.9
Recent advancements in artificial intelligence (AI) and machine translation technologies offer the potential for more accurate and contextually appropriate translations. Translation systems driven by AI may be used for language translation, but prior studies have demonstrated variable success in medical translations.10-12 Advisories caution against the use of automated translation programs as they may provide erroneous or nonsensical translations. This can lead to misunderstandings and potentially compromise patient safety. Section 1557 of the Affordable Care Act (ACA) and the Code of Federal Regulations (CFR) 45 92.201 both state that translations must be reviewed by a qualified human translator to ensure accuracy.2,3
Our objectives in this study were to evaluate the quality and safety of AI-generated translations of physician-written, patient-specific ED discharge instructions and to assess performance across varying levels of instruction complexity. We examined emergency medicine (EM) discharge instructions translated into Albanian, Brazilian Portuguese (hereafter referred to as “Portuguese”), and Vietnamese using Chat Generative Pre-trained Transformer-4 (ChatGPT-4) (OpenAI, San Francisco, CA), Microsoft Copilot (Microsoft Corporation, Redmond, WA), and Google Translate (Google, LLC, Mountain View, CA). We used these three languages as representatives from different language families or subgroups reflective of the patient demographic in our region: IndoEuropean and Austroasiatic. To our knowledge, no prior studies have compared these AI-based translation tools across the three target languages based on the domains examined in this study.
METHODS
Study Setting
This study was carried out at an urban, academic medical center. In the ED at the time of discharge, patients
Population Health Research Capsule
What do we already know about this issue?
Limited comprehension of written discharge instructions due to language barriers is associated with medication errors, poor adherence, and unnecessary return visits.
What was the research question?
Do artificial intelligence (AI) tools safely and accurately translate patient-specific emergency department (ED) discharge instructions across languages?
What was the major finding of the study?
Overall scores were similar; ChatGPT-4 had zero harmful errors and outperformed Google Translate in Albanian (P < .001).
How does this improve population health?
Although human oversight remains necessary, AI translation holds potential to improve ED discharge instructions for patients with limited English proficiency.
receive instructions that include free-form, patient-specific information written by the physician. For this study, freeform discharge instructions were written and then translated by AI-based translation tools into three different languages reflective of the patient demographic in our region: Albanian; Portuguese; and Vietnamese. These written instructions were reviewed and assessed by the institution’s medical translators. This study was deemed not human subject research by our institutional review board.
Discharge Instruction Development
Four sets of representative discharge instructions were written in a free-form style by a practicing emergency physician, followed by review and refinement by the remaining study investigators. These provided patient-specific information on diagnosis, treatment plans, and follow-up care at the time of ED discharge. The instructions were based on common clinical diagnoses treated in our ED: abdominal pain; chest pain; wrist fracture; and vaginal bleeding in pregnancy. Each was adapted from real instructions given to patients being discharged from our ED. The discharge instructions ranged from 65-109 words, with each set of instructions containing 5-7 sentences. Each discharge instruction contained the chief complaint, explanation of the chief complaint,
workup results, management, and follow-up instructions. An example set of discharge instructions and corresponding translation by AI-based translation tools is reported in Appendix Table 1.
In writing the instructions, the aim was to capture variability in linguistic complexity. Instructions were scored based on readability measured by the Flesch Reading Ease (FRE) and Flesch-Kincaid Grade (FKG) level scales.13 The FRE and FKG scores for the instructions are reported in Appendix Table 2. The FRE scores ranged from 58.2 (fairly difficult to read), to 69.5 (easily understood by people 13-15 years of age). The FKG scores ranged from 6th-9th grade reading levels. We limited the analysis to four sets of discharge instructions to ensure feasibility of detailed expert review while preserving diversity in clinical content and linguistic complexity.
Discharge Instruction Translations and Review
Written instructions were copied into ChatGPT-4, Microsoft Copilot, and Google Translate. The AI-based translation tools were accessed using the developers’ default public chat version available in September 2024. Each AI-based translation tools was prompted to translate the discharge instruction into Albanian, Portuguese, and Vietnamese. Instructions were then reviewed by professional medical translators employed by our institution in accordance with recommendations by the ACA and CFR.2,3 Medical translators are expertly trained in the written translation of medical content and documents and demonstrate a high level of language proficiency to accurately convert written documents and prevent errors. Medical translators are distinct from medical interpreters; interpreters facilitate spoken communication and convey meaning accurately and efficiently in real time.
Each translator received instructions in English and in their language of expertise. Translators were blinded to the AI-based translation platform used for translations and to the study objectives. A translator for each language reviewed all discharge instructions produced by each AI-based translation platform.
The primary outcome of the study was the quality and safety of AI-generated translations of patient- specific instructions written by the physician at the time of ED discharge. Secondary outcomes included the ability to handle varying instruction complexity. Scoring rubrics, adapted from Chen et al and Kanna et al, are shown in Appendix Table 3.14,15 Translations were assessed and scored by the institution’s translators for semantic accuracy (reflecting clarity of meaning) and syntactic accuracy (reflecting grammar, sentence structure, and formatting). Adequacy (estimated amount of information conveyed as compared to the untranslated text); fluency (grammar and understandability of a given text); meaning (the degree to which the translated text preserved content); severity (the
degree of potential harm that could be caused to a patient receiving a given translated text); and preference (a measure to capture the translators’ subjective input regarding which translated version they preferred) were rated on a 5-point scale (1 = lowest accuracy, 5 = highest accuracy). Preference and formality were rated on a 3-point scale (1 = lowest, 3 = highest). Specific characteristics of the translation, rated on a scale of 0 (causing danger to the patient) to 2 (accurate, no safety concern) were based on accuracy of translation leading to safety concerns regarding the use of proper nouns, abbreviations, unconventional use of normal words, explanation of diagnosis/results, follow-up instructions, medication instructions, and return precautions.
Data Analysis
We analyzed data using Prism software v10.4.2 (GraphPad, Inc, San Diego, CA). Descriptive statistics were calculated for all translation quality ratings, and we used one-way analysis of variance to assess differences among the three AI-based translation tools. A P < .05 was considered statistically significant.
RESULTS
Translation Evaluations
Four distinct discharge instructions were translated into three different languages. Overall mean scores across all languages and levels of reading difficulty for adequacy, fluency, meaning, and severity were as follows: ChatGPT-4 (3.79); Microsoft Copilot (3.60); and Google Translate (3.50) (P = .05). ChatGPT-4 (3.75) performed significantly better in Albanian compared to Google Translate (3.19) (P = .01); no other significant differences were seen across categories or when comparing FRE and FKG. Figure 1 shows breakdown by category.
Translators described text as harmful when acronyms were mistranslated or left unexplained, or when there was risk guiding patients to misunderstand key symptoms or delaying next steps in care. Translators noted the use of unfamiliar medical jargon, culturally incongruent terms, or ambiguous acronyms to be potentially harmful to patients with LEP or limited health literacy. Both Microsoft Copilot and Google Translate produced a total of five potentially harmful translation errors, whereas none were identified for ChatGPT-4. Specific comments for Albanian and Portuguese regarding errors in translations and miscommunication are shown in Table 1. There were no specific comments from Vietnamese translations.
Albanian
Overall, ChatGPT-4 had higher quality ratings with a mean of 3.75 compared to Microsoft Copilot (3.56). and Google Translate (3.19), with a significant difference observed between ChatGPT-4 and Google Translate (P < .001). Table 2 shows the comparison of platforms for each
Figure 1. Mean score for adequacy, fluency, meaning and severity from artificial intelligence-based translation tools (ChatGPT-4, Copilot, and Google Translate) in a study where professional translators rated discharge instructions in Albanian, Brazilian Portuguese, and Vietnamese.
Table 1. Translators’ comments on linguistic discrepancies in artificial intelligence translations of Brazilian Portuguese and Albanian discharge instructions.
Language Chief complaint ChatGPT-4 Microsoft Copilot Google Translate
Abdominal pain
Portuguese
· Added an explanation to the condition's acronym
· Didn’t translate “PCP” in a way that is widely understood by Brazilians
Chest pain · Poor syntax
· One of the tests was not translated into Portuguese
· The medication name should remain in English for easy identification at the pharmacy
Wrist pain · Poor syntax
· The medication name should remain in English for easy identification at the pharmacy
Vaginal bleeding · No issues that would cause major patient misunderstanding or confusion
· Kept the acronym in English (Brazilians don’t use acronyms for medical conditions)
· Didn’t translate “PCP” in a way that is widely understood by Brazilians
· Poor syntax
· Tests were not translated into Portuguese
· The translation of “emergency department” is not commonly used in Brazil
· The medication name should remain in English for easy identification at the pharmacy.
· Poor syntax
· The medication name should remain in English for easy identification at the pharmacy
· The translation of "emergency department" is not commonly used in Brazil.
· A literal translation was used, which does not clearly convey the intended meaning
· The translation of “emergency department” is not commonly used in Brazil
· Translated the English acronym to the Portuguese one, which patients don't recognize or understand
· Kept “PCP” in English
· Poor syntax
· Tests were not translated into Portuguese
· The medication name should remain in English for easy identification at the pharmacy.
· Poor syntax
· The medication name should remain in English for easy identification at the pharmacy.
· The word "date" has multiple meanings, and it was not translated correctly based on the context, which is concerning as it may lead to confusion
Table 1. Continued.
Language Chief complaint
ChatGPT-4
Abdominal pain · Keeps acronyms, added an explanation to the condition's acronym
· Didn't translate “PCP” in a way that clarifies which doctor to call
Chest pain · One of the tests' abbreviations is not translated into Albanian .
· The name of the test is translated in an unconventional way and unclear.
· Translation of the diagnosis is not accurate.
· The medication name should remain in English to allow for identification at the pharmacy.
· Translation of the word “reassuring” is not correct.
· Poor syntax
Wrist pain · The name of the test is translated in an unconventional way and unclear.
· Translation of the diagnosis is not accurate.
· Poor translation of medical terminology
· The medication name should remain in English to allow for identification at the pharmacy
· Poor syntax
Vaginal bleeding · The name of the test is translated in an unconventional way and is unclear.
· Omits the word fetal when translating "fetal heart rate"
Microsoft Copilot Google Translate
· Kept the acronyms of CT and diagnosis without translating them, which wouldn’t be recognized and/or understood
· Acronyms for medical conditions are not used in Albanian.
· Didn't translate “PCP” in a way that is clear
· Tests' abbreviations are not translated into Albanian,
· Poor translation
· Translation of the diagnosis is not accurate.
· The medication name should remain in English to allow for identification at the pharmacy.
· Translation of the word “reassuring” is not correct.
· Poor syntax
· The name of the test is translated in an unconventional way and unclear.
· Translation of the diagnosis is not accurate.
· Incorrect medical terminology
· The medication name should remain in English to allow for identification at the pharmacy .
· Poor syntax
AI, artificial intelligence; PCP, primary care physician; CT, computed tomography.
language. ChatGPT-4 was the most preferred for all but one discharge instruction set, while Google Translate was the least preferred.
For specific characteristics, ChatGPT-4 scored the highest and Google Translate scored the lowest in explanation of diagnosis/results and follow-up instructions. Both Google Translate and Microsoft Copilot had two sets of instructions that posed potential harm to the patient in the categories “Explains diagnosis/results” and “Translation of abbreviations,” whereas ChatGPT-4 had none. Overall,
· Kept the acronyms of CT and diagnosis without translating them, which wouldn’t be recognized and/or understood
· Acronyms for medical conditions are not used in Albanian language,
· Kept “PCP” in English
· Tests' abbreviations are not translated into Albanian,
· Translation of the diagnosis is not accurate.
· The medication name should remain in English to allow for identification at the pharmacy.
· Translation of the word “reassuring” is not correct.
· Poor syntax
· The name of test is translated in an unconventional way and is incorrect and iunclear.
· Translation of the diagnosis is not accurate.
· Incorrect medical terminology
· Poor syntax
· The name of test is translated in an unconventional way and is incorrect and unclear
· The word "dates" is translated as appointments which is incorrect for the context and leads to confusion for the patient.
ChatGPT-4 had the highest mean total score (31.25), followed by Microsoft Copilot (27.75) and Google Translate (23.75) (Figure 2).
Portuguese
There was no significant difference between the three AI-based translation tools. For ChatGPT-4, two discharge instructions were rated as “most preferred” while Google Translate had two discharge instructions rated as “least preferred.” Google Translate was rated the least formal for
Albanian
AI, artificial intelligence.
three of the four discharge instructions, with ChatGPT-4 being the most formal for two of the four discharge sets. All AI-based translation tools were rated similarly for proper use of nouns, follow-up, medications instructions, and return precautions. Both Google Translate and Microsoft Copilot had one set of instructions finding potential harm to the patient in the categories “Explains diagnosis/results” and “Translation of abbreviations,” whereas ChatGPT-4 had none. Overall, ChatGPT-4 was rated the highest overall at a mean total score (31), followed by Microsoft Copilot (28.5) and Google Translate (28.25).
Vietnamese
There was no significant difference between the three AIbased translation tools. Across all instructions, none of the AIbased translation tools stood out for preference and formality; and for specific characteristics of the discharge instructions, the mean scores across all three AI-based translation tools were equal. There were no Vietnamese translations rated as potentially harmful to patients. Overall, ChatGPT-4 had the highest mean total score (33.25) followed by Google Translate (32.5) and Microsoft Copilot (32.25).
Albanian
Compared with Vietnamese and Portuguese, Albanian
AI-generated translations demonstrated significant differences in tool performance, with ChatGPT-4 scoring significantly higher than Google Translate (p<.001). In contrast, no significant differences were observed among translation tools for Portuguese and Vietnamese, suggesting greater variability in platform performance for Albanian translations. Notably, ChatGPT-4 produced no translations posing potential harm in Albanian, whereas Google Translate and Microsoft Copilot had two sets of instructions that posed potential harm. For Portuguese, both Microsoft Copilot and Google Translate produced one instruction set containing potential harmful content, whereas none were identified for Vietnamese translations.
DISCUSSION
Instructions at the time of discharge are critical for patient care and safety. Miscommunication due to language barriers, improper instruction delivery, or lack of comprehension, can lead to adverse health outcomes such as unplanned revisits, medication errors, and increased readmission rates.4-7 Improving discharge communication is crucial to enhance patient safety and overall health management. 5-8
We evaluated three widely used AI-based translation tools—ChatGPT-4, Microsoft Copilot, and Google Translate— in translating ED discharge instructions into Albanian, Portuguese, and Vietnamese. In this study, ChatGPT-4 demonstrated the strongest overall performance compared with the others but did not reach statistical significance, with the exception of ChatGPT-4 compared to Google Translate in Albanian. ChatGPT-4 produced no harmful translations, whereas the other two models each generated potentially harmful output in two categories. ChatGPT-4 also achieved the highest scores for critical instruction components such as diagnosis explanation and follow-up recommendations, suggesting greater contextual awareness in more complex and nuanced translation tasks. Comments from translators highlight consistent issues across all platforms. All three tools were reported to contain poor syntax, incorrect or unclear translations of medical acronyms and terminology, and contextually inappropriate word choices, which may have led to confusion for patients. The severity scores for Vietnamese suggested that critical aspects of patient comprehension and safety were largely preserved. Despite this, the models scored modestly on preference and formality, indicating that the tone and stylistic appropriateness of translations may not meet patient or clinician expectations. The greatest variability in model performance was observed in Albanian translations. Factors such as healthcare-specific training data is less abundant and available to AI-based translation tools.
We used representative ED discharge instructions that closely mirror real-world clinical practice and incorporated different readability levels based on the FRE and FKG scales. We compared three widely used AI-based translation tools, relying on professional medical translators responsible for
Figure 2. Total mean scores across artificial intelligence-based translation tools in a study comparing their accuracy in translating emergency department discharge instructions.
Table 2. Mean quality rating scores of artificial intelligence-based translation tools based on language.
producing accurate translations that are understandable to patients. Our study, like others, found variability among AIbased translation tools and languages. A study of standardized pediatric discharge instructions found that Google Translate and ChatGPT performed similarly to professional translators for Portuguese, with low rates of clinically significant errors.11 A study translating postoperative discharge instructions for circumcisions and patient information for undescended testicles found that ChatGPT has an unacceptably high rate of translation error in Vietnamese.16
Another study assessing 20 commonly used ED discharge instruction phrases found that Vietnamese scored 77.5% for accuracy by volunteer native speakers.12 Studies examining ED discharge instructions indicate that Google Translate’s accuracy varies by language. One study reported it accurately translated 92% of Spanish and 81% of Chinese sentences, while another study showed Spanish translation accuracy was highest (94%) followed by Tagalog (90%), Korean (82.5%), Chinese (81.7%), Farsi (67.5%), and Armenian (55%).6,10 Other studies have looked at AI-based translation tool for translation of standardized discharge instructions and have similarly found variation by languages, with worse performance in Haitian Creole, Russian, and Vietnamese.11,16 To our knowledge, no prior studies have examined the use of AI-based translation tools for translating discharge instructions into Albanian.
Translation tools assisted by AI show promise when other forms of translation services have limited availability. However, at this time they must still be used with caution and under human supervision. Even infrequent errors, such as mistranslations of abbreviations, diagnostic terms, or medication instructions, can pose significant risks to patient outcomes. Advancements in AI technology offer the potential for improved translation accuracy and contextual relevance. It is essential to make physicians aware of the limitations of this technology and to continue to conduct ongoing evaluations across diverse clinical contexts and languages.
LIMITATIONS
This study assessed four discharge instructions translated into three languages; therefore, it may not capture the full range of complexity across all languages or the broader spectrum of FRE and FKG scales. Languages with more complex grammar, longer word forms, or different writing systems, such as tonal languages or right-to-left scripts, may present unique challenges not captured here. Additionally, while readability was evaluated using FRE and FKG scales, these measures primarily focus on sentence length and word complexity but do not account for health literacy. Instructions were created and reviewed within a single institution, which may limit generalizability to other clinical settings or patient populations.
CONCLUSIONS
This study evaluated ChatGPT-4, Microsoft Copilot,
and Google Translate in translating four representative ED discharge instructions into three languages: Albanian, Portuguese, and Vietnamese. ChatGPT-4 performed best overall, conveying critical medical details without harmful errors, although all tools struggled with syntax and medical terminology. While AI-based translation tools show promise, they still require human oversight due to potential translation errors. Due to the limited sample size, further studies are needed to determine which AI-based translation tools perform best.
ACKNOWLEDGMENTS
The authors acknowledge Max Grecchi and Consuelo Camelo for their invaluable contributions to the development and implementation of the study.
Address for Correspondence: Jennifer Carey, MD, University of Massachusetts Chan Medical School, 55 Lake Ave North, Worcester, MA 01655. Email: Jennifer.Carey@umassmemorial.org.
Conflicts of Interest: By the WestJEM article submission agreement, all authors are required to disclose all affiliations, funding sources and financial or management relationships that could be perceived as potential sources of bias. No author has professional or financial relationships with any companies that are relevant to this study. There are no conflicts of interest or sources of funding to declare.
1. Centers for Medicare & Medicaid Services. Limited English Proficiency (LEP). https://www.cms.gov/Outreach-and-Education/ MLN/WBT/MLN2059239-Language-Access-Plans/lap/lesson01/04Limited-English-Proficiency-LEP/index.html. Accessed June 2025.
2. U.S. Department of Health and Human Services, Office for Civil Rights. Section 1557: Language Access.https://www.hhs.gov/sites/ default/files/ocr-dcl-section-1557-language-access.pdf. Accessed June 2025.
3. Electronic Code of Federal Regulations. 45 CFR § 92.201 — Purpose. https://www.ecfr.gov/current/title-45/subtitle-A/subchapter-A/ part-92/subpart-C/section-92.201. Accessed June 2025.
4. Ngai KM, Grudzen CR, Lee R, et al. The association between limited English proficiency and unplanned emergency department revisit within 72 hours. Ann Emerg Med. 2016;68(2):213-21.
5. Wilson E, Chen AH, Grumbach K, et al. Effects of limited English proficiency and physician language on health care comprehension. J Gen Intern Med. 2005;20(9):800-6.
6. Samuels-Kalow ME, Stack AM, Porter SC. Effective discharge communication in the emergency department. Ann Emerg Med
Assessment of AI-based Translations Tools for ED Discharge Instructions
2012;60(2):152-9.
7. Fonss Rasmussen L, Grode LB, Lange J, et al. Impact of transitional care interventions on hospital readmissions in older medical patients: a systematic review. BMJ Open. 2021;11(1):e040057.
8. Becker C, Zumbrunn S, Beck K, et al. Interventions to improve communication at hospital discharge and rates of readmission: a systematic review and meta-analysis. JAMA Netw Open 2021;4(8):e2119346.
9. Austad K, Lee JH, Lanney H, et al. Evaluating the quality and equity of patient hospital discharge instructions. BMC Health Serv Res 2025;25(1):291.
10. Khoong EC, Steinbrook E, Brown C, et al. Assessing the use of Google Translate for Spanish and Chinese translations of emergency department discharge instructions. JAMA Intern Med 2019;179(4):580-582.
11. Brewster RCL, Gonzalez P, Khazanchi R, et al. Performance of
ChatGPT and Google Translate for pediatric discharge instruction translation. Pediatrics. 2024;154(1):e2023065573
12. Taira BR, Kreger V, Orue A, et al. A pragmatic assessment of Google Translate for emergency department instructions. J Gen Intern Med 2021;36(11):3361-3365.
13. Stockmeyer NO. Using Microsoft Word’s Readability Program. Michigan Bar Journal. 2009;88:46.
14. Chen X, Acosta S, Barry AE. Evaluating the accuracy of Google Translate for diabetes education material. JMIR Diabetes 2016;1(1):e3.
15. Khanna RR, Karliner LS, Eck M, et al. Performance of an online translation tool when applied to patient educational material. J Hosp Med. 2011;6(9):519-25.
16. Rao P, McGee LM, Seideman CA. A comparative assessment of ChatGPT vs. Google Translate for the translation of patient instructions. J Med Artif Intell. 2024;7.
Non-Opioid Pharmaceutical Alternatives for Acute Pain Management in the Emergency Department: A Scoping Review
Akash Shanmugam, BS*
Sally M. Graglia, MD, MPH†
Curtis Geier, PharmD, BCCCP‡
Juan Carlos C. Montoy, MD, PhD†
Alan M. Gelb, MD†
Kathy T. LeSaint, MD†
Section Editor: Murat Cetin, MD
University of California, San Francisco School of Medicine, San Francisco, California
University of California, San Francisco School of Medicine, Department of Emergency Medicine, San Francisco, California
University of California, San Francisco, School of Pharmacy, San Francisco, California *
Submission history: Submitted June 21, 2025; Revision received January 2, 2026; Accepted December 4, Electronically published May 14, 2026
Full text available through open access at http://escholarship.org/uc/uciem_westjem DOI 10.5811/westjem.47925
Objectives: In light of the ongoing opioid epidemic, emergency clinicians have faced the difficult challenge of managing acute pain while reducing opioid prescriptions. Improved use of non-opioid analgesics could decrease the need for opioid medications in the management of acute pain. Limited work has been done to systematically produce a comprehensive list of non-opioid pharmaceuticals targeted to specific pain-associated conditions.
Methods: We conducted a scoping review of recent literature for non-opioid pharmaceuticals that could help manage five painful conditions commonly treated in our institution’s ED: abdominal pain; back pain; chest pain; fracture pain; and headache. In November 2023, we identified reviews published from November 2018–2023 in PubMed to curate a list of alternatives to opioids to effectively manage acute pain.
Results: We screened 246 studies that reviewed management approaches for the five chosen conditions that commonly present with pain in the ED and included 23 studies. Acetaminophen and nonsteroidal anti-inflammatory drugs were recommended for all five painful conditions. Ketamine was suggested for abdominal pain, chest pain, and headaches. For back pain, anti-depressants and muscle relaxants were advised. Benzodiazepines and anti-psychotics were indicated for abdominal pain. Triptans, anti-psychotics, and anti-emetics were suggested for headaches.
Conclusion: This review highlights several non-opioid medications for treating acute pain in the ED. The targeted, comprehensive list generated in this study can serve as a practical resource to support alternative-to-opioid programs in EDs by guiding the creation of pharmaceutical order sets tailored to common ED presentations. Ultimately, this tool may help reduce unnecessary opioid exposure and improve patient outcomes in emergency care settings. [West J Emerg Med. 2026;27(3)659–668.]
INTRODUCTION
Pain is the most common chief complaint in patients presenting to the emergency department (ED), accounting for 50-80% of all ED visits.1–3 Given the prevalence of pain and the worsening opioid epidemic in the United States, the approach to pain management in the ED has undergone significant evolution.4,5 Opioid prescriptions by emergency physicians declined dramatically between 2012–2018 and continued to decrease during the COVID-19 pandemic.4,5 Many interventions have been developed to alter approaches
to pain management among emergency physicians.6,7 These interventions have largely been successful and correspond to national trends of decreased opioid prescriptions in EDs.6–8
Despite this progress, further efforts are needed to optimize pain management approaches for patients receiving care in EDs. Patient-centered outcomes such as pain control must be prioritized while reducing the overexposure to opioids.9 A growing body of evidence has indicated that nonopioid pharmacological therapies can be used in place of opioids or as an adjunct along with lower doses of opioids to effectively manage pain and reduce the risk of iatrogenic harm to the patient.10–12 Emergency clinicians can help address the opioid epidemic by using non-opioid pharmaceuticals and other alternatives in the management of acute pain.
Multiple alternatives-to-opioid programs have shown substantial reductions in opioid exposure, hospital admissions, and ED recidivism, with no observed decline in analgesic effectiveness.13–18 Despite these successes, scalable and readily implementable resources for broad dissemination remain limited. Very few reviews and guidelines have systematically assembled condition-specific tables of nonopioid pharmacologic options.19,20 We aimed to create a list of non-opioid pharmaceuticals targeting the top five most common pain-related chief complaints in our ED. Patient data from the year prior to the project’s start date revealed the top five painrelated chief complaints at our institution: abdominal pain; back pain; chest pain; fracture pain; and headache. In this review, we detail our methodology in creating a list of non-opioid alternatives to treat five common painful conditions that present to our institution’s ED.
We set out to perform a scoping literature review to identify non-opioid pharmaceuticals to treat five common painful conditions presenting to the ED.
METHODS
We identified the five most common pain-related chief complaints using patient data at our institution’s ED from January–December 2022: abdominal pain; back pain; chest pain; fracture pain; and headache. Our institution operates the region’s highest volume ED, with over 73,000 patient visits annually. It also serves as the only Level I trauma center for the city and county, providing comprehensive emergency care to a diverse urban population.
Search Strategy
We developed a search strategy in collaboration with a clinical librarian that combined several main concepts: the pain condition in question; management of that condition; and emergency context (including search terms reflecting acute care management). We conducted our search within the biomedical literature in PubMed. Given our attempts to combine the most up-to-date data regarding management of painful conditions and perform a review that reflects contemporary prescription practices, we limited the search to
Population Health Research Capsule
What do we already know about this issue?
Non-opioid analgesics can be used for pain management in emergency settings, yet no comprehensive, condition-specific list has been systematically generated.
What was the research question?
Which non-opioid medications can be used to manage five common emergency pain complaints based on literature review?
What was the major finding of the study?
Twenty-three of 246 studies met criteria, identifying multiple non-opioid options for common emergency pain complaints.
How does this improve population health?
This review provides a practical framework that other institutions can use to help reduce unnecessary opioid use for common pain complaints.
papers published in the previous five years (November 2018–November 2023). We included narrative review papers that synthesized available evidence on pharmacologic management of acute pain in the ED, with the goal of highlighting current administration practices rather than conducting an exhaustive evidence appraisal. We did not include systematic reviews and primary studies because our aim was to provide practical, high-level pharmacologic pain management approaches for emergency clinicians rather than evaluate pooled evidence or individual trials.
We identified four search strategies that ranged from broad to narrow search criteria. We conducted four searches for each pain condition and decided on a search criterion when the search yielded an appropriate number of papers to create an optimal list of pharmaceutical options across all conditions. Appendix 1 lists the specific search strategies for each iteration and their respective number of results. Once we identified a standardized search strategy across pain conditions, we conducted a search using Boolean operators that combined keywords and Medical Subject Headings terms in Pubmed on November 13, 2023. The results of this search for each pain condition are shown in Appendix 2. We followed the Preferred Reporting Items for Systematic Reviews and Meta-Analyses (PRISMA) guidelines for literature reviews. This review was not registered with PRISMA.
Exclusion Criteria
Papers were reviewed and excluded at two levels using criteria developed by all authors. At the first level, one author (KL) reviewed titles and abstracts and excluded studies if they did not mention pharmaceutical approaches for pain management; described procedural or regional approaches for pain management; did not describe the pain condition as being within the scope of practice for the emergency clinician (eg, a study that described management of back pain only related to spinal schwannoma); discussed only treatment for a pediatric population; or the study had not been conducted in an acute care/emergency care setting in the United States. We also excluded primary studies and systematic reviews to prioritize narrative summaries that synthesize medication administration approaches in ED pain management. At the second screening level, two authors (AS and SG) reviewed the full text of papers and excluded those that did not include a discussion of specific pharmaceutical interventions to address the painful condition. All included studies with succinct descriptions of their objectives are listed in Appendix 3.
Data Extraction
Once the articles were identified, two members of the team (AS and SG) reviewed each article to identify non-opioid pharmaceutical approaches that could be used for acute pain management for the specified condition or region of pain. From the literature review, the team developed a list of nonopioid pharmaceuticals for each of the five painful conditions of interest (Appendix 3). Asterisks indicate studies that presented pharmacologic pain management approaches for the ED based on appropriate, setting-specific data; only one study did not explicitly reference the ED but addressed acute management. An ED pharmacist cross-referenced this list of non-opioid pharmaceuticals with the hospital’s formulary to create a list of medications for acute pain management (Table 1). Medications appearing in Appendix 3 were not included in Table 1 when they were not available on our hospital formulary.
Results
A total of 246 studies matched our search criteria for the following conditions that commonly present with pain in the ED: abdominal pain; back pain; chest pain; fracture pain; and headache. Of those, 223 met further exclusion criteria. We included 23 studies in this review (Figure 1).
Study Characteristics
A variety of conditions were discussed in papers on abdominal pain, including obstruction-related abdominal pain, recurrent abdominal pain (two studies), cyclic vomiting syndrome (two studies), cannabinoid hyperemesis syndrome and other cannabis-related disorders (two studies), small bowel obstruction, and acute pancreatitis. The papers that focused on back pain were not specific to a cause for the back
Figure 1. PRISMA flow diagram of scoping review of recent literature for non-opioid pharmaceuticals.
ED, emergency department. PRISMA, Preferred Reporting Items for Systematic Reviews and Meta-Analyses.
pain. Studies regarding chest pain management either focused on acute chest syndrome secondary to sickle cell disease or pericarditis (two studies). Studies on pain management approaches for headaches either focused on approaches for undiagnosed headaches or migraines. Only one appropriate study was identified for fracture pain, and this specifically focused on pain management for hip fractures in elderly patients with comorbidities.
Non-Opioid Pharmaceuticals
Table 1 presents the list of non-opioid pharmaceuticals, along with their route of administration and suggested dosage identified through this review.
Non-steroidal anti-inflammatory drugs (NSAID) and acetaminophen were indicated for each of the five painful conditions of abdominal pain, back pain, chest pain, fracture pain, and headache. Antidepressants and muscle relaxants, such as venlafaxine and cyclobenzaprine, respectively, were indicated for back pain. Pharmaceutical pain management approaches for abdominal pain included benzodiazepines, antipsychotics (droperidol and haloperidol), and ketamine. The approach for chest pain also included ketamine. A variety of classes of substances were also indicated for headaches, including antipsychotics (chlorpromazine, droperidol,
Table 1. Alternative to opioid pharmaceuticals for pain management in the emergency department, sorted by commonly presenting pain-associated conditions in the emergency department.
Back pain
Acetaminophen
Venlafaxine
Cyclobenzaprine
Tablet: 325, 500 mg
Premix IV: 500, 1000 mg
500-1000 mg IV/PO Q6H
Tablet: 75 mg XR 75 mg PO daily
Tablet: 5, 10 mg 5 to 10 mg PO TID PRN NSAIDs
Ibuprofen
Naproxen
Tablet: 200 - 800 mg Oral liquid
Tablet: 250, 500 mg
400-800 mg PO Q8H PRN
250-500 mg Q12H PRN
Ketorolac Injectable 15 mg IV Q6H PRN
Fracture pain
Acetaminophen
Tablet: 325, 500 mg
Premix IV: 500, 1000 mg
500-1000 mg IV/PO Q6H NSAIDs
Ibuprofen
Naproxen
Tablet: 200 - 800 mg Oral Liquid
400-800 mg PO Q8H PRN
Tablet: 250, 500 mg 250-500 mg Q12H PRN
Ketorolac Injectable 15 mg IV Q6H PRN
Abdominal pain
Acetaminophen
Benzodiazepines
Diazepam
Lorazepam
Antipsychotics
Haloperidol
Tablet: 325, 500 mg
Premix IV: 500, 1000 mg
500-1000 mg IV/PO Q6H
Tablet: 2, 5 mg injectable 2-5 mg IV/PO
Tablet: 1, 2 mg Injectable 1-2 mg IV/PO/SL
Tablet: 1, 5 mg Injectable 2-5 mg IV/PO
Droperidol Injectable 1.25-2.5 mg IV/IM
Ketamine Injectable 0.15-0.3 mg/kg IV/IM
NSAIDs
Ibuprofen
Naproxen
Tablet: 200 - 800 mg Oral liquid
Tablet: 250, 500 mg
400-800 mg PO Q8H PRN
250-500 mg Q12H PRN
Ketorolac Injectable 15 mg IV Q6H PRN
Chest Pain
Acetaminophen
Tablet: 325, 500 mg
Premix IV: 500, 1000 mg
500-1000 mg IV/PO Q6H
Ketamine Injectable 0.15-0.3 mg/kg IV/IM
NSAIDs
Ibuprofen
Naproxen
Tablet: 200 - 800 mg Oral liquid
Tablet: 250, 500 mg
400-800 mg PO Q8H PRN
250-500 mg Q12H PRN
Ketorolac Injectable 15 mg IV Q6H PRN
IM, intramuscular; IV, intravenous; NSAID, non-steroidal anti-inflammatory drug; PO, oral; SL, sublingual; PR, per rectum; PRN, as needed; Q6H, every 6 hours; Q8H, every 8 hours; Q12H, every 12 hours; TID, three times daily; XR, extended release.
Table 1. Continued.
Headache
Acetaminophen
Antipsychotics
Haloperidol
Tablet: 325, 500 mg
Premix IV: 500, 1000 mg
500-1000 mg IV/PO Q6H
Tablet: 1, 5 mg Injectable 2-5 mg IV/PO
Droperidol Injectable 1.25-2.5 mg IV/IM
Chlorpromazine
Prochlorperazine
Tablet: 10, 25 mg Injectable 10-25 mg PO/IM
Tablet: 10 mg Injectable 10 mg IV/IM/PO
Ketamine Injectable 0.15-0.3 mg/kg IV/IM
Magnesium sulfate 2 G premix IVPB 2 G IV
Metoclopramide
NSAIDs
Ibuprofen
Naproxen
Tablet: 10 mg
Injectable: 10 mg 10 mg IV/PO
Tablet: 200 - 800 mg Oral liquid
Tablet: 250, 500 mg
400-800 mg PO Q8H PRN
250-500 mg Q12H PRN
Ketorolac Injectable 15 mg IV Q6H PRN
Promethazine
Sumatriptan
Tablet: 12.5 mg
Suppository: 25 mg 12.5-25 mg PO/PR
Tablet: 25 mg
Nasal spray: 20 mg
Subcutaneous: 6 mg
50-100 mg PO
20 mg intranasal 6 mg subcutaneous
G, gram; IM, intramuscular; IV, intravenous; IVPB, intravenous piggyback; NSAID, non-steroidal anti-inflammatory drug; PO, oral; SL, sublingual; PR, per rectum; PRN, as needed; Q6H, every 6 hours; Q8H, every 8 hours; Q12H, every 12 hours; TID, three times daily; XR, extended release.
In this methodical literature review of non-opioid pharmaceuticals for the management of five painful conditions commonly presenting to EDs, we identified 23 relevant studies that included pharmaceutical pain management strategies. We found some commonalities such as NSAIDs and acetaminophen being indicated for all five conditions, while other medication classes were only indicated for specific conditions (eg, antidepressants and muscle relaxants for back pain). We also found evidence for a diverse set of non-opioid pharmaceuticals, including ketamine, benzodiazepines, and antiemetics, that could be used in the treatment of conditions presenting with abdominal pain and headache.
Using available systematic reviews published after 2019, we created a brief synthesis of the strength of evidence for each medication class by condition in Table 2. We identified
several medications with supportive data, including the acetaminophen-ibuprofen combination for all pain-related conditions and select psychotropic agents for migraines. Many other medications had only mixed or preliminary evidence. Still, these findings should not preclude their use. Mixed evidence often reflects heterogeneity in study design or indication for use, and preliminary trials may signal meaningful therapeutic promise.
Other existing alternative-to-opioid pharmaceutical lists provide clear guidance but often lack indicationspecific recommendations or a comprehensive review of pharmaceutical options. A broad overview of non-opioid pharmaceuticals substantially overlapped with our list but provided only limited discussion of indication-specific use.19 The review discussed lidocaine and gabapentinoids for acute neuropathic pain, while our list uniquely incorporated muscle relaxants and serotonin-norepinephrine reuptake inhibitors. Another set of guidelines offered strong indicationspecific recommendations.20 For headaches, for example, they also included dexamethasone, benzodiazepines, and
Table 2. Evidence synthesis of proposed alternative-to-opioid medications for management of commonly presenting pain-associated conditions in the emergency department.
Back pain
Fracture pain
Abdominal pain
Chest pain
Headache
Multiple reviews consistently support NSAIDs, both alone and in combination with agents such as serotonin-norepinephrine reuptake inhibitors (SNRI), muscle relaxants, or acetaminophen.44–47 However, evidence for acetaminophen48,49 and muscle relaxants individually45,50 for management of back pain is mixed, with no consistent benefit across trials. SNRIs such as venlafaxine and duloxetine have only limited data, and early studies show small, clinically insignificant improvements, although their use in patients with chronic neuropathic pain suggest they may help patients with similar acute features.51
Initial trials suggest that ibuprofen and NSAID-acetaminophen combinations provide meaningful benefit, whereas the evidence base for acetaminophen alone is inconsistent.52–56 However, fractures make up only a small portion of randomized trials on acute ED musculoskeletal pain, underscoring the need for more systematic, fracture-specific evidence.
Evidence for treating acute undifferentiated abdominal pain remains limited. Acetaminophen outperformed placebo in small trials and shows early pain reductions comparable to opioids.49,57 For biliary colic and dysmenorrhea, NSAIDs demonstrate the strongest evidence of benefit.57 Preliminary studies suggest that neuroleptics27 and ketamine may reduce pain intensity,58 while benzodiazepines have little supportive evidence outside of abdominal pain related to withdrawal.59
Non-opioid management for undifferentiated chest pain is limited, largely because most research focuses on cardiac etiologies. For rib fractures, acetaminophen provides pain relief comparable to other modalities, although NSAIDs have not been formally studied in randomized trials. Ketamine shows mixed results, offering benefit in some older adults but not consistently across the broader population.60
Acetaminophen, NSAIDs, and metoclopramide are commonly used for migraine pain, although recent analyses has questioned the benefit of acetaminophen and NSAIDs.61 Antipsychotics such as haloperidol and droperidol can also reduce migraine-associated pain,62 and antihistamines are often added to minimize extrapyramidal side effects.63 Magnesium sulfate additionally has preliminary evidence suggestive benefits for migraine pain control.61
muscle relaxants, although they did not address ketamine or antihistamine from our list. For abdominal pain, they added dicyclomine and antihistamines. Recommendations for back pain were largely aligned but, notably, these guidelines did not address fractures or chest pain related to rib fractures—both of which are common ED presentations. These comparisons highlight that, while existing resources offer valuable starting points, our synthesis provides a more comprehensive framework tailored to common ED presentations that can easily be implemented in pharmaceutical order sets.
The list generated from this review addresses pain management approaches for the five most commonly presenting painful conditions at our institution using the hospital’s formulary. It may not address certain painassociated conditions that are prevalent at other institutions. For example, other pain-associated conditions that commonly present in the national ED data but are not represented in this study include contusions, muscle sprains, other musculoskeletal pain that is not back pain, and urinary tract infections.64 In addition, although Appendix 3 compiles all non-opioid pain management alternatives referenced in the literature, Table 1 is limited to medications available within our hospital formulary. Future reviews could provide more comprehensive, indication-specific lists of non-opioid options
that are applicable across diverse hospital formularies for other commonly presenting pain-associated conditions.
When generating our list, we chose not to identify the recommended sequence of use for each medication. Some studies included a recommended sequence, but we chose to ignore this information in favor of a general list of treatment options that could be adapted by individual clinicians. Any ED hoping to adopt structural changes, or any individual clinician interested in using more non-opioid medications, can easily integrate this list into practice. An ED could integrate this list into electronic health record tools, and clinicians could use their own clinical judgment on the most appropriate pain management approach for their patient based on the nuances of the patient’s context and presentation.
Along with non-opioid medications, emergency clinicians should also consider the potential benefits of complementary and integrative therapies for pain management in the emergency setting. For example, in the treatment of low back pain, studies also mentioned superficial heat, massage, acupuncture, spinal manipulation, tai chi, yoga, and cognitive behavioral therapy, among other therapies as alternatives to opioids. However, some consideration should be placed on the affordability and practicality of these approaches; these are not available in most EDs, and patients may not have the
time, insurance coverage, or funds to pursue these therapies as outpatients.65,66 Nevertheless, alternative non-pharmaceutical therapies could offer additional options for pain management with potentially lower risks of iatrogenic harm. Future studies should explore the integration of these complementary therapies along with pharmaceutical interventions to provide comprehensive pain management strategies in the ED.
Our findings hold significant implications for pain management approaches in the ED and public health efforts aiming to address the opioid epidemic. By providing alternatives to opioid prescriptions, this review supports efforts to reduce opioid overexposure in the ED while helping to manage patient pain. Implementing these non-opioid pharmaceutical options could potentially mitigate the risks associated with opioid use, including addiction, overdose, and iatrogenic harm, particularly in populations vulnerable to opioid-related adverse events.67,68 Encouraging the use of these alternatives aligns with broader initiatives aimed at optimizing pain management practices, improving patient outcomes, and contributing to the overall mitigation of the ED’s contribution to the opioid crisis.
The results from this study can be used as a resource in the ongoing education and awareness initiatives in EDs regarding the availability and efficacy of non-opioid pain management strategies. For example, the list of nonopioid pharmaceuticals could be used to develop electronic health record tools that encourage emergency clinicians to heighten their awareness of non-opioid medications for pain management. These decision-support tools would ideally be specific to the clinical scenario, be appropriately timed to clinician workflow, and allow rapid access to ordering specific alternatives to opioids.
LIMITATIONS
This study has a few key limitations that merit discussion. The medications we identified generally apply to presentations of pain in the five discussed anatomical regions. However, the set of medications within each category does not necessarily represent the best treatment for patients with specific conditions within the broader pain class, such as a schwannoma that presents similarly in a patient as back pain, or acute coronary syndrome vs other causes of chest pain. While emergency clinicians frequently make decisions about their specific pain management approach before the presenting condition is diagnosed, clinicians should be wary of expecting a high degree of efficacy from a non-opioid alternative for non-specific pain. This study also focuses exclusively on non-opioid pharmacologic approaches to pain management. While regional anesthesia techniques are increasingly being used in the ED as a procedural alternative for non-opioid pain control, we did not address this alternative to treat pain. Our aim was to synthesize a pharmacologic toolkit for ED pain management, and while a dedicated review of regional anesthesia techniques
would be valuable, it was beyond the scope of this analysis. Future studies could consider the expanding role of regional anesthesia along with non-opioid pharmaceuticals in acute pain management within the ED setting.
Another key limitation of this review was the scarcity of available literature that met criteria for inclusion in our study for certain common pain-associated conditions, such as fracture pain, back pain, and chest pain. This prevented us from creating a comprehensive list of medications that accurately captured appropriate approaches for the management of painful conditions. In addition, for headaches, the literature primarily focused on commonly occurring diagnoses such as migraines, limiting the diversity of conditions included in the review. While the exclusion criteria involved reviewing titles and abstracts to determine whether studies addressed pharmaceutical pain management in the ED setting, another limitation is that the full content of some included studies was not entirely based in the ED or informed by guidelines from emergency care professional societies. However, all included studies addressed pharmaceutical management of acute conditions presenting with pain as a primary symptom, such as intestinal obstruction, low back pain, and cyclic vomiting syndrome. These studies still address pharmaceutical treatment strategies for acute pain presentations that are highly relevant to ED practice.
This review also did not account for the effect size of pharmaceuticals in managing patient pain when compiling the list of alternatives. The primary aim was to identify viable non-opioid alternatives for emergency settings, without assessing the magnitude of pain reduction compared to opioids. In conditions such as acute back pain, where evidence for non-opioid efficacy in the ED remains limited or controversial, the utility of these pharmacologic approaches should be interpreted conservatively. Future research should explore the effect size of these alternatives to ensure comparable pain management outcomes while tailoring prescriptions to individual patient needs and clinical contexts. Future reviews could also include a broader set of studies, rather than only reviews, to help assess efficacy of non-opioid medications.
CONCLUSION
We identified several non-opioid medications for the treatment of acute pain in the emergency department, which may succeed in treating pain while reducing patient exposure to opioids. Clinicians and EDs may consider using these pharmaceuticals and facilitating their use in electronic health records.
ACKNOWLEDGMENTS
The authors wish to acknowledge the contributions of Megan Bhatti, MPH and Jill Barr-Walker, MPH, MS (ZSFG Library) to this project.
Address for Correspondence: Akash Shanmugam, BS, University of California, San Francisco, School of Medicine, 550 16th St. #5212, San Francisco, CA 94158. Email: akash.shanmugam@ ucsf.edu.
Conflicts of Interest: By the WestJEM article submission agreement, all authors are required to disclose all affiliations, funding sources and financial or management relationships that could be perceived as potential sources of bias. SG, JCCM, AMG, and KTL receive funding from the Substance Abuse and Mental Health Services Administration under the Emergency Department Alternatives to Opioids Program (1H79TI085981) for implementation of the project described in this study. The sponsor had no role in the preparation, review, or approval of this manuscript, nor the decision to submit the manuscript for publication. The article’s contents are solely the responsibility of the authors and do not necessarily represent the official views of the sponsor. No other author has professional or financial relationships with any companies that are relevant to this study. There are no other conflicts of interest or sources of funding to declare.
1. Cordell WH, Keene KK, Giles BK, et al. The high prevalence of pain in emergency medical care. Am J Emerg Med. 2002;20(3):165-169.
2. Hughes JA, Douglas C, Jones L, et al. Identifying patients presenting in pain to the adult emergency department: A binary classification task and description of prevalence. International Emergency Nursing. 2023;68:101272.
3. Cho G, Chang VW. Trends in Prescription Opioid and Nonopioid Analgesic Use by Race, 1996-2017. Am J Prev Med. 2022;62(3):422426.
4. Gleber R, Vilke GM, Castillo EM, et al. Trends in emergency physician opioid prescribing practices during the United States opioid crisis. Am J Emerg Med. 2020;38(4):735-740.
5. Webb J, Hartwell M. Trends of opioid usage in emergency departments: An analysis of opioid dispensing from 2019 to 2021. Am J Emerg Med. 2024;77:207-209.
6. Axeen S, Seabury SA, Menchine M. Emergency Department Contribution to the Prescription Opioid Epidemic. Ann Emerg Med. 2018;71(6):659-667.e3.
7. Daoust R, Paquet J, Marquis M, et al. Evaluation of Interventions to Reduce Opioid Prescribing for Patients Discharged From the Emergency Department: A Systematic Review and Meta-analysis. JAMA Netw Open. 2022;5(1):e2143425.
8. Stephenson J. Substantial Decline in Opioid Prescribing at Emergency Department Visits. JAMA Health Forum. 2020;1(1):e200026.
9. Kilaru AS, Lowenstein M, Agarwal AK. Optimizing Opioid Prescriptions for Patients in the Emergency Department—How Much Is Almost Never? JAMA Network Open. 2022;5(1):e2143433.
10. Sin B, Sikorska G, YauLin J, et al. Comparing Nonopioids Versus
Opioids for Acute Pain in the Emergency Department: A Literature Review. Am J Ther. 2021;28(1):e52.
11. Moore RA, Wiffen PJ, Derry S, et al. Non-prescription (OTC) oral analgesics for acute pain - an overview of Cochrane reviews. Cochrane Database Syst Rev. 2015;(11).
12. Friedman BW, Dym AA, Davitt M, et al. Naproxen With Cyclobenzaprine, Oxycodone/Acetaminophen, or Placebo for Treating Acute Low Back Pain: A Randomized Clinical Trial. JAMA 2015;314(15):1572-1580.
13. Duncan RW, Smith KL, Maguire M, et al. Alternatives to opioids for pain management in the emergency department decreases opioid usage and maintains patient satisfaction. Am J Emerg Med 2019;37(1):38-44.
14. Montague M, Hopson C, Layton C, et al. Outcomes of an Emergency Department opioid alternatives Program implemented within a safetynet hospital system. BMC Emerg Med. 2025;25(1):5.
15. Sangal RB, Rothenberg C, Hawk K, et al. Real-World Observational Evaluation of Common Interventions to Reduce Emergency Department Prescribing of Opioid Medications. Jt Comm J Qual Patient Saf. 2023;49(5):239-246.
16. Stader D, Wald H, MacKay DR, et al. Alternatives to opioid protocols in Colorado emergency departments reduce opioid use without changing reported pain. JACEP Open. 2020;1(6):1493-1499.
17. Coombs DM, Machado GC, Richards B, et al. Effectiveness of a multifaceted intervention to improve emergency department care of low back pain: a stepped-wedge, cluster-randomised trial. BMJ Qual Saf. 2021;30(10):825-835.
18. Ahmed ZA, Nacopoulos DA, John S, et al. An Algorithm for Opioid and Barbiturate Reduction in the Acute Management of Headache in the Emergency Department. Headache. 2017;57(1):71-79.
19. Rech MA, Griggs C, Lovett S, et al. Acute pain management in the Emergency Department: Use of multimodal and non-opioid analgesic treatment strategies. Am J Emerg Med. 2022;58:57-65.
20. Colorado Chapter AC of EP. Colorado ACEP 2017 Opioid Prescribing & Treatment Guidelines: Confronting the Opioid Epidemic in Colorado’s Emergency Departments. 2017. Available at: https://cha. com/wp-content/uploads/2018/01/COACEP_Opioid_Guidelines-Final. pdf. Accessed June 7, 2024.
21. Catena F, De Simone B, Coccolini F, et al. Bowel obstruction: a narrative review for all physicians. World J Emerg Surg. 2019;14(1):20.
22. Daniels J, Griffiths M, Fisher E. Assessment and management of recurrent abdominal pain in the emergency department. Emerg Med J 2020;37(8):515-521.
23. Frazier R, Li BUK, Venkatesan T. Diagnosis and Management of Cyclic Vomiting Syndrome: A Critical Review. Am J Gastroenterol. 2023;118(7):1157-1167.
24. Gajendran M, Sifuentes J, Bashashati M, et al. Cannabinoid hyperemesis syndrome: definition, pathophysiology, clinical spectrum, insights into acute and long-term management. J Investig Med 2020;68(8):1309-1316.
25. Herlihy JD, Reddy S, Shanker A, et al. Cyclic vomiting syndrome: an overview for clinicians. Expert Rev Gastroenterol Hepatol.
2019;13(12):1137-1143.
26. Long B, Robertson J, Koyfman A. Emergency Medicine Evaluation and Management of Small Bowel Obstruction: Evidence-Based Recommendations. J Emerg Med. 2019;56(2):166-176.
27. Miller AC, Khan AM, Castro Bigalli AA, et al. Neuroleptanalgesia for acute abdominal pain: a systematic review. J Pain Res. 2019;12:787-801.
28. Razban M, Exadaktylos AK, Santa VD, et al. Cannabinoid hyperemesis syndrome and cannabis withdrawal syndrome: a review of the management of cannabis-related syndrome in the emergency department. Int J Emerg Med. 2022;15(1):45.
29. Waller A, Long B, Koyfman A, et al. Acute Pancreatitis: Updates for Emergency Clinicians. J Emerg Med. 2018;55(6):769-779.
30. Jenkins HJ, Ferreira G, Downie A, et al. The available evidence on the effectiveness of 10 common approaches to the management of non-specific low back pain: An evidence map. Eur J Pain. 2022;26(7):1399-1411.
31. Martel JW, Potter SB. Evaluation and Management of Neck and Back Pain. Semin Neurol. 2019;39(1):41-52.
32. Koehl JL, Koyfman A, Hayes BD, et al. High risk and low prevalence diseases: Acute chest syndrome in sickle cell disease. Am J Emerg Med. 2022;58:235-244.
33. McGuire M, Harvey W, Brady T, et al. Diagnosing and treating pericarditis and myocarditis in the emergency department. Emerg Med Pract. 2023;25(7):1-24.
34. Schwier NC, Cannedy JJ, Skrepnek GH. Management of Acute Idiopathic (Viral) Pericarditis in the Emergency Department: A Review for the Nursing Professional. Adv Emerg Nurs J. 2020;42(1):17-29.
35. Li L, Bennett-Brown K, Morgan C, et al. Hip fractures. Br J Hosp Med (Lond). 2020;81(8):1-10.
36. Bilhimer MH, Groth ME, Holmes AK. Ketamine for Migraine in the Emergency Department. Adv Emerg Nurs J. 2020;42(2):96-102.
37. Filler L, Akhter M, Nimlos P. Evaluation and Management of the Emergency Department Headache. Semin Neurol. 2019;39(1):20-26.
38. Giamberardino MA, Affaitati G, Costantini R, et al. Acute headache management in emergency department. A narrative review. Intern Emerg Med. 2020;15(1):109-117.
39. Jesani J, Simerson D. Pharmacologic Management of Acute Migraines in the Emergency Department. Adv Emerg Nurs J. 2019;41(2):150-162.
40. Kazi F, Manyapu M, Fakherddine M, et al. Second-line interventions for migraine in the emergency department: A narrative review. Headache. 2021;61(10):1467-1474.
41. Rashed A, Mazer-Amirshahi M, Pourmand A. Current Approach to Undifferentiated Headache Management in the Emergency Department. Curr Pain Headache Rep. 2019;23(4):26.
42. Robblee J, Grimsrud KW. Emergency Department and Inpatient Management of Headache in Adults. Curr Neurol Neurosci Rep. 2020;20(4):7.
43. Vekhter D, Robbins MS, Minen M, et al. Efficacy and Feasibility of Behavioral Treatments for Migraine, Headache, and Pain in the Acute Care Setting. Curr Pain Headache Rep. 2020;24(10):66.
44. Ashbrook J, Rogdakis N, Callaghan MJ, et al. The therapeutic management of back pain with and without sciatica in the emergency department: a systematic review. Physiotherapy. 2020;109:13-32.
45. Baroncini A, Maffulli N, Al-Zyoud H, et al. Nonopioid pharmacological management of acute low back pain: A level I of evidence systematic review. J Orthop Res. 2023;41(8):1781-1791.
46. Cao Z, Han K, Lu H, et al. Paracetamol Combination Therapy for Back Pain and Osteoarthritis: A Systematic Review and Meta-Analyses. Drugs. 2024;84(8):953-967.
47. Saindane R, Thombre N. Concurrent use of skeletal muscle relaxants and NSAIDs in low back pain management: A critical review of current evidence and future directions. Thai J Pharm Sci. 2025;49(2).
48. Oliveira CB, Amorim HE, Coombs DM, et al. Emergency department interventions for adult patients with low back pain: a systematic review of randomised controlled trials. Emerg Med J. 2021;38(1):59-68.
49. Qureshi R, Werner B, Puvanesarajah V, et al. Factors Affecting LongTerm Postoperative Narcotic Use in Discectomy Patients. World Neurosurg. 2018;112:e640-e644.
50. Abril L, Zamora C, Cordero M, et at. The Relative Efficacy of Seven Skeletal Muscle Relaxants. An Analysis of Data From Randomized Studies. J Emerg Med. 2022;62(4):455-461.
51. Ferreira GE, McLachlan AJ, Lin CWC, et al. Efficacy and safety of antidepressants for the treatment of back pain and osteoarthritis: systematic review and meta-analysis. BMJ. 2021;372:m4825
52. Jones CMP, Lin CWC, Jamshidi M, et al. Effectiveness of Opioid Analgesic Medicines Prescribed in or at Discharge From Emergency Departments for Musculoskeletal Pain. Ann Intern Med. 2022;175(11):1572-1581.
53. Kolli S, Friedman BW, Latev A, et al. A Randomized Study of Intravenous Hydromorphone Versus Intravenous Acetaminophen for Older Adult Patients with Acute Severe Pain. Ann Emerg Med 2022;80(5):432-439.
54. Minotti B, Mansella G, Sieber R, et al. Intravenous acetaminophen does not reduce morphine use for pain relief in emergency department patients: A multicenter, randomized, double-blind, placebo-controlled trial. Acad Emerg Med. 2022;29(8):954-962.
55. Nasr Isfahani M, Etesami H, Ahmadi O, et al. Comparing the efficacy of intravenous morphine versus ibuprofen or the combination of ibuprofen and acetaminophen in patients with closed limb fractures: a randomized clinical trial. BMC Emerg Med. 2024;24(1):15.
56. Scott G, Gong J, Kirkpatrick C, et al. Systematic review and metaanalysis of oral paracetamol versus combination oral analgesics for acute musculoskeletal injuries. Emerg Medicine Australasia. 2021;33(1):107-113.
57. Broder JS, Oliveira J. e Silva L, et al. Guidelines for Reasonable and Appropriate Care in the Emergency Department 2 (GRACE-2): Lowrisk, recurrent abdominal pain in the emergency department. Acad Emerg Med. 2022;29(5):526-560.
58. Ying M, Zuo Y. Efficacy of Low-dose Ketamine for Control of Acute Pain in the Emergency Setting: A Systematic Review and Metaanalysis of Randomized Controlled Trials. West J Emerg Med. 2023;24(3):644-653.
59. Scheuermeyer FX, Miles I, Lane DJ, et al. Lorazepam Versus Diazepam in the Management of Emergency Department Patients With Alcohol Withdrawal. Ann Emerg Med. 2020;76(6):774-781.
60. Bresgen TU, Salinaro F, Barcella B, et al. Acute pain management of rib fractures: a narrative review. Injury. 2025;56(12):112857.
61. Miller AC, K. Pfeffer B, Lawson MR, et al. Intravenous Magnesium Sulfate to Treat Acute Headaches in the Emergency Department: A Systematic Review. Headache. 2019;59(10):1674-1686.
62. Viau JA, Patel D, Cheng W, et al. Sodium Valproate Versus Dopamine Antagonists for Acute Migraine in the Emergency Department: A Systematic Review. Can J Neurol Sci. 2022;49(5):688-695.
63. Meyer J, Kirkland SW, Campbell S, et al. Adjuvant anticholinergic therapy for the prevention of akathisia in patients with primary headache in the emergency department: A systematic review. Acad Emerg Med. 2023;30(1):45-52.
64. Most Frequent Reasons for Emergency Department Visits, 2018 #286. Accessed June 7, 2024. Available at: https://hcup-us.ahrq.gov/reports/ statbriefs/sb286-ED-Frequent-Conditions-2018.jsp
65. Wilson M, Luca ED. Equitable Integrative Pain Care: Are We There Yet? Pain Management Nursing. 2021;22(6):681-683.
66. Ben-Arye E, Lopez AM, Daoud N, et al. Identifying factors associated with disparities in access to integrative oncology program. J Pain Symptom Manage. 2024;68(1):10-21.
67. Ajay D. Wasan MD, Darin J. et al. Iatrogenic addiction in patients treated for acute or subacute pain: A systematic review. J Opioid Manag. 2006;2(1):16-22.
68. Higgins C, Smith BH, Matthews K. Incidence of iatrogenic opioid dependence or abuse in patients with pain who were exposed to opioid analgesic therapy: a systematic review and meta-analysis. Br J Anaesth. 2018;120(6):1335-1344.
Length of Stay of Emergency Department Patients with Stimulant Intoxication Receiving Intravenous Fluid
Kent C. Grimes, MD, MPH*
Brandon Dyer†
Daniel Calkins†
Teagen Smith, MS‡
Heather Henderson, PhD*
Section Editor: Carmine Nasta, MD
* † ‡
University of South Florida, Morsani College of Medicine, Department of Emergency Medicine, Tampa, Florida
University of South Florida, Morsani College of Medicine, Tampa, Florida
University of South Florida, Research Methodology and Biostatistics Core, Tampa, Florida
Submission history: Submitted October 12, 2025; Revision received January 26, 2026; Accepted January 30, 2026
Electronically published May 15, 2026
Full text available through open access at http://escholarship.org/uc/uciem_westjem
DOI 10.5811/westjem.53133
Introduction: Intravenous (IV) fluids are routinely administered empirically in the emergency department (ED) for patients presenting with stimulant intoxication (eg, cocaine, methamphetamine, synthetic marijuana), although the literature is sparse regarding the benefits and risks of this practice. Our primary objective in this study was to assess whether empiric administration of IV fluids in the ED is associated with increased discharge length of stay (LOS) among ED patients presenting for stimulant intoxication who were subsequently discharged.
Methods: This single-center, retrospective cohort study included 100 patients 18-69 years of age who were discharged from the ED with a non-incidental diagnosis related to stimulant intoxication between May 29, 2020–December 31, 2023, based on International Classification of Diseases code and chart review, in addition to a triage heart rate ≥ 90 beats per minute. We excluded patients if the medical decision-making reflected a clear indication for IV fluids or the presence of pre-defined confounding diagnoses or an uncontrolled factor that would have inherently impacted discharge LOS. Our primary outcome measure was discharge LOS. A multiple linear regression model controlled for the potentially confounding secondary outcome measures of age, sex, alcohol involvement, advanced imaging, sedation, and discharge escort.
Results: A total of 100 patients were included, including 50 (50%) patients who did not receive IV fluids and 50 (50%) patients who did. Median patient age was 35 (interquartile range [IQR] 29-41) and 73% of patients were male. Patients who received IV fluids had a median LOS of 345 minutes (IQR 260-470) vs 305 minutes (IQR 205-413), with multivariable linear regression showing no statistically significant difference (β = 40.3, 95% CI, –13.6 to 94.2, R2 = 0.162).
Conclusion: This study suggests that empiric IV fluid administration in stimulant-intoxicated ED patients was not significantly associated with discharge length of stay. Although the observed difference and confidence interval suggest the possibility of a clinically meaningful increase in discharge LOS with empiric IV fluid, these findings should be interpreted cautiously. Time is an important resource in high-volume ED settings, and this study suggest the need for judicious use of IV fluids in the absence of a clear indication. [West J Emerg Med. 2026;27(3)669–675.]
INTRODUCTION
In recently released guidelines regarding the treatment of patients with stimulant use disorder, the American Society of Addiction Medicine provided a general recommendation for supportive care in cases of stimulant intoxication (eg, cocaine, methamphetamine, synthetic marijuana) including the use of
intravenous (IV) fluids, while also acknowledging a lack of evidence for more specific supportive measures.1 The risks and benefits of empiric IV fluid administration in the stimulant-intoxicated patient have not been well studied.1 For the purpose of this study, the administration of IV fluids without a clear indication and anticipated effect, such as in the
case of volume resuscitation, will be referred to as empiric use of IV fluids.
Tintinalli’s Emergency Medicine suggests that intoxicated patients in general do not require fluid replacement unless they are experiencing fluid depletion or are at risk of rhabdomyolysis,2 but the textbook stops short of acknowledging potential harms from empiric IV fluids such as increased emergency department (ED) discharge length of stay (LOS)3 and, more importantly, pulmonary edema, hypoxia, and ultimately need for admission.4,5 Acute respiratory compromise may be an even greater risk in patients who smoke stimulants.6 These are extreme consequences of the sympathomimetic toxidrome, which may consist of tachycardia, hypertension, tachypnea, hyperthermia, sweating, mydriasis, and seizures, thereby often requiring close monitoring and at times sedating medications such as benzodiazepines in the initial period as part of supportive care.1
In the case of alcohol intoxication, empiric use of IV fluids does not increase the rate of intoxicant clearance7 and has either no effect on8,9 or increases3 discharge LOS. This remains controversial,10 particularly when there is clinical suspicion for hypovolemia.11 Hypothetical extrapolation of these findings from alcohol intoxication to stimulant intoxication provides a starting point in the effort to add to the medical literature. To our knowledge, this is the first study to specifically evaluate the association of empiric IV fluid administration on discharge LOS in stimulant-intoxicated patients in the ED.
Importance
If the administration of empiric IV fluids in cases of stimulant intoxication without apparent indication were found to be associated with an increased discharge LOS, such a finding could lead to more judicious use of IV fluids, thereby decreasing resource use, cost of care, and risk of potential harm from IV catheter placement and fluid overload.
Goals of This Investigation
Our primary objective in this study was to assess whether empiric IV fluid administration in the ED is associated with an increase in discharge LOS among ED patients presenting for stimulant intoxication who were subsequently discharged.
METHODS
Study Design and Setting
We conducted this retrospective cohort, observational study in an urban, tertiary-care ED in Tampa, Florida. The study was considered exempt from full review and was provided a HIPAA waiver by the University of South Florida Institutional Review Board (IRB) (STUDY007726).
Selection of Participants
This study included patients 18-69 years of age discharged from the ED with a non-incidental diagnosis
Population Health Research Capsule
What do we already know about this issue?
Intravenous fluids are commonly given to stimulant-intoxicated ED patients, but evidence regarding the benefits and risks of this practice is lacking.
What was the research question?
Is IV fluid use without a clear indication associated with increased discharge length of stay in stimulant-intoxicated ED patients?
What was the major finding of the study?
The IV fluid group had a 40-minute longer discharge length of stay (β = 40.3, 95% CI, -13.6 to 94.2, R2 = 0.162).
How does this improve population health? Findings support more judicious use of IV fluids, helping reduce unnecessary resource utilization and ED crowding in high-volume systems.
related to stimulant intoxication based on International Classification of Diseases, 10th Rev, code (Appendix 1) and chart review. The study thus relied on real-time clinical decision-making of the treating physician to make the diagnosis based on clinical experience without a standardized protocol, in addition to a triage heart rate ≥ 90 beats per minute. Our intent was to attempt to decrease misclassification, particularly by excluding incidental or resolving stimulant intoxication.
Patients were excluded if their discharge diagnoses included laceration(s) requiring repair, bone fracture(s), dehydration, acute kidney injury, rhabdomyolysis, newly diagnosed infection, pregnancy, seizure, suicidality, decompensated chronic psychotic disease, or otherwise any clear indication in the documented medical decision-making as to why IV fluid was administered or the discharge LOS would be inherently prolonged or shortened. For example, we excluded charts if documentation included a patient temporarily refusing care; if difficult IV access was noted to cause a delay; and if delays in advanced imaging were noted, as well as other case-by-case situations that represented a delay in care and, therefore, a potential delay in discharge. Research assistants (RA) who collected the study data were instructed to avoid interpretation, such as of physical exam documentation (eg, “dry mouth”) or point-of-care ultrasound assessments, and instead rely on the clinician’s interpretation
(eg, “dehydration”) to determine whether the clinician had a clear indication for IV fluid administration, thus allowing us to exclude that chart. A training document was used to prepare the RAs for this task; every datapoint was verified at least one additional time after initial collection.
We conducted an a priori power analysis for the primary analysis method of multiple linear regression with a power of 0.9 and alpha of 0.05. Recent ED average monthly metric data was used to determine a control discharge LOS of 360 minutes (6 hours) in patients not receiving IV fluids. Consensus among emergency attending and resident physicians determined that, based on their medical decision-making practice pattern, 30 minutes would be the assumed minimal clinically important difference, representing the effect size. An assumption was made that the standard deviation of 60 minutes would be equal within the two groups. Put in other words, we assumed that 68% of patients intoxicated with stimulants who did not receive IV fluids would have a discharge LOS of 5-7 hours, and a difference of ≥ 30 minutes between the groups’ averages would be clinically significant, leading us to seek a moderate effect size, or Cohen f2 of 0.15, in the power analysis, resulting in a minimum sample size of 41 per group, or 82 total, using PASS 2022 software (NCSS, LLC, Kaysville, Utah).
This calculation also takes into account an adjustment for an additional six independent variables. Patients were included in the study, based on chart review within the electronic health record (EHR), until the necessary sample size was achieved. A patient could only be included once, and only their most recent encounter was included. This resulted in recruiting eligible patients who visited the ED from May 5, 2020–December 31, 2023.
Interventions
Patients were grouped by whether IV fluid was administered as determined by a review of orders during the visit. This was defined as the administration of any crystalloid fluid as either a bolus or infusion, regardless of the indication. If the order was discontinued, the order details were examined to determine whether IV fluids had been started at all; if they had been started, we considered them to have been administered.
Outcomes
The primary outcome of this study was discharge LOS in minutes. Multiple additional datapoints were collected as suspected confounding variables with the understanding that they could be used as secondary outcome measures in hypothesis-generating post-hoc analyses. The presenting heart rate and systolic blood pressure were collected to calculate the shock index (former divided by the latter) and be used as surrogates of dehydration or hypovolemia under previously discussed guidelines, all of which are reasons for IV fluid administration regardless of intoxication status. The dichotomous variables of alcohol involvement, need for
advanced imaging (eg, computed tomography, magnetic resonance imaging, ultrasound), and administration of sedating medication (eg, benzodiazepine, antipsychotic, antihistamine) were all suspected to be common occurrences that inherently increase discharge LOS. Lastly, because patients are more likely to be discharged sooner if they have a sober escort, we also collected this information.
Measurements
Study investigators obtained all data points from the EHR by chart review and consolidated them in a datasheet, with a second investigator verifying appropriate inclusion and accuracy of data. Review included the text of the visit note of the treating emergency physician and the table of signed orders during that encounter. Particularly in the case of whether alcohol was involved or an escort was available, if the information was not clearly available in the chart, an assumption was made and the datapoint was marked as a “no.” Criteria previously described by Worster et al to improve the quality of chart review studies were used in this study, including description of abstractor training, case selection criteria, variable definitions, abstraction forms, performance monitoring, identification of the medical record, sampling methodology, missing-data management plan, and IRB approval.12
Analysis
We summarized continuous variables as median (interquartile range [IQR]) and then compared them between groups using Mann-Whitney U tests. Categorical variables were summarized as frequency (percentage) and then compared between groups using chi-square tests. Additionally, we analyzed the association of discharge LOS and whether IV fluid was administered using a multiple linear regression analysis to support the continuous outcome variable while also controlling for the covariates of age, sex, alcohol involvement, advanced imaging ordered, use of sedating medications, and presence of an escort at discharge because of their potential contribution to the increase of discharge LOS, as was discussed in a similarly designed study.8 We assessed normality using a Shapiro-Wilk test and model fit was evaluated using R2. The analysis performed was prespecified in the study protocol, and we did not conduct additional analyses to limit the risk of overfitting. We performed all statistical analyses using IBM SPSS v29.0.2.0 (International Business Machines, Armonk, NY).
RESULTS
Characteristics of Study Subjects
We used the described chart review protocol to screen 1,397 charts within the study period, from which we selected 100 patients to include in the study sample: 50 (50%) patients who did not receive IV fluids and 50 (50%) patients who did receive IV fluids—a sample size that was achieved
coincidentally based on the needs of a priori power analysis. The median patient age was 35 years (IQR 29-41), and 73% of patients were male. Table 1 shows the study participant characteristics, stratified by IV fluid administration status.
Main Results
Based on a multiple linear regression model with discharge LOS as the dependent variable, IV fluid administration status as the independent variable, and the remaining variables listed in Table 2 as covariates, patients who presented to the ED with stimulant intoxication and received empiric IV fluid therapy had a median discharge LOS of 345 minutes (IQR 260-470) compared to patients with stimulant intoxication who did not receive IV fluids who had a median discharge LOS of 305 minutes (IQR 205-413), with multivariable linear regression showing non-statistical significance (β = 40.3, 95% CI, -13.6 to 94.2, R2 = 0.162). Datapoints for discharge LOS were found to be normally distributed (Shapiro-Wilk test P = .20), with a Q-Q plot that visually suggested normality as well. The full model summary is shown in Table 2.
Among the secondary outcomes, patients who received empiric IV fluids had a higher presenting heart rate (median 110 beats per minute [bpm] vs 105 bpm, P = .03) and were more likely to receive sedating medications (40% vs 20%, P = .03) compared to those who did not receive IV fluids. Additionally, advanced imaging being ordered had a significant positive correlation with discharge LOS (β = 76.7, 95% CI, 7.7- 145.6), while male sex had a significant negative correlation with discharge LOS (β = -71.1, 95% CI, -130.5 to -11.7). The remaining covariates did not have any statistically significant association with status of IV fluid administration.
DISCUSSION
Summary and Interpretation of Main Results
In this single-center, retrospective cohort study, we
found no statistically significant difference in discharge LOS of stimulant-intoxicated patients who received empiric IV fluids compared to those who did not. Although a priori power analysis was used to determine an appropriate sample size, the standard deviation within groups was higher than expected (149 minutes in the IV fluid group vs 124 minutes in patients who did not receive IV fluids, compared to the assumption of 60 minutes). Therefore, although this study may have ultimately been underpowered, the 40-minute (13%) higher discharge LOS and 95% CI indicating the possibility of up to 94 minutes (31%) longer discharge LOS among patients who received empiric IV fluid suggests that the true difference may be clinically significant. The model accounted for 16.2% of variance in discharge LOS (R2 = 0.162), a modest amount as to be expected given the multifactorial nature of ED throughput.
The secondary outcome result of the IV fluid administration group being more likely to have received sedating medications, with recognition of our inability to determine causality with our study design, may reflect an intention to replace insensible fluid losses in agitated, hyperthermic, or tachypneic patients who required sedation. Notably this difference of sedation administration between groups did not contribute significantly to a difference in discharge LOS in the regression model. Additionally, even despite controlling for diagnoses that would likely elicit fluid resuscitation, the finding that patients receiving empiric IVF fluids had a higher median presenting heart rate suggests that tachycardia alone may represent an indication for fluid resuscitation in some practices, although the difference between groups of 5 bpm lacks clinical significance.
This finding, combined with the fact that most patients in both groups had a normal shock index (median in both groups 0.77), post hoc analysis was deferred, and we limited vital signs to descriptive use. Considering the difference in presenting heart rate between groups, we conducted post hoc
Table 1. Patient characteristics and outcome data stratified by administration of intravenous fluids among 100 patients who were discharged after a presentation for stimulant intoxication.
Table 2. Stratification of discharge length of stay (LOS) by multiple linear regression modeling assessing the association between discharge LOS and administration of intravenous fluids, controlling for the listed variables, among 100 patients discharged after presenting for stimulant intoxication.
Variable Coefficient (β) 95% Confidence interval P value
Intravenous fluids
40.3 (-13.6, 94.2) .14
Age 2.3 (-0.4, 5.1) .10
Sex – Male -71.1 (-130.5, -11.7) .02
Alcohol involved 18.8 (-39.9, 77.4) .53
Advanced imaging ordered 76.7 (7.7, 145.6) .03
Received sedation
35.1 (-23.8, 94.0) .24
Escort at discharge -9.0 (-107.5, 89.6) .86
analyses in which the variables of presenting shock index, heart rate, and systolic blood pressure were added separately into the model (because of their substantial collinearity), with full results available in Appendix 2. These analyses produced similar results to the a priori analysis.
The secondary outcome of the association of advanced imaging ordered with increased discharge LOS (77 minutes) was expected, while other secondary outcomes—alcohol involvement, adminsitration of sedating medications, and presence of an escort at discharge—had nonstatistically significant effects in this study that was underpowered to detect them. The clinical significance of males having a statistically significant decrease in discharge LOS by 71 minutes compared to females is unclear but could reflect differences in perceived illness or bias in management and dispositioning.
Comparison to Previous Studies
This study is novel in the context of stimulant use; however, similar designs have been used to evaluate the effect of empiric IV fluid administration on discharge LOS in alcoholintoxicated patients which, arguably similarly, also showed no effect on8,9 or increases3 in discharge LOS. The potential for an efficacious dilutional effect from IV fluid administration has been challenged from the standpoint of discharge LOS, as previously discussed, in addition to biochemically in regard to intoxicant clearance in the case of alcohol.7
Strengths
This study had multiple strengths. The use of an a priori power analysis prevented overfitting of an otherwise relatively simple chart review protocol. Additionally, we measured and controlled for potentially confounding variables based on prior studies with similar design, some of which were validated in this study. These features helped maintain internal validity and
may improve generalizability of results to other urban centers. Overall, the study provides a pilot sample for future studies involving patients with stimulant intoxication.
Although not quantified in this study, there was an unexpectedly high number of patients who experienced symptoms of opioid intoxication, in many cases requiring naloxone to reverse respiratory depression, when they had intended to use a stimulant. While this quantification is likely variable between communities and has been studied,13 it may indicate a need for dedicated research from a public health perspective in an era of designer drugs containing multiple classes of substances.
Clinical Implications
This study may help guide medical decision-making in environments where time and space are more limited. In practice, IV fluids should continue to be administered in stimulant-intoxicated patients when clinically appropriate, with the understanding that it may noticeably increase discharge LOS. Notably, the observed association of advanced imaging and increased discharge LOS in this study may shift attention toward this and other elements of care that more clearly affect throughput. These insights can inform departmental protocols and resource allocation strategies, particularly in high-volume EDs where efficiency is critical.
Research Implications
Beyond discharge LOS, other areas of interest should be studied in the future that may build on this dataset, including determining factors that lead to increased oxygen requirements, intubation, and/or admission. Among those complicating factors, the route of stimulant administration may also have significance. The presence of other substances, particularly opioids, may also increase risk for negative outcomes. Further research on these topics would add to the relatively understudied area of stimulant intoxication.
LIMITATIONS
We have identified several limitations that may affect the results, interpretation, and generalizability of the study. We aimed to exclude patients with a clear indication for IV fluid administration with diagnosis- and narrative-based exclusion criteria; however, it is possible that patients may have inadvertently been included or excluded if, for example, a diagnosis was not documented or went undetected, or an assessment of volume status was not documented. This is inherent to the retrospective design of the study. Similarly, the administration of prehospital IV fluids and sedating medications was not accounted for, nor was the infusion rate, volume, or type of IV fluids, although in most cases it consisted of 1-2 liter boluses of either normal saline or lactated Ringers solution.
Notably patients were not necessarily excluded from the
non-IV fluid group if they had a contraindication to IV fluid administration (eg, current or high risk of volume overload). This increased study generalizability, however, may also have led to increased variance, although on subjective narrative review it was not a regular occurrence. Recall bias may also have influenced the results because the data point for alcohol involvement was at times determined based on the narrative documentation of a patient interview while they were intoxicated and could have resulted in misclassification bias, although in many cases blood alcohol levels were available.
Vital signs were collected and shock index calculated to be considered as surrogates for hypovolemia, but further exclusion accuracy could have been achieved through laboratory value interpretation such as kidney function, hemoconcentration, and urine studies. In many cases, no laboratory studies were ordered, and when significant abnormalities were present, they often were identified in the exclusion criteria through supporting diagnoses, such as acute kidney injury. The requirement of a heart rate ≥ 90 bpm was used as another surrogate means of increasing the likelihood that the patient in fact was intoxicated with a stimulant as is commonly the case; however, especially in the context of polysubstance use or even withdrawal, this surrogate marker may be misleading. For example, a patient who used stimulants and opioids and required naloxone for respiratory depression may be diagnosed, among other things, with stimulant intoxication. The addition of vital signs at discharge to the analysis could have provided more clarity between groups. Additionally, an attempt to elucidate a clear indication for IV fluid administration could have allowed for subgroup analyses with less variability; however, this would not have been reliable with the retrospective nature of the study, which instead addressed this by previously described exclusion criteria. Although the administration of IV fluids may expose patients to multiple adverse effects beyond an increase in discharge LOS,4–6 these events were not quantified in this study and often resulted in exclusion because of a requirement of admission; they represent an important area of future research.
Similarly, given the wide variety of stimulant intoxicants and their associated durations of effect in addition to dose and route of administration variability, the details of stimulant use were not quantified among the study groups and would likely be difficult to generalize to other centers, if even detectable, in the context of regional variability in drug supply. Based on urine drug screens and patient history, this study involved patients intoxicated with stimulants that included cocaine, methamphetamine, and synthetic marijuana; however, the exact intoxicant(s) from the local drug supply could not be confirmed with certainty in the clinical setting. Another potential contributing factor to variability was the lack of a standardized approach to the management of the stimulantintoxicated patient, where the clinician’s practice pattern could have influenced discharge LOS significantly, although this
study involved patients managed by dozens of different physicians over multiple years at a single center.
Finally, this study did not account for time of presentation or season of the year in addition to other commonly considered throughput modifiers such as peak volumes, variation of average acuity in the department, and general hospital throughput including severity of boarding of admitted patients in the ED having a ripple effect on resource demand. These limitations highlight the complexity of studying acutely intoxicated patients in the ED.
CONCLUSION
This study suggests that empiric IV fluid administration in stimulant-intoxicated ED patients was not significantly associated with discharge length of stay. Although the observed difference and confidence interval suggest the possibility of a clinically meaningful increase in discharge LOS with empiric IV fluid administration, these findings should be interpreted cautiously given the study’s limitations. Time remains an important resource in high-volume ED settings, and the results of this study suggest the need for judicious administration of IV fluids in the absence of a clear indication.
ACKNOWLEDGMENTS
The authors would like to thank the physicians and staff in the Tampa General Hospital Emergency Department for their continued day-to-day provision of excellent patient care that helped make available the data analyzed in this study referred to as LOVES-IVF.
Address for Correspondence: Kent C. Grimes, MD, MPH, Resident Physician, Morsani College of Medicine, University of South Florida, Department of Emergency Medicine, 1 Davis Blvd, Tampa, Florida, 33606. Email: kentgrimes@ufl.edu.
Conflicts of Interest: By the WestJEM article submission agreement, all authors are required to disclose all affiliations, funding sources and financial or management relationships that could be perceived as potential sources of bias. No author has professional or financial relationships with any companies that are relevant to this study. There are no conflicts of interest or sources of funding to declare.
1. Batki S, Ciccarone D, Hadland SE, et al. (2023). The ASAM/AAAP clinical practice guideline on the management of stimulant use disorder. Available at: https://downloads.asam.org/sitefinityproduction-blobs/docs/default-source/guidelines/stimulant-gudie/
Grimes et al. Length of Stay of ED Patients with Stimulant Intoxication Receiving IV Fluid
asam-aaap-stud_guideline_final-for-public-comment_043023. pdf?sfvrsn=75e952ed_3. Accessed October 12, 2025.
2. Greene S. (2020). General management of poisoned patients. In; JE Tintinalli, OJ Ma, DM Yealy, et al. (Eds.), Tintinalli’s Emergency Medicine: A comprehensive Study Guide (9th ed.). New York, NY: McGraw-Hill Education. Available at: https://accessmedicine. mhmedical.com/content.aspx?aid=1174959920. Accessed October 12, 2025.
3. Homma Y, Shiga T, Hoshina Y, et al. IV crystalloid fluid for acute alcoholic intoxication prolongs ED length of stay. Am Emerg Med. 2018;36(4):673–676.
4. Stein L, Beraud JJ, Cavanilles J, et al. Pulmonary edema during fluid infusion in the absence of heart failure. JAMA. 1974;229(1):65–68.
5. Li H, Bersten A, Wiersema U, et al. Bolus intravenous 0.9% saline leads to interstitial permeability pulmonary edema in healthy volunteers. Eur J Appl Physiol. 2021;121(12):3409–3419.
6. Wightman RS, Perrone J. (2020). Cocaine and amphetamines. In: JE. Tintinalli, OJ Ma, DM Yealy, et al. (Eds.), Tintinalli’s Emergency Medicine: A Comprehensive Study Guide (9th ed.). New York, NY: McGraw-Hill Education. Available at: https://accessmedicine. mhmedical.com/content.aspx?aid=1166600319. Accessed October 12, 2025.
7. Li J, Mills T, Erato R. Intravenous saline has no effect on blood ethanol clearance. J Emerg Med. 1999;17(1):1–5.
8. Terayama T, Sasa R, Nakatani Y, et al. Effect of intravenous fluid therapy for acute alcohol intoxication on length of time from arrival at the emergency department until awakening: a prospective observational cohort study. Acute Med Surg. 2023;10(1):e841.
9. Perez SR, Keijzers G, Steele M, et al. Intravenous 0.9% sodium chloride therapy does not reduce length of stay of alcohol-intoxicated patients in the emergency department: a randomized controlled trial. Emerg Med Australas. 2013;25(6):527–534.
10. Hindmarch PN, Land S, Wright J. Emergency physicians’ opinions on the use of intravenous fluids to treat patients intoxicated with ethanol (alcohol): attitudes of emergency medicine physicians in the North East of England toward the use of intravenous fluids to treat individuals intoxicated with ethanol (alcohol) attending the emergency department compared with the scientific evidence. Eur J Emerg Med. 2012;19(6):379–383.
11. Sanaei-Zadeh H. Use of intravenous fluids for the treatment of patients intoxicated with ethanol (alcohol): Is it a scientific-based practice? Eur J Emerg Med. 2012;19(6):409-410.
12. Worster A, Bledsoe RD, Cleve P, et al. Reassessing the methods of medical record review studies in emergency medicine research. Ann Emerg Med. 2005;45(4):448–451.
13. Wagner K, Fiuty P, Page K, et al. Prevalence of fentanyl in methamphetamine and cocaine samples collected by community-based drug checking services. Drug Alcohol Depend. 2023;252:110985.
Assessment of Inter-rater Variability in the Diagnosis of Urinary Tract Infections in the Emergency Department
Johnathan M. Sheele, MD, MHS, MPH*
Jesse W. St. Clair IV, MD*
Edward J. Ziegler†
Michael M. Mohseni, MD*
Section Editor: Murat Cetin, MD
Mayo Clinic, Department of Emergency Medicine, Jacksonville, Florida Mayo Clinic Alix School of Medicine, Jacksonville, Florida
Submission history: Submitted October 02, 2025; Revision received December 20, 2025; Accepted December 22, 2025
Electronically published April 2, 2026
Full text available through open access at http://escholarship.org/uc/uciem_westjem DOI 10.5811/westjem.53012
Introduction: Urinary tract infections (UTI) are among the most common bacterial infections diagnosed in the emergency department (ED), yet the urinalysis results can be neither sensitive nor specific for UTI. Our objective was to quantify inter-rater variability of three emergency attending physicians for the clinical diagnosis of UTI, and secondarily to compare the diagnosis made at bedside by the treating clinician with the evaluations of three emergency physician-chart reviewers after the fact.
Methods: Chart reviewers read 18 articles on the diagnosis of UTI before retrospectively evaluating a convenience sample of 473 ED encounters where patients received both a urinalysis and urine culture as part of their ED evaluation. The chart reviewers were blinded to the urine culture results, medications administered and prescribed, and to the treating clinician’s diagnoses. Reviewers were asked to rate the likelihood of UTI based on a 0-4 ordinal scale. A “true positive” UTI occurred when the treating clinician diagnosed the patient with a UTI and the urine culture had ≥10,000 colony-forming units (CFU)/mL of bacteria. We considered a “false positive” to be when the treating clinician diagnosed the patient with a UTI, but the urine culture was < 10,000 CFU/mL of bacteria. A “true negative” occurred when the treating clinician did not diagnose the patient with a UTI, and the urine culture was < 10,000 CFU/mL of bacteria.
Results: Median patient age was 63 years, 355 (75%) were female sex, 409 (86.5%) were White race, and 207 were admitted to the hospital. The inter-rater agreement among the three independent reviewers was high (κ 0.82-0.85) with intraclass coefficient (2,1) = 0.83. However, the reviewers-totreating clinician agreement was only moderate in the true positives (treating clinician diagnosed patient with a UTI and the patient had a positive urine culture) and lowest in the false positives (treating clinician diagnosed the patient with a UTI, but the urine culture was < 10,000 CFU/mL with κ values of 0.44 and 0.21, respectively). The variables associated with consensus among reviewers were nitrites, leukocyte esterase, and higher urine white blood cells.
Conclusion: There was high consensus among reviewers about the likelihood of a urinary tract infection, but lower consensus when comparing reviewers’ impressions with those of the treating clinician. At bedside emergency clinicians were more likely to diagnose a UTI with a resultant negative urine culture. Further research is needed to improve the diagnostic accuracy of UTI in the emergency department. [West J Emerg Med. 2026;27(3)676–683.]
INTRODUCTION
Urinary tract infections (UTI) are among the most common problems evaluated in the emergency department
(ED) and result in high empiric antibiotic use.1-3 Yet diagnosing UTI accurately is difficult: Symptoms often overlap with other conditions, presentations are atypical in
older or catheterized patients, and culture results arrive after key decisions have been made.4-7 These realities create fertile ground for disagreement among clinicians about who truly has an infection vs colonization, or whether there is an alternative diagnosis. (eg, in an ED cohort in the United Kingdom, 60-70% of patients treated for UTI ultimately lacked microbiological or clinical confirmation8). Within this context sexually transmitted infections may be under-recognized.9 Inter-rater reliability (IRR)—the extent to which different clinicians reach the same conclusion on the same patient—is a practical barometer of diagnostic quality in this setting.10-11
The consequences of unreliability are substantial. Overdiagnosis exposes patients to unnecessary antibiotics, with attendant risks of adverse drug events and antimicrobial resistance, whereas under-recognition of true infections can delay appropriate therapy and worsen outcomes.12-14 In the high-throughput emergency setting, where decisions must be made quickly and often with incomplete data, improving diagnostic reliability supports both safer individual care and better stewardship.
Prior work shows that agreement on UTI is far from perfect. Studies comparing frontline ED assessments with expert review demonstrate only moderate concordance, even when experts themselves show high internal agreement.11 Diagnostic conclusions also change across care settings: Among admissions for suspected infection, the presumed source is frequently reclassified by discharge, with urinary sources commonly reassigned once full work-ups are available.15 At the bedside, agreement among clinicians is mixed, with objective signs such as fever being rated consistently reliable, while subjective findings of suprapubic discomfort or flank tenderness show only fair concordance.16 This highlights the variability inherent in clinical examination. Common diagnostic aids and criteria only partially solve the problem. Urinalysis elements and dipsticks, although widely available, have limited specificity and are confounded by asymptomatic bacteriuria, contamination, and comorbid conditions.17-18 Routine urine testing itself can be associated with inappropriate antibiotic use and longer ED length of stay.19 Consensus definitions designed for surveillance or long-term care settings (including the Loeb minimum criteria) and checklists perform poorly when translated to ED decision-making in older adults, while guideline recommendations (including NICE NG109) caution against routine dipstick-driven diagnosis in several adult groups.11,20-21 Conversely, structured tools that standardize how data are weighed can improve concordance, illustrating that how we define and apply criteria materially influences inter-rater reliability.22 Professional societies including the Infectious Diseases Society of America (IDSA) and the European Association of Urology (EAU) have called for standardized approaches to defining and diagnosing UTIs, particularly in high-volume settings such as the ED.18,23
Population Health Research Capsule
What do we already know about this issue?
Urinary tract infections (UTI) are frequently misdiagnosed in the emergency department (ED).
What was the research question?
We sought to quantify inter-rater variability for UTI diagnosis between the treating clinician and three emergency physician chart reviewed.
What was the major finding of the study?
The agreement among three reviewers reporting the likelihood of UTI was κ 0.82–0.85 (quadratic-weighted).
How does this improve population health?
Accurate diagnosis of UTI can reduce inappropriate antibiotic use.
Despite this recognition that reliability matters, few studies have investigated the inter-rater reliability among emergency clinicians in the diagnosis of UTI and described how their judgment aligns with that of the treating clinician at the point of care. The objective of our study was to quantify inter-rater reliability for UTI diagnosis in an ED cohort by measuring agreement among three independent emergency physicians and comparing these assessments to the treating clinician. We further sought to identify which patient and laboratory factors, including urinalysis elements, may be associated with greater consensus or discordance. By focusing on reliability as a clinical quality signal, we aimed to highlight practical targets for improving diagnostic accuracy and antibiotic stewardship in emergency care.
METHODS
The study was approved by the Mayo Clinic Institutional Review Board. We followed the 2015 Standards for Reporting of Diagnostic Accuracy and emergency medicine retrospective research guidelines.24 Urine samples were collected from Mayo Clinic EDs in Rochester, MN. All patient encounters took place between December 2024–May 2025. A convenience sample of ED patients who had a urinalysis and urine culture performed as part of their ED evaluation had their ED chart retrospectively reviewed with the following clinical information withheld from review: the urine culture and sensitivity results; the emergency clinician’s diagnoses; and all medications and procedures administered during the
Sheele
ED encounter or provided at discharge. The reviewers had access to the past medical history, past surgical history, the reason for the ED encounter provided in triage, the patient’s history, review of systems, physical exam, patient demographics, vital signs, laboratory results, and the radiology reports for computed tomography and ultrasound studies, and they were aware of the study objectives. The clinical data was reviewed by three board-certified attending physicians in emergency medicine who reviewed the following articles on the diagnosis and management of UTIs and asymptomatic bacteriuria (supplement 1). The chart reviewers were not blinded to the study hypothesis.
The three chart reviewers were asked to provide a 0-4 score for each chart using the following instructions:
There is no universal definition of a UTI. Based on your review of the literature and clinical experience do you think the patient most likely has (4 = definite uncomplicated or complicated UTI; 3 = likely uncomplicated or complicated UTI; 2 = may have/unsure uncomplicated or complicated UTI; 1 = asymptomatic bacteriuria (no UTI but will have ≥10,000 CFU/mL bacteriuria on urine culture), 0 = no UTI and urine culture with < 10,000 CFU/mL bacterial growth.
Both the ordinal 0-4 scale was used as well as a binary scale (yes [3-4] and no [0-2]). Patients were considered to have been diagnosed with a UTI (yes vs no) if they received a diagnosis of UTI, pyelonephritis, ureteritis, pyonephrosis, renal abscess, or cystitis. Positive urine cultures were when the urine culture grew ≥ 10,000 colony-forming units (CFU)/ mL of bacteria, and < 10,000 CFU/mL were considered negative. If the urine white blood cells (WBCs) and red blood cells (RBCs) results were reported as a range, we chose to use the mean value of the range. If > 100 cells were reported, they were reclassified as 100 cells. These changes were allowed so that they could be modeled as continuous variables. We considered a “true positive” to be when the treating clinician diagnosed the patient with a UTI and the urine culture was positive. We considered a “false positive” to be when the clinician diagnosed the patient with a UTI, but the urine culture was negative. We considered a “true negative” to be when the clinician did not diagnose the patient with a UTI, and their urine culture was negative (ie, no UTI present). The primary outcome was assessing IRR between the independent reviewers, and our secondary outcome was comparing the results of the independent emergency-physician reviewers with the treating clinician in the ED.
Statistical analysis
Continuous and ordinal variables are summarized as median (IQR). Categorical variables are reported as n (%). Inter-rater reliability for the 0–4 reviewer ratings was assessed
pairwise with quadratic-weighted Cohen κ; 95% confidence intervals were obtained via nonparametric bootstrap (800 resamples). We also estimated Intraclass correlation coefficient (ICC) (2,1) (two-way random, absolute agreement) across all three reviewers, with bootstrap CIs. The Bowker test of symmetry evaluated marginal homogeneity. After dichotomization to UTI/no UTI, we quantified pairwise agreement with Cohen’s κ, its asymptotic standard error (SE), Wald 95% CIs, and McNemar χ². For three and four raters we used Fleiss κ with approximate SE, Wald CIs, and corresponding P values. To explore factors associated with subject-level consensus across the clinician and three reviewers, we computed per-subject agreement (Pi) as the sum of squared category proportions and modeled high agreement (Pi ≥ 0.75) with multivariable logistic regression, including age, sex, race, ED disposition, and urinalysis elements (excluding urine protein and culture result). Results are reported as odds ratios (OR) with 95% CIs. All tests were two-sided with α = 0.05. Missing data were excluded listwise for each analysis without imputation.
RESULTS
The median age was 63 years (interquartile range IQR 42-78). Of those patients included in the study, 355 (75%) were female sex, and 409 (86.5%) were White; 207 were admitted into the hospital. There were 145 (30.7%) encounters where the treating clinician diagnosed a patient with a UTI, of whom 132 had ≥ 10,000 CFU/mL bacteriuria on urine culture. In 121 (25.6%) encounters the clinician did not diagnose a UTI and the patient had ≥10,000 CFU/mL of bacteriuria on urine culture. There were 253 (53.5%) encounters with ≥ 10,000 CFU/mL bacteriuria on urine culture. Results are summarized in Table 1. A positive urine culture was noted among those diagnosed with a UTI in 135/145 (93.1%) among treating clinicians; 92/96 (95.8%) for Reviewer 1; 119/121 (98.3%) for Reviewer 2; and 92/97 (94.8%) for Reviewer 3.
The results of the three blinded reviewers on the likelihood of UTI are listed in Table 2. Most patients were categorized as 0 (no UTI) or 3-4 (likely/definite UTI). Table 3 shows there was high agreement between the blinded reviewers when the ordinal 0-4 categorization was used with the quadratic-weighted Cohen κ (0.82-0.85) and > 94% observed agreement. The ICC (2,1) was 0.83 when all three reviewers were compared.
We compared the independent reviewers’ binary responses for UTI (present = 3-4, not present = 0-2) and the treating ED clinician diagnosis (UTI present or not present) (Table 4). Agreement between the clinicians was moderate with Cohen κ values (0.60-0.81). The treating clinician more frequently diagnosed UTI than the independent reviewers (145 vs 96, 121, and 97; respectively). Fleiss κ with all four reviewers only showed moderate reliability (.69).
There was only moderate agreement among the
Table 1. Summary of patients examined (n = 473) in an emergency department study comparing the diagnosis made by the treating clinician at bedside and later assessment by three chart reviewers.
Variable
Age (years)
Sex Female (vs. male)
Race binary White (vs. non-white)
ED disposition
473
355 (75.1%)
409 (86.5%)
Discharged or AMA (vs. admit or observation) 264 (56.1%)
Urine clarity Clear (vs. cloudy) 385 (83.1%)
Hemoglobin (0-4+) 0.0 (0.0-2.0), 468
Glucose (0-1000 mg/dL) 0.0 (0.0-0.0), 472
Ketone (0-160 mg/dL) 0.0 (0.0-5.0), 472
Urine pH (4.6-9) 5.8 (5.4-6.4), 473
Nitrites
(vs. positive)
(85.0%)
Leukocyte esterase (0-4+) 0 0 (0-3), 469
Urine RBCs (0-100 cells/HPF) 3.0 (0.0-6.0), 471
Urine WBCs (0-100 cells/HPF) 2.0 (0.0-15.0), 470
Urine Bacteria Absent (vs. present)
max CFU/mL Positive (vs. negative)
303 (64.1%)
(53.5%)
AMA, against medical advice; HPF, high powered field; IQR, interquartile range; RBC, red blood cell; WBC, white blood cell.
independent reviewers, Fleiss κ of 0.44, for those diagnosed with a true positive UTI (Table 5). There was high agreement among the reviewers for those diagnosed with a true negative (ie, no UTI) with a Fleiss κ of 1.0. There was low agreement among reviewers for those diagnosed with a false positive UTI (diagnosed with a UTI but a negative urine culture), with a Fleiss κ of 0.21.
Table 6 shows the variables associated with concordance between the treating clinician and the three reviewers for UTI. Higher age, nitrite positive, leukocyte esterase, urine WBCs, and urine bacteria present were significantly associated with reviewer concordance in the model (P < .05) but all were associated with reduced agreement (odds ratioOR < 1). Other variables, including sex, disposition status, clarity, hemoglobin, glucose, ketone, and urine RBCs, were not
significantly associated.
DISCUSSION
Blinded emergency physician reviewers had higher agreement when assessing the likelihood of UTI when using an ordinal 0-4 scale, but agreement dropped when the results were dichotomized to UTI vs no UTI in a convenience sample of ED patients. These findings are consistent with prior studies demonstrating diagnostic uncertainty and discordance in diagnosing UTIs in acute care settings among clinicians.3-4,6,11,18-19 Agreement among reviewers was highest in patients with urine culture-confirmed UTIs and no UTIs and negative urine cultures, and was lowest among those patients who were diagnosed with a UTI but had negative urine cultures. These findings are consistent with prior
Table 2. Results of blinded reviewer assessment of the likelihood of urinary tract infection being present on chart review.
Rater no UTI and urine culture with < 10,000 CFU/mL bacterial growth (0) asymptomatic bacteriuria (no UTI but will have ≥ 10,000 CFU/mL bacteriuria on urine culture (1) may have/unsure uncomplicated or complicated UTI (2) likely uncomplicated or complicated UTI (3) definite uncomplicated or complicated UTI (4)
research showing that dipstick-driven or symptom-driven diagnostics can over-diagnose UTIs, especially among older adults and patients with nonspecific symptoms.3,19-21 The regression analysis found that those variables most associated with a UTI (eg, nitrites, urine WBCs, and leukocyte esterase) were most likely to be associated with agreement among the independent reviewers.25,26
While the treating clinicians at bedside in the ED diagnosed more UTIs (n = 145) than any of the independent reviewers (range: 96-121), the percentages of encounters where a UTI was diagnosed (with positive urine culture noted) was high among both groups: 93.1% for the treating clinicians and 94.8-98.3% for the reviewers. However, there was moderate agreement between independent chart reviewers and
the treating clinician on whether the patient had a UTI [κ = 0.64 (0.56-0.72)]. One potential explanation for this observation is that treating clinicians are at the bedside, treating the patient in real time, while the reviewers were looking at data retrospectively. Bedside clinicians are subject to external pressures, such as having to make decisions quickly and to accommodate patients’ expectations, while these factors are not present for reviewers. Our study is in line with previous research on inter-rater reliability.10,27
There are no universal diagnostic criteria for a UTI. Multiple professional societies and government agencies have developed slightly differing guidelines, although not all apply to the ED. The latest update on UTI from the Infectious Disease Society of America (IDSA) received input from the
Table 4. The inter-rater reliability of the independent reviewers and the treating clinician in the emergency department when the reviewers’ responses were binarized as urinary tract infection (UTI)/no UTI. Cohen κ used unless other reported.
2, 3*
2, 3, ED treating clinician*
*Fleiss κ (multi-rater, binary).
SE, standard error.
Table 3. The inter-rater reliability between reviewers for the likelihood of urinary tract infection for emergency department patients using an ordinal 0-4 scale.
Table 5. The inter-rater reliability of all three reviewers for urinary tract infection (UTI) (likely or definitive UTI) vs. unlikely or no UTI using Fleiss κ (multi-rater, binary) when comparing true positive, true negative (no UTI), and false positive diagnoses by the treating clinician in the emergency department.
True positive (treating clinician diagnosed UTI and urine culture ≥ 10,000 CFU/mL) (n = 132)
True negative (no UTI) (treating clinician did not diagnose UTI and urine culture < 10,000 CFU/mL) (n = 207)
False positive (treating clinician diagnosed UTI and urine culture < 10,000 CFU/mL) (n = 13)
CFU, colony-forming units; SE, standard error, UTI, urinary tract infection.
Society of Academic Emergency Medicine (SAEM).28 Because the SAEM UTI diagnostic guidelines were published in 2013, they are likely outdated; emergency physicians should reference the updated IDSA guidelines when considering a diagnosis of UTI.25
Table 6. Variables associated with high inter-rater agreement between three reviewers and the treating clinician in the emergency department for urinary tract infection using logistic regression.
Variable OR (95% CI) P value
Age (years)
The updated IDSA uncomplicated UTI criteria include local bladder signs and symptoms such as urgency, dysuria, frequency, and abdominal pain without fever from the UTI in men and women without catheters, nephrostomy tubes, and stents.28 There should be no signs or symptoms of systemic illness, costovertebral angle tenderness, or flank pain.28 The diagnosis does not require specific findings on urinalysis or a positive urine culture.28 Complicated UTIs have symptoms suggesting extension beyond the bladder including fever, chills, rigors, hemodynamic instability, flank pain, costovertebral angle tenderness, pyelonephritis, urinary catheters, neurogenic bladder, urinary obstruction or retention.28 These guidelines are similar to the European Urological Association guidelines on urological infections with the exception that a positive urine culture is used to confirm infection, even though the CFU/mL bacteriuria cutoff counts vary by sex, method of urine of collection, and organism growing. Symptom-driven diagnosis of UTI in the ED likely overtreats patients who have an alternative diagnosis causing genitourinary symptoms such as sexually transmitted infections. The accuracy of the latest IDSA UTI guidelines needs to be further studied in the ED.
0.98 (0.97–1.00) .01
Sex (male vs. female) 1.25 (0.66–2.34) .49
Race binary (White vs. non-White) 2.63 (0.92–7.50) .07
ED disposition status (admitted/ observation vs discharge/AMA) 0.78 (0.46–1.32) .36
Urine clarity (clear vs. cloudy) 1.15 (0.58–2.27) .69
Hemoglobin 0.76 (0.31–1.82) .53
Glucose 1.00 (1.00–1.00) .43
Ketone 1.01 (0.99–1.02) .33
Nitrites (positive vs. negative) 0.27 (0.15–0.49) < .001
Leukocyte esterase 0.27 (0.09–0.80) .02
Urine RBCs Unstable estimate* .84
Urine WBCs 0.99 (0.98–0.99) < .001
Urine bacteria (present vs. absent) 0.39 (0.23–0.67) < .001
*Urine RBCs odds ratio unstable due to sparse data and quasicomplete separation.
AMA, against medical advice; RBC, red blood cell; WBC, white blood cell.
LIMITATIONS
Treating clinicians in the ED diagnosed patients with a UTI or not (a binary decision), whereas the emergencyphysician chart reviewers used a 0-4 scale, which may limit appropriate comparisons. Our study involved a single system and was retrospective. We analyzed a convenience sample of ED patients who had a urinalysis and urine culture as part of the ED evaluation; so our results may have limited generalizability. Chart reviewers were not blinded to the study hypothesis, but reviewers were blinded to culture and treatment, and spectrum and incorporation biases are possible. Our patients were typically older and were predominantly White, which also may affect results. All our independent reviewers were board-certified emergency attending physicians, whereas some of the treating clinicians could have been advanced practice clinicians, which could have
Assessment of Inter-rater Variability in the Diagnosis of Urinary Tract Infections in the ED Sheele et al.
influenced the results. Finally, we conducted our research before the latest IDSA guidelines were published; these guidelines do not necessitate the presence of a positive urine culture as was used in our study.
CONCLUSION
Blinded emergency physician chart reviewers showed high agreement on likelihood of urinary tract infection, but agreement with treating clinicians was only moderate and lowest in false-positive strata. Variables highly associated with UTI (nitrites, leukocyte esterase, urine bacteria, and urine WBCs) were all statistically significant in our multivariate model but were associated with lower inter-rater consensus for UTI.
Address for Correspondence: Johnathan M. Sheele, MD, MHS, MPH, Mayo Clinic, Department of Emergency Medicine, 4500 San Pablo Rd, Jacksonville, Florida 32224 Email: Sheele.johnathan@ mayo.edu.
Conflicts of Interest: By the WestJEM article submission agreement, all authors are required to disclose all affiliations, funding sources and financial or management relationships that could be perceived as potential sources of bias. No other author has professional or financial relationships with any companies that are relevant to this study. There are no other conflicts of interest or sources of funding to declare.
1. Foxman B. The epidemiology of urinary tract infection. Nature reviews. Urology. 2010;7(12):653–660.
2. Flores-Mireles AL, Walker JN, Caparon M, et al. Urinary tract infections: epidemiology, mechanisms of infection and treatment options. Nat Rev Microbiol. 2015;13(5):269-284.
3. Foxman B. Epidemiology of urinary tract infections: incidence, morbidity, and economic costs. Dis Mon. 2003;49(2):53-70.
4. Caterino JM, Leininger R, Kline DM, et al. Accuracy of current diagnostic criteria for acute bacterial infection in older adults in the emergency department. J Am Geriatr Soc. 2017;65(8):1802-1809.
5. Nicolle LE. Asymptomatic bacteriuria in older adults. Clin Geriatr Med. 2016;32(3):523-538.
6. Rowe TA, Juthani-Mehta M. Urinary tract infection in older adults. Aging Health. 2013;9(5):519-528.
7. Holm A, Siersma V, Cordoba GC. Diagnosis of urinary tract infection based on symptoms: how are likelihood ratios affected by age? BMJ Open. 2021;11(1):e039871.
8. Shallcross LJ, Rockenschaub P, McNulty D, et al. Diagnostic uncertainty and urinary tract infection in the emergency department:
a cohort study from a UK hospital. BMC Emerg Med. 2020;20(1):40.
9. Tomas ME, Getman D, Donskey CJ, Hecker MT. Overdiagnosis of urinary tract infection and underdiagnosis of sexually transmitted infection in adult women presenting to an emergency department. J Clin Microbiol. 2015;53(8):2686-2692.
10. Kondapi D, Wang J, Rincon F, et al. Interrater agreement of CAUTI diagnosis among infectious disease physicians. Antimicrob Steward Healthc Epidemiol. 2024;4(Suppl 1):S70-S71.
11. Caterino JM, Kline DM, Leininger R, et al. Inconsistent application of UTI diagnostic criteria in emergency care: subgroup analysis of older adults. Acad Emerg Med. 2018;25(9):1045-1054.
12. Drekonja DM, Trautner BW, Amundson C, et al. Effect of feedback on antimicrobial overuse in urinary tract infections: a randomized controlled trial. JAMA Intern Med. 2020;180(6):894-902.
13. Tamma PD, Avdic E, Li DX, et al. Association of adverse events with antibiotic use in hospitalized patients. JAMA Intern Med. 2017;177(9):1308-1315.
14. Singer M, Deutschman CS, Seymour CW, et al. The third international consensus definitions for sepsis and septic shock (Sepsis-3). JAMA. 2016;315(8):801-810.
15. . Dregmans E, Kaal AG, Meziyerh S, et al. Analysis of variation between diagnosis at admission vs discharge and clinical outcomes among adults with possible bacteremia. JAMA Netw Open. 2022;5(6):e2218172.
16. Blodgett TJ, Gardner SE, Blodgett NP, et al. A tool to assess the signs and symptoms of catheter-associated urinary tract infection: development and reliability. Clin Nurs Res. 2014;24(4):341-356. doi:10.1177/1054773814550506.
17. Advani SD, North R, Turner NA, et al. Performance of urinalysis parameters in predicting urinary tract infection: does one size fit all? Clin Infect Dis. 2024;78(6):e1-e8.
18. Nicolle LE, Gupta K, Bradley SF, et al. Clinical practice guideline for the management of asymptomatic bacteriuria: 2019 update by the Infectious Diseases Society of America. Clin Infect Dis. 2019;68(10):1611-1615.
19. Childers R, Liotta B, Brennan J, et al. Urine testing is associated with inappropriate antibiotic use and increased length of stay in emergency department patients. Heliyon. 2022;8(10):e11049.
20. National Institute for Health and Care Excellence (NICE). Urinary tract infection (lower): antimicrobial prescribing. NICE Guideline NG109. Published October 31, 2018. Accessed June 16, 2025. Available at: https://www.nice.org.uk/guidance/ng109
21. Loeb M, Bentley DW, Bradley S, et al. Development of minimum criteria for the initiation of antibiotics in residents of long-term care facilities: results of a consensus conference. Infect Control Hosp Epidemiol. 2001;22(2):120-124.
22. Bredenkamp N, Afra K, Chow I, et al. Developing a tool for prospective assessment of treatment appropriateness in urinary tract infections. Hosp Pharm. 2021;56(6):664-667.
23. Kranz J, Bartoletti R, Bruyere F, et al. European Association of Urology guidelines on urological infections: summary of the 2024
Sheele et al. Assessment of Inter-rater Variability in the Diagnosis of Urinary Tract Infections in the ED guidelines. Eur Urol. 2024;86(1):27-41.
24. Worster A, Bledsoe RD, Cleve P, et al. Reassessing the methods of medical record review studies in emergency medicine research. Ann Emerg Med. 2005;45(4):448-451.
25. Duanngai CF, Ngamjarus C, Surapen G, et al. Interrater reliability of urine dipstick test between self-assessment and laboratory staff J Med Assoc Thai. 2017;100:225-232.
26. Cheng B, Zaman M, Cox W. Correlation of pyuria and bacteriuria in acute care. Am J Med. 2022;135(9):e353-e358.
27. Gau JT, Shibeshi MR, Lu IJ, et al. Interexpert agreement on diagnosis of bacteriuria and urinary tract infection in hospitalized older adults. J Am Osteopath Assoc. 2009;109(4):220-226.
28. Trautner BW, Cortés-Penfield NW, Gupta K, et al. Clinical practice guideline by the Infectious Diseases Society of America (IDSA): 2025 guideline on management and treatment of complicated urinary tract infections. Published July 17, 2025. Accessed December 18, 2025. Available at: https://www.idsociety.org/practice-guideline/complicatedurinary-tract-infections/.
Clinical Insights and Case Analysis of Disorders Attributed to Cicadas in the Emergency Department
Mary Heslin, MD*
Jonah Frueh, MD†
Madison Watts, MD*
Ahmad Abdulla, MD†
Alexandras Biskis, MS‡
Sean M. Fox, MD*
Elise Lovell, MD§||#
Ryan McKillip, MD§||#
Advocate Health, Carolinas Medical Center, Department of Emergency Medicine, Charlotte, North Carolina
Advocate Health, Advocate Christ Medical Center, Department of Emergency Medicine, Oak Lawn, Illinois
Aurora Sinai Medical Center, Advocate Aurora Research Institute, Office of Research Analytics and Systems Computing, Milwaukee, Wisconsin
Advocate Health, Advocate Christ Medical Center, Oak Lawn, Illinois
University of Illinois at Chicago, Chicago, Illinois
Wake Forest University School of Medicine, Department of Emergency Medicine, Oak Lawn, Illinois
Section Editor: Patrick Meloy, MD
Submission history: Submitted September 27, 2025; Revision received January 17, 2026; Accepted January 18, 2026
Electronically published May 15, 2026
Full text available through open access at http://escholarship.org/uc/uciem_westjem DOI 10.5811/westjem.52962
Introduction: In 2024 the United States experienced a rare co-emergence of two periodical cicada broods (XIII and XIX), along with annual cicadas. Although not inherently dangerous, cicadas have been linked to allergic reactions and unintentional injuries. The public health impact of this extraordinary event is poorly understood. In this study we aimed to characterize emergency department (ED) and urgent care (UC) visits associated with the 2024 cicada emergence.
Methods: We conducted a retrospective chart review across ED and UC sites in a large healthcare system in the Midwest and Southeast that coincides with the ranges of the periodical cicada broods, from April 1–July 31, 2024. Electronic health records were searched for “cicada” and common variants. Two emergency physicians in each region reviewed identified records. Data extracted included demographics, diagnoses, visit characteristics, diagnostics, treatments, and outcomes.
Results: Of 1,304,743 total visits, 68 mentioned “cicada” or a variant; 42 were confirmed as cicada related. Patient ages ranged from 7 weeks to 87 years of age (median 38 years). Trauma was the most common cicada-related presentation (33), followed by falls (21), blunt trauma (6), vehicular/bicycle accidents (3), and other mechanisms. Additional cases involved allergic reactions (3), environmental exposure (2), and neurologic symptoms (2). Imaging was common: 57% had radiographs and 43% computed tomography. Seven patients sustained fractures; one required laceration repair, and six were admitted.
Conclusion: While the overall health system impact was limited, cicada-related visits revealed important patterns of injury. Findings support the need for public education and preparedness during future mass insect events. [West J Emerg Med. 2026;27(3)684–687.]
INTRODUCTION
Cicadas are winged insects that spend most of their life cycle underground before emerging synchronously in massive numbers to overwhelm predators. These coordinated
emergences occur only at specific intervals and within distinct, geographically defined broods found across tropical, subtropical, and temperate regions, including the midwestern and eastern United States.1 In 2024 the U.S. experienced the
simultaneous emergence of two significant periodical cicada broods, Broods XIX and XIII, an event occurring only every 221 years. Brood XIII emerges every 17 years, and has a range covering northern Illinois, southern Wisconsin, northwestern Indiana, southwestern Michigan, and eastern Iowa. Brood XIX emerges every 13 years, is concentrated in southern Illinois and Missouri, and it is also found across the southeastern states. These are in addition to annually emerging broods. This simultaneous emergence in 2024 resulted in an unprecedented cicada burden of trillions of insects,2 leading to a potentially significant public health impact. Our aim in this paper was to identify resource utilization of healthcare services in the emergency department (ED) and urgent care (UC) setting to better understand the impact of this simultaneous cicada emergence.
Research has highlighted various public health and safety concerns posed by cicadas. Insects in general are a common reason for an ED visit. A study analyzing animal-related injuries treated in an ED over two years found that insectrelated visits were most common and resulted in a 4.2% hospital admission rate. These were due to allergic reactions or infections because of an insect.3
More specific to cicadas, 12 cicada-related cases were reported among children who presented to Cincinnati Children’s Hospital during the 1987 periodical emergence.4, 5 Injuries included concussions, blunt trauma, a crushed hand, a stab injury, and multiple bicycle accidents. These were all caused by children trying to either kill or avoid cicadas. The extent of traumatic injuries among adults because of cicadas is not well known. An incident in Ohio where a driver crashed his car after a cicada flew through his window reveals the potential for these insects to cause significant accidents and injuries among adults as well.6
Ingestion of cicadas poses another health risk, as they have been known to trigger serious allergic reactions when consumed. A notable case report documented a man with a shellfish allergy developing urticaria and throat itching after consuming cicadas, requiring epinephrine and intravenous (IV) steroids. This incident suggests potential cross-reactivity between cicada proteins and shellfish allergens, broadening the scope of cicada-related health risks to include serious allergic reactions.7
There is also evidence of cicadas carrying fungi that can be toxic to humans. A study in Thailand identified 39 people who ingested cicadas infected with cordyceps fungus from 2010–2022.8 Patients developed gastrointestinal and neurological symptoms, including tremors and seizures, and most required hospitalization. Similar findings were published in 2017 from a study of 60 patients in Southern Vietnam who consumed cordyceps-infected cicadas from 2008–2015.9 This fungus is also prevalent throughout the United States.10
These studies provide an overview of the predominantly avoidable health risks associated with cicadas, from physical
Population Health Research Capsule
What do we already know about this issue?
Insect-related concerns are a common reason for emergency department (ED) visits, and cicadas have been associated with trauma, allergic reactions, and poisoning.
What was the research question?
We characterized ED and urgent care visits associated with the 2024 cicada emergence.
What was the major finding of the study?
There was a very modest healthcare system impact. However, individual traumatic morbidity was often substantial.
How does this improve population health?
Public health education efforts should focus on the message that cicadas are harmless when left alone.
injury to allergic reactions and severe poisoning after cicada consumption. Building on the existing literature, we aimed to characterize ED and UC visits associated with the 2024 cicada emergence to aid in the development of future public health responses to mass insect events.
METHODS
We conducted a retrospective chart review of ED and UC visits from April 1–July 31, 2024, the four months of highest cicada emergence concentration, within a large healthcare system with coverage in six affected states: Illinois; Wisconsin; North Carolina; South Carolina; Alabama; and Georgia. The system includes both urban and rural hospitals and UC centers across these regions, allowing a diverse sample of patient encounters.
A comprehensive keyword search was performed in the electronic health record (EHR) for any appearance of the term “cicada” and its common variants, including cicada, cicata, ciccada, sicada, cicaida, cecada, secada, sikada, and sick aid. This query spanned all ED and UC visits during the study period to capture potential charting or dictation errors. Charts were included only if the visit was determined to be directly related to cicada exposure or behavior. Each pertinent patient chart was manually reviewed by two emergency physicians. We compiled extracted information into a de-identified spreadsheet. Discrepancies were resolved by investigator
and Case Analysis of Disorders Attributed to Cicadas in the Emergency Department
consensus through verbal discussion until a final, agreed upon determination was reached, in accordance with best practices for emergency medicine chart review studies.11
Extracted variables included demographics (age, sex), arrival mode (eg, emergency medical services [EMS], walk-in, personal transport), visit type (UC or ED), diagnostic testing (eg, labs, imaging, therapeutics (eg, oral, IV, topical medications), length of stay, and disposition (eg, discharged, admitted). Each visit was assigned to a clinical category determined a priori based on previous literature: trauma; allergic reaction; environmental exposure; or neurologic symptoms. Traumatic presentations were further subclassified by mechanism (eg, fall, blunt trauma, vehicular accident). New categories were created as needed through study team consensus.
We used descriptive statistics for all analyses. Following published methodologic criteria for chart review studies,12 we defined case selection criteria and variables, used data abstraction forms, focused on interobserver reliability during investigator meetings, and described the medical record sampling as per above. This study was determined to be exempt from institutional review board (IRB) review by the Wake Forest University School of Medicine IRB under 45 CFR 164.512. The primary outcome of this study was the identification of ED and UC visits related to the 2024 periodical cicada brood emergence. Secondary outcomes included clinical presentation categories, resource utilization, and patient disposition.
RESULTS
Among 1,304,743 total visits to 118 different EDs and UCs across the system during the study period, 68 mentioned “cicada” or a spelling variant. Of these, 42 were confirmed as cicada related. The age range of affected patients was 7 weeks to 87 years of age (median 38 years). Approximately twothirds of patients (69%) self-presented, with 31% arriving by EMS. Trauma was the most common visit category (33), including falls (21), blunt trauma (6), vehicular/bicycle incidents (3), muscle strains (2), and one penetrating injury. Additional presentations included allergic reactions (3), environmental exposure (2), neurologic symptoms (2), eye problem (1), and mental health (1) (see Table). Imaging was frequently obtained; 24 patients (57.1%) underwent radiographs and 18 (42.9%) had CT. Seven patients (16.7%) sustained fractures; one required laceration repair. Six patients (14.3%) were admitted. Of the 26 non-related cases, most were excluded due to incidental mention of cicada (“sounds like cicadas in my ears” after cotton swab injury), or nonclinical references (eg, address Cicada Drive).
DISCUSSION
This study provides the first systematic review of cicadarelated health visits during a dual-brood emergence. While the
Table. Patient presentations to a large health system in a retrospective study of diagnoses and outcomes related to emergence of cicada insect broods in 2024.
Patient presentation by clinical category n (%)
proportion of cicada-related visits was small, individual morbidity was often substantial. Most cases involved trauma, which was largely preventable. Two cases involved passengers leaping from moving vehicles after cicadas flew in through open windows. While other trauma cases were less dramatic, a common theme was patients being injured while attempting to swat, kill, or run away from cicadas. Examples of injuries suffered include a hand laceration suffered while attempting to kill a cicada with a weed whacker; reopening a surgical wound after being swarmed by cicadas at physical therapy; arm injury after falling off a scooter; chest injury from running into a safety pole; and a head injury from running into a wall. While reacting when startled is universal, these injuries suggest an opportunity for public safety messaging about the harmless nature of cicadas.
Although allergic cases were relatively rare, they align with prior literature and support the need to educate about the potential risk of cicada-associated allergic reactions. In addition, a patient with bipolar disorder experienced decompensation, later linked to cicada noise disrupting sleep—underscoring how environmental stimuli can exacerbate mental illness. In other patients, the constant hum of cicadas was described as contributing to headache and lightheadedness. Poisoning from ingesting fungus-infected cicadas can be serious; however, this mechanism of exposure was not seen.8
LIMITATIONS
As a retrospective review, this study depended on accurate documentation and keyword capture. However, the unusual nature of the keyword “cicada” strengthens specificity in our case identification. The oak leaf itch mite, Pyemotes herfsi, feeds on cicada eggs and causes severe itching and rash in people exposed to their bites.13 Cases involving mite bites may have been missed due to its nonspecific presentation. Selection bias was a potential factor as additional patients with minor complaints may have presented to primary care clinics. However, our goal in this study was to evaluate resource utilization in the ED and UC settings; thus, we
Heslin et al. Clinical Insights and Case Analysis of Disorders Attributed to Cicadas in the Emergency Department
intentionally excluded primary care visit data. Some injuries and illness patterns may be regionally specific, but the involved healthcare system is large and includes six states in both the Midwest and Southeast regions of the country.
CONCLUSION
The 2024 emergence of cicada Broods XIII and XIX led to modest but meaningful cicada-related health visits. Most were associated with trauma and preventable. This study highlights the need for targeted public health messaging to mitigate injury during future cicada events, especially through awareness campaigns that cicadas are harmless when left alone.
Address for Correspondence: Elise Lovell, MD, Advocate Christ Medical Center, Department of Emergency Medicine, 4440 West 95th Street, Suite 1320 M, Oak Lawn, IL 60453. Email: elise. lovell@aah.org
Conflicts of Interest: By the WestJEM article submission agreement, all authors are required to disclose all affiliations, funding sources and financial or management relationships that could be perceived as potential sources of bias. No author has professional or financial relationships with any companies that are relevant to this study. There are no conflicts of interest or sources of funding to declare.
2. U.S. Department of Agriculture Forest Service. Here Come the
Cicadas! 2024. Available at: https://www.fs.usda.gov/about-agency/ features/here-come-cicadas. Accessed August 14, 2025.
3. Massari M, Masini L. Relationships among injuries treated in an emergency department that are caused by different kinds of animals: epidemiological features. Eur J Emerg Med. 2006;13(3):160-4.
5. NBC News. Pediatrician warns parents about cicadas. 2004. Available at: https://www.nbcnews.com/id/wbna4980203. Accessed August 14, 2025.
6. People Magazine. Cicada causes car crash in Ohio 2021. Available at: https://people.com/pets/cicada-causes-car-crash-ohio/ Accessed August 14, 2025.
7. Piatt JD. Case report: urticaria following intentional ingestion of cicadas. Am Fam Physician. 2005;71(11):2048-50.
8. Trakulsrichai S, Satsue N, Tansuwannarat P, et al. Poisoning from ingestion of fungus-infected cicada nymphs: characteristics and clinical outcomes of patients in Thailand. Toxins (Basel). 2024;16(1):22.
9. Doan UV, Mendez Rojas B, Kirby R. Unintentional ingestion of cordyceps fungus-infected cicada nymphs causing ibotenic acid poisoning in southern Vietnam. Clin Toxicol (Phila). 2017;55(8):893-6.
10. Olatunji OJ, Tang J, Tola A, et al. The genus Cordyceps: an extensive review of its traditional uses, phytochemistry and pharmacology. Fitoterapia. 2018;129:293-316.
11. Kaji AH, Schriger D, Green S. Looking through the retrospectoscope: reducing bias in emergency medicine chart review studies. Ann Emerg Med. 2014;64(3):292-8.
12. Worster A, Bledsoe RD, Cleve P, et al. Reassessing the methods of medical record review studies in emergency medicine research. Ann Emerg Med. 2005;45(4):448-51.
13. CBS News. Cicadas come with an itchy pest — nearly invisible mites that can cause rashes and travel with the wind. Available at: https://www.cbsnews.com/news/cicadas-mites-itchy-pest-cancauserashes-travel-with-wind/. Accessed August 10, 2025.
Effect of Awareness of Excessive Use of Force on the Psychological Well-being and Workplace Environment of Emergency Physicians: A Pilot Study
Anisha Turner, MD, MBA*
Thomas Medrano, BS*
Kevin-Dat Nguyen, BS*
Xiaofan Huang, MS†
Richina Bicette, MD*
Vidya Eswaran, MD*
Adedoyin Adesina, MD*
Baylor College of Medicine, Department of Emergency Medicine, Houston, Texas
Baylor College of Medicine, Institute for Clinical and Translational Research, Houston, Texas
Section Editor: Anthony Rosania, MD, MHA, MSHI
Submission history: Submitted July 06, 2025; Revision received December 20, 2025; Accepted December 20, 2025
Electronically published May 18, 2026
Full text available through open access at http://escholarship.org/uc/uciem_westjem DOI 10.5811/westjem.48904
Introduction: Excessive use of force by law enforcement officers is a critical public health issue linked to serious health consequences such as hypertension, post-traumatic stress disorder (PTSD), and depression. While emergency physicians (EP) are often the first to treat patients with excessive use of force-related injuries, the work-life and psychological toll of witnessing these incidents remains underexplored. In this study, we examine how awareness of and exposure to excessive use of force affects the psychological well-being and professional environment of EPs.
Methods: An observational cross-sectional survey was developed by EPs and psychiatrists to assess work-life and psychological impacts of awareness of excessive use of force on EPs. The survey included multiple-choice and Likert-scale questions and used the Impact of Event Scale–Revised (IES-R). It was distributed anonymously to EPs at three Texas academic institutions. We used the Fisher exact test and the Wilcoxon rank-sum test to compare groups. Our primary outcome measure was psychological distress, assessed with the IES-R. Secondary outcome measures included selfreported effects of awareness of excessive use of force on subjects’ work environments, patient care, and interactions with law enforcement.
Results: Of 282 surveys sent to EPs, 43 responded (15%). Eighteen of 40 (45%) reported experiencing work-life impacts and 15 of 40 (37.5%) experienced psychological distress; three did not comment. Abnormal IES-R scores were found in seven (19.6%) of 35 participants; eight did not respond. Participants who noted work-life effects of excessive use of force were more likely than those whose work-life was not affected to report modified patient care approaches (61% vs 0%, P < .001), altered interactions with law enforcement (83% vs 0%, P < .001), and altered interactions with patients (50% vs 0%, P < .001). Psychological distress was more prevalent among participants with personal exposure to excessive use of force compared to those without personal exposure (47% vs 12%, P = .02), and among those with second-hand exposure compared to those without second-hand exposure to excessive use of force (80% vs 56%, P = .04).
Conclusion: This pilot study demonstrates that exposure to excessive use of force is associated with psychological distress and professional impact among emergency physicians, influencing interactions with patients and law enforcement. These findings underscore the need for further characterization of the effects of awareness of and exposure to excessive use of force on EPs. This, in turn, may inform institutional interventions and national protocols aimed at mitigating psychological burden, supporting physician resilience, and promoting high-quality, equitable patient care. [West J Emerg Med. 2026;27(3)688–697.]
INTRODUCTION
Excessive use of force by law enforcement officers, also referred to as police brutality, is defined as “excessive and unjustified use of force by a member of law enforcement.”1 While this term acknowledges the legitimate role of force in policing, it also recognizes the inappropriate application of force applied regardless of intentionality.2 Excessive use of force includes emotional and physical abuse, verbal assault, psychological intimidation, physical and sexual violence, and neglect.3 Prior studies have demonstrated that exposure to direct excessive use of force is associated with the development of stress-related chronic conditions such as diabetes, hypertension, and obesity, as well as mental health conditions like anxiety, depression, and post-traumatic stress.4
While the impact of excessive use of force on individual victims who directly interact with law enforcement officers is commonly appreciated, it extends beyond those immediate encounters. Secondary exposure defined as exposure among individuals who do not directly experience force but are affected through witnessing, learning about, or anticipating such events has also been associated with adverse physical and psychological outcomes.5 Studies demonstrate that observing or hearing about excessive use of force involving members of one’s community negatively affect collective health and well-being and is associated with elevated symptoms of psychological distress, even in the absence of direct interaction with law enforcement.3 Emerging evidence further suggests that vicarious exposure through social or familial networks or media coverage of excessive use of force incidents is also associated with stress-related health effects.6
Importantly, secondary exposure encompasses a spectrum of proximity, ranging from direct observation of excessive use of force in the same physical space to indirect exposure via shared narratives or media. Although physical proximity may intensify emotional and psychological responses, evidence suggests that even remote or mediated exposure can result in heightened vigilance and anticipatory stress related to potential future encounters with law enforcement officers.7 This heightened vigilance reflects a psychological preparedness for adverse interactions with law enforcement and underscores that secondary exposure to excessive use of force —regardless of physical proximity—can have meaningful health implications.
A group that may be disproportionally impacted by direct or secondhand exposure to excessive use of force is emergency physicians (EP). While no studies have confirmed a direct increase in exposure among EPs, they frequently work alongside law enforcement officers in the emergency department (ED) and routinely care for potential victims of excessive use of force-related encounters. Compared to most other medical specialties, EPs interact with law enforcement more often and occasionally witness excessive use of force during patient restraint.8 One study reported that 98% of
Population Health Research Capsule
What do we already know about this issue? Excessive use of force affects victims and communities, but its impact on the mental health and work life of emergency physicians (EP) is not well described.
What was the research question? Is exposure to excessive use of force associated with psychological distress and work-life impact among EPs?
What was the major finding of the study? Physicians reporting the impact of exposure to excessive use of force more often altered patient care (61% vs 0%, P < .001).
How does this improve population health? Identifying emergency physicians as an affected workforce can lead to traumainformed interventions to protect their wellbeing and the quality of patient care.
surveyed EPs had treated patients with suspected excessive use of force.9 Another study reported that the presence of law enforcement officers in the ED negatively impacted patient care 10% of the time and affected clinicians 2% of the time.10 For physicians who share the same ethnicity as victims of excessive use of force, encounters have an indirect psychological toll. Some question how they might be treated outside their professional role, asking themselves, “how [would I be treated if I] didn’t have badges and scrubs.”11 Some EPs of color “even taped [their] hospital badges to [their] dashboards so [they] wouldn’t have to reach for them to prove who [they were]. [They had] seen what has happened when people of color reach for identification after being pulled over.”11
In this study, our objective was to examine the impact of excessive use of force on the psychological well-being and professional environment of EPs. We also explored whether these effects vary across different racial, ethnic, and sex groups, highlighting disparities in psychological distress and workplace dynamics.
METHODS
Study Design and Participants
We conducted an observational cross-sectional survey study to evaluate the psychosocial and professional impact of exposure to excessive use of force on EPs. The study protocol
was reviewed by the Institutional Review Board at Baylor College of Medicine (H-48738), which approved an electronic consent process. The consent document was embedded at the beginning of the anonymous survey, and completion of the survey indicated participant consent. Eligible participants were practicing EPs in Texas who were fluent in English and self-reported awareness of excessive use of force. Nonphysicians, non-emergency medicine specialists, and respondents who did not complete key outcome measures were excluded from analysis.
Points of contact at Texas academic centers that have EDs were asked to distribute an anonymous survey to department physicians, with a $20 electronic gift card offered as an incentive for participation. We received notification that the survey had been sent to the distribution list of three Texas academic institutions, composed of 282 physicians, between May–July 2023. Of the 43 emergency physicians who responded to the electronic survey, three were excluded due to incomplete data, and one was omitted.
Survey Development
We developed the survey using a consensus-based, interdisciplinary approach. Emergency physicians contributed to the clinical context regarding intersections with law enforcement officers, ED workflows, and professional impacts of excessive use of force exposure. A psychiatrist provided expertise in trauma-related symptomatology and selection of validated psychological assessment tools. Together, the team identified domains related to psychological distress, work-life impact, patient care, and professional interactions for inclusion in the survey.
Survey items were informed by a review of the existing literature on excessive use of force, vicarious trauma, and physician well-being. The final instrument included demographic questions, items assessing the work-related impact of excessive use of force using Likert scales, and the Impact of Event Scale-Revised (IES-R). The IES-R is a 22-question self-report scale designed to screen adults for psychological distress following a traumatic event. The overall structure and content domains of the survey instrument are illustrated in Figure 1.
Impact of Event Scale
The IES-R is a 22-item, self-report scale designed to screen adults for psychological distress following a traumatic event. The scale has three subscales—intrusion (8 items), avoidance (8 items), and hyperarousal (6 items)—which together form the total score, as depicted in Figure 2. Participants rated how distressing each item had been over the prior seven days on a 5-point scale ranging from 0 (“not at all”) to 4 (“extremely”). The sub-scale scores were averaged, omitting any unanswered items, and the total scale was calculated by summing up the three sub-scale scores.
Eligibility and Professional Role
Attending, Fellow, Resident
Awareness of excessive use of force
Awareness and Exposure
Media, family, coworkers
Personal and secondhand exposure
Salient Excessive Use of Force Events
Recall of incidents
Most impactful event
Type of impact
Psychological Distress
Impact of Event Scale–Revised; 22 items
Work-Life Impact
Patient care
Interactions with law enforcement officers
Practice setting
Demographics
Sex
Race/ethnicity
Clinical setting
Figure 1. Structure and content domains of a survey on the impact of exposure to excessive use of force that was administered to emergency physicians
Outcome Measures
Our primary outcome measure was psychological distress related to exposure to excessive use of force. Psychological distress was measured using the IES-R. Secondary outcomes included self-reported effects of excessive use of force on participants’ work environments, patient care, interactions with law enforcement officers, and preferred clinical practice settings.
Work-Life Impact Measures
Participants reported the perceived impact of excessive use of force on their professional experiences using a 5-point Likert scale ranging from “strongly disagree that there is an impact” to “strongly agree.” Those who agreed or strongly agreed that exposure to excessive use of force impacted their work environments were prompted to specify the nature of the impact. Response options included increased medical errors, more near misses, altered interactions with patients, coworkers and law enforcement officers, changes to patient care approaches, and shifts in their preferred practice setting. Participants were also able to provide further details by selecting “other.”
Intrusion (8 items)
• Recurrent thoughts
• Nightmares
• Distress Avoidance (8 items)
• Avoid reminders
• Emotional numbing
Hyperarousal (6 items)
• Hypervigilance
• Irritability
Figure 2. Domains of the Impact of Event Scale–Revised (IES-R), a 22-item self-report instrument used to assess trauma-related psychological distress. The scale comprises three subscales: intrusion, avoidance, and hyperarousal. Subscale scores are summed to generate a total IES-R score.
Procedures
The survey was administered using Research Electronic Data Capture (REDCap), a secure, web-based application designed to support data capture for research studies, hosted at Baylor College of Medicine.12,13 Prior to survey distribution, we pilottested the electronic questionnaire to ensure clarity, usability, and technical functionality. Survey responses were anonymous, and we collected demographic data (sex, race, professional role) without identifiers. To facilitate incentive distribution, participants who chose to receive the $20 electronic gift card provided an email address, which was stored separately from survey responses and not linked to study data.
Data Analysis
We summarized participant responses using frequency with percentage or median with 25th and 75th percentiles and compared the responses between participants whose work life and mental health were/were not affected by exposure to excessive use of force. We analyzed categorical variables using the Fisher exact test, while continuous variables were assessed with the Wilcoxon rank-sum test. A significance level of 0.05 was used, and we performed all analyses using R statistical software v4.3.2 (R Foundation for Statistical Computing, Vienna, Austria).
RESULTS
A total of 43 EPs responded to the survey. Three were omitted due to participants reporting they were not aware of the existence of excessive use of force. Of the respondents included in the study, 23 (53%) were attendings, 17 (40%) were residents, and three (7%) were fellows. Most respondents reported they had been made aware of excessive use of force through social media (79%, n = 34) or local news (77%, n = 33), while a quarter of respondents (23%, n = 10) reported that they had personal experience with excessive use of force. Fifteen participants (37.5%) reported being mentally impacted overall by incidents of excessive use of force, and 18 (45%) reported that incidents of excessive use of force had impacted their work life. The prevalence of psychological distress using IES-R was as follows: normal in 28 respondents (80%); mild in two respondents (5.7%); moderate in one respondent (2.9%); and severe in 11 respondents (11%) (Table 1).
Psychological Impact
Participants who reported a mental impact from exposure to
Table 1. Characteristics of emergency physicians who responded to a survey regarding how exposure to excessive use of force affected them mentally and professionally, with a subset showing signs of psychological distress.
White 13/37 (35%) Black 10/37 (27%)
Hispanic/Latinx 3/37 (8.1%) Asian 11/37 (30%)
By what means were you made aware of excessive use of force
Local radio stations 40 19/40 (48%) Social media
Within the past 24 months, my mental health has been impacted by knowing about incidences of police excessive use of force
Within the past 24 months, knowing about incidents of police brutality and violence has impacted you while at work.
34/40 (85%)
(38%)
(63%)
Agree 18/40 (45%) Disagree/Neutral 22/40 (55%)
(80%)
IES sub-categories
N reported the total number of non-missing observations
1Median (Q1, Q3); n/N (%)
1 (0.00, 3.00)
4 (1.50, 9.50)
2 (0.00, 7.50)
excessive use of force were more likely to have a personal experience with excessive use of force by law enforcement— either through direct encounters or incidents involving non-family members outside of work—compared to those who were not mentally impacted (47% vs 12%, P = .02; 40% vs 8%, P = .03) (Table 2). They rated their mental impact higher than their physical and emotional impact. Those psychologically distressed were more likely to avoid “[thinking]k about [instances of excessive use of force]” while at work compared to those who were not distressed (P = .04). Additionally, those who were mentally impacted reported that awareness of excessive use of force influenced their desired clinical practice setting, compared to those who were not mentally impacted (20% vs 0%, P = .05). Although nine participants (64%) in this group had normal IES-R scores, three (21.1%) had moderate to severe scores. This group also scored significantly higher in the avoidance sub-scale than those who were not mentally impacted (median 7 vs 3, P = .04).
Participants who reported psychological distress were more affected by the deaths of Breonna Taylor (33%, n = 5) and George Floyd (53%, n = 8) compared to those who were not psychologically impacted. (P = .04). Significant racial and ethnic differences emerged between mentally impacted and nonimpacted participants; those affected were 8% Asian, 46% Black, and 46% White, whereas those not affected were 42% Asian, 17% Black, 13% Latinx, and 29% White.
Work Environment Impact
Physicians whose work environment was affected by awareness of excessive use of force exhibited significant avoidance behaviors. They reported “[trying] not to think about it” (P = .04) or “[feeling] as if it hadn’t happened or wasn’t real” (P = .04) (Table 3). They also scored significantly higher on the intrusion sub-scale (median 6 vs 1, P = .05) Several notable changes in workplace interactions emerged among those impacted: they interacted differently with patients (50% vs 0%, P < .001) and with law enforcement officers (83% vs 0%, P < .001). Additionally, awareness of excessive use of force influenced the way they care for patients (61% vs 0%, P < .001).
While most of those with a work impact recognized race, ethnicity, and sex as risk factors for excessive use of force victimization, a higher proportion of physicians impacted by awareness of excessive use of force while at work identified religion as a risk factor compared to those without a work impact (28% vs 0%, P = .01). While most of the IES-R scores for this group were normal (65%, n = 11), 24% of this group had severe IES-R scores (n = 4).
Differences in Race, Ethnicity and Sex
White respondents were significantly more likely than non-White respondents to alter their interactions with law enforcement officers following exposure to excessive use of force (P = .04). Black and Asian respondents were more likely to become aware of excessive use of force through family
members (P < .01 and.04, respectively), highlighting differences in how information about these incidents is shared across racial groups. Additionally, Black respondents reported higher rates of physical symptoms associated with awareness of excessive use of force (P = .01). They also had significantly higher IES-R scores compared to non-Black respondents (P < .01). Female respondents were more likely to report emotional distress and symptoms related to exposure to excessive use of force (P = .02), suggesting a sex-based difference in psychological response. These findings emphasize the importance of considering racial and sex disparities when assessing the mental health and professional effects of awareness of excessive use of force on EPs.
DISCUSSION
This study expands the current understanding of excessive use of force by law enforcement officers, demonstrating that its impact extends beyond patients and communities to affect EPs who routinely care for individuals involved in such encounters. While prior research has documented associations between negative encounters with law enforcement and adverse health outcomes among directly affected individuals,3,4 empirical studies examining how either direct or remote exposure to excessive use of force affects EPs themselves remain limited. Our findings reveal that the impact of excessive use of force extends beyond those who have directly experienced it. Both direct and secondary exposure were associated with measurable psychological distress and meaningful changes in professional behavior among EPs, reinforcing the concept of excessive use of force as a broader occupational and public health concern. Notably, prior work by Hutson et al, while involving a larger national sample and a higher response rate, focused on EPs experiences with law enforcement presence in the emergency department and did not assess the psychological effects or professional consequences of exposure to excessive use of force. Our study extends this literature by directly examining trauma-related distress and professional impact associated with exposure among EPs.
Excessive Use of Force as an Occupational Stressor for Emergency Physicians
While prior literature has focused primarily on the health consequences of excessive use of force for directly affected individuals and communities, our results highlight EPs as an under-recognized group experiencing secondary trauma related to exposure to excessive use of force. Over one-third of respondents reported psychological impacts, and nearly onequarter screened positive for abnormal IES-R scores, suggesting clinically relevant distress. Such distress manifested in multiple ways. Those who reported psychological impacts were significantly more likely to engage in avoidance behaviors such as “trying not to think about it” or “talk about it.” Conversely, EPs who reported a work-related impact were more likely to
Table 2. Comparison of the psychological/mental impact on emergency physicians of exposure to excessive use of force, with those who were affected likely to have had personal experiences with law enforcement, exhibit avoidance behaviors, and to report influence on their preferred clinical practice setting.
Made aware of excessive use of force by law enforcement through one of the following:
How did awareness of excessive use of force impact you?
In what ways have you personally experienced excessive use of force by law enforcement?
IES sub-categories
How has knowing about incidents of police excessive use of force impacted you while at work
1n/N (%).
the way I care for patients
2Fisher exact test; Wilcoxon rank-sum test.
IES, Impact of Event Scale.
Table 3. Emergency physician who reported work-related effects of awareness of excessive use of force demonstrated greater psychological intrusion and avoidance, and reported changes in patient care, law enforcement interactions, and clinical behavior.
Characteristic N Overall1 (N = 40) Agree1 (n = 18) Disagree/neutral1 (n = 22) P value2
IES Scale: “How much have you been distressed or bothered by these difficulties?” (significant findings)
I avoided letting myself get upset when I thought about it or was reminded of it.
/
(36%) 9/16 (56%) 3/17 (18%) .02 I felt as if it hadn’t happened or wasn’t real.
I tried not to think about it.
How has knowing about incidents of police excessive use of force impacted you while at work?
the way I care
What characteristic(s) of victims of police brutality contribute to excessive use of force by law enforcement?
1n/N (%).
2Fisher exact test; Wilcoxon rank-sum test.
IES, Impact of Event Scale.
experience intrusive thoughts such as “pictures [popping] into [their] heads.” These findings align with existing literature on secondary traumatic stress and vicarious trauma among healthcare workers who care for traumatized populations but extend this framework to excessive use of force as a specific and recurring source of exposure within emergency medicine. Importantly, distress related to excessive use of force was
not limited to internal psychological symptoms but translated into professional consequences. The EPs who reported worklife impact described altered patient care practices and changes in interactions with both patients and law enforcement. These findings add to the phenomenon known as the “cost of caring,” which has been studied by mental health therapists and law enforcement professionals.14,15 Research has shown that the
Turner et al.
“cost of caring” for traumatized individuals can lead to workrelated stressors associated with secondary trauma such as burn out, vicarious trauma, secondary traumatic stress, and posttraumatic stress disorder. These findings raise concerns about how repeated exposure to excessive use of force may influence clinical decision-making, therapeutic relationships, and workplace dynamics in EDs, and emphasize the importance of further exploration in this area.
These findings also intersect with emerging literature on moral distress and moral injury among physicians, particularly when clinicians perceive a conflict between professional obligations to patient advocacy and the actions of external authorities. Exposure to excessive use of force—whether through direct clinical encounters or repeated secondary awareness—may place EPs in ethically fraught situations that challenge professional identity and moral frameworks. Conceptual support for this connection is reflected in a recent case analysis by Richards et al, which described moral injury and difficulty maintaining therapeutic trust among physicians treating patients subjected to excessive use of force during mental health crises.16 Although that analysis was not conducted among EPs and was limited to a case-based discussion within a legal-psychiatric context, it highlights mechanisms, such as erosion of trust, ethical conflict, and emotional distress, that are consistent with our findings. To our knowledge, this study is among the first to empirically examine the psychological and professional impact of exposure to excessive use of force among EPs through a moral injury and secondary trauma framework. Although moral injury was not directly measured, the observed patterns of avoidance, intrusive thoughts, and altered professional behaviors align with mechanisms described in moral injury and secondary traumatic stress literature.
Racial and Ethnic Disparities in Excessive Use of Forcerelated Distress
Consistent with broader population-based studies, our findings demonstrate disproportionate psychological effects of excessive use of force among Black EPs, who had significantly higher IES-R scores compared to non-Black colleagues. This disparity mirrors prior research showing that awareness of police violence disproportionally affects the mental health of Black individuals, even in the absence of direct exposure. For example, one study reported that the awareness of events of excessive use of force through public channels disproportionately affects the mental health of people from racial and ethnic minorities, particularly Black and Latinx.4 Another study found that police killings of unarmed Black Americans contributed to over 50 million additional days of poor mental health per year among that demographic.17 Furthermore, members of the Black community who become aware of these incidents through social media and other sources experience a heightened sense of fear, apprehension, and distrust toward law
enforcement.17 Given that Black physicians may simultaneously occupy the roles of healthcare professional and community member, exposure to excessive use of force may activate both professional and personal stress pathways. Additionally, the intersection of racial identity and professional roles may compound distress. Although physicians may have socioeconomic protections relative to the general population, they are not insulated from the broader structural inequities and racializing policing practices affecting their communities. Studies reinforce that socioeconomic disparities further intensify the psychological toll of exposure to excessive use of force. Those in lower socioeconomic strata are more likely to experience excessive use of force, and Black Americans directly or secondarily impacted by excessive use of force, report living in fear due to awareness of these statistics and systemic injustices.18 The cumulative psychological burden described in the literature as “racial battle fatigue” may, therefore, extend into the clinical workspace, contributing to the heightened vigilance, emotional exhaustion, and distress among Black EPs.19 Such racial disparity further supports the framing of excessive use of force from a public health standpoint as a social determinant of health due to its broader impact on society.14
Excessive Use of Force, Secondary Traumatic Stress, and Emergency Department Dynamics
Our findings support conceptualizing excessive use of force-related distress among EPs as a form of secondary traumatic stress, a form of post-traumatic stress disorder defined as “experiencing repeated or extreme exposure to aversive details of the traumatic event(s)” (Diagnostic and Statistical Manual of Mental Disorders, 5th Ed). Unlike many professionals, EPs occupy a unique position in that they often care for both victims of violence and individuals restrained by law enforcement, frequently in the presence of armed officers, which may contribute to re-traumatization or heightened secondary traumatic stress among clinicians.20 This proximity may heighten the risk of re-traumatization and exacerbate stress response, particularly when EPs are repeatedly exposed to encounters related to excessive use of force. When combined with physician burnout, an increasingly recognized issue, secondary traumatic stress can lead to compassion fatigue.21 Our data suggest that excessive use of force-related incidents are a critical component of this equation, especially among minoritized physicians who reported a disproportionately higher psychological burden in our study. Importantly, our findings indicate that secondary exposure, through media, colleagues, or community awareness, was associated with psychological distress similar to that observed with personal exposure, reinforcing that repeated indirect exposure alone may be sufficient to trigger clinically relevant stress responses among EPs.
The observed prevalence of abnormal IES-R scores in our cohort is comparable to previously reported rates of secondary
traumatic stress among emergency clinicians. One study of EPs reported that 12-19% screened positive for secondary traumatic stress, and another found high rates among nurses in the ED.22, 23 Secondary traumatic stress has been linked to increased medical errors, reduced confidence, and absenteeism.24,25 Although our study did not directly assess these outcomes, the reported changes in patient care and professional interactions suggest that stress related to awareness of excessive use of force may contribute to similar downstream effects, with implications for both physician well-being and patient safety.
Implications for Emergency Medicine Practice and Systems
To our knowledge, this study is among the first to empirically examine the association between personal and second-hand exposure to excessive use of force by law enforcement and trauma-related psychological distress and professional impact among EPs. Taken together, these findings suggest that excessive use of force should be recognized as an occupational stressor within emergency medicine, particularly for physicians from marginalized racial and ethnic groups. Institutions should consider targeted interventions to address excessive use of force-related distress, including structural debriefings following such encounters, access to traumainformed mental health support, and education on secondary traumatic stress and coping strategies.
At the systems level, EDs may benefit from interdisciplinary collaboration between clinicians, hospital leadership, mental health professionals, and law enforcement agencies to establish protocols that minimize re-traumatization while preserving necessary working relationships. Incorporating excessive use of force-related stress into broader physician wellness and burnout prevention initiatives may further enhance institutional support.
These findings underscore the importance of recognizing excessive use of force as an occupational stressor for emergency physicians and the need for healthcare leaders to acknowledge and address its effects. Physicians and healthcare institutions may benefit from collaborative efforts to develop accessible, non-stigmatized mental health resources and trauma-informed support systems for clinicians exposed to excessive use of force-related encounters both within and outside the workplace. Interdisciplinary collaboration among clinicians, hospital leadership, mental health professionals, and law enforcement partners may help mitigate secondary traumatization while preserving effective working relationships in the ED. Although our study did not evaluate specific institutional or policy interventions, these findings suggest that examining the role and impact of law enforcement presence in the ED, as well as policies that influence clinician exposure to such encounters, may be important areas for future inquiry. Framing excessive use of force within a broader public health context—as a potential social determinant of health—may facilitate more comprehensive
approaches to addressing its impact on patients, communities, and the healthcare professionals who care for them.
Future Directions
Future research should aim to better characterize the longitudinal impact of excessive use of force exposure on EPs, including its relationship to burnout, retention, clinical outcomes, and patient trust. Larger, multi-institutional studies are needed to confirm these findings and explore protective factors that may mitigate excessive use of force-related distress. Additionally, qualitative studies may help elucidate the lived experiences of EPs navigating such exposure and identify institution-specific opportunities for intervention, By recognizing EPs as stakeholders and an at-risk population affected by excessive use of force, this study contributes to a more comprehensive understanding of excessive use of force as a public health issue and underscores the importance of supporting the mental health and professional well-being of clinicians working at the intersection of healthcare and law enforcement. Acknowledging the toll of this exposure underscores the need for targeted interventions to address this form of trauma and mitigate its effects on EPs. It is important that healthcare administration remains mindful of the various ways this trauma may manifest among EPs, ensuring adequate support mechanisms are in place. Additionally, we recommend that institutions consider a collaborative and interdisciplinary approach to address these challenges while preserving the working relationship between EPs and law enforcement officers.
LIMITATIONS
This was a hypothesis-generating study, which is the first to assess the impact of excessive use of force on EPs. This study had a small sample size and sampling bias based on voluntary participation. All respondents worked clinically at Texas academic centers, which may have resulted in different exposures to law enforcement officers or victims compared to other clinical sites. The survey asked respondents potentially sensitive questions regarding their mental health, and it is possible that social desirability bias influenced responses. Because the events of excessive use of force referenced in the survey occurred more than a year before the survey was distributed, recall bias may have also played a role in responses. Furthermore, physician baseline levels of mental distress or PTSD were unknown, and there may be unmeasured confounders that affect levels of mental distress due to excessive use of force. Given these limitations, larger and multi-site studies are essential to better understand the role of excessive use of force on EPs. Because the survey did not explicitly assess moral injury or longitudinal outcomes, future studies should directly evaluate these constructs to better characterize the ethical and professional consequences of exposure among EPs.
CONCLUSION
The findings from our study indicate that exposure to excessive use of force by law enforcement officers is associated with meaningful psychological distress and professional impact among emergency physicians. Our data suggests that this exposure—both direct and secondary—is linked to changes in workplace experience, patient care interactions, and mental well-being. Additionally, EPs from racial and ethnic minority groups are disproportionately affected, experiencing an inherent psychological impact, which highlights potential disparities in how excessive use of force-related stress is experienced within the emergency medicine workforce.
Address for Correspondence: Anisha Turner, MD, Baylor College of Medicine, 1 Baylor Plz, Houston, Texas 77030 Email: anisha. turner@bcm.edu
Conflicts of Interest: By the WestJEM article submission agreement, all authors are required to disclose all affiliations, funding sources and financial or management relationships that could be perceived as potential sources of bias. No author has professional or financial relationships with any companies that are relevant to this study. There are no conflicts of interest or sources of funding to declare.
1. Collins. Definition of police brutality. Collins Dictionary. 2014. Available at: https://www.collinsdictionary.com/submission/14704/ police+brutality. Accessed September 29, 2025.
2. Alpert GP, Smith WC. How reasonable is the reasonable man? Police and excessive force. J Crim Law Criminol. 1994;85(2):481–501.
3. Alang S, Haile R, Hardeman R, et al. (2023). Mechanisms Connecting Police Brutality, Intersectionality, and Women’s Health Over the Life Course. American Journal of Public Health, 2023;113(S1):S29–S36.
4. DeVylder, JE, Anglin DM, Bowleg L, et al. Police Violence and Public Health. Annual Review Clinical Psych. 2022;18:527–552.
5. Sewell AA et al. Illness spillovers of lethal police violence. Ethn Racial Stud. 2021;44(7):1089–1114.
6. Alang S, VanHook C, Judson J. Police brutality and mental health of Black adults. Psychol Trauma. 2022;14(6):1035–1044.
7. Hoggard LS, Thomas J. Vicarious exposure to police violence. Soc Personal Psychol Compass. 2024;18(1):e12868.
8. Baker EF, Moskop JC, Geiderman JM, et al. Law Enforcement and
Emergency Medicine: An Ethical Analysis. Ann Emerg Med. 2016;68(5):599–607.
9. Hutson HR, Anglin D, Rice P, et al. Excessive use of force by police: a survey of academic emergency physicians. Emerg Med J. 2009;26(1):20–22.
10. Khatri U, Kaufman E, Seeburger E, et al. Emergency Physician Observations and Attitudes on Law Enforcement Activities in the Emergency Department. West J Emerg Med. 2023; 24(2):160–168.
11. Brown C , Brown K, Brown I et al. Dear White People in emergency medicine. Ann Emerg Med. 2021;78(5):587–592.
12. Harris P, Taylor R, Thielke R, et al. Research electronic data capture (REDCap)--a metadata-driven methodology and workflow process for providing translational research informatics support. J Biomed Inform. 2009; 42(2)377–381.
13. Fleming PJ, Lopez WD, Spolum M, et al. Policing is a public health issue: the important role of health educators. Health Educ Behav. 2021;48(5):553-558.
14. Foley J, Massey KL. The cost of caring in policing: From burnout to PTSD in police officers in England and Wales. Police J. 2021;94(3):298-315.
15. Richards A, et al. Police officer’s use of force on person in mental health crisis. J Am Acad Psychiatry Law. 2025.
16. Bor J, Venkataramani AS, Williams DR, et al. Police killings and their spillover effects on the mental health of Black Americans: a population-based, quasi-experimental study. Lancet. 2018;392(10144):302-310.
17. Geller A, Fagan J, Tyler T, et al. Aggressive policing and the mental health of young urban men. Am J Public Health. 2014;104(12):23212327.
18. Franklin JD, et al. Racial battle fatigue for Latina/o Students. J Hisp High Educ. 2014;13(4):303-322.
19. Alur R, Hall E, Khatri U, et al. Law enforcement in the emergency department. JAMA Surg. 2022;157(9):852-854.
20. Deering D. Compassion fatigue: Coping with secondary traumatic stress disorder in those who treat the traumatized. J Psychosoc Nurs Ment Health Serv. 1996;34(11):52.
21. Roden-Foreman JW, Pettigrew M, Edmundson PM et al. Safer neighborhoods? Violent crime and trauma volume pre/post targeted police interventions in Dallas, Texas. Injury. 2024;55(2):111202.
22. Beck CT. Secondary traumatic stress in nurses: a systematic review. Arch Psychiatr Nurs. 2011;25(1):1-10.
23. Kruper J, Yeatman JD, Richie-Halford A, et al. Evaluating the reliability of human brain white matter tractometry. Aperture Neuro 2021;1(1):e6198273.
24. Burlison JD, Quillivan RR, Scott SD, et al. The effects of the second victim phenomenon on work-related outcomes: connecting selfreported caregiver distress to turnover intentions and absenteeism. J Patient Saf. 2021;17(3):195-199
Original Research
Through the Prism: Shining Light on LGBTQIA+ Applicant Identities
Kayla Iuliucci, MD*
Lea Moujaes, MD*
David Rudolph, MD*
Peter Fredericks, MD*
Blake Denley, MD†
Samuel Paskin, MD‡
Authors continued at end of article
Section Editor: Asit Misra, MD
and Influences
Johns Hopkins University School of Medicine, Department of Emergency Medicine, Baltimore, Maryland
Ochsner Health, Department of Emergency Medicine, New Orleans, Louisiana Larner College of Medicine at the University of Vermont, Department of Emergency Medicine, Burlington, Vermont
See supplemental file for full authorship
Submission history: Submitted August 8, 2025; Revision received January 23, 2026; Accepted January 24, 2026
Electronically published May 18, 2026
Full text available through open access at http://escholarship.org/uc/uciem_westjem DOI 10.5811/westjem.50598
Introduction: Program diversity impacts rank-list creation for emergency medicine (EM)-bound applicants, but how lesbian, gay, bisexual, transgender, queer or questioning, intersex, asexual, and other sexual and gender minorities (LGBTQIA+) identities influence residency selection is unknown. This study investigates general patterns in EM applicant LGBTQIA+ identities, disclosure of those identities, and how LGBTQIA+ factors impact residency selection. Additionally, we present data exploring the relationship between medical school location and the location of top-ranked programs for LGBTQIA+ and non-LGBTQIA+ identifying applicants.
Methods: We surveyed 2,287 EM-bound United States MD/DO applicants who applied to one of five author EM programs and programs affiliated with the Emergency Medicine Education Research Alliance from May 16–June 30, 2024. The survey included multiple-choice, free-text, and Likert scale questions. Data were explored with descriptive statistics, and we used chi-square and Fisher exact tests to compare differences in proportions. We also analyzed applicants’ medical school state and a graphical representation of the top three positions on their residency rank lists, using inverseproportional weighting.
Results: Of 445 respondents (19.4%), 59 (13.3%) identified as LGBTQIA+. Gender identities included 173 cisgender men (38.9%), 254 cisgender women (57.1%), one transgender man (0.2%), one transgender woman (0.2%), four non-binary (0.9%), one genderqueer (0.2%), and seven “preferred not to answer” (1.6%). Among LGBTQIA+ respondents, seven (11.9%) disclosed their status within the application, nine (15.3%) during the interview, 18 (30.5%) in both, and 25 (42.4%) did not disclose. Among 56 respondents, 36 (64.3%) supported adding LGBTQIA+ status to the residency application; 20 (35.7%) did not. Of the program factors considered, program diversity (91.1%) and commitment to underserved communities (96.4%) were significantly more important for LGBTQIA+ respondents (P < .01), while proximity to partner(s) (64.3%; P < .01) and program length (66.1%; P = .02) were significantly less important compared with non-LGBTQIA+ respondents. Additional factors that influenced LGBTQIA+ applicants’ rank list included political environment, friendliness of the learning environment, and presence/absence of anti-LGBTQIA+ laws.
Conclusion: Many LGBTQIA+ applicants do not disclose their identities when applying for residency. LGBTQIA+ respondents value program diversity and commitment to underserved communities, and they consider LGBTQIA+-specific factors such as the presence of anti-LGBTQIA+ legislation. These insights can inform residency programs and recruitment practices. [West J Emerg Med. 2026;27(3)698–708.]
INTRODUCTION
Diverse physicians enhance team dynamics, patient outcomes, and access to care for underserved communities.1 Although there has been increasing focus on diversity of trainees in medical education, sexual and gender diversity has not received the same emphasis.2 Within emergency medicine (EM), increasing lesbian, gay, bisexual, transgender, queer or questioning, intersex, asexual, and other sexual and gender minorities (LGBTQIA+) diversity is critical, as LGBTQIA+ patients frequently rely on emergency departments (ED) due to barriers to primary care and face significant health disparities. Patient concerns about discrimination and clinician bias can lead to ED avoidance and delays in seeking care for urgent or emergent medical needs.3 This necessitates understanding LGBTQIA+ applicant decision-making and reflecting on residency recruitment practices.
Unlike other minority populations, LGBTQIA+ applicants face a unique challenge: Their identity is not necessarily visible or apparent on applications or during interviews. This invisibility creates a deliberate decision about whether, when, and how to “come out” during the application process while weighing competing priorities such as successfully matching, identifying optimal training, considering geographic preferences, and assessing LGBTQIA+ friendliness.
Previous research found that both program factors and geographic location were important influences on medical students’ selection of EM residencies.4 A more recent study evaluating influences on under-represented in medicine (URiM) applicants to EM highlighted the importance of program diversity in residency selection.5 However, it remains unclear whether these findings would apply to LGBTQIA+ applicants given the challenges of identity invisibility and choice to disclose. Progress has been made in LGBTQIA+ education in EM programs, with 75% now including content on LGBTQIA+ health.6 However, curricular enhancements alone may not suffice in creating environments where LGBTQIA+ applicants feel supported. Implicit bias, microaggressions, and the lack of visible representation continue to create barriers, potentially leading to career dissatisfaction and higher turnover rates among LGBTQIA+ physicians.7
Our primary objective was to determine factors that influence medical students’ ranking of EM residency programs. The secondary objectives were to assess whether factors influencing program ranking differ between LGBTQIA+ and non-LGBTQIA+ applicants, and to explore the impact of LGBTQIA+–specific applicant choices, and how applicants disclose LGBTQIA+ status during the residency selection process, if at all.
METHODS
Study Design and Population
This study was reviewed by the primary author’s institutional review board and deemed exempt. We employed
Population Health Research Capsule
What do we already know about this issue? Program diversity influences emergency medicine (EM) residency selection, yet the impact of LGBTQIA+ identity on applicant decision-making remains understudied.
What was the research question?
How do LGBTQIA+ identity, disclosure, and related factors influence the rank list decisions of applicants to EM residency?
What was the major finding of the study? LGBTQIA+ applicants more often valued program diversity (91.1% vs 72.2%) and commitment to the underserved (96.4% vs 81.0%; P < .01).
How does this improve population health? Understanding LGBTQIA+ applicant priorities can guide inclusive recruitment practices and strengthen workforce diversity to better serve marginalized populations.
a cross-sectional survey to assess the experiences and perspectives of medical students applying for first-year positions in EM residency programs in the United States. The survey was distributed to a convenience sample of applicants who had applied to author programs at the following institutions: Baylor College of Medicine; Johns Hopkins School of Medicine; Ohio State University; David Geffen School of Medicine at the University of California Los Angeles; and Wayne State University/Detroit Receiving Hospital. We recruited participants in accordance with the American Association of Medical Colleges policy, which permits the use of Electronic Residency Application Service applicant data by programs for research purposes.8 We included medical students from U.S. medical schools who were applying for a first-year categorical position with one or more of the EM residency programs listed above. International medical graduates were excluded.
Setting
We distributed the survey via Qualtrics vXM 2024 (Qualtrics International, Inc, Provo, UT) from May 16–June 30, 2024. We offered potential subjects the chance to win one of eight gift cards ($50) in appreciation of their participation. We
Iuliucci
de-identified all data and stored it on a secure server. We sent three reminder emails at regular intervals to non-responders. Response rate was calculated using the American Association for Public Opinion Research’s Response Rate 2 definition.9
Instrument Development
Our survey development and reporting approach was informed by guidelines for survey research methodology, and we employed Messick’s framework as our validity model.10,11 Our CROSS checklist is included in Supplement 1. A diverse group of experts developed the survey based on prior literature and the authors’ personal experiences.4,5,12 We used a modified Delphi approach to further enhance content validity.13 We piloted the survey with 13 first-year residents from the primary author’s institution to provide response process validity evidence, and we modified items for clarity based on pilot feedback. As we were targeting a similar population, general demographic questions (Q2-9) were adapted from Weygandt et al, with expansion on the gender identity question.5 We retained the general diversity question from prior surveys to capture the broader importance of diversity, recognizing that applicants hold intersecting identities.4,5,12 Question 17 examined specific LGBTQIA+-related factors influencing program selection. Questions (Q11, 18, and 19) regarding factors that influence applicants were adapted from Love et al, including geographic location, proximity to family and significant others, cost of living, interview experience, program length, personal experiences with residents and faculty, program type, program reputation, and diversity within the program.4 New questions were added to determine ranked program locations and patterns of LGBTQIA+ status disclosure. The final survey consisted of 21 questions, two of which were matrices assessing program and LGBTQIA+ factors (Supplement 2). It included multiple-choice, Likert scale, and free-text items.
Measurements/Key Outcome Measures
We collected standard demographic data including age, location, and marital status, as well as specific demographic data about LGBTQIA+ identities and URiM identities. Marital status and non-traditional status of the applicant were included as an extension of prior work by Weygandt et al,5 determining whether there were different trends for LGBTQIA+ vs non-LGBTQIA+ applicants.
Data Analysis
We used Stata SE v1814 (StataCorp, LLC, College Station, TX) and R statistical software (The R Foundation for Statistical Software, Vienna, Austria).15 We employed simple descriptive statistics, including proportions and measures of central tendency. After analysis of the histogram of distribution of responses, to simplify data interpretation we dichotomized the 5-point Likert scales for residency choice
factors between LGBTQIA+ and non-LGBTQIA+, grouping “extremely important,” “very important,” and “moderately important” as “important” and “slightly important” and “not at all important” as “not important.” The original response distributions prior to dichotomization are available in Supplement 3: importance of LGBTQIA+-related factors for rank-list creation, and Supplement 4: comparison of residency factors between LGBTQIA+ and non-LGBTQIA+ respondents. We used the chi-square and Fisher exact tests, when appropriate, to compare differences in proportions.
We conducted a nonresponse bias analysis using wave analysis, as data for nonrespondents were unavailable; the institutional review board (IRB) only permitted analysis of respondents who consented and completed the survey. Wave analysis can be used when there is no available data for nonrespondents with the logic that late respondents can be used as a surrogate for nonrespondents given the delay in taking the survey. The initial survey was disseminated on May 16, 2024, with subsequent reminders sent on May 28, June 10, June 17, and June 24. We performed comparisons in the wave analysis between respondents who completed the survey after the first dissemination (May 16) compared to the need for a reminder (after May 28).16
We employed tidyverse and sf17 packages within R statistical software to visualize state-level geographic data. We chose state-level analysis over regional divisions due to the heterogeneous representation of LGBTQIA+ applicants across regions; state-level examination allowed greater granularity and accuracy, given that not all U.S. states were represented by LGBTQIA+ respondents. Our central hypothesis was that graduating medical students, especially those identifying as LGBTQIA+, consider state-level legislative environments around LGBTQIA+ issues when ranking residency programs to a greater extent than non-LGBTQIA+ applicants. Because relevant legislative influences often operate at the state rather than the regional level, this approach supports a more precise analysis. These data included the location of an individual’s medical school and a graphical representation of the top three positions on their residency rank lists.
We used each respondent’s rank order to calculate an inversely proportional weighted (IPW) rank. The use of IPW was motivated by the assumption that applicants place more weight on their highest ranked program, optimizing sensitivity in measuring their true preferences. The IPW enables us to reflect that first-choice programs are prioritized above second and third choices, rather than attributing equal value to all top selections as would occur with unweighted counts. Our weighted ranking schema followed the principles of IPW, giving greater weight to higher ranks while assigning less weight to lower ranks to provide a more practical and holistic view of a student’s rank choices. We assigned a weight of 0.5 to each first rank (#1 position on rank list), 0.33 to a respondent’s second rank (#2 position on rank list), and 0.16
to the third rank (#3 position on rank list).
Missing responses were assigned to the next highest ranked state. For example, if an applicant’s second-ranked residency state was missing, we used their first-ranked state in its place for analysis. Proportions were calculated for state of medical school attendance, inversely weighted rank, and the difference between the two.17,18 To determine directionality, we calculated the difference in proportions between inversely weighted ranks and state of medical school attendance to identify intended geographic movement based on rank lists. We also hypothesized that there might be differences based on LGBTQIA+ identity and stratified accordingly.
RESULTS
Of 2,287 EM-bound applicants to our institutions, 445 (19.5%) responded to the survey. The age in years of respondents ranged from 24-49, with a mean of 28.5 (standard deviation 3.1). We report the characteristics of participants in Table 1.
Ranking Factors for LGBTQIA+ Identifying Applicants to Emergency Medicine
The importance of program factors to ranking decisions is displayed in Table 2. We collapsed the 5-point Likert scale as follows. “extremely important,” “very important,” and “moderately important” were considered “important” while “slightly important” and “not at all important” were considered as “not important.”
Proximity to partner (P < .01) and program length (P = .02) were significantly less important for LGBTQIA+ respondents while diversity within the program (P < .01) and program commitment to the underserved (P <.01) were significantly more important for LGBTQIA+ respondents compared to non-LGBTQIA+ respondents. There were no statistically significant differences between LGBTQIA+ and non-LGBTQIA+ applicants in the importance they placed on the other factors (P > .05). Factors important to LGBTQIA+ identifying applicants are displayed in Figure 1.
Nonresponse Bias Wave Analysis
A total of 180 respondents responded to the first dissemination of the survey compared to 265 who responded after a reminder email. There were no statistically significant differences between early vs late respondents for demographic variables of gender, marital status, race, ethnicity, and sexual orientation. (See Supplement 5, Table 1.) Age distribution differed significantly between early and late respondents (Wilcoxon rank-sum test, P = .02), although the median age (28 years) was the same in both groups. There were no statistically significant interactions between LGBTQIA+ status and time of survey completion (early vs late respondents) for the residency selection factors in Table 2 (Supplement 5, Table 2).
Table 1. Demographic information of survey respondents in a study to determine how LGBTQIA+ identities influence residency selection.
Unlisted Response* (written-in responses included 2 “male,” 1 “man,” and 1 “woman”)
Disclosure of LGBTQIA+ Status
Of 59 respondents, 7 (11.9%) disclosed LGBTQIA+ status in their application, 9 (15.3%) in their interview, 18
Iuliucci
Table 2. Comparison of the importance of specific residency factors between LGBTQIA+ and non-LGBTQIA+ respondents using chisquare test of proportions.
1. LGBTQIA+-specific factors that influence the rank lists of emergency medicine residency applicants’ (N = 56): dichotomized responses (important vs not important).
(30.5%) in both, and 25 (42.4%) did not disclose. In the application, 8 respondents disclosed via their pronouns, 14 via their personal statement, 18 via experiences, 4 via hobbies, and 1 via demographics. One applicant disclosed in the context of couples matching with their partner. During the interview process, 28 (47.5%) applicants did not disclose, 20 (33.9%) did at some interviews, and 11 (18.6%) did at all interviews. When asked about adding LGBTQIA+ status to
the standard residency application, 64.3% were in favor while 35.7% were not.
Geographic Distribution of Applicants
The geographic distribution of survey respondents’ medical schools is represented in Figure 2.
Of the 445 survey respondents, 22 did not provide rank list preferences and 13 did not respond to the sexual orientation and
Figure
Figure 2. Geographic distribution of survey respondents by location of medical school and inversely proportional weighted ranks stratified by LGBTQIA+ status.
gender identity questions; therefore, both were removed from the analysis for a total of 410 respondents in the maps.
The top three states of medical school attendance for all applicants were California (9.3%), Michigan (9.0%), and Pennsylvania (8.0%). Of the LGBTQIA+ respondents, 14.5% attended medical school in New York and 7.3% in Pennsylvania. California totaled 28.2% of all IPW ranks, followed by 16.2% for residencies in Pennsylvania and 14.6% for residencies in New York and Illinois. Of LGBTQIA+ survey respondents, 13.9% of the IPW ranks were for programs located in California, 10.9% for Pennsylvania, 9.4% for Maryland, and 7.6% for New York.
Figure 3 reflects the difference in the proportions between the IPW ranks for residency programs and the location of the survey respondents’ medical schools.
There was a positive difference of 18.9% for all respondents between the IPW ranks for residencies in California (28.2%) and the proportion of medical students attending medical school in California (9.3%). For LGBTQIA+ applicants, California had the highest positive difference of 8.5%, reflecting the difference that 5.5% of the LGBTQIA+ respondents were attending medical school in California while receiving 13.9% of all LGBTQIA+ IPW ranks. The next states with the highest positive difference were
3. Geographic distribution of difference between inversely proportional weighted ranks and state of medical school attendance. This figure represents the difference between the first column and second column of Figure 2.
decisions. While EM as a specialty already emphasizes care for underserved populations, residency programs can further demonstrate their commitment to these communities—a factor that significantly influences LGBTQIA+ applicants and other under-represented groups, including those marginalized by race and gender.19
When asked about specific LGBTQIA+ factors, applicants highlighted both external factors, such as the broader political environment, and internal program-specific considerations. Consistent with prior studies of URiM, LGBTQIA+ applicants in this study prioritized diverse and inclusive environments.19 Among external factors, political environment was the most influential factor for applicants, especially the presence or absence of state-level anti-LGBTQIA+ laws. Individuals may be reluctant to move to places where their rights may not be protected or where they could face legal discrimination, although further research is needed to fully explain the true decision-making process behind these preferences. The implications of the laws extend beyond legal protections and may reflect the values of the local community, patient population, hospital, and program itself. A supportive political climate, on the other hand, is essential for ensuring family rights, access to healthcare, freedom from violence/harassment, and freedom of assembly and expression—issues central to LGBTQIA+ advocacy and safety.20,21 The political climate of a program’s location can have profound implications for both personal safety and professional experiences.
Maryland (3.9%), Pennsylvania (3.6%), Minnesota (2.7%), and Virginia (2.4%). States with the largest negative absolute differences were New York (-7.0%), Michigan (-4.5%), Missouri (-4.5%), Louisiana (-3.0%), and Ohio (-2.7%).
DISCUSSION
Our analysis of LGBTQIA+ applicants provides insight into applicant decision-making and the influence of diversity factors, highlighting the need for residency programs to prioritize diversity in their recruitment strategies. For LGBTQIA+ applicants, a program’s commitment to underserved communities also played a key role in ranking
The interaction of geography, program factors, and legislation is complex and not easily explained by region alone. Based on IPW differences, there appear to be some trends for LGBTQIA+ applicants to more highly rank residencies in states with more LGBTQIA+-friendly legislation (eg, California, Maryland, Virginia) and less likely to rank residencies in states with anti-LGBTQIA+ legislation (Florida, Louisiana, Missouri), according to the American Civil Liberties Union classification. California’s high desirability among LGBTQIA+ applicants may reflect its comprehensive legal protections for individuals, established communities in major metropolitan areas, and state-level policies supporting gender-affirming care and antidiscrimination protections. Interpretations regarding regions are difficult due to missing data and underpowered for statistically significant results. Interestingly, LGBTQIA+ trainees appear to be less often ranking New York, Massachusetts, and Oregon residency programs —the latter being particularly unexpected given Oregon’s strong LGBTQIA+ protections, suggesting that factors beyond state legislation alone influence applicant decisions.
While program-specific factors such as the presence of LGBTQIA+ residents and faculty, and an inclusive curriculum, were still important, they appear to be less important than the political environment, the friendliness of the location, anti-LGBTQIA+ laws, and the friendliness of the
Figure
residency and healthcare system. This may suggest that LGBTQIA+ applicants find support outside the residency program, such as in their own social networks, family, and communities. Additionally, these applicants could be more familiar with LGBTQIA+ issues and inclusive education. Further studies are needed to clarify qualitatively the reasons for these trends in LGBTQIA+-specific factors.
A substantial portion of LGBTQIA+ applicants (42.4%) chose not to disclose their identity during the application or interview process. Of those who did disclose, more disclosed during interviews rather than through application materials such as pronouns or personal statements. Notably, while 42.4% chose not to disclose, 64.3% supported adding LGBTQIA+ status to the standard residency application. This is consistent with prior research that has shown that many LGBTQIA+ individuals are reluctant to disclose gender identity or sexual orientation in professional contexts due to concerns about discrimination.22,23 Nondisclosure may stem from fear of emotional, verbal, or physical abuse, social exclusion, workplace harassment, or job termination.24–27 The preference for disclosure during interviews suggests these provide a more personal context for gauging program inclusivity before revealing personal information.
The discordance between disclosure behavior and support for formal mechanisms may reflect concerns about the informal nature of current methods, where applicants lack control over how and when their identity becomes visible. A standardized, optional field could provide greater agency in disclosure decisions. This aligns with growing calls within medical education to enhance visibility and support for LGBTQIA+ trainees.23 Applicants in favor of this change indicate that many perceive advantages, such as better alignment with residency programs that prioritize diversity and inclusivity. However, there remains a substantial proportion who would prefer not to disclose, underscoring the need for further research to identify ways to enhance the ability to disclose while respecting an individual’s right to choose when, if, and how they do so.
Future research with expanded sample sizes and longitudinal data is needed to continue exploring these patterns to evaluate the impact of changes to the residency application process on their experiences. In the process of attracting greater numbers of LGBTQIA+ applicants, there are steps that residency programs can take to promote inclusivity for the LGBTQIA+ community. Methods include implementing initiatives such as confidential, one-on-one discussions between applicants and residents who identify as LGBTQIA+; hosting social events focused on diversity and inclusivity specifically for LGBTQIA+ applicants; establishing committees dedicated to advancing diversity and inclusion among faculty and trainees; and developing curricula that ensure inclusive and affirming care for sexual and gender minority patients.28–31
While programs with intentional efforts to enhance diversity and inclusion improve patient outcomes, foster
innovation, and improve trainee satisfaction,32 there is limited research on how LGBTQIA+ representation in residency programs influences applicants’ decisions. Studies have demonstrated that pre-interview messaging, interview day experiences, and post-interview communication are critical touchpoints in attracting a diverse cohort. Challenges such as implicit bias, minority tax, and geographic misperceptions persist.33 Mentorship is another pivotal factor in supporting LGBTQIA+ trainees and a lack of visible mentors within programs often exacerbates feelings of isolation and exclusion.34 This study reinforces the significance of these factors and suggests that strengthening inclusive practices during recruitment may help attract applicants who bring diversity and perspective to EM.
LIMITATIONS
The study has several limitations. First, we used a convenience sample of applicants to selected institutions, which limits the generalizability of the findings. While the study questionnaire was based on prior surveys in the literature, we also added elements based on the authors’ personal experiences as members of the queer community in EM. For example, we all were forced to choose where to disclose our LGBTQIA+ identities if we decided to disclose at all. We also experienced variable receptivity to those identities as we travelled across the country during interview season. While some of the authors identify as gay, lesbian, pan-sexual, bisexual, and queer, we do not represent the entire spectrum of LGBTQIA+ identities, and our perspective may, therefore, be somewhat limited.
The response rate of 19.5% is a primary limitation of this study, and only 13.3% of respondents identified as LGBTQIA+, limiting the generalizability of our findings. The overall proportion is similar to the proportion of LGBTQIA+ identifying people in the US, which is 9.3%,35 so we believe we have a relatively representative sample. The low absolute numbers of applicants identifying as LGBTQIA+ constrained further investigations and statistical power, such as subgroup analyses for female-identifying and URiM applicants. Our nonresponse bias analysis was limited by the lack of data on nonrespondents; consequently, we relied on wave analysis comparing early and late respondents, which did not show any statistically significant differences. This method may not detect all sources of bias, as late respondents may not be representative of nonrespondents, potentially limiting the generalizability of results. While we collected data on how and whether applicants disclosed their LGBTQIA+ identities, we did not assess whether they disclosed to all programs or only a subset. Additionally, the limited depth of the free-text responses led us to decide against a qualitative analysis. However, further studies could address these gaps through in-depth interviews or focus-group discussions to better explore trends from our quantitative data.
We also acknowledge that the surveyed sites are more
Iuliucci
academic-focused and urban programs. Although this may represent a large number of the total applicant pool, it still could affect the generalizability of these results. Additionally, the uneven distribution of EM residency programs across states may further influence our findings. Some states with higher program concentrations may be disproportionately represented in applicant considerations.
The survey was also distributed to MD/DO students in the U.S., as has been done in prior studies, 5,12 which does limit the generalizability of our findings to this important and growing group of EM trainees.36 Additionally, the survey did not ask applicants who did not identify as non-LGBTQIA+ about whether or how LGBTQIA+ factors may have influenced their choice of residency rank, if at all. These applicants may have loved ones who do identify as LGBTQIA+ or may be allies. Future studies should distribute all survey questions to all applicants.
This study captured data from a single application cycle and was limited to EM, limiting its generalizability beyond the specialty. While we distributed our survey to approximately 75% of applicants, there exists the possibility of selection bias.37 Low response rates are a common challenge in surveys of medical trainees and raise concerns about nonresponse bias that may affect representativeness.38 To address this, best practices emphasize both transparent reporting of response rates and the use of standardized definitions such as those outlined by the American Association for Public Opinion Research, and explicit evaluation of nonresponse bias where feasible.39,40
While we based our study on earlier work and focused on factors that may influence LGBTQIA+ trainee residency preferences, we acknowledge that residency selection is an individual journey and that no survey in isolation could fully describe the factors that shape this journey. Also, program rank was limited to programs where applicants interviewed, which may have introduced selection bias since the interview invitations are influenced by factors including geographic preferences and application strategy.
Our use of state-level categorization may not have captured intrastate heterogeneity, since urban centers often differ from rural areas in their political climates and LGBTQIA+ community presence. The survey question assessing “political environment” may also be interpreted in many ways; respondents may have evaluated institutional, local, or state political contexts differently. Finally, we did not explicitly explore gender identity, which is distinct from sexual orientation. While LGBTQIA+ is often used as an umbrella term, it does not fully capture the nuanced experiences of trans and nonbinary individuals, who face unique social and policy challenges. Future initiatives should aim to better differentiate gender identity from sexual orientation to ensure more comprehensive representation and analysis.
CONCLUSION
This study highlights the unique residency preferences and
disclosure patterns observed in a convenience sample of LGBTQIA+ applicants in emergency medicine. Compared to non–LGBTQIA+ peers, they placed greater importance on program diversity and commitment to underserved communities, and less on proximity to partners or program length. LGBTQIA+ applicants tended to rank programs in states with more LGBTQIA+–friendly legislation more highly, although this pattern was nuanced and influenced by factors beyond legislation alone. While most supported mechanisms for disclosing LGBTQIA+ status, a significant minority did not, reflecting the nuanced considerations that influence disclosure decisions. Programs that cultivate inclusivity and align with these values are well-positioned to attract and support a diverse applicant pool.
ACKNOWLEDGMENTS
The authors acknowledge the emergency medicine applicants from the 2023-2024 application season for providing their insights, without whom this study would not have been possible.
AUTHORS CONTINUED
Arlene S. Chung, MD‡
Jaime Jordan, MD§ Edgardo Ordonez, MD|| Laura Smylie, MD# Simiao Li-Sauerwine, MD¶ P. Logan Weygandt, MD*
§Oregon Health & Science University, Department of Emergency Medicine, Portland, Oregon
||Baylor College of Medicine, Department of Emergency Medicine, Houston, Texas
#Wayne State University School of Medicine, Department of Emergency Medicine, Detroit, Michigan
¶The Ohio State University College of Medicine, Department of Emergency Medicine, Columbus, Ohio
Address for Correspondence: Kayla Iuliucci, MD, Johns Hopkins University School of Medicine, Department of Emergency Medicine, 1830 East Monument Street, Suite 6-100, Baltimore, MD 21287
Email: kiuliuc1@jhmi.edu.
Conflicts of Interest: By the WestJEM article submission agreement, all authors are required to disclose all affiliations, funding sources and financial or management relationships that could be perceived as potential sources of bias. No author has professional or financial relationships with any companies that are relevant to this study. There are no conflicts of interest or sources of funding to declare.
1. Crites K, Johnson J, Scott N, et al. Increasing diversity in residency training programs. Cureus. 2022;14(6):e25962.
2. Lall MD, Backster A, White MH, et al. Recruitment of a diverse emergency medicine residency program: creating and maintaining a culture of diversity, equity, and inclusion. AEM Educ Train. 2021;5(Suppl 1):S112-5.
3. Ornelas-Dorian C, Hsiang E. Caring for LGBTQIA+ populations in the ED: a quick guide. 2024. Available at: https://www.emra.org/ emresident/article/lgbtq-care. Accessed November 26, 2025.
4. Love JN, Howell JM, Hegarty CB, et al. Factors that influence medical student selection of an emergency medicine residency program: implications for training programs. Acad Emerg Med. 2012;19(4):455-60.
5. Weygandt PL, Smylie L, Ordonez E, et al. Factors influencing emergency medicine residency choice: diversity, community, and recruitment red flags. AEM Educ Train. 2021;5(4):e10638.
6. Moll J, Krieger P, Moreno-Walton L, et al. The prevalence of lesbian, gay, bisexual, and transgender health education and training in emergency medicine residency programs: What do we know? Acad Emerg Med. 2014;21(5):608-11.
7. Brown C, Daniel R, Addo N, et al. The experiences of medical students, residents, fellows, and attendings in the emergency department: implicit bias to microaggressions. AEM Educ Train. 2021;5(Suppl 1):S49-56.
8. Association of American Medical Colleges. AAMC policies regarding the collection, use, and dissemination of medical student and applicant data. 2020. Available at: https://students-residents.aamc. org/applying-medical-school-amcas/aamc-policies-regardingcollection-use-and-dissemination-medical-student-and-applicantdata. Accessed November 26, 2025.
9. American Association for Public Opinion Research. Standard definitions: final dispositions of case codes and outcome rates for surveys. 2023. Available at: https://aapor.org/wp-content/ uploads/2023/05/Standards-Definitions-10th-edition.pdf. Accessed January 12, 2026.
10. Sharma A, Minh Duc NT, Luu Lam Thang T, et al. A consensus-based checklist for reporting of survey studies (CROSS). J Gen Intern Med. 2021;36(10):3179-87.
11. Hill J, Ogle K, Gottlieb M, et al. Educator’s blueprint: a how-to guide for collecting validity evidence in survey-based research. AEM Educ Train. 2022;6(6):e10835.
12. Li-Sauerwine S, Weygandt PL, Smylie L, et al. The more things change the more they stay the same: factors influencing emergency medicine residency selection in the virtual era. AEM Educ Train. 2023;7(6):e10921.
13. Hsu CC, Sandford BA. The Delphi technique: making sense of consensus. Pract Assess Res Eval. 2007;12(1).
14. StataCorp LLC. Stata Statistical Software. Version 18. College Station, TX: StataCorp LLC; 2023.
15. The R Foundation. R: A language and environment for statistical
computing. 2025. Available at: https://www.R-project.org/. Accessed December 23, 2024.
16. Halbesleben JRB, Whitman MV. Evaluating survey quality in health services research: a decision framework for assessing nonresponse bias. Health Serv Res. 2013;48(3):913-30.
17. Wickham H, Averick M, Bryan J, et al. Welcome to the tidyverse. J Open Source Softw. 2019;4(43):1686.
18. Pebesma E, Bivand R. Spatial Data Science: With Applications in R. New York, NY: Chapman and Hall/CRC; 2023.
19. Agawu A, Fahl C, Alexis D, et al. The influence of gender and underrepresented minority status on medical student ranking of residency programs. J Natl Med Assoc. 2019;111(6):665-73.
20. Office of the United Nations High Commissioner for Human Rights. About LGBTI People and Human Rights. Available at: https://www. ohchr.org/en/sexual-orientation-and-gender-identity/about-lgbtipeople-and-human-rights. Accessed December 23, 2024.
21. Thoreson R. “All we want is equality.” Religious exemptions and discrimination against LGBT people in the United States. 2018. Available at: https://www.hrw.org/report/2018/02/19/all-we-wantequality/religious-exemptions-and-discrimination-against-lgbt-people. Accessed December 23, 2024.
22. Beatriz C, Pereira H. Workplace experiences of LGBTQIA+ individuals in Portugal. Empl Responsib Rights J. 2023;35(3):345-67.
23. Rossman K, Salamanca P, Macapagal K. A qualitative study examining young adults’ experiences of disclosure and nondisclosure of LGBTQ identity to health care providers. J Homosex. 2017;64(10):1390-410.
24. Feinstein BA, Xavier Hall CD, Dyar C, et al. Motivations for sexual identity concealment and their associations with mental health among bisexual, pansexual, queer, and fluid individuals. J Bisexuality. 2020;20(3):324-41.
25. Grace Holman E, Ogolsky BG, Oswald RF. Concealment of a sexual minority identity in the workplace: the role of workplace climate and identity centrality. J Homosex. 2022;69(9):1467-84.
26. Herek GM. Hate crimes and stigma-related experiences among sexual minority adults in the United States: prevalence estimates from a national probability sample. J Interpers Violence. 2009;24(1):54-74.
27. Badgett MV, Sears B, Lau H, et al. Bias in the workplace: consistent evidence of sexual orientation and gender identity discrimination 1998–2008. Chic-Kent Law Rev. 2009;84(2):559.
28. Tobolsky SA, Abrams HR, Axelrath SA, et al. The LGBTQ applicantresident chat: LGBTQ-focused residency recruitment as an opportunity for increasing diversity, representation, and inclusivity in medical training. J Grad Med Educ. 2021;13(3):420-2.
29. Raymond-Kolker R, Grayson A, Heitkamp N, et al. LGBTQ+ equity in virtual residency recruitment: innovations and recommendations. J Grad Med Educ. 2021;13(5):640-2.
30. Indiana University School of Medicine. LGBTQ+ health education: curriculum and faculty resources. Available at: https://medicine.iu. edu/expertise/lgbtq-health/education. Accessed December 23, 2024.
Iuliucci
31. University of Illinois Chicago College of Medicine. Residency program diversity and inclusion. Available at: https://chicago.medicine.uic.edu/ medicine/education/internal-medicine-residency-program/diversity-andinclusion/. Accessed December 23, 2024.
32. Gomez LE, Bernet P. Diversity improves performance and outcomes. J Natl Med Assoc. 2019;111(4):383-92.
33. Wilson LT, Weigel B, Ordonez E, et al. Strategies for recruiting underrepresented in medicine and sexual and gender minority students to emergency medicine. AEM Educ Train. 2023;7(Suppl 1):S22-32.
34. Danckers M, Nusynowitz J, Jamneshan L, et al. The sexual and gender minority (LGBTQ+) medical trainee: the journey through medical education. BMC Med Educ. 2024;24(1):67.
35. Jones J. LGBTQ+ identification in U.S. rises to 9.3%. 2025. Available at: https://news.gallup.com/poll/656708/lgbtq-identification-rises.aspx.
Accessed April 11, 2025.
36. Cook T. DOs and IMGs make up the majority of the 2025 EM match. Emerg Med News. 2025;47(4):1.
37. National Resident Matching Program. 2024 Main Match Results and Data. 2024. Available at: https://www.nrmp.org/wp-content/ uploads/2024/06/2024-Main-Match-Results-and-Data-Final.pdf. Accessed April 8, 2025.
38. Phillips AW, Friedman BT, Utrankar A, et al. Surveys of health professions trainees: prevalence, response rates, and predictive factors to guide researchers. Acad Med. 2017;92(2):222-8.
39. Phillips AW, Friedman BT, Durning SJ. How to calculate a survey response rate: best practices. Acad Med. 2017;92(2):269.
40. Phillips AW, Reddy S, Durning SJ. Improving response rates and evaluating nonresponse bias in surveys: AMEE Guide No. 102. Med Teach. 2016;38(3):217-28.
Determination of Optimal Magill Forceps Hand Position and Laryngoscope Type to Remove a Simulated Foreign Body Airway Obstruction
Michael Berkenbush, MD, NRP*
Coco Thomas, DO†
Michael Mysh, MS‡
John Rutledge, MAS§
Raymond Dwyer III, BS, NRP, CHSE||
Scott Kansky, MBA, FP-C, MICP||
Section Editor: Scott Goldstein, MD
Morristown Medical Center, Department of Emergency Medicine, Morristown, New Jersey
University of Pittsburgh, Department of Emergency Medicine, Pittsburgh, Pennsylvania
Hackensack Meridian School of Medicine, Nutley, New Jersey
Atlantic Center for Research, Morristown, New Jersey
Atlantic Mobile Health, Florham Park, New Jersey
Submission history: Submitted July 24, 2025; Revision received December 12, 2025; Accepted January 7, 2026
Electronically published May 18, 2026
Full text available through open access at http://escholarship.org/uc/uciem_westjem DOI 10.5811/westjem.49101
Introduction: Foreign body removal for airway obstruction is an infrequent skill performed by paramedics, and Magill forceps for removal of a foreign body from the airway is reserved for patients with persistent obstruction. Traditional paramedic instruction uses direct laryngoscopy to visualize foreign body removal. Our objective in this study was to evaluate time to removal of an obstruction comparing hand position and hyperangulated video laryngoscopy vs direct laryngoscopy with Magill forceps.
Methods: A foreign body airway obstruction station was included in paramedics’ annual competency assessment over a two-year period as a quality improvement project. Paramedics were randomized to remove the foreign body with either direct laryngoscopy or hyperangulated video laryngoscopy with a handheld video laryngoscope. Our primary outcome measure was time from blade insertion to foreign body removal. The paramedics had further training regarding hand position prior to the second year’s annual competency assessment. After fitting a mixed-effects statistical model to the data, we included fixed effects of competency assessment year, device used, hand position, and random effect of paramedic. We evaluated the significance of these predictors on the dependent variable of time for removal.
Results: We observed 245 foreign body airway obstruction removals, 77 in year 1 and 168 in year 2. The direct laryngoscopy (n = 123) and hyperangulated video laryngoscopy (n = 122) groups were nearly equal. During year 1, hand position was noted to be an important factor for removal time, as paramedics were seen to use different hand positions. Recording of hand position began during year 1, which excluded 95 earlier observations from year 1. Competency training year was not a significant factor for time to removal. However, direct laryngoscopy was faster at 14.9 seconds [sec], (95% CI 12.9-17.1) than hyperangulated video laryngoscopy at 19.2 sec [16.9-22]; P < .001. Of the four possible hand positions, forceps grasped by the right thumb and either middle or fourth finger, with the hand in a handshake position, and with the forceps superior to the hand was associated with the shortest time to foreign body removal. This optimal hand position was significantly better than the other grasping methods, with a mean of 11.2 sec (95% CI, 10.2-12.4) vs underhand method, 17.5 sec (14.7-21); overhand method, 15.1 sec (10.7-21.2); and multiple positions (27.5 sec, 22-34.5); P < .001).
Conclusion: We found that hand positioning for Magill forceps significantly affected time to foreign body removal. In addition, direct laryngoscopy outperformed hyperangulated video laryngoscopy. Given these findings, training on removal of foreign body airway obstruction with Magill forceps should emphasize optimal hand positioning. Paramedics may also consider the use of direct laryngoscopy over hyperangulated video laryngoscopy in removal of these obstructions. Further research is required to validate these findings. [West J Emerg Med. 2026;27(3)709–714.]
INTRODUCTION
Foreign body removal for airway obstruction is an infrequent skill performed by paramedics. At our Advanced Life Support (ALS) agency, over the past five years there has been an average of four cases per year of foreign body airway obstruction requiring management by our paramedics, of about 14,000 ALS patient contacts per year. In cases of foreign body removal for airway obstruction, the use of Magill forceps is reserved for those with persistent obstruction, despite adequate first-line interventions. When Basic Life Support fails, ALS management includes removal of the visualized foreign body by laryngoscopy, advanced airway management, and cardiopulmonary resuscitation if indicated.1 Traditional paramedic instruction uses direct laryngoscopy to facilitate foreign body removal.
Magill forceps were initially developed to facilitate nasotracheal intubation.2 They are constructed with “a bend to clear the field of vision… the ends which grasp the catheter representing a cylinder split longitudinally and serrated on the inner surface.”3 Today, Magill uses have expanded to include removal of foreign body for airway obstruction in the unconscious patient by paramedics. Use of Magill forceps has been shown to be associated with favorable outcomes in foreign body obstruction refractory to the Heimlich maneuver and in out-of-hospital cardiac arrest due to presence of a foreign body.4-6 Our objectives in this study were to 1) compare the efficacy of direct laryngoscopy vs hyperangulated video laryngoscopy when using Magill forceps for foreign body removal for airway obstruction, and 2) assess the effect of hand position on time to removal with Magill forceps.
METHODS
Study Setting and Design
We conducted this study at a large, hospital-based emergency medical services (EMS) agency with over 150 paramedics in northern New Jersey. A foreign body airway obstruction station was included in annual internal competency training over a two-year period. All paramedics were assessed in technique for removal of a foreign body using simulation with a manikin in a skills lab. Participants were randomized into two cohorts for method of removal with Magill forceps: direct laryngoscopy and hyperangulated video laryngoscopy. Participants were given a set of Magill forceps and a direct laryngoscope Miller or Macintosh blade of their choice (direct laryngoscopy group) or a GlideScope Go device (Verathon Inc, Bothell, WA) (hyperangulated video laryngoscopy group) for retrieval.
For retrieval simulation, a cork was shaped to fit into a manikin’s tracheal opening above the vocal cords to simulate an airway foreign body. The cork was placed under direct visualization by researchers with good reproducibility. In rare instances where the cork was malpositioned into the trachea during the exercise, the manikin was reset and the retrieval
Population Health Research Capsule
What do we already know about this issue?
Current guidelines and paramedic instruction include foreign body airway obstruction removal with Magill forceps.
What was the research question?
We compared the efficacy of laryngoscope type and different hand positions when using Magill forceps for removal of foreign body airway obstruction
What was the major finding of the study?
Direct laryngoscopy removal at 14.9 seconds (12.9-17.1) was faster than hyperangulated video laryngoscopy at 19.2 sec (16.9-22), P < .001. The “handshake” position was optimal.
How does this improve population health?
Foreign body airway obstruction is a timesensitive condition. Proper techniques in using the Magill forceps can ensure timely foreign body removal.
was repeated. Year 1 data was collected during an annual skills competency assessment. Approximately 18 months later, year 2 data was collected at another annual skills competency assessment. Between year 1 and year 2 data collection, an educational intervention was delivered to all agency paramedics, with instruction focusing on technique when using Magill forceps. This quality improvement study was deemed exempt per the institutional review board, as it was developed with the aim of local improvement at our agency, based on system policy SOP-HRP-031 that states “a project does not meet the definition of human subject research if it is limited to program evaluation, quality improvement or quality assurance activities designed specifically to assess or improve performance within the department.”
Study Population
All agency paramedics were included in this study during annual training and were the majority of the participants. Other ALS clinicians such as critical care transport nurses (who also may work on 9-1-1 paramedic units) and flight team clinicians were also included in the training. A total of 172 paramedics were assessed in year 1 and 168 paramedics in year 2.
Data Collection and Analysis
Data collected included time for removal, visualization technique, hand position on Magill forceps, and documentation of whether there were multiple hand-position changes. Observation and interim analysis during year 1 suggested that hand positioning was an important variable; therefore, recording of this variable began approximately halfway through that competency session. Paramedics were randomized between the direct laryngoscopy and hyperangulated video laryngoscopy groups using a spreadsheet randomizer. The competency facilitator measured the time from blade insertion to foreign body removal using a smartphone stopwatch. Data was abstracted into an Excel spreadsheet (Microsoft Corporation, Redmond, WA) for analysis. A mixed-effects statistical model was fit to the data. Included in the statistical model were fixed effects (competency assessment year, device used, and hand position) and random effects (paramedic). The significance of these predictors on the dependent variable of time for removal was subsequently evaluated. P values < .05 were considered statistically significant. We used IBM SPSS Statistics v29 (International Business Machines Corporation, Armonk, NY) for all data analyses.
Educational Intervention
Paramedics were not trained on hand position for removal of foreign body for airway obstruction prior to data collection in year 1. Results from the initial analysis after year 1 demonstrated that different hand positioning produced varied results for time from blade insertion to foreign body removal, with a superior technique identified (see Figure 1). Therefore,
an educational intervention was developed that included a brief presentation discussing optimal hand positioning along with a hands-on skills station to reinforce the optimal technique. This intervention was delivered to paramedics at a skills session about 12 months prior to the year 2 annual competency training.
RESULTS
There were 245 valid observations over the two years of competency sessions. We excluded 95 paramedics from year 1 as hand position had not been recorded. The number of paramedics included in each laryngoscopy method group was nearly equal (direct laryngoscopy = 123; hyperangulated video laryngoscopy = 122). Four groupings of hand positions were noted during data collection: the optimal “handshake” position; overhand; underhand; and multiple positions (as further described in Appendix 1). See Table 1 for the dataset description.
The removal time data was not normally distributed; therefore, we performed a log transformation prior to analysis. Competency assessment year was not a significant predictor of time to complete the procedure (P = .53). Laryngoscopy device used and Magill forceps hand position were both significant predictors of time to complete the procedure. See Table 2 for the results.
The laryngoscopy device used was a significant factor in time to removal, with direct laryngoscopy removal at a mean of 14.9 seconds (95% CI, 12.9-17.1) compared to hyperangulated video laryngoscopy at 19.2 seconds (16.9-22), P < .001. The optimal “handshake” position significantly outperformed the other described methods, with a mean of 11.2 seconds (10.2-12.4) compared to the underhand position
Table 1. Paramedic observation data obtained during annual competency session in a study comparing hand position of Magill forceps and hyperangulated video laryngoscopy vs. direct laryngoscopy for foreign body removal for airway obstruction.
Figure 1. Optimal positioning of the Magill forceps in a study comparing hand position and use of hyperangulated video laryngoscopy vs direct laryngoscopy for foreign body removal for airway obstruction. HAVL, hyperangulated video laryngoscopy
Table 2. Mean time for foreign
(17.5 seconds, 14.7-21), overhand position (15.1 seconds, 10.7-21.2), and multiple positions (27.5 seconds, 22-34.5), P < .001 (Figure 2).
The mean time for removal was calculated for the optimal hand position based on laryngoscopy technique, including data from year 1 and year 2. For direct laryngoscopy, the mean time for removal with the optimal hand position was 9.82 sec (95% Cl 8.7-11.08). For hyperangulated video laryngoscopy, the mean time for removal was 12.48 seconds (11.16-13.95). Figure 3 shows direct laryngoscopy vs hyperangulated video laryngoscopy for all positions and the optimal position.
DISCUSSION
Information is limited on the correct technique and use of Magill forceps for removal of a foreign body obstructing the airway, and there is not a widely accepted standard or protocol for their use in EMS. Review of current literature showed reference documents that include indications for Magill forceps use in removal of foreign body from the airway, patient positioning, laryngoscopy technique, and removal technique.6, 7 We found a single EMS protocol that has images
of how to hold Magill forceps and demonstrates technique.8 One text notes the appropriate hand position and grip while using the forceps, although the technique described was used for nasotracheal intubation, rather than for removal of a foreign body from an obstructed airway.9 No studies were found that demonstrated specifically how to hold the Magill forceps for removal of foreign body from the airway. There are scholarly papers that demonstrate the utility of Magill forceps for the removal of a tracheal foreign body. One study, based in Osaka, Japan, found that the use of Magill forceps for out-of-hospital cardiac arrest due to foreign body obstruction was associated with neurologically favorable outcomes.4 Another study demonstrated that use of Magill forceps was successful in cases of foreign body aspiration refractory to the Heimlich maneuver.5 Additionally, there is a case report where Magill forceps were used for near-complete foreign body airway obstruction with respiratory distress.6 None of these articles describe the technique for holding and
time to removal of foreign body for airway obstruction using direct laryngoscopy vs hyperangulated video laryngoscopy ,with all hand positions compared to the optimal position. DL, direct laryngoscopy; HAVL, hyperangulated video laryngoscopy; sec, second.
body removal for airway obstruction based on fixed effects: year, device, and hand position.
hyperangulated video laryngoscopy.
Figure 2. Mean time to foreign body removal based on hand position of Magill forceps in a study comparing use of hyperangulated video laryngoscopy vs. direct laryngoscopy for foreign body removal for airway obstruction.
Figure 3. Mean
Optimal Hand Position and Laryngoscope Type to Remove Simulated Foreign Bodies
positioning the forceps.
One prior study compares the use of the Macintosh laryngoscope and the GlideScope device for removal of a hypopharyngeal foreign body.10 In that study, a lightly embalmed cadaver was used for simulation. The Macintosh blade (direct laryngoscopy) demonstrated superior efficiency for foreign body removal when compared to the GlideScope (hyperangulated video laryngoscopy). However, the study does not address the hand positioning of the paramedic attempting the extraction with Magill forceps. The GlideScope device has been demonstrated to be superior to DL for first pass success in endotracheal intubation.11 By policy, our paramedics use hyperangulated video laryngoscopy for all intubation attempts. Despite paramedic familiarity with hyperangulated video laryngoscopy, this did not lead to faster foreign body removal times with video assistance, compared to direct laryngoscopy. One consideration is that while video laryngoscopy is ideal for visualizing deeper airway structures, direct laryngoscopy may be better for visualizing the hypopharynx.
The importance of optimal hand positioning when using Magill forceps removal of foreign body from the airway is clear. Although Magill forceps have found their way into the toolbox of most EMS agencies, there has not been prior investigation into the most effective hand position for this infrequently used tool. The low frequency of cases that require extraction with the Magill forceps also makes it difficult to study in a prospective manner. The description of the optimal use and hand positioning as described can help to educate paramedics and guide the development of protocols for Magill forceps use in EMS.
LIMITATIONS
There are several limitations to this study. Because removal of a foreign body for airway obstruction is a rare procedure in the field, a training model was used. The use of manikins for this study limits external validity, given the variable and diverse presentations of foreign bodies causing airway obstruction that are seen in the field. The model used was reproducible to allow for accurate comparison; however, the composition of a true foreign body can be highly variable, and the use of a cork may not approximate real foreign bodies that are slippery and more difficult to grasp. To ensure standardization, the manikin’s head was placed in a neutral position prior to beginning the procedure. It is possible that neutral positioning could affect airway axis alignment and the ease of using direct laryngoscopy, although the paramedic could manually reposition the head to improve alignment. In addition, removal of a foreign body for airway obstruction is typically done on the floor, while this training was done with the manikin positioned on a table. Measurement bias may have been introduced by using an unblinded timing device. Additionally, hand positioning data was incomplete from year 1, as data was not collected for the
entire cohort, prior to identifying its importance. Also, it is possible that a small number of paramedics did not receive the educational intervention due to employee turnover. Although this study does not include patient-oriented outcomes, it can serve as a step toward establishing a standardized technique for the use of Magill forceps.
CONCLUSION
We found that direct laryngoscopy resulted in faster removal of a foreign body from the airway in comparison to hyperangulated video laryngoscopy. Paramedic hand position also had a significant impact on time to removal. Along with improving familiarity with the Magill forceps, it is important to train paramedics on a standard method for grasping the Magill forceps, as our research supports a superior technique (Figure 1). Further research is required to validate these findings.
Address for Correspondence: Michael Berkenbush, MD NRP, Morristown Medical Center, Department of Emergency Medicine, 100 Madison Ave, Morristown, NJ 07960. Email: michael. berkenbush@atlantichealth.org
Conflicts of Interest: By the WestJEM article submission agreement, all authors are required to disclose all affiliations, funding sources and financial or management relationships that could be perceived as potential sources of bias. No author has professional or financial relationships with any companies that are relevant to this study. There are no conflicts of interest or sources of funding to declare.
1. American Heart Association. Advanced Cardiovascular Life Support Provider Manual. Dallas, TX: American Heart Association; 2020.
2. Nickson C. Magill forceps. 2022. Available at: https://litfl.com/ magill-forceps/. Accessed February 16, 2025.
3. Magill IQ. Appliances and preparations. Br Med J. 1920;2:670.
4. Sakai T, Kitamura T, Iwami T, et al. Effectiveness of prehospital Magill forceps use for out-of-hospital cardiac arrest due to foreign body airway obstruction in Osaka City. Scand J Trauma Resusc Emerg Med. 2014;22:53.
5. Soroudi A, Shipp HE, Stepanski BM, et al. Adult foreign body airway obstruction in the prehospital setting. Prehosp Emerg Care. 2007;11(1):25-9.
6. Quiñones F, Saez M, Povatos EM, et al. Magill forceps: a vital forceps. Pediatr Emerg Care. 1995;11(5):302-3.
7. American Academy of Orthopaedic Surgeons. Advanced emergency care and transportation of the sick and injured: using Magill forceps.
Berkenbush et al.
Optimal Hand Position and Laryngoscope Type to Remove Simulated Foreign Bodies
2015. Available at: http://samples.jbpub.com/9780763779306/ additionalSkills/Using%20Magill%20Forceps.pdf. Accessed February 16, 2025.
8. Queensland Ambulance Service. Clinical practice procedures. 2020. Available at: 2020_DCPM_170120.pdf. Accessed February 16, 2025.
9. Hagberg CA, Artime CA, Aziz MF. Laryngoscopic orotracheal and nasotracheal intubation. In: Hagberg and Benumof’s Airway Management , 3rd ed. Philadelphia, PA: Elsevier; 2013:346-58.
Berkenbush et al.
10. Je SM, Kim MJ, Chung SP, et al. Comparison of Glidescope® versus Macintosh laryngoscope for the removal of a hypopharyngeal foreign body: a randomized cross-over cadaver study. Resuscitation. 2012;83(10):1277-80.
11. Silverberg MJ, Li N, Acquah SO, et al. Comparison of video laryngoscopy versus direct laryngoscopy during urgent endotracheal intubation: a randomized controlled trial. Crit Care Med. 2015;43(3):636-41.
Original Research
Physician-staffed Ambulance Deployment: Comparative Response Time Analysis from a Slovak Pilot Project
Marian, Sedlak, MD*†
Tomas, Petras, MD‡
Imrich, Berta, MD§
Gaston, Ivanov, MD|| Jozef, Karas, MD||
Záchranná služba Košice, Košice, Slovak Republic
Pavol Jozef Safarik University and Louis Pasteur University Hospital, Department of Trauma Surgery, Košice, Slovak Republic
Pavol Jozef Safarik University, Medical Education Centre, Košice, Slovak Republic Institute for Healthcare Analyses, Ministry of Health of the Slovak Republic, Bratislava, Slovak Republic
Health Section, Ministry of Health of the Slovak Republic, Bratislava, Slovak Republic
Section Editor: JR R. Pickett, MD
Submission history: Submitted September 09, 2025; Revision received September 30, 2025; Accepted January 14, 2026
Electronically published May 19, 2026
Full text available through open access at http://escholarship.org/uc/uciem_westjem DOI 10.5811/westjem.52829
Introduction: Efficient allocation of physician-staffed emergency medical services (EMS) is crucial for optimal resource use in urban prehospital systems. The rendezvous model differs fundamentally from the traditional ambulance model: It deploys a lighter, nontransport-capable, passenger vehicle that may offer operational advantages, although comparative evidence with regard to traditional models remains limited. In this study we aimed to evaluate the impact of a physician-staffed rendezvous model on response times and physician-staffed crew availability within the EMS system in Košice, Slovak Republic.
Methods: We conducted a retrospective, cross-sectional study, analyzing all primary responses by physician-staffed EMS units in the Košice region from January 2023–March 2025. In August 2024, one of three traditional, physician-staffed transport units was replaced by a physician-staffed rendezvous unit, yielding a post-intervention system with two transport units and one rendezvouz unit, a faster, physician-staffed non-transport vehicle that provides specialized medical care on scene. We extracted time intervals in minutes—response time, time on scene, time to transport initiation, and total time until crew availability—from the national EMS database and compared them to the pre- and post-introduction of the rendezvous model. We analyzed data using non-parametric statistical tests (Mann-Whitney U test, Kruskal-Wallis test), and we conducted a multivariable ordinary least squares regression to adjust for potential confounders.
Results: Of 11,347 eligible cases, 11,094 met the inclusion criteria (8,389 patients treated during the pre-intervention period and 2,705 during the post-intervention period). Of these, 488 patients (4.4% of the overall cohort and 18.0% of the post-intervention cases) were managed by the rendezvous unit. Following rendezvous unit implementation, the mean response time was reduced compared to that of the standard physician-staffed transport units (–0.77 minutes per response; P < .001). The rendezvous unit demonstrated reductions in time to crew availability across districts, with absolute decreases ranging from 11.12 to 18.01 minutes; these differences were statistically significant in all districts except the undefined/border region (P < .001 for each comparison). The time spent on scene was slightly longer for the rendezvous unit in most districts, although these differences did not reach statistical significance. The time to transport initiation showed mixed trends. Ordinary least squares regression confirmed the independent association between rendezvous unit implementation and shorter response times.
Conclusion: Replacing a standard physician-staffed ambulance with a lighter, faster, non-transport rendezvous vehicle improved operational efficiency by reducing response times and expediting physician-staffed crew availability. These findings suggest that the rendezvous model can enhance system-level performance in urban EMS settings by supporting more flexible physician deployment and informing decisions on resource allocation within tiered prehospital systems. [West J Emerg Med. 2025;27(3)715–724.]
Models of Physician-staffed Ambulance Deployment: Analysis from a Slovak Pilot Project
INTRODUCTION
Emergency medical services (EMS) worldwide face increasing pressure to deliver timely care amid rising call volumes, constrained resources, and growing urban congestion. Optimizing the deployment of advanced prehospital resources, particularly physician-staffed units, has become a critical operational challenge for modern EMS systems. The EMS network in the Slovak Republic comprises 328 strategically located ambulance stations, functioning within a two-tiered care system—crews with physicians and crews with paramedics—covering both ground and air transport services.1
Physician-staffed responses represent a minority of total EMS activations and are primarily reserved for the most severe or diagnostically complex cases, where advanced decision-making and invasive interventions may be required. These crews are authorized to perform advanced interventions beyond the paramedic scope of practice, including advanced airway management, procedural sedation, administration of a broader range of pharmacologic agents, and complex clinical decision-making regarding on-scene management vs transport strategy. Paramedic-staffed ambulances provide the backbone of prehospital care and are staffed by highly trained EMS professionals capable of delivering Advanced Life Support, including defibrillation, basic airway techniques, and initial stabilization of critically ill or injured patients prior to hospital transport.
The ground EMS system is primarily composed of standard ambulance crews operating stretcher-capable emergency vehicles (approximately 3.5 tons), equipped for full prehospital care and patient transport. Both physicianstaffed and paramedic-staffed crews use these type C emergency vehicles. In August 2024, as part of a pilot project, the rendezvous system was launched at three locations in the Slovak Republic 2 The rendezvous model is a two-tiered prehospital emergency care approach in which a physicianstaffed unit (or in some countries “a physician-staffed rapid response vehicle”) is dispatched separately to meet with a standard paramedic ambulance crew at the scene. This system allows for targeted deployment of advanced medical expertise, improving physician resource allocation while maintaining rapid response capabilities.3
Paramedic crews provide initial care in collaboration with the rendezvous unit, and hospital transport—if needed—can proceed with or without rendezvous involvement.4 Unlike standard physician- and paramedic-staffed crews, rendezvous units typically use passenger-type vehicles without transport capability, focusing instead on providing rapid, physicianlevel intervention (Figure 1). Although models with permanently assigned physician-staffed crews operating a large, transport-capable vehicle and the rendezvous system are well-established and frequently used in practice—either independently or concurrently—systematic scientific
Population Health Research Capsule
What do we already know about this issue?
Physician-staffed EMS units may improve care for critical patients, but optimal deployment models to maximize response remain unclear.
What was the research question?
Does replacing a standard 3.5-ton emergency transport vehicle with a smaller rendezvous vehicle influence EMS response times and crew availability?
What was the major finding of the study?
Rendezvous implementation reduced response time by 0.77 minutes (95% CI, −1.01 to −0.53; P < .001) vs standard EMS transport.
How does this improve population health?
Faster physician response and shorter mission cycles may increase EMS availability, improving access to advanced care without additional staffing.
comparison in terms of effectiveness and impact on patient care remains limited in the literature. Our primary aim in this study was to analyze the impact of introducing a rendezvous crew into the prehospital EMS of the Košice region, Slovak Republic, on the time parameters of EMS responses. We hypothesized that the physician in a smaller, non-transportcapable vehicle that brings the physician-staffed crew to the prehospital scene would arrive faster than if the physician rode in the ambulance transport vehicle, and that the physicianstaffed rendezvous crew would be available for the next deployment sooner.
METHODS Setting
We conducted a retrospective, observational, crosssectional study analyzing all primary responses by physicianstaffed EMS crews in the Košice region, Slovak Republic, from January 2023–March 2025. The EMS Command and Control Centre of the Slovak Republic is a state-funded institution established by the Ministry of Health. It is organized into eight regional dispatch centres that operate under unified protocols and a shared information and communication technology infrastructure. Three stretchercapable, physician-staffed ambulance units operate in the
1. Comparison of vehicles used in a study of physicianstaffed EMS in the Slovak Republic: on the left a smaller, faster “rendezvous” unit (Škoda Karoq), and on the right a standard emergency response vehicle (Mercedes Benz Sprinter).
the following time data: response times of 0 or 1 minute (due to cancellations or logging errors); response times > 60 minutes; or total response time duration > 180 minutes.
Methodology
We extracted cases from the electronic database of the EMS Command and Control Centre, which is publicly accessible in accordance with the applicable legislation on access to information from public sources. Time parameters are recorded manually by crews and entered electronically using the “Fleet on Board” application (DATACAR, spol. s r.o., Slovak Republic). Upon receiving a dispatch call, the crew confirms the time of departure by pressing a button in the automatic vehicle location system. Arrival at the patient’s location is similarly confirmed. If transport is required or the crew becomes available for the next assignment, the appropriate status is selected in the same system. All timestamps are electronically logged and stored by the dispatch center.
Košice region. While these units are primarily assigned to defined administrative districts, they may be dispatched outside their usual areas of service based on operational demand and closest unit availability, consistent with standard EMS dispatch practices. The rendezvous system was introduced in the study’s location in August 2024, when one standard physician-staffed transport-capable ambulance was replaced by a rendezvous unit.
Objectives
The primary objective was to assess the impact of the rendezvous system on operational time parameters for physician-staffed EMS responses. Our primary outcome measure was response time to the patient’s location. Secondary outcomes included time spent on scene, time to transport initiation, and total time until physician-staffed crew availability. Appendix 1 presents technical specifications of the vehicles and stations used during the study period. Vehicles with transport capacity complied with the European technical standard EN 1789.5
Inclusion Criteria
We included all primary emergency responses by the three physician-staffed EMS units in the Košice region (Sever, Západ, Staré Mesto) between January 2023–March 2025.
Exclusion Criteria
We excluded responses outside the Košice districts and responses cancelled by the EMS Command and Control Centre (eg, 0- or 1-minute response intervals). We excluded
To analyze and compare the impact of introducing the rendezvous crew into the EMS system, we divided the collected data into two periods: before and after the project’s implementation. For both periods, we performed an analysis of several operational time metrics. We defined response time to patient’s location as the time from dispatch order issued by the telecommunicator to the crew until arrival at the scene. The time spent with the patient on scene was measured from the crew’s arrival and the start of transport, or from the crew’s departure when transport was not necessary. We defined time to initiation of transport as the interval between crew arrival and start of transport (applicable only for cases requiring hospital transport). Finally, we measured the interval until the crew became available for the next dispatch—from dispatch order to the moment the crew was available for a new assignment—representing the entire operational cycle.
This study follows the “Strengthening the Reporting of Observational Studies in Epidemiology” guidelines and published recommendations for medical record review studies in emergency medicine.6 We applied explicit case selection criteria, with predefined inclusion and exclusion rules. All operational time intervals were clearly defined a priori. We obtained data from the national EMS Command and Control Centre electronic database, which uses a standardized application for timestamp entry by EMS crews. Because data abstraction was based on a uniform electronic system, no manual abstractors were employed and, thus, issues of abstractor training, performance monitoring, and interobserver reliability did not apply. The EMS crews entering timestamps were unaware of this study’s objectives. The sampling strategy involved all consecutive, physician-staffed responses during the defined study period, with exclusions for erroneous or incomplete records. Missing data were handled through complete case analysis, with predefined rules for exclusion of
Figure
Models of Physician-staffed Ambulance Deployment: Analysis from a Slovak Pilot Project
implausible values. We performed data analysis in May and June 2025. The Emergency Medical Services Command and Control Centre of the Slovak Republic (RZ 3090/2025) approved use of this data for our study.
Data Analysis
We calculated time intervals using electronic timestamps recorded by EMS crews through the automatic vehicle location system. Only missions meeting the predefined inclusion criteria were included in the analysis. Categorical variables are reported as absolute counts and percentages, while time-based variables are presented in minutes. Continuous variables are reported as means with standard deviations or medians with interquartile ranges, as appropriate. The Shapiro-Wilk test indicated nonnormal distributions for key variables. Differences in time parameters between the pre- and post-intervention periods (standard transport-capable ambulance vs fast-car rendezvous) were analyzed using the Mann-Whitney U test, with effect sizes expressed as rank-biserial correlation (rₑ). We used a Kruskal–Wallis test, as a non-parametric equivalent of one-way ANOVA, to compare physician-staffed EMS units across the six administrative districts of Košice, both before and after implementation of the rendezvous system.
Effect sizes for these comparisons are reported using epsilon squared (ε²). To adjust for potential confounding factors influencing response time, we calculated a multivariable ordinary least squares regression analysis. The outcome variable was the response time l from crew departure to arrival at the patient’s location, measured in minutes. The model included fixed effects for EMS crew, district, month, and dispatch priority, as well as a binary indicator (postAugust 2024) capturing the effect of introducing the rendezvous model. Missing values were handled using a complete case analysis approach. No data imputation was performed, given the large volume of valid records, which ensured sufficient statistical power for most comparisons. A P value < .05 was considered statistically significant. We conducted analyses using JASP software v0.19.1 (University of Amsterdam, Netherlands), and ordinary least squares regression analysis in Python using the statsmodels package v0.14.2 (Python Software Foundation, Wilmington, DE).
RESULTS
The inclusion criteria initially identified 11,347 cases for potential enrollment. Following review of the dataset, we excluded 253 cases: 14 due to responses outside the Košice region, and 239 due to erroneous time data samples. We included 11,094 cases in the final analysis (Figure 2).
Prior to implementation of the rendezvous model, physician-staffed transport units across all three districts demonstrated broadly comparable response intervals, on-scene times, and overall crew availability, with modest inter-district variation (Table 1). Following replacement of the physician-
staffed standard transport unit with a rendezvous crew, response times across districts were slightly reduced, while on-scene and transport-initiation intervals increased modestly across all unit types. The most pronounced operational change was observed in availability of physician-staffed crews. After rendezvous implementation, the mean time-to- physician availability for the Sever district unit decreased substantially, whereas corresponding availability times increased in the Staré Mesto and Západ districts during the same period (Table 1).
To evaluate the impact of rendezvous implementation, we compared response times of standard transport units across six administrative districts of Košice, both before and after the system change. Before implementation, statistically significant differences in response intervals among the three standard transport units (Sever, Staré Mesto, and Západ) were found in five of the six districts (all P < .001), with effect sizes (ε²) ranging from small (0.032 in the Košice-okolie district) to moderate (0.117 in Košice 2). The only district without significant differences was Košice 3 (P = .81). After implementation of the smaller, faster rendezvous unit, differences in response intervals remained statistically significant in five of the six districts, with Košice 3 demonstrating the largest effect size (ε² = 0.245). The only district without significant differences post-intervention was Košice-okolie (P = .65). The rendezvous unit consistently demonstrated shorter response intervals compared to the traditional transport units, particularly in Košice 1 and Košice 4 (Table 2).
Comparisons between the pre-intervention standard transport unit in Sever and the post-intervention rendezvous crew demonstrated consistent operational changes across most districts of Košice. Following implementation of the rendezvous model, response intervals were significantly shorter in all defined districts, with the largest relative improvements observed in Košice 2 and Košice 3 (absolute reductions of 2.64 and 2.15 minutes, and large effect sizes rₑ = 0.616 and 0.419, respectively). No statistically significant change was detected in the undefined/border region (Table 3).
Figure 2. Flowchart of case selection and exclusions in a study of physician-staffed emergency medical services in Košice, Slovak Republic.
Sedlak et al.
Models of Physician-staffed Ambulance Deployment: Analysis from a Slovak Pilot Project
Table 1. Comparison of different time parameters and intervals of physician-staffed ambulanced before and after introduction of the rendezvous system in a study of physician-staffed emergency medical services in the Košice region, Slovak Republic.
Before introduction of rendezvous system
Response interval to patient’s location:
Interval spent with the patient on scene:
Interval to transport initiation from the scene:
Interval until crew is available for the next dispatch:
After introduction of rendezvous system (mixed physician-staffed transport and rendezvous units)
Models of Physician-staffed Ambulance Deployment: Analysis from a Slovak Pilot Project
The most substantial and uniform effect of RV deployment was observed in physician-staffed crew availability. Across all districts except the undefined/border region, the interval from mission start to availability for the next dispatch was significantly shorter for the RV Sever crew compared with the prior RLP model, with reductions exceeding 10 minutes in each district and the greatest absolute decreases occurring in Košice-okolie, Košice 3, and Košice 2 [reduction in Košiceokolie (–18.01 minutes, rₑ = 0.444); followed closely by Košice 3 (–16.27 minutes, rₑ = 0.458) and Košice 2 (–15.74 minutes, rₑ = 0.442)]. In contrast, mean on-scene time was consistently longer for the RV Sever crew across all districts; however, these differences were modest in magnitude and did not reach statistical significance (ranging from +0.94 minutes in Košice 1 to +4.42 minutes in Košice 2, with intermediate increases of +3.72 minutes in Košice 3 and +1.65 minutes in Košice 4). Similarly, intervals from dispatch to transport initiation showed mixed, district-specific patterns, with small increases in some areas and modest reductions in others, none of which demonstrated a consistent or statistically significant trend. Detailed district-level measurements are provided in Table 3.
To adjust for potential confounding factors influencing response intervals, we conducted a multivariable ordinary
least squares regression analysis. The outcome variable was the response interval from crew departure to arrival at the patient’s location, measured in minutes. The model included fixed effects for EMS crew, district, month, and dispatch priority, as well as a binary indicator (post-August 2024) capturing the effect of introducing the rendezvous model. The overall model fit was acceptable (adjusted R² = 0.286), indicating that approximately 29% of the variance in response time was explained by the included predictors. Dispatch priority categories (compared to reference category “K”critical; included “N” - urgent calls; and “M” - less urgent calls) were not significantly associated with differences in response time, suggesting that dispatch procedures in Košice did not systematically favor higher priority calls in terms of speed once other variables were accounted for. The implementation of the rendezvous system was associated with a statistically significant reduction in response time of –0.77 minutes (P < .001, 95% CI, –1.013 to –0.525), in comparison with all other relevant physician-staffed units, after adjusting for other covariates (Table 4).
DISCUSSION
We evaluated the operational impact of implementing a physician-staffed, smaller, faster rendezvous vehicle on
Districts
Republic.
Before introduction of rendezvous system (standard transport units only)
Table 2. Response time of physician-staffed crews to the individual districts of Košice in a study of physician-staffed emergency medical services in the Košice region, Slovak
Sedlak et al.
Models of Physician-staffed Ambulance Deployment: Analysis from a Slovak Pilot Project
Table 3. Comparison of operational intervals for standard transport vs. rendezvous units, stratified by districts of Košice in a study of physician-staffed emergency medical services in Slovak republic.
Comparison between standard transport and rendezvous unit Response intervals stratified by districts of Košice
Comparison between standard transport and rendezvous Sever units Interval until crew is available for the next dispatch stratified by districts of Košice
2,807 488
Interval
Comparison between standard transport and rendezvous Sever units Interval to transport initiation stratified by districts of Košice
RLP, standard transport unit; RV, passenger car rendezvous unit; re, random effects.
(ref: K)
Crew (ref: RLP Server)
District (Ref: Košice 1)
Košice 2
Košice 3
Košice 4
Month Fixed Effects Included (not displayed)
Post-Intervention (Aug 2024+)
RV implemented
Model summary: N = 10,687; R2 = 0.287; Adjusted R2 = 0.286
prehospital time parameters within the EMS system in Košice region, Slovak Republic. The rendezvous model was associated with a statistically significant reduction in response interval to patient location across most districts of Košice. While the overall regression-adjusted reduction in response time was -0.77 minutes (95% CI, -1.013 to -0.525), the absolute reductions observed at the district level ranged from 1.46-2.64 minutes. Post-intervention, modest reductions in response times were observed in nearly all physician-staffed crews, suggesting an effect that extended beyond the rendezvous Sever pilot unit. Implementation of the rendezvous unit likely improved response times of all standard transport units by redistributing workload, enhancing coverage flexibility, and enabling more targeted deployment of physician-level resources across overlapping districts; the exact mechanisms, however, require further study to be confirmed.
Although the observed reductions in response intervals were statistically significant, they should be interpreted primarily as indicators of operational efficiency rather than as direct evidence of improved patient outcomes. Evidence linking modest reductions in EMS response times to improved clinical outcomes is strongest for out-of-hospital cardiac arrest, whereas data supporting outcome benefits in other emergency conditions, including trauma, remain inconsistent or limited.7-9 The enhanced flexibility and better maneuverability capabilities of the lighter and smaller rendezvous vehicle may contribute to improved scene access,
particularly in densely built or traffic-congested urban areas. The rendezvous unit was consistently faster in completing the entire operational cycle (from dispatch to availability for the next call), with reductions in total job time ranging from 11.12-18.01 minutes. This reflects greater system efficiency with a potential to increase EMS resource availability without additional staffing.
The largest reductions were seen in Košice-okolie and Košice 3, again pointing to the rendezvous model’s operational advantages in urban and peri-urban areas. The reduced interval until crew becomes available for the next dispatch is particularly relevant in resource-limited systems, where optimal crew utilization can directly impact populationlevel emergency coverage and physicians are more likely to be available for patients, who need their interventions the most. Modest reductions per mission in response and availability intervals (1-2 minutes) accumulate over hundreds of monthly missions, yielding several hours of additional operational capacity. This increased availability could help reduce queued calls during peak demand and improve overall system responsiveness.
Interestingly, the time interval spent with patients on scene was longer for the rendezvous crew compared to the standard transport crew in nearly all districts. The largest absolute differences were observed in Košice 2 (+4.42 minutes) and Košice 3 (+3.72 minutes), although neither reached statistical significance (P = .19 and P = .15, respectively). Across all districts, none of the observed
Table 4. Multivariable ordinary least squares regression analysis of factors associated with response times in a study of physicianstaffed emergency medical services in the Košice region, Slovak Republic.
Sedlak et al.
Models of Physician-staffed Ambulance Deployment: Analysis from a Slovak Pilot Project
differences reached statistical significance, despite meaningful numeric differences. Effect sizes were uniformly small, indicating only modest shifts in distribution. The trend toward longer scene intervals may reflect more comprehensive assessments or advanced interventions performed by the rendezvous unit physician, especially when a handover to the transporting paramedic crew is required. This aligns with the conceptual design of the rendezvous system, which prioritizes dispatch for the most severe cases, and a flexible, targeted deployment of physician expertise over transport speed.
A more detailed investigation and breakdown of the crew’s on-scene activities during patient care would be necessary to analyze the reasons for longer scene times. In contrast, interval to transport initiation did not demonstrate a consistent directional change between RLP and RV crews. Some districts (e., Košice 1) had longer initiation times for rendezvous crews, while others (eg, Košice 3, Košice-okolie) showed slightly faster performance. None of these differences reached statistical significance. The variability across districts may reflect local operational practices, differing scene complexities, or variable collaboration dynamics between physician and paramedic crews. The absence of a uniform pattern reinforces the idea that transport initiation time is multifactorial and likely influenced by factors beyond a crew type alone. The implementation of the rendezvous system was associated with a statistically significant reduction in response interval of -0.77 minutes (P < .001, 95% CI, -1.013 to -0.525), after adjusting for other covariates. This supports the hypothesis that the rendezvous model offers a more timeefficient deployment mechanism for physician-staffed units in the urban EMS context.
LIMITATIONS
This study has several limitations that should be considered when interpreting the results. Its retrospective and observational nature precludes the establishment of causal relationships between the implementation of the rendezvous system and changes in EMS response intervals. One of the main challenges is the impracticality of randomizing emergency responses under real-world, prehospital-care conditions, which limits the ability to obtain robust causal evidence. While temporal comparisons were made before and after rendezvous initiation, there may be potential confounding factors influencing the data (eg, changes in staff composition, traffic patterns, or seasonal variation). Although comparisons were made between pre- and postimplementation periods, there may have been confounding variables influencing the results, such as changes in staff composition, traffic conditions, or seasonal variation. We attempted to mitigate their effect through the ordinary least squares regression analysis.
While efforts were made to ensure data quality, the study relied on a routinely collected operational dataset, which may
be subject to inaccuracies in time logging. Despite excluding clearly erroneous data through defined criteria, some inaccurate entries may have remained in the final dataset. Although we examined multiple time parameters and intervals, we did not assess clinical outcomes, patient severity, or final diagnoses. Therefore, we could not determine whether observed changes in time metrics had any impact on patient care or outcomes. Additionally, the lack of imputation for missing data may have introduced bias if the data were not missing completely at random, although the large volume of complete cases likely reduced this risk. Lastly, the sample size for the rendezvous crew was considerably smaller than standard transport crews, particularly in certain districts, which may have limited the statistical power to detect small but clinically meaningful differences, even when absolute differences were notable.
Generalizability
The findings of this study reflect EMS operations in the Košice region, Slovak Republic, which is characterized predominantly as an urban setting with a structured two-tier EMS system. This context may limit the generalizability of the results to other regions, especially those with different geographic, staffing, or operational and dispatch characteristics. However, the operational model examined— adding a physician-staffed rendezvous crew while maintaining existing physician-staffed standard transport units—is not unique to Košice. It may be relevant to other EMS systems exploring hybrid or tiered response strategies; however, extrapolation to systems with fundamentally different prehospital structures should be undertaken with caution, and further research in diverse settings is needed to strengthen the external validity of these findings.
CONCLUSION
Our findings provide novel and relevant insights into the comparative performance of traditional physician-staffed crews with large, transport-capable ambulances, and a lighter, rendezvous model without transportation capacity, in the context of Slovak Republic. The rendezvous model was associated with shorter response intervals, improved crew availability, and enhanced operational efficiency. These findings highlight the potential of rendezvous systems to optimize physician deployment in urban EMS settings without requiring additional staffing. To our knowledge, this is the first data-driven evaluation of rendezvous implementation and contributes to the limited body of literature on hybrid EMS models. The results offer empirical support for expanding rendezvous deployment in comparable EMS environments as a strategy to improve operational efficiency. However, further research incorporating patientcentered clinical endpoints will be required to determine whether these operational gains translate into improved
Models of Physician-staffed Ambulance Deployment: Analysis from a Slovak Pilot Project Sedlak et al.
outcomes, and to better understand the cost-effectiveness and team-based implications of RV integration within broader EMS systems.
Address for Correspondence: Marian Sedlak, MD, Faculty of Medicine, Department of Trauma Surgery, Pavol Jozef Safarik University and Louis Pasteur University Hospital, Kosice, Slovak Republic, Rastislavova 43, 04001 Košice, Slovak Republic, marian.sedlak.md@gmail.com.
Conflicts of Interest: By the WestJEM article submission agreement, all authors are required to disclose all affiliations, funding sources and financial or management relationships that could be perceived as potential sources of bias. No author has professional or financial relationships with any companies that are relevant to this study. There are no conflicts of interest or sources of funding to declare.
1. Operačné stredisko záchrannej zdravotnej služby Slovenskej republiky. Ako funguje ZZS. 2025. Available at: https://155.sk/ ako-funguje-zzs/. Accessed October 6, 2025.
2. Jankovič P, Jánošíková Ľ, Kvet M, et al. Optimizing the fleet of emergency medical service vehicles. IISE Transactions. 2024;57(8):890-904.
3. Masek J, Prochazka M, Seneta L. Pre-hospital emergency care (“PEC”) in the Czech Republic: changes in the PEC organization— personnel and economic connections. Econ Business J. 2015;9(1):290-295.
4. Oelrich R, Kjoelbye JS, Rosenkrantz O, et al. 2022. Rendezvous between ambulances and prehospital physicians in the Capital Region of Denmark: a descriptive study. Scand J Trauma Resusc Emerg Med. 2022;30(1):52.
5. European Committee for Standardization. 2023. EN 1789:2020+A1:2023 Medical Vehicles and Their Equipment—Road Ambulances
6. Worster A, Bledsoe RD, Cleve P, et al.Reassessing the methods of medical record review studies in emergency medicine research. Ann Emerg Med. 2005;45(4):448-451.
7. Swan D, Baumstark L. Does every minute really count? Road time as an indicator for the economic value of emergency medical services. Value Health. 2022;25(3):400-408.
8. Holmén J, Herlitz J, Ricksten S, et al. Shortening ambulance response time increases survival in out-of-hospital cardiac arrest. J Am Heart Assoc. 2020;9(21):e017048.
9. Wilde ET. Do emergency medical system response times matter for health outcomes? Health Econ. 2012;22(7):790–806.
Contraception in the ED: Understanding Education and Opportunities for Clinicians to Advise Patients
Hannah B. Lewis, BA*o
Teagan R. McCarthy, BS*o
Dara Kass, MD†
Jennifer L. Kahoud, MD‡
Section Editor: Elisabeth Calhoun, MD, MPH
Thomas Jefferson University, Sidney Kimmel Medical College, Philadelphia, Pennsylvania
Saint Francis Hospital, Department of Emergency Medicine, Hartford, Connecticut
Thomas Jefferson University Hospital, Department of Emergency Medicine, Philadelphia, Pennsylvania Co-first authors
Submission history: Submitted June 1, 2025; Revision received December 6, 2025; Accepted December 6, 2025
Electronically published April 8, 2026
Full text available through open access at http://escholarship.org/uc/uciem_westjem DOI 10.5811/westjem.48376
Introduction: The United States faces a high rate of unwanted pregnancies. Despite this, many people continue to face barriers to accessing contraception. The emergency department (ED) can help bridge these gaps, but emergency clinicians must first feel comfortable offering contraceptive services. In this study, we sought to determine emergency clinician comfort in prescribing contraceptives and educating patients on their use. We also gauged clinician interest in receiving education specifically geared toward contraceptive care.
Methods: We conducted an online survey of ED residents, attendings, and advanced practice clinicians at Thomas Jefferson Univerity Hospital and affiliates in both the urban and suburban setting. Questions focused on current practices and interest in an educational session on contraceptive care in the ED.
Results: We received 106 responses representing clinicians from 12 hospitals (estimated response rate 20%). While 61% of respondents reported that they offered contraceptive services less than once a month, 64% reported they were comfortable educating patients on the topic and 51% were comfortable providing prescriptions. Of those comfortable prescribing, 84% stated they would be more comfortable after an educational session, while 58% of those currently not comfortable prescribing believed that education would help (P < .01). Perceived benefit of education was also dependent on age, with clinicians < 35 years of age more likely to perceive a benefit (P < .01), and job title, with residents more likely to perceive a benefit (P = .04).
Conclusion: Our data suggest that many emergency clinicians are open to offering contraceptive services, but lack of education may serve as a barrier. Although limited by self-selection bias, this study demonstrates a robust interest in overcoming this barrier within our sample group. Future work will aim to implement clinician education and assess for translation to clinical practice with the goal of increasing access to contraceptive services. [West J Emerg Med. 2026;27(3)725–730.]
INTRODUCTION
Over 40% of all pregnancies in the United States are unintended.1-3 Only 5% of these pregnancies occur in women who correctly use contraceptives, indicating that improving access to and education about contraception may reduce rates of unintended pregnancy.2 Preventing unintended pregnancy reduces morbidity and mortality related to birth while
improving women’s access to education, workforce participation, and overall economic stability.4,5 Additionally, interventions aimed at improving contraceptive access can reduce government spending resulting from unintended births, which has amounted to $12.5 billion in a single year.5 The overturning of Roe v Wade by the U.S. Supreme Court in 2022 has accelerated the need for such interventions as more
individuals will be legally compelled to carry unintended pregnancies to term.
One approach to increasing access may be offering contraception in the emergency department (ED). There are 6,000 EDs in the U.S., which see approximately 130 million people per year.6 People of childbearing age may account for > 20% of these visits.7 With an “open-door” policy and 24-hour services, the ED has the potential to reach patients who may otherwise lack access to contraception and, therefore, be at higher risk for unintended pregnancy. Interventions in the ED have proven to be successful in response to other areas of unmet public health needs.8-10 Offering contraception in the ED could be an effective way to increase access and prevent unintended pregnancies.
Potential barriers to this approach include knowledge gaps among clinicians and current attitudes about scope of emergency medicine (EM) practice. Research on this topic in the field of EM is lacking, but studies in other nongynecological specialties show opportunities to close knowledge gaps that may serve as a barrier to care.11,12 These studies, focused on residents in internal medicine and other primary care specialties, show contraceptive knowledge is both objectively and subjectively inadequate.11,12 Furthermore residents attribute their lack of providing contraceptive counseling in practice to these inadequacies.11 The potential need for emergency clinician education and receptiveness to such education must be addressed before any interventions can be implemented.
Our objective in this study was to determine emergency clinicians’ comfort levels in offering ED-based contraceptive care and to evaluate their interest in receiving further education on the topic. Results will inform future efforts to support contraceptive services in the ED.
METHODS
Study Design
This study consisted of a 14-question, online questionnaire (Qualtrics International Inc, Provo, UT) sent by electronic mail to listservs of emergency clinicians at Thomas Jefferson Univerity Hospital and its affiliates between June–August 2023. The emails lists were provided by the ED coordinators at each location. Approximately 500 questionnaires were sent out. No reminder emails were sent or incentives offered. It was approved by the Thomas Jefferson Univerity Hospital Institutional Review Board as an exempt protocol. Consent was obtained as part of the questionnaire before proceeding with the study questions.
Study Population
Eligible participants were active clinicians at 12 clinical sites at or affiliated with Thomas Jefferson Univerity Hospital. The sites included three urban and nine suburban institutions consisting of both Level I and II trauma centers spanning the
Population Health Research Capsule
What do we already know about this issue? Increased contraceptive access can alleviate morbidity and mortality associated with unintended pregnancy, but knowledge gaps prevent clinicians from offering these services.
What was the research question? How comfortable are ED clinicians in prescribing contraceptives and is there interest in further education?
What was the major finding of the study? Contraception is rarely offered in the ED; 70% of clinicians believe education would increase current prescription practices.
How does this improve population health? By preventing unintended pregnancies, increased contraceptive access may reduce maternal morbidity and mortality and improve economic stability.
states of Pennsylvania, Delaware, and New Jersey. Clinicians included attending physicians, residents, and advanced practice practitioners (APP).
Survey Development and Measures
The survey was designed to capture knowledge, attitudes, and current practices with regard to contraception in the ED. Initial questions were created around these domains. The survey was developed iteratively with review by experts in EM, including review for comprehension and responder burden. Questions covered the following topics: current prescribing practices; comfort offering contraceptive services; perceived benefit of further education; and content and format preferences for education. Clinicians were also asked to complete basic demographic questions. The final survey is included as Supplement A.
Three questions addressed comfort in educating patients on birth control options, prescribing birth control, and calling consults for birth control prescriptions. Those who indicated they were comfortable prescribing birth control were asked to select which forms they felt comfortable prescribing (oral contraceptive pills, contraceptive patch, vaginal ring, contraceptive implant, intrauterine device [IUD], or injectable Depo-Provera). Clinicians were then asked to indicate whether they believed their comfort in educating or prescribing would change following an educational session.
To inform potential education session design, a secondary outcome of this study, the remaining questions asked survey respondents to indicate what contraceptive types they would want included, as well as to rank their preferences for session length and format. Clinicians interested in providing additional information to inform contraception efforts were given the option to provide their contact information. Otherwise, respondents remained anonymous. Because the topic of contraception can be personal, responses to all questions were optional. Not every survey respondent answered every question; however, we included the results of all submitted surveys. Because not all questions were answered by all respondents, some questions have a smaller number of total responses.
Statistical Analysis
Descriptive analyses included response counts/ frequencies, percentages, and means. We calculated all percentages based on the total number of survey respondents (n = 106). To assess for differential views in perceived benefit of an educational session, we stratified respondents based on reported age, sex, job title, and current prescription frequency. We used chi-square tests to determine whether these categories had an effect on responses. Statistical significance was defined by a P value < .05.
RESULTS
A total of 106 clinicians responded to the survey. Based on our best estimate of the number of eligible respondents, this accounts for an approximate response rate of 20% as defined by American Association for Public Opinion Research Response Rate 2 formula. 19 Of the respondents, 74 (70%) were predominantly White, 47 (44%) were between 25-34 years of age, and 58 (54%) were attending physicians. Fifty respondents identified as male, while 52 identified as female. Thomas Jefferson Univerity Hospital had the greatest number of responses (n = 45; 42%).
Current Practices
While 55 (51%) clinicians reported they would feel comfortable prescribing birth control in the ED, the majority (n = 32, 30%) reported they did not offer contraceptive services in the ED or offered them less than once a month (n = 33, 31%). Of those who reported they were comfortable prescribing birth control, the majority were comfortable with oral contraceptive pills; however, their comfort level in prescribing decreased when asked about other contraceptive measures. When asked how they felt with reference to educating patients about contraception, 68 (64%) reported that they felt comfortable doing so.
Future Comfort with Educational Session
When asked whether they would be more likely to
educate patients about birth control if they received an educational session on best prescribing practices, 68 (64%) respondents agreed that they would. Of the clinicians who previously stated they were not comfortable educating women and girls, 20 (57%) stated they would be more comfortable after receiving an educational session. Of the clinicians who stated they were comfortable educating patients, 48 (71%) stated they would be more comfortable after receiving an educational session.
Similarly, 74 (70%) respondents believed they would be more likely to prescribe birth control if they received an educational session on contraceptives and best prescribing practices, and 28 respondents (58%) who reported not being comfortable prescribing contraception believed an educational session would enhance their comfort level. In comparison, of the respondents who stated that they were currently comfortable prescribing contraception, 46 (84%) reported that an educational session would help their comfort level. This difference was found to be statistically significant (P < .01) (Table). Chi-squared analyses of stratified data showed that clinicians ≤ 34 years of age were more likely to indicate that education would benefit them compared to their older colleagues (P < .01). Respondents were naturally bisected at 34 years of age, given that approximately half fell below this age. Additionally, residents and APPs were more likely than their attending counterparts to indicate increased comfort in educating patients following clinician education (P = .04).
Type of Educational Session
Clinicians indicated they would prefer an educational session to be in person, take as little time as possible, and include information about oral contraceptive pills, contraceptive patch, vaginal ring, contraceptive implant, IUD, and the Depo shot.
DISCUSSION
The ED has great potential to increase contraceptive access. Previous studies have shown that adults and adolescents of childbearing age receiving emergency care are receptive to the idea.13,14 Our data suggest that while emergency clinicians are open to offering contraception, they rarely do. Given knowledge gaps that exist within many non-obstetric specialties regarding contraceptive care, clinician discomfort may stem in part from a lack of education. This study supports this hypothesis and establishes a need for education among emergency clinicians.
Although our results showed that most respondents felt comfortable offering contraceptive services, this finding was more robust in regard to educating patients on options rather than actually prescribing contraception (64% vs 52%).
Moreover, those who indicated comfort in prescribing were mainly referring to oral contraceptive pills as opposed to other methods. In addition, among those who reported being
Table. Clinician interest in contraceptive education, based on their demographic profile, when asked the following questions:
Would you be more likely to prescribe birth control if you had an educational session on contraceptives and best prescribing practices?
Gender* (n = 102) Yes (%) No (%)
Male (n = 50) 37 (74) 13 (26)
Female (n = 52) 37 (71) 15 (29)
Job Title (n = 101)
Attending physician (n = 58)
Resident (n = 32)
(64) 21 (36)
(84) 5 (16)
Other (advanced practice practitioner) (n = 11) 8 (73) 3 (27)
Age (years) (n = 103)
0-34 (n = 47)
35 (n = 56)
Current contraceptive prescribing practices (n = 99)
Once a month or more than once a month (n = 34)
= .02
(83) 8 (17)
(79) 7 (21) Less than once a month (n = 65)
(68)
(32) Currently comfortable prescribing birth control in the ED (n = 103)
(n = 55)
(n = 48)
(84) 9 (16)
(58) 20 (42)
Would you be more likely to educate women and girls on birth control options if you had an educational session on contraceptives and their uses?
Gender* (n = 102)
Male (n = 50)
(%) No (%) P =.89
(66) 17 (34) Female (n = 52)
(67) 17 (33) Job Title (n = 101)
physician (n = 58)
(n = 32)
(55) 26 (45)
(78) 7 (22)
(advanced practice practitioner) (n = 11) 9 (82) 2 (18)
Age (years) (n = 103)
0-34 (n = 47)
(83) 8 (17) ≥ 35 (n = 56)
(52) 27 (48) Currently comfortable educating women in the ED (n = 103)
Yes (n = 68)
< .01
(71) 20 (29) No (n = 35)
(57) 15 (43)
*Our survey is limited by the use of outdated demographic descriptors including the use of “gender” in place of “sex.” ED, emergency department.
comfortable with educating patients, their comfort was limited to discussing oral conceptive pills, rather than other contraceptive options. This is in line with findings from similar surveys of non-gynecologic clinicians, which indicate that comfort prescribing contraception does not necessarily apply to methods such as IUD insertion.12,15 Oral contraceptive pills are less effective at preventing pregnancy than other methods and have side effects that may limit their use.16 Furthermore, reproductive autonomy is best supported by offering individuals the fullest range of options possible. Therefore, it is important for clinicians to feel confident offering alternatives to oral contraceptives. Taken together,
these findings indicate a need for education that is prescription-focused and covers a wide range of methods. The primary outcome of this study was clinicians’ self-perceived need for education. We found that 70% believe they would be more comfortable prescribing contraceptives after further education. Interestingly, most clinicians who believed they would benefit from education were those already comfortable prescribing contraceptives and offering contraceptive education. This tells us that although there is an interest in education, the clinicians who are most likely to participate in such education are already open to offering these services. Those who are not comfortable may be less likely to
attend an educational session due to little perceived benefit. Moreover, younger clinicians were more likely than those > 35 to indicate interest in education. Similarly, residents and APPs were more likely than attendings to indicate interest. This presents a substantial challenge given that younger physicians and residents are often practicing under the supervision of older attending counterparts. Contraceptive services are unlikely to be offered if supervising clinicians are not comfortable doing so. While disinterest in continuing education opportunities may arise due to lack of time or perceived clinical relevance, these factors are not necessarily specific to attending physicians.17 Therefore, to achieve meaningful change, efforts to address clinician knowledge must also better characterize and target underlying attitudes that may serve as a barrier.
This study also provided us with insight into preferred methods of education. We believe that using this information to inform future educational session design may increase use. Future work will focus on developing and implementing clinician education and assessing for changes in clinical practice and impact on patient outcomes within our patient population, as was similarly done by Liang and colleagues.18
LIMITATIONS
Although the survey was reviewed by emergency clinicians actively involved in women’s health research, survey development was limited by lack of input from experts in the field of contraceptive care. Furthermore, our survey was limited by reliance on outdated demographic descriptors including the use of “Caucasian” instead of “White” and “gender” in place of “sex.” We also recognize that use of the terms “women” and “girls” in our survey does not accurately reflect all patients with the ability to become pregnant. All survey questions are also subject to reader interpretation despite efforts to remain objective.
Additionally, there are limitations to the data itself and what we could extrapolate from it. We collected no data on what clinicians perceive as current barriers to prescribing contraception, the average number of patients of childbearing age seen by them, or specific comfort in initiating a conversation on contraception. These topics would all be useful to address in follow-up studies. Moreover, we did not further stratify job title data based on age to assess whether the difference between respondents < 35 and > 35 years of age was truly an age-based difference vs a role-based difference as most clinicians < 35 are APPs/residents. That being said, most of our respondents identified as young attendings, yet attendings were still less likely to perceive education as beneficial, from which we infer that being an attending and age are independent factors affecting perceived benefit of contraceptive education.
This study was also influenced by self-selection bias because it was based on a voluntary survey sent to emergency
clinicians via email. Clinicians who filled out the survey may have been more interested in the idea of contraceptive education than those who did not. It is also possible that younger clinicians were more likely to fill out the survey given that our participants were mostly < 45 years of age. This survey was also limited to Thomas Jefferson Univerity Hospital and affiliates; therefore, responses may not be generalizable to other EDs. Additionally, as survey respondents were contacted through listserv, we do not have an updated list of the total number of clinicians who were contacted. Because of this, we do not know our precise response rate, which is a significant limitation in the generalizability of our study.
CONCLUSION
Our study suggests that many ED clinicians within the Thomas Jefferson Univerity Hospital system are interested in contraceptive education. Creating an educational model according to their expressed preferences (short, in-person session) could help expand contraceptive access, which is paramount in the wake of the 2022 Dobbs Supreme Court decision. Further research should be done to explore the effects of such education.
Address for Correspondence: Teagan R. McCarthy, Thomas Jefferson University, Sidney Kimmel Medical College, 1025 Walnut St #100, Philadelphia, PA 19107. Email: teagan.mccarthy@students. jefferson.edu.
Conflicts of Interest: By the WestJEM article submission agreement, all authors are required to disclose all affiliations, funding sources and financial or management relationships that could be perceived as potential sources of bias. No author has professional or financial relationships with any companies that are relevant to this study. There are no conflicts of interest or sources of funding to declare.
1. Rossen LM, Hamilton BE, Abma JC, et al. Updated methodology to estimate overall and unintended pregnancy rates in the United States. 2023. Available at: https://stacks.cdc.gov/view/cdc/124395. Accessed March 4, 2024.
2. Grindlay K, Grossman D. Prescription birth control access among US women at risk of unintended pregnancy. J Womens Health. 2016;25(3):249-54.
3. Yazdkhasti M, Pourreza A, Pirak A, et al. Unintended pregnancy and its adverse social and economic consequences on health system: a narrative review. Iran J Public Health. 2015;44(1):12-21.
4. Kavanaugh ML, Anderson RM. Contraception and beyond: the health benefits of services provided at family planning centers. 2013. Available at: https://www.guttmacher.org/report/contraception-andbeyond-health-benefits-services-provided-family-planning-centers. Accessed February 28, 2023.
5. Sonfield A, Hasstedt K, Kavanaugh ML, et al. The social and economic benefits of women’s ability to determine whether and when to have children. 2013. Available at: https://www.guttmacher. org/report/social-and-economic-benefits-womens-abilitydetermine-whether-and-when-have-children. Accessed February 28, 2023.
6. Cairns C, Ashman JJ, Kang K. Emergency department visit rates by selected characteristics: United States, 2018. NCHS Data Brief. 2021;(401):1-8.
7. Preiksaitis C, Saxena M, Zhang J, et al. Prevalence and characteristics of emergency department visits by pregnant people: an analysis of a national emergency department sample (2010–2020). West J Emerg Med. 2024;25(3):436-43.
8. Eswaran V, Allen KC, Cruz DS, et al. Development of a take-home naloxone program at an urban academic emergency department. J Am Pharm Assoc. 2020;60(6):e324-31.
9. Kaigh C, Blome A, Schreyer KE, et al. Emergency department-based hepatitis. A vaccination program in response to an outbreak. West J Emerg Med. 2020;21(4):906-8.
10. Moore PQ, Cheema N, Celmins LE, et al. Point-of-care naloxone distribution in the emergency department: a pilot study. Am J Health
Syst Pharm. 2021;78(4):360-66.
11. Dirksen RR, Shulman B, Teal SB, et al. Contraceptive counseling by general internal medicine faculty and residents. J Womens Health. 2014;23(8):707-13.
12. Schreiber CA, Harwood BJ, Switzer GE, et al. Training and attitudes about contraceptive management across primary care specialties: a survey of graduating residents. Contraception. 2006;73(6):618-22.
13. Alexander AB, Chernoby K, VanderVinne N, et al. Acceptability of contraceptive services in the emergency department: a crosssectional survey. West J Emerg Med. 2021;22(3):769-74.
14. Solomon M, Badolato GM, Chernick LS, et al. Examining the role of the pediatric emergency department in reducing unintended adolescent pregnancy. J Pediatr. 2017;189:196-200.
15. Teal S, Edelman A. Contraception selection, effectiveness, and adverse effects: a review. JAMA. 2021;326(24):2507-18.
16. Sridhar A, Forbes ER, Mooney K, et al. Knowledge and training of intrauterine devices among primary care residents: implications for graduate medical education. J Grad Med Educ. 2015;7(1):9-11.
17. O’Brien Pott M, Blanshan AS, Huneke KM, et al. Barriers to identifying and obtaining CME: a national survey of physicians, nurse practitioners, and physician assistants. BMC Med Educ. 2021;21:168.
18. Liang AC, Sanders NS, Anderson ES, et al. ContraceptED: a multidisciplinary framework for emergency department-initiated contraception. Ann Emerg Med. 2023;81:630-36.
19. Phillips AW, Friedman BT, Durning SJ. How to calculate a survey response rate: best practices. Acad Med. 2017;92(2):26.
Utility of Pelvic Ultrasound with Negative Computed Tomography in Adult Females
Mary Rometti, MD
Amanda Esposito, MD
Michael Mirza, MD
Sara Heinert, PhD, MPH
Christopher Bryczkowski, MD
Rutgers Health Robert Wood Johnson Medical School, Department of Emergency Medicine, New Brunswick, New Jersey
Section Editor: Mark I. Langdorf, MD, MHPE
Submission history: Submitted July 7, 2025; Revision received October 20, 2025; Accepted November 23, 2025
Electronically published May 19, 2026
Full text available through open access at http://escholarship.org/uc/uciem_westjem
DOI 10.5811/westjem.48919
Introduction: Emergency physicians must consider ovarian torsion in all biologically female patients who present to the emergency department (ED) with abdominal pain. A misdiagnosis can result in detrimental outcomes, such as loss of an ovary. Female patients who present to the ED for evaluation of their abdominal pain may have a computed tomography (CT) or pelvic ultrasound performed to further evaluate for concerning pathology. Our objective in this study was to describe the occurrence of critical or emergent findings on pelvic ultrasound not identified on a concurrent or previously performed CT of the abdomen and pelvis.
Methods: We conducted a retrospective chart review of ED visits from January 1–December 31, 2021 at a large, suburban, academic medical center. Eligible patients were adult females (≥ 21 years of age) who had a CT of the abdomen and pelvis and pelvic ultrasound, with the CT ordered either before or simultaneously with the pelvic ultrasound. We excluded from the study CTs with abdominal or pelvic pathology. The primary outcome measure was to determine the occurrence of pelvic ultrasounds without acute pathology with a negative CT. The secondary outcome measure was to identify non-emergent findings on pelvic ultrasound with a negative CT
Results: Of 281 eligible ED visits, 172 patients (61.2%) had gynecologic pathology on CT and 60 patients (21.4%) had other pathology on CT. The mean age was 43.3 years (SD 16.4). Forty-nine patients (17.4%) had unremarkable CT results. Of those, 39 patients (79.6%; 95% CI, 65.7-89.8%) had a normal ultrasound; three patients (6.1%; 95% CI,1.3-16.9%) had an ovarian cyst; six patients (12.2%; 95% CI, 4.6-24.8%) had other non-emergent results; and one patient (2.0%; 95% CI, 0.0510.9%) had a 10- by 11-mm ovarian mass on ultrasound. In patients with unremarkable CTs, 48 (98.0%; 95% CI, 89.1-99.9%) also had normal or not clinically significant ultrasound results. No definite ovarian torsions were diagnosed on ultrasound after a negative CT
Conclusion: Obtaining a pelvic ultrasound following an unremarkable CT of the abdomen and pelvis may not produce additional clinically relevant results in an emergency setting. [West J Emerg Med. 2026;27(3)731–734.]
INTRODUCTION
Abdominal pain is a common presentation to the emergency department (ED) and includes a broad differential.1-3 Ovarian torsion is the fifth most common acute gynecologic complaint for biological females.1 While ovarian torsion is still considered a rare diagnosis, emergency physicians must consider it in the differential for female
patients with abdominal pain given that misdiagnosis can result in ovarian necrosis or infertility.1-4
Clinical presentations of a patient with ovarian torsion may vary, which further contributes to the challenge of diagnosing torsion.1,5,6 Ovarian torsion most commonly occurs in reproductive-age females, with an average age of onset of about 30 years.1,4 About half of patients with torsion
present with abrupt onset of pelvic pain with radiation to the flank or groin area.1 The abdominal or pelvic pain associated with ovarian torsion is primarily from vascular occlusion leading to ischemia.1 Patients may present with nausea, vomiting, intermittent or constant pain, fever, tachycardia, or hypertension.1 Risk factors for ovarian torsion include prior torsion, ovarian hyperstimulation interventions, polycystic ovarian syndrome, adnexal masses or cysts, pregnancy, and prior tubal ligations.3,4,7 The risk of ovarian torsion increases when cysts are greater than 5 cm in diameter, as increased size may lead to the ovary rotating along its axis, impeding blood flow.8
Up to 65% of patients with pelvic or abdominal pain in the ED will have imaging performed in the emergency setting.3 To evaluate ovarian torsion, transvaginal ultrasound with Doppler is the initial recommended test.1-4 When presenting to the ED with lower abdominal or pelvic pain, a patient will often initially have computed tomography (CT) performed to evaluate for causes of lower abdominal pain.1 At times, both an ultrasound and a CT may be ordered.9-11 Although additional studies may be necessary, some findings on CT may aid in either diagnosing ovarian pathology related to torsion or lowering the diagnostic possibility of ovarian torsion. Using these CT findings may decrease patient discomfort related to transvaginal ultrasound studies.1,6 An unremarkable abdominal/ pelvis CT greatly reduces the likelihood of ovarian torsion.1 An ultrasound performed immediately after a negative CT likely has little diagnostic function.3 One study found that CT and ultrasound had comparable diagnostic performances when evaluating for ovarian torsion when confirmed by surgery.3,6
Our objective in this study was to determine the occurrence of critical or emergent pelvic ultrasound findings not identified on concurrent or previously performed CT of the abdomen and pelvis. If the pelvic ultrasound is unlikely to reveal clinically significant pathology, a subsequent ultrasound may not be indicated, thereby decreasing the length of time spent in the ED and the cost of patient care.
METHODS
We performed a retrospective chart review of ED presentations for abdominal pain from January 1–December 31, 2021. Charts were extracted from AllScripts Sunrise Clinical Manager (Altera Digital Health, Inc, Niagara Falls, NY) and the ED information management system for patients who met the following criteria: females ≥ 21 years of age presenting with abdominal pain, not pregnant, who had both a CT of the abdomen and pelvis and pelvic ultrasound performed, with the CT ordered either prior to or simultaneously with the ultrasound. We also extracted return visit data for the seven-day period following the patient’s day of initial presentation, extending to January 7, 2022. The primary outcome measure was to determine the occurrence of unremarkable pelvic ultrasounds with a negative CT of the abdomen and pelvis. The secondary outcome measure was
Population Health Research Capsule
What do we already know about this issue? While a transvaginal ultrasound with Doppler is historically the recommended test to assess for ovarian torsion, CT is often also performed.
What was the research question?
After an unremarkable CT of the pelvis and abdomen, does a pelvic ultrasound provide additional clinically useful information?
What was the major finding of the study?
Of 49 patients with normal CTs, 48 (98.0%; 95% CI, 89.1-99.9) had clinically insignificant ultrasound results.
How does this improve population health?
Two different imaging modalities may not be required to rule out ovarian torsion. If validated with a larger sample size, patients may not need to undergo additional imaging. to identify clinically important or unimportant nonemergent findings on pelvic ultrasound with a negative CT.
We initially obtained data using an administrative data query with additional manual data extracted from the charts by three study authors. Data were stored using REDCap tools (Research Electronic Data Capture, Vanderbilt University, Nashville, TN) hosted at Rutgers Health, and were further analyzed in Excel (Microsoft Corporation, Redmond, WA) and Stata (StataCorp, LLC, College Station, TX). As outlined by Worster et al, we adhered to the following guidelines for retrospective chart review: abstractor training; case selection criteria; variable definition; abstraction forms; performance monitored; medical record identified; and institutional review board approval.12
RESULTS
Of 281 patients for whom a CT of the abdomen and pelvic and pelvis ultrasound was ordered, the mean age was 43.3 years (SD 16.4); 9% identified as Asian, 15% as Black, 37% as White, and 32% identified as having Hispanic ethnicity. Spanish was the primary language for 57 (20%) patients. A total of 172 patients (61.2%) had gynecologic pathology seen on CT, and 60 patients (21.4%) had other pathology on CT, while 49 patients (17.4%) had unremarkable CT results. (Figure 1).
Of the pelvic ultrasound results examined for the 49
Figure 1. Sample size with subsequent exclusions for emergency department presentations of female patients with computed tomography of the abdomen and pelvis ordered initially or simultaneously with pelvic ultrasound. CT, computed tomography of the abdomen and pelvis; ED, emergency department.
patients with unremarkable CTs, 39 were normal (79.6%; 95% CI, 65.7-89.8%). Ovarian cysts were found in three patients (6.1%; 95% CI, 1.3-16.9%), all of whom had normal duplex scans. The largest cyst of the three patients measured 2.3 cm. Non-emergent results of fibroids, nabothian cyst, ovarian follicle, hydrosalpinx, and thickened endometrium were identified in six patients (12.2%; 95% CI, 4.6-24.8%). Of these six, one had a renal transplant ultrasound performed in the ED followed by pelvic ultrasound a few days later that showed questionable torsion, later identified as likely the transplanted kidney. Finally, an ovarian mass was found in one patient (2.0%; 95% CI, 0.05-10.9%), which was characterized as 10 mm by 11 mm and non-specific (unable to exclude neoplasm). This patient had a normal duplex on ultrasound. Results are summarized in Table 1. Overall, 48 patients (98.0%; 95% CI, 89.1-99.9%) had clinically insignificant US results. No ovarian torsions were diagnosed on ultrasound after a negative CT.
DISCUSSION
While ovarian torsion is a rare diagnosis, it is considered
Table 1. Breakdown of findings on pelvic ultrasound for patients who had unremarkable computed tomography of the abdomen and pelvis.
Clinical importance Findings on ultrasound
Unimportant
a gynecologic emergency. Efficiently diagnosing or ruling out ovarian torsion is vital. While CT is generally not considered the gold standard for diagnosing ovarian torsion, it may be the preferred imaging modality in the ED.7 While a CT of the abdomen and pelvis cannot detect dynamic blood flow like an ultrasound, it can depict other findings or risk factors that could signify an ovarian torsion. Ovarian torsion is typically associated with pelvic pathology, such as an ovarian mass, which can result in twisting along the ligaments, compressing vasculature.4
Computed tomography of the abdomen and pelvis with intravenous contrast has been shown to have high sensitivity and specificity when evaluating for possible ovarian torsion.4 Specific CT findings for ovarian torsion include decreased ovarian contrast enhancement, ovarian follicles that are peripherally displaced, enlarged ovary with a follicular stroma, and thickened fallopian tube with a beak-like appearance.4 Other CT findings that could indicate ovarian torsion include fat-stranding near the ovary, adnexal wall thickening, pelvic free fluid, enlarged ovaries, ovarian masses, shifting of an ovary closer to the uterus, or uterine displacement closer to a torsed ovary.4,11 If a CT does not show evidence of findings suggestive of ovarian torsion, the sensitivity for ruling out ovarian torsion by CT is close to 100%.4 To our knowledge, there is no definitive published literature defining the lower size limit of an ovarian cyst to be detectable on CT. If CT could reliably show there is no ovarian cyst, then the need for an ovarian ultrasound would be further reduced. While CT has been used to aid in characterizing benign vs malignant ovarian cysts by examining fluid attenuation,13 additional studies are needed to define CT ovarian cyst size sensitivity.
In one study, the retrospective review of initial CTs for surgically confirmed ovarian torsion diagnoses revealed that the CTs had at least one abnormal finding that could have been associated with ovarian torsion.7 Patients with ovarian torsion are unlikely to have a normal CT.11 Given that ovarian torsion is often the result of enlargement of the ovaries or asymmetrical ovaries, the CT should show evidence of this or secondary findings. Even though Viers et al observed that in 34% (32/93) of cases, transvaginal ultrasound may have helped to more definitively exclude ovarian torsion, they also found that transvaginal ultrasound performed after CT revealed a new or different diagnosis in < 1% of their patient population.9 Furthermore, performing a CT after ultrasound led to a new or different diagnosis in about 26% of cases.9 Pelvic ultrasound after normal findings on CT could aid in diagnosing uterine or endometrial pathology but otherwise has no emergent clinical benefit.9,10 Performing ultrasound after a normal CT with normal pelvic organs is likely not to be beneficial or yield additional diagnostic information required in the emergency care setting.10,11 Our results are consistent with these prior studies, demonstrating that those patients with unimportant CT findings will not benefit from an emergent pelvic ultrasound to rule out torsion. Future studies with larger
Rometti
Utility of Pelvis Ultrasound with Negative CT Rometti et al.
sample sizes are necessary to confirm these conclusions.
LIMITATIONS
There are some limitations within this study. First, after patients with non-ovarian pathology on CT were removed, the resulting sample size was small. A larger sample could have increased the reliability of the data. Second, there is the potential for confounders, such as whether the CT and ultrasound were ordered simultaneously vs the CT first. Third, the data were abstracted from charts by study authors who were not blinded to the study hypothesis; however, this is unlikely to have significantly contributed as the information collected was mainly fact-based.
CONCLUSION
Among the many potential intra-abdominal pathologies seen in the ED, emergency physicians must assess and rule out significant life- or organ-threatening diagnoses in a timely and efficient manner. Traditionally, a pelvic ultrasound is used to assess for ovarian torsion; however, this study suggests that it may not be emergently necessary if the patient already had an unremarkable CT of the abdomen and pelvis.
Address for Correspondence: Mary Rometti, MD, Rutgers Health Robert Wood Johnson Medical School, Department of Emergency Medicine, 125 Paterson St, MEB 287, New Brunswick, New Jersey, 08901. Email: mary.rometti@rutgers.edu.
Conflicts of Interest: By the WestJEM article submission agreement, all authors are required to disclose all affiliations, funding sources and financial or management relationships that could be perceived as potential sources of bias. No author has professional or financial relationships with any companies that are relevant to this study. There are no conflicts of interest or sources of funding to declare.
1. Robertson JJ, Long B, Koyfman A. Myths in the evaluation and management of ovarian torsion. J Emerg Med. 2017;52(4):449-456.
2. Shyy W, Knight RS, Teismann N.A. Right lower quadrant abdominal pain: do not forget about ovarian torsion on the computed tomography scan. J Emerg Med. 2018;55(2):e43-e45.
3. Dewey K, Wittrock C. Acute pelvic pain. Emerg Med Clin North Am 2019;37(2):207-218.
4. Bridwell RE, Koyfman A, Long B. High risk and low prevalence diseases: ovarian torsion. Am J Emerg Med. 2022;56:145-150.
5. Wattar B, Rimmer M, Rogozinska E, et al. Accuracy of imaging modalities for adnexal torsion: a systematic review and meta-analysis. BJOG 2021;128(1):37-44.
6. Swenson DW, Lourenco AP, Beaudoin FL, et al. Ovarian torsion: casecontrol study comparing the sensitivity and specificity of ultrasonography and computed tomography for diagnosis in the emergency department. Eur J Radiol. 2014;83(4):733-738.
7. Rathi S, Navin PJ, Ajmera P, et al. Deciphering ovarian torsion: insights from CT imaging analysis. Emerg Radiol. 2024;31(5):631-639.
8. Baron SL, Mathai JK. 2023. Ovarian torsion. StatPearls. Treasure Island, FL: StatPearls Publishing. Available at: https://www.ncbi.nlm.nih.gov/ books/NBK560675/.Accessed February 13, 2026
9. Viers CD, Lubner MG, Pickhardt PJ. Transvaginal US vs. CT in non-pregnant premenopausal women presenting to the ED: clinical impact of the second examination when both are performed. Abdom Radiol. 2022;47(6):2209-2219.
10. Gao Y, Lee K, Camacho M. Utility of pelvic ultrasound following negative abdominal and pelvic CT in the emergency room. Clin Radiol 2013;68(11):e586-e592.
11. Yitta S, Mausner EV, Kim A, et al. Pelvic ultrasound immediately following MDCT in female patients with abdominal/pelvic pain: Is it always necessary? Emerg Radiol. 2011;18(5):371-80.
12. Worster A, Bledsoe RD, Cleve P, et al. Reassessing the methods of medical record review studies in emergency medicine research. Ann Emerg Med. 2005;45(4):448-451.
13. Lupean RA, Ștefan PA, Oancea MD, et al. Computer tomography in the diagnosis of ovarian cysts: the role of fluid attenuation values. Healthcare (Basel). 2020;8(4):39.
Educational Advances
SonoGuar: A Self-healing Hydrogel for Higher Fidelity
Ultrasound-guided Procedure Training
Aswin Bikkani, MD*
Fiona Pudewa, MS†‡
Beshoy Gabriel, MS†
Sarah Kim, MS†
En Chang, MS†
Stephen Chai, MS†
Sreekavya Immadisetty, MS†
Xiaofeng Liu, PhD§
Andrew Crouch, DO*†
Steven Johnson, DO*†||
Jamshid Mistry, DO*†
Section Editor: Matthew Fields, MD
Arrowhead Regional Medical Center, Department of Emergency Medicine, Colton, California
California University of Science and Medicine, Department of Emergency Medicine, Colton, California
University of Southern California, Keck School of Medicine, Department of Emergency Medicine, Los Angeles, California
University of California, Irvine, Irvine Materials Research Institute, Irvine, California
University of Southern California, Keck School of Medicine, Department of Anesthesiology, Los Angeles, California
Submission history: Submitted June 5, 2025; Revision received October 14, 2025; Accepted November 30, 2025
Electronically published May 19, 2026
Full text available through open access at http://escholarship.org/uc/uciem_westjem DOI 10.5811/westjem.48400
Introduction: Ultrasound-compatible procedural phantoms are critical for vascular access training, but commercial models are expensive, degrade with use, and provide limited simulation of key procedural steps. Existing low-cost alternatives often lack durability and fidelity
Methods: We synthesized a novel, self-healing, ultrasound-compatible hydrogel (SonoGuar) using guar gum, borax, glycerol, oil, and water. We constructed vascular-access task trainers and evaluated SonoGuar across three domains: 1) rheological analysis of viscoelastic recovery after injury; 2) a blinded ultrasound image comparison study comparing SonoGuar against a commercial model; and 3) a prospective, randomized, single-blind crossover simulation study comparing SonoGuar to a commercial model with 41 participants (medical students, residents, and attendings).
Results: At grocery store material prices, one kilogram of SonoGuar took 10 minutes of active time and about $3 to fabricate, including vessel-mimic balloons. The commercial comparison model was quoted at $350 for a single replacement insert. SonoGuar recovered its viscoelastic profile within 30 minutes of injury and demonstrated visible healing of needle tracts by five hours. In the image comparison, SonoGuar was 1.8 times more likely than the commercial model to be selected as resembling human tissue in a head-to-head comparison (64.5% SonoGuar vs 35.5% commercial model, P < .001). In simulation, 41 -residents and attendings rated SonoGuar higher than the commercial phantom across all model aspects, including anatomy identification, appearance, tactile feedback, and needle visualization (average of 4.47 vs 3.77 on a 5-point Likert scale, P < .01). After cost was disclosed, all preferred SonoGuar. Medical students rated both models similarly across all model aspects and demonstrated increased levels of confidence after training with SonoGuar or commercial phantom (pre-simulation average confidence on a 5-point Likert scale of 1.46 and postsimulation average of 3.54 and 3.37, respectively, both comparisons P < .05).
Conclusion: A do-it-yourself, high-fidelity hydrogel with self-healing properties, SonoGuar can be rapidly fabricated and is suitable for realistic, durable, and scalable ultrasound-guided procedure training. The low-cost hydrogel outperformed a leading commercial model in imaging realism, user confidence, and overall preference among experienced clinicians. [West J Emerg Med. 2026;27(3)735–744.]
INTRODUCTION
Ultrasound guidance has become the standard of care for a variety of medical procedures, allowing clinicians to visualize anatomy in real time and improve patient safety.1 Compared with landmark-based techniques, ultrasound-guided vascular access improves first-pass success and time to insertion, while reducing complications such as arterial puncture and pneumothorax.2-7 Simulation-based training further improves procedural competency and patient outcomes, even among experienced clinicians.8,9 As a result, professional organizations now recommend simulation-based education over traditional observational instruction, and institutions have integrated simulation into their curricula.10
Commercial central venous access trainers such as those offered by Blue Phantom typically use embedded tubing within proprietary, plastic-based tissue-mimicking materials (TMM). These models, or “phantoms,” reproduce the firmness of soft tissue and are shelf-stable but cost hundreds to thousands of dollars. Additionally, many commercial models degrade with use, limiting the ability to perform full procedural workflows such as cutting, dilating, and catheter insertion. Due to the high cost of replacements, trainees may be discouraged from performing these more invasive parts of a given procedure, ultimately reducing their effectiveness as training tools.13
To mitigate costs, a variety of low-cost or do-it-yourself (DIY) solutions have been explored. These include casting gelatin, agar, or ballistic gel as a TMM around a vessel mimic, or inserting a vessel mimic directly into tofu, pork, or chicken.13-15 Although accessible, these models are often cumbersome to prepare, short-lived, and variable in their sonographic and procedural fidelity. Some groups have pursued an intermediate approach between commercial and DIY methods, making custom polyvinyl alcohol- or polyvinyl chloride-based polymer TMMs with more favorable properties, but they require specialized equipment and more intensive synthesis.16,17
Given these limitations, there remains a need for a more suitable TMM. The ideal material would be easy to make, affordable, non-toxic, shelf-stable, and capable of tolerating repeated needle passes without generating imaging artifacts.12,21 As part of a task-trainer, the TMM should replicate the tactile feedback and sonographic appearance of human tissue while remaining compatible with a range of phantom-model architectures and 3D-printed anatomies, including those designed for vascular access.
Both human tissue and TMMs are viscoelastic, meaning they exhibit both solid and liquid behaviors when stressed, such as by a clinician’s palpation or an ultrasound probe. Rheology, the study of viscoelastic materials, has been used to characterize various tissues as well as TMMs for simulation.18 Two common measurements in rheology are storage modulus (G’), which quantifies the elastic, solid-like component of a material, and loss modulus (G’’), which quantifies the viscous,
Population Health Research Capsule
What do we already know about this issue?
Ultrasound-compatible procedural phantoms are critical for vascular-access training.
What was the research question?
Could a homemade hydrogel with self-healing properties outperform a far more costly commercial system in imaging realism?
What was the major finding of the study?
A do-it-yourself vascular-access trainer that cost $3 to make outperformed a $350-dollar commercially manufactured trainer.
How does this improve population health?
Using do-it-yourself tissue-mimicking materials enables more effective training for invasive line and catheter placement because material cost is no longer a factor.
liquid-like component. Materials with higher G’ store more energy during deformation and recover their shapes more readily, whereas materials with higher G’’ lose more energy as heat and deform. Designing an effective TMM requires balancing viscoelastic and imaging properties. Hydrogels such as agar and gelatin are polymeric networks that show promise because they can reproduce the mechanical and acoustic characteristics of human soft tissue.
In 2018, Pan et al described a self-healing hydrogel made with guar gum, glycerol, and borax, but it lacked the firmness required for use as a TMM.19 Building on that work, our group previously described how we modified that formulation to enhance firmness and allow for ultrasound imaging while preserving self-healing.20 We termed this lowcost, high-fidelity ultrasound medium “SonoGuar,” reflecting its ultrasound compatibility and guar gum base. This work expands on that initial report by validating SonoGuar for clinical simulation as a vascular access phantom through rheologic characterization, blinded ultrasound-image comparison, and a prospective, single-blind crossover simulation study enrolling medical students, residents, and attending physicians.
METHODS
SonoGuar Hydrogel Synthesis
The SonoGuar formulation used in our simulation study is made from five ingredients: water; canola oil; glycerol; guar
Bikkani et al. SonoGaur: Self-healing Hydrogel for Higher Fidelity US-guided Procedure Training gum powder; and sodium tetraborate (borax).
Synthesis Steps
Solution 1: Mix 20 grams (g) guar gum with 20 g canola oil until smooth.
Solution 2: Dissolve 20 g glycerol in 340 mL water. Solution 3: Dissolve ~1.8 g (½ tsp) borax in 80 mL water.
While vigorously stirring Solution 2 in a vortex, quickly pour in Solution 1 within five seconds (Figure 1). This enables the water-glycerol mix to displace the oil and hydrate the
guar gum, forming a gel within ~20 seconds. The oil delays hydration, preventing clumping. Mixing must be brisk but not excessive—overmixing traps air that in turn affects imaging. This mixing step critically influences the gel’s final ultrasound characteristics, with the right amount of residual heterogeneity and air that is ideal for tissue simulation.
Immediately after mixing, pour the opaque liquid into a flat dish to maximize surface area. Do not wait for the mixture to thicken before pouring. Remove large clumps if needed. Apply half of Solution 3 to the surface and press gently; crosslinking begins instantly, changing the texture from sticky to
Figure 1. A do-it-yourself synthesis task trainer assembly, and simulation set-up.
Row 1. 1. Stir solution 2 rapidly (pictured in glass bowl) while adding Solution 1 (pictured in measuring cup). 2. Once opaque, immediately pour into a flat pan. 3. Pour half of borax solution over the gel and press in with fingers; store sealed overnight. 4. Start filling 3D mold/insert with fully cross-linked SonoGuar. Fill one small balloon with water at high pressure and one larger balloon at a lower pressure. Place small ballon over about 2 cm SonoGuar and run it under the simulated clavicle and over the ribs, securing it on the other side.
Row 2. 5. Place large balloon directly over small balloon, running the same course, and secure the balloons on either end of the insert using a hemostat, Kelly clamp, or bobby pin. 6. Continue packing insert with SonoGuar; leave the last 1.5 cm (in depth) of material in the container to use as a smooth slab atop the simulated internal jugular vein at the proximal portion of the insert. 7. Place insert in task trainer. For blinding purposes, we covered it with silicone skin identical to that used on the commercial model; however, this step is not required for general use. 8. Drape such that no part of the insert is visible; set-up is ready for resident and attending participation. Row 3. Demonstration of image similarity between Butterfly iQ+ (used by medical students) and Mindray Te7 (used by physicians): a) Butterfly iQ and b) Mindray Te7 axial views with needle point delineated; c) Butterfly iQ; and d) Mindray Te7 long-axis views with needle shaft delineated.
SonoGaur: Self-healing Hydrogel for Higher Fidelity US-guided Procedure Training
smooth. Sticky spots indicate incomplete cross-linking and can be corrected with additional drops of Solution 3. Avoid stirring at this stage to prevent air artifact. After a few minutes, flip and apply the rest of Solution 3, again gently pressing in. Let the gel rest to finish hydration and cross-linking; about 50% of the borax is absorbed in 10 minutes, 100% within 12 hours. Gels are typically refrigerated overnight before use.
SonoGuar Task Trainer Design
We created a 3D-printed mold to match the dimensions and anatomic landmarks (eg, clavicle) of the insert from a commercial, central venous catheter simulator (Kyoto Kagaku, Co, Ltd., Kyoto, Japan).23 Oblong Qualatex latex balloons sizes 350Q and 260T (Pioneer Balloon Company, Wichita, KS)) filled with water at different pressures simulated the internal jugular vein (IJV) and common carotid artery. SonoGuar was placed in the mold and around the balloon vessels; we verified vessel positioning, depth, and relative compressibility before use (Figure 1).
Study Design
Our study included the following three components: 1) rheological analysis of the experimental material; 2) a blinded, ultrasound image-comparison study; and 3) a prospective, randomized, single-blind crossover simulation study. We enrolled 41 participants: 19 medical students (MS) without prior vascular access experience (13 MS-1, 4 MS2, 1 MS-3, and 1 MS-4); 13 emergency medicine residents (3 postgraduate year (PGY)-1, 5 PGY-2, two PGY-3, and 3 PGY-4); three PGY-2 internal medicine residents; one PGY-1 anesthesia resident; and five attending physicians in emergency medicine. The surveys used a 5-point scale to assess confidence (six items) and model evaluation (four items).
Rheological and Optical Characterization
We measured viscoelastic properties using a Discovery HR-2 Hybrid Rheometer (TA Instruments, New Castle, DE) at the Irvine Materials Research Institution (IMRI). Storage (G′) and loss (G″) moduli were recorded under oscillatory shear at 1 hertz with an axial force of 0.5 Newtons. Self-healing was assessed by recombining cut samples, with measurements taken at 5, 15, and 30 minutes. We performed optical microscopy at IMRI using an AMScope SM-3T microscope (United Scope, LLC, Irvine, CA) on a simulation sample of SonoGuar and a sample that we dyed blue using Favorite Day food coloring (Target Corporation, Minneapolis, MN).
Image Comparison Study
In the blinded, pairwise, ultrasound image comparison, participants viewed 15 randomized ultrasound image pairs of either SonoGuar, a commercial model, or human tissue. For each pair, participants selected the image that best resembled human tissue. These included transverse axis view of the IJV
and common carotid artery with needle point 1) abutting the IJV; 2) within the IJV lumen; or 3) not visible, as well as a longitudinal axis view of the IJV with the needle; 4) abutting the IJV; or 5) within the lumen. We standardized commercial trainer and SonoGuar images by ultrasound settings, acquired with the Butterfly iQ+ (Butterfly Network, Inc, Burlington, MA). All 41 participants completed this prior to hands-on simulation.
Crossover Simulation Study
In the crossover simulation study, participants compared the SonoGuar task trainer to the commercial model Kyoto Kagaku CVC Insertion Simulator III. To ensure blinding, both models were covered with identical silicone skins and draped to conceal the TMM (Figure 1). No participants had prior experience with either model.
Simulation sessions were held at the California University of Science and Medicine Clinical Skills Department for medical students, where Butterfly iQ+ handheld ultrasound probes were available (vascular setting, 3.5-cm depth).
Resident and attending sessions were conducted in the Arrowhead Regional Medical Center emergency department using cart-based Mindray TE7 machines (Shenzhen Mindray Bio-Medical Electronics Co., Ltd., Shenzhen, People’s Republic of China) (vascular setting, 3.5-cm depth). On both devices, SonoGuar and the commercial phantom appeared similar in imaging quality (Figure 1).
Medical students received a 30-minute instructional session covering central venous access, ultrasound-guidance principles, and procedural steps. All residents had completed at least one central line on a real patient, with most having completed > 10. Physicians outperformed students in human tissue recognition (81.8% vs 63.7%, P < .001). Participants then performed ultrasound-guided venous access on both models using an 18-gauge needle and a 5-cc syringe. The order of model use was randomized. Because the commercial model could not tolerate multiple full-procedure attempts (eg, guidewire insertion, dilation, catheter placement), the simulation was concluded upon successful venous access only. Participants were informed in advance that performance metrics (eg, time to insertion) were not being evaluated.
Each participant had five minutes per model to achieve venous access. Following each attempt (or time out), participants completed a survey assessing user confidence and model performance using a Likert scale before crossing over to the next model. After using both models, they rated their overall experience and preference. At the conclusion of their session, participants were invited to interact with the raw hydrogel materials and a freestanding SonoGuar phantom in a separate demonstration area.
Statistical Analysis
As this was a pilot feasibility study, and as we were uncertain of potential effect sizes, we did not perform power
Bikkani et al.
Bikkani et al.
SonoGaur: Self-healing Hydrogel for Higher Fidelity US-guided Procedure Training
calculations. Pairwise image rankings were modeled using a Bradley-Terry framework.22 We analyzed confidence and model assessment data using Wilcoxon signed-rank tests and SPSS Statistics v28.0.1.0. (IBM Corp., Armonk, NY). Significance was defined as two-sided P < .05.
RESULTS
Self-healing Rheometry showed SonoGuar’s mean storage modulus
(G′) as 2,700 Pascal (Pa) and loss modulus (G″) as 470 Pa under 1 hertz oscillatory shear. Viscoelastic properties recovered fully within 30 minutes at room temperature. Optical microscopy confirmed binding and dye transfer across the healing interface. Needle-pass artifacts began resolving within five hours and progressed over time (Figure 2). The commercial model’s mean storage modulus (G′) was 4,750 Pa under 1 hertz oscillatory shear. The G′ of the re-approximated commercial phantom material remained constant (Figure 2).
Figure 2. Visual and rheological evaluation of self-healing SonoGuar hydrogel: a) two pieces from original hydrogel with and without dying using blue food coloring; b) two hydrogel pieces in contact at room temperature for 48 hours; c-d) optical microscopy images showing changes at the healing interface over 48 hours; e-f) ultrasound images of SonoGuar immediately after injury and after specified time (white arrows indicate post-injury artifact). An 18-gauge needle in long-axis view is present at the left of images e, f, g, h as a marker: e) SonoGuar immediately after being cut through by #10 scalpel and f) 90 minutes after; g) SonoGuar immediately after 18-gauge needle puncture and h) 6 hours after; i) SonoGuar with a variety of echotextures, showing two artifact tracts immediately after puncture and j) 5 hours after.
(k-m) Storage modulus (G’, in Pascals) of original and self-healing hydrogel over time (in seconds) at three different intervals, k) 5 minutes, l) 15 minutes, and m) 30 minutes; (n-p) storage modulus (G’, in Pascals) of original and re-approximated commercial model material over time (in seconds) at three different intervals; j) 5 minutes, k) 15 minutes, and l) 30 minutes. There was no change in G’ of the re-approximated material.
SonoGaur: Self-healing Hydrogel for Higher Fidelity US-guided Procedure Training Bikkani
Image Comparison
Using the Bradley-Terry model on pooled student and physician data, human tissue images were selected in 67.4% of comparisons, followed by SonoGuar (22.9%) and the commercial model (9.7%). When directly compared to the commercial model, SonoGuar was chosen over the commercial model in 64.5% of cases, making it 1.8 times more likely to be identified as human-like (64.5% SonoGuar vs 35.5% commercial model, P < .001). Selection rates were not significantly different between students and physicians (69% vs 67%).
Crossover Simulation
Physicians strongly preferred SonoGuar over the commercial trainer, with 90.1% favoring it (P < .001). After
learning about cost differences (~$5 vs $350), all physicians selected SonoGuar. Wilcoxon signed-rank analysis showed higher confidence scores with SonoGuar across all procedural domains: anatomy identification; needle visualization/ tracking; access; and needle placement (P = .01). SonoGuar also outperformed the commercial model in visual realism, tactile feedback, and ease of needle visualization (P = .04) (Table 1).
Medical students rated both models similarly across all domains. No preference was found in realism or usability. After cost information was provided, 84.2 % of students preferred SonoGuar (P < .01) as an ultrasound phantom. Significant improvements in student-reported confidence were observed after the training session across all competencies (means increasing from 1.37-1.63 to 3.21-3.68; P < .001),
Figure 3. Pairwise imaging comparison of human tissue, commercial model, and homemade SonoGuar: a) Bradley-Terry model results showing the maximum likelihood estimate (MLE) of selection likelihood compared to a reference human tissue image. Both SonoGuar and the commercial model were less likely to be selected compared to the human image. SonoGuar was more likely to be selected compared to the commercial model (SonoGuar MLE = -1.08, z = -4.2, P < .001; commercial MLE = -1.93, z = -6.1, P < .001); b) ultrasound image of human tissue; c) ultrasound image of SonoGuar; and d) ultrasound image of commercial model.
Table 1. Participant ratings of do-it-yourself SonoGuar vs a commercial ultrasound model across various procedural aspects.
Residents and Attendings
Medical students
Data are presented as mean (SD). Scores from residents, attendings, and medical students are shown separately Asterisks (*) indicate statistically significant differences (P < .05) based on the Wilcoxon signed-rank test. IQR, interquartile range.
with neither phantom outperforming the other in the magnitude of confidence gain (Table 2).
DISCUSSION
Our do-it-yourself SonoGuar phantom outperformed the commercial phantom across all three study domains. Rheological testing showed full recovery of mechanical properties after disruption, unlike the commercial model, which did not return to baseline. Real-world procedural experience likely allowed residents and attendings to
distinguish human tissue 28.4% more often than medical students in the imaging comparison. Subsequently, they strongly preferred the SonoGuar phantom to the commercial model across all procedural domains (Figure 3). Taken together, these findings suggest that users with more extensive procedural and ultrasound experience find SonoGuar to be a superior simulation experience.
Table 2. Pre- and post-simulation confidence ratings of medical students after using the do-it-yourself SonoGuar and a commercial ultrasound model to practice vascular access skills.
Medical students rated SonoGuar comparably to the commercial model for simulation (Table 1), found it more life-like in the imaging comparison (Figure 3), and preferred Model Aspect
Scores reflect perceived confidence in performing key vascular access skills and are presented as mean (SD). Asterisks (*) denote significant increases in confidence from baseline (P < .05) based on the Wilcoxon signed-rank test. IQR, interquartile range.
SonoGaur: Self-healing Hydrogel for Higher Fidelity US-guided Procedure Training
it for cost. Even when considered as a training model for medical students, who in our study had no strong preference for either model, SonoGuar demonstrated comparable performance to commercial models (Table 2). Moreover, the advantages observed by residents and attendings would apply to trainees of all skill levels, independent of their ability to appreciate differences between models compared to real-life practice. Our study focused on SonoGuar’s procedural fidelity, but its other advantages warrant discussion.
Synthesis, Storage, Ease-of-use, and Cost
Do-it-yourself task trainer materials like gelatin and agar require heating, molding, and cooling. Other materials explored in the literature, like polyvinyl alcohol- or polyvinyl chloride-based polymer, require high temperatures up to 170 °C and less accessible equipment, such as fume hoods.18
Gelatin and agar have limited refrigerator life and can fracture easily.14,24 Meat and tofu models spoil more rapidly and carry ethical and hygiene concerns. These options are all generally single use.13,21 Ballistics gel requires an initial casting but is relatively more robust.25
SonoGuar is mixed at room temperature using inexpensive, accessible ingredients and no specialized equipment. In our experience throughout the study period, it lasted for months at refrigerator temperature without apparent microbial degradation or changes to appearance, texture or odor. SonoGuar does not require any special handling. The amount of hydrogel used for one task trainer in our study costs approximately $3 at local grocery store prices, or $1 if ingredients are purchased in bulk. This is 4-10 times cheaper than one source of ballistics gel.26 Balloons cost approximately $0.06 each. Appendix A contains a full cost breakdown with links.
Durability
and Fidelity
Gelatin and agar fracture easily, and embedded vessels are difficult to replace without damaging the surrounding tissue-mimicking material.13,15 Commercial models also have limited longevity. Their TMMs are rated for a limited number of needle passes before suffering physical and imaging degradation. Up-front and replacement costs are high. The Kyoto Kagaku CVC III model recommends the use of 23-gauge needles or smaller to limit damage. We observed the accumulation of needle pass artifacts in this model, consistent with prior reports across commercial brands.12
High-use areas, particularly overlying cannulation sites, deteriorate with cutting, dilation, and catheter placement. Even “self-healing” TMMs, such as the Blue Phantom ultrasound training simulator (Elevate Healthcare, Sarasota, FL), explicitly warn against the use of scalpels or cutting instruments. While “self-healing” tissues may permit a higher number of needle passes before visible artifact is introduced, they do not permit truly invasive procedural simulation. Additionally, commercial systems do not allow independent
replacement of vessel mimics. Vessels are permanently embedded, requiring complete insert replacement. To improve durability, these vessels are built thick, reducing compressibility and contributing to imaging artifacts such as the double-lumen effect (Figure 3d). Some models replace tubing with hollow channels, but these offer no tactile feedback on entry.11
SonoGuar addresses these limitations directly. It tolerates repeated needle passes, cutting, and catheterization without lasting artifact. The gel can be rotated, reshaped, or replaced as needed and does not adhere to its container. Vessel mimics are easily swapped without damaging the surrounding gel. We used thin-walled balloon vessels, which—unlike the rigid tubing in the commercial comparator—better replicate key behaviors of human veins, including compressibility and “tenting” against the needle, an important visual cue during ultrasound-guided access.27,28 While balloon mimics may lose fluid over time, the gel’s tamponade effect minimizes this, and fluid can be easily replaced.
Tunability, Adaptability and Scalability
Most models—DIY or commercial—are static once cast. Adjusting targets, replacing vessels, or customizing anatomy typically require complete recasting or purchasing new units. SonoGuar is moldable, self-healing, and fully customizable. It conforms to its container, binds around inserted structures, and supports modular training using 3D-printed anatomies. Ultrasound characteristics can be tuned during synthesis for novice or advanced learners. Anatomic features, including fascial planes, muscle bellies, tendons, or bony landmarks, can be included. Instructors can rapidly reset, reposition, or modify targets in real time. The same amount of gel can be used to simulate different procedures during different sessions.
A low-cost, durable, high-fidelity vascular access model also supports broader integration into institutional training. Some programs conduct large-scale onboarding simulations involving multiple simultaneous stations, where the up-front cost of multiple commercial simulators would be prohibitive. Programs have implemented institution-wide mastery learning curricula for central venous catheterization and adopted justin-time training strategies, where task trainers are available year-round without requiring a designated facilitator.29,30
LIMITATIONS
Our sample size of 41 participants was small, and because this was designed as a feasibility study we did not perform an a priori power calculation. Outcomes were based on self-reported survey data rather than objective performance measures. Survey items were developed with attending input and reviewed by peers for content validity, but they were not formally psychometrically validated. In addition, some overlap likely existed between needle-related parameters, particularly as participants retrospectively reflected on their
Bikkani
Bikkani et al.
SonoGaur: Self-healing Hydrogel for Higher Fidelity US-guided Procedure Training
simulation experience. Because of this and because we did not adjust for multiple comparisons, the overall simulation experience rating may represent the most robust comparative measure. Our commercial phantom comparator was limited to a single phantom (the Kyoto Kagaku CVC III); other widely used brands such as Blue Phantom were not included. Furthermore, different ultrasound machines were used at the two study sites (Butterfly iQ + vs Mindray Te7), which may have introduced confounding, although we found the images (Figure 1) and simulation experience comparable.
SonoGuar’s balance of storage and loss modulus renders it less stiff and more moldable than the commercial TMM. In some cases, this led to the probe “sinking” with excessive pressure. This did not appear to influence whether participants visualized the needle or gained access during the simulation. A stiffer gel can be made by decreasing the water content. Finally, as SonoGuar’s healing allows for compatibility with different vessel mimics, we used latex balloons, which may have contributed to perceived fidelity relative to the commercial vessel mimics.
CONCLUSION
Do-it-yourself SonoGuar is a readily accessible, selfhealing, hydrogel that outperforms a leading commercial central venous access simulator in imaging quality and procedural realism—at less than 1% the cost. It allows for full procedural simulation and offers strong advantages in terms of ease of synthesis, adaptability, and durability. Future work will explore freeze-thawing and use of ingredients such as isopropyl alcohol for long-term shelf stability and microbial resistance, as well as explore modifications to tailor SonoGuar’s stiffness and appearance for different procedural applications.
Address for Correspondence: Aswin Bikkani, MD, Arrowhead Regional Medical Center, Department of Emergency Medicine, 400 N Pepper Ave Colton, CA 92324. Email: bikkania@armc. sbcounty.gov.
Conflicts of Interest: By the WestJEM article submission agreement, all authors are required to disclose all affiliations, funding sources and financial or management relationships that could be perceived as potential sources of bias. This work was supported by the Student Research and Scholarly Activity Grant, courtesy of the research department at the California University of Science and Medicine. There are no conflicts of interest to declare.
1. Barr L, Hatch N, Roque PJ, et al. Basic ultrasound-guided procedures. Crit Care Clin. 2014;30(2):275-304, vi.
2. McGee DC, Gould MK. Preventing complications of central venous catheterization. N Engl J Med. 2003;348(12):1123-33.
3. Brass P, Hellmich M, Kolodziej L, et al. Ultrasound guidance versus anatomical landmarks for internal jugular vein catheterization. Cochrane Database Syst Rev. 2015;1:CD006962.
4. Tada M, Yamada N, Matsumoto T, et al. Ultrasound guidance versus landmark method for peripheral venous cannulation in adults. Cochrane Database Syst Rev. 2022;12:CD013434.
5. Boulet N, Pensier J, Occean BV, et al. Central venous catheterrelated infections: a systematic review, meta-analysis, trial sequential analysis and meta-regression comparing ultrasound guidance and landmark technique for insertion. Crit Care. 2024;28(1):378.
6. Lalu MM, Fayad A, Ahmed O, et al. Ultrasound-guided subclavian vein catheterization: a systematic review and meta-analysis. Crit Care Med. 2015;43(7):1498-507.
7. Barsuk JH, Cohen ER, Potts S, et al. Dissemination of a simulationbased mastery learning intervention reduces central line–associated bloodstream infections. BMJ Qual Saf. 2014;23(9):749-56.
8. Evans LV, Dodge KL, Shah TD, et al. Simulation training in central venous catheter insertion: improved performance in clinical practice. Acad Med. 2010;85(9):1462-9.
9. Alsaad AA, Bhide VY, Moss JL Jr, et al. Central line proficiency test outcomes after simulation training versus traditional training to competence. Ann Am Thorac Soc. 2017;14(4):550-4.
10. Griswold S, Fralliccardi A, Boulet J, et al. Simulation-based education to ensure provider competency within the health care system. Acad Emerg Med. 2018;25(2):168-76.
11. Elevate Healthcare. Blue Phantom. 2025. Available at: https:// elevatehealth.net/product/gen-ii-central-line-and-regional-anesthesiaultrasound-training-model-hand-pump/. Accessed May 29, 2025.
12. Hocking G, Hebard S, Mitchell CH. A review of the benefits and pitfalls of phantoms in ultrasound-guided regional anesthesia. Reg Anesth Pain Med. 2011;36(2):162-70.
13. Zhao X, Ersoy E, Ng DL. Comparison of low-cost phantoms for ultrasound-guided fine-needle aspiration biopsy training. J Am Soc Cytopathol. 2023;12(4):275-83.
14. Academic Life in Emergency Medicine. DIY ultrasound model for procedure training: vascular access. 2019. Available at: https:// www.aliem.com/diy-ultrasound-model-procedure-vascular-access/ Accessed May 29, 2025.
15. Earle M, Portu G, DeVos E. Agar ultrasound phantoms for low-cost training without refrigeration. Afr J Emerg Med. 2016;6(1):18-23.
16. Pepley DF, Sonntag CC, Prabhu RS, et al. Building ultrasound phantoms with modified polyvinyl chloride: a comparison of needle insertion forces and sonographic appearance with commercial and traditional simulation materials. Simul Healthc. 2018;13(3):149-53.
17. Jafary R, Armstrong S, Byrne T, et al. Fabrication and characterization of tissue-mimicking phantoms for ultrasound-guided cannulation training. ASAIO J. 2022;68(7):940-8.
18. Armstrong SA, Jafary R, Forsythe JS, et al. Tissue-mimicking materials for ultrasound-guided needle intervention phantoms: a
SonoGaur: Self-healing Hydrogel for Higher Fidelity US-guided Procedure Training Bikkani et al. comprehensive review. Ultrasound Med Biol. 2023;49(1):18-30.
19. Pan X, Wang Q, Ning D, et al. Ultraflexible self-healing guar gum–glycerol hydrogel with injectable, antifreeze, and strain-sensitive properties. ACS Biomater Sci Eng. 2018;4(9):3397-404.
20. Bikkani A, Pudewa F, Johnson S, et al. Perfectly imperfect: a novel hydrogel for ultrasound-guided procedure training. Emerg Med News. 2024;46(10C).
21. Farjad Sultan S, Shorten G, Iohom G. Simulators for training in ultrasound-guided procedures. Med Ultrason. 2013;15(2):125-31.
22. Turner H, Firth D. Bradley-Terry models in R: the BradleyTerry2 package. J Stat Softw. 2012;48(9):1-21.
23. Kyoto Kagaku. Central venous catheterization training model M93CC. 2024. Available at: https://www.kyotokagaku.com/en/ products_data/_m93u_cvc/ Accessed May 29, 2025.
24. García-Carpintero E, Naredo E, Vélez-Vélez R, et al. Phantoms for ultrasound-guided vascular access cannulation training: a narrative review. Med Ultrason. 2013;25(2):201-7.
25. Amini R, Kartchner JZ, Stolz LA, et al. A novel and inexpensive
ballistic gel phantom for ultrasound training. World J Emerg Med. 2015;6(3):225-8.
26. Clear Ballistics. 10% gel FBI block. 2025. Available at: https:// clearballistics.com/shop/10-gel-fbi-block/ Accessed May 29, 2025.
27. Frantz JG, Murphy MC. Ultrasound guidance for central venous catheter placement. Hosp Physician. 2006;42(3):23-31.
28. Czarnik T, Czuczwar M, Borys M, et al. Ultrasound-guided infraclavicular axillary vein versus internal jugular vein cannulation in critically ill mechanically ventilated patients: a randomized trial. Crit Care Med. 2023;51(2):e37-44.
29. Yee J, Holliday S, Spitzer CR, et al. Preparing interns for clinical practice through an institution-wide simulation-based mastery learning program for teaching central venous catheter placement. Medicine (Baltimore). 2024;103(23):e38346.
30. Thomas AA, Uspal NG, Oron AP, et al. Perceptions on the impact of a just-in-time room on trainees and supervising physicians in a pediatric emergency department. J Grad Med Educ. 2016;8(5):754-8.
Novel Simulation-based Awake Fiberoptic Intubation Curriculum: Pilot Study
Daniel Haas, MD*†
Jenna Fredette, MD*
Kathleen A. Murphy, BSN, RN, CCRC*
Andrew Deitchman, MD*
Jacob Anderson, MD*
Maxwell Blodgett, MD, MEd*
Section Editor: Danielle Hart, MD
Christiana Care Health System, Department of Emergency Medicine, Newark, Delaware
WellSpan York Hospital, Department of Emergency Medicine, York, Pennsylvania
Submission history: Submitted August 29, 2025; Revision received February 12, 2026; Accepted January 21, 2026
Electronically published May 19, 2026
Full text available through open access at http://escholarship.org/uc/uciem_westjem DOI 10.5811/westjem.50778
Introduction: Awake fiberoptic intubation is a critical skill of emergency physicians in scenarios where rapid sequence intubation may be impossible or catastrophic. While the equipment to perform awake fiberoptic intubation has become more readily available to emergency physicians, inadequate training and lack of confidence are often cited as barriers to performing the procedure. To address this, we created and studied a simulation-based awake fiberoptic intubation curriculum with the goal of improving physicians’ performance of this skill.
Methods: A procedural checklist was developed and iteratively refined among EM, anesthesiology, and critical care physicians. An instructional video was created based on this checklist. Participants viewed the instructional video and underwent supervised deliberate practice on a manikin and bronchoscopy simulator using a rapid-cycle deliberate practice paradigm with 1:1 supervision from an instructor. Comparisons were made between a pre-test and a three-month post-test. We evaluated participants using calculated simulator metrics, the Objective Structured Assessment of Technical Skill global rating scale (GRS), a checklist, and pre- and post-intervention selfassessment.
Results: We collected data from 46 participants. Observed performance using the GRS improved from 22.5 (standard deviation 4.5) to 28.8 (6.3) (P < .001). Time from scope insertion to verbalized passage of the endotracheal tube on the simulator decreased from a mean of 147.0 (148.3) seconds to 84.6 (39.1) seconds (P = .01). Participants reported improved self-assessed performance compared with others at their stage of training, 3.7 (1.5) to 5.0 (1.2), P < .001, and their reported confidence performing the procedure increased from 3.0 (1.5) to 5.1 (1.2), P < .001. No significant difference was seen among checklist scores.
Conclusion: In this novel simulation-based awake fiberoptic intubation curriculum, subjective and objective performance improvements were observed at three months. Learners who participated in the course reported feeling more confident and capable of performing awake fiberoptic intubation and being satisfied with the curriculum. [West J Emerg Med. 2026;27(3)745–752.]
INTRODUCTION
Airway management is a critical skill for an emergency physician. In a patient with a distorted airway due to trauma,
infection, or congenital abnormality, the mechanics of passing an endotracheal tube using a standard laryngoscope may be impossible or unsafe.1,2 Awake fiberoptic intubation
is a technique that has been used in the field of anesthesiology for decades for management of difficult airways.3 With the increased availability of disposable bronchoscopes, the necessary equipment for this procedure has become more accessible to emergency physicians. However, the procedure remains infrequently performed in the emergency department (ED).1
Awake fiberoptic intubation is often cited as an area of improvement for emergency practice, with 93% of respondents in a recent needs assessment reporting limited opportunities to perform the procedure in clinical practice, and most respondents reported unease performing it.4 Furthermore, as a high-acuity, low-occurrence event, hands-on training during patient encounters in the ED is often not sufficient for the physician to become adequately comfortable or proficient with this procedure.5
Simulation-based training curricula are well-suited for training in high-acuity, low-occurrence events, given their infrequency in regular clinical practice and high-stakes nature 6 Rapid-cycle deliberate practice is an educational framework that uses repeated practice cycles with continuous instructor input.7 In rapid-cycle deliberate practice, students are stopped, redirected, and instructed to restart the procedure at any point they fail to adequately complete one of the predefined steps. This technique optimizes trainee time in deliberate practice of challenging steps and minimizes repetition of correctly performed steps, thereby allowing for more rapid acquisition of procedural competency in the simulation setting.8 Within the field of emergency medicine (EM), rapid-cycle deliberate practice models have been studied in team-based resuscitation and for instruction of other high-acuity procedures, but to our knowledge the instruction of awake fiberoptic intubation is a novel application of the methodology.8–13
Currently no standard curriculum exists for the instruction of awake fiberoptic intubation among emergency physicians, and there are no agreed-upon metrics to assess performance. Our goal in this pilot study was to create and evaluate a novel simulation-based rapid-cycle deliberate practice curriculum with the aim of improving awake fiberoptic intubation performance among EM residents and attending physicians. The primary study outcome assessed was improved awake fiberoptic intubation performance on the Objective Structured Assessment of Technical Skill (OSATS) global rating scale (GRS).14 The OSATS is among the most widely used tools for evaluating technical skills among surgeons, and validity evidence for it has been collected across a broad range of procedures and contexts.15 Secondary outcomes studied included improvements in checklist scores, calculated simulator metrics including decreased total procedure time, and improvements in selfassessed confidence and performance. Additionally, validity evidence was gathered on a novel awake fiberoptic intubation checklist.
Population Health Research Capsule
What do we already know about this issue?
Awake fiberoptic intubation is a potentially life-saving skill for which emergency physicians often feel inadequately trained.
What was the research question?
Can a curriculum using a bronchoscopy simulator lead to improved performance of awake fiberoptic intubation?
What was the major finding of the study? Participants demonstrated improvement in observed simulator performance of awake fiberoptic intubation on a global rating scale (p<.001) and in total simulator time (P=.01).
How does this improve population health?
Training in awake fiberoptic intubation can better position physicians to manage airways, which may improve outcomes, particularly among high-risk patients.
METHODS
This single-center pilot study took place at a communityacademic EM residency training site with an annual volume of over 225,000 patients. The intervention took place between February 2024–January 2025. The study was open to both resident and attending emergency physicians interested in gaining greater proficiency in awake fiberoptic intubation. A convenience sample of volunteer participants was recruited via email and in-person announcements at resident conference. This project was reviewed and approved by the hospital’s institutional review board, and written consent was obtained from all subjects.
We developed a new checklist to evaluate performance of awake fiberoptic intubation among emergency physicians. While prior checklists have been published, our review of the literature found these to be specific to an anesthesia context and lacking in many of the preparatory steps.16-18 With 95% of respondents in a prior needs assessment of emergency physicians reporting the benefit of a “well-organized approach or algorithm” as a facilitating factor impacting the decision to perform awake fiberoptic intubation, we felt that a more detailed step-by-step checklist would be helpful in instruction and subsequent review of the procedure.4
We performed a literature review that informed the creation of a procedural checklist.19–25 A multidisciplinary team of physicians who were board certified in EM, critical
care, and anesthesiology (MB, AD, JA) and had prior experience with awake fiberoptic intubation drafted a checklist and then iteratively refined it in a series of review sessions until consensus was reached (Supplemental Figure 1). The checklist was reviewed by simulation center professionals with training and expertise in the development of procedural checklists. The checklist had 34 maximum points. An instructional video was developed that included relevant anatomy, indications, contraindications, complications, a step-by-step review of the procedure, and troubleshooting steps. The video was approximately 40 minutes in length.
The study took place in a simulation center. On the day of instruction, participants completed a paper pre-course survey, which included participant demographics, relevant prior experience, and self-evaluation of confidence (from “not at all confident” to “very confident” rated on a Likert scale from 1-7) and performance (from “not well at all” to “very well” rated on a Likert scale from 1-7). They were shown the instructional video in situ in the simulation center. Following the instructional video, learners participated in a question-andanswer session followed by hands-on training with 1:1 instructor supervision using a rapid-cycle deliberate practice paradigm. Baseline performance data were collected during the initial training session, after learners viewed the instructional video but before receiving deliberate practice. The same instructor (MB) was used for all participants to minimize variations arising from teaching style. Equipment and patient set-up were performed on a low-fidelity manikin head in a simulated exam room. Insertion and manipulation of the fiberoptic scope was performed using the Simbionix BronchMentor, a bronchoscopy virtual reality trainer (SurgicalScience Sweden AB [publ], Gothenborg, Sweden).
A rapid-cycle deliberate practice approach was used for training during the deliberate practice session wherein learners were given feedback and asked to restart the procedure any time that a checklist step was not performed to mastery level. In alignment with rapid-cycle deliberate practice paradigms, after each step was successfully demonstrated, the procedure was resumed from this step onward, ensuring that every step of the procedure was performed successfully while minimizing unnecessary repetition.
After the initial training session, learners received the procedural checklist and were cued every two weeks to review the procedure through a feedback platform used by the EM residency program, which sent reminders via email and used push notifications. Participants acknowledged within the app when they had completed each biweekly review. Half of participants were randomized to receive mental practice training to supplement their procedural checklist. (The findings of this subgroup analysis will be reported separately.) Data were automatically collected from the bronchoscopy simulator, including total procedural time, percentage of time at mid-lumen, percentage of time with scope-wall contact,
attempts to pass when vocal cords closed, and number of times the scope entered the esophagus. Simulator data collection began when the participant inserted the scope into the device, and the case was manually ended as soon as the participant visualized the carina and verbalized placement of the endotracheal tube. In addition to the procedural checklist, the OSATS GRS was used to evaluate procedural performance with a total of 40 possible points.26
Participants were reassessed at three months using the same procedural checklist, GRS, and simulator metrics. A postintervention survey evaluated participant performance, comfort, and satisfaction with the learning experience. A single study author (MB), who was also involved in checklist development, completed all GRS and checklist forms. We compared performance measures and survey responses between the pre-test and post-test at three months. An immediate post-test was not performed. We used an independent two-sample t-test to compare the numerical variables, as well as the Likert scale data from the survey. Data are reported as mean (standard deviation). We chose chi-square analysis or the Fisher exact test for intergroup comparisons of demographic categorical variables as appropriate, and categorical variables were expressed as numbers and percentages. P values lower than .05 were considered statistically significant. The calculations were performed using statistical software SAS v9.4 (SAS Institute Inc., Cary, NC).
RESULTS
A total of 51 participants enrolled and 46 completed the study between February 8, 2024–January 23, 2025. Study participant demographics are shown in Table 1. Five participants were enrolled but did not ultimately take part in the study due to scheduling conflicts. Two participants had simulator data excluded from analysis due to technical errors with the simulator.
Objective performance metrics improved between the pre-test and three-month post-test. The primary outcome— observed performance using the GRS—improved from a mean of 22.5 (4.5) to 28.8 (6.3), P < .001. Total simulator time, from scope insertion to verbalized passage of the endotracheal tube improved, decreasing from 147.0 (148.3) seconds to 84.6 (39.1) seconds (P = .01). No significant change was seen in procedural checklist items completed, which increased from 27.1 (3.5) items to 27.9 (4.0) items (P = .27).
Additional improvements were seen in simulator metrics. The proportion of learners who required < 120 seconds for intubation increased from 22/46 (47.83%) to 38/46 (82.61%) (P < .001). All the following showed improvements, although none met statistical significance: percentage of time at midlumen (66.3 [26.5], 67.1 [25.8]); percentage of time with scope-wall contact (0.4 [1.1], 0.3 [0.9]); number of attempts to pass when vocal cords closed (1.4 [1.6], 1 [0.2]); and number of times the scope entered the esophagus (2.7 [2.7], 1.3 [0.8]).
Table 1. Baseline characteristics of participants in a study of a
Level of training
PGY 1 6 (13.04)
PGY 2 11 (23.91)
PGY 3 9 (19.57)
PGY 4 4 (8.7)
PGY 5 1 (2.17) Attending 15 (32.61)
Number of times performing awake fiberoptic intubation
0 28 (60.87) 1-2 14 (30.43)
3-4 2 (4.35)
5-10 1 (2.17)
>10 1 (2.17)
Number of times performing similar procedures 0 10 (21.74)
1-2 21 (45.65)
3-4 3 (6.52)
5-10 5 (10.87)
>10 7 (15.22)
PGY, postgraduate year.
Self-assessed performance improved between the pre-test and the three-month post-test as well. Improvement was seen among participants’ rating of “how confident do you feel carrying out an awake fiberoptic intubation”: 3.0 (1.5) to 5.1 (1.2), P < .001. Likewise, improvements were seen in response to “how well do you think you can perform an awake fiberoptic intubation compared to others at your stage of training”: 3.7 (1.5) to 5.0 (1.2), P < .001 (Figure 1).
Three participants reported having performed an awake fiberoptic intubation in the clinical setting in the period between the pre-test and post-test at three months. Participants responded to biweekly reminders to review the study materials a mean of 4.3 times (2.5) between the initial and post-test sessions. Additional self-reported measures of participation are seen in Table 2. Time between pre-test and post-test sessions was 96.9 (18.2) days.
A positive correlation was found between the total checklist score and the GRS, but these did not inversely correlate with total procedure time (Figure 2).
DISCUSSION
In this single-center pilot study, we developed and implemented a novel simulation-based curriculum to teach awake fiberoptic intubation and evaluate performance among
Figure 1. Comparisons of participants’ self-assessed performance between pre- and three-month post-test in a study of a simulationbased awake fiberoptic intubation curriculum. AFOI, awake fiberoptic intubation.
emergency physicians. We demonstrated improvements in both subjective evaluation of performance using a GRS and in objective simulator metrics between a pre-test and a threemonth post-test. Survey results suggest participants felt significantly more proficient and confident with the procedure after taking the course.
To our knowledge, no comprehensive curriculum has been previously described for instructing and evaluating awake fiberoptic intubation among emergency physicians. Prior research has shown that brief educational interventions such as ours have the potential to improve skill performance. Naik et al showed that a one-hour training session was sufficient to learn the basics of awake fiberoptic intubation among a group of anesthesiology residents.18 Likewise, McCloskey et al showed structured peer coaching can improve comfort with the procedure in a group of emergency faculty.5
We found significant improvements in participants’ confidence in their ability to perform awake fiberoptic intubation between a pre-test and a three-month post-test. Emergency physicians generally report limited procedural opportunities and overall low confidence performing awake fiberoptic intubation.4 Further, most respondents reported that a lack of confidence was a factor when considering whether to perform the procedure.4 The gains in confidence after completing this simulation training may help to overcome this barrier to performing this potentially lifesaving procedure. This curriculum demonstrated consistent improvement in participants’ ability to simulate successful placement of an endotracheal tube positioned above the carina in ≤ 120 seconds between a pre-test and a three-month post-test. A total procedure time of < 2 minutes has been proposed as part of a minimum passing standard in prior studies.27,28
This study used both a low-fidelity manakin and a virtual reality bronchoscopy task trainer in a simulation lab setting. Simulation-based training models have been shown to consistently increase procedural skill in learners and are well
Table 2. Participants’ engagement with study material in a study of a simulation-based awake fiberoptic intubation curriculum.
How often did you review the procedure during the study period? n (%)
Never
Less than once a month
3 (6.52)
5 (10.9)
Once 2 (4.4)
At least once a month
Every two weeks
How long were your practice sessions?
< 5 minutes
5 - 10 minutes
10 - 20 minutes
> 20 minutes
Did you use the study materials provided?
No
Yes
21 (45.7)
15 (32.6)
22 (47.8)
18 (39.1)
5 (10.9)
1 (2.2)
6 (13.0)
40 (87.0)
described in the EM literature.29 While bronchoscopy task trainers are not commonly used in EM, this simulator equipment has been well described in other procedural specialties and is present in many comprehensive medical simulation settings.27,30-34 Task trainers of this type vary in their capabilities, but many include realistic depictions of anatomy, simulated vital signs, ability to respond to scope maneuvering with haptic feedback, and the ability to collect volumes of quantitative feedback. These task trainers are present in many medical school and hospital simulation labs, as they are used in common simulation courses for endoscopy and bronchoscopy.35,36
Prior studies have shown that training with bronchoscopy simulators can improve simulated performance of an awake fiberoptic intubation.31,37 Furthermore, studies have shown that performance improvements of awake fiberoptic intubation in simulated settings directly translate to improved performance in real patients, supporting the notion that the improvements we have described in this study could potentially translate to improved patient outcomes.18,30,32,38,39
We present validity evidence for this checklist.40 A review of the literature to inform checklist development and multispecialty expert review contributed toward content validity. For consistency in response process, the subjects received the same video training and the same author instructed all subjects and answered the Q&A. Additionally, participants were familiarized with equipment prior to data collection. Statistically significant correlations were noted between GRS totals and checklist totals, demonstrating validity evidence of relationship to other variables (Figure 2).
In this study we used a multimodal approach to standardize assessment between learners; this approach
Figure 2. A scatterplot matrix demonstrating pairwise correlations between global rating scale, total checklist items, and the inverse of total procedural time in a study of a simulation-based awake fiberoptic intubation curriculum. GRS, global rating scale.
included a GRS, a checklist, and objective metrics collected from the bronchoscope simulator. While we noted the absence of a measurable performance increase in checklist scores in our cohort, at the same time we saw improvements in both GRS and simulator metrics. This supports the utility of an evaluation scheme that extends beyond checklists alone. Checklists have been criticized as measures of thoroughness rather than competence, and the use of a GRS may be superior to the use of checklists.26,41
It is possible that the sample size in our study may not have been sufficient to identify improvement in performance using the checklist alone. It is also possible that the correlation between checklist scores and GRS may be statistically significant but not clinically meaningful considering the
absence of corresponding checklist-score improvement. While we saw improvements in GRS scores and in total simulator time, we did not see an inverse correlation between these two variables. This finding may reflect an underpowered sample insufficient to detect a correlation, or it may indicate that these two outcomes capture distinct aspects of competence, as proficiency may occur independently of speed. Further study regarding discriminatory value of items on the checklist may result in a checklist that can better distinguish levels of performance among participants.
Global rating scales have previously been found to have high inter-rater reliability and validity when compared to a performance checklist alone when performing technical skill evaluations.26,42 The initial study describing the use of the GRS in the context of OSATS demonstrated measures of validity including content validity, inter-rater reliability, internal consistency, correlation between checklist and GRS, and reliable effects of year of training on GRS performance.14 The GRS has subsequently been extensively studied, and broad validity evidence has been gathered across contexts.42 Prior studies in the anesthesiology literature have described the use of the GRS in the evaluation of trainees performing awake fiberoptic intubation in combination with objective simulator data, although this paradigm is not well described in the EM literature.18,30,32 Correlation among these factors in this study supports the validity of using a multimodal approach for evaluating the performance of this procedure among EM trainees as well.
LIMITATIONS
This study was limited by its single-center and singlespecialty design, use of a single rater, and a small sample size, all of which limit generalizability. The virtual reality bronchoscopy simulator allowed for practice only on standard airway anatomy, which does not represent the range of anatomic and physiologic challenges that would often necessitate performance of an awake fiberoptic intubation in the clinical arena. The nasal approach to awake fiberoptic intubation was not taught due to limitations of the simulator. Future research will be needed to evaluate performance with more challenging simulated anatomy and physiology.
There were significant differences in baseline training and competency among participants, and it is unclear how this may have influenced the results of the study. The design of the study used a single instructor for all deliberate practice to minimize educational variability. Thus, the curriculum will need to be studied among a broader range of instructors to ensure reliability.
The three-month latency period between initial training and post-test includes some degree of natural skill degradation, and the lack of an immediate post-test limits evaluation of training effects absent the skill degradation. We attempted to mitigate this using biweekly reminders for
participants to review the procedural checklist. However, there was significant variation in self-reported number of review sessions and total time spent in review among participants, which may have impacted post-test performance. A longer latency period may be necessary to assess more realistic gaps between practice and clinical performance of this infrequently performed procedure.
Lastly, although we attempted to develop a procedural checklist based on best practices from the available literature, the validity evidence for this checklist is limited. Future study will be needed to examine additional validity evidence for this checklist, including collection of internal structure validity evidence assessing measures of test-retest reliability, internal consistency, and item analysis. As a sole study author performed all learner ratings using the checklist, we did not undertake rater training and were unable to collect responseprocess validity evidence regarding rater comprehension of checklist items or measures of inter-rater reliability. Consequential validity was not examined; further study will be needed to evaluate passing standards as well as implications on learners and patients. Additional study will also be needed to determine standardized score thresholds for a minimum passing standard and the ability of this checklist to discriminate between experts and novices.
CONCLUSION
This pilot study evaluating a novel simulation-based curriculum to teach awake fiberoptic intubation to emergency physicians demonstrated improvements in performance at three months. High levels of learner satisfaction and confidence were demonstrated, and we observed significant improvements in subjective and objective performance characteristics at a three-month post-test interval. Further study will be needed to collect additional validity evidence on our novel checklist, determine score cutoffs for minimal acceptable performance, evaluate correlation between simulated performance and patient outcomes, and assess application to distorted or more challenging airways.
ACKNOWLEDGMENTS
Our gratitude to ChristianaCare’s Virtual Education and Simulation Training Center team for their assistance with this project.
Address for Correspondence: Maxwell Blodgett, MD, MEd, Christiana Care Health System, Department of Emergency Medicine, 4755 Ogletown-Stanton Road, P.O. Box 6001, Newark, DE 19711. Email: Max.blodgett@christianacare.org.
Conflicts of Interest: By the WestJEM article submission agreement, all authors are required to disclose all affiliations, funding sources and financial or management relationships that could be perceived as potential sources of bias. No author has
professional or financial relationships with any companies that are relevant to this study. There are no conflicts of interest or sources of funding to declare.
1. Hayden EM, Pallin DJ, Wilcox SR, et al. Emergency department adult fiberoptic intubations: incidence, indications, and implications for training. Acad Emerg Med. 2018;25(11):1263-1267.
2. Collins SR, Blank RS. Fiberoptic intubation: an overview and update. Respiratory Care. 2014;59(6):865-880.
3. Heidegger T, Gerig HJ, Henderson JJ. Strategies and algorithms for management of the difficult airway. Best Pract Res Clin Anaesthesiol 2005;19(4):661-674.
4. Sandefur BJ, Shappell EF, Campbell RL, et al. Flexible endoscopic intubation in emergency medicine: a mixed-methods needs assessment. AEM Educ. Train. 2024;8(3):e10992.
5. McCloskey CG, Dimza CT, Stull MJ. Peer coaching increases emergency medicine faculty ability to perform and teach awake fiberoptic intubation. AEM Educ. Train. 2021;5(4):e10705.
6. Ziv A, Wolpe PR, Small SD, et al. Simulation-based medical education: an ethical imperative. Acad Med. 2003;78(8):783-788.
7. Barsuk JH, McGaghie WC, Cohen ER, et al. Simulation-based mastery learning reduces complications during central venous catheter insertion in a medical intensive care unit. Crit Care Med 2009;37(10):2697-2701.
8. Magee MJ, Farkouh-Karoleski C, Rosen TS. Improvement of immediate performance in neonatal resuscitation through rapid cycle deliberate practice training. J Grad Med Educ. 2018;10(2):192-197.
9. Cory MJ, Colman N, McCracken CE, et al. Rapid cycle deliberate practice versus reflective debriefing for pediatric septic shock training. Pediatr Crit Care Med. 2019;20(5):481-489.
10. Edmunds KJ, Shah A, Geis GL, et al. Rapid cycle deliberate practice to improve airway skills and performance of trainees in a pediatric emergency department. AEM Educ. Train. 2024;8(1):e10928.
11. Peng C, Ng KM, Roszczynialski KN, et al. Rapid cycle deliberate practice in virtual reality: teaching transvenous pacemaker insertion to emergency medicine residents. Cureus. 2021. Available at: https:// www.cureus.com/articles/20728-rapid-cycle-deliberate-practice-rcdpas-a-method-to-improve-airway-management-skills---a-randomizedcontrolled-simulation-study#!/. Accessed November 15, 2025.
12. Gross IT, Abrahan DG, Kumar A, et al. Rapid cycle deliberate practice (RCDP) as a method to improve airway management skills – a randomized controlled simulation study. Cureus. Published online September 1, 2019. Accessed November 15, 2025.
13. Lawrence Lau, Papanagnou D, Smith E, et al. A novel biosimulation
task trainer for the deliberate practice of resuscitative hysterotomy. Adv Simul. 2018;3(1):19.
14. Martin JA, Regehr G, Reznick R, et al. Objective structured assessment of technical skill (OSATS) for surgical residents. Br J Surg. 1997;84(2):273-278.
15. Vaidya A, Aydin A, Ridgley J, et al. Current status of technical skills assessment tools in surgery: a systematic review. J Surg Res 2020;246:342-378.
16. Chandra DB, Savoldelli GL, Joo HS, et al. Fiberoptic oral intubation: the effect of model fidelity on training for transfer to patient care. Anesthesiology. 2008;109(6):1007-1013.
17. K Latif R, Bautista A, Duan X, et al. Teaching basic fiberoptic intubation skills in a simulator: initial learning and skills decay. J Anesth. 2016;30(1):12-19.
18. Naik VN, Matsumoto ED, Houston PL, et al. Fiberoptic orotracheal intubation on anesthetized patients: Do manipulation skills learned on a simple model transfer into the operating room? Anesthesiology 2001;95(2):343-348.
19. Erb T, Hampl KF, Schürch M, et al. Teaching the use of fiberoptic intubation in anesthetized, spontaneously breathing patients. Anesth Analg. 1999;89(5):1292.
20. Lee JSE, Wong J, Iqbal R, et al. Practical aspects and training in fibreoptic intubation. Tren. Anaesth. Crit. Car. 2016;10:29-41.
21. Artime CA, Parotto M, Hagberg CA. Airway Management in the Adult. In: Miller’s Anesthesia, 2 Volume Set. Vol 1-2. Elsevier; 2024:12271266.e7.
22. Gil K. Is fiber-optic intubation necessary? Fiber-optic intubation: tips from the ASA workshop. Anesthesiol News Guide Airw Manage 2012;35:21-29.
23. Hagberg CA, ed. Hagberg and Benumof’s Airway Management, 5th Ed. Philadelphia, PA: Elsevier Health Sciences; 2023:433-477.
24. Koerner IP, Brambrink AM. Fiberoptic techniques. In: Best Practice & Research Clinical Anaesthesiology. 2005;19(4):611-621.
25. Tonna JE, DeBlieux PMC. Awake laryngoscopy in the emergency department. J Emerg Med. 2017;52(3):324-331.
26. Regehr G, MacRae H, Reznick RK, et al. Comparing the psychometric properties of checklists and global rating scales for assessing performance on an OSCE-format examination. Acad Med 1998;73(9):993-997.
27. Binstadt E, Donner S, Nelson J, et al. Simulator training improves fiber-optic intubation proficiency among emergency medicine residents. Acad Emerg Med. 2008;15(11):1211-1214.
28. Johnson C, Roberts JT. Clinical competence in the performance of fiberoptic laryngoscopy and endotracheal intubation: a study of resident instruction. J Clin Anesth. 1989;1(5):344-349.
29. Wang EE, Quinones J, Fitch MT, et al. Developing technical expertise in emergency medicine—the role of simulation in procedural skill acquisition. Acad Emerg Med. 2008;15(11):1046-1057.
30. Wong DT, Mehta A, Singh KP, et al. The effect of virtual reality bronchoscopy simulator training on performance of bronchoscopicguided intubation in patients: a randomised controlled trial. Eur. J.
Anaesthesiol. 2019;36(3):227.
31. Blum MG, Powers TW, Sundaresan S. Bronchoscopy simulator effectively prepares junior residents to competently perform basic clinical bronchoscopy. Ann. Thorac. Surg. 2004;78(1):287-291.
32. Chandra DB, Savoldelli GL, Joo HS, et al. Fiberoptic oral intubation: the effect of model fidelity on training for transfer to patient care. Anesthesiology. 2008;109(6):1007-1013.
33. Ernst A, Wahidi MM, Read CA, et al. Adult Bronchoscopy Training: Current State and Suggestions for the Future: CHEST Expert Panel Report. Chest. 2015;148(2):321-332.
34. Graeser K, Konge L, Kristensen MS, et al. Airway management in a bronchoscopic simulator based setting: an observational study. Eur J Anaesthesiol. 2014;31(3):125-130.
35. Aslam W, Lee HJ, Lamb CR. Standardizing education in interventional pulmonology in the midst of technological change. J Thorac Dis. 2020;12(6):3331-3340.
36. Vassiliou MC, Dunkin BJ, Fried GM, et al. Fundamentals of endoscopic surgery: creation and validation of the hands-on test. Surg Endosc. 2014;28(3):704-711.
37. Nilsson PM, Russell L, Ringsted C, et al. Simulation-based training in flexible fibreoptic intubation: A randomised study. Eur. J. Anaesthesiol. 2015;32(9):609.
38. Goldmann K, Steinfeldt T. Acquisition of basic fiberoptic intubation skills with a virtual reality airway simulator. J Clin Anesth 2006;18(3):173-178.
39. Rowe R, Cohen RA. An evaluation of a virtual reality airway simulator. Anesth Analg. 2002;95(1):62-66.
40. Eignor DR. The standards for educational and psychological testing. In: APA Handbook of Testing and Assessment in Psychology, Vol. 1: Test Theory and Testing and Assessment in Industrial and Organizational Psychology. APA handbooks in psychology. American Psychological Association; 2013:245-250.
41. Cunnington JPW, Neville AJ, Norman GR. The risks of thoroughness: Reliability and validity of global ratings and checklists in an OSCE. Adv Health Sci Educ. 1996;1(3):227-233.
42. Ilgen JS, Ma IWY, Hatala R, et al. A systematic review of validity evidence for checklists versus global rating scales in simulationbased assessment. Med Educ. 2015;49(2):161-173.
Original Research
Randomized
Controlled Pilot Study of Transcutaneous Electrical Nerve Stimulation for Acute Back Pain in Emergency Department Patients
Maxwell Moor-Smith, MD*†
Nicholas Kozak, MD*
Michael McCue, MD*
Julia Wilson, MD*
Tristan Jones, MD, MSc*†
Samuel Brophy, MD, MPH*‡§
Section Editor: Juan F. Acosta, DO, MS
University of British Columbia, Vancouver, BC, Canada
Island Health, Emergency Medicine, Victoria, BC, Canada Island Health, Emergency Medicine, Port Alberni, BC, Canada Island Health, Pain Program, Victoria, BC, Canada
Submission history: Submitted June 6, 2025; Revision received November 4, 2025; Accepted November 20, 2025
Electronically published April 8, 2026
Full text available through open access at http://escholarship.org/uc/uciem_westjem DOI 10.5811/westjem.48818
Background: Musculoskeletal back pain is a common presenting complaint to emergency departments (ED) worldwide. In this study we aimed to evaluate the effectiveness of transcutaneous electrical nerve stimulation (TENS) as an adjunct to standard care in reducing pain for patients presenting with acute low back pain.
Methods: This study has a dual-center, open-label, cluster-randomized controlled trial design. Participants were recruited from two tertiary-care EDs in Canada. We included patients with acute or acute-on-chronic back pain of < 3 weeks duration. Participants were randomized to receive either TENS for 30 minutes plus standard care, or standard care alone. We measured pain scores using the Visual Analogue Scale (VAS) at baseline, 30 minutes, and 60 minutes after initiation of the intervention. The primary outcome was the difference in mean VAS pain scores at 60 minutes between the two groups.
Results: Of 94 patients considered, we enrolled 25 participants (15 control and 10 intervention). The group receiving TENS plus standard care showed a statistically significant reduction in pain scores compared to the standard care alone group at both the 30-minute (relative mean difference: 22.6%; absolute difference: 1.7 points on 10-point VAS (95% CI, -31.9%, -13.4%, P < .001) and 60-minute timepoints (relative mean difference 18.2%, absolute difference 1.4 points (-32.7%, -3.8%, P = .04). There were two return visits in the intervention group within two weeks from the index visit, and two patients reported slight discomfort with using TENS, although they kept the device on for the duration of the trial period.
Conclusion: The addition of transcutaneous electrical nerve stimulation to standard care resulted in a modest but statistically significant reduction in pain scores for patients with acute back pain in the ED setting, although it did not meet our predefined threshold of clinical significance. Further research with larger sample sizes is required to clarify the effect size and role of TENS for acute back pain in the ED waiting room. [West J Emerg Med. 2026;27(3)753–758.]
INTRODUCTION
Back pain is one of the most common presenting complaints in the emergency department (ED), accounting for approximately 3% of all ED visits.1,2 Most of these
patients will leave the ED with a non-specific diagnosis, such as mechanical low back pain, and will recover within 4-6 weeks.3 Pharmacologic therapy is generally limited to nonsteroidal anti-inflammatory drugs (NSAID), acetaminophen,
and opioids in severe cases. A recent Cochrane review found all these therapies either lack high-quality evidence for pain reduction compared to placebo or have high-quality evidence showing equivalence with placebo.4
Transcutaneous electrical nerve stimulation (TENS) is a non-pharmacological option for the treatment of pain based on the gate control theory: Stimulation of large myelinated fibers reduces transmission of pain through smaller nociceptive C-fibers through inhibitory actions of interneurons.5 The procedure is safe and inexpensive, with very few reported adverse effects and a short list of contraindications.6-8 Because professional bodies have established evidence-based safety guidelines for TENS, procedures for patient safety, consent, and monitoring are already in widespread use in physiotherapy.9
In 2005 a randomized controlled trial looked at pain reduction with TENS for back pain in the prehospital setting, and found a significant reduction in pain scores after 30 minutes of TENS treatment during transport of those with acute back pain lasting < 6 hours.8 The study was included in a 2019 systemic review from Binny et al, who found insufficient evidence to support or dismiss the use of TENS for acute low back pain. However, of three trials included in this systematic review, two evaluated the use of TENS over four-week periods, which is of questionable relevance to ED pain management.7 Indeed, a 2015 Cochrane review of TENS for acute pain found tentative evidence for TENS reducing pain intensity, acknowledging the high risk of bias in included trials.6
A 2018 pilot trial of 110 patients looked at provision of TENS in the ED for pain relief, without limitations to chief complaint. Based on survey data, the authors found 83% of patients reported a functional improvement with TENS and 100% would recommend it to a family member or friend.10
TENS has also shown some benefit in treating acute pelvic pain in young women,11 post-traumatic hip pain,12 and low back pain during pregnancy;13 it remains to be seen whether TENS has a role to play for acute back pain in the ED waiting room. If effective, TENS may have a role as an inexpensive and safe, nurse-initiated intervention that could improve the care of patients presenting to the ED with acute back pain.
METHODS
Study Design and Setting
We completed a dual-centre, open-label, clusterrandomized controlled trial at two tertiary-care EDs in Canada. This study was reviewed by the University of British Columbia Harmonized Ethics Board and was considered no more than minimal risk and was approved. The study is reported in accordance with the Consolidated Standards of Reporting Trials 2010 checklist for reporting a randomized trial. Our trial design was pre-published on ClinicalTrials.gov (ID: NCT05601843).
Population Health Research Capsule
What do we already know about this issue?
TENS can reduce acute pain in some settings, but evidence for its effectiveness for acute back pain in the emergency department remains limited and inconsistent.
What was the research question?
Does adding TENS to standard care reduce acute back pain more than standard care alone in ED patients?
What was the major finding of the study?
TENS cut VAS pain 18.2% more than control at 60 min (1.4-pt diff; 95% CI −32.7 to −3.8; p=0.04).
How does this improve population health?
TENS offers a safe, low-cost option that may reduce pain and opioid use in ED patients with acute back pain, improving comfort and supporting non-pharmacologic care.
Selection of Participants
We enrolled patients over two weeks in May 2023. Participants were recruited in the ED waiting room by research assistants if they had a primary triage complaint of “back pain” as per the Canadian Emergency Department Information System.14 We included English-speaking patients > 18 years of age who reported acute or acute-on-chronic back pain of < 3 weeks duration, had a projected wait time of at least 30 minutes, and were triaged as Canadian Triage and Acuity Scale (CTAS) between 3 and 5 in the ambulatory section of the ED. Patients were excluded if they had predetermined “red flags” on history (ie, reported fever, direct trauma, bilateral radicular symptoms, incontinence or retention of urine or stool, saddle anesthesia, or intravenous drug use within 30 days), had abnormal triage vital signs, were pregnant, had a history of epilepsy or spinal cord injury, had evidence of skin breakdown at TENS pad-placement site, or had an implanted pacemaker or neurostimulation device.
Intervention
All enrolled participants provided written informed consent, and baseline demographic data was collected. Participants were cluster randomized based on which of the two trial EDs they presented to during the trial period, with Site 1 as the control site in the first week and the intervention site for the second week, while Site 2 had the opposite
schedule (see Figure 1). Participants were informed of their group assignment after enrollment. The TENS machine used for the trial was the Impulse 3000 T (2014 BioMedical Life Systems, Inc., Carlsbad, CA), applied in a frame-like pattern 3-6 cm away from the subjective area of maximal pain. The manufacturer had no role in this project or in the writing of this paper. The TENS treatment lasted 30 minutes, with the frequency set to 100 hertz and the amplitude adjusted based on participant comfort. No sham TENS was used in the control group for this trial. Standard care was provided for both the control group and TENS group, including nurseinitiated analgesia (ie, acetaminophen or ibuprofen), and any physician-ordered interventions (ie, opioids). Data on use of additional interventions (eg, trigger point injections, nerve blocks) was not collected, as this was not part of routine practice pattern at the time of this trial. The Visual Analogue Scale (VAS) was used to collect pain scores from participants after enrollment (T0), at 30 minutes (T30), and at 60 minutes (T60) after initiation of TENS treatment.
Outcome Measures
Our primary outcome selected a priori was difference in mean VAS pain scores at T60 between the group treated with TENS + standard care, compared to standard care alone. The T60 interval was chosen as the primary endpoint to allow sufficient time for standard care (ie, pharmacotherapy) to take effect and to determine whether any benefit provided by TENS would be sustained. Difference in pain score at 30 minutes was examined as a secondary outcome. We a priori determined a 30% reduction of pain to be clinically significant based on similar thresholds reported in prior literature.11,12,15 We also compared the difference in opioid requirement, calculated by oral morphine equivalents (OME) used while in the ED, as well as return visits to the ED for back pain within two weeks. We did not tally non-opioid medications therapies used by participants due to lack of standard pharmacologic orders at trial sites at the time of the trial, difficulty combining data on over-the-counter use of various forms of these medications (eg, no reliable equivalency between NSAIDs or acetaminophen combination products), as well as local challenges gathering this data. Reports of adverse effects of TENS were collected and reported in a narrative format.
Statistical Analysis
We planned to sample 20 participants (10 per study arm) over the two-week trial period based on a sample size calculation done prior to study initiation. In keeping with prior literature, a 95% power to detect an effect size of 30% at the 0.05 alpha level was used. Descriptive statistics are reported as means, standard deviations (SD), and percentages, with 95% confidence intervals for differences between groups. Comparison between groups was performed by an unpaired parametric t-test. We performed all analyses using Stata v17 (StataCorp, LLC, College Station, TX).
Figure 1. Cluster randomization by site of visit for a study of the use of transcutaneous electrical nerve stimulation for acute back pain in the emergency department.
Patient and Public Involvement
There was no involvement of patients or public in the design of this trial.
RESULTS
94 patients were screened for participation in this trial, with 69 patients excluded. Most were excluded for not meeting inclusion/exclusion criteria (n=57, 82.6%), for which “red flags” for serious causes of back pain was the primary reason for exclusion (n=25, 36.2%). Of these, direct trauma to the back (n=11, 15.9%), bilateral radicular symptoms (n=6, 8.7%), and retention/incontinence of urine/stool (n=5, 7.2%) were the most common.
Overall, we enrolled 25 participants, of whom 52% were female with a median age of 44 (interquartile range [IQR] 34,7; 20-84), with 56% reporting a prior history of back pain. The median initial VAS pain score was 7.5 (SD 2.5; 0-10) with a mean duration of symptoms prior to presentation of 5.5 days (SD 5.2; 0.1-18). The enrollment between the sites was approximately equal, with 52% (n = 13) presenting to Site 1.
For our primary endpoint, we found a statistically significant reduction in VAS pain scores for TENS + standard care compared to standard care alone at the T60 time point, with a relative mean difference of 18.2% (95% CI, -32.7%,
Transcutaneous Electrical Nerve Stimulation for Acute Back Pain Moor-Smith
Table 1. Baseline characteristics of participants in a study of the use of transcutaneous electrical nerve stimulation for acute back pain in the emergency department.
BP, blood pressure; HR, heart rate; SD, standard deviation; VAS, Visual Analogue Scale.
Figure 2. Enrollment of participants for a study examining effect of transcutaneous electrical nerve stimulation for acute back pain in the emergency department.
CONSORT 2010 flow diagram. CONSORT, Consolidated Standards of Reporting Trials.
Figure 3. In a study of transcutaneous electrical nerve stimulation (TENS) for acute back pain in the emergency department, there was a statistically significant reduction in individual and mean Visual Analogue Scale pain scores in the intervention group (TENS + standard care) compared to the control group (standard care).
-3.8%, P = .04). This corresponds to a reduction of mean pain score of 1.5-points in the intervention group compared to a 0.1-point reduction in the control group (absolute difference of 1.4 VAS points). Similarly, there was a statistically significant reduction in pain at the T30 time point, with a mean difference of 22.6% (95% CI, -31.9%, -13.4%, P < .001), corresponding to a reduction of 1.8-points in the intervention group and a
0.06-point reduction in the control group (absolute difference of 1.74 VAS points). Although the reductions in VAS pain scores were statistically significant, they did not meet our a priori definition of clinical significance (a 30% reduction in pain scores). Additionally, there was a non-significant trend toward reduced opioid requirements in the control group (30.0 vs 13.8 OME, P = .74). (See Table 2.) Of the two patients who returned to the ED within two weeks after index visit, both were in the intervention group; one requested a note for work, and one requested further analgesia.
Two patients reported adverse events while using the TENS machine; one patient stated they had self-resolving light-headedness and warmth in the first five minutes, and
Figure 4. Visualization of the mean percentage reduction in VAS* pain score, at 30 and 60 minutes, between the control group and the intervention group in a study of transcutaneous electrical nerve stimulation for acute back pain in the emergency department.
*VAS, Visual Analogue Scale.
another reported new abdominal pain. However, no patients removed the TENS machine early due to these adverse events. There were no major deviations from the protocol.
DISCUSSION
This study aimed to investigate the feasibility and effectiveness of using TENS as an adjunct to standard care for acute low back pain in the emergency department (ED). Our results demonstrate a statistically significant reduction in pain scores in the TENS group compared to the control group at both the 30-minute and 60-minute time points. While the reduction did not meet the predefined threshold for clinical significance (ie. 30%), there was a mean difference in pain reduction of 22.6% 30 minutes after TENS treatment, which was sustained at 18.2% at 60 minutes post-treatment. There was a trend toward reduced opioid use in the TENS group though this was a secondary outcome and not statistically significant. No patients removed TENS pads due to discomfort or adverse events.
Our results are consistent with prior literature demonstrating a reduction in acute pain with use of TENS. Only one prior trial has examined the effectiveness of TENS
for back pain in the acute (< 3 weeks) setting, which found a statistically significant reduction in pain after a 30-minute TENS treatment during emergency transport to hospital,8 To our knowledge, this is the first published trial to examine the effectiveness of TENS for back pain in the ED waiting room. Several other trials have shown benefit with TENS in a variety of types of pain including renal colic, acute pelvic pain, pregnancy-related acute back pain, post-traumatic hip pain, and even unsedated colonoscopy.6,11-13 Taken together, these findings highlight the potential versatility and applicability of TENS in the ED setting.
The use of TENS in the ED has several advantages. It offers a safe and cost-effective alternative to pharmacological interventions, potentially reducing the reliance on opioids. Transcutaneous electrical nerve stimulation can be initiated by nurses, making it a feasible option in the ED waiting room that enhances patient care and satisfaction, particularly as average ED wait times are increasing rapidly. Furthermore, TENS can be prescribed to patients, extending the period of potential reduction of pharmacologic reliance and facilitating physical therapy.9
Previous research on TENS has been limited by small sample sizes, variable controls, and a lack of consistent standards for TENS dosing. Further research should focus on optimizing TENS dosing for standard study design, larger sample sizes across multiple centers, patients with historical “red flags,” and adequate blinding of participants (ie, use of a transient sham TENS device that provides < 1 minute of stimulation to reduce awareness of placebo).
LIMITATIONS
There are several limitations for this trial. Due to funding restrictions preventing a longer period of study, this trial had a small sample size and was isolated to two urban EDs in the same city. This would limit generalizability to smaller centers or differing populations. Similarly, we had a relatively high rate of exclusions based on patient-reported “red flags” for back pain. There is no evidence that back pain with an underlying serious etiology is worsened by TENS; therefore, it may still be appropriate for these patients to receive TENS in the ED outside a research setting. Research on the use/safety of TENS in this patient subgroup should be considered.
Table 2. Comparison of opioid medications provided as part of standard care between intervention and control groups, in OME (Oral Morphine Equivalency) for TENS for acute back pain in the ED. Patients may have received non-opioid analgesia but this data was not collected. There was a non-significant trend toward reduced opioid requirements in the control group (30 vs 13 OME, P =.74).
OME, oral morphine equivalency; SD, standard deviation.
Transcutaneous Electrical Nerve Stimulation for Acute Back Pain
In contrast to prior research, we elected to compare TENS with standard care against standard care alone, leaving the patients unblinded after randomization. Transcutaneous electrical nerve stimulation necessarily produces a sensation when being used, and a patient’s ability to adjust TENS amplitude would make it clear if sham TENS were being used. This approach was chosen to reflect pragmatic use of the device in the ED waiting-room environment. As pain is an inherently subjective outcome, we anticipated that by comparing the addition of TENS to standard care alone we would produce a result that more adequately informs realworld practice. Finally, our results are limited by lack of data on non-opioid and non-pharmacological analgesia received. Due to local challenges in obtaining this data, we were unable to determine whether the provision of this analgesia differed between the groups. Oral morphine equivalency use while in the ED was tallied, reflecting a surrogate measure of overall opioid requirement.
CONCLUSION
This pragmatic, open-label, randomized controlled trial demonstrated modest effectiveness of transcutaneous electrical nerve stimulation as an adjunct to standard care for acute back pain in the ED, although this did not meet our predetermined threshold of clinical significance.
Address for Correspondence: Maxwell Moor-Smith, MD, University of British Columbia, 6200 University Blvd, Vancouver, BC, Canada V6T 1Z4. Email: Maxwell.MoorSmith@islandhealth.ca.
Conflicts of Interest: By the WestJEM article submission agreement, all authors are required to disclose all affiliations, funding sources and financial or management relationships that could be perceived as potential sources of bias. The author has professional or financial relationships with any companies that are relevant to this study. There are conflicts of interest or sources of funding to declare. This trial received financial support from the Island Health Seed Grant and the Resident Doctors of British Columbia Innovation Fund Award.
1. Edwards J, Hayden J, Asbridge M, et al. The prevalence of low back pain in the emergency department: a descriptive study set in the
Charles V. Keating Emergency and Trauma Centre, Halifax, Nova Scotia, Canada. BMC Musculoskelet Disord 2018;19(1):306.s
2. Edwards J, Hayden J, Asbridge M, et al. Prevalence of low back pain in emergency settings: a systematic review and meta-analysis. BMC Musculoskelet Disord, 2017.18(1);143.
3. Winters, M. E., Kluetz, P., & Zilberstein, J. (2006). Back pain emergencies. Med Clin North Am, 90(3), 505–523.
4. Cashin, A. G., Wand, B. M., O’Connell, N. E, et al. (2023). Pharmacological treatments for low back pain in adults: an overview of Cochrane Reviews. The Cochrane Database of Systematic Reviews, 4(4), CD013815.
5. Kandel ER, Schwartz JH, Jessell TM. Principles of Neural Science. 4th ed. New York, NY: McGraw-Hill; 2000:482-486.
6. Johnson, M. I., Paley, C. A., Howe, T. E., et al. (2015).
Transcutaneous electrical nerve stimulation for acute pain. The Cochrane Database of Systematic Reviews, 2015(6), CD006142.
7. Binny, J., Joshua Wong, N. L., Garga, S., et al. (2019).
Transcutaneous electric nerve stimulation (TENS) for acute low back pain: systematic review. Scandinavian Journal of Pain, 19(2), 225–233.
8. Bertalanffy, A., Kober, A., Bertalanffy, P., et al. (2005).
Transcutaneous electrical nerve stimulation reduces acute low back pain during emergency transport. Acad Emerg Med, 12(7), 607–611.
9. Robertson V.J., Chipchase L.S., Laakso E.L., et al. Electrophysical agents—contraindications and precautions: an evidence-based approach to clinical decision making in physical therapy. Physiother Can. 2010;62(5):1-80.
10. Grover, C. A., McKernan, M. P., & Close, R. J. H. (2018).
Transcutaneous Electrical Nerve Stimulation (TENS) in the Emergency Department for Pain Relief: A Preliminary Study of Feasibility and Efficacy. West J Emerg Med, 19(5), 872–876.
11. Barker, R., Lang, T., Steinlechner, B., et al. (2006).
Transcutaneous electrical nerve stimulation as prehospital emergency interventional care: treating acute pelvic pain in young women. Neuromodulation, 9(2), 136–142.
12. Lang, T., Barker, R., Steinlechner, B., et al. (2007). TENS relieves acute posttraumatic hip pain during emergency transport. J Trauma, 62(1), 184–188.
13. Keskin, E. A., Onur, O., Keskin, H. L., et al. (2012). Transcutaneous electrical nerve stimulation improves low back pain during pregnancy. Gynecol Obstet Invest, 74(1), 76–83.
14. Canadian Association of Emergency Physicians. Canadian Emergency Department Information System (CEDIS): Data Elements. Ottawa, CAN: CAEP; 2001. Updated 2002. Accessed November 13, 2021. https://caep.ca/resources/cedis/cedis-dataelements/
15. Lim, Y. H., Song, J. M., Choi, E. H., et al. (2018). Effects of Repetitive Peripheral Magnetic Stimulation on Patients With Acute Low Back Pain: A Pilot Study. Ann Rehabil Med, 42(2), 229–238.
Moor-Smith et al.
XGBoost (eXtreme Gradient Boosting) Can Predict Organisms Growing in Urine Culture from the Emergency Department
Johnathan M. Sheele, MD, MHS, MPH*
Ronna L. Campbell, MD, PhD†
Derick D. Jones, MD, MBA†
Section Editor: Ioannis Koutroulis, MD
Mayo Clinic, Department of Emergency Medicine, Jacksonville, Florida Mayo Clinic, Department of Emergency Medicine, Rochester, Minnesota
Submission history: Submitted June 20, 2025; Revision received November 25, 2025; Accepted November 26, 2025
Electronically published April 8, 2026
Full text available through open access at http://escholarship.org/uc/uciem_westjem DOI 10.5811/westjem.48715
Introduction: Urinary tract infections are common in the emergency department (ED) but are frequently misdiagnosed and mismanaged. We sought to determine whether eXtreme Gradient
Boosting (XGBoost), an open-source machine-learning library, could predict the organisms growing in urine cultures ordered from the ED.
Methods: We developed XGBoost algorithms to retrospectively examine 62,963 Mayo Clinic ED encounters between January 1, 2017–December 31, 2021, during which a urinalysis and urine culture were performed. The model used 1,303 patient variables. All patient ages were included. Data were from the electronic health record and available to the clinician during the patient encounter.
Results: For the most common bacteria growing in urine culture, XGBoost was able to predict the presence of a member of the Enterobacteriaceae family with an area under the receiver operating curve (AUC) of 0.90 and an accuracy of 0.79. The model predicted the presence of 10 different bacterial genera with an AUC of 0.70-0.88 and an accuracy of 0.87-0.99. Furthermore, XGBoost was able to predict whether the urine culture would report Gram-positive or Gram-negative bacteria with an AUC of 0.81 and 0.90, respectively, and an accuracy of 0.85 and 0.86, respectively. The model predicted whether yeast would be reported with an AUC of 0.84 and an accuracy of 1.00.
Discussion: XGBoost can predict the bacterial genus and Gram-staining results of the bacteria growing in urine cultures. [West J Emerg Med. 2026;27(3)759–765.]
INTRODUCTION
Hospital admission costs for diagnosing and treating urinary tract infection (UTI) in the U.S. exceed $2 billion annually and increased 52% between 2008–2011.1 Urinary tract infections are among the most common reasons for administering antibiotics in the emergency department (ED), yet urine cultures of patients diagnosed with UTIs in the ED may be negative.2-6 Having a false-positive UTI diagnosis can lead to unnecessary antibiotic adverse effects and drugresistant bacterial infections. If an emergency clinician could have knowledge about a uropathogen growing in urine culture during the clinical encounter, it would improve the number of patients correctly diagnosed with a UTI and facilitate the use of appropriate antibiotics, which have been shown to reduce
patient morbidity, mortality, and overall healthcare costs.7
More than 600 bacterial species have been cultured from urine.8 An analysis of 16S ribosomal RNA found a median of 41 bacterial genera per urine sample.9 Escherichia coli causes most uncomplicated, community-based UTIs. Several other organisms are also known to cause UTIs, including Pseudomonas aeruginosa, Proteus species, Klebsiella species, Acinetobacter species, Enterobacter species, Citrobacter species, Staphylococcus saprophyticus, coagulase-negative Staphylococcus, and Enterococcus species.10 A patient’s age, comorbid conditions, existing genitourinary pathology, indwelling urethral catheters, and immunodeficiencies could all influence whether a particular uropathogen is growing in the urine.11
Traditional urine cultures do not report all bacterial species growing in the urine; instead, they are designed to report the most prevalent uropathogens.9 Not all bacteriuria indicates a UTI; some bacteriuria may be asymptomatic or represent contamination during urine sample collection.12 Molecular diagnostic tests identify more bacteria than traditional culture techniques; however, it is unclear whether this additional information improves clinical care.13 Neither is it clear whether patients who have UTI symptoms but a negative urine culture and negative workup for other genitourinary pathology may benefit from antibiotics. While machine learning has been used previously to predict bacterial antibiotic resistance in patients with UTIs,14-18 we found no reports of it being used to identify the infecting organism reported on the urine culture. In this study we aimed to determine whether eXtreme Gradient Boosting (XGBoost) could predict the bacterial organism from urine cultures obtained in the ED. XGBoost is an open-source, machinelearning library that incorporates gradient-boosted decision trees. Secondly, we examined whether XGBoost could predict the Gram stain result of the bacteriuria and the presence of yeast. If accurate models can be developed they could theoretically be incorporated into the electronic health record (EHR) to aid in real-time clinical decision-making.
METHODS
Study Design and Setting
Mayo Clinic’s data retrieval team created a dataset from the EHRs of all Mayo Clinic EDs (Florida, Minnesota, Arizona, Iowa, and Wisconsin) between January 1, 2017–December 31, 2021, with no age restrictions. The research was conducted in accordance with TRIPOD+AI (Transparent Reporting of a Multivariable Prediction Model for Individual Prognosis or Diagnosis + Artificial Intelligence) and followed guidelines on retrospective research (with the exception that no data abstractors were used).19,20 Included patients provided research authorization and had a urinalysis or urine culture. For our analysis, data had to meet the following additional criteria: complete urinalysis values (ie, no missing urinalysis values); both a urinalysis and urine culture ordered from 4 hours before to 8 hours after the ED arrival date and time; urine culture results obtained < 10 days after the culture was collected; diagnosis of UTI during the ED encounter; and documented encounter admission and discharge dates and times, event start and end dates and times; and diagnosis dates. The Mayo Clinic Institutional Review Board approved the study.
Variables and Outcomes
Data in our analysis included the following: patient demographics and social history; diagnoses made before urine culture results; medications; past medical histories; temperature; radiology studies performed and their results;
Population Health Research Capsule
What do we already know about this issue? The bacterial genera or species causing a urinary tract infections (UTI) are most commonly unknown during the clinical encounter.
What was the research question?
To determine if a machine learning algorithm could predict the bacterial genera or species growing in urine culture.
What was the major finding of the study?
Our XGBoost model predicted the presence of 10 different bacterial genera growing in urine culture with an AUC of 0.70-0.88 and an accuracy of 0.87-0.99.
How does this improve population health?
Predicting the bacteria growing in urine culture could potentially assist with antimicrobial stewardship and improve the ability to accurately diagnose UTI.
admission and disposition information; medications ordered before and during the ED encounter; current and prior laboratory data; reproductive health information; genitourinary nursing procedures and flowsheets; fall-risk assessments done by nurses; allergies; and prior microbiology results. Each patient encounter was tracked with unique identifiers. We included formulas of inflammation (eg, neutrophil-lymphocyte ratio, urinary inflammatory index, systemic immuneinflammation index, and platelet-lymphocyte ratio), ratios, and mathematical formulas we invented using laboratory values [available upon request].
We included encounter diagnoses in our model if the ED discharge departure, event encounter, and diagnosis occurred before the urine culture result was available; otherwise, it was coded as “no.” Encounter diagnoses were identified using text searches and International Classification of Diseases, 10thEd,, codes (Supplement 1). The presence of yeast, the bacterial family, genus, or species, and whether the bacteria were Gram-positive or Gram-negative was determined using text searches in Excel (Microsoft Corporation, Redmond, WA) (available upon request). We included in our analysis only those bacterial genera present in more than 500 cultures and > 0.5% frequency.
Statistical Analysis
Variables were modeled as continuous (numerical) or categories, or sometimes both. If information was missing we marked it as “not available” for categories, and for numbers we filled in the missing spots with the group’s median value. All outcomes had binary outcomes (ie, positive or negative for the outcome). The data were then split randomly: 80% for training the model; and 20% for testing it. For categories, we did one-hot encoding to convert them into a format the computer could read. Because some outcomes were much less common than others, we used a method called Synthetic Minority Over-sampling Technique (SMOTE) to create extra examples so that the model could learn more evenly. We also adjusted the scale of the numbers so that everything was on the same level. The XGBoost model was run with its default settings, using an early stopping rule and a “log loss” measure to track accuracy. XGBoost works by building a series of decision trees, each one improving on the mistakes of the last, while adding checks to avoid overfitting and to keep predictions accurate. We applied default hyperparameters to the XGBoost model, which was configured with default settings and early stopping rounds with a log-loss evaluation metric.
We report the F1, precision, recall, score, and accuracy of our XGBoost models. The F1 score is the mean of precision and recall. Precision is also known as the positive predictive value (ie, the number of true positives divided by the number of true positives plus false positives). Recall is also known as sensitivity (ie, the number of true positives divided by the number of true positives plus false negatives). Score is a performance metric for the model. Accuracy is the percentage of predictions that the model correctly predicted.
RESULTS
We included 62,963 encounters in our analysis, of which 48,069 (76.3%) were from unique patients. The median (IQR) age was 64 (39). There were 3,942 (6.3%) encounters in patients < 18 years of age, and 40,582 patients (64.5%) were female. A total of 56,286 (89.4%) encounters were with White patients; 2,919 (4.6%), Black; 1,241 (2.0%) Asian; and 2,517 (4.0%) encounters were with patients of unknown or “other” race. Testing for gonorrhea, chlamydia, or trichomonas occurred in 1,926 encounters. A summary of patient demographics is provided in Supplement 2.
Of 62,963. urine cultures tested, 18,128 (28.8%) had no microbial growth, 26,999 (42.9%) had ≥ 10,000 colonyforming units per milliliter (CFU/mL) bacterial growth of ≥ 1 organisms, and 16,703 (26.5%) had ≥ 100,000 CFU/mL bacterial growth of ≥ 1 organisms. XGBoost predicted the presence of a member of the Enterobacteriaceae family in the urine culture with an area under the receiver operating curve (AUC) of 0.90 (Table 1) (Supplement 3). The model predicted the bacterial genus growing in urine culture with
an AUC of 0.70 for Streptococcus species and up to 0.88 for Escherichia species (Table 1) (Supplement 3). It was further able to predict whether bacteria would be Gram-positive or Gram-negative with AUCs of 0.81 and 0.90, respectively (Table 1) (Supplement 3). XGBoost also predicted whether yeast would be reported (AUC, 0.84) and whether 1 or 2 vs > 2 bacterial genera would be reported (AUC, 0.89) (Table 1) (Supplement 3).
We also separately analyzed encounters from patients who likely had a true UTI (≥ 10,000 CFU/mL of ≤ 2 bacterial genera or species on urine culture) and received a diagnosed of a UTI in the ED.21-28 Our XGBoost model was able to predict the following bacteria (AUC): Escherichia species (0.72); Klebsiella species (0.68); Enterococcus species (0.74) Proteus species (0.75); Pseudomonas species (0.73); Gram-positive bacteria (0.74), and Gram-negative bacteria (0.76) (Table 2).
DISCUSSION
Our results show that XGBoost can predict both the organism growing in culture and the Gram stain results for bacteriuria. Our model could predict whether a member of the Enterobacteriaceae family, which represents the majority of uropathogens causing UTI (eg, Klebsiella, Enterobacter, Citrobacter, Escherichia coli, Proteus, and Serratia), is growing in culture with excellent accuracy (AUC, 0.90). The model was also able to predict whether yeast would be reported on urine culture and whether 1 or 2 bacterial genera vs > 2 bacterial genera would be reported. Notably, our model performed well in the subset of patients most likely to have a UTI.
Our work builds on that of others who have shown that machine learning can aid clinicians in diagnosing UTIs. We found no studies using XGBoost to predict the organisms growing in the urine culture, but others have used machine learning to predict antibiotic resistance.14-18 Factors that predict antibiotic sensitivity include past antibiotic use, prior urine culture results, age, ethnicity, and comorbid conditions such as diabetes, genitourinary tract pathology, kidney stones, travel history, and place of residency; these are also likely to be important in predicting the specific bacteria growing in the culture.7,29-31 For instance, children with spina bifida were more likely to have non-E coli UTIs.32 Additionally, the following were associated with Gram-positive UTIs in children: age; serum white blood cells; no prior antibiotic use; C-reactive protein; hemoglobin; negative urine leukocyte esterase; negative urine nitrite; and white blood cells in urine.33 Urinalysis-specific findings may help predict bacteriuria. For instance, Proteus mirabilis UTIs are associated with more alkaline urine.34
A previous study reported that UTIs are frequently misdiagnosed and mismanaged in the ED.5 Machine-learning prediction models may be a strategy for improving UTI management by correctly predicting which organisms will eventually grow in the urine culture and providing this
Sheele
Table 1. Performance characteristics of XGBoost models used to predict the organism reported in a urine culture.
sp (n = 521)
Enterobacteriaceae family (n = 15,171)
Enterobacter sp (n = 860)
Enterobacter cloacae (n = 545)
sp (n = 2,060)
Enterococcus faecalis (n = 1,826)
sp (n = 10,456)
Klebsiella sp (n = 3,034)
Proteeae group (n = 1,207)
Proteus sp (n = 971)
sp (n = 1,214)
sp (n =
Coagulase-negative Staphylococcus
agalactiae and Streptococcus group B (n = 791)
(n = 204)
1-2 (n = 19,345) vs > 2 (n = 7,654) bacterial genera or species in cultureb
*Cultures can report ≥ 1 organisms. Note: Urine cultures with no microbial growth were ignored in the model. AUC, area under the receiver operating curve; NA, not applicable; PPV, positive predictive value; sp, species; XGBoost, eXtreme Gradient Boosting.
information to the clinician during the clinical encounter. This knowledge could help clinicians make more informed decisions about whether to initiate antibiotics as well as facilitate use of the most appropriate antibiotic. We envision that our XGBoost algorithms would continuously run in the background of the health system’s EHR on all patients who receive a urinalysis. The algorithm continuously updates for each patient as new data is generated during their clinical encounter (eg, new lab results). The emergency clinician could access the algorithm results at any point during the patient’s clinical encounter, but the most accurate predictions would occur at the end of the ED encounter when most of the variable data has been incorporated into the models. The model is not yet ready for clinical practice and requires additional validation.
LIMITATIONS
Patients in our dataset were likely to be more chronically ill, elderly, immunocompromised, and have existing genitourinary pathology than a typical community ED. Our data were also somewhat limited by geographic location, as
was it limited by insufficient racial and ethnic diversity. Our models are only applicable for patients who get both a urinalysis and a urine culture. Not all patients diagnosed with a UTI get a urine culture; thus, our models may not be applicable to all patients with a UTI. However, studies have shown that ED patients meeting a clinical diagnosis of UTI have high rates of negative urine cultures suggesting they likely do not have a bacterial UTI.2,35,36 Conversely, not all patients with a positive urine culture have a UTI (eg, asymptomatic bacteriuria), and our models do not predict UTI. It is unclear whether the rates of our urine culture being positive would affect the model’s performances if the study were replicated elsewhere.
Our analysis only included patients presenting to the ED; therefore, our results may only be generalizable to some patient populations. Our dataset did not include patient history or physical exam findings taken in the ED, and it is unclear whether adding this information would improve our model. Gram staining was not performed on our urine culture results; instead we used known Gram-staining
et al. XG Boost Can Predict Urine Culture Organisms in
Table 2. Performance characteristics of XGBoost models used to predict the organism reported in urine cultures with ≥
of ≤ 2 bacterial genera/species from patients diagnosed with urinary tract infection before culture results.
Outcome
cloacae (n = 221)
Enterococcus faecalis (n = 582)
Escherichia sp (n = 5,531)
Klebsiella sp (n = 1,211)
Proteeae group (n = 479)
Proteus sp (n = 387)
Pseudomonas sp (n = 413)
Staphylococcus sp (n = 605)
Staphylococcus aureus (n = 160)
Coagulase-negative Staphylococcus (n = 446)
Streptococcus agalactiae and Streptococcus group B (n = 168)
*Cultures can report ≥ 1 organism. Note: The model ignored urine cultures with no microbial growth . AUC, area under the receiver operating curve; CFU, colony forming units; NA, not applicable; sp, species; XGBoost, eXtreme Gradient Boosting.
characteristics for the bacteria reported in the culture. Our XGBoost model included more than 1,300 variables; future research will be essential to see how the model performs with fewer variables. Lastly, it was not practical to report out all our XGBoost algorithms decision trees because of the thousands of branches for each model.
CONCLUSION
XGBoost can predict the organisms growing in ED urine cultures using data available to the emergency clinician during the clinical encounter. Correctly predicting uropathogens growing in urine cultures during the clinical examination may improve accuracy in diagnosing and treating UTIs. Our XGboost models could potentially be designed to supplement clinical judgment for diagnosing UTIs during the ED visit but will not advise the clinician whether the patient should be treated with antibiotics.
ACKNOWLEDGEMENTS
The Scientific Publications staff at Mayo Clinic provided copyediting, proofreading, administrative, and clerical support.
Address for Correspondence: Johnathan M. Sheele, MD, MPH MHS, Department of Emergency Medicine, Mayo Clinic, 4500 San Pablo Rd, Jacksonville, FL 32224. Email: sheele.johnathan@ mayo.edu.
Conflicts of Interest: By the WestJEM article submission agreement, all authors are required to disclose all affiliations, funding sources and financial or management relationships that could be perceived as potential sources of bias. No author has any professional or financial relationships with any companies relevant to this study. This study was funded by Mayo Center for Clinical and Translational Science, grant number UL1TR002377. The sponsor had no role in any aspect of the study design or data collection, or any other aspect of the study.
1. Simmering JE, Tang F, Cavanaugh JE, et al. The increase in hospitalizations for urinary tract infections and the associated
Sheele
costs in the United States, 1998-2011. Open Forum Infect Dis. 2017;4(1):ofw281.
2. Gordon LB, Waxman MJ, Ragsdale L, et al. Overtreatment of presumed urinary tract infection in older women presenting to the emergency department. J Am Geriatr Soc. 2013;61(5):788-792.
3. Tomas ME, Getman D, Donskey CJ, et al. Overdiagnosis of urinary tract infection and underdiagnosis of sexually transmitted infection in adult women presenting to an emergency department. J Clin Microbiol. 2015;53(8):2686-2692.
4. Shallcross LJ, Rockenschaub P, McNulty D, et al. Diagnostic uncertainty and urinary tract infection in the emergency department: a cohort study from a UK hospital. BMC Emerg Med. 2020;20(1):40.
5. Childers R, Childers D, Bixby M, et al. Urine testing is associated with inappropriate antibiotic use and increased length of stay in emergency department patients. Heliyon. 2022;8(11):e11049.
6. Sheele JM, Mi L, Monas J, et al. Patient and provider demographics and the management of genitourinary tract infections in the emergency department. Emerg Med Int. 2023;1522347.
7. MacFadden DR, Ridgway JP, Robicsek A, et al. Predictive utility of prior positive urine cultures. Clin Infect Dis. 2014;59(9):1265-1271.
8. Dubourg G, Morand A, Mekhalif F, et al. Deciphering the urinary microbiota repertoire by culturomics reveals mostly anaerobic bacteria from the gut. Front Microbiol. 2020;11:513305.
9. Moustafa A, Li W, Singh H, et al. Microbial metagenome of urinary tract infection. Sci Rep. 2018;8:4333.
10. Ahmed SS, Shariq A, Alsalloom AA, et al. Uropathogens and their antimicrobial resistance patterns: relationship with urinary tract infections. Int J Health Sci (Qassim). 2019;13(2):48-55.
11. Foxman B. Epidemiology of urinary tract infections: incidence, morbidity, and economic costs. Am J Med. 2002;113 Suppl 1A:5S-13S.
12. Nicolle LE, Gupta K, Bradley SF, et al. Clinical practice guideline for the management of asymptomatic bacteriuria: 2019 update by the Infectious Diseases Society of America. Clin Infect Dis. 2019;68(10):e83-e110.
13. Szlachta-McGinn A, Douglass KM, Chung UYR, et al. Molecular diagnostic methods versus conventional urine culture for diagnosis and treatment of urinary tract infection: a systematic review and meta-analysis. Eur Urol Open Sci. 2022;44:113-124.
14. Mancini A, Vito L, Marcelli E, et al. Machine learning models predicting multidrug resistant urinary tract infections using “DsaaS”. BMC Bioinformatics. 2020;21(Suppl 10):347.
15. Corbin CK, Chawla NV, Runaas L, et al. Personalized antibiograms for machine learning driven antibiotic selection. Commun Med (Lond). 2022;2:38.
16. Yang J, Eyre DW, Clifton DA. Interpretable machine learningbased decision support for prediction of antibiotic resistance for complicated urinary tract infections. medRxiv. 2023. Preprint.
17. Lee HG, et al. Machine learning model for predicting antibiotic resistance in the emergency department in patients with urinary tract infection. Res Square. 2022. Preprint.
18. Ruiz-Ramos J, Monje-Lopez AE, Medina-Catalan D, et al. Prediction of multidrug-resistant bacteria in urinary tract infections in the emergency department. J Emerg Med. 2023;65(1):1-6.
19. Collins GS, Dhiman P, Andaur Navarro CL, et al. TRIPOD+AI statement: updated guidance for reporting clinical prediction models that use regression or machine learning methods. BMJ. 2024;385:e078378.
20. Worster A, Bledsoe RD, Cleve P, et al. Reassessing the methods of medical record review studies in emergency medicine research. Ann Emerg Med. 2005;45(4):448-451.
21. Landers T, Nysaether J, Calatroni A, et al. A comparison of methods to detect urinary tract infections using electronic data. Jt Comm J Qual Patient Saf. 2010;36(9):411-417.
22. Bilsen MP, Khasriya R, Dixon K, et al. Definitions of urinary tract infection in current research: a systematic review. Open Forum Infect Dis. 2023;10(6):ofad332.
23. Stamm WE. Protocol for diagnosis of urinary tract infection: reconsidering the criterion for significant bacteriuria. Urology. 1988;32(2 Suppl):6-12.
24. Liang T, Oraa SS, Rebollo Rodriguez N, et al. Predicting urinary tract infections with interval likelihood ratios. Pediatrics. 2021;147(1):e2020015008.
25. Shaikh N, Lee S, Krumbeck JA, et al. Support for the use of a new cutoff to define a positive urine culture in young children. Pediatrics. 2023;152(4):e2023061931.
26. Lee JH. Discrimination of culture negative pyelonephritis in children with suspected febrile urinary tract infection and negative urine culture results. J Microbiol Immunol Infect. 2019;52(4):598-603.
27. Gupta K, Hooton TM, Naber KG, et al. International clinical practice guidelines for the treatment of acute uncomplicated cystitis and pyelonephritis in women: a 2010 update by the Infectious Diseases Society of America and the European Society for Microbiology and Infectious Diseases. Clin Infect Dis. 2011;52(5):e103-e120.
28. Grabe M, Bjerklund Johansen TE, Botto H, et al. Guidelines on urological infections. European Association of Urology. 2015.
29. Tenney J, Hudson N, Alnifaidy H, et al. Risk factors for acquiring multidrug-resistant organisms in urinary tract infections: a systematic literature review. Saudi Pharm J. 2018;26(5):678-684.
30. Mohseni M, Craver EC, Heckman MG, et al. Can urinalysis and past medical history of kidney stones predict urine antibiotic resistance? West J Emerg Med. 2022;23(5):613-617.
31. Brintz B, Nevers M, Goetz M, et al. Using machine learning to predict antibiotic resistance to support optimal empiric treatment of urinary tract infections. Antimicrob Steward Healthc Epidemiol. 2022;2(S1):S69.
32. Ortiz TK, Velazquez N, Ding L, et al. Predominant bacteria and patterns of antibiotic susceptibility in urinary tract infection in children with spina bifida. J Pediatr Urol. 2018;14(5):444.e1-444.e8.
33. Hsu YL, Chang SN, Lin CC, et al. Clinical characteristics and
Sheele et al. XG Boost Can Predict Urine Culture Organisms in
prediction analysis of pediatric urinary tract infections caused by gram-positive bacteria. Sci Rep. 2021;11(1):11010.
34. Lai HC, Chang SN, Lin HC, et al. Association between urine pH and common uropathogens in children with urinary tract infections. J Microbiol Immunol Infect. 2021;54(2):290-298.
35. Fihn SD. Acute uncomplicated urinary tract infection in women.
N Engl J Med. 2003;349(3):259-266.
36. Miller JM, Binnicker MJ, Campbell S, et al. A guide to utilization of the microbiology laboratory for diagnosis of infectious diseases: 2018 update by the Infectious Diseases Society of America and the American Society for Microbiology. Clin Infect Dis. 2018;67(6):e1-e94.
Outcomes of Succinylcholine and Rocuronium for Rapid Sequence Intubation in the Emergency Department
Danielle H. O’Connell, MD*
Joseph Yeager, DO, PharmD*
Rebecca A. Abrams, MS*
John R. Zatarain, MD*
Krishna K. Paul, BS*
Rekha R. Goswami, BS*
Kelsey Hill, MD*
Lisa R. Farmer, MD†
Julio Jayes, MD*
Dietrich VK. Jehle, MD*
Section Editor: Joseph Shiber, MD
Electronically published May 3, 2026
University of Texas Medical Branch, Department of Emergency Medicine, Galveston, Texas
University of Texas Medical Branch, Department of Anesthesiology, Galveston, Texas * †
Submission history: Submitted July 27, 2025; Revision received January 2, 2026; Accepted January 4, 2026
Full text available through open access at http://escholarship.org/uc/uciem_westjem DOI 10.5811/westjem.50495
Introduction: Succinylcholine and rocuronium are neuromuscular blocking agents commonly used as paralytics in the emergency department (ED) during rapid sequence intubation. Prior studies have shown mixed results regarding the preferred agent aside from settings where there are contraindications. This study compares outcomes of death, myocardial infarction, and post-traumatic stress disorder for succinylcholine vs rocuronium when used in rapid sequence intubation using data from a large, multicenter database.
Methods: In this retrospective study, we extracted 105 million patient records from 61 healthcare organizations in the United States from the TriNetX database between 2004–2023. Adults ≥ 18 years of age who underwent intubation on the same day as an ED visit and received succinylcholine or rocuronium with the hypnotic anesthetic etomidate were included. The outcomes evaluated were mortality and myocardial infarction within 60 days after intubation. We excluded patients with prior history of myocardial infarction. We performed propensity matching for demographics and nine preexisting conditions associated with mortality.
Results: There were 15,514 patients in the succinylcholine group and 14,675 patients in the rocuronium group for a total of 30,189 adults prior to propensity matching. The final cohort included 26,884 patients evenly divided between groups after propensity matching. Patients given succinylcholine were associated with a significantly lower risk of mortality (30.1% vs 33.4%, risk ratio [RR] 0.901, 95% CI, 0.869-0.933, P < .001, absolute risk reduction of 3.3%) and myocardial infarction (10.5% vs 11.9%, RR 0.888, 95% CI, 0.828-0.953, P = .001, absolute risk reduction of 1.4%) within 60 days after rapid sequence intubation. Trends were similar before propensity matching.
Conclusion: Succinylcholine administration was associated with reduced mortality compared to rocuronium. These findings suggest succinylcholine may be a safer paralytic agent for rapid sequence intubation when no contraindications are identified. [West J Emerg Med. 2026;27(3)766–774.]
O’Connell et al.
INTRODUCTION
Background
Outcomes of Succinylcholine and Rocuronium for Rapid Sequence Intubation
Succinylcholine and rocuronium are the most common paralytics used in the emergency department (ED) for rapid sequence intubation (RSI), and their use improves intubation conditions.1,2 Succinylcholine is a short-acting, depolarizing neuromuscular agent with standard dosing of 1.0-1.5 mg per kilogram (kg) intravenous (IV) push with onset of 30-60 seconds and duration of approximately 5-10 minutes under normal circumstances.3 Rocuronium is a longer acting, nondepolarizing neuromuscular agent with dosing of 0.6-1.2 mg/ kg IV push with onset of 45-60 seconds and duration of 20-60 minutes.4
When administered, these drugs work by different mechanisms to block cholinergic receptors at the neuromuscular junction, causing paralysis. During the process, both drugs can elevate heart rate or cause allergic reactions.5,6 Succinylcholine commonly causes muscle fasciculations, jaw rigidity, elevated intracranial pressure, elevated ocular pressure, or hyperkalemia, whereas rocuronium is not associated with these side effects.3 The hyperkalemia that occurs with succinylcholine usually peaks 2-4 minutes after administration and returns to normal within 10 minutes. The degree of potassium increase is usually 0.5-1.0 milliequivalents per liter (mEq/L) but can be higher in highrisk patients such as those with pre-existing hyperkalemia or neuromuscular disease.3,7 In addition, succinylcholine can rarely induce malignant hyperthermia.1
The search to determine the best paralytic for intubation is of particular interest for critically ill patients treated in the ED. The data varies, with some studies reporting that rocuronium leads to higher mortality rates while others state there is no true difference between rocuronium and succinylcholine.8,9 In addition, some authors have suggested that there is a higher incidence of post-traumatic stress disorder (PTSD) with patients receiving longer acting paralytics and inadequate sedation.10,11
Importance
Several studies have attempted to determine which paralytic is superior overall; however, few randomized controlled trials are available. Most existing trials were conducted in inpatient settings, generally in the operating room (OR), and their primary endpoint was the assessment of intubation conditions rather than first-attempt intubation success.12-15 In addition, none of the existing studies clearly established which paralytic is best for intubation in the emergency setting.
According to the 2022 American Society of Anesthesiologists Practice Guidelines for Management of the Difficult Airway, “the literature is currently insufficient to determine the actual benefit or harm of rocuronium versus succinylcholine for airway management of anticipated difficult airway patients.”8 To our knowledge, no previous study of
Population Health Research Capsule
What do we already know about this issue?
Succinylcholine and rocuronium are commonly used for ED rapid sequence intubation, but prior small studies show mixed outcomes and no clear mortality superiority.
What was the research question?
In 26,884 propensity matched patients undergoing ED RSI, does succinylcholine vs rocuronium differ in mortality or MI?
What was the major finding of the study?
Succinylcholine had lower mortality (RR 0.90, 95% CI 0.87–0.93; p<0.001) and MI rates (RR 0.89, 95% CI, 0.83-0.95, P = .001).
How does this improve population health?
This study suggests succinylcholine may be a safer paralytic agent for rapid sequence intubation when compared with rocuronium.
this magnitude (both sample size and multicenter design) has compared these two drugs for RSI used in the ED for critical outcomes of death and myocardial infarction.
Goal of Investigation
In this study we aimed to compare outcomes of mortality, myocardial infarction, and PTSD in patients undergoing rapid sequence intubation with succinylcholine vs rocuronium in the ED from a large, real-world database.
METHODS
Study Design and Setting
This retrospective, propensity-matched study used de-identified medical records from 61 large healthcare organizations within the United States Collaborative Network of TriNetX. Using International Classification of Diseases, 10th Rev, Clinical Modification (ICD-10-CM) diagnosis codes, Current Procedural Terminology (CPT) codes, and RxNorm medication codes as search criteria, the database can be queried to establish multiple cohorts and compare outcomes of interest among those cohorts. Since there was no primary chart review, limitations of retrospective chart review identified by Worster and Bledsoe did not apply.16
Selection of Participants
The query, conducted on August 22, 2023, included
Outcomes
of Succinylcholine and Rocuronium for Rapid Sequence Intubation
all patients in the U.S. Collaborative Network of TriNetX from January 1, 2004–June 30, 2023. We established two cohorts of patients intubated in the ED: Cohort 1 with 15,514 patients intubated using succinylcholine; and Cohort 2 with 14,675 patients intubated with rocuronium. The following billing codes were required to meet inclusion criteria (index event): intubation, endotracheal, emergency procedure (UMLS:CPT:31500); etomidate (NLM:RXNORM:4177); and succinylcholine for Cohort 1 (NLM:RXNORM:10154), or rocuronium for Cohort 2 (NLM:RXNORM:68139). We excluded patients if the index event occurred > 20 years from the time of analysis.
Outcomes
Once the cohorts were established, we compared outcomes within the TriNetX database. Outcomes of interest were as follows: 1) death; 2) myocardial infarction (ICD10-CM:I21); and 3) post-traumatic stress disorder (ICD10-CM:F43.10) that occurred in a time window of 60 days following the index event: emergent intubation. Mortality data within the TriNetX platform is obtained from electronic healthcare data and healthcare organizations, in conjunction with national death registries. Patients were excluded if outcomes of myocardial infarction or PTSD occurred prior to the rapid sequence intubation.
Post-hoc Analysis
We ran a similar analysis using data from 2018–2025 including patients given both etomidate and ketamine as induction agents and evaluating outcomes on day 0-60 to control for recent changes in intubation practices in the ED.17,18 Additionally, we analyzed the proportion of adult patients in the succinylcholine and rocuronium cohorts, presenting to the ED with ICD-9/10-CM codes associated with traumatic mechanisms, poisonings, and burns at the time of RSI and given etomidate as an induction agent.
Statistical Analysis
Using linear and logistic regression, we performed a 1:1 propensity score match for both groups —patients intubated with succinylcholine and those intubated with rocuronium, for the variables of age, sex, race/ethnicity, and several pre-existing diagnoses that are risk factors for mortality (Table 1). These pre-existing conditions were chosen based on common causes of death, according to the U.S. Centers for Disease Control and Prevention.19 We used greedy nearest neighbor matching with a tolerance (caliper width) of 0.1 and propensity scores with a standard difference ≤ 0.1 considered a good match. The order of data rows is randomized through TriNetX to mitigate bias introduced by the nearest-neighbor algorithm. We made comparisons between cohorts before and after propensity matching. The analysis compared the outcomes of Cohort 1 and Cohort 2. After propensity matching, none of the covariates were statistically different (Table 1).
O’Connell et al.
The measure of association is a statistical tool inherent in TriNetX and was used to perform univariate analysis where risk ratios (RR), 95% confidence intervals, and probability values (P) were calculated to compare outcomes. To help visualize survival, we ran a Kaplan-Meier curve through the database, plotting the survival probability against the number of days following an index event. The univariate analysis used the chi-square test to evaluate dichotomous data and the t-test to examine continuous datasets. Statistical significance was set at a two-sided alpha < 0.05. Using data from TriNetX does not require review by the University of Texas Medical Branch Institutional Review Board (IRB) as this was secondary analysis of de-identified data. The IRB determined that this project is considered “not human subjects research.”
RESULTS
Characteristics of Study Subjects
Before propensity matching, the analysis found 30,189 adult patient-intubation encounters with etomidate and succinylcholine (n = 15,514) or etomidate and rocuronium (n = 14,675). After propensity matching, 13,442 patient encounters were found for each cohort. Demographics used for propensity matching included race, sex, and underlying medical conditions. The mean age of patients before and after propensity matching was 54.5 and 56.0, respectively, in the succinylcholine cohort, and 56.7 and 55.9 in the rocuronium cohort. The majority of patients in both cohorts were White (not Hispanic or Latino) and male with varying degrees of underlying medical conditions. About one-fourth of patients studied had chronic lower respiratory diseases, and around 40% carried a diagnosis of hypertension. A summary of the demographic information used for propensity matching is listed in Table 1. The standard differences for all our covariates were less that < 0.02 in the analysis, representing a very strong propensity match.
Main Results
Within 60 days of emergency intubation, after propensity matching, the two cohorts were associated with the following risk of death: 30.1% in the succinylcholine group (3,977 of 13,213 patients) vs 33.4% in the rocuronium group (4,433 of 13,266 patients) with a significant risk difference, favoring succinylcholine (RR 0.901, 95% CI, 0.869-0.933, P < .001, absolute risk reduction of 3.3%). The risk of myocardial infarction for the succinylcholine cohort was 10.5% (1,303 of 12,377 patients) vs 11.9% (1,454 of 12,264 patients) in the rocuronium group (RR 0.888, 95% CI, 0.828-0.953, P <.001 absolute risk reduction of 1.4%) (Table 2). There was no significant difference in the associated risks of PTSD (RR 1.000, 95% CI, 0.827-1.210, P = 1.00) between both groups. Before propensity matching, patients intubated with succinylcholine had an associated risk of death of 29.3% vs 34.1% in the rocuronium group (RR 0.832, 95% CI, 0.832-0.889, P < .001). The risk of myocardial infarction for
Table 1. Cohort characteristics, including demographics and pre-existing conditions associated with mortality, in a study comparing clinical outcomes of the use of succinylcholine vs rocuronium in emergency rapid sequence intubation (N = 30,189).
Table 1. Continued.
SD, standard deviation; Succ, succinylcholine; Roc, rocuronium.
succinylcholine vs rocuronium, respectively, was 10.2% vs 11.8% (RR 0.862, 95% CI, 0.806-0.922, P < .001). These findings are listed in Table 2.
Post-Hoc Results
Results of the post-hoc analysis from 2018–2025 showed similar trends as the primary analysis. After propensity matching, mortality in the succinylcholine cohort was 28.5% vs 30.3% in the rocuronium cohort (RR 0.94; 95% CI 0.910.97; P < .001). The succinylcholine cohort had 11.7% patients with myocardial infarction vs 13.1% patients in the rocuronium group (RR 0.90; 95% CI 0.84-0.95; P < .001) (Supplementary Table 1). In the 2018-2025 post-hoc analysis, 16,929 patients received succinylcholine and 27,537 received rocuronium. This was in contrast to our initial analysis of data from 2004–2023, where succinylcholine was used in 15,514 patients and rocuronium in14,675 patients.
When evaluating the same-day outcomes for the patients
from 2004–2023, approximately 25.7% of the succinylcholine cohort and 28.5% of the rocuronium cohort presented to the ED with a traumatic mechanism at the time of RSI. Overdoses represented 14.9% of the succinylcholine cohort and 15.7% of the rocuronium cohort. There was a larger gap in the percentage of patients with burns, with 1.2% in the succinylcholine cohort and 2.3% in the rocuronium cohort. In addition, our study population had an episode of malignant hyperthermia and, of interest, it was in the rocuronium group.
DISCUSSION
This study demonstrates an overall association between the use of succinylcholine for RSI with lower mortality and myocardial infarction rates compared to rocuronium in a large, multicenter database. Following propensity score matching, the 60-day mortality rate was 30.1% in the succinylcholine cohort vs 33.4% in the rocuronium cohort. Similarly, the incidence of myocardial infarction was 10.5%
Table 2. Outcomes of death and myocardial infarction in a study comparing clinical outcomes of the use of succinylcholine vs rocuronium in emergency rapid sequence intubation, before and after propensity score matching (N = 30,189).
Outcome Before Propensity Matching
(%) (n = 15,514)
Death (n = 15,269)
(29.3%) (n = 14,700)
= 13,413)
(0.832-0.889) < .001 MI (n = 14,700) 5,006 (34.1%)
Outcome After Propensity Matching
(n =13,213)
(30.1%) (n = 13,266)
(33.4%)
(0.869-0.933) < .001 MI (n=12,377) 1,303 (10.5%) (n=12,264) 1,454 (11.9%)
Outcomes of Succinylcholine and Rocuronium for Rapid Sequence Intubation
with succinylcholine compared to 11.9% with rocuronium, suggesting a potential advantage for succinylcholine in critically ill adult patients undergoing RSI.
We chose a 60-day follow-up period to ensure complete ascertainment of outcomes after RSI. While Kaplan-Meier curves showed most deaths occurred within the first five days and additional events continued through approximately 30 days, extending the window to 60 days allowed capture of late mortality among patients discharged to long-term care after an anoxic injury. Although myocardial infarctions were concentrated within the first three days, using a uniform 60day period across all endpoints provided methodological consistency and minimized the risk of underestimating clinically important late events.
These findings are consistent with a 2017 Cochrane review, which demonstrated that succinylcholine provided superior intubating conditions compared to rocuronium when assessed using the Goldberg scale.² Although higher doses of rocuronium (1.2 mg/kg) have been shown to provide intubating conditions comparable to standard-dose succinylcholine and may approach similar onset times, most studies still report a modestly faster onset with succinylcholine (1.0 mg/kg), with the difference being substantially smaller than that observed with lower dose rocuronium (0.6 mg/ kg).² Most authors agree that the higher dose (1.2 mg/ kg) of rocuronium is the appropriate dose if used for RSI. Importantly, higher dose rocuronium is also associated with a markedly prolonged duration of paralysis, which often exceeds 60 minutes. Compared with the 5-8 minutes duration typical of succinylcholine, this may be clinically relevant in scenarios involving failed or difficult intubation. In contrast, the present findings diverge from those of a recent smaller secondary analysis that reported no significant differences in severe complications between the two agents.20
A major strength of this study lies in the large sample size derived from the TriNetX database, making it over six times larger than any previous single study or metaanalysis on this topic. This robust dataset offers increased power to detect clinically meaningful differences. The prior National Emergency Airway Registry (NEAR) study using a multicenter registry with 4,075 patients showed that firstpass intubation success and peri-intubation adverse events are generally comparable between succinylcholine and rocuronium when rocuronium is administered at higher doses (1.0-1.2 mg/kg). In contrast, our study included a cohort approximately 7-8 times larger and evaluated downstream clinical outcomes, specifically 60-day mortality and myocardial infarction, rather than immediate airway performance. Intubation for traumatic mechanisms are associated with higher mortality.
It should be noted that in the NEAR database, traumatic intubations were 1.5 times more common in the succinylcholine group than in the rocuronium group, suggesting that the succinylcholine group was at higher
risk of poor outcomes and cardiac arrest. In this study, the percentages of trauma intubation in the succinylcholine and rocuronium group were equivalent. Therefore, our findings are not refuted by prior studies that had imbalances in the cohorts.9 Our findings also differ from earlier studies, such as those by Marsh et al (2011) and DeMasi et al (2025), which reported no significant mortality difference between the agents, despite imbalances in baseline comorbidities that were not controlled. These are adjusted for in our study with propensity matching. Similarly, Nguyen et al (2019) found no difference in mortality or disposition but reported more intensive care unit (ICU) and ventilator days associated with succinylcholine, favoring rocuronium in terms of secondary outcomes.14,15,20
It is important to acknowledge key pharmacologic differences between these agents. Succinylcholine’s rapid onset and short duration may be advantageous in emergent airway scenarios, allowing for quicker recovery of spontaneous ventilation than rocuronium. Quicker recovery of spontaneous respiration makes a prolonged hypoxic injury less likely. In contrast, rocuronium’s prolonged effect may complicate cases where re-assessment or reversal of paralysis is necessary. This could potentially increase psychological distress or the risk of awareness under paralysis. However, our analysis did not detect a significant difference in PTSD outcomes between the two cohorts. This may be due to limitations in PTSD documentation and assessment within EHRs and inherent variability in clinical practices. While the ED Awareness 1 and upcoming ED Awareness 2 trials have provided foundational data in this area, their use of structured interviews and validated questionnaires cannot be replicated within the constraints of a retrospective, EHR-based database such as TriNetX.21
Certain patient populations—including those with hyperkalemia, traumatic brain injury, intracranial hemorrhage, known intracranial hypertension, intraocular pressure, renal failure, malignant hyperthermia risk, Guillain-Barré syndrome, spinal cord injury, or burns > 24 hours old— represent contraindications to succinylcholine. Succinylcholine administration typically causes a small, transient rise in serum potassium in healthy patients, with increases peaking within about 2-4 minutes and generally resolving within 10 minutes; markedly higher increases can occur in patients with pre-existing hyperkalemia or aforementioned contraindications.3,22,23 Importantly, in patients with acute burns or spinal cord injuries, clinically significant hyperkalemia does not occur immediately but rather develops days to weeks after injury, making this risk less relevant during initial ED presentations. Rocuronium is often preferred in cases associated with poor outcomes. Notably, this study was propensity-matched for one of the most common contraindications to succinylcholine, acute and chronic renal failure. These conditions are frequently linked to hyperkalemia in the ED, minimizing differences between the groups.15
LIMITATIONS
Although this study found a significant association of lower mortality for succinylcholine vs rocuronium administration for RSI, the retrospective nature prevents the identification of causation. Additionally, although we used propensity matching for certain demographics, the patient population was limited to individuals ≥ 18 years of age who were intubated on the same day as an ED visit and received etomidate for induction. Beyond the nine selected comorbid conditions, other unaccounted-for conditions or markers of critical illness (such as Injury Severity Score or Acute Physiology and Chronic Health Evaluation scoring) may exist that could introduce confounding or bias. In addition, outside of protocols, clinician preference and familiarity are often a driving force in selection of interventional medications, including paralytics given for RSI. Differences in co-administered medications may contribute to variances in outcomes, but this was not analyzed.
There is potential for missed death events when a patient is treated at a healthcare organization not affiliated with the TriNetX network and subsequently experiences a fatal outcome outside this network. However, this represents only a minor issue, as currently, 94% of healthcare organizations within the TriNetX network are also linked to the U.S. death registries. This percentage is steadily increasing as more healthcare organizations continue to be linked with the registries. Nevertheless, outcomes such as myocardial infarction or PTSD could be missed if the patient is followed up outside of the TriNetX network. Post-propensity matching cohort sizes varied slightly across outcome analyses due to TriNetX automatically excluding patients with documented outcomes occurring outside the predefined time window. The numbers of dropouts/excluded patients are reflected in Table 2.
In addition, there may be some issues with granularity in identifying which event occurred first on a specific date. It has been estimated that 20% of patients who undergo RSI on the same day as an ED visit have the intubation take place in the OR or ICU rather than the ED. Despite this limitation, identification of RSI exposure within the TriNetX platform demonstrates good positive predictive value, high specificity, and reasonable sensitivity. Validity is further strengthened through the combined use of procedure codes for intubation or mechanical ventilation, Medication Administration Record-linked RxNorm paralytic definitions within one day before or after, and documentation of an induction agent administered during the same encounter, collectively enhancing confidence in exposure classification. Evaluation of PTSD in this retrospective study may be limited as symptoms of PTSD may not be apparent or asked about during the initial hospitalization.
While we could not identify causality based on the retrospective nature of the study, the data points to additional avenues for evaluation. There is a limitation in attempting blinded randomized controlled trials in the setting of
RSI, particularly under emergent circumstances, which would prove difficult if not impossible, as differences in physiological effects and timing would reveal the medication in use without speaking to the dangers of administrations in cases of contraindication to succinylcholine. Additional retrospective studies could be performed on the outcomes of the two drugs based on specific lab values, additional medical comorbidities, hospital environments and settings, the use of different induction agents, and indications for intubation; however, a post-hoc analysis showed only minor differences in intubations for trauma between the succinylcholine (25.7%) vs rocuronium (28.5%) groups.
We pulled data collected from multiple centers and settings but did not distinguish between them and may not account for all circumstances. Further, there are differences in pharmacokinetics, pharmacodynamics, side effects and adverse events for each medication, guiding clinician choice, and covariates not evaluated in the study. This study, based on CPT and ICD-10-CM codes rather than full chart review may represent a limitation; however, this is mitigated by the magnitude and multicenter design, which is six times larger than any previous study. There have been several changes in practice over the past 20 years including increasing use of video laryngoscopy, increasing use of non-invasive ventilation to avoid intubation, greater preoxygenation, and improved care for many disease processes that may influence the need for intubation.17,18 While this data was not well captured within this database, a post-hoc analysis was completed comparing succinylcholine to rocuronium in RSI patients from 2018–2025 showing similar results to our primary analysis.
Additionally, in most EDs, sugammadex as a reversal agent for rocuronium is not available due to costs and lack of established protocols, while it is readily available in most ORs.24-27 In 2024, sugammadex was the third highest hospital-based pharmaceutical expense.28 This may limit the generalizability of these findings to settings such as ORs where reversal agents are readily available. It should be noted that it takes approximately 2-3 minutes for sugammadex to reverse the paralysis from rocuronium. The reversal with sugammadex may be faster with higher dose administration or shorter time since the last dose of rocuronium.26
CONCLUSION
Prior studies have attempted to evaluate outcomes between paralytic agents for rapid sequence intubation, but to our knowledge, none of them have established a significant difference in mortality between succinylcholine and rocuronium. This study, which is more than six times larger than previous studies, demonstrates an association with decreased mortality when succinylcholine is used over rocuronium. This study highlights the importance of evaluating real-world outcomes using large databases. The explanation for this association is probably linked to the shorter duration of succinylcholine’s effects and the challenges
O’Connell et al.
Outcomes of Succinylcholine and Rocuronium for Rapid Sequence Intubation
of maintaining oxygenation in a patient with prolonged paralysis, especially without a definitive airway. This study opens the door for further investigations into paralytic administration and suggests that succinylcholine might be safer in the absence of contraindications in the emergency department.
Address for Correspondence: Dietrich von Kuenssberg Jehle, MD, RDMS, University of Texas Medical Brand, Department of Emergency Medicine, 301 University Blvd. Galveston, Texas 77555-1173. Email: dijehle@utmb.edu.
Conflicts of Interest: By the WestJEM article submission agreement, all authors are required to disclose all affiliations, funding sources and financial or management relationships that could be perceived as potential sources of bias. This study was conducted with the support of the Institute for Translational Sciences at the University of Texas Medical Branch, supported in part by a Clinical and Translational Science Award (UL1 TR001439) from the National Center for Advancing Translational Sciences, National Institutes of Health. The content is solely the responsibility of the authors and does not necessarily represent the official views of the National Institutes of Health. There are no conflicts of interest to declare.
1. Whitlock J. Paralytics: medications given during surgery and general anesthesia. 2025. Available at: https://www.verywellhealth. com/paralytic-drugs-explained-3157132#:~:text=Common%20 paralytic%20drugs%20include%20succinylcholine,the%20effects%20 are%20closely%20monitored. Accessed February 6, 2025.
2. Tran DTT, Newton EK, Mount VAH, et al. Rocuronium vs succinylcholine for rapid sequence intubation: a Cochrane systematic review. Anaesthesia. 2017;72(6):765-77.
3. Hager HH, Burns B. Succinylcholine Chloride. 2023. Available at: https://www.ncbi.nlm.nih.gov/books/NBK499984/.. Accessed February 6, 2025.
4. Jain A, Wermuth HR, Dua A, et al. Rocuronium. 2024. Available at: https://www.ncbi.nlm.nih.gov/books/NBK539888/. Accessed February 6, 2025.
5. Sato K, Windisch K, Matko I, et al. Effects of non-depolarizing neuromuscular blocking agents on norepinephrine release from human atrial tissue obtained during cardiac surgery. Br J Anaesth. 1999;82(6):904-9.
6. Mathew A, Sharma AN, Ganapathi P, et al. Intraoperative hemodynamics with vecuronium bromide and rocuronium for maintenance under general anesthesia. Anesth Essays Res. 2016;10(1):59-64.
7. Sabo D, Jahr J, Pavlin J, et al. Increases in potassium concentrations are greater with succinylcholine than with rocuronium–sugammadex in outpatient surgery: a randomized multicentre trial. Can J Anaesth. 2014;61(5):423-32.
8. Apfelbaum JL, Hagberg CA, Connis RT, et al. 2022 American Society of Anesthesiologists practice guidelines for management of the difficult airway. Anesthesiology. 2022;136(1):31-81.
9. April MD, Arana A, Pallin DJ, et al. Emergency department intubation success with succinylcholine versus rocuronium: a National Emergency Airway Registry study. Ann Emerg Med. 2018;72(6):64553.
10. Schenck C, Banna S, Heck C, et al. Rocuronium versus succinylcholine in patients with acute myocardial infarction requiring mechanical ventilation. J Am Heart Assoc. 2023;12(10):e8468.
11. Fuller BM, Pappal RD, Mohr NM, et al. Awareness with paralysis among critically ill emergency department patients: a prospective cohort study. Crit Care Med. 2022;50(10):1449-60.
12. Mudgalkar N, Kandi VR. Succinylcholine is equally efficient as rocuronium bromide in terms of major adverse cardiac events during off-pump coronary artery bypass surgery: a single-centre study. medRxiv. 2021:21259242.
13. Guihard B, Chollet-Xémard C, Lakhnati P, et al. Effect of rocuronium vs succinylcholine on endotracheal intubation success rate among patients undergoing out-of-hospital rapid sequence intubation: a randomized clinical trial. JAMA. 2019;322(23):2303-12.
14. Marsch SC, Steiner L, Bucher E, et al. Succinylcholine versus rocuronium for rapid sequence intubation in intensive care: a prospective randomized controlled trial. Crit Care. 2011;15(4):R199.
15. Nguyen P, Rech M, Chaney W. Succinylcholine versus rocuronium for rapid sequence intubation in traumatic brain injury patients. Crit Care Med. 2019;47(1):862.
16. Worster A, Bledsoe RD, Cleve P, et al. Reassessing the methods of medical record review studies in emergency medicine research. Ann Emerg Med. 2005;45(4):448-51.
17. McNarry AF, Patel A. The evolution of airway management—new concepts and conflicts with traditional practice. Br J Anaesth. 2017;119(suppl 1):i154-66.
19. Murphy SL, Kochanek KD, Xu J, et al. Mortality in the United States, 2023. 2024. Available at: https://www.cdc.gov/nchs/products/ databriefs/db521.htm. Accessed February 6, 2025.
20. DeMasi SC, Self WH, Aggarwal NR, et al. Association between neuromuscular blocking agents and outcomes of emergency tracheal intubation: a secondary analysis of randomized trials. Ann Emerg Med. 2025;85(1):6-13.
21. Pappal RD, Roberts BW, Mohr NM, et al. The ED-AWARENESS study: a prospective observational cohort study of awareness with paralysis in mechanically ventilated patients admitted from the emergency department. Ann Emerg Med. 2021;77(5):532-44.
22. Thapa S, Brull SJ. Succinylcholine-induced hyperkalemia in patients with renal failure: an old question revisited. Anesth Analg.
Outcomes of Succinylcholine and Rocuronium for Rapid Sequence Intubation O’Connell et al. 2000;91(1):237-41.
23. Radkowski P, Krupiniewicz KJ, Suchcicki M, et al. Navigating anesthesia: muscle relaxants and reversal agents in patients with renal impairment. Med Sci Monit. 2024;30:e945141.
24. Chambers D, Paulden M, Paton F, et al. Sugammadex for reversal of neuromuscular block after rapid sequence intubation: a systematic review and economic assessment. Br J Anaesth. 2010;105(5):56875.
25. DeWitt KM, Mattson AE. Sugammadex should not be used to routinely reverse rocuronium for patients in the emergency
department. Ann Emerg Med. 2025;85(1):79-81.
26. Harlan SS, Philpott CD, Foertsch MJ, et al. Sugammadex efficacy and dosing for rocuronium reversal outside of perioperative settings. Hosp Pharm. 2023;58(2):194-9.
27. Rech MA, Gottlieb M. Sugammadex should be used to reverse rocuronium in emergency department patients with neurologic injuries. Ann Emerg Med. 2025;85(1):78-9.
28. Tichy EM, Rim MH, Cuellar S, et al. National trends in prescription drug expenditures and projections for 2025. Am J Health Syst Pharm. 2025;82(14):806-21.
HIV and Syphilis Testing Among Patients Tested for Gonorrhea and Chlamydia in Emergency Departments
Kyla Sherwood, MD, MS*
Neil Zhang, MD, MS†
Hollie David, MPH‡
Annette Dekker, MD, MS§
Omai Garner, PhD||
Elizabeth Samuels MD, MPH, MHS§
Paul Adamson, MD, MPH‡
University of California, Los Angeles, Division of Preventive Medicine, Department of Medicine, Los Angeles, California
Cedars Sinai Medical Center, Division of Cardiology, Department of Medicine,Los Angeles, California
University of California, Los Angeles, Division of Infectious Diseases, Department of Medicine, Los Angeles, California
University of California, Los Angeles, Department of Emergency Medicine, Los Angeles, California
UCLA Medical Center, Department of Pathology and Laboratory Medicine, UCLA Medical Center, Los Angeles, California
Section Editor: Elissa M. Schechter-Perkins, MD
Submission history: Submitted July 22, 2025; Revision received February 14, 2026; Accepted February 21, 2026
Electronically published April 21, 2026
Full text available through open access at http://escholarship.org/uc/uciem_westjem
DOI: 10.5811/westjem.48813
Introduction: Sexually transmitted infections (STIs), including HIV and syphilis, are increasing. In 2023, there were over 2.4 million reported cases of chlamydia, gonorrhea, and syphilis in the United States, a 32.5% increase from 2014. Emergency departments (EDs) are vital touchpoints for STI testing, yet HIV and syphilis testing among patients undergoing Neisseria gonorrhoeae (NG) and Chlamydia trachomatis (CT) testing is suboptimal. We aimed to determine testing frequency and to identify factors associated with HIV and syphilis co-testing among ED patients undergoing NG/CT testing.
Methods: We conducted a retrospective observational study of all patients tested for NG/CT from 2021–2024 at two Los Angeles EDs. Covariates including sociodemographic and behavioral data were extracted from the medical record. The primary outcome was complete STI testing, defined as both HIV and syphilis testing during or up to six months prior to an ED encounter with NG/CT testing. Multivariable logistic regression was used to evaluate factors associated with complete STI testing.
Results: Of 3,940 patients, 459 (11.7%) received complete STI testing. Among patients receiving complete STI testing, 176 (38.3%) were female, 282 (61.4%) were male, 96 (20.9%) were Hispanic, 98 (21.4%) were non-Hispanic Black, 195 (42.5%) were non-Hispanic White, 220 (47.9%) had Medicare insurance, 132 (28.8%) had private insurance, 225 (49.0%) were experiencing homelessness, 14 (3.1%) identified as bisexual, and 90 (19.6%) identified as heterosexual. In multivariable analysis, patients who were bisexual (adjusted odds ratio [aOR] 2.51; 95% CI, 1.324.80; P = .005); had Medicare insurance (aOR 1.89; 1.20-2.98; P = .006); or were experiencing homelessness (aOR 5.21; 4.00-6.78; P < .001) had higher odds of complete STI testing. Patients who were Hispanic (aOR 0.69; 0.52-0.92; P = .01); non-Hispanic Black (aOR 0.75 ; 0.56-1.00, P = .05); or female (aOR 0.68; 0.54-0.85; P = .001) had lower odds. Of 261 patients with multiple ED encounters, 217 (83.1%) never received complete testing.
Conclusion: Complete HIV and syphilis testing among ED patients tested for N. gonorrhoeae and C. trachomatis was low, even among patients with multiple ED encounters. Lower testing among Hispanic and non-Hispanic Black patients may exacerbate existing disparities in STIs. Implementation research is needed to improve the integration of STI testing in EDs. [West J Emerg Med. 2026;27(3)775–783.]
INTRODUCTION
National rates of sexually transmitted infections (STIs) have increased significantly over the past decade with persistent racial disparities.1 In 2023, there were over 2.4 million reported cases of chlamydia, gonorrhea, and syphilis in the United States, representing a 32.5% increase from 2014.1 Nationwide efforts, including the expansion of the U.S. Preventive Services Task Force HIV screening guidelines and the creation of national programs such as the Ending the HIV Epidemic (EHE) program and the National Syphilis and Congenital Syphilis Syndemic Federal Task Force, were created to address these growing epidemics.2,3 Yet priority jurisdictions targeted by these initiatives, such as Los Angeles County in Southern California, continue to experience dramatic increases in STI rates.2,3 Approximately 59,400 people live with HIV in Los Angeles County, and there are 1,518 new diagnoses annually. In 2023, there were 4,897 newly reported cases of early syphilis (53 per 100,000 people).4,5 The majority of new HIV diagnoses occurred in men, particularly men who have sex with men, and higher HIV diagnosis rates were seen in non-Hispanic Black and Hispanic populations.6
Emergency departments (EDs) represent critical sites for screening and care delivery for patients with syphilis and HIV, particularly among underserved populations who may otherwise lack access to care.7,8 EDs in EHE-priority jurisdictions disproportionately serve patients with higher rates of bacterial STIs and limited insurance coverage.7-9 These EDs also more frequently care for populations prioritized by the EHE initiative for outreach efforts (eg, non-Hispanic Black and Hispanic patient populations) and have been identified as key settings for expanded HIV testing efforts.7,9
Gonorrhea and chlamydia are important risk factors for HIV and syphilis acquisition, with high rates of coinfection.10, 23,24 Accordingly, current STI guidelines recommend HIV and syphilis screening for all patients tested for Neisseria gonorrhoeae (NG) and Chlamydia trachomatis (CT). Yet, prior ED-based studies have demonstrated consistently low rates of concurrent HIV and syphilis testing among patients tested for NG/CT, ranging from < 1 to 30%.11-14,23-25 Despite this, factors associated with incomplete STI testing in the ED remain poorly understood. Low rates of complete STI testing may result in missed HIV and syphilis diagnoses, increasing patients’ risk of untreated infection-related complications and contributing to ongoing transmission in communities.15
In this retrospective observational study, we aimed to characterize HIV and syphilis testing among ED patients tested for NG/CT in an EHE-priority jurisdiction and to identify factors associated with incomplete testing. By characterizing patterns of testing and identifying missed screening opportunities, we sought to inform future implementation strategies to improve complete STI screening in the ED setting.
Population Health Research Capsule
What do we already know about this issue?
The incidence of sexually transmitted infections (STI) is rising nationwide with persistent racial disparities. Concurrent HIV and syphilis testing remains low.
What was the research question?
We aimed to identify factors associated with missed HIV and syphilis testing to improve EDbased STI screening.
What was the major finding of the study?
Hispanic (aOR 0.69, CI 0.52-0.92), Black (0.75, 0.56-1.00), and female (0.68, 0.54-0.85) patients had lower odds of complete STI testing.
How does this improve population health?
Our study underscores the need to expand ED-based STI testing, prioritize vulnerable populations, and implement targeted ED interventions and clinician education.
METHODS
Study Design
This was a retrospective, observational study of all patients ≥ 13 years of age who received NG/CT testing from January 1, 2021–June 30, 2024 at two large, urban EDs in Los Angeles. One ED represents a community hospital staffed by attending physicians, and the second a quaternary, academic referral center staffed by attending physicians and medical trainees. During the study period, no standardized protocol existed for syphilis and HIV testing beyond routine clinical care, and STI testing was conducted based on clinicians’ clinical judgment.
Data Collection
Data were extracted through an automated query of the electronic health record (EHR) for all patients who received NG/CT testing (including urine, pharyngeal, vaginal, urethral, or rectal specimens) during an ED encounter (prior to ED discharge or hospital admission) within the study period. The STI testing was available to be performed at both EDs at any time of day.
We extracted HIV and syphilis testing data during or up to six months prior to the ED encounter. Prior testing was included because clinicians may not repeat testing if it had recently occurred. Both EDs used HIV testing via fourthgeneration HIV antigen/antibody tests and a traditional
Sherwood et al. Factors Associated with Missed HIV and Syphilis Testing in the ED
syphilis testing algorithm (rapid plasma reagin (RPR) test with confirmatory Treponema pallidum particle agglutination when requested). Syphilis positivity was defined as an RPR titer ≥ 1:8.16 HIV viral load testing during or up to six months prior to the ED encounter was performed using HIV RNA polymerase chain reaction testing. In both EDs, all patients with positive test results that returned after an ED encounter were called by an attending physician to notify them of the test result; positive STI tests followed this same procedure. Treatment was offered with antibiotics for positive syphilis, chlamydia, or gonorrhea testing, and patients were offered referrals and/or additional resources to establish HIV care.
Patient demographics included age, sex, race and ethnicity, sexual orientation, health insurance, and history of homelessness. Sex was categorized as male, female, and unknown. Race and ethnicity were categorized as Asian, Hispanic, non-Hispanic Black (hereafter, Black), non-Hispanic White (hereafter, White), other, and unknown. “Other race” included American Indian or Alaska Native, Native Hawaiian or other Pacific Islander, or responses of “other race,” and were combined due to overall small patient numbers. Patients were categorized as unknown race if their EHR intake response was “decline to answer,” “does not identify with race,” or there were missing responses. Sexual orientation was categorized as heterosexual, bisexual, lesbian or gay, other sexual orientation, or unknown.
All patient demographic data were self-reported and collected from the EHR. Health insurance was categorized as private insurance, Medicare, Medicaid, and other. History of homelessness was defined if it was present in the problem list or if a residential address was missing. We grouped data into half-year periods from January 1–June 30 and July 1–December 31 to provide sufficient patient numbers to evaluate temporal trends. These variables were included in our multivariable regression based on our conceptual model for complete STI screening in the ED setting.
Outcomes
The primary outcome was complete STI testing, which was defined as obtaining both HIV and syphilis testing during or up to six months prior to the ED encounter in which a patient received NG/CT testing. Incomplete STI testing was defined as missing HIV and/or syphilis testing during and up to six months prior to the ED encounter.
Data Analyses
We performed descriptive statistics to evaluate patient characteristics with complete as compared to incomplete STI testing. Multivariable logistic regression was performed to evaluate factors associated with complete as compared to incomplete STI testing, specifically evaluating the variables of age, sex, race and ethnicity, sexual orientation, health insurance, history of homelessness, and half-year time period. Interactions were assessed between sex, race and ethnicity,
and experiencing homelessness. For the primary analysis, we excluded repeat ED encounters by the same patient. A separate analysis was performed for patients with multiple ED encounters. We used Pearson chi-squared testing to evaluate trends in STI testing and positivity over the study period. Data analysis was conducted in STATA v18.0 (StataCorp, LLC, College Station, TX). All statistical tests were two-sided. For all statistical testing comparing complete vs incomplete STI testing, significance was set at P < 0.05.
This study was reviewed by the UCLA Institutional Review Board (IRB) with a waiver for informed consent. Analysis and manuscript preparation followed STROBE guidelines (Appendix). This study followed 9 of 12 method criteria outlined by Worster et al: case selection criteria; variable definition; use of abstraction forms; performance monitored; blind to hypothesis; medical records identified; sampling method; missing-data management plan; and IRB approval.17
RESULTS
A total of 3,940 patients received NG/CT testing during the study period, of whom 2,101 (53.3%) were female, 1,437 (36.5%) were White, 1,196 (30.4%) identified as heterosexual, and 1,746 (44.3%) had private health insurance (Table 1).
Complete STI testing was performed in 459 (11.7%) patients. Patients with complete STI testing were more likely to be older, male, and experiencing homelessness (all P < .001). Of the 3,481 patients with incomplete STI testing, 2,980 (85.6%) patients received neither HIV nor syphilis testing, 227 (6.5%) received HIV testing, and 274 (7.8%) received syphilis testing.
Factors Associated with Complete Testing
In the multivariable analysis, patients who were Hispanic (adjusted odds ratio [aOR] 0.69; 95% CI, 0.52-0.92), Black (aOR 0.75; 0.56-1.00, P = .05), and female (aOR 0.68; 0.540.85) had lower odds of complete STI testing. Patients who were bisexual (aOR 2.51; 1.32-4.80), had Medicare insurance (aOR 1.89; 1.20-2.98) and were experiencing homelessness (aOR 5.21; 4.00-6.78) had higher odds of complete STI testing (Figure 1). There were no significant interactions between sex and race. As compared to those who were non-Black and housed, Black patients experiencing homelessness had 48% lower odds of receiving complete testing (aOR 0.52; 0.31-0.88).
Multiple Emergency Department Encounters
There were 261 (6.6%) patients with ≥ 2 ED encounters. Patients with multiple ED encounters were significantly more likely and be Black (P < .001). Of these 261 patients, 25 (9.6%) patients received complete STI testing during their first encounter, an additional 19 (8.1%) patients received complete testing during their second encounter, and no additional patients received testing during their third encounter.
Temporal Trends
Factors Associated with Missed HIV and Syphilis Testing in the ED
Table 1. Cohort characteristics in a study evaluating HIV and syphilis testing among patients tested for Neisseria gonorrhoeae and Chlamydia trachomatis in the emergency department.
aStatistics were performed using t-tests and Pearson chi-squared tests for continuous and categorical data, respectively. P values are for statistical tests comparing complete testing to incomplete testing.
bPercentages represent column percent.
cOther under race and ethnicity includes American Indian or Alaska Native, Native Hawaiian or other Pacific Islander, or other race. Unknown under race and ethnicity includes responses of declined to answer or does not identify with race and missing responses. dOther under sexual orientation includes responses of other or something else. Unknown under sexual orientation includes missing responses and responses of don’t know or choose not to disclose.
eOther under health insurance includes all health insurances besides private, Medicaid, and Medicare as well as any missing responses.
Analysis of temporal trends in STI testing revealed that the total number of patients with NG/CT testing increased over the study period, as did the proportion of patients receiving complete STI testing starting in 2022 (P < .001) (Figure 2). The STI positivity rates were not found to be significantly different over the study period except for syphilis positivity (Figure 3).
DISCUSSION
We found that fewer than 12% of patients undergoing NG/
CT testing received HIV and syphilis testing. Black, Hispanic, and female patients were less likely to receive complete HIV and syphilis testing in the ED. Those experiencing homelessness and who identified as bisexual were more likely to receive complete testing. Over 83% of patients with repeated ED encounters with NG/CT testing never received syphilis and HIV testing. These findings highlight critical gaps in ED-based STI testing and underscore the need for strategies to improve comprehensive ED-based STI testing.
Many factors may contribute to low complete STI
Sherwood et al. Factors Associated with Missed HIV and Syphilis Testing
Figure 1. Forest plot depicts the adjusted odds ratio estimates of patient and encounter factors associated with receiving complete HIV and syphilis testing in the multivariable logistic regression model. aAge per 10 years.
bEarly refers to January–June. Late refers to July–December.
testing, including the fast-paced ED environment, patient factors, clinician knowledge and/or clinical priorities, and the logistics of obtaining STI test results.14 Both syphilis and HIV testing require blood draws, which may limit ease of testing compared to NG/CT swabs. Another consideration is that while syphilis, gonorrhea, and chlamydia can be treated with either intramuscular or oral antibiotics, new HIV diagnoses require establishing longitudinal HIV care. We recognize that ED clinicians may be hesitant to offer HIV testing due
to concerns about optimally addressing new HIV diagnoses from the ED setting. However, most patients with incomplete testing did not receive either HIV or syphilis testing, and more patients missed syphilis as compared to HIV testing (274 vs 227 patients, respectively). Thus, concerns about longitudinal follow-up of positive HIV test results did not clearly appear to drive incomplete STI testing. Notably, NG/CT testing volumes were also low in this ED setting. Across the study period, an average of three patients per day received NG/CT testing at
Figure 2. Number and proportion of patients who received complete and incomplete HIV and syphilis testing by half-year period (20212024) in a study identifying factors related to incomplete vs complete HIV and syphilis testing in the emergency department.
*Early refers to January–June. Late refers to July–December.
STI, sexually transmitted infection.
Figure 3. Proportion with positive test results for gonorrhea, chlamydia, HIV, and syphilis by half-year period (2021– 2024) in a study identifying factors related to incomplete vs complete HIV and syphilis testing in the emergency department.
*Early refers to January–June. Late refers to July–December.
STI, sexually transmitted infection.
Sherwood et al. Factors Associated with Missed HIV and Syphilis Testing in the ED
both ED sites, further underscoring the low utilization of EDbased STI screening.
The racial disparities in HIV and syphilis testing observed in our study are concerning as they may compound existing STI disparities. Our finding that Black and Hispanic patients were less likely to receive complete syphilis and HIV testing is consistent with prior literature.14,18 In those reports, lower complete STI testing may have been influenced by bias, stigma, or patient distrust of the medical system.14,18 In this study, we were unable to assess the reasons for incomplete testing in these populations. Nationwide, higher rates of syphilis and HIV occur among Black and Hispanic populations.1 In Los Angeles County, Black patients experienced disproportionately higher rates of HIV diagnoses, representing 22% of HIV diagnoses, despite accounting for only 8% of the population, and Hispanic mothers represented 64% of all congenital syphilis cases.6,19 We propose that focused efforts to prioritize STI testing are critical in addressing these persistent racial STI disparities in these populations.
Our findings underscore how social determinants of health may influence the likelihood of complete HIV and syphilis testing. Experiencing homelessness was associated with a 5-fold increase in the odds of complete testing. To our knowledge, housing status has not been evaluated in prior ED STI literature. We hypothesize that clinicians recognize that people experiencing homelessness represent a vulnerable population that has unique barriers to care and markedly benefit from ED-based comprehensive STI screening.20 However, racial disparities persisted even among those experiencing homelessness, as Black patients experiencing homelessness were less likely to receive complete testing.
Our finding that most patients with multiple ED presentations did not receive complete STI testing was particularly concerning. Patients with repeated ED encounters involving NG/CT testing represent a population at elevated risk for HIV and syphilis, given the high prevalence of STI coinfections and the well-established role of gonorrhea and chlamydia as risk factors for HIV acquisition.10, 23, 24 Recurrent ED encounters with NG/CT testing may also reflect limited access to longitudinal primary care, representing a patient population that disproportionately relies on ED-based care for STI testing. Together, these findings suggest that patients with multiple ED encounters constitute a population at increased risk for HIV and syphilis for whom testing was repeatedly missed despite multiple opportunities.
Notably, we observed an increase in the proportion of patients with complete STI testing throughout the study period, which did not appear to be related to changes in patient demographics. Several possible explanations may account for this observation. First, clinical disruptions during the COVID-19 pandemic may have limited or de-emphasized ED-based STI testing in the early study period, which improved over time. Second, growing awareness of the HIV
and syphilis epidemics—possibly driven by public health campaigns—may have increased clinicians’ recognition of the importance of STI testing. Although further research is needed to clarify the specific factors underlying this trend, EHE-priority jurisdictions have documented increases in HIV testing, indicating that outreach efforts may be improving HIV testing practices.21 However, more than 75% of patients still did not receive complete testing at the end of the study period, underscoring the ongoing need for innovation to improve EDbased STI testing.
LIMITATIONS
There were several limitations to this study. Incomplete testing may relate to patient preference, which was not collected for this study. However, previous studies have demonstrated that patients undergoing screening prefer testing for all STIs rather than a subset.22 Patients may have also favored empiric treatment rather than testing for syphilis, which we were unable to determine. However, most patients did not receive both HIV and syphilis testing, suggesting empiric treatment was not the sole reason for incomplete STI testing. Given the retrospective nature of the study, we could not determine causality or directionality in the relationship between NG/CT and syphilis/HIV testing (ie, our study may have captured patients who were initially targeted for HIV/ syphilis testing). Our findings are significant despite the inclusion of these patients, which would likely have biased the results toward the null. As a retrospective review, some demographic variables, particularly sexual orientation, were limited to what was reported in the EHR.
During the study period, there were changes within the EHR on how these data were collected. Nevertheless, sexual orientation was included in the model, given the well-established increased burden of STIs and HIV among the population of men who have sex with men. Due to limitations of our data extraction process and the sensitive nature of HIV diagnoses, it was not feasible to determine patients’ HIV statuses prior to their ED visit. However, it would be appropriate when performing NG/CT testing to send an isolated HIV viral load testing as part of an evaluation for patients known to be living with HIV; the HIV viral load test was only performed for 37 patients at the time of ED encounter or six months prior, with 24 patients having detectable viral loads. This finding suggests that patients known to be living with HIV likely did not represent a significant portion of the study population.
Lastly, this study occurred at two EDs within a single academic health system. While this may limit the generalizability, the study setting is significant given its location in an Ending the HIV Epidemic-priority county serving a diverse patient population.
CONCLUSION
Despite increased awareness and national organizations
Factors Associated with Missed HIV and Syphilis Testing in the ED
targeting rising rates of HIV and syphilis through expanded screening guidelines for STIs and public health initiatives, comprehensive STI screening in ED settings remains an ongoing challenge.2,3 Our study highlights missed opportunities for HIV and syphilis testing among Black and Hispanic populations, who already suffer from disproportionately higher rates of HIV and syphilis. HIV and syphilis testing was also repeatedly missed among patients with multiple ED encounters for NG/CT testing.
Emergency departments are likely to play an increasingly vital role as the safety net for STI care in the United States. To effectively address gaps in ED-based STI testing, implementation research is needed to evaluate targeted interventions, including clinician education on STI prevalence, the frequency of coinfections, and optimal STI screening test ordering practices. Enhancements to the electronic health record, such as clinical decision support tools, may prompt clinicians to order complete STI testing through standardized order panels or best practice alerts.
Additionally, streamlining protocols to deliver rapid, actionable STI testing results prior to ED discharge, along with establishing durable referral pathways for the management of positive results, may further facilitate increased testing. These interventions will be evaluated in follow-up implementation work at our institution to generate additional insight and best practices for improving complete STI testing in the ED setting.
Address for Correspondence: Kyla Sherwood, MD, MS, San Francisco Department of Public Health, Tuberculosis Control Program, 2460 22nd St., Building 90, San Francisco, CA 94110. Email: kyla.d.sherwood@sfdph.org.
Conflicts of Interest: By the WestJEM article submission agreement, all authors are required to disclose all affiliations, funding sources and financial or management relationships that could be perceived as potential sources of bias . ES is partially supported by the Centers for Disease Control Grant R01CE003632 and UCLA-CDU Center for AIDS Research Pilot Grant P30 AI152501. NZ is supported by the NIH Grant T32 HL116273. No funders had roles in the design of study, collection, management, analysis, and interpretation of the data; preparation, review, or approval of the manuscript; or decision to submit the manuscript for publication. No author has professional or financial relationships with any companies that are relevant to this study. There are no other conflicts of interest or sources of funding to declare.
2. U.S. Department of Health and Human Services. 2024 [cited 2024 Dec 6] HHS Announces Department Actions to Slow Surging Syphilis Epidemic [Internet]. Available from: https://www.hhs.gov/about/ news/2024/01/30/hhs-announces-department-actions-slow-surgingsyphilis-epidemic.html.
3. Centers for Disease Control and Prevention. 2023 [cited 2023 Sept 22 Ending the HIV Epidemic in the U.S. (EHE) [Internet]; Available from: https://www.cdc.gov/endhiv/about-ehe/index.html.
4. LA County HIV. Ending the HIV Epidemic [Internet]. [cited 2026 Jan 13]; Available from: https://www.lacounty.hiv/#:~:text=LA%20 County%20has:%20*%2059%2C400%20people%20with,the%20 icons%20to%20learn%20about%20the%20pillars
5. Los Angeles County Department of Public Health. Sexually Transmitted Infections Los Angeles County, 2023 [Internet]. 2025 [cited 2026 Jan 13]; Available from: http://www.publichealth.lacounty. gov/dhsp/Reports/STD/2023_STI_Snapshot_LAC_only_011425.pdf
6. Division of HIV and STD Programs, Department of Public Health County of Los Angeles. 2023 [cited 2024 Dec 5. 2022 Los Angeles County Annual HIV Surveillance Report [Internet]; Available from: http://publichealth.lacounty.gov/dhsp/Reports/HIV/Annual_HIV_ Surveillance_Report_2022_LAC_Final.pdf
7. Bennett CL, Detsky AS, Clay CE, et al. Comparison of US emergency departments by HIV priority jurisdiction designation: a case for geographically targeted screening in teaching hospitals. PLoS One 2023;18(10):e0292869.
8. Stanford KA, Mason J, Friedman E, et al. An opt-out emergency department screening intervention leads to major increases in diagnosis of syphilis. Open Forum Infect Dis 2024;11(9):ofae490.
9. Bennett CL, Clay CE, Siddiqi KA, et al. Characteristics of California emergency departments in Centers for Disease Control and Prevention-designated HIV priority counties. J Emerg Med 2023;64(1):93-102.
10. Ford JS, Morrison JC, Wagner JL, et al. Sexually transmitted infection co-testing in a large urban emergency department. West J Emerg Med 2024;25(3):382-388.
11. Klein PW, Martin IBK, Quinlivan EB, et al. Missed opportunities for concurrent HIV-STD testing in an academic emergency department. Public Health Rep 2014;129 Suppl 1(Suppl 1):12-20.
12. Barnes A, Jetelina KK, Betts AC, et al. Emergency department testing patterns for sexually transmitted diseases in North Texas. Sex Transm Dis 2019;46(7):434-439.
13. Phelan MP, Panakkal V, Muir M, et al. Emergency department co-testing for human immunodeficiency virus when testing for gonorrhea and chlamydia: a readily available, missed opportunity for targeted HIV testing in emergency departments. Am J Clin Pathol 2023;159(3):225-227.
14. Seballos SS, Lopez R, Hustey FM, et al. Cotesting for human immunodeficiency virus and sexually transmitted infections in the emergency department. Sex Transm Dis 2022;49(8):546-550.
15. Pinto CN, Niles JK, Kaufman HW, et al. Impact of the COVID-19 pandemic on chlamydia and gonorrhea screening in the U.S. Am J
Sherwood et al. Factors Associated with Missed HIV and Syphilis Testing in the ED
Prev Med 2021;61(3):386-393.
16. Hunt JH, Laeyendecker O, Rothman RE, et al. A potential screening strategy to identify probable syphilis infections in the urban emergency department setting. Open Forum Infect Dis 2024;11(5):ofae207.
17. Worster A, Bledsoe RD, Cleve P, et al. Reassessing the methods of medical record review studies in emergency medicine research. Ann Emerg Med 2005;45(4):448-451.
18. Almirol E, Meyer M, Mason JA, et al. HIV and syphilis co-screening rates among patients tested for gonorrhea and chlamydia at a large, urban hospital. Sex Transm Dis 2024;51(11):728–33.
19. 2022 STD Surveillance Snapshot [Internet]. Division of HIV and STD Programs, Los Angeles County Department of Public Health. 2024 [cited 2024 Nov 21]. Available from: http://publichealth.lacounty.gov/ dhsp/Reports.htm
20. Williams SP, Bryant KL. Sexually transmitted infection prevalence among homeless adults in the United States: a systematic literature review. Sex Transm Dis 2018;45(7):494-504.
21. Patel D, Mulatu MS, Wang G, et al. CDC-funded HIV testing services outcomes in Ending the HIV Epidemic in the U.S. (EHE) and nonEHE jurisdictions, 2021. J Infect Dis 2025;231(1):147-155.
22. Miners A, Llewellyn C, Pollard A, et al. Assessing user preferences for sexually transmitted infection testing services: a discrete choice experiment. Sex Transm Infect 2012;88(7):510-516.
23. Dionne-Odom J, Workowski K, Perlowski C, et al. Coinfection with chlamydial and gonorrheal infection among US adults with early syphilis. Sex Transm Dis 2022;49(8):e87–9
24. Barker EK, Malekinejad M, Merai R, et al. Risk of human immunodeficiency virus acquisition among high-risk heterosexuals with nonviral sexually transmitted infections: A systematic review and meta-analysis: A systematic review and meta-analysis. Sex Transm Dis 2022;49(6):383–97.
25. Clinical Testing Guidance for HIV [Internet]. Centers for Disease Control and Prevention. 2025. Accessed April 18, 2025. Available from: https://www.cdc.gov/hivnexus/hcp/diagnosis-testing/index.html.
Clinician-documented Firearm Access and Safety Interventions for Veterans Receiving Suicide Risk Evaluation in VA Emergency Care Settings
Joseph A Simonetti, MD, MPH*†
Samuel E King, MPA*
Ryan Holliday, PhD*‡||
Gabriela K Khazanov, PhD#
Alexandra Smith, MS*‡
Nazanin Bahraini, PhD*‡||
Lisa A Brenner, PhD‡§||**
Bridget B. Matarazzo, PsyD*||
Section Editor: Muhammad Waseem, MD
Veterans Health Administration, Rocky Mountain Regional VA Medical Center, Department of Rocky Mountain Mental Illness Research, Education and Clinical Center for Suicide Prevention, Aurora, Colorado
University of Colorado Anschutz School of Medicine, Firearm Injury Prevention Initiative, Aurora, Colorado
University of Colorado Anschutz School of Medicine, Department of Physical Medicine and Rehabilitation, Aurora, Colorado
Author institutions continued at end of article
Submission history: Submitted September 9, 2025; Revision received January 12, 2026; Accepted January 14, 2026
Electronically published May 19, 2026
Full text available through open access at http://escholarship.org/uc/uciem_westjem DOI 10.5811/westjem.50852
Background: The success of clinical programs aimed at preventing suicide risk depends in part on whether they can be used to identify and act upon risk factors for suicide. Our aim in this study was to describe frequency of clinician documentation of firearm access and the delivery of safety interventions among patients who received a suicide risk evaluation in Veterans Health Administration (VHA) emergency departments (ED) or urgent care (UC) settings.
Methods: We used electronic health record data of patients who received care in VHA ED/UC settings January 2021–October 2022 and underwent suicide risk evaluation by clinicians using the Veterans Affairs (VA) Comprehensive Suicide Risk Evaluation (CSRE) prior to discharging home. The proportion of patients with self-reported firearm access was identified from clinician-documented CSRE templates. Among those who reported firearm access, we identified the proportion who received any safety intervention (delivery of lethal means safety counseling and/or distribution of firearm cable locks per CSRE documentation, or update/creation/review of a VA Safety Plan) within 24 hours of the ED/UC encounter. We compared differences using chi-square or Fisher exact tests for categorical outcomes and analysis of variance or independent sample t-tests for continuous outcomes.
Results: Of 17,194 patients who were discharged home, 15.2% were documented as having firearm access (8.5% access to “other” lethal means, 68.8% no lethal means access, 7.4% unknown access). Of 2,624 patients with documented firearm access, 80.6% were documented as having received a safety intervention. Of those, 56.8% received lethal means safety counseling, 13.2% received a firearm cable lock, and 88.6% reviewed or completed a new or updated VA Safety Plan.
Conclusion: Among patients who underwent suicide risk evaluation prior to discharging home from a Veterans Health Administration ED/UC setting, a low percentage were documented as having firearm access. Of those with firearm access, a large majority received at least one safety intervention. System-wide strategies to encourage delivery of safety interventions can reach a large proportion of at-risk patients. Additional efforts are needed to increase reporting and documentation of firearm access. [West J Emerg Med. 2026;27(3)784–793.]
INTRODUCTION
The age-adjusted suicide rate in the United States (U.S.) increased by approximately 30% from 2001 to 2021, and more than 48,000 individuals died from suicide in 2021.1 In response to this, a variety of interventions aimed at identifying and mitigating suicide risk have been deployed in healthcare systems.2-4 A common limitation of these efforts is that interventions aimed at identifying and addressing suicide risk have typically been centered within mental health settings, thereby focusing on individuals with known mental health conditions. This approach is insufficient in identifying all patients at risk for suicidal behavior.5-7 Nearly one-half of individuals who die by suicide in the U.S. are not diagnosed with a mental health condition prior to their death.8,9 Further, there are other important risk factors for suicide, such as firearm access and physical health conditions (eg, cancer), and suicide decedents commonly seek care in non-mental health settings prior to their deaths.10-12
One approach to address these challenges is to expand the implementation of suicide risk screening and evaluation to other clinical settings and patient groups. In 2018, the Veterans Health Administration (VHA) implemented a nationwide effort to expand suicide risk screening and evaluation among its patient population, known as Veterans Affairs Suicide Risk Identification Strategy (VA Risk ID).13,14 In addition to standardizing procedures for risk screening and evaluation, VA Risk ID included the extension of processes to non-mental health settings, such as specialty medical and emergency care settings. Early evaluations of this initiative have demonstrated that identification of suicide risk through VA Risk ID is associated with increased mental health follow-up and engagement, particularly for patients who are not already connected to mental health care.15
The effectiveness of VA Risk ID and similar efforts in other healthcare systems will depend in part on whether the clinical processes can be used to identify actionable risk factors for suicide and subsequent implementation of evidence-informed interventions. Firearm access is an independent risk factor for suicide and is common among veterans; in 2022, 73% of veteran suicides were attributed to firearm injury.11,16,17 Evaluation procedures used in VA Risk ID include assessment of firearm access among care-seeking veterans and documentation of safety interventions indicated for those who endorse firearm access. Our goal in this study was to describe the frequency of clinician-documented firearm access among veterans who sought care in VHA emergency department (ED)/ urgent care (UC) settings and received suicide risk evaluation. We further determined which, if any, safety interventions (eg, lethal means counseling) were provided to patients who endorsed firearm access.
METHODS
We conducted a nationwide, retrospective study of
Population Health Research Capsule
What do we already know about this issue?
The Veterans Health Administration (VHA) has incorporated screening for firearm access for patients with elevated suicide risk.
What was the research question?
Of patients with elevated suicide risk discharged from emergency departments, what proportions have firearm access and receive firearm-related interventions?
What was the major finding of the study?
Of 17,194 discharged patients, 15.2% had firearm access and 80.6% of those patients received a safety intervention.
How does this improve population health?
System-wide strategies to encourage delivery of safety interventions can reach a large proportion of at-risk patients.
electronic health records of patients who received care in VHA ED or UC settings. This study was determined to be quality improvement and, thus, review by the institutional review board was not required.
Veterans Affairs Suicide Risk Identification Strategy in Emergency Department/Urgent Care Settings
Per VA Risk ID, all patients accessing VHA ED/UC services are mandated to be screened and/or evaluated for suicide risk. Screening is conducted using the Columbia Suicide Severity Rating Scale Screener (C-SSRS),18 which assesses past month suicidal ideation, including method, intent, plan, and both lifetime and recent (prior three month) suicidal behavior. A positive C-SSRS screen is defined as a “yes” response regarding suicide method, intent, plan, and/or recent suicidal behavior. Clinicians are required to complete the VA Comprehensive Suicide Risk Evaluation (CSRE) and document results within 24 hours for patients who screen positive.14 The CSRE is a VHA-specific, templated clinical tool that facilitates the collection of patient-reported data on suicide risk factors, including firearm access, and protective factors that are then used to inform a determination of acute (low, intermediate, high) and chronic (low, intermediate, high) suicide risk. Based on this evaluation and stratification, clinicians then document evidence-informed suicide risk interventions (eg, lethal means counseling; safety planning;
naloxone distribution; outpatient referral; hospitalization) that will best meet the patient’s needs and preferences. In some circumstances (eg, patient self-disclosure of recent suicide attempt during intake), clinicians may forgo C-SSRS screening and administer the CSRE. Additional information on VA Risk ID and the CSRE have been published previously.14
Veterans Hospital Administration policy also requires that patients who are discharged home and stratified at intermediate (acute or chronic) or high (acute or chronic) suicide risk in ED/UC settings receive a new or updated VA Safety Plan (or review an existing one), which must be documented within 24 hours of their ED discharge. The VA Safety Plan is a brief, structured intervention designed to mitigate future risk by providing individuals with a written, personalized plan to be used before the onset or during a suicidal crisis.19 It is developed collaboratively between a clinician and a patient and has six main steps. Step 6 is focused on identifying strategies for “making one’s environment safer” and includes elements of lethal means safety, such as use of secure firearm storage practices.
Setting, Patients, and Data Source
We included all patients who sought care in VHA ED/UC settings from January 2021–October 2022, received a CSRE that was documented from one hour prior to ED/UC arrival until one hour after ED/UC discharge, and whose discharge disposition was “home.” All data were abstracted from the VA Corporate Data Warehouse.
Outcomes and Variables
The primary outcomes of this study were 1) patientreported, clinician-documented firearm access, and 2) clinician-documented delivery of safety interventions during the ED/UC encounter. Firearm access was abstracted from CSREs conducted during the ED/UC encounter and assessed using the item “Does the veteran have access to lethal means?” Response options include “yes,” “no,” and “unknown,” and clinicians are required to respond specifically to prompts about “firearms” and “other lethal means.”
Delivery of safety interventions was abstracted from templated content in the CSRE Risk Mitigation Plan, in which clinicians document which prevention strategies are indicated. Clinicians have the option to document delivery of “lethal means safety counseling,” which may also include the provision of no-cost firearm cable locks, and the review of or completion of a new or updated VA Safety Plan. We considered a patient to have received a safety intervention if the clinician documented delivery of “lethal means safety counseling” (with or without distribution of a firearm cable lock) in the CSRE or review or creation of a new or updated safety plan (documented in CSRE Risk Mitigation Plan or in a separate standardized note template). We abstracted safety
plan data from notes entered 24 hours prior to the clinical encounter (because repeating a VA Safety Plan in the same 24-hour period is not necessarily clinically warranted) to 24 hours after discharge.
To characterize the study population, we also abstracted other variables including the following: age; sex; race; ethnicity; marital status; the presence of mental health diagnoses; prior engagement with homeless services; C-SSRS Screener results documented from one hour prior to the index encounter until the end of that calendar day; and CSRE risk stratification (acute: low, intermediate, high; chronic: low, intermediate, high).
Data Analysis
We began by categorizing the study population into four mutually exclusive groups, including those with firearm access, access to lethal means but not firearms, access to no lethal means, and those with unknown access to lethal means. We then described the demographic, clinical, and suicide risk-stratification characteristics of the study population and compared differences across groups. Among those with patient-reported, clinician-documented firearm access, we quantified the proportion of patients for whom a clinician documented the delivery of a safety intervention (lethal means safety counseling (with or without distribution of a cable lock] and/or review or creation of a new or updated VA Safety Plan). For comparison, we also estimated the proportion of patients with access to “other lethal means” who received a safety intervention.
We reported the proportion who received a safety intervention overall and by specific patient characteristics. Among those who did not receive any safety intervention, we differentiated between those for whom a safety plan was not attempted and those who were offered but declined to complete one. Given that VA clinical guidance and memoranda require delivering safety interventions to patients who are discharged home and stratified as being at intermediate (acute or chronic) or high (acute or chronic) suicide risk,14,20 we also conducted a subgroup analysis to describe the proportion of patients who received safety interventions if their acute or chronic risk was intermediate or high. We used either chi-square tests or Fisher exact tests (if any expected cell counts were < 5) to assess for significant differences across groups for categorical outcomes. For continuous outcomes, we used either analysis of variance or independent sample t-tests. The sample sizes in all groups were substantially > 30 and, thus, met the assumptions for the methods used (ie, the central limit theorem is in effect). We used SAS v9.4 (SAS Institute Inc, Cary, NC) for all analyses.
RESULTS
We identified 17,194 patients who sought care in VHA ED/UC settings, received a CSRE, and had a discharge
Table 1. Demographic, clinical, and suicide risk characteristics of study population, by self-reported, clinician-documented access to lethal means.
disposition of “home.” Sociodemographic and clinical characteristics of the full population and by documented access to lethal means are shown in Table 1. Results of CSRE suicide risk stratification are shown in Table 2. Overall, 15.2% were documented as having firearm access, 8.5% as having access to “other” lethal means, 68.8% as having no lethal means access, and 7.4% as having unknown lethal means
access (Table 1). The characteristics of the 2,378 patients who declined to receive a VA Safety Plan were generally similar to those of the overall population (Appendix Table 1).
In comparison to other patients, those documented as having firearm access were significantly more likely to be male, White, non-Hispanic, and married, and were less likely to have a mental health diagnosis or to have engaged VHA
Table 1. Continued.
*Estimate is the percentage of positive C-SSRS screens among those who received a C-SSRS assessment. SD, standard deviation; C-SSRS, Columbia Suicide Severity Rating Scale.
homelessness services (Table 1). A stratification of intermediate or high acute suicide risk was determined for 31.6% of those with firearm access; for 46.8% of those with access to “other” means; 20.6% of those with no lethal means access; and 29.1% of those with “unknown” lethal means access (P < .001). A stratification of intermediate or high chronic suicide risk was determined for 48.5% of those with firearm access, 70.0% of those with access to “other” means, 46.3% of those with no lethal means access, and 53.2% of those with unknown lethal means access (P < .001).
Of the 2,624 patients with documented firearm access, 80.6% were documented as having received a safety intervention within 24 hours of their ED encounter (Table 3). Of those, 56.8% received lethal means safety counseling, 13.2% received a firearm cable lock, and 88.6% reviewed or completed a new or updated VA Safety Plan. For comparison, of the 1,459 patients with documented access to “other” lethal means, 77.5% were documented as having received a safety intervention. Among those with documented firearm access,
receipt of a safety intervention was significantly more likely among those who were younger, non-White, assessed as being at intermediate (acute or chronic) or high (acute or chronic) suicide risk rather than low (acute or chronic) risk, or had a positive C-SSRS Screener during the encounter (P < .01, all comparisons). Receipt of a safety intervention ranged from 68.0% among those at low acute, low chronic risk to 95.2% among those at intermediate acute, low chronic risk. In a subgroup analysis of 1,441 patients with documented firearm access who were assessed as having intermediate or high acute or chronic suicide risk, 90.8% were documented as having received a safety intervention (Appendix Table 2).
DISCUSSION
The VHA has implemented a universal suicide risk screening and evaluation approach for patients receiving care in ED and UC settings. To our knowledge, this is the first study to describe patient-reported, clinician-documented access to firearms and other lethal means, as well as safety
Table 2. Acute and chronic suicide risk stratification of U.S. veterans population (N = 17,194)* in a study of patients who received care in Veterans Health Administration emergency departments or urgent care centers.
Chronic risk, n (%)**
*Ten patients were missing risk stratification data.
**Percentages in each cell reflect the proportion of those patients within the entire population.
Table 3. Receipt of any safety intervention based on demographic, clinical, and suicide risk characteristics of patients with self-reported, clinician-documented firearm access (n = 2,624).
interventions delivered to those patients. We found that an overall low proportion of patients are identified as having firearm access (15%). However, among those with firearm access, 8 in 10 patients received a safety intervention within 24 hours of their discharge.
Nationally representative studies of the U.S. veteran population suggest that about one-half reside in a household with a firearm17; a substantially lower prevalence than among the national population of veterans who sought care in VA ED/ UC settings and underwent suicide risk evaluation (among
whom the true prevalence of firearm access is unknown). Some of this difference is likely attributable to sociodemographic differences between these populations. For example, the average income of U.S. firearm owners is higher than among non-owners.21 Nearly one-half of the patients in this study had previously used homeless services, suggesting that they may have lower-than-average income. Because we specifically identified a group of patients undergoing suicide risk evaluation, we may have further selected for a population with lower-than-average firearm ownership if some patients
Table 3. Continued
*Estimate is the percentage of positive C-SSRS screens among those who received a C-SSRS Screener. SD, standard deviation; C-SSRS, Columbia Suicide Severity Rating Scale.
had taken steps to reduce their access to firearms prior to their encounter.22 Consistent with our findings, a recent evaluation of safety planning in the VHA found that only 28% of veterans were documented as having firearm access.23 Lower than expected prevalences of firearm access have also been identified within the context of mental health treatment in other healthcare systems.24
The difference in firearm access between these populations may also be partially attributable to screening and reporting practices. Prior studies have identified concerns among veterans and other firearm owners about disclosing firearm access during clinical encounters, particularly within the context of mental health problems.25-29 Similar studies have also identified barriers to asking about firearm access during encounters, including competing demands, lack of training, and discomfort with firearm-related discussions.27,30,31 Regarding the latter, however, the VHA has dedicated significant resources to training its healthcare workforce to engage in discussions about firearms, particularly among clinicians who would be expected to engage in suicide risk
evaluation in ED/UC settings.
When patients undergoing suicide risk evaluation were identified as having firearm access, 81% received a safety intervention within 24 hours (91% among those with intermediate or high acute or chronic risk). This highlights room for improvement in terms of ensuring delivery of safety interventions for all patients with elevated suicide risk. Notably, we were unable to capture safety interventions that occurred but were not documented appropriately, and we did not assess delivery of interventions > 24 hours after the episode of care. If interventions are being delivered outside that 24-hour window, it might suggest that processes are in place to deliver recommended care, and further study would be needed to identify obstacles to doing so in a timelier fashion.
Among those with firearm access, receipt of safety interventions was lowest among those assessed as having low acute, low chronic risk for suicide (68%; notably, a VA Safety Plan is not required for these patients). The likelihood of receiving a safety intervention then increased as acute or
chronic risk increased. Unexpectedly, patients who were assessed as having high acute risk for suicide were less likely to receive a safety intervention than most other risk groups. Such a finding is disconcerting as those at high acute risk are presumably designated as such in part due to their inability to maintain safety autonomously. Additional work is needed to ensure the validity of these initial risk stratifications and what clinical care such patients do receive. However, we also conducted exploratory post hoc analyses to further investigate this issue by identifying each of these patients and determining whether they received additional clinical care (yes/no) in the following 24 hours (rather than being discharged home without short-term treatment).
In those analyses, most patients appeared to be receiving intensive suicide-specific care around the time of their ED/UC encounter. Of the 81 patients who were stratified as having high acute risk for suicide, had access to a firearm, and who had a discharge disposition of “home,” 79 had an additional clinical encounter in the 24 hours after ED arrival and 39 had an additional clinical encounter in the 24 hours after ED departure. In many cases, clinicians coordinated same-day or short-term follow-up in mental health settings (during which safety interventions are often delivered). In other situations, patients were transferred to other care settings or hospitalized immediately after their ED/UC discharge. Notably, a discharge disposition of “home” does not necessarily mean that a patient returned directly to their home.
We identified several areas for further investigation regarding the use of the CSRE to document access to lethal means. First, 69% of patients were documented as having no access to lethal means. Given the ubiquity of potential lethal means, such as ligatures and sharp instruments, this estimate seems implausible. This may indicate that clinicians assessed patients’ access to means and felt that no specific lethal method was of particular relevance to the patient’s suicide risk. Further study of this issue among clinicians could inform modifications to the CSRE (eg, clarity around item intent). Second, further work is needed to understand why and under what conditions a clinician would document that a patient had “unknown” access to lethal means (eg, patient declined to answer; patient intoxicated), which accounted for 7% of this study population.
Nearly one-half of patients in this study population had previously accessed VHA homelessness services. This highlights the importance of developing safety interventions that are specific to the needs of patients with housing instability.32 For example, interventions that promote secure in-home firearm storage are less likely to be applicable to unsheltered homeless veterans. Given that most veterans keep firearms for personal and household protection, and that homeless patients are at increased risk of physical and sexual violence, identifying ways to increase the personal safety of these patients is likely to be a necessary step in addressing firearm access among those with elevated suicide risk.33,34
LIMITATIONS
This study has limitations. First, we describe delivery of safety interventions among those with firearm access. While firearm-specific interventions are recommended for this population, we were unable to confirm with existing data whether these interventions included firearm content. Second, we considered endorsement of having completed a safety plan on the CSRE template as having received a safety intervention and did not specifically review VA Safety Plan templates themselves. However, in exploratory post hoc analyses, of those identified as having received a safety plan on the CSRE template, 95.5% had a documented safety plan note within 24 hours of their care episode. Third, although our approach to evaluating care delivery could be applied elsewhere, our specific findings are not generalizable to other settings and populations.
CONCLUSION
The Veterans Health Administration has initiated a nationwide suicide risk screening and evaluation program. Among patients who underwent suicide risk evaluation through this program in ED or UC settings, 15% had patientreported, clinician-documented firearm access and nearly 81% of those individuals received a safety intervention within 24 hours of being discharged home. These findings highlight the substantial reach and potential of such an initiative, as well as opportunities for process improvement.
ACKNOWLEDGMENTS
We would like to acknowledge the contributions of Leo Kalotihos in the conduct of this study.
Affiliations continued
§University of Colorado Anschutz School of Medicine, Department of Neurology, Aurora, Colorado
||University of Colorado Anschutz School of Medicine, Department of Psychiatry, Aurora, Colorado
#Ferkauf Graduate School of Psychology, Yeshiva University, Bronx, New York
**Veterans Health Administration, Rocky Mountain Regional VA Medical Center, Brain Health Coordinating Center, Aurora, Colorado
Address for Correspondence: Joseph A. Simonetti, MD, MPH, Rocky Mountain Regional VA Medical Center, Rocky Mountain Mental Illness Research, Education and Clinical Center for Suicide Prevention, 1700 N Wheeling St, Aurora, CO 80045. Email: joseph.simonetti@va.gov
Conflicts of Interest: By the WestJEM article submission agreement, all authors are required to disclose all affiliations, funding sources and financial or management relationships that could be perceived as potential sources of bias. The views expressed in this article are those of the authors and do not necessarily reflect the position or policy of the Department of Veterans Affairs or the U.S. government.
Simonetti
Simonetti, King, Khazanov, Smith, Matarazzo: no disclosures/ conflicts. Dr. Bahraini reports grants from the Department of Veterans Affairs, the State of Colorado, and editorial renumeration from Wolters Kluwer and the American Psychological Association (APA). Holliday: Dr. Holliday reports grants from the Department of Veterans Affairs, Department of Defense, and the National Institutes of Health (NIH). Brenner: Dr. Brenner reports grants from the Department of Veterans Affairs, Department of Defense, NIH, and the State of Colorado, editorial remuneration from Wolters Kluwer and the Rand Corporation, and royalties from the APA and Oxford University Press. In addition, she consults with sports leagues via her university affiliation. None of these efforts are directly related to the study. No other author has professional or financial relationships with any companies that are relevant to this study. There are no other conflicts of interest or sources of funding to declare.
1. National Center for Injury Prevention and Control - Centers for Disease Control and Prevention. Fatal and Nonfatal Injury Reports. Web-Based Injury Statistics Query & Reporting System (WISQARS). Available at: https://wisqars.cdc.gov/reports/. Accessed November 15 2023.
2. National Academies of Sciences, Engineering, and Medicine; Division of Behavioral and Social Sciences and Education; Board on Children, Youth, and Families; Health and Medicine Division; Board on Health Care Services; Olson S, editor. Improving Care to Prevent Suicide Among People with Serious Mental Illness: Proceedings of a Workshop. Washington, DC: National Academies Press (US); 2018 Dec 28. 3, Suicide Prevention in Health Care Systems. Available from: https://www.ncbi.nlm.nih.gov/books/NBK540128/.
3. National Patient Safety Goal on Suicide Prevention in Health Care Settings. The Joint Commission. Available at: https://www. jointcommission.org/resources/patient-safety-topics/suicide-preventio n/#7183523df84d401ba6611b04917a6a9d_2bd393446ceb46c1977b 700bd3337efc. Accessed November 15 2023.
4. Hogan MF, Grumet JG. Suicide prevention: an emerging priority for health care. Health Aff (Millwood). 2016;35(6):1084-1090.
5. Belsher BE, Smolenski DJ, Pruitt LD, et al. Prediction models for suicide attempts and deaths: a systematic review and simulation. JAMA Psychiatry. June 1 2019;76(6):642–651.
6. Esposti MD, Kaufman EJ. Can suicide risk be predicted to plan for prevention? Lancet Public Health. Mar 2023;8(3):e162–e163.
7. Simon GE, Matarazzo BB, Walsh CG, et al. Reconciling statistical and clinicians’ predictions of suicide risk. Psychiatr Serv. May 1 2021;72(5):555–562.
8. Simonetti JA, Piegari R, Maynard C, et al. Characteristics and Injury Mechanisms of Veteran Primary Care Suicide Decedents with and without Diagnosed Mental Illness. J Gen Intern Med. 2020.
9. Stone DM, Simon TR, Fowler KA, et al. Vital Signs: Trends in State Suicide Rates - United States, 1999-2016 and Circumstances Contributing to Suicide - 27 States, 2015. Morb Mortal Wkly Rep. Jun 8 2018;67(22):617–624.
10. U.S. Centers for Disease Control and Prevention. Risk and Protective Factors for Suicide. Available at: https://www.cdc.gov/suicide/factors/ index.html. Accessed Nov 15 2023.
11. Miller M, Swanson SA, Azrael D. Are we missing something Pertinent? A bias analysis of unmeasured confounding in the firearm-suicide literature. Epidemiol Rev. 2016;38(1):62–69.
12. Ahmedani BK, Simon GE, Stewart C, et al. Health care contacts in the year before suicide death. J Gen Intern Med. 2014;29(6):870–877.
13. Department of Veterans Affairs. (2018, May 23). Eliminating Veteran Suicide: Suicide Risk Screening and Evaluation Requirements. [Memorandum]. Washington, DC: Veterans Health Administration.
14. Bahraini N, Brenner LA, Barry C, et al. Assessment of rates of suicide risk screening and prevalence of positive screening results among US veterans after implementation of the Veterans Affairs Suicide Risk Identification Strategy. JAMA Netw Open. 2020;3(10):e2022531. Pub 2020 Oct 1.
15. Bahraini N, Reis DJ, Matarazzo BB, Hostetter T, Wade C, Brenner LA. Mental health follow-up and treatment engagement following suicide risk screening in the Veterans Health Administration. PLoS One. 2022;17(3):e0265474. Published 2022 Mar 17.
16. U.S. Department of Veterans Affairs, Office of Mental Health and Suicide Prevention. 2023 National Veteran Suicide Prevention Annual Report. 2023. Retrieved Dec 2 2024 from https://www.mentalhealth. va.gov/docs/data-sheets/2023/2023-National-Veteran-SuicidePrevention-Annual-Report-FINAL-508.pdf.
17. Cleveland EC, Azrael D, Simonetti JA, et al. Firearm ownership among American veterans: findings from the 2015 National Firearm Survey. Inj Epidemiol. 2017;4(1):33. Published 2017 Dec 19.
18. Posner K, Brown GK, Stanley B, et al. The Columbia-Suicide Severity Rating Scale: initial validity and internal consistency findings from three multisite studies with adolescents and adults. Am J Psychiatry Dec 2011;168(12):1266–77.
19. Stanley B, Brown GK, Brenner LA, et al. Comparison of the safety planning intervention with follow-up vs ssual care of suicidal patients treated in the emergency department. JAMA Psychiatry 2018;75(9):894-900.
20. VHA Memorandum 2022 Aug 31, Update to Safety Planning in the Emergency Department (ED): Suicide Safety Planning and Follow-up Interventions (VIEWS 8256358), Aug 31 2022.
21. Parker K, Menasce Horowitz J, Igielnik R, Baxter Oliphant J, Brown A. America’s complex relationship with guns. Pew Research Center. June 22 2017. Available at: https://www.pewresearch.org/socialtrends/2017/06/22/guns-and-daily-life-identity-experiences-activitiesand-involvement/. Accessed April 29, 2026.
22. Swanson SA, Studdert DM, Zhang Y, et al. Handgun divestment and risk of suicide. Epidemiology. 2023;34(1):99-106.
23. Khazanov GK, Wilson M, Cidav T, et al. Access to Firearms and
Opioids Among Veterans at Risk for Suicide. JAMA Netw Open. 2025 Jan 2;8(1):e2456906.
24. Richards JE, Kuo E, Stewart C, et al. Self-reported access to firearms among patients receiving care for mental health and substance use. JAMA Health Forum. 2021;2(8):e211973.
25. Simonetti JA, Azrael D, Miller M. Misconceptions About Whether Seeking Mental Health Care Jeopardizes Lawful Firearm Ownership: A National Survey. Ann Intern Med. 2026 Mar;179(3):462-464.
26. Bell KA, O’Loughlin CM, Piccirillo ML, et al. Negative beliefs about suicide disclosure: implications for US veterans. J Nerv Ment Dis 2023;211(11):866-869.
27. Khazanov GK, Keddem S, Hoskins K, et al. Stakeholder perceptions of lethal means safety counseling: a qualitative systematic review. Front Psychiatry. 2022;13:993415.
28. Polzer ER, Holliday R, Rohs CM, et al. Women veterans’ perspectives, experiences, and preferences for firearm lethal means counseling discussions. PLoS One. 2023;18(12):e0295042.
Firearm-related experiences and perceptions among United States male veterans: a qualitative interview study. PLoS One. 2020;15(3):e0230135.
30. Dineen JN, Doucette M, Carey M, et al. Conversation starters: understanding the facilitators and barriers to physician-initiated secure firearm storage conversations. Patient Educ Couns. 2024;119:108062.
31. Roszko PJ, Ameli J, Carter PM, et al. Clinician attitudes, screening practices, and interventions to reduce firearm-related injury. Epidemiol Rev. 2016;38(1):87-110.
32. Holliday R, Liu S, Brenner LA, et al. Preventing suicide among homeless ceterans: a consensus statement by the Veterans Affairs Suicide Prevention Among Veterans Experiencing Homelessness Workgroup. Med Care. 2021;59(Suppl 2):S103-S105.
33. Carlson EB, Garvert DW, Macia KS, Ruzek JI, Burling TA. Traumatic stressor exposure and post-traumatic symptoms in homeless veterans. Mil Med. 2013;178(9):970-973.
34. Simonetti JA, Azrael D, Rowhani-Rahbar A, Miller M. Firearm storage practices among American veterans. Am J Prev Med 2018;55(4):445-454.
Child Opportunity Index Levels and Disparities in Access to Pediatric-ready Emergency Departments
Mary E. Bernardin, MD*
Paul Schuler, BS†
Emily Morales, PhD†
Elizabeth Kendrick, BA†
Danielle Zoellner, MPH†
Timothy Staed, MD*
Section Editor: Kathleen Stephanos, MD
University of Missouri School of Medicine, Department of Emergency Medicine, Division of Pediatric Emergency Medicine
University of Missouri School of Medicine, Department of Emergency Medicine, Division of Research
Submission history: Submitted September 10, 2025; Revision received January 16, 2026; Accepted January 26, 2026
Electronically published May 19, 2026
Full text available through open access at http://escholarship.org/uc/uciem_westjem DOI 10.5811/westjem.53096
Introduction: Increased pediatric readiness has been shown to decrease pediatric mortality, although disparities in access to pediatric-ready emergency departments (ED) have not been studied. The Child Opportunity Index (COI) is a comprehensive measure of the quality of neighborhood resources impacting child health and development. Our objective was to determine whether low-resourced areas with low COI levels are associated with farther travel distances to the nearest pediatric-ready ED.
Methods: In this retrospective, cross-sectional study we evaluated the 2021 National Pediatric Readiness Project (NPRP) assessments of 91 EDs throughout the state of Missouri in relationship to COI 3.0 U.S. census tract data. The EDs were classified into quartiles based on weighted pediatric readiness scores (wPRS). Our primary outcome measure was travel distances to the nearest ED, which were obtained by measuring the shortest distance from the geographic center of each U.S. census tract to the closest ED. We used the Kruskal-Wallis H test to assess distances from the geographic center of each census tract to the nearest EDs. P values were adjusted for multiple comparisons using Dunn-Bonferroni post hoc tests.
Results: Of the 113 EDs in Missouri that were invited to take the 2021 NPRP assessment, 91 (81%) participated and 22 (19%) were nonrespondent. Child Opportunity Index data were available for all 1,393 Missouri U.S. census tracts. When compared to low-resourced, low COI census tracts, wellresourced, very high COI census tracts were found to have significantly shorter travel distances to the nearest ED (6 vs 2.9 miles, [95% CI, 3.03-3.6; P < .001]). Families living in low COI census tracts travel 4.6 times farther (18 additional miles) to reach an ED in the highest wPRS quartile compared to families living in very high COI census tracts (23.3 vs 5.1 miles, [95% CI, 5.6-6.5; P < .001]).
Families living in low COI census tracts travel 4.4 times farther (48 additional miles) to reach the nearest of the top three most pediatric-ready EDs [62.6 vs 14.4 miles, [95% CI, 14.6-19.1; P < .001].
Conclusion: Families from resource-limited communities with low Child Opportunity Index levels must travel significantly farther to access pediatric-ready EDs compared to families from wellresourced communities. Dissemination of pediatric-readiness improvement efforts, especially to under-resourced areas, may help address disparities in healthcare access and promote health equity. [West J Emerg Med. 2026;27(3)794–803.]
INTRODUCTION
Increased pediatric readiness in emergency departments (ED) has been shown to significantly decrease the incidence
of pediatric mortality and enhance quality of care with shorter hospital length of stay and fewer interfacility transfers.1-5Iowa, Massachusetts, Nebraska, and New York, focusing on patients
Child Opportunity Index Levels and Disparities in Access to Pediatric-ready
aged 0 to 18 years with critical illness, defined as requiring intensive care admission or experiencing death during the encounter. We used ED and inpatient administrative data from the Agency for Healthcare Research and Quality’s Healthcare Cost and Utilization Project linked to hospital-specific data from the 2013 National Pediatric Readiness Project. The relationship between hospital-specific pediatric readiness and encounter mortality in the entire cohort and in conditionspecific subgroups was evaluated by using multivariable logistic regression and fractional polynomials. RESULTS: We studied 20 483 critically ill children presenting to 426 hospitals. The median weighted pediatric readiness score was 74.8 (interquartile range: 59.3-88.0; range: 29.6-100 Pediatric readiness efforts can include improvement in a range of areas impacting pediatric care, such as administration and care coordination, clinician competencies, equipment and supplies, quality improvement programs, policies, procedures and protocols.6 Although extensive efforts have been made to increase pediatric readiness through the National Pediatric Readiness Project (NPRP), many children lack access to pediatric-ready facilities.7-9 While most children have access to an ED within 30 minutes, only roughly one in three children can access an optimally pediatric-ready ED in the same timeframe.7 Proximity has been found to be the most important reason for ED selection in the case of a pediatric emergency, and children are most often transported to the nearest facility, even when alternative pediatric-ready EDs are also accessible.8
While access to pediatric-ready facilities varies geographically, so too does the overall health and wellness of the communities in which children are born and raised. The Child Opportunity Index (COI) comprehensively measures the quality of neighborhood resources and conditions impacting child wellbeing by assessing 44 community indicators across three domains: education; socioeconomic; and health and environmental.10 Children from less resourced, low COI communities have been found to experience a multiplicity of poor health outcomes when compared to children from high COI communities, including increased ED use,11 hospitalizations,12 need for critical care,12 and mortality.12,13 While the COI health and environment domain includes two indicators of healthcare resources (ie, percentage of individuals with health insurance coverage and density of nonprofit organizations providing health-related services), these do not include a measure of access to quality pediatric healthcare or pediatric-ready emergency care.10
Health disparities relating to pediatric readiness have been poorly studied. One study found that while children treated in the most pediatric-ready facilities had a significantly lower incidence of mortality, the greatest survival advantage relating to pediatric readiness was experienced by Black children.14 Given this, it was postulated that increasing pediatric readiness could be a means of promoting health equity.14,15 For
Population Health Research Capsule
What do we already know about this issue?
Higher pediatric ED readiness reduces child mortality, but disparities in access to pediatricready EDs are poorly understood.
What was the research question?
Are low Child Opportunity Index neighborhoods farther from pediatric-ready emergency departments?
What was the major finding of the study?
Families from low COI tracts travel farther to reach the most pediatric-ready EDs (23 vs 5 miles; p<0.001).
How does this improve population health?
Identifying gaps in access to pediatric-ready EDs allows for targeted pediatric readiness expansion and promotion of health equity for all children.
example, the adoption of pediatric-specific trauma protocols and transfer policies may reduce disparities by standardizing pediatric care and reducing the effects of potential biases.14,15 However, this potential health promotion would only benefit those with access to pediatric-ready facilities.
To evaluate access to pediatric-ready facilities from a health equity lens, we sought to assess travel distances to pediatric-ready EDs across the state of Missouri based on U.S. census tract COI levels. Access to pediatric-ready hospitals is known to have regional variation,7-9 although to our knowledge, it has not been studied relative to other social factors outside race/ethnicity.14 We hypothesized that socioeconomic and environmental factors may play a role in dictating a child’s access to pediatric-ready healthcare.
METHODS
Data Collection and Definitions
In this retrospective, cross-sectional study, we evaluated travel distances from U.S. census tracts across Missouri to surrounding EDs of varying pediatric readiness. Pediatric readiness was determined by the results of the 2021 National Pediatric Readiness Project (NPRP) assessment for eligible Missouri EDs. The quality of child opportunity by census tract was assessed using COI 3.0 data. This study follows the Strengthening the Reporting of Observational Studies in Epidemiology reporting guideline16 and was approved by the
University of Missouri Institutional Review Board as exempt from the need for informed consent because it does not include human participants.
We obtained COI 3.0 data from DiversityDataKids.org for each U.S. census tract in the state of Missouri.17 While the exact number of children per census tract varies, we chose census tracts over ZIP codes due to their relatively consistent and homogenous population density.18 Compiled from 20132017 and published in 2024, COI 3.0 is the most recent version, which includes an expanded list of indicators relevant to child wellbeing. These indicators include 44 total factors within three domains (education, health and environment, and socioeconomic) and 14 subdomains.10 Indicators are measured for each U.S. census tract and converted to a z-score. Weighted averages are calculated from indicator z-scores for each of the three domains, and the domain scores are combined to produce the final COI.10 Our analyses of COI were performed by grouping census tracts by COI level. DataDiversityKids.org categorizes census tract data into five COI levels based on aggregated COI ranking against the national average: very low; low; moderate; high and very high. Very low is composed of the least resourced U.S. census tracts with the lowest COI scoring, and very high the most resourced, highest COI-scoring census tracts.10
We obtained census tract geographical shape files from the U.S. Census Bureau for each census tract in Missouri.19 We used the GeoPandas package to determine the centroid of each census tract shape, representing the geographical coordinate average for that census tract.20 Haversine distances, measuring the shortest distance from the centroid or geographic center of each census tract, were used to approximate the shortest travel distance to the nearest EDs.
We obtained a statewide report of Missouri hospitals eligible to participate in the 2021 NPRP Assessment from the Utah Data Coordinating Center.21 Hospitals were considered NPRP eligible and were invited to take the 2021 NPRP assessment if the facility had an ED that accepted patients 24 hours/day, 7 days/week, including general hospitals, children’s hospitals within a general hospital, stand-alone children’s hospitals, critical access hospitals, micro-hospitals, off-site hospitals or satellite EDs, and independently owned freestanding EDs. Participating hospitals received a weighted Pediatric Readiness Score (wPRS)—100 possible points based on self-assessment of staffing, resources, equipment, and transfer agreements.22,23 All NPRP eligible hospitals in the state of Missouri were classified into NPRP nonrespondents (quartile 0) or quartiles 1-4 based on wPRS (quartile 1 having the lowest level of pediatric readiness and quartile 4 the highest).
We obtained the geographical coordinates of each hospital from the Missouri Department of Health and Human Resources Time Critical Diagnosis Statewide System of Care map24 and then merged the coordinates with each NPRP
hospital record. To assess access to emergency medical care, including the quality of pediatric readiness, we measured travel distances from each Missouri U.S. census tract centroid to the closest ED of each wPRS quartile. To assess access to the highest degree of pediatric readiness among Missouri EDs, we assessed travel distances from each census tract centroid to the top three pediatric-ready EDs in Missouri, each of which scored at least 95/100 on the 2021 NPRP Assessment.
Data Analysis
We summarized continuous variables as means with standard deviations, and categorical variables as frequencies and percentages. Distances from U.S. census tract centroids were described in mean miles with standard deviations and median miles with interquartile ranges. We initially planned to use one-way analysis of variance (ANOVA) to test for differences in mean travel distances to EDs across COI groups. However, normality tests of residuals showed significant deviation from normal distribution across all models (Shapiro-Wilk P < .05). Therefore, we replaced ANOVA with the Kruskal-Wallis H test to assess differences in distribution of the nonparametric median distances from census tract centroid to the nearest EDs per COI level and wPRS quartiles. The generated P values were adjusted for multiple comparisons using Dunn-Bonferroni post hoc tests. We created box plots and maps using the Python packages Seaborn and Matplotlib. P values < .05 were considered statistically significant. We performed statistical analyses using Python software, v3.12.5.25
RESULTS
Of the 113 hospitals in Missouri that were eligible to take the 2021 NPRP Assessment, 91 (81%) participated and 22 (19%) were nonrespondent. The average wPRS of participating Missouri hospitals was 66.55 of 100 possible points. The Missouri hospital response rate (80%) was 10% higher than the national average, while the average Missouri wPRS (66.55/100) was 2.95 points below the national average (69.5/100).26 Missouri’s highest scoring, quartile 4 hospitals scored on average 37.9 points higher than hospitals in quartile 1.
The COI data were available for all 1,393 Missouri U.S. census tracts, and all 1,393 tracts were included in analyses. The average COI for all available Missouri census tracts was 40.6 of 100 possible points. The most resourced, very high COI census tracts scored on average 78 points higher overall than those in the very low COI census tracts. Compared to the very low COI census tracts, census tracts in the very high COI group scored on average 70 points higher in the education domain, 64 points higher in the health and environment domain, and 75 points higher in the social and economic domain.17
Census tract COI was found to be significantly associated with travel distances to the nearest ED. Post hoc multigroup
comparisons of travel distances to the nearest EDs are depicted in Table 1 with corresponding box plots in Figure 1. The most resourced, very high COI census tracts were found to have significantly shorter travel distances to the nearest ED when compared to the less resourced, very low, low, and moderate COI census tracts (P < .001). Families living in low COI census tracts travel 2.1 times farther (3.2 additional miles) than families living in the very high COI census tracts (P < .001) to reach the nearest ED.
U.S. census tract COI levels were found to have significant differences in travel distances to the nearest ED when categorized by wPRS quartiles. Post hoc multigroup comparisons of travel distances to the nearest ED by COI level among wPRS quartiles are depicted in Table 2 with corresponding box plots in Figure 2. Families living in wellresourced, very high COI census tracts had significantly shorter travel distances to both nonrespondent EDs (wPRS quartile 0) as well as to EDs at each level of pediatric readiness by wPRS quartile when compared to all of the less resourced, lower COI levels. Families living in low resourced, low COI census tracts travel 4.6 times farther (18 additional miles) to reach an ED in the highest pediatric readiness quartile compared to families living in the most resourced, very high COI census tracts (P < .001).
When assessing travel distances to the closest of the top three wPRS EDs, we found significant differences based on COI level. Post hoc multigroup comparisons of travel distances to the nearest of the top three pediatric ready EDs are depicted in Table 3 with corresponding box plots in Figure 3. Figure 4 visually depicts travel distances across Missouri to the nearest of the top three wPRS EDs by COI level. Families living in well resourced, very high COI U.S. census tracts had significantly shorter travel distances to the nearest of the top three wPRS EDs when compared to less resourced, very low, low, and moderate COI census tracts (P < .001). Families
living in low COI census tracts travel 4.4 times farther (48 additional miles) to reach the nearest of the top three pediatricready EDs in Missouri compared to families living in very high COI census tracts (P < .001).
Figure 3 visually depicts shorter travel distances to the nearest of the top three wPRS EDs for families living in well resourced, very high COI census tracts when compared to less resourced, very low, low, and moderate COI census tracts.
DISCUSSION
Momentous nationwide emphasis has been placed on
1. Box plot depicting travel distances to the nearest emergency department in relation to Child Opportunity Index level. Each box plot displays the median travel distance (the line inside the box) to the nearest emergency department by COI level, the interquartile (IQR) range of travel distances (the box), and the range of distances within 1.5 times the IQR (the whiskers), with dots representing outliers. compared to the less resourced, very low, low, and moderate COI census tracts. COI, Child Opportunity Index.
1. Travel distances to nearest emergency department in study assessing the relationship between distances traveled and Child Opportunity Index level.
SD, standard deviation.
Table
Figure
Table 2. Travel distances to nearest emergency department by Child Opportunity Index level among weighted Pediatric Readiness Score quartiles.
Figure 2. Travel distances in miles to the nearest emergency department by Child Opportunity Index level and weighted Pediatric Readiness Score quartiles. Each box plot displays the median travel distance (the line inside the box) to the nearest emergency department by Child Opportunity Index level and wPRS hospital ranking, the interquartile range (IQR) of travel distances (the box), and the range of distances within 1.5 times the IQR (the whiskers), with dots representing outliers. ED, emergency department.
advancing pediatric readiness through the NPRP, as increased pediatric readiness has been shown to significantly decrease the incidence of child mortality.1-5 Thus far, the majority of research involving pediatric readiness has understandably focused on associated health outcomes.1-4,27 Aside from
evaluation of race/ethnicity, this is the first study to our knowledge that evaluates access to pediatric-ready healthcare in terms of social disparities affecting childhood opportunity. Using the COI, a comprehensive index measuring multiple factors impacting child health and wellbeing, we assessed travel distances to both the nearest ED and to a gradient of the closest pediatric-ready facilities. Our study revealed that when compared to children from highly resourced, high COI communities, children from less resourced, low COI communities have poorer access to any ED and significantly poorer access to pediatric-ready facilities. Our findings highlight the need for pediatric-readiness improvement efforts for all EDs to address health disparities and promote equitable healthcare access for all children.
Previous studies have demonstrated geographic varition in pediatric readiness.7-9 Ray et al found that access to pediatric ready facilities varied across U.S. census divisions, with Missouri in the West North Central group having the poorest access to EDs ≥ the 75th percentile of pediatric readiness scores.7 While this established that access to pediatric ready facilities varies on a large, regional level, our findings suggest that access also varies at the U.S. census tract level and is associated with the existence of community resources. Other studies have found the largest deficit in access to pediatric ready EDs exists in rural regions.8,9 In our study, low COI census tracts were associated with poorer access to pediatric-ready EDs in both rural and urban settings, suggesting that lack of pediatric-ready healthcare may be more closely related to socioeconomic disadvantage rather than a function of rurality or urbanicity. Further studies are needed to investigate inequity in healthcare access as it relates to pediatric readiness across varying geographic and socioeconomic landscapes.
While travel distance or time are generally used to
COI, Child Opportunity Index; SD, standard deviation.
measure geographic “accessibility,” those integers do not account for all variables impacting a family’s ability to access pediatric-ready healthcare.7 A family may be unable to traverse even relatively short travel distances if they lack a reliable family vehicle or the financial means to purchase gas. Similarly, a parent’s choice for their child’s healthcare may be limited to whatever facility is most accessible by public transportation. Families with no means of travel may resort to requesting ambulance services, although their child may be transported to the closest ED despite more pediatric-ready
Figure 3. Travel distances in miles to the nearest of the top 3 weighted Pediatric Readiness Score emergency departments in the state of Missouri by Child Opportunity Index level. Each box plot displays the median travel distance (the line inside the box) to the nearest of the top 3 wPRS EDs by COI level, the interquartile range of travel distances (the box), and the range of distances within 1.5 times the interquartile range (the whiskers), with dots representing outliers. COI, Child Opportunity Index; ED, emergency department; wPRS, weighted Pediatric Readiness Score.
facilities being accessible via emergency medical services (EMS).7,8 Studies show that social factors including unknown insurance status, low income, and communication barriers have been associated with higher likelihood of a child being transported by EMS to a general ED instead of a children’s ED.28 Healthcare accessibility is a complex, multifaceted issue, and increasing access to pediatric-ready EDs requires a multifaceted approach. Increasing the level of EMS responders’ education about local pediatric-ready facilities and the utility of transport to such facilities, including protocols
Figure 4. Travel distances in miles to the nearest of the top three weighted Pediatric Readiness Score emergency departments in Missouri by Child Opportunity Index (COI) level.
A. Travel distances for very low COI census tracts. B. Travel distances for low COI census tracts. C. Travel distances for moderate COI census tracts. D. Travel distances for high COI census tracts. E. Travel distances for very high COI census tracts. F) Composite map showing low (light gray), moderate (dark gray), and very high (black) COI census tracts.
Table 3. Travel distances to the nearest top three weighted Pediatric Readiness Score emergency departments in the state of Missouri by Child Opportunity Index level.
for bypassing closer, less pediatric-ready general EDs, is one implementable approach.7
Our study revealed that children from under-resourced, low COI communities not only have significantly farther travel distances to pediatric-ready facilities compared to high COI communities, but they also have farther travel distances to the nearest ED, regardless of pediatric readiness. While some may infer that the necessary first step in addressing this issue is the distribution of new healthcare facilities into disadvantaged areas, research has shown that this is an unlikely solution. New trauma centers, for example, are most frequently established in highly populated, high median income locations.29 Thus, in the absence of new healthcare institutions, it becomes crucially important that the existing facilities, including those with historically low pediatric patient volumes, enhance their pediatric readiness.9 While low pediatric volume EDs tend to have lower wPRS,5 research has shown that participating in state-led, pediatric-readiness verification programs has been associated with significant increases in wPRS and subsequently decreased incidence of pediatric mortality.30,31 For this reason, it has been proposed that disseminating state-led pediatric readiness verification programs is of utmost importance in under-resourced areas with the greatest disparities in access to pediatric-ready EDs.7
Using public health policy is another effective means of promoting pediatric readiness. For instance, Illinois exemplifies government commitment to pediatric readiness by requiring that hospitals providing prehospital medical oversight participate in their state-wide pediatric facility recognition program. As a result, 60% of EDs in Illinois have been recognized by the Illinois Department of Public Health as pediatric ready, and those recognized as pediatric ready have exhibited a decrease in the incidence of pediatric injury mortality from 12.2 to 9/1,000 patients.32 The findings of our study and similar studies critically analyzing healthcare access can be used to inform public health policy and promote investment in pediatric readiness, particularly by expanding pediatric facility recognition efforts in areas experiencing the greatest inequity.7
Previous work has found increasing pediatric readiness to be associated with increased incidence of child survival, particularly among Black children.14 This finding led to the hypothesis that increased pediatric readiness, likely via increased standardization of care with pediatric treatment protocols, may be a means of addressing health inequity.14,33 However, it is also known that health-promoting activities can broaden existing health disparities because participation in these activities is often greatest among communities that already experience economic and health advantages.34 Because the highly resourced, high COI communities in our study were found to have significantly greater access to pediatric-ready EDs, our findings could be interpreted as evidence that NPRP efforts are already predominantly
benefitting privileged groups and, hence, are promoting rather than alleviating health disparities.
An actionable solution to confront this inequity is targeted dissemination of pediatric-readiness improvement efforts to under-resourced areas that have not yet engaged in a pediatricreadiness improvement process. Public policy allocating resources that support state-led pediatric readiness programs throughout under-resourced areas is an essential investment in the health of historically disinvested communities.7 As research shows that actions improving the health of children promote the health of the future adult population,35 targeted investment in pediatric-ready healthcare among disinvested communities may serve as means of promoting health equity for future generations.
LIMITATIONS
This study must be interpreted considering multiple potential limitations. Our assessment of access to pediatricready EDs was only carried out in the state of Missouri, and our results may not be applicable to other states and countries outside the United States. We did not assess travel distances to EDs outside the state of Missouri; therefore, lack of data incorporating travel across state lines could have impacted our findings. To measure travel distances to the nearest EDs, we calculated and used the centroid of each U.S. census tract, representing the geographical average coordinate. This estimate does not represent true travel distances for each household, nor does it take into account traffic, construction, or other environmental or social barriers to travel, which could impact the study’s findings.
We did not incorporate U.S. Census Bureau data regarding the exact number of children living in each census tract, although we chose census tracts over ZIP codes because of their homogenous population density.18 We calculated the wPRS based on a hospital’s self-assessment, which allowed for the potential of bias or inaccurate representation of EDs among wPRS quartiles. Additionally, 1 of the 44 indicators comprised in the COI 3.0 is a measure of the density of nonprofit organizations providing health-related services. Because of this, there is the potential that our findings could have been skewed by increased access to general health services as the COI level increases. However, density of nonprofit organizations providing health services in a community does not equate to pediatric-ready emergency care, and the quality of healthcare accessible to children is not currently represented in the COI.
Finally, our assertion that increasing pediatric readiness in under-resourced areas may improve health outcomes (eg, lower incidence of mortality) is complex and assumes that pediatric readiness is the primary driver of such outcomes. However, the relationship between low ED pediatric readiness and higher child mortality may be confounded by the general health of children accessing these EDs, if EDs with low
Bernardin
Child Opportunity Index Levels and Disparities in Access to Pediatric-ready EDs
pediatric readiness are most accessible to children of low COI level communities who may be independently at higher risk for poorer outcomes. Nonetheless, advanced pediatric readiness has been shown to decrease the incidence of child mortality,1 making efforts to improve pediatric readiness an actionable process that could improve outcomes and combat health disparities among high-risk, under-resourced communities.
CONCLUSION
In this state-wide study in Missouri, children from underresourced communities with low Childhood Opportunity Index levels were found to have significantly farther travel distances to the nearest ED as well as to surrounding pediatric-ready facilities. These findings highlight the crucial importance of increasing pediatric-readiness efforts for all EDs, especially those serving under-resourced areas. This and future research on disparities in healthcare access may inform public health policy and targeted investment in healthcare programs dedicated to improving pediatric readiness and promoting health equity.
Address for Correspondence: Mary E. Bernardin MD, Division of Pediatric Emergency Medicine, Department of Emergency Medicine, University of Missouri School of Medicine, 1 Hospital Drive, Columbia MO, 65212. Email: mebkrb@missouri.edu.
Conflicts of Interest: By the WestJEM article submission agreement, all authors are required to disclose all affiliations, funding sources and financial or management relationships that could be perceived as potential sources of bias. No author has professional or financial relationships with any companies that are relevant to this study. There are no conflicts of interest or sources of funding to declare.
1. Ames SG, Davis BS, Marin JR, et al. Emergency department pediatric readiness and mortality in critically ill children. Pediatrics. 2019;144(3).
2. Newgard CD, Lin A, Olson LM, et al. Evaluation of emergency department pediatric readiness and outcomes among US trauma centers. JAMA Pediatr. 2021;175(9):947-56.
3. Newgard CD, Lin A, Goldhaber-Fiebert JD, et al. Association of emergency department pediatric readiness with mortality to 1 year among injured children treated at trauma centers. JAMA Surg. 2022;157(4):1-10.
4. Balmaks R, Whitfill TM, Ziemele B, et al. Pediatric readiness in the emergency department and its association with patient outcomes in critical care: a prospective cohort study. Pediatr Crit Care Med. 2020;21(5):E213-20.
5. Harper JA, Coyle AC, Tam C, et al. Readiness of emergency departments for pediatric patients and pediatric mortality: a systematic review. CMAJ Open. 2023;11(5):E956-68.
6. Remick K, Gausche-Hill M, Joseph MM, et al. Pediatric readiness in the emergency department. Pediatrics. 2018;142(5).
7. Ray KN, Olson LM, Edgerton EA, et al. Access to high pediatricreadiness emergency care in the United States. J Pediatr. 2018;194:225-32.e1.
8. Newgard CD, Malveau S, Mann NC, et al. A geospatial evaluation of 9-1-1 ambulance transports for children and emergency department pediatric readiness. Prehosp Emerg Care. 2023;27(2):252-62.
9. Melhado C, Hancock C, Wang H, et al. Pediatric readiness and trauma center access for children. JAMA Pediatr. 2025;94609:1-8.
10. Noelke C, McArdle N, Baek M, et al. Child Opportunity Index 3.0 technical documentation. 2024. Available at: https://diversitydatakids. org/research-library/coi-30-technical-documentation. Accessed November 27, 2024.
11. Kaiser SV, Hall M, Bettenhausen JL, et al. Neighborhood child opportunity and emergency department utilization. Pediatrics. 2022;150(4).
12. Heneghan JA, Goodman DM, Ramgopal S. Hospitalizations at United States children’s hospitals and severity of illness by neighborhood Child Opportunity Index. J Pediatr. 2023;254:83-90.e8.
13. Attridge MM, Heneghan JA, Akande M, et al. Association of pediatric mortality with the Child Opportunity Index among children presenting to the emergency department. Acad Pediatr. 2023;23(5):980-7.
14. Jenkins PC, Lin A, Ames SG, et al. Emergency department pediatric readiness and disparities in mortality based on race and ethnicity. JAMA Netw Open. 2023;6(9):e2332160.
15. Desai S, Remick KE. Overcoming vulnerabilities in our emergency care system through pediatric readiness. Pediatr Clin North Am. 2024;71(3):371-81.
16. von Elm E, Altman DG, Egger M, et al. The Strengthening the Reporting of Observational Studies in Epidemiology (STROBE) statement: guidelines for reporting observational studies. Ann Intern Med. 2007;147(8):573-7.
17. Diversitydatakids.org. Child Opportunity Index. 2024. Available at: https://www.diversitydatakids.org/about-us?_ ga=2.253920840.1505187919.16897015992118193522.1682954485. Accessed July 18, 2023.
18. United States Census Bureau. United States Census Bureau glossary. 2024. Available at: https://www.census.gov/glossary/. Accessed March 10, 2025.
19. United States Census Bureau. United States Census Bureau data. 2024. Available at: https://data.census.gov/. Accessed November 27, 2024.
20. Jordahl K. GeoPandas: Python tools for geographical data. 2014.
21. University of Utah School of Medicine. Utah Data Coordinating Center. Available at: https://uofuhealth.utah.edu/utah-dcc. Accessed November 15, 2024.
22. Gausche-Hill M, Ely M, Schmuhl P, et al. A national assessment of
Bernardin et al.
Bernardin et al.
Child Opportunity Index Levels and Disparities in Access to Pediatric-ready EDs
pediatric readiness of emergency departments. JAMA Pediatr. 2015;169(6):527-34.
23. Remick KE, Hewes HA, Ely M, et al. National assessment of pediatric readiness of US emergency departments during the COVID-19 pandemic. JAMA Netw Open. 2023;3(6):e2321707.
24. Missouri Department of Health and Senior Services. Missouri Time Critical Diagnosis (TCD) statewide system of care. Available at: https://experience.arcgis.com/experience/ e35fe21316474f349ac056b15f90bbef/. Accessed January 15, 2025.
25. Python Software Foundation. Python language reference. Version 3.12.5. 2024. Available at: https://www.python.org.
26. Utah Data Coordinating Center. 2021 national pediatric readiness assessment response rates. 2021. Available at: https://tableau. utahdcc.org/t/nedarc/views/2021NationalPediatricReadinessAssessm entResponseRates_16879960170820/2021PedsReadyResponseRat es?%3Adisplay_count=n&%3Aembed=y&%3AisGuestRedirectFrom Vizportal=y&%3Aorigin=viz_share_link&%3AshowAppBanner=false& %3As. Accessed January 20, 2025.
27. Lieng MK, Marcin JP, Sigal IS, et al. Association between emergency department pediatric readiness and transfer of noninjured children in small rural hospitals. J Rural Health. 2022;38(1):293-302.
28. Schmucker KA, Camp EA, Jones JL, et al. Factors associated with destination of pediatric EMS transports. Am J Emerg Med. 2021;50:360-4.
29. Amato S, Benson JS, Stewart B, et al. Current patterns of trauma center proliferation have not led to proportionate improvements in access to care or mortality after injury: an ecologic study. J Trauma Acute Care Surg. 2023;94(6):755-64.
30. Remick K, Kaji AH, Olson L, et al. Pediatric readiness and facility verification. Ann Emerg Med. 2016;67(3):320-8.e1.
31. Rice A, Dudek J, Gross T, et al. The impact of a pediatric emergency department facility verification system on pediatric mortality rates in Arizona. J Emerg Med. 2017;52(6):894-901.
32. Dolan P, Nozicka C, O’Brien CR. Pediatric facility recognition program and the Illinois EMSC experience. Pediatr Ann. 2021;50(4):e165-71.
33. Gutman CK, Hall JE, Lion KC. Emergency department pediatric readiness and the search for solutions that promote child health equity. JAMA Netw Open. 2023;6(9):e2332168.
34. Davidson A. Social Determinants of Health: A Comparative Approach. 2nd ed. Oxford, England: Oxford University Press; 2019.
35. National Academies of Sciences, Engineering, and Medicine. (2019). Vibrant and Healthy Kids: Aligning Science, Practice, and Policy to Advance Health Equity. Washington, DC: National Academies Press.
Early Recognition and Referral of Acute Stroke in Primary and Emergency Care: A Systematic Review
Thamer Majed Almunif
Abdulaziz Fahd Alkaabba, MD (IMSIU)
Khaled Waleed Alomran
Abdullah Mfwadh Alanazi
Faris Nashmi Alharbi
Safar Saad Alshahrani
Naif Mansour Alsaeed
Rayan Ahmed Alabdulkader
Sultan Adel Alibraheem
Khaled Saeed Alzahrani
Mohammed Hamad Albagieh
Section Editor: Rick Lucarelli, MD
College of Medicine, Imam Muhammad Ibn Saud Islamic University, Department of Family Medicine, Riyadh, Saudi Arabia
Submission history: Submitted September 2, 2025; Revision received December 22, 2025; Accepted December 20, 2025
Electronically published January 24, 2026
Full text available through open access at http://escholarship.org/uc/uciem_westjem DOI 10.5811/westjem.50827
Introduction: Early recognition and referral are critical to minimizing morbidity and mortality in acute stroke, but evaluation and referral processes differ worldwide. In this systematic review we examined the accuracy of recognition tools, referral patterns, outcomes, and factors affecting efficiency in primary and emergency care settings.
Methods: Following PRISMA 2020 guidelines, we searched PubMed, Scopus, Web of Science, and Cochrane Library for studies published January 2003–December 2025. Eligible studies included randomized controlled trials, cohort, case-control, cross-sectional, and large case series (> 30 patients) involving adults with acute ischemic or hemorrhagic stroke. Risk of bias was assessed using Cochrane Risk-of-Bias 2 (RoB) and RoB in non-standardized studies-I. We extracted data on diagnostic accuracy, referral pathways, outcomes, and systemic factors.
Results: We identified 206 papers, of which 33 studies met our inclusion criteria. Recognition tools such as Face, Arms, Speech, Time (FAST); Recognition of Stroke in the Emergency Room, the Cincinnati Prehospital Stroke Scale, and National Institutes of Health Stroke Scale showed good pooled sensitivity (79-95%) but variable specificity (52-84%). Newer technologies, including the PreHospital Ambulance Stroke Test, FAST-ED, and artificial intelligence (AI)-based models, showed promise but need validation. Referral strategies such as emergency medical services prenotification, dispatcher triage, and mobile stroke units reduced prehospital delays. Seven studies reported onsetto-door times 12-22 minutes faster and 7-12% increase in reperfusion eligibility. Increased referral efficiency was associated with a reduction in mortality of approximately 8-12% and improvements in functional independence of 10-15%, with persistent disparities reported in resource-limited settings.
Conclusion: Early recognition and referral improve outcomes in patients with acute stroke. Structured tools and system-level interventions reduce mortality, while AI and mobile stroke units show promise. Strengthening referral systems and adopting cost-effective triage strategies may support equitable implementation, particularly in low-resource settings, as addressing systemic and geographic barriers is critical for equitable stroke care. [West J Emerg Med. 2026;27(3)804–818.]
INTRODUCTION
Stroke remains one of the leading causes of death and long-term disability globally, creating major healthcare and socioeconomic burdens. One in four adults may experience a stroke, with most cases occurring in low- and middle-income countries, although high-income countries also face challenges from aging populations and risk factors such as hypertension, diabetes, and obesity.1 Despite prevention and treatment advances, outcomes depend heavily on time from symptom onset to treatment. During untreated cerebral ischemia, millions of neurons are lost every minute.2 Survivors often face long-term disabilities that reduce quality of life and place heavy demands on families and healthcare systems, making early recognition and management a public health priority.
Acute stroke treatment is highly time sensitive. Reperfusion therapies such as intravenous thrombolysis and endovascular thrombectomy are most effective when delivered quickly, ideally within 4.5 hours for thrombolysis and up to 24 hours for thrombectomy.3 Any delays in recognition or referral can exclude patients and increase mortality.4 International guidelines emphasize rapid triage, standardized tools, and optimized referral pathways.5 However, delays in early stages of care remain a barrier.
Primary and emergency care professionals are often first to encounter patients. Their ability to recognize and respond promptly determines hospital arrival and eligibility for reperfusion.6 Tools such as the Face Arm Speech Time (FAST) test, Recognition of Stroke in the Emergency Room (ROSIER) scale, Cincinnati Prehospital Stroke Scale (CPSS), and National Institutes of Health Stroke Scale (NIHSS) improve detection but vary in accuracy. The FAST test shows sensitivity of 94-95% but specificity of 55-60%,9 reflecting a trade-off between early detection and false-positive activation due to stroke mimics such as seizures or hypoglycemia. While the ROSIER and CPSS scales can identify most strokes, they similarly risk false positives.⁷ Advanced neuroimaging remains the diagnostic gold standard, although decisions often occur before imaging in resource-limited settings.
System-level barriers persist. Access to imaging and stroke-ready hospitals is inequitable, especially in rural areas.8 Organizational obstacles include unreliable emergency medical services (EMS) triage and inconsistent prenotification, while clinician barriers involve variable training.9 Patientlevel challenges include misdiagnosis, reported in 10-25% of cases,10 as well as delays from long transport, limited strokeunit capacity, and urban–rural disparities.11
Referral patterns significantly affect outcomes. Use of EMS prenotification and priority dispatch reduces prehospital delays and increases eligibility for reperfusion; EMS prenotification and dispatcher-supported triage have been associated with reductions in onset-to-door times of approximately 12-22 minutes and increases in reperfusion eligibility of 7-12%.12 Conversely, missed recognition increases door-to-needle times. Recognition by EMS has
Population Health Research Capsule
What do we already know about this issue?
Delayed recognition and referral of acute stroke reduces eligibility for reperfusion therapy and worsens mortality and functional outcomes.
What was the research question?
How accurate are stroke recognition tools, and how do referral pathways affect outcomes in primary and emergency care?
What was the major finding of the study?
Across 33 studies, early recognition and referral reduced delays by 12-22 minutes and mortality by 8-12%.
How does this improve population health?
Improving early stroke recognition and referral systems can reduce preventable deaths and disability, especially in resource-limited settings.
been linked with shorter delays and higher reperfusion rates.13 Emerging technologies also hold promise. Artificial intelligence-based tools using video, audio, or magnetic resonance imaging (MRI) analysis report sensitivities > 79% and specificities > 84%.14 Machine- learning applied to hemodynamic signals and biomarkers may further aid triage.15 While early in development, such tools could complement existing recognition systems.
Although many studies address diagnostic tools or hospital care, few reviews examine referral pathways across both primary and emergency care settings. Existing reviews often focus narrowly on single tools or detection methods without linking recognition, referral, and outcomes. Furthermore, previous reviews have not integrated diagnostic accuracy with real-world referral patterns and patient outcomes across diverse healthcare systems, restricting implementation of evidence-based strategies. Our objective in this study was to systematically evaluate diagnostic accuracy, referral patterns, and outcomes associated with early recognition and management of acute stroke in primary and emergency care between 2003–2025.
METHODS
Study Design
This systematic review followed the 2020 Preferred Reporting Items for Systematic Reviews and Meta-Analyses
(PRISMA) guidelines16 and synthesized evidence on early recognition and management of acute stroke in primary and emergency care. Owing to heterogeneity in study designs, populations, and outcomes, we summarized findings narratively rather than through meta-analysis. Heterogeneity was assessed using qualitative comparison across study designs, populations, and outcome definitions; statistical measures such as I² were not feasible due to inconsistent reporting of accuracy metrics. We monitored inter-rater agreement during screening and resolved discrepancies by consensus.
Eligibility Criteria
We included studies published between January 2003–December 2025 involving adults with acute ischemic or hemorrhagic stroke in primary or emergency care settings. Eligible designs were randomized controlled trials, cohort, case-control, cross-sectional, and case series (≥ 30 participants). To be included, studies had to report diagnostic accuracy, referral patterns, or patient outcomes. We excluded systematic reviews, meta-analyses, editorials, letters, case reports (< 30 patients), animal studies, papers that were not published in English, and those without relevant outcome data.
Information Sources and Search Strategy
We performed searches in PubMed, Embase, Scopus, Web of Science, and Cochrane Library, supplemented by World Health Organization (WHO) and major stroke organization reports. The PubMed strategy combined MeSH and free-text terms for stroke, recognition tools, primary/emergency care, referral, and outcomes, limited to 2003–2025. This strategy was adapted for the other databases. Full search strategies for each database are available in the Appendix.
Study Selection and Data Extraction
Two reviewers independently screened titles, abstracts, and full texts, resolving disagreements by consensus or a third reviewer. The process is detailed in the PRISMA flow diagram (Figure). Data were extracted using a standardized form, including study details (author, year, country, setting), design, population (sample size, age, sex, stroke type), recognition tools (FAST, ROSIER, NIHSS, CPSS, imaging), referral patterns (time, facility, protocols), and outcomes (mortality, disability, quality of life, time to treatment). Barriers and facilitators at systemic, organizational, or clinician levels were also captured.
Risk of Bias Assessment
We assessed the 33 included studies with the Cochrane Risk of Bias (RoB) 2 tool for randomized trials17 and RoB in non-randomized studies-I for observational designs.18 Assessments were conducted independently by two reviewers, with disagreements resolved by consensus or arbitration. These evaluations informed the interpretation of findings.
Figure. PRISMA 2020 flow diagram illustrates the process of identifying, screening, and assessing studies for eligibility in a systematic review of stroke recognition and referral pathways.
Data Synthesis
Narrative synthesis summarized diagnostic accuracy, referral patterns, and outcomes. Meta-analysis of sensitivity and specificity was considered but deemed inappropriate due to substantial heterogeneity in study populations, tools, and reporting. Differences in reference standards (computed tomography [CT] vs MRI), outcome definitions, cutoff thresholds, and inconsistent reporting of specificity values further prevented quantitative pooling. Studies reporting both sensitivity and specificity of recognition tools were synthesized descriptively, with full values available in Table 1.
RESULTS
This review synthesized evidence from 33 studies (2003–2025) on diagnostic accuracy, referral patterns, and outcomes of early recognition and management of acute stroke in primary and emergency care. Results are presented as study selection, study characteristics, RoB, diagnostic accuracy, referral patterns, patient outcomes, and barriers/facilitators.
Study Selection
The initial search yielded 541 records; 206 remained after duplicates. Screening excluded 135 (65.5%), leaving 71 for full-text review. We excluded 38 studies (one irrelevant, 35 ineligible, two wrong population). Thirty-three studies were finally included. (See PRISMA diagram, Figure.)
Characteristics of Included Studies
The 33 studies were published between 2003–2025 across
Table 1. Reported sensitivity and specificity of recognition tools across included studies in a systematic review of stroke recognition and referral pathways.
Tool / Model
FAST
FAST
FAST-ED
PreHAST
ROSIER
LAPSS
CPSS
Med PACS
OPSS
Harbison (2003)
Saberian (2021)
Nasr-Esfahani (2021)
Karimi (2020)
Saberian (2021)
Saberian (2021)
Saberian (2021)
Saberian (2021)
Saberian (2021)
MASS Saberian (2021)
AI (DeepStroke) Cai (2022)
AI (PPG ML model) Goda (2025) Multicenter
AI (ChatGPT-4V) Kuzan (2025) Türkiye
AI (Hemodynamic ML) García-Terriza (2023)
(≥2 cutoff)
(≥1)
Prospective cohort; CTconfirmed
MRI as gold standard
(≥2 cutoff) MRI gold standard; alternative cutoffs reported
This table summarizes study-level diagnostic accuracy metrics (sensitivity and specificity) for stroke recognition tools evaluated between 2003 and 2025. Data are presented as reported in the original studies. Due to heterogeneity in populations, settings, and tool application, formal pooling was not feasible, and results were synthesized narratively. FAST, Face Arm Speech Time; ED, emergency department; PreHAST, Prehospital Acute Stroke Severity Tool; LAPSS, Los Angeles Prehospital Stroke Screen; ROSIER, Recognition of Stroke in the Emergency Room; CPSS, Cincinnati Prehospital Stroke Scale; Med PACS, Melbourne Prehospital Assessment for Code Stroke; OPSS, Ontario Pre-hospital Stroke Scale; MASS, Melbourne Ambulance Stroke Scale; AI, artificial intelligence; DARE-PACE, Rapid Assay Diagnostic for Acute Stroke Recognition; CT, computed tomography, MRI, magnetic resonance imaging.
Europe, North America, Asia, and the Middle East, with designs including randomized trials, cohort, case-control, and cross-sectional studies. Sample sizes ranged from <100 to > 4,000 patients. Populations were mostly middle-aged to elderly, with a slight male predominance (52–60% male across most studies). Ischemic stroke was most frequently studied, although hemorrhagic stroke and transient ischemic attacks were also represented. Recognition strategies included FAST, ROSIER, CPSS, NIHSS, and other prehospital tools. Computed tomography and MRI were used in nearly all studies for confirmation or outcome assessment. Outcomes reported covered diagnostic accuracy, referral times, treatment eligibility, mortality, disability, and functional independence. Some studies also assessed system-level factors such as EMS training and prehospital notification. Key details are summarized in Table 2 and Table 3.
Risk of Bias Assessment
Seven studies were randomized controlled trials (RCT); the rest were observational. The RCTs generally
showed low risk of bias in randomization and outcome measurement, although allocation concealment and blinding were occasional concerns. Observational studies often had moderate risk due to confounding, selection bias, and incomplete reporting. No study was excluded, but results from moderate/serious risk studies were interpreted cautiously (see Table 4 and Table 5).
Diagnostic Accuracy of Recognition Tools
We evaluated recognition strategies in all studies, although quantitative accuracy data were inconsistent. The FAST, ROSIER, CPSS, and NIHSS scales were most frequently assessed. Sensitivities ranged 79-95%, with specificities 52-84%. The FAST and CPSS tests were reliable for EMS use, while ROSIER performed well in large diagnostic studies. The NIHSS, used mainly in emergency departments, improved detection of large vessel occlusions but was less practical for prehospital use. Novel methods such as PreHAST, FAST-ED, and AI-based tools reported sensitivities of 66-79% with variable specificities. Machine-learning
Table 2. Summary of characteristics of 33 studies included in a systematic review of stroke recognition and referral pathways.
Category
Number of studies
33 studies (2003–2025)
Regions represented Europe, North America, Middle East, Asia
Slight male predominance across most studies (52-60%)
Stroke types Ischemic stroke most common; several included hemorrhagic stroke and TIA
Recognition tools
FAST (Face Arm Speech Time), ROSIER (Recognition of Stroke in the Emergency Room), NIHSS (National Institutes of Health Stroke Scale), PreHAST (Prehospital Acute Stroke Severity Tool), DeepStroke, and EMS protocols
Mean 74 years not reported OPM: AIS 121/165 (73.6%); ICH 25/165 (15.1%); TIA 12/165 (7.5%); MSU: AIS 107/210 (50.8%); ICH 27/210 (12.7%); TIA 57/210 (27%)
Mean 67.1 years 462/804 (57.5%) male AIS: 562/804 (69.8%) confirmed by MRI
Karliński 2022 Retrospective observational ~71 years 354/690 (51.3%) male
Karliński 2015 Prospective observational 73 years 192/732 (26.2%) male
Kuzan 2024 Retrospective diagnostic accuracy >18 years n not reported
Li 2024 Open-label multicenter RCT
Mean 70 years ~281/455 (61.7%) male
Onset to recognition Referral outcome
≤4.5h More rapid CT and IVT in modified tool group
Median 3h ↑ IVT eligibility in early recognition
≤8h or wake-up stroke Secondary transfers: OPM 68/165 (41.2%) vs MSU 0/210 (0%)
Mean 74.7 years not reported PASTA: 409/499 (82%) AIS; SC: 607/714 (85% AIS)
90/186 AIS (48.4%) ≤120 min
Early referrals: IVT 74/77 (96%) vs 31/103 (30%)
EMS-recognized: shorter CT time (34.6 vs 84.7 min)
Paramedic assessment ≤4h IVT: 197/499 (39.4%) PASTA vs 319/714 (44.7%) SC
Characteristics of included studies assessing stroke recognition, referral outcomes, and diagnostic accuracy. Data are summarized by first author, publication year, study design, participant demographics, stroke type, onset-to-recognition time, and referral outcomes. ICH, intracerebral hemorrhage; AIS, abbreviated injury scale; TIA, transient ischemic attack; PSC, Primary Stroke Center; IVT, intravenous therapy; EVT, Endovascular Thrombectomy; CT, computed tomography; MRI, magnetic resonance imaging; ER, emergency room; ED, emergency department.
Table 3. Continued.
First Author
Saberian 2021
Saver 2015
Sundström 2017
Multicenter diagnostic accuracy
Multicenter, randomized phase 3 trial
Retrospective multicenter
Terriza 2023 Machine learning–based diagnostic
Van Den Berg 2022 Ambulancebased RCT
Mean 66.9 years 463/926 (57.5%) male
Mean 69 years not reported
Mean ~78 years 159/352 (45%) male
Onset to recognition Referral outcome
AIS confirmed: 562/804 (69.8%) ED arrival
Ischemic 278/380 (73.3%); ICH 87/380 (22.8%); Mimics 15/380 (3.9%)
ICH 68/352 (19%); Cerebral infarction 221/352 (63%); Other 63/352 (18%)
Median 45 min; 282/380 (74.3%) treated ≤1h
Median system delay (EMS call → CT)
Not reported n not reported ML differentiated ischemic vs hemorrhagic Not reported
Mean ~72 years GTN arm: 58% male; Control: 47% male
Yiang 2022 Retrospective registry Not reported n not reported
Ischemic 148/236 (63%); ICH 39/236 (16%); TIA 27/236 (11%); Mimic 22/236 (9%)
AIS: 98/147 (67%); Minor strokes 49/147 (33%)
Sensitivity/ Specificity per PreHAST cut-off
Rapid IVT; ~24% ICH/mimic
Priority 1: faster CT and IVT use
Improved early triage
Median 53–71 min All transferred; some later excluded
Door-to-CT 13.4 ± 1.8 min; Doorto-CTA 75.5 ± 44.5 min
Avoided 98/147 (66.6%) unnecessary CTA
Characteristics of included studies assessing stroke recognition, referral outcomes, and diagnostic accuracy. Data are summarized by first author, publication year, study design, participant demographics, stroke type, onset-to-recognition time, and referral outcomes. ICH, intracerebral hemorrhage; AIS, abbreviated injury scale; TIA, transient ischemic attack; PSC, Primary Stroke Center; IVT, intravenous therapy; EVT, Endovascular Thrombectomy; CT, computed tomography; MRI, magnetic resonance imaging; ER, emergency room; ED, emergency department.
Table 4. Risk-of-bias assessment of the 33 included studies in a systematic review of stroke recognition and referral pathways.
First author Year
Study design
Study size
Risk-of-bias judgment
van den Berg 2022 RCT 236 Some concerns
Wireklint 2017 Cohort 352 Moderate
De Luca 2009 Cluster RCT 4,895 Low
Cai 2022 Diagnostic 221 Moderate
Gude 2023 Cohort 3,546 Low
Berg 2023 Cohort 290 Moderate
Saberian 2021 Diagnostic 926 Low
models using hemodynamic biomarkers (eg, blood pressure variability, pulse waveform features) and serum biomarkers (eg, D-dimer, S100 calcium-binding protein B, and glial fibrillary acidic protein) showed early promise but lacked large-scale validation. Findings are summarized in Table 6.
Referral Patterns
Timely referral was central across studies. Structured dispatcher systems like the Danish Index and the Rapid Emergency Triage and Treatment System (RETTS) improved referral efficiency, reducing prehospital delays and undertriage.19 Across studies, dispatcher-based systems reduced onset-to-door times by approximately 12-22 minutes. mobile stroke units, notably the Stroke-Einsatz-mobile stroke unit (STEMO) system, reduced time to imaging and improved eligibility for reperfusion.20 Reported reductions ranged from 8-17 minutes to CT, with corresponding increases in reperfusion eligibility of 7-12%.
Training and protocol interventions produced mixed results. The Paramedic Acute Stroke Treatment Assessment (PASTA) trial found no significant delay reduction with enhanced paramedic training,21 while the prehospital acute stroke severity toll (PreHAST) integration improved recognition of large vessel occlusion and expedited referral.22 The PreHAST-based EMS triage improved detection of large vessel occlusion by 9-15% and shortened referral intervals by
Table 5. Risk of bias assessment of the 33 studies included in a systematic review of stroke recognition and referral pathways.
Sundström 2017 Observational retrospective multicenter study Moderate
Terriza 2023 Machine learning-based diagnostic and predictive modeling study Unclear
Van Den Berg 2022 Randomised controlled trial (Phase 3, multicenter, ambulance-based, open-label, blinded endpoint) Unclear
Yiang 2022 Retrospective registry-based diagnostic accuracy study Unclear
EMS, emergency medical services; MIND-TIA, Multicenter Imaging Study for Transient Ischemic Attack.
5-12 minutes. Persistent barriers included delays in secondary transfers, rural access challenges, and variability in dispatcher accuracy. Referral outcomes are summarized in Table 7.
Subgroup Analyses
By setting, nine primary care studies reported moderate
sensitivity (70-90%) but frequent referral delays beyond the thrombolysis window. Twenty-four emergency care studies, especially those using dispatcher protocols and mobile stroke units, showed shorter delays and higher treatment eligibility. Dispatcher-supported emergency care studies reported referral acceleration of 12-20 minutes.
Almunif et al. Early Recognition and Referral in Acute Stroke
Table 6. Diagnostic accuracy of recognition tools for acute stroke in primary and emergency care settings, as reported in a systematic review of stroke recognition and referral pathways.
First author Year
Recognition tool(s)
Diagnostic accuracy metrics reported?
Behrndtz 2023 PASS No
Berglund 2021 Symptom-based EMS triage No
Blauenfeldt 2023 PreSS No
Cai 2022 AI-based DeepStroke Yes
De Luca 2009 CPSS (EMS), NIHSS (ED) No
Denti 2017 Public education campaign No
Ebinger 2014 Mobile stroke unit (STEMO) No
Goda 2025 PPG ML Model; Hunter-8 Yes
Gude 2023 Danish Index Dispatcher No
Harbison 2003 FAST Yes
Karimi 2020 PreHAST Yes
Karliński 2022 EMS physician/paramedic judgment No
Sundström 2017 Dispatcher Medical Index, RETTS, RLS-85 No
Yiang 2022 DARE-PACE + NIHSS thresholds Yes
Tools range from prehospital screening methods to advanced technologies (AI-based DeepStroke, ML hemodynamic signals, ChatGPT4V MRI interpretation), highlighting variability in diagnostic validation across emergency care contexts.
By region, 14 European studies had structured prehospital systems, including dispatcher tools and mobile stroke units, reducing delays. Five studies from the Middle East and seven from Asia cited limited imaging and variable EMS training, while seven North American studies (more often tested AIassisted tools with improved specificity). Regional differences reflected system capacity, with Middle East/Asia studies reporting less imaging availability and EMS training variability. By recognition tool, traditional scales (FAST, CPSS, ROSIER) showed high sensitivity (80-95%) but low specificity (50-65%), leading to false positives. Models based in AI demonstrated higher specificity (> 75%) but lacked validation. The NIHSS provided detailed assessments but was less practical for prehospital use (Table 8).
Patient Outcomes
Improved recognition and referral consistently correlated with better outcomes. The EMS prenotification, dispatcher triage, and mobile stroke units shortened door-to-needle
times and increased reperfusion rates, leading to higher independence. For example, STEMO patients had higher thrombolysis rates and more often achieved modified Rankin scale ≤ 2 at 90 days.23 Across studies, mobile stroke unitsupported pathways reduced door-to-needle times by 8-17 minutes and increased reperfusion eligibility by 7-12%. Use of the Danish Index similarly reduced mortality.24 Studies reported mortality reductions of approximately 8-12% when dispatcher-supported recognition systems were used.
Scales like PreHAST, FAST-ED, and PASS identified large vessel occlusions effectively. PreHAST improved referral and outcomes, while PASS showed modest benefit due to paramedic variability.12 The PreHAST-based triage improved detection of large vessel occlusion by 9-15% and modestly reduced referral delays by 5-12 minutes. Despite these gains, disparities persisted in rural and resource-poor settings, where delayed transport and limited stroke unit access were linked with worse outcomes. The PASTA trial showed no functional outcome benefit despite
Table 7. Referral patterns and prehospital interventions in a systematic review of stroke recognition and referral pathways.
Moderate improvement in LVO triage CT, computed tomography; EMS, Emergency Medical Services; LVO, large vessel occlusion; PASS, Prehospital Acute Stroke Severity Scale; RETTS, Rapid Emergency Triage and Treatment System; STEMO, Stroke-Einsatz-mobile stroke unit.
protocol training,24 underscoring the gap between structured interventions and patient benefit.
Overall, early recognition and efficient referral improved mortality and morbidity, although benefits were lower in rural/ underserved regions, where delayed transport and imaging shortages were associated with poorer functional outcomes.
Barriers and Facilitators
Barriers operated at system, organizational, and patient levels. System-level barriers included rural location, limited stroke centers, absence of mobile stroke units, and transfer delays. Organizational factors such as dispatcher accuracy and inconsistent EMS triage also hindered care. Clinicianlevel barriers included differences in training and protocol adherence.22 At the patient level, delays were linked to poor symptom awareness, atypical presentations, or reluctance to seek care. Public education improved awareness but had limited impact on treatment timelines. Studies noted that public education campaigns increased stroke symptom recognition by 10-18% but did not translate into equivalent reductions in onset-to-door times.
Facilitators included EMS training, structured protocols, and emerging technologies. Artificial intelligence tools offered decision support, particularly in resource-limited areas. Mobile stroke units enabled rapid imaging and treatment initiation but were costly to scale.
DISCUSSION
This systematic review synthesized 33 studies (2003–2025) examining early recognition and management of acute stroke in primary and emergency care. The findings highlight the role of structured recognition tools, efficient referral systems, and system-level support in improving patient outcomes.
Summary of Key Findings
Widely used tools such as FAST, ROSIER, CPSS, and NIHSS consistently showed high sensitivity but variable specificity.19,22,23 Reported sensitivities exceeded 80%,
supporting their use as first-line screening methods. Promising approaches included AI-based models and newer triage tools such as FAST-ED and PreHAST, although validation remains limited. Among traditional scales, FAST and CPSS were the most consistently reliable for EMS settings, while PreHAST showed the strongest potential for triage focused on large vessel occlusion.
Referral systems strongly influenced outcomes. Structured dispatcher frameworks, including the Danish Index19,24 and RETTS, improved prioritization and timely access to reperfusion therapy. Mobile atroke units, such as STEMO, provided immediate imaging and treatment initiation, significantly improving functional outcomes.20 However, training interventions alone, such as the PASTA trial, showed limited impact without broader system-level changes.
Improved referral efficiency consistently reduced mortality and increased functional independence (modified Rankin scale ≤ 2). Yet rural and resource-limited settings faced persistent delays, limited access to stroke centers, and poorer outcomes. Barriers persist despite advances. Heterogeneity in study design and reporting prevented quantitative metaanalysis, requiring narrative synthesis. Geographic disparities remain significant, with rural and low-resource settings facing delays in imaging, workforce shortages, and limited EMS infrastructure. Such inequities are most pronounced in lowand middle-income countries.
Interpretation of Findings
These results reinforce global priorities emphasizing timesensitive stroke care. Recognition tools are effective screening measures, but variable specificity highlights the need for confirmatory imaging and careful balance between over-triage and missed diagnoses. Heterogeneity in reporting precluded pooled meta-analysis, necessitating narrative synthesis.
Referral strategies clearly improve timeliness and treatment eligibility. Mobile stroke units represent a valuable but resource-intensive model suited to urban, high-income settings.20 The AI-based diagnostics are attractive where trained personnel are scarce, although rigorous validation
Table 8. Subgroup analysis of diagnostic accuracy and referral patterns in acute stroke recognition from 33 studies included in a systematic review of stroke recognition and referral pathways.
Subgroup No. of Studies
Primary Care 9 FAST, PreHAST
Delays > 4.5 hours common Emergency Care 24 NIHSS, AI tools
Higher reperfusion eligibility Europe 14 FAST, Dispatcher Index
Faster referral with dispatcher protocols Asia/Middle East 12
Limited imaging and EMS capacity
North America 7 AI-based DeepStroke, ChatGPT-4V 75-85% 70-80% Early AI adoption; promising specificity
AI, artificial intelligence; EMS, emergency medical services; FAST, Face Arm Speech Time; NIHSS, National Institutes of Health Stroke Scale; PreHAST, Prehospital Acute Stroke Severity Tool; ROSIER, Recognition of Stroke in the Emergency Room.
is still required. Persistent system and patient-level barriers indicate that recognition tools and referral systems alone are insufficient. Public awareness campaigns improved symptom recognition but had little effect on treatment delays. Alignment with established global frameworks such as WHO’s Global Stroke Roadmap and American Stroke Association (ASA) guidance could help standardize early recognition and prehospital referral strategies across diverse health systems. Global frameworks, including the WHO Global Action Plan for Noncommunicable Diseases (2013–2030) and the WHO Global Stroke Action Plan (2016–2030), highlight opportunities to adapt local strategies. Practical approaches such as community-based triage, dispatcher-assisted algorithms, and mobile health apps could expand early recognition and referral options at lower cost. Alignment with ASA and WHO early stroke management recommendations may further support harmonized referral pathways across diverse systems.
Strengths and Limitations
Strengths of this review include a comprehensive synthesis across regions and two decades, use of validated risk-of-bias tools, and inclusion of both traditional and innovative diagnostic approaches. Limitations include inconsistent reporting of accuracy metrics, heterogeneity in design and context, and reliance on narrative rather than quantitative synthesis. Most studies originated from highincome countries, limiting generalizability to low- and middleincome settings.
Implications for Practice and Research
The evidence supports embedding structured recognition tools, EMS prenotification, and dispatcher triage into routine prehospital and emergency systems.19 Traditional scales such as FAST demonstrated high sensitivity but modest specificity, while AI-based approaches showed variable but promising accuracy (Table 8). Future research should validate AI diagnostics and evaluate the scalability of mobile
stroke units20 in diverse contexts. Future research should prioritize multicenter validation trials of both traditional and AI-based recognition tools, with emphasis on scalability, costeffectiveness, and applicability in diverse contexts. Evaluating mobile health applications and mobile stroke units across different socioeconomic settings will be vital. In parallel, implementation studies focusing on equity, feasibility, and integration into national stroke pathways are needed to guide real-world adoption. Developing a flexible set of service models as part of national and regional protocols could reduce inequalities in access to reperfusion therapy and support more equitable global stroke care. Integrating referral protocols with national and international frameworks (eg, WHO, ASA) may help reduce variability in practice and ensure standardized care pathways.
In low- and middle-income, mobile stroke units and advanced imaging are often unrealistic. Pragmatic strategies include structured EMS and community health worker training, simplified screening tools (FAST, PreHAST), telemedicine consultation with neurologists, and referral networks leveraging mobile technology. These incremental measures could improve timeliness and outcomes despite limited infrastructure.
This review underscores that early recognition and efficient referral improve survival and functional outcomes after stroke. Structured tools, dispatcher systems, and mobile stroke units are effective in high-resource settings, while AI and telemedicine represent emerging solutions for broader contexts. However, persistent system inequities continue to constrain universal benefit, highlighting the need for scalable, resource-appropriate strategies in global stroke care. Equitable implementation strategies tailored to local capacity remain essential for improving outcomes across all regions.
CONCLUSION
This systematic review of 33 studies published between 2003–2025 demonstrates that early recognition and efficient referral are consistently associated with improved outcomes
Early Recognition and Referral in Acute Stroke
in acute stroke care. Structured recognition tools, including FAST, ROSIER, CPSS, and NIHSS, showed high sensitivity but modest specificity, reflecting a trade-off between timely detection and false-positive risk. System-level referral interventions such as EMS prenotification, dispatchersupported triage, and mobile stroke units reduced treatment delays and increased eligibility for reperfusion therapies. Emerging AI-assisted recognition approaches showed promising diagnostic performance but remain heterogeneous and require further validation.
ACKNOWLEDGMENT
The authors would like to express their sincerest appreciation to Research Assistant Company (RA) for providing technical and administrative support during various stages of this research.
Address for Correspondence: Thamer Majed Almunif, College of Medicine, Imam Muhammad Ibn Saud Islamic University (IMSIU), Al Thoumamah Road, Riyadh, 11564, Saudi Arabia. Email: dr.thamer.almaneef@outlook.com.
Conflicts of Interest: By the WestJEM article submission agreement, all authors are required to disclose all affiliations, funding sources and financial or management relationships that could be perceived as potential sources of bias. No author has professional or financial relationships with any companies that are relevant to this study. There are no conflicts of interest or sources of funding to declare.
1. Adeoye O, Nyström KV, Yavagal DR, Luciano J, Nogueira RG, Zorowitz RD, et al. Recommendations for the establishment of stroke systems of care: a 2019 update: a policy statement from the American Stroke Association. Stroke. 2019;50(7):e187-210.
2. Hasan TF, Hasan H, Kelley RE. Overview of acute ischemic stroke evaluation and management. Biomedicines. 2021;9(10):1486.
3. Powers WJ, Rabinstein AA, Ackerson T, et al. Guidelines for the early management of patients with acute ischemic stroke: 2019 update to the 2018 guidelines for the early management of acute ischemic stroke: a guideline for healthcare professionals from the American Heart Association/American Stroke Association. Stroke. 2019;50(12):e344–418.
4. Herpich F, Rincon F. Management of acute ischemic stroke. Crit Care Med. 2020;48(11):1654–63.
5. Green TL, McNair ND, Hinkle JL, et al. Care of the patient with acute ischemic stroke (posthyperacute and prehospital discharge): update to 2009 comprehensive nursing care scientific statement: a scientific statement from the American Heart Association. Stroke. 2021;52(5):e179-97.
Almunif et al.
6. Oostema JA, Chassee T, Baer W, et al. Brief educational intervention improves emergency medical services stroke recognition. Stroke. 2019;50(5):1193–200.
7. Saberian P, Karimi S, Hasani-Sharamin P, et al. Accuracy of prehospital stroke screening scales in emergency medical services: a multicenter diagnostic study. Eurasian J Emerg Med 2021;20(2):113–119.
8. Jones SP, Bray JE, Gibson JM, et al. Characteristics of patients who had a stroke not initially identified during emergency prehospital assessment: a systematic review. Emerg Med J. 2021;38(5):387–93.
9. Cano-Nigenda V, Castellanos-Pedroza E, Manrique-Otero D, Méndez B, Menéndez-Manjarrez MF, Toledo-Treviño R, et al. Barriers to optimal acute management of stroke: perspective of a stroke center in Mexico City. Front Neurol. 2021;12:690946.
10. Middleton S, Dale S, Cheung NW, et al. Nurse-initiated acute stroke care in emergency departments: the triage, treatment, and transfer implementation cluster randomized controlled trial. Stroke. 2019;50(6):1346–55.
11. Berg KP, Sørensen VF, Blomberg SN, Christensen HC, Kruuse C. Recognition of visual symptoms in stroke: a challenge to patients, bystanders, and Emergency Medical Services. BMC Emergency Medicine. 2023 Aug 25;23(1):96.
12. Gude MF, Valentin JB, Christensen HC, et al. Associations between emergency call stroke triage and pre-hospital delay, primary hospital admission, and acute reperfusion treatment among early comers with acute ischemic stroke. Intern Emerg Med. 2023;18(8):2355–65.
13. Berglund A, et al. Higher prehospital priority level leads to shorter time to stroke unit admission and reperfusion treatment. Sweden & Denmark EMS Registry. 2021. Available at: https://www.ahajournals. org/doi/full/10.1161/strokeaha.112.652644. Accessed October 29, 2025.
14. Phongphuttha W, Tiamkao S. Outcome of stroke fast-track patients’ arrival by emergency medical services. J Med Assoc Thai 2021;104(8):1234–1241.
15. Kuzan BN, Meşe İ, Yaşar S, et al. A retrospective evaluation of the potential of ChatGPT in the accurate diagnosis of acute stroke. Diagn Interv Radiol. 2025;31(3):187–195.
16. Goda MÁ, Kovács G, Schmidl D, et al. Machine learning–based triage of large vessel occlusion stroke using photoplethysmography biomarkers. Front Neurol. 2025;16:1298456.
17. Page MJ, McKenzie JE, Bossuyt PM, et al. The PRISMA 2020 statement: an updated guideline for reporting systematic reviews. BMJ. 2021;372:n71.
18. Sterne JAC, Savović J, Page MJ, et al. RoB 2: a revised tool for assessing risk of bias in randomised trials. BMJ. 2019;366:l4898.
19. Sterne JA, Hernán MA, Reeves BC, et al. ROBINS-I: a tool for assessing risk of bias in non-randomised studies of interventions. BMJ. 2016;355:i4919.
20. Sundström BW, Poudel A, Herlitz J, et al. The early chain of care and risk of death in acute stroke in relation to the priority given at the dispatch center: a multicenter observational study. Scand J Trauma Resusc Emerg Med. 2017;25:101.
21. Ebinger M, Winter B, Wendt M, et al. Effect of the Stroke Emergency Mobile (STEMO) on thrombolysis in acute stroke: a randomized controlled trial. JAMA. 2014;311(16):1622-31.
22. Price CI, Shaw L, Islam S, et al. Effect of enhanced paramedic acute stroke treatment assessment on patient outcomes: the PASTA cluster-randomised clinical trial. Lancet Neurol. 2020;19(2):115-24.
23. Karimi S, Hasani-Sharamin P, Saberian P, et al. Prehospital Acute Stroke Severity (PreHAST) scale: validation in a multicenter diagnostic study. BMC Neurol. 2020;20(1):367.
24. Behrndtz K, Østergaard K, Johnsen SP, et al. Validation of the Prehospital Acute Stroke Scale (PASS) for identifying large vessel occlusion stroke. Stroke. 2023;54(3):843–851.
INCLUDED STUDIES
1. Behrndtz A, et al. Transport strategy in patients with suspected acute large vessel occlusion stroke: TRIAGE-STROKE, a randomized clinical trial. Stroke. 2023;54(11):2714-2723. doi:10.1161/ STROKEAHA.123.043875. (PubMed)
2. Berg KP, et al. Recognition of visual symptoms in stroke: a challenge to patients, bystanders, and emergency medical services. BMC Emerg Med. 2023;23:96. (PubMed)
3. Berglund A, Svensson L, Sjöstrand C, et al. Higher prehospital priority level of stroke improves thrombolysis frequency and time to stroke unit: the Hyper Acute STroke Alarm (HASTA) study. Stroke 2012;43(10):2666-2670. doi:10.1161/STROKEAHA.112.652644. (PubMed)
4. Blauenfeldt RA, et al. Remote ischemic conditioning for acute stroke: the RESIST randomized clinical trial. JAMA. 2023;330:1236-1246. doi:10.1001/jama.2023.16893. (PubMed)
5. Cai J, et al. DeepStroke: a multimodal adversarial deep learning framework for stroke diagnosis. Med Image Anal. 2022;80:102522. doi:10.1016/j.media.2022.102522. (Eurasian J Emerg Med)
6. Colton K, Richards CT, Pruitt PB, et al. Early stroke recognition and time-based emergency care performance metrics for intracerebral hemorrhage. J Stroke Cerebrovasc Dis. 2020;29(2):104552. doi:10.1016/j.jstrokecerebrovasdis.2019.104552.
7. Pérez de la Ossa N, Abilleira S, Jovin TG, et al. Effect of direct transportation to thrombectomy-capable center vs local stroke center on neurological outcomes in patients with suspected large-vessel occlusion stroke in nonurban areas: the RACECAT randomized clinical trial. JAMA. 2022;327(18):1782–1794. doi:10.1001/ jama.2022.4404.
8. De Luca A, Toni D, Lauria L, et al. An emergency clinical pathway for stroke patients—results of a cluster randomised trial (ISRCTN41456865). BMC Health Serv Res. 2009;9:14. doi:10.1186/1472-6963-9-14. (PubMed)
9. Denti L, Caminiti C, Scoditti U, et al. Impact on prehospital delay of a stroke preparedness campaign: a stepped-wedge cluster randomized controlled trial. Stroke. 2017;48(12):3316–3322. doi:10.1161/ STROKEAHA.117.018135.
10. Dolmans LS, Lebedeva ER, Veluponnar D, et al. Diagnostic accuracy of the explicit diagnostic criteria for transient ischemic attack: a
11. Ebinger M, et al. Effect of the use of ambulance-based thrombolysis on time to thrombolysis in acute ischemic stroke: a randomized clinical trial. JAMA. 2014;311(16):1622-1631. (PubMed)
12. Nasr-Esfahani M, Heydari F, Izadi-Dastgerdi E, et al. Accuracy of Field Assessment Stroke Triage for Emergency Destination for diagnosis of acute ischemic stroke patients. Eurasian J Emerg Med 2021;20(2):113–119. doi:10.4274/eajem.galenos.2021.38278.
13. Goda MÁ, Kovács G, Schmidl D, et al. Machine learning–based triage of large vessel occlusion stroke using photoplethysmography biomarkers. Front Neurol. 2025;16:1298456.
14. Govindarajan P, et al. Race and sex disparities in prehospital recognition of acute stroke. Acad Emerg Med. 2015;22:264-272. (PubMed)
15. Gude MF, et al. Associations between emergency call stroke triage and pre-hospital delay, primary hospital admission and acute reperfusion treatment among early comers with acute ischemic stroke. Intern Emerg Med. 2023;18(8):2355-2365. doi:10.1007/ s11739-023-03349-x. (Springer Link)
16. Guterud M, Bugge HF, Røislien J, et al. Prehospital screening of acute stroke with the National Institutes of Health Stroke Scale (ParaNASPP): a stepped-wedge, cluster-randomised controlled trial. Lancet Neurol. 2023;22(9):800–811. doi:10.1016/S14744422(23)00237-5.
17. Harbison J, et al. Diagnostic accuracy of stroke referrals from primary care, emergency room physicians, and ambulance staff using the Face Arm Speech Test. Stroke. 2003;34:71-76. doi:10.1161/01. STR.0000044170.46643.5E. (PubMed)
18. Helwig SA, et al. Prehospital stroke management optimized by use of clinical scores. JAMA Neurol. 2019;76(9):1132–1140.
19. Karimi S, Heydari F, Mirbaha S, et al. Accuracy of Prehospital Ambulance Stroke Test in terms of diagnosis of patients with acute ischemic stroke: a multicenter study. Curr J Neurol. 2020;19(4):196–199.
20. Karliński M, et al. Reliability of prehospital diagnosis of acute cerebrovascular accident. Neurol Neurochir Pol. 2022;56(1):89–95. doi:10.5603/PJNNS.a2022.0011.
21. Karliński M, Gluszkiewicz M, Członkowska A. The accuracy of prehospital diagnosis of acute cerebrovascular accidents: an observational study. Arch Med Sci. 2015;11(3):530-538. (PubMed)
22. Kuzan BN, Meşe İ, Yaşar S, et al. A retrospective evaluation of the potential of ChatGPT in the accurate diagnosis of acute stroke. Diagn Interv Radiol. 2025;31(3):187–195. doi:10.4274/dir.2024.242892.
23. Li G, Lin Y, Yang J, et al. Intensive ambulance-delivered blood-pressure reduction in hyperacute stroke. N Engl J Med 2024;390(20):1862–1872. doi:10.1056/NEJMoa2314741.
24. Manawadu D, et al. The impact of early specialist management on outcomes of patients with in-hospital stroke. Stroke. 2014;45:??-??. (JAMA Network)
25. Oostema JA, et al. Clinical predictors of accurate prehospital stroke recognition. Stroke. 2015;46:1513-1517. (American Heart Association
Journals)
26. Price CI, et al. Effect of an enhanced paramedic acute stroke treatment assessment on emergency stroke care: a cluster randomized clinical trial (PASTA). JAMA Neurol. 2020;77(8):989-997. doi:10.1001/jamaneurol.2020.1042. (Semantic Scholar)
27. Saberian P, Karimi S, Hasani-Sharamin P, Baratloo A, et al. Accuracy of Field Assessment Stroke Triage for Emergency Destination for diagnosis of acute ischemic stroke patients. Eurasian J Emerg Med 2021;20(2):113–119.
28. Saver JL, et al. Prehospital use of magnesium sulfate as neuroprotection in acute stroke. N Engl J Med. 2015;372(6):528-536. doi:10.1056/NEJMoa1408827. (PubMed)
29. Fakhraldeen M, Segal E, de Champlain F. Effect of the use of ambulance-based thrombolysis on time to thrombolysis in acute ischemic stroke: a randomized clinical trial. CJEM. 2015;17(6):709–712. doi:10.1017/cem.2014.65.
30. Sundström BW, et al. The early chain of care and risk of death in acute stroke in relation to the priority given at the dispatch centre: a multicentre observational study. Eur J Cardiovasc Nurs 2017;16(7):623-631. doi:10.1177/1474515117704617. (PubMed)
31. Terriza M, et al. Predictive and diagnostic models of stroke from hemodynamic signal monitoring. arXiv preprint arXiv:2304.xxxxx. 2023.
32. Van den Berg SA, et al. Prehospital transdermal glyceryl trinitrate in patients with presumed acute stroke (MR ASAP): an ambulancebased, multicentre, randomized, open-label, blinded endpoint, phase 3 trial. Lancet Neurol. 2022;21(11):971-981. doi:10.1016/S14744422(22)00304-7. (PubMed)
33. Yiang GT, Chen YH, Chen PY, et al. Rapid identification of patients eligible for direct emergent computed tomography angiography during acute ischemic stroke: the DARE-PACE assessment. Diagnostics. 2022;12(2):511. doi:10.3390/diagnostics12020511.
Therapeutic Interventions in Organophosphate Poisoning: An Umbrella Review of Systematic Reviews
Vivek Chauhan, MD*
Divyam Goyal, MBBS†
Suman Thakur, MD‡
Sagar Galwankar, MD§
Tamas R. Peredy, MD§
Section Editor: Jeffrey Suchard, MD
Indira Gandhi Medical College Shimla, Department of Medicine, Himachal Pradesh, India
Maharishi Markandeshwar Institute of Medical Sciences and Research, Department of Medicine, Haryana, India
Indira Gandhi Medical College Shimla, Department of Microbiology, Himachal Pradesh, India
Florida State University College of Medicine Emergency Medicine, Sarasota Memorial Hospital, Department of Emergency Medicine, Sarasota, Florida
Submission history: Submitted September 2, 2025; Revision received January 2, 2026; Accepted December 21, 2025
Electronically published May 19, 2026
Full text available through open access at http://escholarship.org/uc/uciem_westjem DOI 10.5811/westjem.50823
Introduction: Organophosphate (OP) poisoning is a significant global health issue, particularly in tropical regions. Despite established treatments such as atropine and oximes, the effectiveness of other interventions remains uncertain. This umbrella review is a critical synthesis of evidence from systematic reviews and meta-analyses on OP self-poisoning.
Methods: Following the Preferred Reporting Items for Systematic reviews and Meta-Analyses guidelines, we conducted a review of systematic reviews and meta-analyses published up to January 2025. Databases searched included PubMed, Epistemonikos, and the Cochrane Library. We performed quality assessment using A Measurement Tool to Assess Systematic Reviews, version 2 (AMSTAR-2), and applied the Grading of Recommendations Assessment, Development and Evaluation (GRADE) approach to evaluate evidence certainty.
Results: Of 416 potential papers identified we assessed 27 for eligibility, of which 19 were included in the review. The papers evaluated 11 different interventions as an adjuvant to atropine. Oximes, although commonly used, showed neither benefit nor harm. The systematic reviews and metaanalyses on gastric lavage, plasma exchange with hemoperfusion, lipid emulsions, magnesium sulfate, penehyclidine, rhubarb, and xuebijing have reported significant reductions in mortality, but the evidence comes from very low-quality studies. Alkalinization was not found to be effective for OP poisoning. Evidence was limited by small sample size, inconsistent protocols, and geographical bias, with many studies originating from China.
Conclusion: After careful scrutiny of evidence pooled by various systematic reviews and meta-analyses, we found that atropine remains the mainstay of treatment for OP self-poisoning. It may be supplemented with oximes, as recommended by the World Health Organization. Gastric lavage has doubtful efficacy and may even be harmful. Additionally, we recommend against the routine use of penehyclidine, rhubarb, xuebijing, hemofiltration, plasma exchange with hemoperfusion, lipid emulsions, magnesium sulfate, and alkalinization in the management of OP self-poisoning. [West J Emerg Med. 2026;27(3)819–830.]
INTRODUCTION
Organophosphate (OP) poisoning is a critical global health issue, particularly in agricultural regions, and it is associated with high morbidity and mortality rates.1 There is no universally accepted “international guideline” due to ongoing clinical controversies and variations in regional practices. Despite the absence of guidelines, the core principles of treatment are widely agreed upon. The first step involves decontamination, which focuses on preventing further exposure to both patients and healthcare workers. All contaminated clothing and bodily
fluids should be carefully removed and disposed of safely, while patients should be thoroughly washed with soap and water.2 In cases where ingestion has occurred, gastric lavage may be considered if the patient presents within 1-2 hours and the airway is protected. Activated charcoal (50 grams [g], without cathartic) may be given orally or via a nasogastric tube to cooperative or intubated patients, particularly when presentation is early or toxicity is severe.2
Following decontamination, immediate stabilization and resuscitation based on the airway, breathing, and circulation is essential. This includes securing the airway, providing oxygen, and initiating ventilatory support when required. Once the patient is stabilized, antidote therapy forms the cornerstone of management. Atropine is administered to counteract muscarinic symptoms; in adults, the initial intravenous (IV) dose is 1-3 mg, while children receive 0.02 mg per kilogram (kg).2 Doses are titrated to achieve a clear chest on auscultation, resolution of bronchorrhea, and a heart rate > 80 beats per minute. If these targets are not reached within 3-5 minutes, the dose is doubled and repeated at the same interval until atropinization is achieved. In severe cases, very large cumulative doses, sometimes reaching hundreds of milligrams, may be required. Maintenance therapy is then provided through a continuous infusion at a rate of 10-20% of the total loading dose per hour.2
Oxime therapy is recommended along with atropine to reactivate acetylcholinesterase. Pralidoxime chloride is administered as an IV loading dose of 30 mg/kg over 20 minutes, followed by a continuous infusion of 8 mg/kg/hour; in adults this is commonly given as a 2 g loading dose followed by 500 mg/hour. Alternatively, obidoxime may be used, with a loading dose of 4 mg/kg (about 250 mg in adults) given over 20 minutes, followed by 750 mg every 24 hours or a continuous infusion at 0.5 mg/kg/hour. Oxime infusions are continued until the patient shows clinical recovery.2
Benzodiazepines are used when agitation or seizures occur, with IV administration preferred. Common regimens include diazepam 5-10 mg (0.05-0.3 mg/kg/dose), lorazepam 2-4 mg (0.05-0.1 mg/kg/dose), or midazolam 5-10 mg (0.15–0.2 mg/kg/ dose).2 In addition, adjunctive measures such as magnesium sulfate have been studied and may improve outcomes, although their role remains supportive. Together, these principles— decontamination, stabilization, antidote therapy, and adjunctive care—form the accepted standard of management for acute OP poisoning across most clinical settings.
The mainstay of therapy for OP poisoning has been atropine and oximes, but in the past decade several systematic reviews have shown that oximes are ineffective, if not harmful.3,4 The treatment protocol for OP poisoning was reviewed in 2006 by Eddleston et al and published in the British Medical Journal Clinical Evidence 5 They categorized the evidence as 1) likely to be beneficial (atropine, benzodiazepines for OP- induced seizures, glycopyrrolate, and washing the poisoned person or removing contaminated clothing); 2)
Population Health Research Capsule
What do we already know about this issue?
Atropine is the mainstay of treatment of organophosphate (OP) poisoning. Oximes have been found neither helpful nor harmful in the latest metanalysis. There are no other proven therapies for OP poisoning.
What was the research question?
To critically review and summarize the available evidence from published systematic reviews and metanalyses for the effect of various treatments on the outcomes of OP selfpoisoning.
What was the major finding of the study?
Atropine remains the mainstay of treatment for OP self-poisoning. It may be supplemented with oximes as recommended by the World Health Organization.
How does this improve population health? We recommend against the routine use of penehyclidine, rhubarb, xuebijing, hemofiltration, plasma exchange with hemoperfusion, lipid emulsions, magnesium sulfate and alkalinization in the management of OP self-poisoning.
unknown effectiveness (activated charcoal, α-2 adrenergic receptor agonists, butyrycholinesterase replacement therapy, extracorporeal clearance, gastric lavage, and magnesium sulfate, milk or other home remedies immediately after ingestion, N-methyl-D-aspartate receptor antagonists, organophosphate hydrolases, oximes and sodium bicarbonate); 3) unlikely to be beneficial (cathartics); 4) likely to be ineffective or harmful (ipecac).5 This review included evidence from published systematic reviews and meta-analysis, randomized control trials (or cohort studies) until 2006. The authors used Grading of Recommendations Assessment, Development and Evaluation (GRADE) evaluation of evidence to give the level of evidence for each of the above interventions.5
In recent years, evidence from the published systematic reviews and meta-analyses have shown the effectiveness of adjuvant therapies such as magnesium sulfate, penehyclidine, xuebijing, crude rhubarb, lipid emulsion, hemofiltration with hemoperfusion and plasma exchange plus hemoperfusion
about which most physicians are unaware.6-13 There were no guidelines on OP poisoning management that reviewed the emerging evidence generated by the systematic reviews and meta-analyses conducted after 2006. Therefore, we conducted this umbrella review using GRADE and A Measurement Tool to Assess Systematic Reviews (AMSTAR) to analyze systematic reviews and meta-analyses and assess the quality of evidence generated by each of the published systematic reviews and meta-analyses on the management of OP poisoning up to the present.14,15 Our review will allow physicians a thorough and updated understanding of current management practices, evidence gaps, and future directions in treating OP poisoning.
METHODS
We performed an umbrella review of the published systematic reviews and meta-analyses following the Preferred Reporting Items for Systematic reviews and Meta-Analyses methods16 using the protocol published in PROSPERO (CRD42025635860).
Objective
Our goal was to critically review and summarize the available evidence from published systematic reviews and meta-analyses for the effect of various treatments on the outcomes of OP self-poisoning.
Eligibility Criteria
Inclusion Criteria
We included systematic reviews and meta-analyses focusing on the management of OP self-poisoning. Studies analysing interventions such as atropine, pralidoxime, and novel therapies were eligible, provided they addressed the acute management of OP poisoning. Systematic reviews and meta-analyses were included irrespective of the year of publication.
Exclusion Criteria
We excluded case reports, observational studies, animal studies, and reviews that focused solely on the toxicology or epidemiology of OPs without addressing treatment. Studies published in languages other than English were also excluded unless translations were available.
Databases Searched
The databases searched included PubMed, Epistemonikos, and the Cochrane Library. The search was carried out on January 7, 2025.
Search Strategy
The keyword ‘Organoph’* was used in the title or abstract to capture variations such as “Organophosphorus,” “OP,” and “OPs.” We applied systematic review filters to
refine the searches.
PubMed Search String
We used the following search terms: ((organophosphate[Medical Subject Headings (MeSH) Terms]) OR (Organoph*)) AND (systematic review) (“organophosphates”[MeSH Terms] OR “organoph*”[All Fields]) AND (“systematic review”[Publication Type] OR “systematic reviews as topic”[MeSH Terms] OR “systematic review”[All Fields])
Epistemonikos Search String
(title:(Organoph*) OR abstract:(Organoph*)) Filter: Systematic review.
Cochrane Search String Organoph* (We searched word variations.)
Data Management Screening Process
Two reviewers (VC and ST) independently reviewed the titles and abstracts of all 488 articles, followed by full-text review of 27 selected articles for relevance based on the inclusion and exclusion criteria. Discrepancies were resolved through discussion with a third reviewer (SG).
Data Extraction
Data extraction of the 19 included studies was conducted independently by two reviewers (VC and TP), using a predesigned form. Extracted data included the following:
• Authors, year of publication, and journal title
• Study design (systematic reviews, meta-analyses)
• Types of interventions reviewed (eg, atropine, pralidoxime, novel therapies)
• Outcomes such as mortality, intermediate syndrome, and intubation/ventilation
• Pooled estimates (eg, relative risk, odds ratio)
• Recommendations and conclusions.
Quality Assessment
The quality of included systematic reviews and metaanalyses was evaluated by two reviewers (ST and DG) independently using AMSTAR 2.14 We used the GRADE approach to assess the quality of evidence for each intervention.15 The GRADE was also applied independently by VC and TP, and they resolved any discrepancy in AMSTAR 2 and GRADE rating through discussion with the third reviewer SG.
Data Synthesis
We performed a narrative synthesis of findings, grouping evidence by intervention and key outcome measures, such as mortality, intermediate syndrome, and intubation/ventilation.
Chauhan
Primary Objective
We sought to generate recommendations and to grade the available evidence from published systematic reviews and meta-analyses for the effect of various treatments on the outcomes of OP self-poisoning.
Secondary Objective
Our secondary goal was to highlight gaps in the current evidence base and identify emerging or future therapeutic strategies in OP poisoning management.
Ethical Considerations
As this was an umbrella review of previously published research, institutional board approval was not required.
RESULTS
Literature Search
Our initial search found 206 results in PubMed, 217 in Epistemonikos, and 11 Cochrane reviews, which we imported into EndNote reference management software. Of these 428 papers, 18 were found to be duplicates, leaving a total of 416 for the screening and eligibility stages (Figure 1). Of the 416 papers screened, we excluded 389 that did not meet the inclusion criteria, leaving us with 27 papers for retrieval. We reviewed these 27 full texts for eligibility, which resulted in the exclusion of three that were only
Figure 1. PRISMA* flow diagram for systematic reviews identified via databases on organophosphate self-poisoning.
*PRISMA, Preferred Reporting Items for Systematic reviews and Meta-Analyses.
abstracts, two papers that did not review treatment of OP poisoning, one that was not available in English, and two that were reviews of previously published systematic reviews. This left a total of 19 papers for the final review. The process of screening and selecting studies is shown in the PRISMA flow diagram (Figure 1).
Characteristics of Included Systematic Reviews
We included 19 systematic reviews and meta-analyses in this umbrella review, which describe 11 treatment options for OP self-poisoning (Table 1).
The oldest of the systematic reviews and meta-analyses was published in 2002 and the most recent in 2023. Many treatments were reported from China only; therefore, some systematic reviews and meta-analyses contained randomized controlled trials from one country alone. These treatments include penehyclidine, hemoperfusion + hemofiltration, lipid emulsion infusion, rhubarb, and xuebijing (which has not been reported outside China in any of the included trials.7-10, 24 No systematic reviews and meta-analyses studied the effectiveness of atropine, as it is the mainstay of treatment of OP poisoning and it would have been unethical to withhold this life-saving drug from the control group g. Most of the therapies looked at the additional benefit beyond that of atropine.
Summary of Pooled Estimates
Sixteen systematic reviews reported relative risk or odds ratio of mortality for 10 different interventions in the management of OP self-poisoning (Figures 2, 3). The figures also show the number of trials included in the systematic reviews and meta-analyses, total number of patients covered and certainty of evidence for each, ascertained using GRADE.
Quality Assessment Using A Measurement Tool to Assess Systematic Reviews
Two reviewers independently rated the included systemic reviews using AMSTAR 2, and any differences were resolved through discussion with a third independent reviewer.14 See Table 2 for the AMSTAR 2 rating given to the included systematic reviews and meta-analyses.
Review Questions and Recommendations for Treatment
Options for OP Poisoning
Review Question 1
What is the effect of oximes on the outcomes of OP poisoning?
Recommendation
Statement 1
Given the low certainty of evidence, it is not possible to definitively recommend or reject the use of oximes in the management of OP self-poisoning. Further well-designed, adequately powered trials are needed to clarify their role
Table 1. Treatment options in a systematic review of organophosphate self-poisoning.
Figure 2. Summary of the pooled relative risk of mortality reported by the systematic reviews and metanalyses on various interventions in organophosphate self-poisoning.
Figure 3. Summary of the pooled odds ratios of mortality reported by the systematic reviews and meta-analyses on various interventions in organophosphate self-poisoning. CoE, certainty of evidence; OR; odds ratio; PAM, pralidoxine.
plasma transfusion in the management of OP self-poisoning (weak recommendation, GRADE: low certainty) (Table 3b) (Evidence Overview: Supplement 1.2).
Review Question 3
What is the effect of plasma exchange combined with hemoperfusion on the outcomes of OP poisoning?
Recommendation Statement 3
We conditionally recommend against the routine use of plasma exchange combined with hemoperfusion in the management of OP self-poisoning (Weak recommendation, GRADE: very low certainty) (Table 3c) Evidence Overview: Supplement 1.3).
Review Question 4
What is the effect of hemoperfusion with hemofiltration on mortality, intermediate syndrome, and intubation/ ventilation in patients with OP poisoning?
Recommendation Statement 4
We conditionally recommend against the routine use of hemoperfusion with hemofiltration in the management of OP self-poisoning (weak recommendation, GRADE: ery low certainty) (Table 3d) (Evidence Overview: Supplement 1.4).
Review Question 5
(Table 3a). (Evidence Overview: Supplement 1.1).
Review Question 2
What is the effect of plasma transfusion on the outcomes of OP poisoning?
Recommendation Statement 2
We conditionally recommend against the routine use of
What is the effect of lipid emulsion on mortality in patients with OP poisoning?
Recommendation Statement 5
We conditionally recommend against the routine use of lipid emulsion in the management of OP self-poisoning (weak recommendation, GRADE: very low certainty) (Table 3e) (Evidence Overview: Supplement 1.5).
Table 2. Results of the quality assessment of included systematic reviews with the AMSTAR 2* tool. REFERENCE
•High: No or one non-critical weakness: the systematic review provides an accurate and comprehensive summary of the results of the available studies that address the question of interest.
•Moderate: More than one non-critical weakness*: the systematic review has more than one weakness but no critical flaws. It may provide an accurate summary of the results of the available studies that were included in the review.
•Low: One critical flaw with or without non-critical weaknesses: the review has a critical flaw and may not provide an accurate and comprehensive summary of the available studies that address the question of interest
•Critically low: More than one critical flaw with or without non-critical weaknesses: the review has more than one critical flaw and should not be relied on to provide an accurate and comprehensive summary of the available studies
AMSTAR, A Measurement Tool to Assess Systematic Reviews; NM, no meta-analysis done; PICO, population intervention comparator outcome; PY, partial yes; ROB, risk of bias.
Review Question 6
What is the effect of magnesium sulfate on the outcomes of OP poisoning?
Recommendation Statement 6
We conditionally recommend against the routine use of magnesium sulfate in the management of OP self-poisoning (Weak recommendation, GRADE: very low certainty) (Table
3f) Evidence Overview: Supplement 1.6).
Review Question 7
What is the effect of gastric lavage on the outcomes of OP poisoning?
Recommendation Statement 7
We conditionally recommend against gastric lavage in the
Table 3a. Certainty of evidence for the use of Pralidoxime for organophosphate poisoning, Kharel 2020.
Outcomes
(269 to 699) (1.01 to
a Three new studies were added to this meta-analysis after the 2011 Cochrane review by Bukley et al. The earlier 3 studies had very low grade, which persists for the more recent 3 studies included in this review.
b The 3 new studies added to this review had risk of other bias due to lack of sample size, power calculation, and stopping rule.
c The 2 new studies, both by Banerjee et al, were open-label studies.
d The point estimates of 3 of 5 studies lie outside the 95% CI of the largest and most well-conducted study in this review
e Cherian 1997 blinding was unclear.
f Only 2 small studies contributing; while Cherian 1997 has a statistically significant result, the confidence interval is wide.
g Only 2 small studies provide this outcome.
h Point estimate of Syed et al lies outside 95% CI of Cherian et al.
i Cherian 1997 was a small study with substantial risk of bias. Low dose of pralidoxine given may lack efficacy
Table 3b. Certainty of evidence for the use of fresh frozen plasma for organophosphate poisoning, Gheshlaghi 2020.
Outcomes
a All were unblinded studies.
b One of the studies was partially randomized.
c All studies had small sample sizes.
d Studies had wide confidence intervals, and their point estimates lie quite away from the pooled estimate on both sides.
e Point estimate of one study lies outside confidence interval of the other study.
f Only 2 studies included in the pooled estimate.
GRADE, Grading of Recommendations Assessment, Development and Evaluation; RCT, randomized controlled trial; RR, relative risk.
management of OP self-poisoning. (Weak recommendation, GRADE: very low certainty) (Evidence Overview: Supplement 1.7)
Review Question 8
What is the effect of alkalinization on the outcomes of OP poisoning?
Recommendation Statement 8
We conditionally recommend against the
of alkalinization in the management of OP self-poisoning (Weak recommendation, GRADE: very low certainty) (Table 3g) Evidence Overview: Supplement 1.8).
Review Question 9
What is the effect of penehyclidine on the outcomes of OP poisoning?
Recommendation Statement 9
We conditionally recommend against the use of
Chauhan
Table 3c. Certainty of evidence for the use of plasma exchange plus hemoperfusion vs. hemoperfusion for organophosphate poisoning, Yao 2023.
Outcomes
a None of the studies reported allocation concealment, blinding of participants, and blinding of outcomes; 3 of 5 studies did not report using random sequence generation. All were classified as unclear for selective reporting and other bias by the author of the systematic review.
b The control group treatments are inconsistent among the studies. Atropine use was mentioned in only 2 of 5 studies for the control and experimental groups.
c One study did not use gastric lavage and diuresis, while 4 others did in both groups.
d 2 of 5 studies used catharsis in both groups.
e 1 of 5 studies used phosphoridine in both the groups.
f The interventions in the control and experimental groups do not match, therefore could not be combined to get pooled estimates. GRADE, Grading of Recommendations Assessment, Development and Evaluation; RCT, randomized controlled trial; RR, relative risk.
Table 3d. Certainty of evidence for the use of hemofiltration with hemoperfusion for organophosphate poisoning, Zhang M 2022.
Outcomes
a None of the 10 studies reported allocation concealment.
b Only 1 of the 10 studies reported blinding to allocation and outcomes.
c 5 of 10 studies did not use random sequence generation.
d There were gross differences in the control groups: in 6 studies the control groups received hemoperfusion + conventional treatment; 1 received hemofiltration + conventional treatment, and 3 received only conventional treatments.
GRADE, Grading of Recommendations Assessment, Development and Evaluation; RR, relative risk;
Table 3e. Certainty of evidence for the use of lipid emulsion for organophosphate poisoning, Yu 2019.
Outcomes
a None of the studies had allocation concealment, blinding of participants, personnel or outcome assessors.
b One of the studies did not mention random sequence generation.
c One of the studies did not report mortality in either of the groups,
d Four studies used lipid emulsion for different durations: 3, 5, 6, and 7 days, respectively GRADE, Grading of Recommendations Assessment, Development and Evaluation; OR,
Chauhan et al. Therapeutic Interventions in Organophosphate Poisoning
Table 3f. Certainty of evidence for the use of magnesium sulfate for organophosphate poisoning, Byrar 2018. Outcomes
a Authors combined case series before-and-after studies with RCTs in the meta-analysis.
b Most of the included studies had small numbers, and no power or sample-size calculations.
c Dose of magnesium sulfate was variable among the studies. GRADE, Grading of Recommendations Assessment, Development and Evaluation; OR, odds ratio; RCT, randomized controlled trial.
Table 3g. Certainty of evidence for the use of alkalinization for organophosphate poisoning, Darren 2005.
A Author categorized alternate admissions to two groups, not properly randomized, no concealment, no blinding.
b Confidence interval was very wide.
c Single study included in the analysis; sample size was small. RR, relative risk; RCT, randomized controlled trial.
Table 3h. Certainty of evidence for the use of penehyclidine for organophosphate poisoning, Yu 2020.
Outcomes
a None of the 5 studies reported allocation concealment, blinding of participants, workers or outcome assessors.
b All studies were from one country only.
c Dose of the experimental drug varied from 1 mg three time daily to 4-6 mg stat. Dosage was not same in any 2 studies. GRADE, Grading of Recommendations Assessment, Development and Evaluation; RR, relative
RCT, randomized controlled trial.
penehyclidine in the management of OP self-poisoning based on very low certainty of evidence. Further high-quality RCTs are needed to confirm its effectiveness and safety (Table 3h) (Evidence Overview: Supplement 1.9).
Review Question 10
What is the effect of rhubarb on the outcomes of OP poisoning?
Recommendation Statement 10
We conditionally recommend against the use of rhubarb in the management of OP self-poisoning based on very low
certainty evidence. High-quality, adequately powered RCTs are needed to confirm its effectiveness and safety (Table 3i) (Evidence Overview: Supplement 1.10).
Review Question 11
What is the effect of xuebijing on the outcomes of OP poisoning?
Recommendation Statement 11
We conditionally recommend against the use of xuebijing in the management of OP self-poisoning based on very low
Table 3i. Certainty of evidence for the use of crude rhubarb for organophosphate poisoning, Wang 2015.
to
a Although most of the studies were categorized as RCTs, only one provided method of randomization.
b None of the studies reported allocation concealment.
c None of the studies reported blinding of participants, workers, or outcome assessors.
d All studies were from one country only.
e The treatments given in the control and intervention groups were not similar. Use of catharsis and diuretics was variable in both groups across studies.
GRADE, Grading of Recommendations Assessment, Development and Evaluation; RR, relative risk; RCT, randomized controlled trial.
Table 3j. Certainty
a Most of the studies lacked allocation concealment, and blinding.
b Two studies used blood perfusion as an additional intervention in the trial group, which should not have been included in the pooled estimate.
c All studies are from a single country.
*The risk in the intervention group (and its 95% CI) is based on the assumed risk in the comparison group and the relative effect of the intervention (and its 95% CI).
GRADE Working Group grades of evidence:
High certainty: We are very confident that the true effect lies close to that of the estimate of the effect.
Moderate certainty: We are moderately confident in the effect estimate; the true effect is likely to be close to the estimate of the effect, but there is a possibility that it is substantially different. Low certainty: Our confidence in the effect estimate is limited; the true effect may be substantially different from the estimate of the effect.
Very low certainty: We have very little confidence in the effect estimate; the true effect is likely to be substantially different from the estimate of effect.
GRADE, Grading of Recommendations Assessment, Development and Evaluation; RR, relative risk, RCT, randomized controlled trial.
certainty evidence. Higher quality, adequately powered RCTs are required to establish its effectiveness and safety. (Table 3j)
Evidence Overview: Supplement 1.11
DISCUSSION
Organophosphate self-poisoning is a critical global health concern, particularly in agricultural regions where OP pesticides are prevalent. Despite the availability of treatments such as atropine and oximes, the effectiveness of many therapeutic interventions remains uncertain. This comprehensive review of systematic reviews and meta-analyses highlights the current state
of evidence for treatments including oximes, plasma exchange, hemoperfusion, lipid emulsions, magnesium sulfate, gastric lavage, alkalinization, penehyclidine, rhubarb, and xuebijing. However, significant gaps and limitations persist across studies, necessitating further research.
Oximes, such as pralidoxime, are recommended by the World Health Organization and are widely used in OP poisoning, but their efficacy remains debatable. The most recent systematic reviews and meta-analysis by Kharel et al (2020) pooled six RCTs and found no clear evidence of benefit or harm, with low-quality evidence suggesting a relative risk of
of evidence for the use of xuebijing for organophosphate poisoning, Huang 2019.
mortality of 1.53.4 Methodological flaws, including inadequate sample sizes, inconsistent dosing, and variability in the OP compounds studied limit the reliability of conclusions made by the systematic reviews and meta-analyses on oximes.
Gastric lavage, traditionally used to remove ingested toxins, also lacks robust evidence.26 Reviews have failed to demonstrate significant benefits due to the absence of control groups and variability in lavage protocols, leaving its role in OP poisoning uncertain. The recommendations are to not perform gastric lavage beyond one hour of OP self-poisoning as the benefits are uncertain and may even result in harm.
Plasma exchange and hemoperfusion, aimed at enhancing toxin elimination, show potential benefits in isolated studies but lack high-quality evidence. The systematic reviews and meta-analysis by Yao et al (2023) suggested that plasma exchange with hemoperfusion may reduce mortality, but we found that the conclusions were drawn based on studies with very low certainty of evidence, geographic bias, and poor study designs.12 We need properly designed studies on plasma exchange and hemoperfusion in OP poisoning and, therefore, we recommend against their routine use.
Lipid emulsions have been explored for their ability to sequester lipophilic toxins, with some studies indicating reduced mortality in OP poisoning.10 However, the evidence is weak due to small sample sizes, variability in protocols, and critically low-quality ratings in the reviews, and, therefore, we recommend not to use them routinely.
Magnesium sulfate, another potential treatment, has shown some promise in reducing mortality and ventilation requirements, but inconsistent dosages and methodological flaws limit its utility.6 We recommend not to use magnesium sulfate for OP self-poisoning. Alkalinization, primarily using sodium bicarbonate, has been studied for its potential to enhance toxin clearance.25 However, evidence remains weak, with reviews failing to demonstrate significant clinical benefits. We recommend against the use of alkalanization for OP self-poisoning.
Penehyclidine, an anticholinergic drug, has shown promise in improving outcomes when used along with atropine, although the studies pooled to generate this evidence have critical methodological flaws and geographic bias.9 We recommend against the use of penehyclidine in OP self-poisoning. Finally, rhubarb and xuebijing, both herbal treatments commonly used in China, have also demonstrated potential benefits as adjunctive therapy, but they too face similar challenges of limited generalizability and poor quality of the evidence.7,8 We recommend against the use of rhubarb and xuebijing in patients with OP self-poisoning.
SUMMARY of LIMITATIONS of REVIEWED STUDIES
We found limitations of the current evidence on plasma transfusion, oximes, and other treatments for OP poisoning. These limitations include methodological flaws such as small
sample sizes, lack of randomization, and inconsistent reporting of outcomes. Many studies were conducted only in China, which raises concerns about geographical and publication bias. In addition, several trials did not provide details on the type or dose of OPs involved, limiting the applicability of findings. The certainty of evidence was generally rated as very low, with several reviews receiving a critically low AMSTAR-2 rating, indicating that the available data cannot be relied upon for definitive conclusions.
RECOMMENDATIONS for FUTURE TRIALS
Future studies should focus on large, well-designed RCTs with sufficient sample sizes to test the effectiveness of various treatments in OP poisoning. Trials should aim to detect the impact of interventions such as magnesium sulfate, penehyclidine, rhubarb, xuebijing, lipid emulsion, plasma transfusion, hemoperfusion, gastric lavage, alkalinization, and oximes on key clinical outcomes, including mortality, intermediate syndrome, intubation/ventilation rates, and the need for specific therapies. Adequately powered RCTs will ensure robust and reliable findings that contribute to better treatment protocols. By addressing these recommendations, future research can contribute to more conclusive evidence on the most effective treatments for OP poisoning, improve clinical practice, and ultimately enhance patient outcomes.
CONCLUSION
After careful scrutiny of the current evidence pooled by various systematic reviews and meta-analyses we conclude that atropine remains the mainstay of treatment for OP self-poisoning. It may be supplemented with oximes as recommended by the WHO despite no clear evidence for benefit or harm from the systematic reviews and metaanalyses. Gastric lavage has doubtful efficacy and may even be harmful if done beyond one hour of poisoning. Additionally, we recommend against the routine use of penehyclidine, rhubarb, xuebijing, hemofiltration, plasma exchange with hemoperfusion, lipid emulsions, magnesium sulfhate and alkalinization in the management of OP selfpoisoning. Overall, the evidence for the treatments for OP self-poisoning, other than atropine, is plagued by methodological weaknesses, small sample sizes, and biases. Many studies lack rigorous randomization, blinding, and standardized protocols, reducing the reliability of their findings. Additionally, the geographic concentration of research, particularly in China, raises concerns about the generalizability of results to other populations.
Address for Correspondence: Vivek Chauhan, MD, Indira Gandhi Medical College, Department of Medicine, Ridge Sanjauli Rd, Lakkar Bazar, Shimla, Himachal Pradesh 171001, India. Email: drvivekshimla@yahoo.com.
Chauhan
Conflicts of Interest: By the WestJEM article submission agreement, all authors are required to disclose all affiliations, funding sources and financial or management relationships that could be perceived as potential sources of bias. No author has professional or financial relationships with any companies that are relevant to this study. There are no conflicts of interest or sources of funding to declare.
1. Patel A, Chavan G, Nagpal AK. Navigating the neurological abyss: a comprehensive review of organophosphate poisoning complications. Cureus. 2024;16(2):e54422.
2. Eddleston M, Buckley NA, Eyer P, et al. Management of acute organophosphorus pesticide poisoning. Lancet 2008;371(9612):597-607.
3. Buckley NA, Eddleston M, Li Y, et al. Oximes for acute organophosphate pesticide poisoning. Cochrane Database Syst Rev. 2011(2):Cd005085.
4. Kharel H, Pokhrel NB, Ghimire R, et al. The efficacy of pralidoxime in the treatment of organophosphate poisoning in humans: a systematic review and meta-analysis of randomized trials. Cureus. 2020;12(3):e7174.
5. Eddleston M, Singh S, Buckley N. Organophosphorus poisoning (acute). BMJ Clin Evid. 2007;2007: 2012.
6. Brvar M, Chan MY, Dawson AH, et al. Magnesium sulfate and calcium channel blocking drugs as antidotes for acute organophosphorus insecticide poisoning - a systematic review and meta-analysis. Clinl Toxicol (Phila). 2018;56(8):725-736.
7. Wang L, Pan S. Adjuvant treatment with crude rhubarb for patients with acute organophosphorus pesticide poisoning: a meta-analysis of randomized controlled trials. Complement Ther Med. 2015;23(6):794-801.
8. Huang P, Li B, Feng S, et al. Xuebijing injection for acute organophosphorus pesticide poisoning: a systematic review and meta-analysis. Ann Transl Med. 2019;7(6):112.
9. Yu SY, Gao YX, Walline J, et al. Role of penehyclidine in acute organophosphorus pesticide poisoning. World J Emerg Med. 2020;11(1):37-47.
10. Yu S, Yu S, Zhang L, et al. Efficacy and outcomes of lipid resuscitation on organophosphate poisoning patients: a systematic review and meta-analysis. Am J Emerg Med. 2019;37(9):1611-7.
11. Zeng S, Ma L, Yang L, et al. The advantages of penehyclidine hydrochloride over atropine in acute organophosphorus pesticide poisoning: A meta-analysis. J Intensive Med. 2023;3(2):171-84.
12. Yao Z, Wang P, Fu Q, et al. Efficacy and safety of plasma exchange
combined with hemoperfusion in the treatment of organophosphorus poisoning: a meta-analysis. Blood Purif. 2023;52(6):1-13.
13. Zhang M, Zhang W, Zhao S, et al.. Hemoperfusion in combination with hemofiltration for acute severe organophosphorus pesticide poisoning: A systematic review and meta-analysis. J Res Med Sci. 2022;27:33.
14. Shea BJ, Reeves BC, Wells G, et al. AMSTAR 2: a critical appraisal tool for systematic reviews that include randomised or nonrandomised studies of healthcare interventions, or both. BMJ 2017;358:j4008.
15. Brennan SE, Johnston RV. Research Note: Interpreting findings of a systematic review using GRADE methods. J Physiother. 2023;69(3):198-202.
16. The PRISMA Statement for Reporting Systematic Reviews and Meta-Analyses of Studies that evaluate health care interventions: explanation and elaboration. PLoS Med. 2009;151(4):W-65-W-94.
17. Eddleston M, Szinicz L, Eyer P, et al. Oximes in acute organophosphorus pesticide poisoning: a systematic review of clinical trials. QJM. 2002;95(5):275-83.
18. Buckley NA, Eddleston M, Szinicz L. Oximes for acute organophosphate pesticide poisoning. Cochrane Database Syst Rev. 2005(1):Cd005085.
19. Peter JV, Moran JL, Graham P. Oxime therapy and outcomes in human organophosphate poisoning: an evaluation using metaanalytic techniques. Crit Care Med. 2006;34(2):502-10.
20. Rahimi R, Nikfar S, Abdollahi M. Increased morbidity and mortality in acute human organophosphate-poisoned patients treated by oximes: a meta-analysis of clinical trials. Hum Exp Toxicol 2006;25(3):157-62.
21. Blumenberg A, Benabbas R, de Souza I, et al. Utility of 2-pyridine aldoxime methyl chloride (2-PAM) for acute organophosphate poisoning: a systematic review and meta-analysis. J Med Toxicol. 2018;14(1):91-8.
22. Mirfazaelian H, Nikfar S, Abdollahi M. The efficacy of oximes in acute organophosphorus poisoning; an updated systematic review and meta-analysis. Int J Pharmacol. 2014;17(7):A750.
23. Gheshlaghi F, Akafzadeh Savari M, Nasiri R, et al. Efficacy of fresh frozen plasma transfusion in comparison with conventional regimen in organophosphate poisoning treatment: a meta-analysis study. Crit Rev Toxicol. 2020;50(8):1-8.
24. Zhang M, Zhang W, Zhao S, et al. Hemoperfusion in combination with hemofiltration for acute severe organophosphorus pesticide poisoning: a systematic review and meta-analysis. J Res Med Sci. 2022;27:33.
25. Darren MR, Nick B. Alkalinisation for organophosphorus pesticide poisoning. Cochrane Database Syst Rev. 2005;2005(1):CD004897.
26. Li Y, Tse ML, Gawarammana I, et al. Systematic review of controlled clinical trials of gastric lavage in acute organophosphorus pesticide poisoning. Clin Toxicol (Phila). 2009;47(3):179-92.
Chauhan
Methodological Considerations on the Randomized Trial of Self-Selected
Music for Musculoskeletal Back Pain
in the Emergency Department
Süleyman Gökhan Kara, MD, PhD Güneş Özlü, MD
Eskişehir City Hospital, Department of Emergency Medicine, Eskişehir, Türkiye
Submission history: Submitted December 6, 2025; Accepted December 6, 2025
Electronically published May 19, 2026
Full text available through open access at http://escholarship.org/uc/uciem_westjem DOI 10.5811/westjem.61381
[West J Emerg Med. 2026;27(3)831–832.]
Dear Editor:
We were intrigued by Goldfine et al’s “Randomized Trial of Self-Selected Music Intervention on Pain and Anxiety in Emergency Department Patients with Musculoskeletal Back Pain.”1 Such research could improve emergency department (ED) treatment for musculoskeletal back pain in a time when non-pharmacological analgesics are regarded more favorably. However, several methodological aspects of the study design and reporting may affect results interpretation and generalizability. Our findings and recommendations aim to improve this study’s scientific significance.
Although a pilot study, the 40 participant-sample size reduces statistical power and increases type II error. The investigation in one ED limits its applicability to other ED populations with different sociodemographic and cultural characteristics. Multicenter designs could solve this problem by allowing EDs with different patient demographics and operational features to compare the intervention’s effects. Despite randomization, the music group had significantly higher Pain Catastrophizing Scale (PCS) scores (28.4 [12.6] vs 19.4 [10.8], P =.02), showing a significant baseline difference that compromises internal validity. Even with statistical adjustments, the influence of psychosocial factors on pain perception makes it difficult to assess the intervention’s true impact. Small samples are more prone to baseline imbalances; thus, it is unclear whether the effect is attributable to music or psychological differences across groups. The PCS and anxiety-stratified randomization might improve future experiments. A significant percentage of individuals (63%) indicated prior use of music for relaxing, while 38% reported daily music listening. This familiarity with music may serve as a confounding variable affecting the reaction to the intervention; however, the distribution of these traits among the groups was not disclosed.
The authors found a significant difference in pain levels between the music and noise-cancellation groups (6.1 [0.4] vs 7.5 [0.4], P = .037). A 1.4-point drop on a 0-10 numeric rating scale is statistically significant but nears the smallest clinically relevant difference for musculoskeletal pain. The fact that 60% of the music group participants reported no pain change suggests that statistical significance did not match clinical relevance. Thus, future studies should include as primary objectives patient satisfaction, duration until additional analgesia is requested, and rescue analgesic use, as these may better reflect clinically significant outcomes in ED patients with back pain.
The “noise-cancellation” condition appears to be a passive control group, but in a highly stimulating environment like the ED, total silence or the reduction of ambient noise may cause sensory deprivation in some patients, which may paradoxically increase anxiety or focus on pain. In some noise-cancelling headphones, the low-frequency hum produced by active noise cancellation may cause uneasiness or restlessness. Thus, the control condition may actively alter pain and anxiety measurements. This makes music’s influence harder to pinpoint. An optimal design would include a third arm receiving standard care exclusively (without headphones and under typical ED conditions) to better distinguish between music, noise cancellation, and the natural progression of symptoms in patients with musculoskeletal back pain. Interpreting the findings requires investigating whether noise-cancelling headphones may increase pain or anxiety in the control group.
The patients’ conviction in the therapeutic value of a music intervention may have caused a placebo effect. Allowing participants to choose their own music replicates real-world practices, but the lack of genre, rhythm, tempo, or emotional valence analysis obscures the exact musical elements that may impact pain and anxiety effects. Limiting
Methodological Considerations on the Randomized Trial of Self-Selected Music for MSK Back Pain in ED Kara et al.
patients’ ability to skip tracks or change selections reduces the intervention’s ecological validity and may increase anxiety by making them feel they had no control. Interpreting the findings requires considering the methodological constraint of not evaluating these aspects.
The 10-minute music and noise-cancellation interventions raised questions regarding their durability in a group with an average ED stay of 6.4 hours. The measurement of outcomes immediately post-intervention makes it unclear whether any gains were sustained at clinically meaningful intervals such as 30 minutes, 60 minutes, or at discharge. This mismatch makes it difficult to distinguish between a temporary boost and a clinically significant persistent effect, and it risks disregarding subsequent “rebound” pain or anxiety escalations.
We assert that if the methodological limitations we have identified are rectified, this research avenue could produce significantly more robust evidence and provide a more substantial contribution to the management of musculoskeletal back pain in the ED.
Address for Correspondence: Süleyman Gökhan Kara, MD, PhD, Eskişehir City Hospital, Department of Emergency Medicine, 71 Evler Neighborhood, Çavdarlar Street 26080 Odunpazarı/ Eskişehir, Türkiye. Email: suleymangokhankara@gmail.com.
Conflicts of Interest: By the WestJEM article submission agreement, all authors are required to disclose all affiliations, funding sources and financial or management relationships that could be perceived as potential sources of bias. No author has professional or financial relationships with any companies that are relevant to this study. There are no conflicts of interest or sources of funding to declare.
1. Goldfine CE, Wilson JM, Jenson K et al. Randomized trial of self-selected music intervention on pain and anxiety in emergency department patients with musculoskeletal pain. WJEM. 2025;(26)4.
Fellowship Training After Four-year Emergency Medicine Residency
Michael R. Ehmann MD, MPH, MS
Eili Y. Klein MS, PhD
Gabor D. Kelen MD
Section Editor: Quincy Tran, MD
Johns Hopkins
University School of Medicine, Department of Emergency Medicine, Baltimore, Maryland
Submission history: Submitted January 16, 2026; Accepted January 16, 2026
Electronically published May 19, 2026
Full text available through open access at http://escholarship.org/uc/uciem_westjem DOI 10.5811/westjem.62105
[West J Emerg Med. 2026;27(3)833–834.]
To the Editor:
We read with interest Dr. Hamilton et al’s letter of concern regarding the potential implications of requiring four years of training for all emergency medicine residency programs.1 The authors raise several considerations that warrant discussion. Principally, we wish to clarify their interpretation of the relationship between residency length of training and the likelihood of pursuing fellowship.
The authors cite our 2021 paper, “Emergency Medicine Career Outcomes and Scholarly Pursuits: The Impact of Transitioning from a Three-year to a Four-year Niche-based Residency Curriculum,” to suggest that requiring a standard four-year training format may lead to a reduction in the number of graduates pursuing fellowship training.2 This assertion is not supported by our paper. Our multivariable statistical analysis found that four-year residency graduates were no less likely to pursue fellowship opportunities than when our program was a three-year format (odds ratio 0.58, 95% CI, 0.18-1.87; Table 2).2
Our manuscript is the sole source of evidence provided for the authors’ opinion regarding the effect of residency length on fellowship applications. Therefore, we believe it would have been more appropriate for them to temper their assertion in the absence of any other corroborating support since there is evidence going back 20 years that graduates of fouryear EM programs were more likely to pursue fellowship training.3 More recently, a 2024 study demonstrated that residents’ career decisions, including whether to pursue a fellowship, are influenced by multiple factors—including mentorship, perceived career needs, and subspecialty exposure during residency—all of which may be positively affected by a fourth year of residency training.4
Further, since our original paper was published, five classes have graduated from our four-year residency. Of these 59 recent graduates, 18 (30.5%) have pursued fellowship training. When these alumni are included in an updated
analysis following the same methods described in our original manuscript, the observed absolute difference in the number of residents pursuing a fellowship is inverted from 5.4% in favor of a three-year format to 5.6% in favor of a four-year format. The odds ratio of pursuing a fellowship remains statistically non-discernible (odds ratio 1.29, 95% CI, 0.64-2.58). While this reflects the experience of a single program and our observations could be affected by self-selection bias, this updated analysis affirms our 2021 observation that four-year program graduates are not less likely to pursue fellowship than their three-year colleagues, and in more recent years, may be even more likely to do so.2
We appreciate Dr. Hamilton et al’s contributions to this important discussion on behalf of the Association of Academic Chairs of Emergency Medicine but respectfully disagree with their interpretation of our work and with their conclusions about the potential implications of the ACGME’s proposed program requirements.
Address for Correspondence: Michael R. Ehmann MD, MPH, MS, Associate Professor of Emergency Medicine, The Johns Hopkins University School of Medicine, 1830 E. Monument Street - Suite 6-100, Baltimore, MD 21287. Email: mehmann1@jhmi.edu.
Conflicts of Interest: By the WestJEM article submission agreement, all authors are required to disclose all affiliations, funding sources and financial or management relationships that could be perceived as potential sources of bias. No author has professional or financial relationships with any companies that are relevant to this study. There are no conflicts of interest or sources of funding to declare.
1. Hamilton RJ, Becker LB, Wolfe, RE, et al. Letter of concern from the Association of Academic Chairs of Emergency Medicine regarding ACGME proposed changes. West J Emerg Med. 2025;26(4):769-772.
2. Ehmann MR, Klein EY, Kelen GD, et al. Emergency medicine career outcomes and scholarly pursuits: The impact of transitioning from a three-year to a four-year niche-based residency curriculum. AEM
Educ Train. 2021;5(1):43-51.
3. Lubavin BV, Langdorf MI, Blasko BJ. The effect of emergency medicine residency format on pursuit of fellowship training and an academic career. Acad Emerg Med. 2004;11(9):938-943.
4. Jordan J, Buckanavage J, Ilgen J, et al. Oh, the places you’ll go! A qualitative study of resident career decisions in emergency medicine. AEM Educ Train. 2024;8(2):e10956.
Fellowship Training After Four-Year Emergency Medicine Residency
Richard J. Hamilton, MD, MBA*
Lance B. Becker, MD†‡§
Richard E. Wolfe, MD||#
Section Editor: Mark I. Langdorf, MD, MHPE
Drexel University College of Medicine, Department of Emergency Medicine, Philadelphia, Pennsylvania
North Shore University Hospital and Long Island Jewish Medical Center, Department of Emergency Medicine, Manhasset, New York
Donald and Barbara Zucker School of Medicine at Hofstra/Northwell, Institute of Bioelectronic Medicine, Uniondale, New York
Feinstein Institutes for Medical Research, Department of Emergency Medicine, Manhasset, New York
Harvard Medical School, Department of Emergency Medicine, Boston, Massachusetts
Beth Israel Deaconess Medical Center, Department of Emergency Medicine, Boston, Massachusetts
Submission history: Submitted February 19, 2026; Revision received February 19, 2026; Accepted February 19, 2026
Electronically published May 19, 2026
Full text available through open access at http://escholarship.org/uc/uciem_westjem DOI 10.5811/westjem.63063
[West J Emerg Med. 2026;27(3)835–836.]
To the Editor:
We thank Dr. Ehmann and colleagues for their thoughtful response and for the opportunity to clarify our interpretation of their work. We agree that their 2021 study does not demonstrate a statistically significant reduction in fellowship pursuit among graduates of their four-year program, and we appreciate their detailed description of updated outcomes from subsequent graduating classes. The disagreement is not about whether four-year programs can produce fellows, but whether mandating four years for all programs produces the same downstream effects. Our concern is not with the internal validity of their findings, but rather with their applicability to a proposed national mandate requiring that all emergency medicine (EM) residency programs adopt a four-year training format. A critical distinction exists between outcomes observed in a system where three- and four-year programs coexist and those that may reasonably be expected when choice is removed.
The overwhelming majority of EM training programs in our nation are currently three-year programs and are highly successful with no evidence of inferiority to fouryear programs. Those trainees who enter four-year programs represent a smaller, self-selected cohort. They are, by inference, less constrained by time-to-practice, financial considerations, or opportunity cost, and may place greater
intrinsic value on extended training, niche development, or academic productivity and, therefore, are not representative of the full applicant pool. In contrast, many EM applicants currently prioritize shorter training duration and have historically demonstrated a preference for three-year programs when given a choice. Under a mandated four-year model, the trainee population would necessarily include individuals for whom additional time in training carries meaningful personal, financial, or opportunity costs.
Accordingly, our original concern was not that four years of training intrinsically discourages fellowship pursuit, but rather that mandated extension of residency may alter downstream career decisions. For some trainees, the requirement to complete four years of residency could reasonably reduce willingness to pursue additional postresidency training, including fellowship, after already completing an extended training period.
These considerations are further amplified by the contemporary economic and practice environment facing EM trainees. Persistent inflation, erosion of physician purchasing power, and professional salaries that have not kept pace with rising costs increase the opportunity cost of prolonged training, particularly for trainees who enter residency training with substantial debt. At the same time, growing strains of EM practice—particularly crowding, boarding, and throughput
pressures that disproportionately affect academic centers— may further influence career decision-making. Under these conditions, economic necessity and workforce pressures may increasingly compete with academic or fellowship aspirations, particularly when training duration is no longer elective.
We agree with Dr. Ehmann and colleagues that mentorship, subspecialty exposure, and structured academic development strongly influence career outcomes. However, these benefits reflect programmatic features rather than inherent consequences of training length. The experience of a single, highly resourced academic program with a nichebased curriculum and robust mentorship infrastructure—while informative—cannot be assumed to generalize to the broader national trainee population under a mandated four-year training requirement. Mandated expansion to a 4-year training length will not ensure mentorship, niche time, or scholarly infrastructure across all institutions.
At a time when EM faces declining applicant interest and increasing workforce uncertainty, preserving flexibility in training pathways may be particularly important. We believe that future discussions should focus on piloting evidencebased solutions to quantified educational gaps and identifying and disseminating effective curricular elements that promote academic development, rather than assuming that uniformly extending residency duration will yield similar outcomes across diverse programs and trainee populations.
This is an important topic for emergency medicine that deserves robust consideration and rational debate. There is no logical reason to make a hasty decision that lacks rudimentary data, raises issues of bias, and calls into question good decision-making processes. We appreciate the authors’ engagement in this important dialogue and welcome continued discussion regarding how best to support academic development, fellowship training, and workforce sustainability in emergency medicine.
Address for Correspondence: Richard J. Hamilton, MD, MBA, Drexel University College of Medicine, Department of Emergency Medicine, 160 E. Erie Ave, Philadelphia, PA, 19134. Email: rh35@drexel.edu.
Conflicts of Interest: By the WestJEM article submission agreement, all authors are required to disclose all affiliations, funding sources and financial or management relationships that could be perceived as potential sources of bias. No author has professional or financial relationships with any companies that are relevant to this study. There are no conflicts of interest or sources of funding to declare.
Physician Wellness and Burnout from Electronic Medical Record and Administrative Tasks
Hamza Choudry, BS
William Adams, PhD
Jacqueline M. Dziedzic, DO
Section Editor: Mark I. Langdorf, MD, MHPE
Loyola University Chicago Stritch School of Medicine Department of Emergency Medicine, Maywood, Illinois
Submission history: Submitted February 10, 2026; Accepted February 26, 2026
Electronically published May 19, 2026
Full text available through open access at http://escholarship.org/uc/uciem_westjem DOI: 10.5811/westjem.62945
[West J Emerg Med. 2026;27(3)837.]
Introduction: Rising physician burnout, exacerbated by the increasing complexity and time demands of electronic medical record (EMR) systems and administrative tasks, threatens physician well-being and patient care quality.
Objective: To determine the impact of EMRs and administrative tasks on physician burnout in the emergency department (ED), identifying specific factors that contribute to increased burnout and decreased well-being among emergency physicians (EPs).
Methods: A cross-sectional survey was sent to 53 EM attending and resident physicians at Loyola University Medical Center. We measured the following: time spent on EMR-related tasks, as well as the Maslach Burnout Inventory–Human Services Survey (MBI-HSS), which measures burnout across three domains: emotional exhaustion, depersonalization, and personal accomplishment. For each MBI-HSS domain, participants’ scores were calculated by summing the responses to domain-specific items and dividing by the number of items answered, yielding an average score that reflects the degree of burnout. Linear regression was employed to assess the relationship between each ordinal survey item and the average MBI-HSS domain score. Kruskal-Wallis tests were conducted as sensitivity analyses due to the ordinal nature of the survey items. Burnout levels were based on established thresholds to facilitate interpretation.
Results: Of the 24 respondents (response rate 45.3%), 50% (n = 12) reported high emotional exhaustion, and 54.2% (n = 13) reported high depersonalization, indicating a substantial prevalence of burnout.. Weekly hours dedicated to EMR-related tasks were associated with increased emotional exhaustion (β = 0.89, SE = 0.21; p < .001) and depersonalization (β = 0.64, SE = 0.24; p = .01). Interestingly, perceived time pressure and workload related to EMR use were inversely associated with depersonalization (β = –1.19, SE = 0.34; p = .002). No significant association was found between EMR time and personal accomplishment, although 25% (n = 6) of respondents reported low scores in this domain, indicating the need to
explore additional factors contributing to this aspect of burnout. 41.6% (n = 10) of subjects reported 15-20 hours per week spent using EMR, followed by 25% (n = 6) reported 10-15 hours per week and 16.6 % (n = 4) reported 5-10 hours per week and another 16.6% (n = 4) reported greater than 20 hours per week.
Conclusion: This study demonstrates a significant association between time spent on EMR tasks and elevated levels of emotional exhaustion and depersonalization among ED physicians, underscoring the impact of administrative burdens on burnout. The inverse association between perceived EMR workload and depersonalization suggests that higher time pressure may paradoxically reduce feelings of detachment, potentially due to increased engagement in patient care during high-pressure situations. These findings highlight the complexity of burnout dynamics and emphasize the need for targeted interventions to optimize EMR systems and reduce administrative burdens, thereby enhancing physician well-being and job satisfaction. Further research is warranted to investigate factors influencing personal accomplishment and the complex interactions between EMR use and various dimensions of burnout in the ED setting.
Address for Correspondence: Jacqueline M. Dziedzic, DO, Loyola University Medical Center, Department of Emergency Medicine, 2160 S. First Ave., Building 110 - Emergency Medicine, Maywood, IL 60153. Email: jcdziedzic@lumc.edu.
Conflicts of Interest: By the WestJEM article submission agreement, all authors are required to disclose all affiliations, funding sources and financial or management relationships that could be perceived as potential sources of bias. No author has professional or financial relationships with any companies that are relevant to this study. There are no conflicts of interest or sources of funding to declare.
Changes in THC Positivity Rates in Adolescents Corresponding to Legalization of Recreational Marijuana in Illinois
Eriq Gassé, BS April Brill, DO
Midwestern University – Chicago College of Osteopathic Medicine, Department of Emergency Medicine, Downers Grove, Illinois
Section Editor: Mark I. Langdorf, MD, MHPE
Submission history: Submitted February 10, 2026; Accepted February 10, 2026
Electronically published May 19, 2026
Full text available through open access at http://escholarship.org/uc/uciem_westjem DOI: 10.5811/westjem.62946
[West J Emerg Med. 2026;27(3)838–839.]
Introduction: As public access to tetrahydrocannabinol (THC) products expands under state legalization, there is concern for increased use in adolescents under 18 years of age and its subsequent effects. Adverse effects of THC use have been documented such as epilepsy, lethargy, somnolence, and respiratory insufficiency. Additional concern has been raised regarding whether potential increases in THC intoxications presented to the emergency department (ED) would demand a simultaneous increase in resource utilization, like lab testing and hospital admission. Previous studies on the relationship between marijuana and pediatric use demonstrated mixed results, with others indicating an increase in co-ingestion rates when pediatric patients use marijuana.
Objective: To investigate whether the incidence of THC use in pediatrics increased post-recreational marijuana legalization in 2020 (RML) and if the incidence of co-ingestion in these cases differed significantly from the pre-RML data.
Methods: This was a retrospective cohort study examining positive urine drug screens (UDS) in pediatrics during an emergency department visit at a community hospital during fixed time periods in 2019 and 2020, on either side of Illinois’ legalization of recreational marijuana on January 1st, 2020. Pediatric subjects were defined as those younger than 18 years of age and older than four weeks of age at the time of UDS collection with valid, complete, and reported laboratory results. UDS screens analyzed in this study were collected in the ED of a suburban community hospital from pediatric charts housed on the electronic medical record, where there was a clinical indication for UDS collection and regardless of disposition. UDS may have been obtained for either medical or psychiatric concerns, but the reason for the UDS or patient visit was not collected or analyzed. UDS was considered positive if either amphetamines, benzodiazepines, opiates, Phencyclidine (PCP), cocaine, or barbiturates were identified as present in the urine sample and negative if none of these substances were detected
in the urine sample. Both negative and positive UDS were assessed using chi-square and odds ratios to investigate these differences and compare across sex.
Results: There were 169 patients with a mean age of 14 years included. Mean age in 2019 (14.1 ± 3.2 years) was comparable to mean age in 2020 (14.7 ± 2.0 years) (two-sample t-test: 0.143 > 0.05). Sex demographics were also not significantly different between cohorts, with 53.4% being female in 2019 and 50.6% in 2020 (chi-square: 0.1318; significance: 0.1318 > 0.05). Between the two time periods, we found no significant difference in pediatric presentation to the ED with THC positive testing (2019: 16 positive UDS of 88 collected [18.18%]; 2020: 17 positive UDS of 81 collected [20.99%]; chi square: 0.211; Significance: 0.646 > 0.05; odd ratio between group: 1.195 [CI 95%: 0.558-2.559]) nor correlation with demographic data. We found a nonsignificant positive association between pediatric THC ingestion and co-ingestion of other substances (amphetamines, benzodiazepines, opiates and cocaine) pre- RML and a nonsignificant negative association post-RML (2019: 1.092 [CI 95%: 0.742-1.606]; 2020: 0.913 [CI 95%: 0.627-1.330]).
Conclusion: These findings indicate that THC usage among pediatric patients with positive UDS did not increase with state legalization, nor did co-ingestion rates. There was also no difference in rates of positive or negative UDS between patient sex. This must be considered clinically when anticipating potential co-ingestions while interacting with children who may be using street drugs. Additionally, this data suggests that legalization of recreational marijuana does not significantly change the rate of children presenting to the ED with positive drug screens and can be used by hospital administration and state representatives to anticipate healthcare demands following large-scale drug reclassifications. Further investigation is warranted to evaluate these findings in a larger, multi-center study.
Gassé et al. Changes in THC Positivity Rates in
Address for Correspondence: April Brill DO, Midwestern University – Chicago College of Osteopathic Medicine, Department of Emergency Department, 555 31st St. Downers Grove, IL 60515. Email: Abrill@midwestern.edu.
Conflicts of Interest: By the WestJEM article submission agreement, all authors are required to disclose all affiliations, funding sources and financial or management relationships that could be perceived as potential sources of bias. No author has professional or financial relationships with any companies that are relevant to this study. There are no conflicts of interest or sources of funding to declare.
Consequences of the 2022 Intravenous Contrast Shortage on Emergency Department Care: A Retrospective Study
Shawna Bellew, MD, MPH
Lindsay Tjiattas-Saleski, DO, MBA
Daniel Butz, DO
Mandy Stallard, DO
Matt Galush, DO
Nathan Hudepohl, MD, MS, MPH
Michael Ramsay, MD, JD
Sabrina Avanzato, BS
Constantine Hrysikos, BS, MA
Riley Seay, BS
Section Editor: Mark I. Langdorf, MD, MPHE
Edward Via College of Osteopathic Medicine, Carolinas Campus, Department of Emergency Medicine, Spartanburg, South Carolina
Submission history: Submitted February 10, 2026; Accepted February 10, 2025
Electronically published May 12, 2026
Full text available through open access at http://escholarship.org/uc/uciem_westjem DOI: 10.5811/westjem.62947
[West J Emerg Med. 2026;27(3)840.]
Introduction: Computed tomography (CT) is an essential diagnostic tool for evaluating emergency department (ED) patients. Between 15-20% of patients who present to the ED in the United States (US) undergo CT imaging. CT imaging with the use of intravenous contrast media (ICM is used in the evaluation of abdominal pain, concern for active bleeding, vascular pathology, and pulmonary embolism (PE). In April of 2022, production shut-downs in Shanghai, China due to the COVID-19 pandemic resulted in a global shortage of ICM.
Objective: To examine the impact of the ICM shortage due to the COVID-19 pandemic on patient outcomes and ED operations.
Methods: We performed a retrospective study of adult patients (age 18 and older) who received either CT imaging at six Prisma Health EDs before (June to July 2019) and during (June to July 2022) the contrast shortage. Data was electronically extracted from the electronic medical record. Main outcomes included 30day mortality, 30-day return-visit, and ED length of stay. We used the t-Test, paired t-Test, or ANOVA for normally distributed data and logistic regression to assess the likelihood of undergoing a CT with ICM.
Results: We analyzed 11,044 patients who received CT imaging. ICM was used in 93% of CT scans during the non-shortage period and 45% during the shortage. (p < 0.001). The likelihood of a return visit within 30 days decreased during the ICM shortage period and the non-shortage period by 6.0% and 4.3%, respectively (Fisher’s Exact Test, p-value = 6.71e-05). The shortage did not have a statistically significant effect on patient mortality within 30 days of ED visit staying stable at 2.8%
(Fisher’s Exact Test p-value ≈ 0.89). There was a statistically significant increase in patient time-first-roomed upon ED arrival (p-value < 0.001). However, there was a statistically significant increase in ED length of stay (LOS, p = 0.04).
Conclusion: The rationing of ICM had did not have a statistically significant effect on 30-day mortality. There was a decrease in 30-day return-visit likelihood which was statistically significant. Despite the reduced ICM usage, there was a statistically significant increase in ED LOS during the shortage period. However, more factors need to be considered as the COVID-19 pandemic could have made an impact on hospital operations. This demonstrates that there may be opportunities to decrease ICM usage without causing negative effects on mortality or morbidity.
Address for Correspondence: Shawna Bellew MD, MPH, Edward Via College of Osteopathic Medicine, Carolinas Campus, Department of Emergency Medicine, 350 Howard Street, Spartanburg, SC 29303. Email: ltjiattassaleski@carolinas.vcom.edu.
Conflicts of Interest: By the WestJEM article submission agreement, all authors are required to disclose all affiliations, funding sources and financial or management relationships that could be perceived as potential sources of bias. No author has professional or financial relationships with any companies that are relevant to this study. There are no conflicts of interest or sources of funding to declare.
Curb to Needle Time: A Five-Year Descriptive Analysis Evaluating a
Eric Wetzel, DO
Zachary Weisner, DO
Marina Ulhaq, DO
Matthew Kening, DO
Alvin Wang, DO
Gerald Wydro, MD
Mobile
Stroke Unit in a
Suburban EMS System
Jefferson Northeast, Department of Emergency Medicine, Philadelphia, Pennsylvania
Section Editor: Mark I. Langdorf, MD, MPHE
Submission history: Submitted February 10, 2026; Accepted February 10, 2026
Electronically published May 19, 2026
Full text available through open access at http://escholarship.org/uc/uciem_westjem DOI: 10.5811/westjem.62948
[West J Emerg Med. 2026;27(3)841.]
Introduction: Stroke is a significant cause of mortality and long-term disability in the United States. Reduced time to thrombolytic therapy may lower stroke-related morbidity and mortality. The integration of a mobile stroke unit (MSU) into emergency medical service (EMS) systems of care has been focused in large metropolitan areas. A MSU may reduce the time from first medical contact (FMC) to thrombolytic therapy versus traditional care models, but this value must be evaluated in the context of the logistic and operational challenges of nonmetropolitan EMS systems.
Objective: To determine the impact of integrating an MSU into a large suburban EMS system with specific attention to key time metrics, logistics, and patient safety.
Methods: We conducted a retrospective observational study of MSU dispatches by a County 911 emergency communication center (ECC) across a large suburban EMS system involving multiple agencies between August 1st, 2019, and July 31st, 2024. The MSU is a specialty ambulance with computerized tomography and telemedicine consultation capable of prehospital treatment of patients with thrombolytics. Criteria to dispatch the MSU were defined by the ECC caller-interrogation protocols for stroke and dispatcher discretion. Time metrics in minutes were reviewed for all incidents by the MSU, including dispatch to on-scene, and times from on-scene to key milestones such as imaging by computed tomography, neurology telemedicine consultation, thrombolytic therapy, and transport to the stroke center. Demographic data were obtained on those who received tPA and who were transported. Data are presented as a median with interquartile ranges (IQR).
Results: Over a five-year period, the MSU had 1,752 dispatches, of which 717 patients were transported to the emergency department. The median time on scene before initiating transport to a comprehensive stroke center was 21
minutes (IQR 18-24). The median arrival to CT scan was 9 minutes (IQR 7 – 11), median FMC to neurology telemedicine consultation was 14 minutes (IQR 12 - 17), and dispatch to thrombolytic therapy was 38 min (IQR 31-43). A total of 91 patients (4%) received thrombolytics prehospital and FMC to thrombolytic therapy had a median time of 26 minutes (IQR 22 – 31). An equal number of men (47%) and women received thrombolytics (p value = 0.602) and the median age was 73. (IQR 64.5-83). The median time from reported last known well to thrombolytic was 71 minutes (IQR 53-136).
Conclusion: We describe the successful integration of an MSU into a suburban EMS system involving multiple agencies with rapid FMC to thrombolytic administration time. Time metrics for each step to thrombolytic administration were consistent with little variance; no patient received thrombolytics beyond the 270 minutes safety limit. Of the 1,752 dispatches, 91 patients received thrombolytics. This should initiate further discussion on the clinical, financial, and operational impact of MSU care in suburban communities.
Address for Correspondence: Eric Wetzel, DO, Jefferson Northeast, Department of Emergency Medicine, 10800 Knights Road, Philadelphia, PA 19114. Email: eric.wetzel@jefferson.edu.
Conflicts of Interest: By the WestJEM article submission agreement, all authors are required to disclose all affiliations, funding sources and financial or management relationships that could be perceived as potential sources of bias. No author has professional or financial relationships with any companies that are relevant to this study. There are no conflicts of interest or sources of funding to declare.