8 Seattle 5 6
Portland Area
Olympia
19 5
Boston Area
Detroit
Minneapolis 10 7
14
Worcester
Portland Madison 12
55 Boulder
Bay Area
Springfield
6
5
5
Denver 11 San Jose
12 Cleveland
58 New York
Chicago
8 Philadelphia
5 Asheville
5
5
5
Durham
Baltimore 9
5 Los Angeles
Austin
Washington D.C.
7
56 Across Rural U.S.
50 Puerto Rico
2019 WORKER COOPERATIVES
IN THE UNITED STATES
EQUITY IN WORKER COOPERATIVES RACE
WAGES
The racial demographics of worker owners continue to show a majority of people of color, with a concentration of Latinx workers.
At a worker cooperative, compensation is measured in terms of both wages and patronage. Patronage, the worker-owner’s portion of the profit, can make a significant difference in annual compensation.
White 41.2% Latinx 37.9% Black 12.7% Other 6.2%
ENTRY WAGES The average wage paid at all reporting worker cooperatives is
$19.67 GENDER People identifying as female continue to make up the majority of the workforce at worker cooperatives.
Female 62.5% Male 35.8% Non-binary 1.7%
PER HOUR
This figure is more than $7.00 higher than the minimum wage in the 13 states with the most worker co-ops.
PATRONAGE Worker co-ops that distribute surplus as patronage to members distribute a median total patronage of $190,890 across the membership each year and an average distribution of
$8,241
TO EACH WORKER OWNER
Can good values be good business, too? For generations, the cooperative movement has been answering with a resounding “Yes!” - Michelle Chen, The Nation (2019)
PAY RATIO The vast majority of worker cooperatives have maintained a
2 - TO -1
pay ratio between highest paid and lowest paid workers.
Worker cooperatives prioritize the reduction of internal inequality over other compensation goals. By contrast, the average large U.S. corporation has a CEO-to-worker pay ratio of 303-to-1.
This report is a co-production of Democracy at Work Institute and the U.S. Federation of Worker Cooperatives. It is based on the participating 106 businesses. Only responding businesses that are incorporated, generated revenue and paid workers during FY2018 were included in the effort.
SNAPSHOT OF THE WORKER CO-OP SECTOR
465*
A SOLUTION FOR STARTUPS AND BUSINESS EXITS The rate of new startups each year remains steady at about 25 new firms per year, while the number of businesses that have converted to employee ownership has grown slightly.
KNOWN WORKER CO-OPS
Startup 69.3% Conversion 24.3% Other 6.4%
6,454
ESTIMATED WORKERS
$505 MILLION ESTIMATED REVENUE
ESTABLISHED IN A VARIETY OF INDUSTRIES Worker cooperatives exist in an array of industries, from concentrations within retail trades to engineering and manufacturing to administrative services.
Child Care
Professional Services
Retail
Home Care
* Includes 415 worker cooperatives verified operational in 2018 and 50 Puerto Rican worker cooperatives (also not included in our survey).
WORKER COOPERATIVES IN THE U.S. PROVIDING STABILITY
The worker cooperative model is a durable one. Compared to other small businesses in the U.S., mature worker cooperatives have a higher than average success rate.
25.6%
6-10 YEARS OLD
14.7%
26+ YEARS OLD
By comparison, U.S. small businesses that are 6-10 years old have a 18.7% success rate while those older than 26 years have an 11.9% success rate.
COMMON CHALLENGES
For the first time in our annual economic census series, we asked worker cooperatives to identify challenges their workplaces face.
HEALTH INSURANCE OTHER WORKER BENEFITS ADMINISTRATIVE BURDENS BUSINESS PLANNING LEGAL
25
Number of businesses
50
Selected from a curated list of challenges, the most common issues identified were benefits-related challenges (health or other). The most frequently identified nonbenefits challenge was administrative burdens, closely followed by business planning. This year’s survey participants were not asked about access to capital; the U.S. Federation of Worker Cooperatives reports that access to capital is among the most common challenges for new and existing worker co-ops.
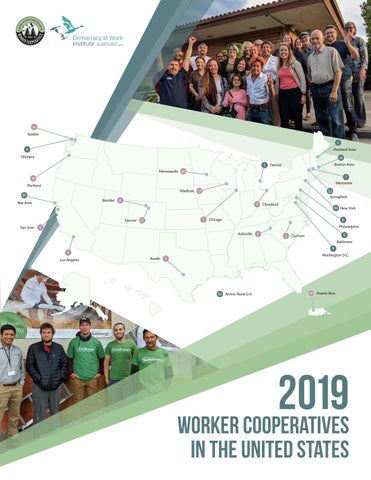
On the front cover... Indicates a region with a concentration of 5 or more worker cooperatives
Indicates a region with a concentration of 5 or more worker cooperatives as well as a Workers to Owners collaborator Workers to Owners members focus on converting businesses from a traditional structure to employee ownership. Learn more about Workers to Owners Collaborative at becomingemployeeowned.org Figures are based on metro statistical areas