This report is a co-production of Democracy at Work Institute and the U.S. Federation of Worker Cooperatives
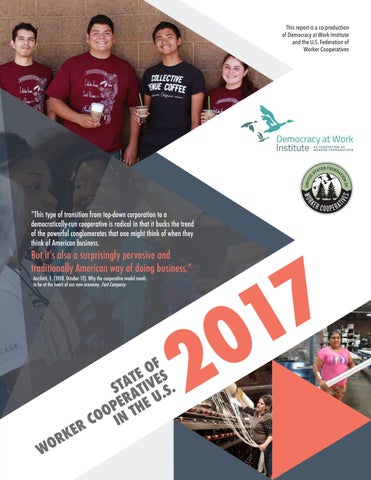
“This type of transition from top-down corporation to a democratically-run cooperative is radical in that it bucks the trend of the powerful conglomerates that one might think of when they think of American business.
But it’s also a surprisingly pervasive and traditionally American way of doing business.” - Anzilotti, E. (2018, October 12). Why the cooperative model needs to be at the heart of our new economy. Fast Company.
WO
E K R
F O TE VES A ST ATI .S. ER HE U P O NT O RC I
7 1 0 2
HOW WORKER CO-OPS GET STARTED The rate of new startups each year remains steady at about 25 new firms per year, while the rate of converted businesses is growing at a small pace.
Other/Unknown 6%
Conversion 25%
Industries
Start-up 69%
Compensation At a worker cooperative, compensation is measured in terms of both wages and patronage. Patronage, the worker-owner’s portion of the profit, can make a significant difference in annual compensation.
Major industry concentrations remain primarily in retail trade; professional scientific, and technical services; as well as administrative, support, waste management, and remediation services. Retail Trade 16% Professional, Scientific, and Technical Services 16% Administrative / Support / Waste Management / Remediation 13% Manufacturing 11% Accomodation and Food Services 9% Construction 8% Health Care and Social Assistance 8% Transportation and Warehousing 6% All Other Industries 14%
ENTRY WAGES + PATRONAGE The entry level wage paid at all reporting worker cooperatives ranged from $8.50 / hour to $100 / hour, with many clustered around
$12 - $15 PER HOUR
PAY RATIO
Worker co-ops that distribute surplus as patronage to members have a wide distribution of payments from $700 to $1,960,000 to the collective membership, with a median total patronage of
$33,697 per year
RACE AND GENDER
The vast majority of worker cooperatives have maintained a
2 - to -1
top-bottom pay ratio or less.
The average large U.S. corporation has a CEO-to-worker pay ratio of 303-to-1. This ratio indicates that worker cooperatives are prioritizing the reduction of internal inequality over other compensation goals.
Latinx 45% White 39% Black 11% Other 5% Female 74% Male 23% Non-binary 3%
2017 had significantly more reported female workers, likely due to more home care, child care, and cleaning cooperatives reporting. Additionally, there was a large increase in non-binary reporting, from 43 to 102 workers.
This report is based on the participating 105 businesses, and only businesses that generated revenue and paid workers during FY2017 were included in the effort. For more information visit https://institute.coop/2017-worker-cooperative-state-sector-report.
Worker Cooperatives IN THE UNITED STATES a n d
d e m o c r at i c
8
Worker Cooperatives Across the U.S.
w o r k p l a c E S
450* known worker co-ops
6,734 Workers
$467,420,871 Gross revenue
+5 Seattle 5
6
+1 W2O Olympia W2O
12
10
-2 Portland
-1
W2O
-2
W2O
5
Bay Area
6
+2 San Jose
0
W2O
5
7
+2 Austin
+1 Cleveland
+4
Boston Worcester
W2O
55 +23 W2O New York
-5 Chicago
9 5
Net change over the last 5 years
W2O
15 +1 Springfield
Madison 5
Total Worker Co-ops
-1 7
+3 Boulder
11 +10 W2O Denver
17
Detroit
Minneapolis
12 55
+2 Portland
-1
W2O
Asheville 5
6
+2 Durham
8
+1
W2O
+6
W2O
Philadelphia
+1 Baltimore
Washington, D.C.
Indicates a Workers to Owners collaborator in this MSA, that focuses on conversions (businesses that transition from a traditional structure to employee ownership).Learn more at becomingemployeeowned.org
50
Puerto Rico*
Figures are based on metro statistical area
The typical worker co-op... Brings in a median revenue of $588,698
51 +15 W2O Rural U.S.
Top 15 States 77 +13 W2O California 67 +26 W2O New York 39 +5
W2O
Massachussetts
23 +9
W2O
Washington
19
W2O
Wisconsin
has a 3.7% profit margin
* Includes 394 worker cooperatives verified operational in 2017, a net +6 increase for 2018 (early count, not included in our survey), and 50 Puerto Rican worker cooperatives (also not included in our survey). ** Based on 2016 data, due to insufficient data reported in 2017.
Pays AN AVERAGE wage of $15.82**
0
18 +14 W2O Colorado 17 +3 16
W2O
Employs 9 workers
Rural AREAS
W2O
0
Vermont Oregon
13 +8
W2O
Maine
13 +6
W2O
Pennsylvania
12 +1
W2O
North Carolina
12 +2
W2O
Ohio
11
-1
W2O
Minnesota
8
+1
Maryland
8
+3
Texas