4 minute read
Rooibos tea production: a comparison between the Overberg and the Cederberg regions

by Vanessa Barends-Jones, vanessab@elsenburg.com
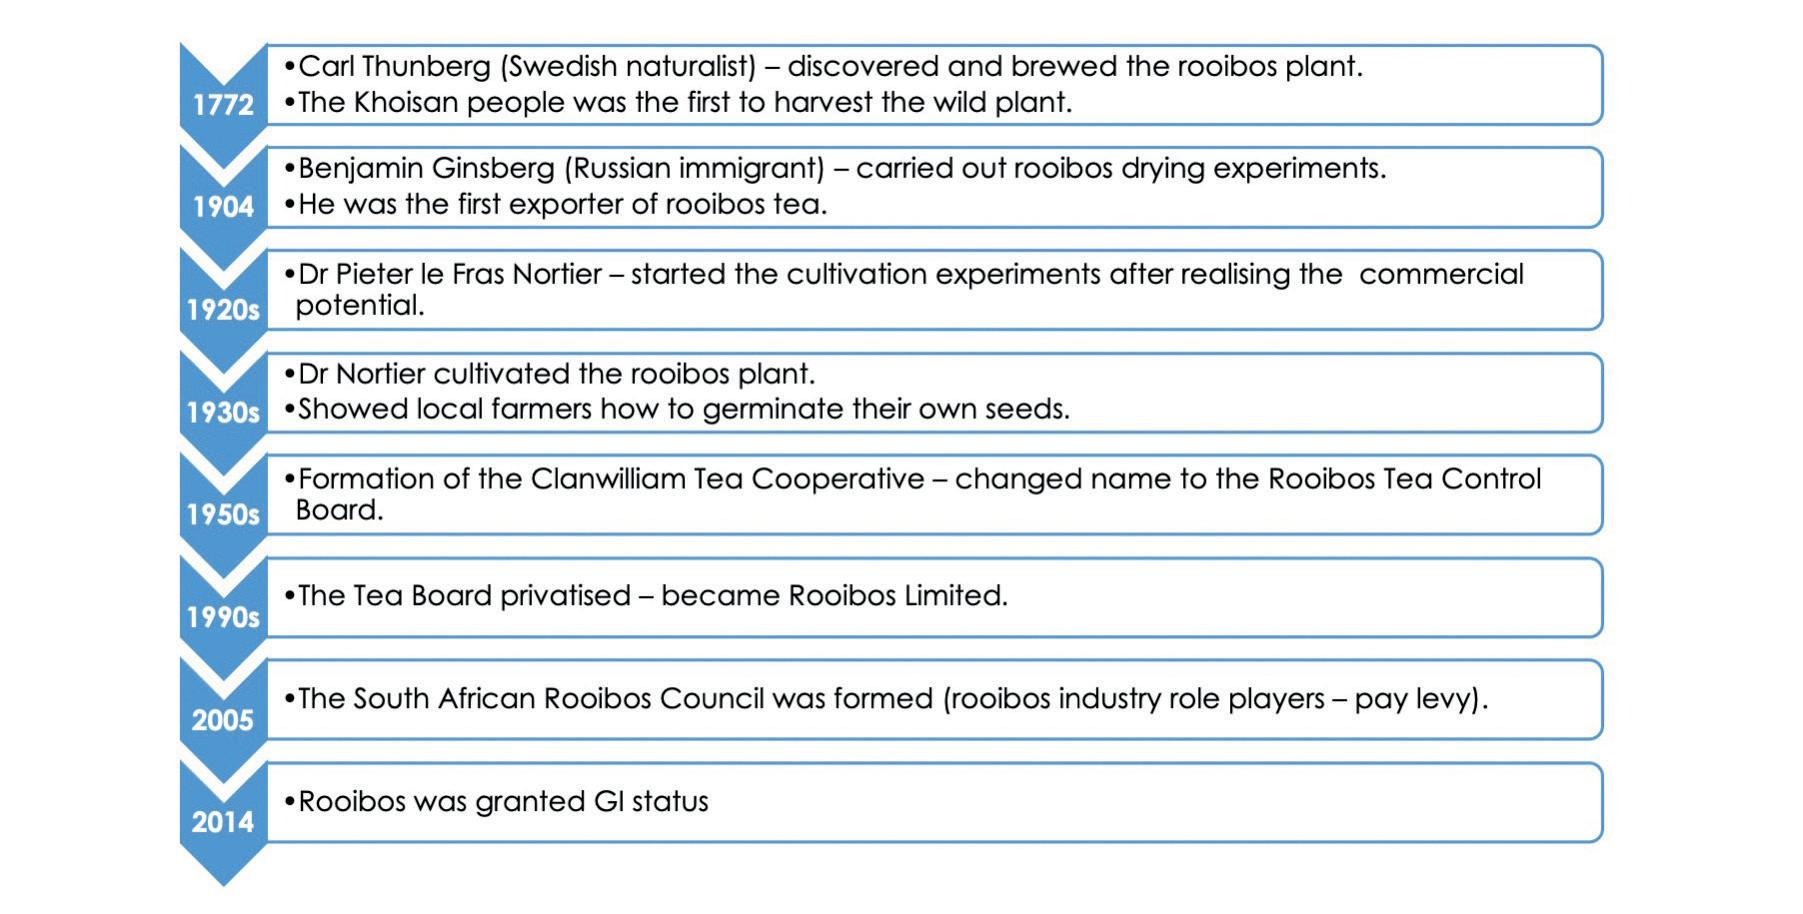
The South African rooibos tea industry has a history dating back to the 1600s and production is concentrated in the Cederberg region of the Western Cape, and some parts of the Northern Cape (Nieuwoudtville)(Tshitiza, 2019). The rooibos plant’s history and how its health properties were discovered are still under debate (DEA, 2014; Wynberg, 2016) and are summarised in Figure 1 below.
Advertisement
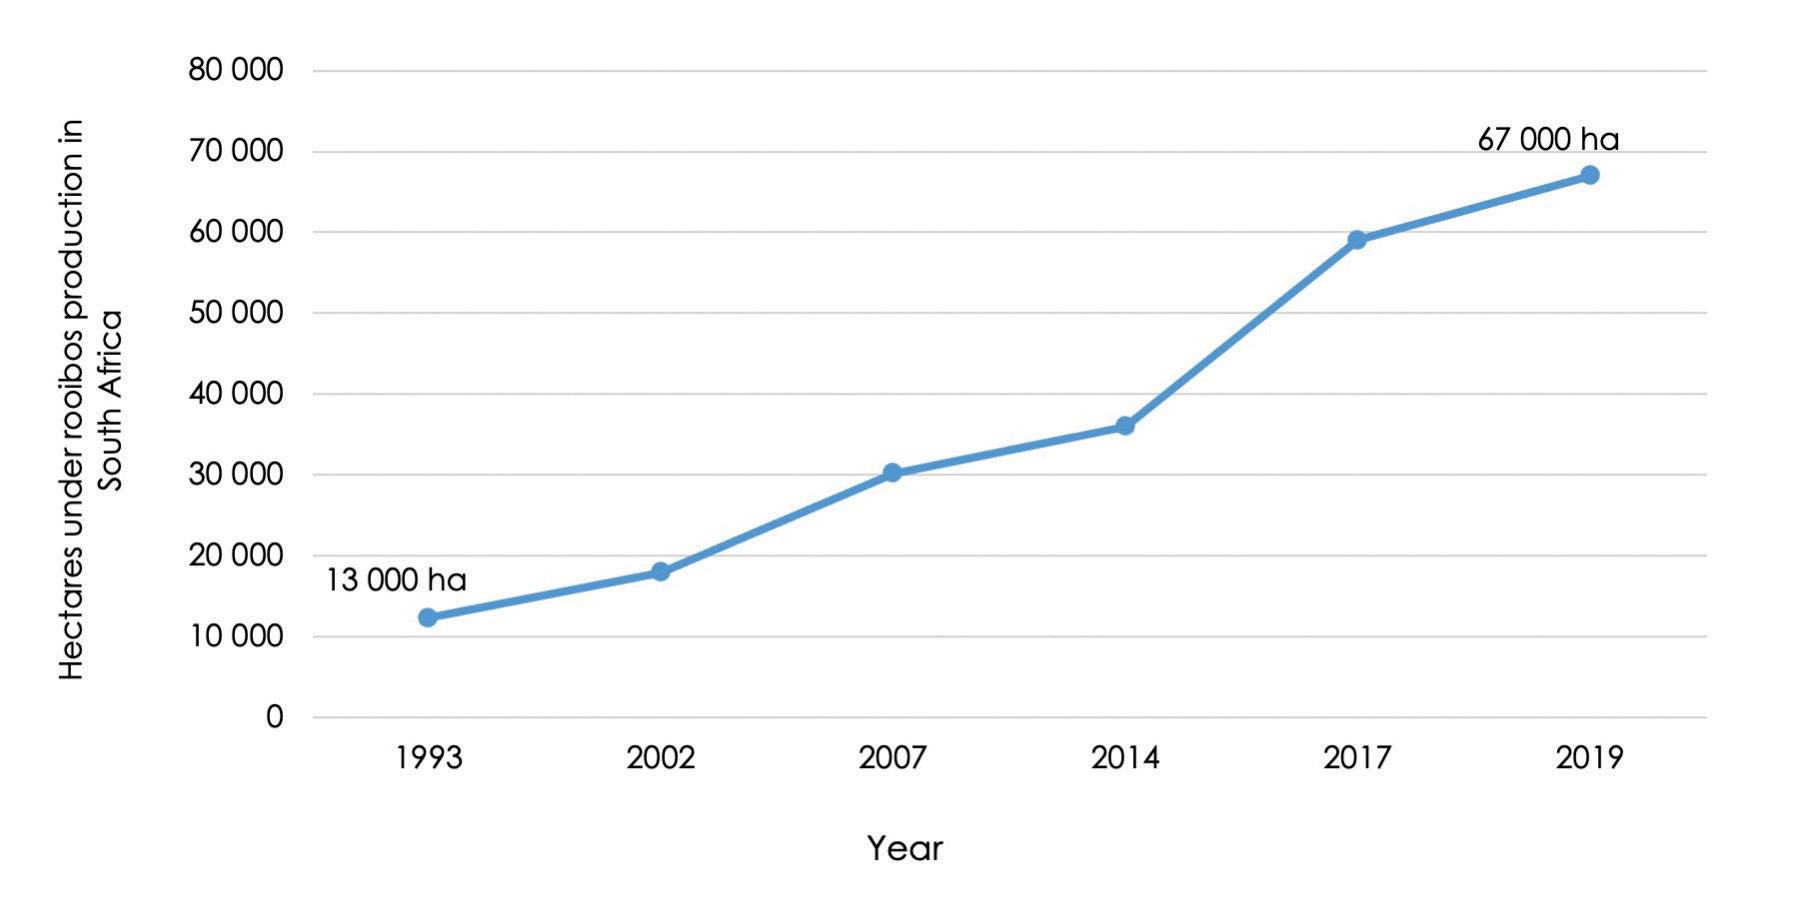
Rooibos tea demand is growing globally as evidenced by the hectares under rooibos production in South Africa. The area under production increased from 13 000 hectares in 1993 to more than 67 000 hectares in 2019 (Figure 2). The growing demand for rooibos tea is due to its health benefits (healthy beverage), being high in antioxidants, and its use in cosmetics.
With this increase in global demand comes the opportunity for expansion and job creation in the rooibos tea industry, especially in the Cederberg region, where the bulk of the tea originates from. Climaterelated impacts such as drought are already affecting this area. To counteract these
Source: Own compilation (2021)
Source: Central Statistical Service (1998); Stats SA (2010, 2005); WCDOA (2018) & Pretorius (2019)

Source: Wessels (2019); Wessels (2020)
Source: ITC (2020) realities and the associated risks, rooibos tea manufacturers are looking to expand production in other suitable areas. Figure 3 shows the rooibos-producing areas in the Western Cape. The Overberg is a suitable area for expansion, with about 682 hectares under rooibos production currently.
The South African rooibos industry is largely export-driven. According to Figure 4, export volumes increased from 721 tonnes in 2001 to 9 486 tonnes in 2019 (ITC, 2020).
Export values have increased from R201 million in 2021 to more than R936 million in 2019. The strong growth in the value of exported rooibos was driven by the significant increases in prices, especially when compared to the period before 2010. Figure 5 shows the export unit prices from 2001 to 2019. The rand value per tonne of rooibos exported in 2012 was R28 000/t, which increased to its peak in 2018 – R110 000/t. Prices dropped to around R98 000/t in 2019.

Potential reasons for this change are moving international markets, as most of the exported rooibos tea finds markets in Asia (Japan) and the European Union (EU)
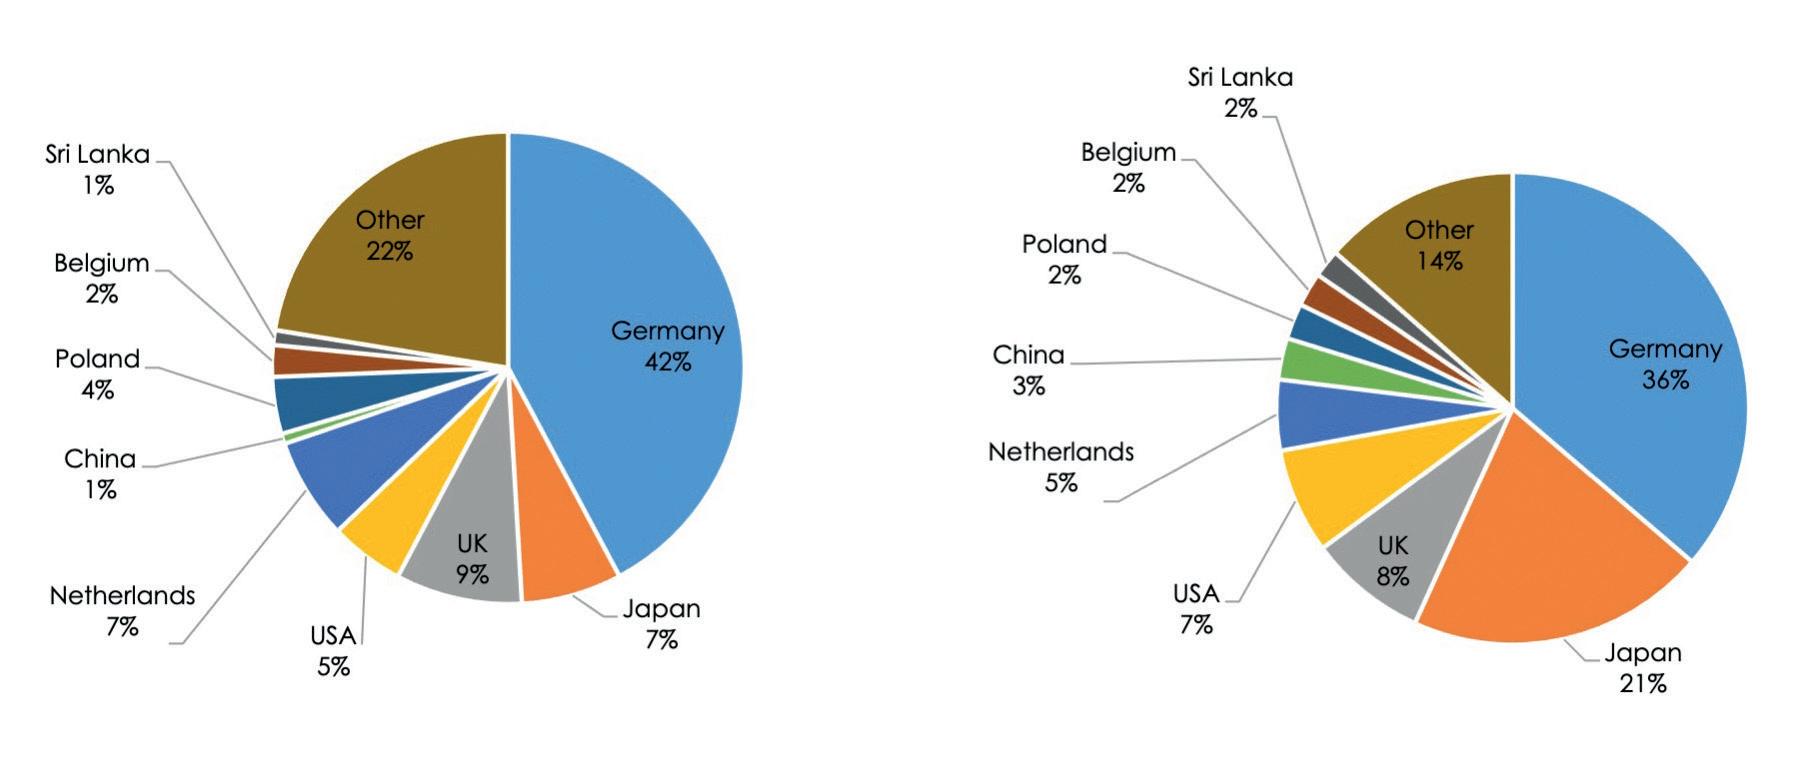
(Germany and the Netherlands). In the past, the EU was the frontrunner when it came to rooibos tea imports, but that picture is changing as Japan is taking the lead. Figure 6 gives a summary of the export destinations of South African rooibos tea for 2012 and 2019.
The top five destinations for rooibos tea in 2012 were Germany (42%), the United Kingdom (9%), the Netherlands (7%), Japan (7%), and the United States (5%). In 2019 the export destination picture changed slightly, with Germany remaining at the top but market share decreasing to 36%, followed by Japan (21%), the United Kingdom (8%), the United States (7%), and the Netherlands (5%) (SARS, 2020).
Looking at domestic markets, the price per kilogram of rooibos tea is slightly different for the local farmers who supply to the big tea companies. The prices farmers received for their tea were between R23,50/kg to R25/kg in 2020 compared to the maximum amount of R75/kg farmers received for their tea in the past (Genis, 2021). When comparing the Cederberg rooibos tea region with the new rooibos area, it is evident that the Overberg produces more yield
Source: ITC (2020)

Source: SARS (2020) per hectare than the Cederberg, which can be seen in Table 1. The Overberg produces double the amount of rooibos per hectare per year compared to the Cederberg. This may be due to the high soil carbon in the Overberg, but more research needs to be done to confirm higher production levels (Pretorius, 2019).
Table 1 shows both areas receiving the same average price of R50 per kilogram of rooibos for the different production years.
Prices and kilograms are based on the enterprise study that was done in 2019. Due to the absence of a drying/cutting facility in the Overberg, farmers are not receiving R50/kg because they sell the wet tea to the buyer. When drying and cutting costs (R3,50/kg) are deducted, farmers get R46,50/kg, or less. Though further research is needed, the information is gathered from enterprise budgets that were developed for both regions, looking at yield, income, and expenses. Table 2 gives a summary of the establishment costs.
Table 2 shows that it costs R5 767 more to establish one hectare of rooibos in the Overberg than in the Cederberg. The analysis and comparison provide distinct differences in the on-farm costings between the two regions. Labour in the Overberg is the first big cost difference when compared to the Cederberg. This is because the bulk of rooibos production in the Overberg is organic. Although the tea is grown organically, most of these farms do not have organic certification. Therefore, they cannot ask for certified prices. The second difference is the cost of planting material per hectare due to the import of seedlings from the Cederberg. A trial on one of the farms in the Overberg was conducted to start producing seedlings. Unfortunately, only 20% of the seeds germinated and could be used as seedlings (Van Schalkwyk personal communication, 2019).
Although the Overberg must still perfect the germinating process, the area shows potential for expansion. Figure 7 shows the potential areas.
It is clear that although 266 798 hectares are available, excluding the protected areas and the current 678 hectares under rooibos production, it still includes some urban and various agricultural production
Source: Lingani (2020); Own compilation (2020)
Source: Lingani (2020) areas. Excluding the last-mentioned areas, 168 354 hectares are available for rooibos production without environmental impact assessment (EIA) approval. The question, then, is whether expansion should occur without the drying and cutting facility in the Overberg. Only further research that focuses on the economic feasibility of such a facility in the Overberg, can give an answer to this. To read the full report, please contact Vanessa at vanessab@ elsenburg.com.

Source: Wessels (2020)
References
Central Statistical Service. 1998. Census of Agriculture, 1993 – Provincial Statistics, Western Cape Pretoria: Central Statistical.
Genis, A. 2021. Rooibosbedryf verwag weer groot oes. Landbouweekblad, Issue: 7–14 January.
Lingani, M. 2020, May 12. Rooibos tea Production Budgets – Cederberg & Overberg. Elsenburg, Western Cape, South Africa.
Pretorius, G. (2019). Organiese Boerdery Praktyke en Bestuur. Bredasdorp: Cape Natural.
Stats SA. 2005. Census of commercial agriculture 2002 – Financial and production statistics
Pretoria: Statistics South Africa.
Stats SA. 2010. Census of commercial agriculture, 2007 – Financial and production statistics
Pretoria: Statistics South Africa.
WCDOA. 2018. CapeFarmMapper. Retrieved from https://gis.elsenburg.com/apps/cfm/
Wessels, E. 2019. Rooibos Tea in the Cape Agulhas Area, WCDOA, Bredasdorp, South Africa.
Wessels, E. 2020. Suitability for Rooibos Tea Production. WCDOA, Bredasdorp, South Africa.
