5 minute read
The South African ostrich industry carbon footprint

by WCDOA pubs

by Vanessa Barends-Jones, vanessab@elsenburg.com
South Africa has implemented the Carbon Tax Act (No.15 of 2019) to encourage behaviour that will assist in the reduction of emissions, towards a low-carbon economy (South African Government, 2019). The agricultural sector was excluded in the first phase of the carbon tax regulations and will only be directly affected in Phase 2, which is expected to come into effect in 2023. The agricultural sector is already putting measures in place to measure carbon footprints1 at farm level, and monitoring these footprints to ensure more efficient farming to reduce carbon taxes. Disclosure of carbon emissions is increasingly becoming the norm. With consumers and retailers being more aware of their impact on the environment, there is increased demand to see products’ carbon footprint, which influences decisions to purchase (De Kock, 2018). It is within this context that the South African ostrich industry is seeking to understand its environmental footprint, how it compares to other industries and what carbon reduction opportunities there are. To conduct a carbon footprint for an industry, it is important to understand the whole value chain and all its operations. A comprehensive study was done for the ostrich industry for the 2018/19 period.
Advertisement
The South African ostrich industry produces approximately 70% of the world’s ostrich products, including by-products (Brand & Jordaan, 2011). The industry is export-driven, and exports are the main source of income (Barends-Jones & Pienaar, 2020). The geographical spread of suitable growing regions are limited to the Western Cape (73%), the Eastern Cape, Limpopo and the Free State (StatsSA, 2020). The industry faced many difficulties including avian influenza (AI), a three-year drought and the closure of the European market. These caused volatilities for the industry, especially in January 2018 when the European Union (EU) banned South Africa from exporting ostrich and other game meat as a result of the National Department of Agriculture, Forestry and Fisheries’ (DAFF) residue testing procedures failing to meet EU requirements (DAFF, 2018).
Figure 1 highlights two peaks before the AI outbreaks in 2011 and 2017. These peaks illustrate an average market value for ostrich meat between R200 million and
R300 million. Heat-treated meat exports also grew with an average annual rate of 28% from 2012 to 2017. The effect of market closure in 2018 can be seen in Figure 1, showing a decline for meat and heat-treated meat exports. The ban was lifted in March 2019 and the ostrich industry can once again export heat-treated meat to the EU.
Figure 2 below summarises the process of production through the various stages of the bird’s life cycle and into the various product developments.
The production system of eggs within the value chain consists of several farms specialising in the reproduction of ostriches, both extensive and intensive, varying in camp sizes and management practices (WCDoA & SAOBC, 2010). The breeding season for ostriches starts around May and continues until January the following year, and this period is followed by a four-month resting period. On average, a female ostrich can produce around 30 eggs per year, but productivity can be higher (BarendsJones & Pienaar, 2020). Figure 2 also shows that the 25 000 breeder birds can produce around 500 000 eggs, of which approximately 325 000 eggs will hatch when using the standard hatchability rate of 65%. The other 35% (infertile eggs), are sold either for consumption or as empty shells that can be used as décor or souvenirs (Barends-Jones & Pienaar, 2020).
Figure 3 shows the value chain analysis for the industry and highlights the critical role the ostrich industry plays, including 5 500 jobs generated on-farm and in the value-adding facilities (Barends-Jones & Pienaar, 2020). Focusing on the valueadded part of the industry, Figure 3 shows that for the final products produced (meat, skins and leather, as well as feathers and feather products), the total value of these outputs were around R1,9 billion.
2 Enteric fermentation refers to the “natural part of the digestive process in ruminant animals. Microbes in the digestive tract, or rumen, decompose and ferment food, producing methane as a by-product” (Morris, Enteric fermentation, 2019).
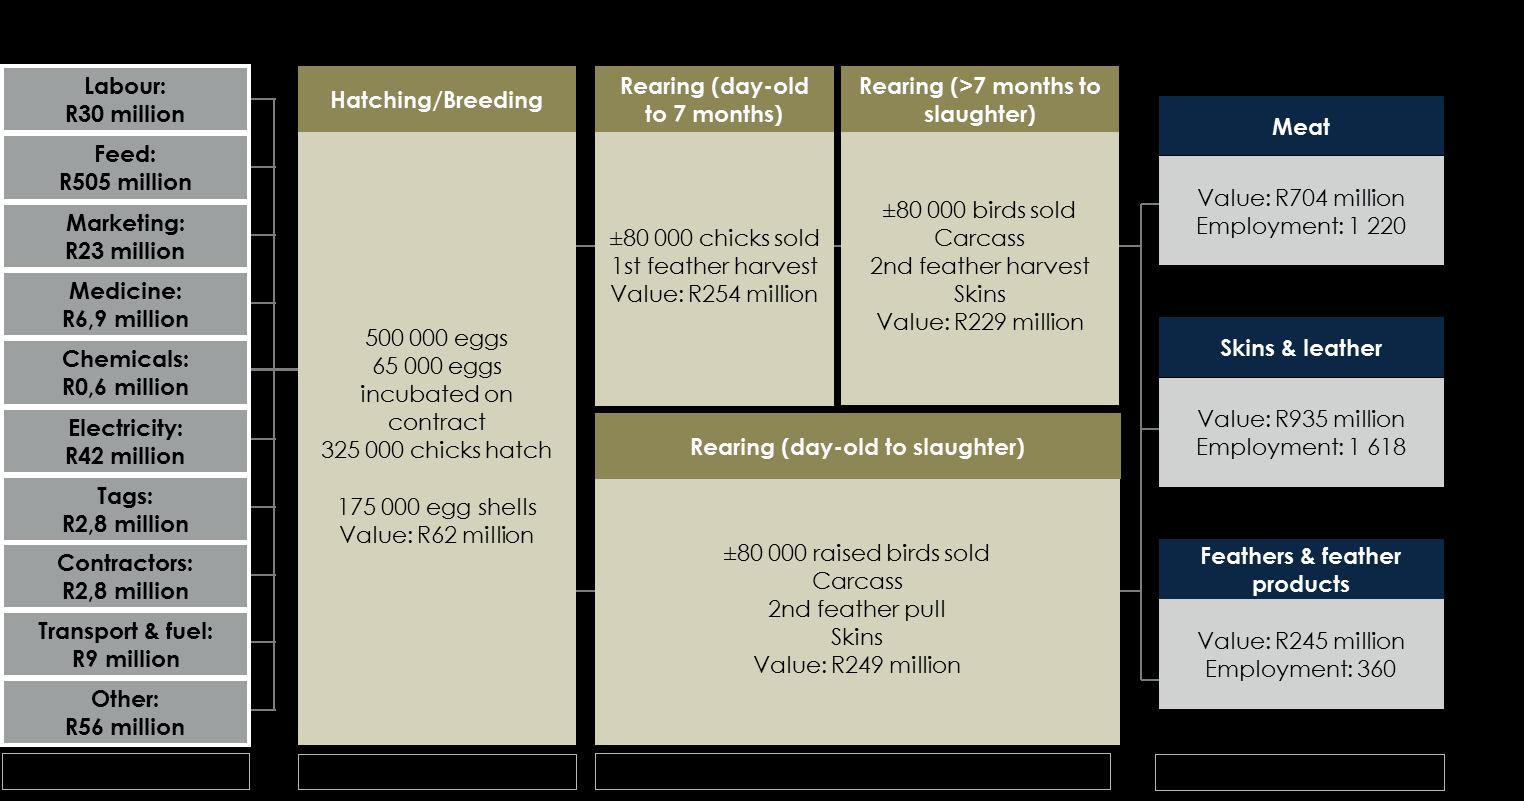
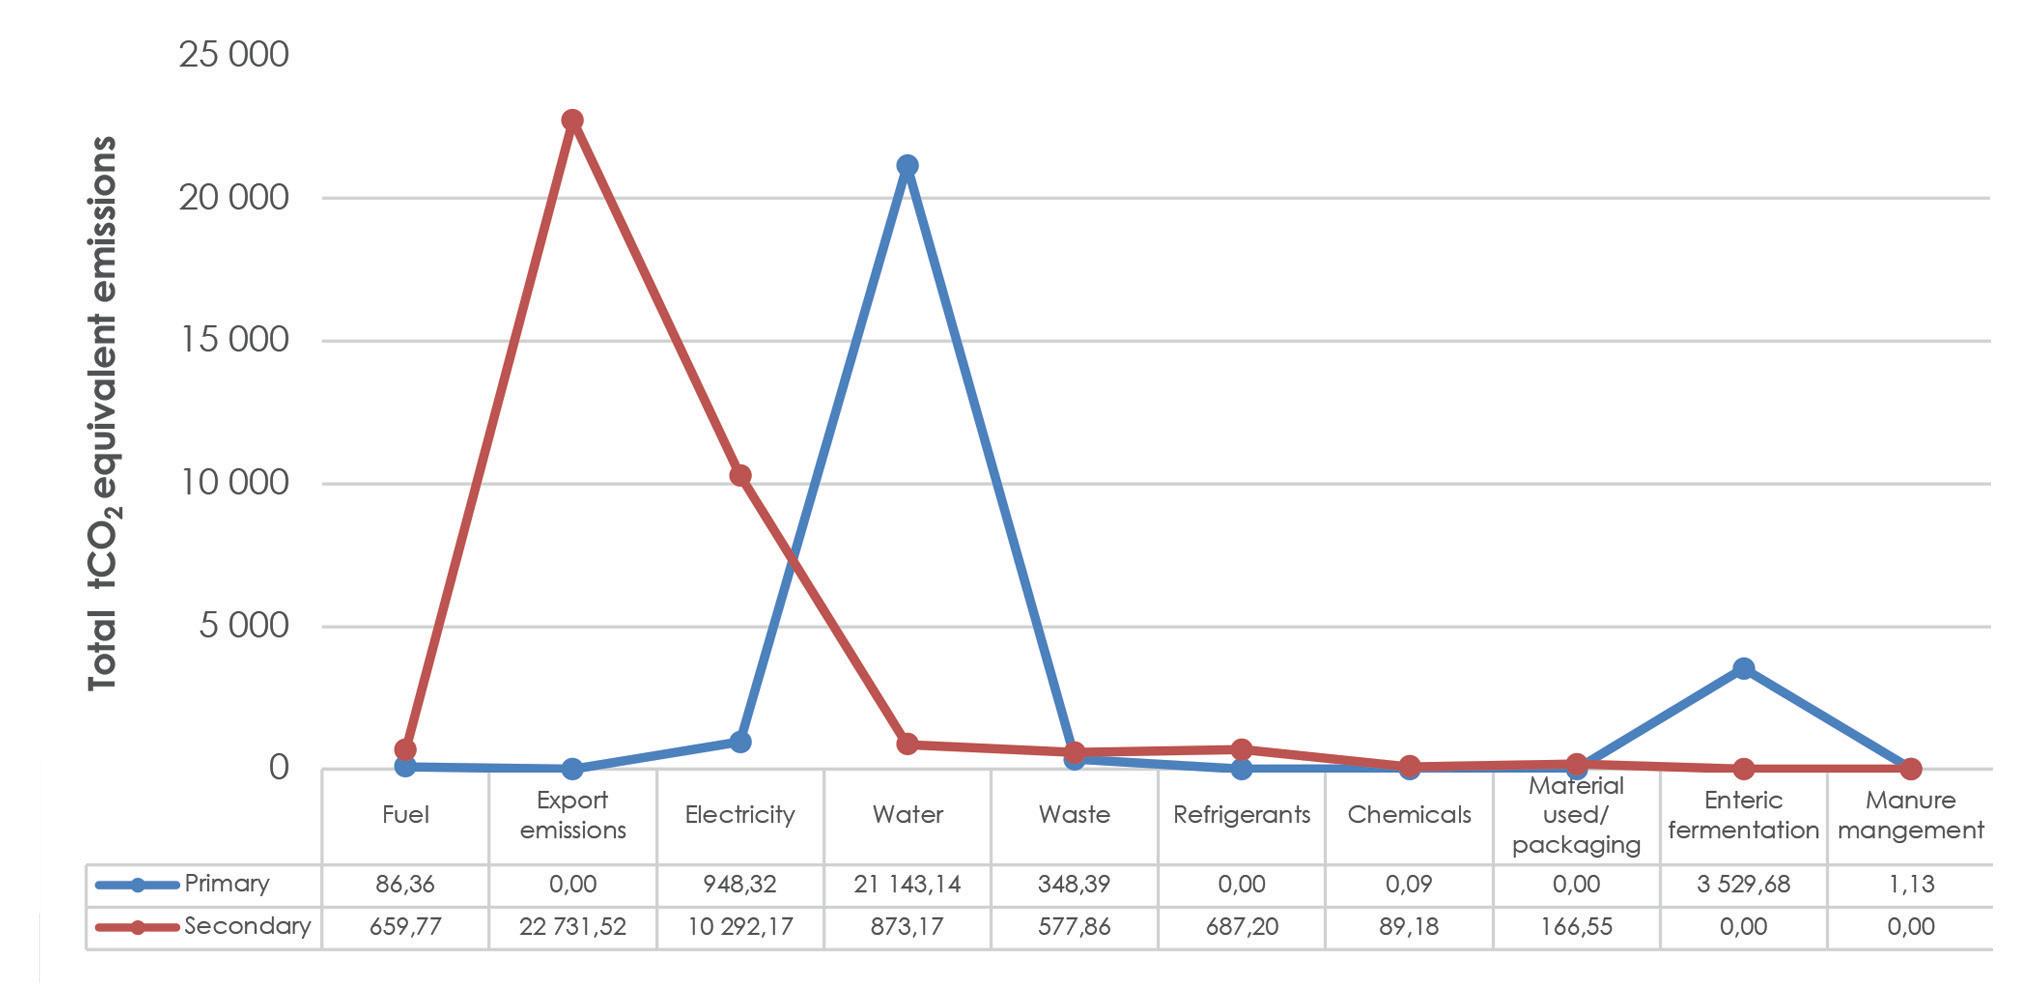
Figure 4 illustrates emissions of approximately 62 134,55 tonnes of carbon dioxide equivalent (tCO₂e) for the industry. Primary production (including activities like breeding, hatching and rearing), contributed 42% to total emissions compared to secondary production (including valueadding activities from leather, meat and feather production), which contributed 58% to total emissions.
Export emissions (22 731,52 tCO₂e) were the highest emitting activity for secondary production, followed by electricity (10 292,17 tCO₂e). Looking at the primary production curve, water (21 143,14 tCO₂e) and enteric fermentation 2 (3 529,68 tCO₂e) are the highest emitters. Enteric fermentation is minimal compared to export emissions, water, and electricity. When comparing the water and electricity categories for both primary and secondary production, it is clear that secondary production uses much more electricity units than primary production, whilst the inverse can be seen for water, with primary production using exponentially more water units.
The results from the full report show that ostrich production has an extremely low carbon footprint compared to cattle, dairy, sheep, and other livestock systems. A conservative estimate suggests that for every kilogram of ostrich meat produced, an average of 2,79 kg CO₂ equivalents are emitted. This estimate is much lower relative to the 20,44 kg for sheep, 15,44 kg for beef and 4,62 kg for pork. Ostrich meat was still 0,46 kg CO₂e more per kilogram of meat than chicken meat (2,33 kg of CO₂e). The main reason for this stems from the fact that ostriches are non-ruminant animals with comparatively low methane emissions, making it one of the most environmentally friendly meat categories available.
The results also confirm that the ostrich industry has close to zero waste since most by-products are used in the production process, with the major contributor to greenhouse gases coming from water use, electricity and export travel emissions. Exports are the main source of income, and the local market is not mature enough to support the industry. Therefore, it is better to focus on the “other hotspot emissions” that are easier to decrease. It will have a positive outcome on the financial side of the industry and, at the same time, the overall carbon footprint. These “other hotspot emissions” will lead to carbon reduction strategies that can focus on better energy use, a water recycling and cleaning system, and setting up a manure management system.
To read the full report, please contact Vanessa at vanessab@elsenburg.com
References
Barends-Jones, V., & Pienaar, L. 2020. The South African Ostrich Industry Footprint. Elsenburg: WCDOA.
Brand, T., & Jordaan, J. 2011. The contribution of the South African ostrich industry to the national economy. Applied Animal Husbandry & Rural Development:1-7.
Cucek, J., Klemes, J., & Kravanja, Z. 2015. Chapter 5: Overview of environmental footprints. (In Klemes, J., ed. Assessing and Measuring Environmental Impact and Sustainability. Elsevier Inc. p. 131-193).
DAFF. 2018. Notice of intention by the European Union to exclude South Africa from the annex of countries with approved residue monitoring plans for farmed animals and game. Department of Agriculture, Forestry and Fisheries. Pretoria: DAFF.
De Kock, L. 2018. Which carbon calculator to use for my farm or agri business? Confronting Climate Change (CCC) Initiative, Stellenbosch.
Morris, J. 2019. Enteric fermentation. Retrieved from Climate & Clean Air Coalition: https://www.ccacoalition.org/en/activity/enteric-fermentation.
Pandey, D., & Pandey, J. 2011. Carbon Footprint: Current methods of estimation. Environmental Monitoring and Assessment, 178(1-4), 135-160.
South African Government. 2019. Treasury on Gazetting of Carbon Offsets Regulations in terms of the Carbon Tax Act and related draft regulations for public comment. Retrieved from South African Government: https://www.gov.za/speeches/treasurygazetting-carbon-offsets-regulations-terms-carbon-tax-act-and-related-draft.
StatsSA. 2020. Census of Commercial Agriculture 2017: Finacial and production statistics. Pretoria: Statistics South Africa.
WCDOA. 2019. Ostrich Census Database. Elsenburg: Directorate Veterinary Services Western Cape Department of Agriculture.
WCDoA, & SAOBC. 2010. Volstruishandleiding. Western Cape Department of Agriculture & South African Ostrich Business Chamber, Oudthoorn.