Strategic Intervention Analysis At the 3 June 2026 Strategic Planning and Policy meeting, Waipā DC agreed to progress investigations of a new river crossing at four locations: •
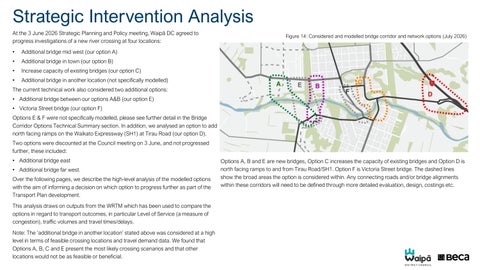
Additional bridge mid west (our option A)
•
Additional bridge in town (our option B)
•
Increase capacity of existing bridges (our option C)
•
Additional bridge in another location (not specifically modelled)
Figure 14: Considered and modelled bridge corridor and network options (July 2026)
The current technical work also considered two additional options: • Additional bridge between our options A&B (our option E) • Victoria Street bridge (our option F) Options E & F were not specifically modelled, please see further detail in the Bridge Corridor Options Technical Summary section. In addition, we analysed an option to add north facing ramps on the Waikato Expressway (SH1) at Tirau Road (our option D). Two options were discounted at the Council meeting on 3 June, and not progressed further, these included: • Additional bridge east • Additional bridge far west. Over the following pages, we describe the high-level analysis of the modelled options with the aim of informing a decision on which option to progress further as part of the Transport Plan development. This analysis draws on outputs from the WRTM which has been used to compare the options in regard to transport outcomes, in particular Level of Service (a measure of congestion), traffic volumes and travel times/delays. Note: The ‘additional bridge in another location’ stated above was considered at a high level in terms of feasible crossing locations and travel demand data. We found that Options A, B, C and E present the most likely crossing scenarios and that other locations would not be as feasible or beneficial.
Options A, B and E are new bridges, Option C increases the capacity of existing bridges and Option D is north facing ramps to and from Tirau Road/SH1. Option F is Victoria Street bridge. The dashed lines show the broad areas the option is considered within. Any connecting roads and/or bridge alignments within these corridors will need to be defined through more detailed evaluation, design, costings etc.
Do Minimum - movement constraints (2055) The map shows constraints in key areas on the strategic network as indicated by WRTM outputs for the 2055 do minimum scenario (no additional bridge). This is for comparison purposes only (compared with option findings shown in the following pages).
Figure 15: 2055 Do Minimum Constrained areas.
‘Low’ considers the road is within capacity. ‘Medium’ and ‘High’ indicates congestion/delays and volumes are exceeding capacity. This reflects average conditions during weekday evening periods, i.e. it is not the ‘peak’ conditions. The high level of delay at the intersection of Cambridge Road (north), Hooker and Racecourse Road is caused by delay on the adjoining roads (Hooker and Racecourse). Cambridge Road (north) has a low level of delay. Norfolk Drive intersection with Victoria Street north shows a high level of delay. The Hamilton Road and Victoria Street (south) intersection is at capacity. Other corridors including Cambridge Road (north), Shakespeare Street Bridge and Thornton Road are near capacity. The constrained areas are where we expect most congestion would be experienced with the level of delay to road users increasing between the Low, Medium and High bands.
Legend Constrained areas Low Medium High
Option A - movement constraints (2055) The map displays key metrics for Option A – an additional bridge in the Mid-West area.
Figure 16: 2055 Option A Constrained Areas.
The additional bridge reduces traffic volumes in the town centre area and increases traffic on Cambridge Road north. The additional bridge attracts around 30% of the total bridge crossing demand. When Option A is compared to the Do minimum, Cambridge Road (north) level of delay worsens. This may indicate that some intersection upgrades would be required to support this option. The Cambridge Road north intersections with Hooker, Racecourse, Hanlin and Forrest Road performance worsens with a higher level of delay. Hamilton Road, Victoria Street and Thornton Road delay improves to low (yellow).
Note: • ‘Low’ considers the road is within capacity. ‘Medium’ and ‘High’ indicates congestion / delays and volumes are exceeding capacity. This reflects average conditions during weekday morning and evening periods, i.e. it is not the ‘peak’ conditions.
Legend Constrained areas Low Medium High
Option B - movement constraints (2055) The map displays key metrics for Option B.
Figure 17: 2055 Option B Constrained Areas.
The additional bridge in the In-town area, west of Victoria Street bridge, also releases pressure from the town centre, and increases traffic onto Cambridge Road (north) as consistent with Option A. The pressure on Cambridge Road (north) is extended to the intersection of the additional bridge. The additional bridge attracts around 40% of the total crossing demand. This is higher than Option A, likely due to the more central location of the crossing. Option B as a network performs slightly better than Option A due to the closer location to the town centre providing a more direct route to Victoria Street and Cambridge Road (north), schools, and destinations within the town centre. Cambridge Road north’s intersections with Hanlin Road and Forrest Road reduces the level of delay when compared to Option A. This means Option B alleviates pressure on Cambridge Road (north) compared to Option A.
Note: • ‘Low’ considers the road is within capacity. ‘Medium’ and ‘High’ indicates congestion / delays and volumes are exceeding capacity. This reflects average conditions during weekday morning and evening periods, i.e. it is not the ‘peak’ conditions.
Legend Constrained areas Low Medium High
Option C - movement constraints (2055) The map displays areas of constraint for Option C – increasing capacity of Fergusson Bridge (Shakespeare Street) and relevant corridors including Karāpiro Stream bridge (Achilles Avenue). Increasing capacity could be widening or an alternative such as three lane tidal flow.
Figure 18: 2055 Option C Constrained Areas.
Based on the model outputs, increasing capacity on Fergusson Bridge (Shakespeare Street) and the surrounding existing roads does little to alleviate pressure on the town centre and remains similar to the do minimum scenario. This Option did not significantly change constrained areas on the existing bridges Achilles Avenue and Albert Street has no delay compared to the do minimum scenario and the intersection with Duke Street performs better as well. Traffic volumes on Queen Street and Shakespeare Street Bridge increase in Option C due to the increased capacity. Note: • ‘Low’ considers the road is within capacity. ‘Medium’ and ‘High’ indicates congestion / delays and volumes are exceeding capacity. This reflects average conditions during weekday morning and evening periods, i.e. it is not the ‘peak’ conditions.
Legend Constrained areas Low Medium High
Option D - Findings (2055) Transport modelling of Option D indicates that very few vehicles would use north facing ramps at Tirau Road/SH1. The model predicts trip distribution based on distance and the speed that vehicles can travel, taking congestion/delays into account at different times of the day. The modelling indicates that even with higher speeds and less congestion on the expressway route (Figure 19) the majority of trips would take Victoria Road rather than use the new ramps at Tirau Road with a longer trip. Additionally, existing vehicle movement data indicates that around 30% of trips from Leamington in the morning travel north of SH1 i.e. toward Hamilton or Hautapu. This is the potential user base for north facing ramps at Tirau Road, which is quite low. A high penalty (traffic calming, speed humps etc) would need to be applied on Victoria Road to encourage traffic to use the expressway alternative. Even with this, the number of users is not likely to be significant enough to encourage NZTA to consider adding new on ramps to the expressway. Generally, motorway on ramps are seen as impacting the movement of vehicles along the expressway, which is the primary purpose of a high movement corridor such as State Highway 1. As motorway ramps are owned by NZTA not Council, any decision to progress planning for ramps in future would need to be made by NZTA. Note: • Figure 20 - ‘Low’ considers the road is within capacity. ‘Medium’ and ‘High’ indicates congestion / delays and volumes are exceeding capacity. This reflects average conditions during weekday morning and evening periods, i.e. it is not the ‘peak’ conditions.
Figure 20: Option D shows no difference in the locations of constraint compared with the do minimum
Figure 19: Distance and speed limit comparison for Option D
Other Metrics
Figure 21: Network Statistics
Other metrics from the analysis include network-wide travel times and speeds. Lower travel times indicate less congestion /delay on the network as a whole. The graphs here present the findings for the do minimum, Option A, Option B, Option C and Option D. Both Options A and B reduce travel times and increase network speeds compared to the Do Minimum. Option C and D do not predict significant benefits. Options A and B are very close in terms of these metrics. Buses, Walking and Cycling The prior analysis is focused on traffic movements and this is influenced by the WRTM as mentioned previously. It is important to note benefits for other modes which assumes any new bridge will accommodate buses and have suitable walking and cycling facilities. From a transport perspective and at a high level, a crossing more central to town, Option B, is likely to be more suited to providing for movement of buses, cycles and pedestrians than Option A. Option C does not improve options for bus routing, or improve accessibility for walking and cycling.
Conclusions from the network operation analysis The high-level network analysis undertaken for this review stage indicates that traffic volumes will continue to increase as planned urban growth in Cambridge eventuates. An additional bridge will help to reduce congestion/delay and distribute traffic across the network. A bridge in the area of Option A or B appears to have similar benefits/impacts in regard to transport outcomes. Option B may be slightly better in terms of multimodal transport options. The Transport Plan will take this further in terms of defining the corridor location and evaluating the benefits/ costs and consenting risks etc in more detail.
Do minimum Option A Option B Option C Option D
Section 3: Bridge Corridor Options Technical Summary
Future Bridge Corridors - Assessment Corridor Assessment • Five potential bridge corridors were considered with three selected for further assessment through transport modelling. • North facing ramps at Tirau Road connecting to SH1 were also identified for transport modelling due to possible associated impacts and to provide consistent information across options (this is Option D on other maps). • These ‘bridge corridors’ identify the general vicinity within which a future bridge, or upgrade to an existing bridge, could potentially occur. • The assessment focuses on the broad corridors rather than a specific road alignment, recognising that wider network impacts would be broadly comparable for different connections within the same corridor. Phase 1 Modelling • Transport modelling requires identification of specific road connections, to test potential options and understand wider network performance and impacts. • The road connections selected were for transport modelling purposes only and do not represent preferred or proposed future routes. • The modelling provides an indication of the potential network effects within each corridor, rather than determining a specific future alignment. • Any future bridge corridor would be subject to further investigation, consultation, planning, environmental assessment, funding decisions, and statutory approvals before any decisions are made.
Figure 22: Bridge Corridor Options Modelled (July 2026) A. Future Mid-West B. Future In-Town C. Additional Capacity at Fergusson Bridge (Shakespeare St) and Karāpiro Stream Bridge (Achilles Avenue) Considered but not modelled E. Future corridor (in between options A&B) F: Victoria Street Bridge
Bridge Corridor Options A,B&C – High-level overview The below provides a high-level summary of the potential advantages and disadvantages, associated with each corridor option. Option
Advantages
Disadvantages
Option A Additional bridge Mid-west corridor
• Connects to existing and planned future growth areas. • Limited impact on established residential neighbourhoods. • Provides an alternative for heavy vehicles accessing Hautapu and SH1, reducing the need to travel through the town centre. • Opportunity to support future urban expansion and connectivity. • Improves network resilience. • Will reduce through traffic travelling via the town centre. • Greater opportunity to integrate with future transport corridors, bus and cycling, walking and micromobility.
• Significant investment required (as per MCA). • Requires significant new transport connections and supporting infrastructure. • Provides less direct access to the town centre and key destinations with some trips needing to travel back into the town centre. • The benefits of this investment are strongly linked to the timing and extent of future growth in the western area. • Possible impacts on new development underway in this area.
Option B Additional bridge In-town corridor
• Closer connection to the town centre (than Option A), providing access to existing shopping, businesses, schools and community facilities. This advantage is based on current destinations; noting new destinations may emerge in other areas over the 30-year planning period, which could change travel patterns and demand. • Provides greater opportunities to support public transport connections, as well as some benefits for cycling, walking and micromobility. • Potential to improve accessibility to existing destinations. • Could connect to existing roads, potentially reducing the need for new local connections. • Improves network resilience.
• • • •
Option C Additional capacity Fergusson Bridge (Shakespeare St) and Karāpiro Stream Bridge (Achilles Avenue)
• Builds on an existing transport corridor. • Supports the strategic movement function of the existing roads, including increased throughput and accommodating through traffic and heavy vehicles. • Probable lower indicative capital cost than a new bridge. • Increases crossing capacity in the same location without creating a new river crossing. • May minimise environmental effects compared with a new bridge. • Supports staged implementation over time.
• Significant investment required (as per MCA). • Continues to concentrate traffic on the existing corridor. • Requires significant upgrades to connecting intersections and roads including Karāpiro Stream Bridge (Achilles Avenue). • Potential impacts on adjacent properties and businesses during construction. • Limited ability to improve broader network connectivity and redistribute travel demand. • Limited opportunity to improve walking, cycling and micromobility (noting steep gradient with Queen Street).
Significant investment required (as per MCA). Requires significant new transport connections and supporting infrastructure. Major impact on existing residential areas. Impacts on existing network improvements that have been implemented to support a local street function, rather than a higher movement and throughput function. • Historic buildings and constrained corridors may limit upgrades. • Greater construction disruption within the town.
Bridge Corridor Options D,E&F – High-level overview The below provides a high-level summary of the potential advantages and disadvantages, associated with each corridor option. Option
Advantages
Disadvantages
Option E Additional bridge corridor between Options A&B
• • • •
• Significant investment required (as per MCA). • Requires significant new transport connections and supporting infrastructure. • Major impact on existing residential areas if located within the town centre fringe. • Could impact areas of natural springs and restoration, depending on the final alignment, i.e., Te Puna Marama – Moon Spring & Resthaven. • Could impact existing network improvements that have been implemented to support a local street function, rather than a higher movement and throughput function.
Option F Victoria Street Bridge change of function Change of function could only occur alongside additional capacity i.e. new bridge or expansion of other existing.
• Supports Victoria Street's future role within the town centre as a priority place function. • Reduces through-traffic within the Cambridge town centre. • Creates opportunities to improve walking, cycling and micromobility. • Improves safety through reduction in traffic and people conflicts. • Enhance the vibrancy of the town centre due to less through traffic and transport emissions. • Can be implemented incrementally and adjusted over time.
• • • • •
• Improves access to/from SH1 for northbound traffic travelling to Hamilton and Auckland. • Could improve network resilience by providing an additional access point to SH1 during incidents or closures elsewhere. • Could improve freight and regional connectivity for some trips.
• Transport modelling indicates relatively low forecast traffic demand, suggesting limited utilisation, although actual future demand may be slightly higher. • High capital cost relative to the number of users and transport benefits achieved. • Limited reduction in traffic on existing local roads or river crossings.
Option could include: - Decrease capacity - Possible one way system or tidal flow - Prioritise people movement over vehicles. Option D Tirau Road - north facing ramps to SH1 (Not bridge corridor option but significant network option also assessed)
Balances access to growth areas and the town centre. May distribute traffic more evenly across the network. Potential to reduce impacts compared with an in-town bridge. Improves network resilience.
May increase traffic on alternative routes and bridge crossings. Could increase travel times for some vehicle trips. May affect some access for businesses, residents and freight. Requires complementary network improvements to operate effectively. May face community and stakeholder opposition due to changes in access and travel patterns.
Future Bridge Corridor - Technical scope A technical assessment is planned to support decisions on the designation for a future bridge corridor to inform the 2027–2037 Long Term Plan. Scope Develop a high-level implementation plan for protecting a preferred future bridge corridor, including: •
the statutory pathway required to secure a designation;
•
a high-level outline of the technical investigations and approvals required;
•
preliminary on-site investigations to inform the preparation of the implementation plan and identify key site constraints, opportunities and risks;
•
indicative property acquisition requirements and the indicative scale of acquisition, including high level costs and risks;
•
the wider transport network impacts, including what improvements may be required upstream and downstream of the bridge, and the indicative scale of investment and delivery;
•
a high-level programme, risks and key decision points; and
•
an indicative three-year budget to inform the 2027–2037 Long Term Plan.
Technical Appendices
Volume Maps – Option A (2055) Figure 23: Traffic volume plots from WRTM Option A
These maps show relative traffic volumes using the thickness of the blue lines. Thicker lines indicate roads carrying higher traffic volumes than thinner lines. The red circle highlights the roading connection used within WRTM for modelling purposes only and do not represent preferred or proposed future routes. The maps are intended for comparison purposes only. They show how traffic volumes change between the options as vehicles are rerouted when the strategic interventions are applied. This diagram shows that Option A attracts some traffic onto the additional bridge, although less than Option B, as shown on the following page. The additional traffic using the bridge also increases traffic volumes on Cambridge Road (north) and Hamilton Road. The road alignments shown are for modelling purposes only. A connection to the bridge is required in the model to assess how traffic would move through the network; however, the actual road corridor alignment for the options has not yet been determined.
Volume Maps – Option B (2055) Figure 24: Traffic volume plots from WRTM Option B
These maps show relative traffic volumes using the thickness of the blue lines. Thicker lines indicate roads carrying higher traffic volumes than thinner lines. The red circle highlights the roading connection used within WRTM for modelling purposes only and do not represent preferred or proposed future routes. The maps are intended for comparison purposes only. They show how traffic volumes change between the options as vehicles are rerouted when the strategic interventions are applied. This diagram shows that the bridge in Option B attracts some traffic, with this traffic then flowing onto Cambridge Road (north) and Hamilton Road. The road alignments shown are for modelling purposes only. A connection to the bridge is required in the model to assess how traffic would move through the network; however, the actual road corridor alignment for the options has not yet been determined.
Volume Maps – Option C (2055) These maps show relative traffic volumes using the thickness of the blue lines. Thicker lines indicate roads carrying higher traffic volumes than thinner lines. The red circle highlights the existing roading connection used within WRTM for modelling purposes only. The maps are intended for comparison purposes only. They show how traffic volumes change between the options as vehicles are rerouted when the strategic interventions are applied. This diagram shows that the bridge in Option C leads to higher traffic volumes on the Fergusson Bridge (Shakespeare Street), Archilles Avenue / Albert Street.
Figure 25: Traffic volume plots from WRTM Option C
Volume Maps – Option D (2055) These maps show relative traffic volumes using the thickness of the blue lines. Thicker lines indicate roads carrying higher traffic volumes than thinner lines. The red circle highlights the existing roading connection used within WRTM for modelling purposes only. The maps are intended for comparison purposes only. They show how traffic volumes change between the options as vehicles are rerouted when the strategic interventions are applied. This diagram shows Option D does not make any notable differences in terms of traffic volumes with the ramps on Tirau Road / SH1. The ramps are depicted by thin blue lines which indicates a low level of use.
Figure 26: Traffic volume plots from WRTM Option D
Option A: Mid-west (2055) The map displays key metrics for Option A – an additional bridge in the Mid-west area. This is for comparison purposes only.
Figure 28: 2055 Option A LOS results and change in traffic volume compared to Do Minimum.
The additional bridge reduces traffic volumes in the town centre area (as shown by the decreasing arrows) and increases traffic on Cambridge Road (which results in LOS impacts). The additional bridge attracts around 30% of the total bridge crossing demand. When Option A is compared to the Do minimum, Cambridge Road (north) LOS changes from LOS D to E. This may indicate that some intersection upgrades would be required to support this option. The Cambridge Road (north) intersections with Hooker, Racecourse, Hanlin and Forrest Road perform at LOS F. Hamilton Road, Victoria Street and Thornton Road have improved from LOS E to D. Notes: • the LOS indication is for a two-hour average weekday evening period (not peak conditions). • the modelling is based on the best available information and planning assumptions at this time, but is considered to underestimate future travel demand. As a result, the modelled levels of service shown on the maps are likely to be better than the levels of service that may occur in practice, with actual future network performance potentially being worse than indicated.
Traffic volume change against Do Min Increase
LOS D LOS E LOS F
Significant Decrease
Moderate
Low
Significant
Moderate
Low
Option B: In-town (2055) The map displays key metrics for Option B – an additional bridge in the In-town area. This is for comparison purposes only.
Figure 29: 2055 Option B LOS results and change in traffic volume compared to Do Minimum.
The additional in-town bridge, west of Victoria Street bridge, also releases pressure from the town centre (as shown by the decreasing arrows) and increases traffic onto Cambridge Road north as consistent with Option A. The pressure on Cambridge Road (north) is extended to the intersection of the additional bridge. The additional bridge attracts around 40% of the total crossing demand. This is higher than option 1 likely due to the more central location of the crossing. Option B as a network performs slightly better than Option A because the closer location to the town centre provides a more direct route to Victoria Street and Cambridge Road (north). Cambridge Road north’s intersections with Hanlin Road and Forrest Road reduce to LOS E instead of F when compared to Option A. And the westbound lane on Cambridge Road (north) reduces to a D instead of an F. This means Option B alleviates pressure on Cambridge Road (north) compared to Option A. See comparative ‘Notes section’ for this option, on page 44 Option A – Mid-west (2055).
LOS D LOS E LOS F
Traffic volume change against Do Min Increase
Significant Decrease
Moderate
Low
Significant
Moderate
Low
Option C: Existing bridges (2055) The map displays key metrics for Option C – increasing capacity of the Fergusson Bridge (Shakespeare Street) and corridor including Karāpiro Stream Bridge (Achilles Avenue). Increasing capacity could be widening or an alternative such as three lane tidal flow. This is for comparison purposes only.
Traffic volume change against Do Min Increase
Figure 30: 2055 Option C LOS results and change in traffic volume compared to Do Minimum.
Increasing capacity on Fergusson Bridge (Shakespeare Street) and the surrounding existing roads does little to alleviate pressure on the town centre and remains similar to the do minimum scenario.
No change
This option did not significantly change traffic volumes on the existing bridges. Achilles Avenue and Albert Street has no delay compared to the do minimum scenario and the intersection with Duke Street performs better as well (LOS D).
No change
Traffic volumes on Queen Street and Shakespeare Street Bridge increase in this option due to the increased capacity. See comparative ‘Notes section’ for this option, on page 44 Option A – Mid-west (2055).
LOS D LOS E LOS F
Significant Decrease
Moderate
Low
Significant
Moderate
Low