
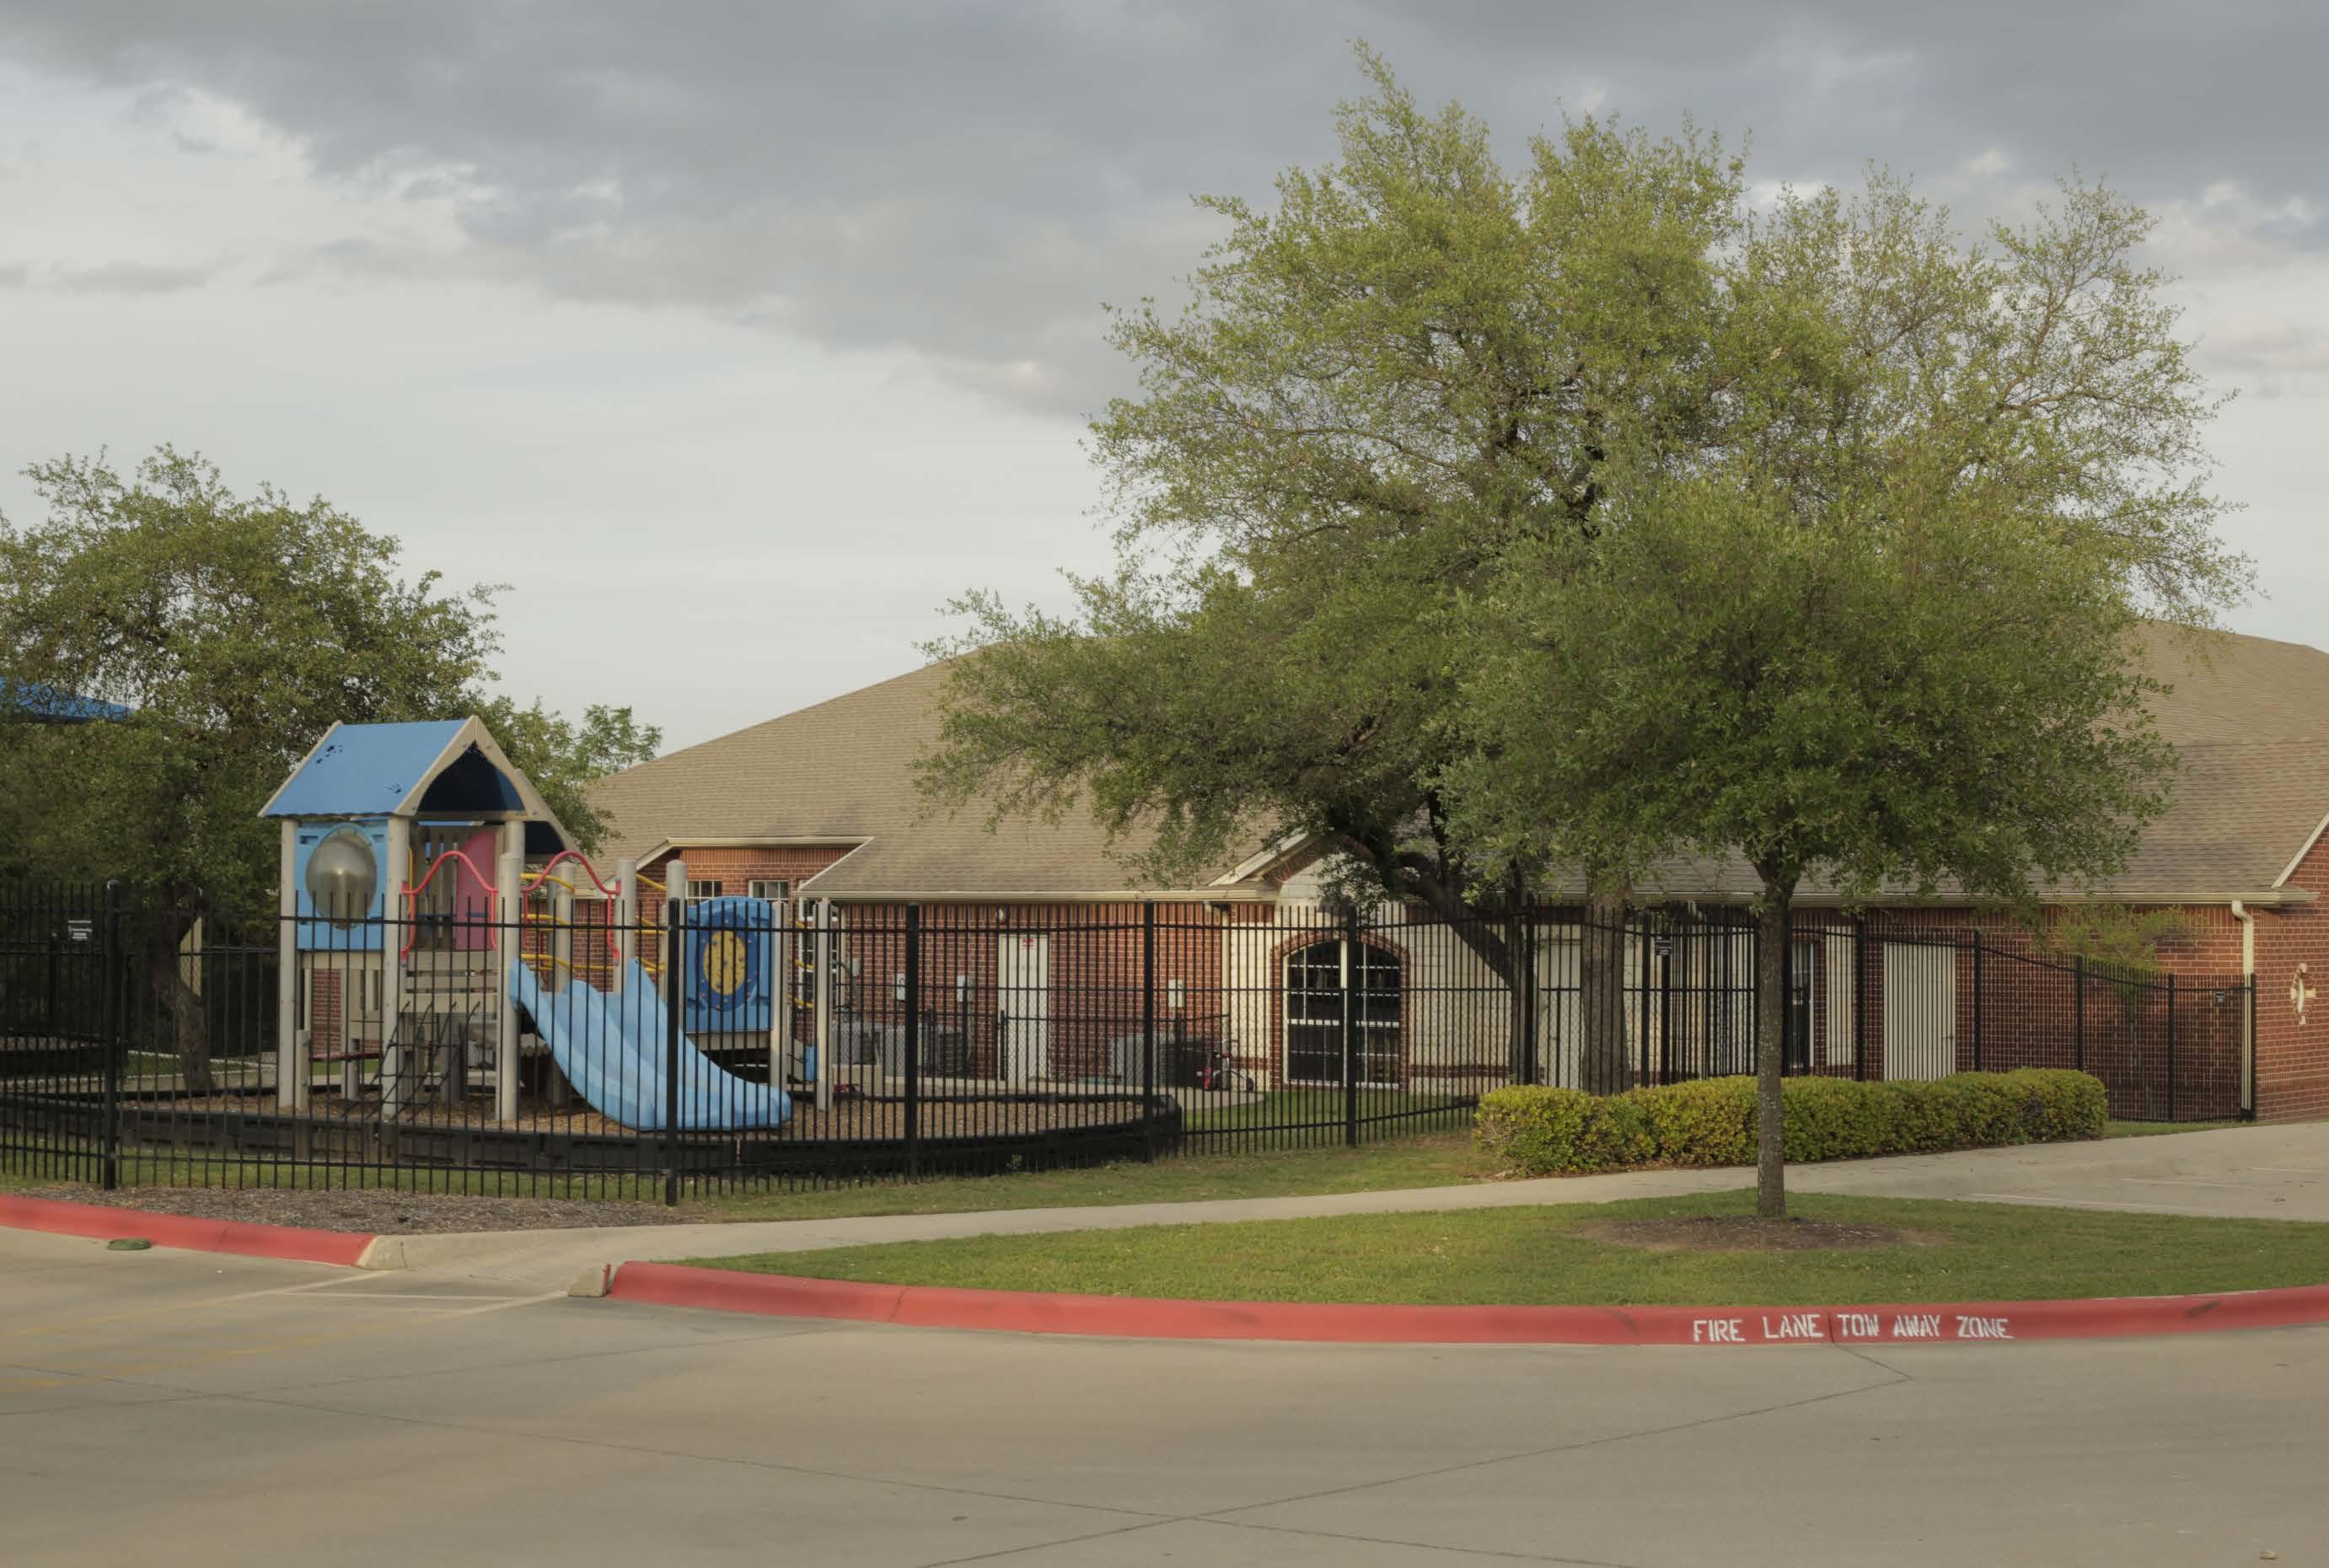

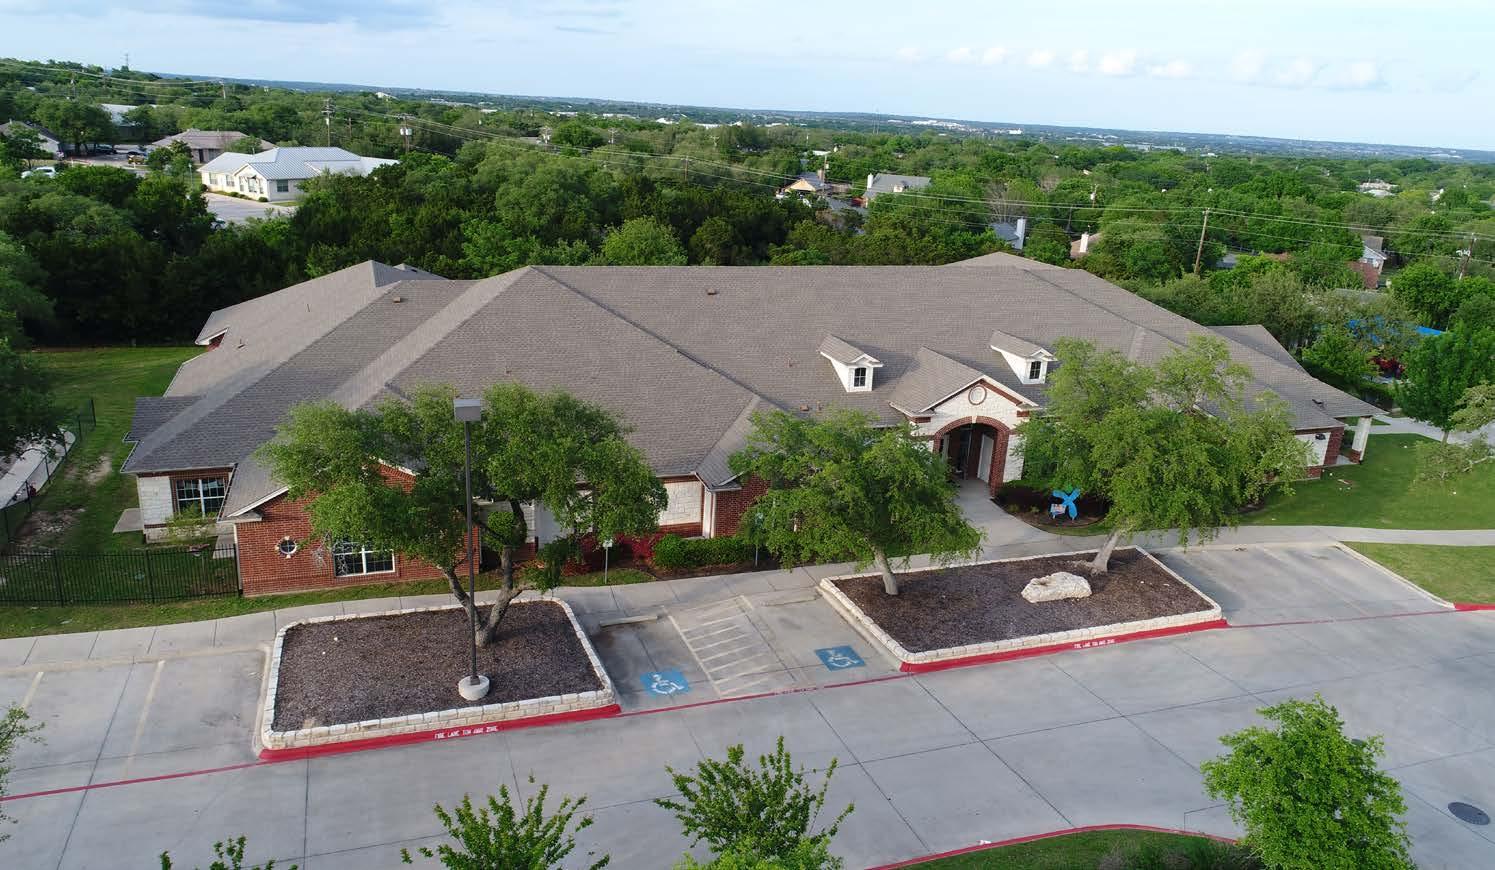
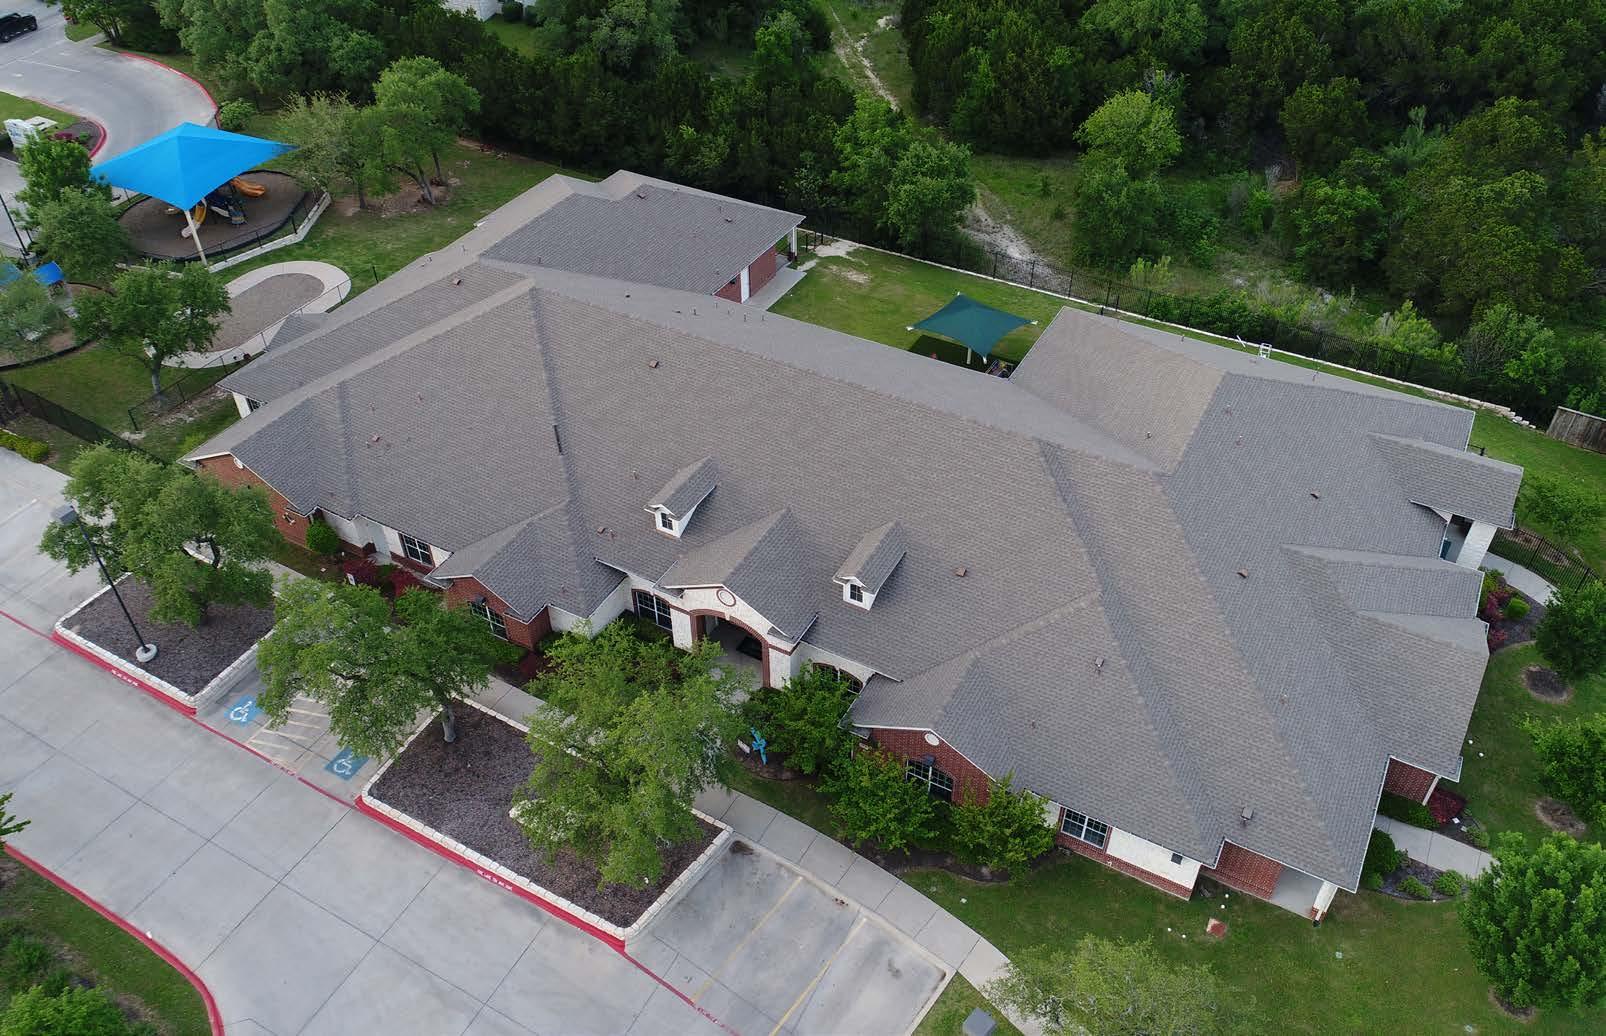
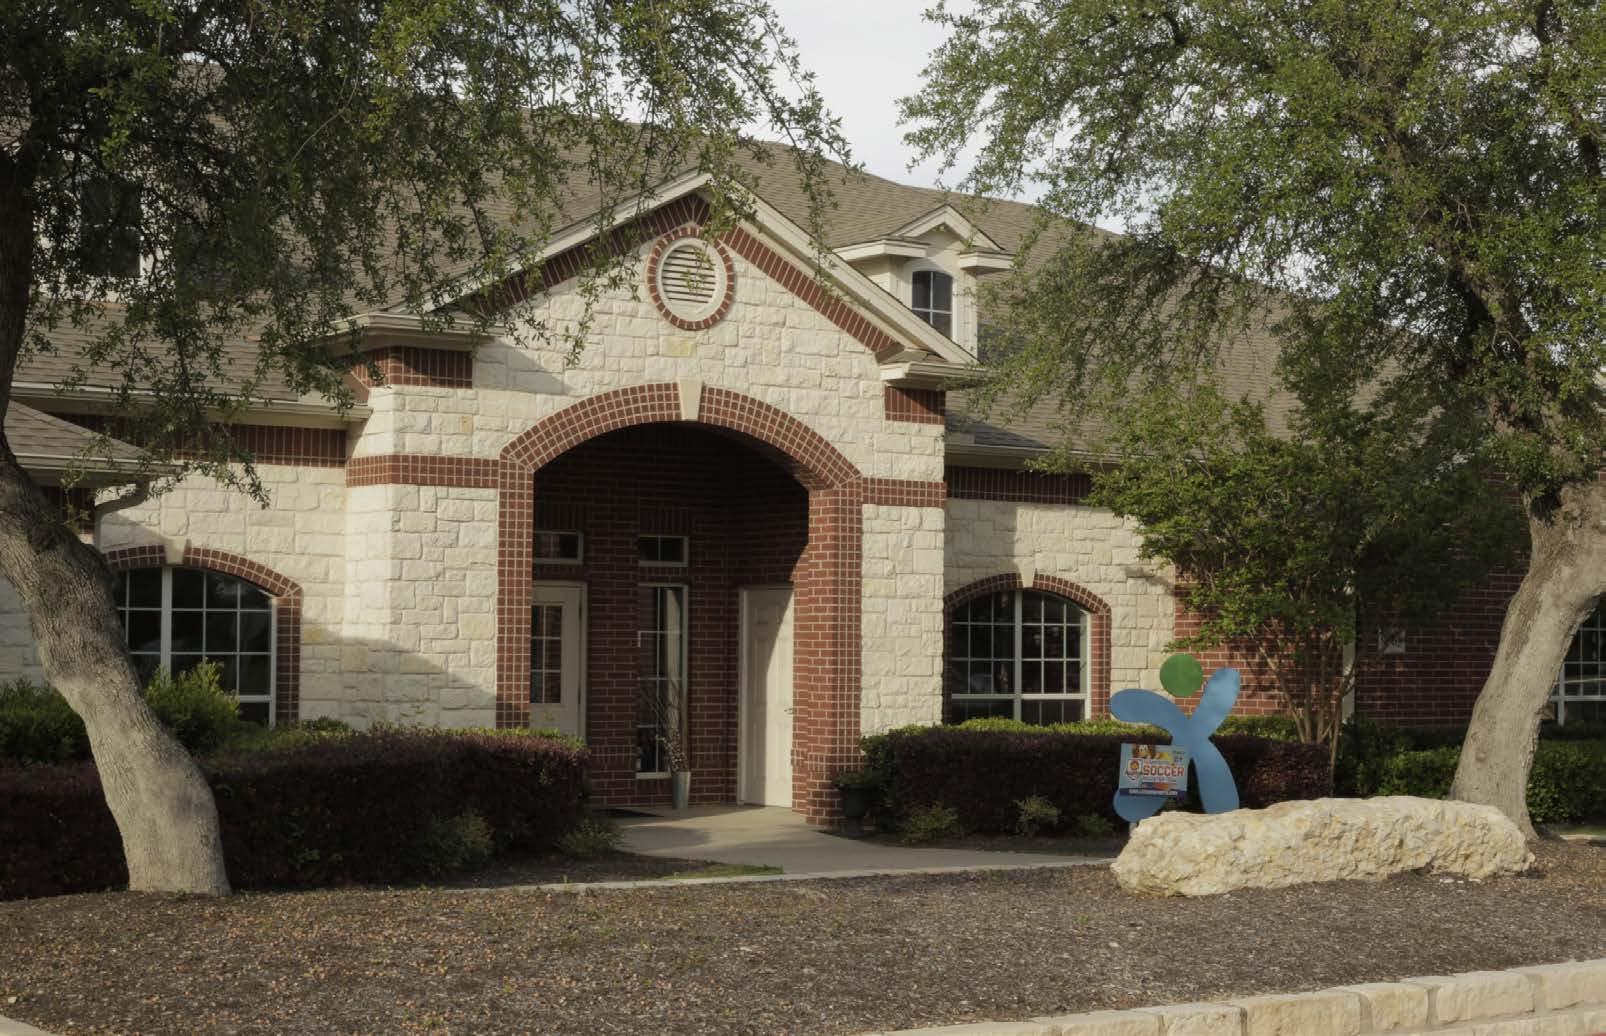
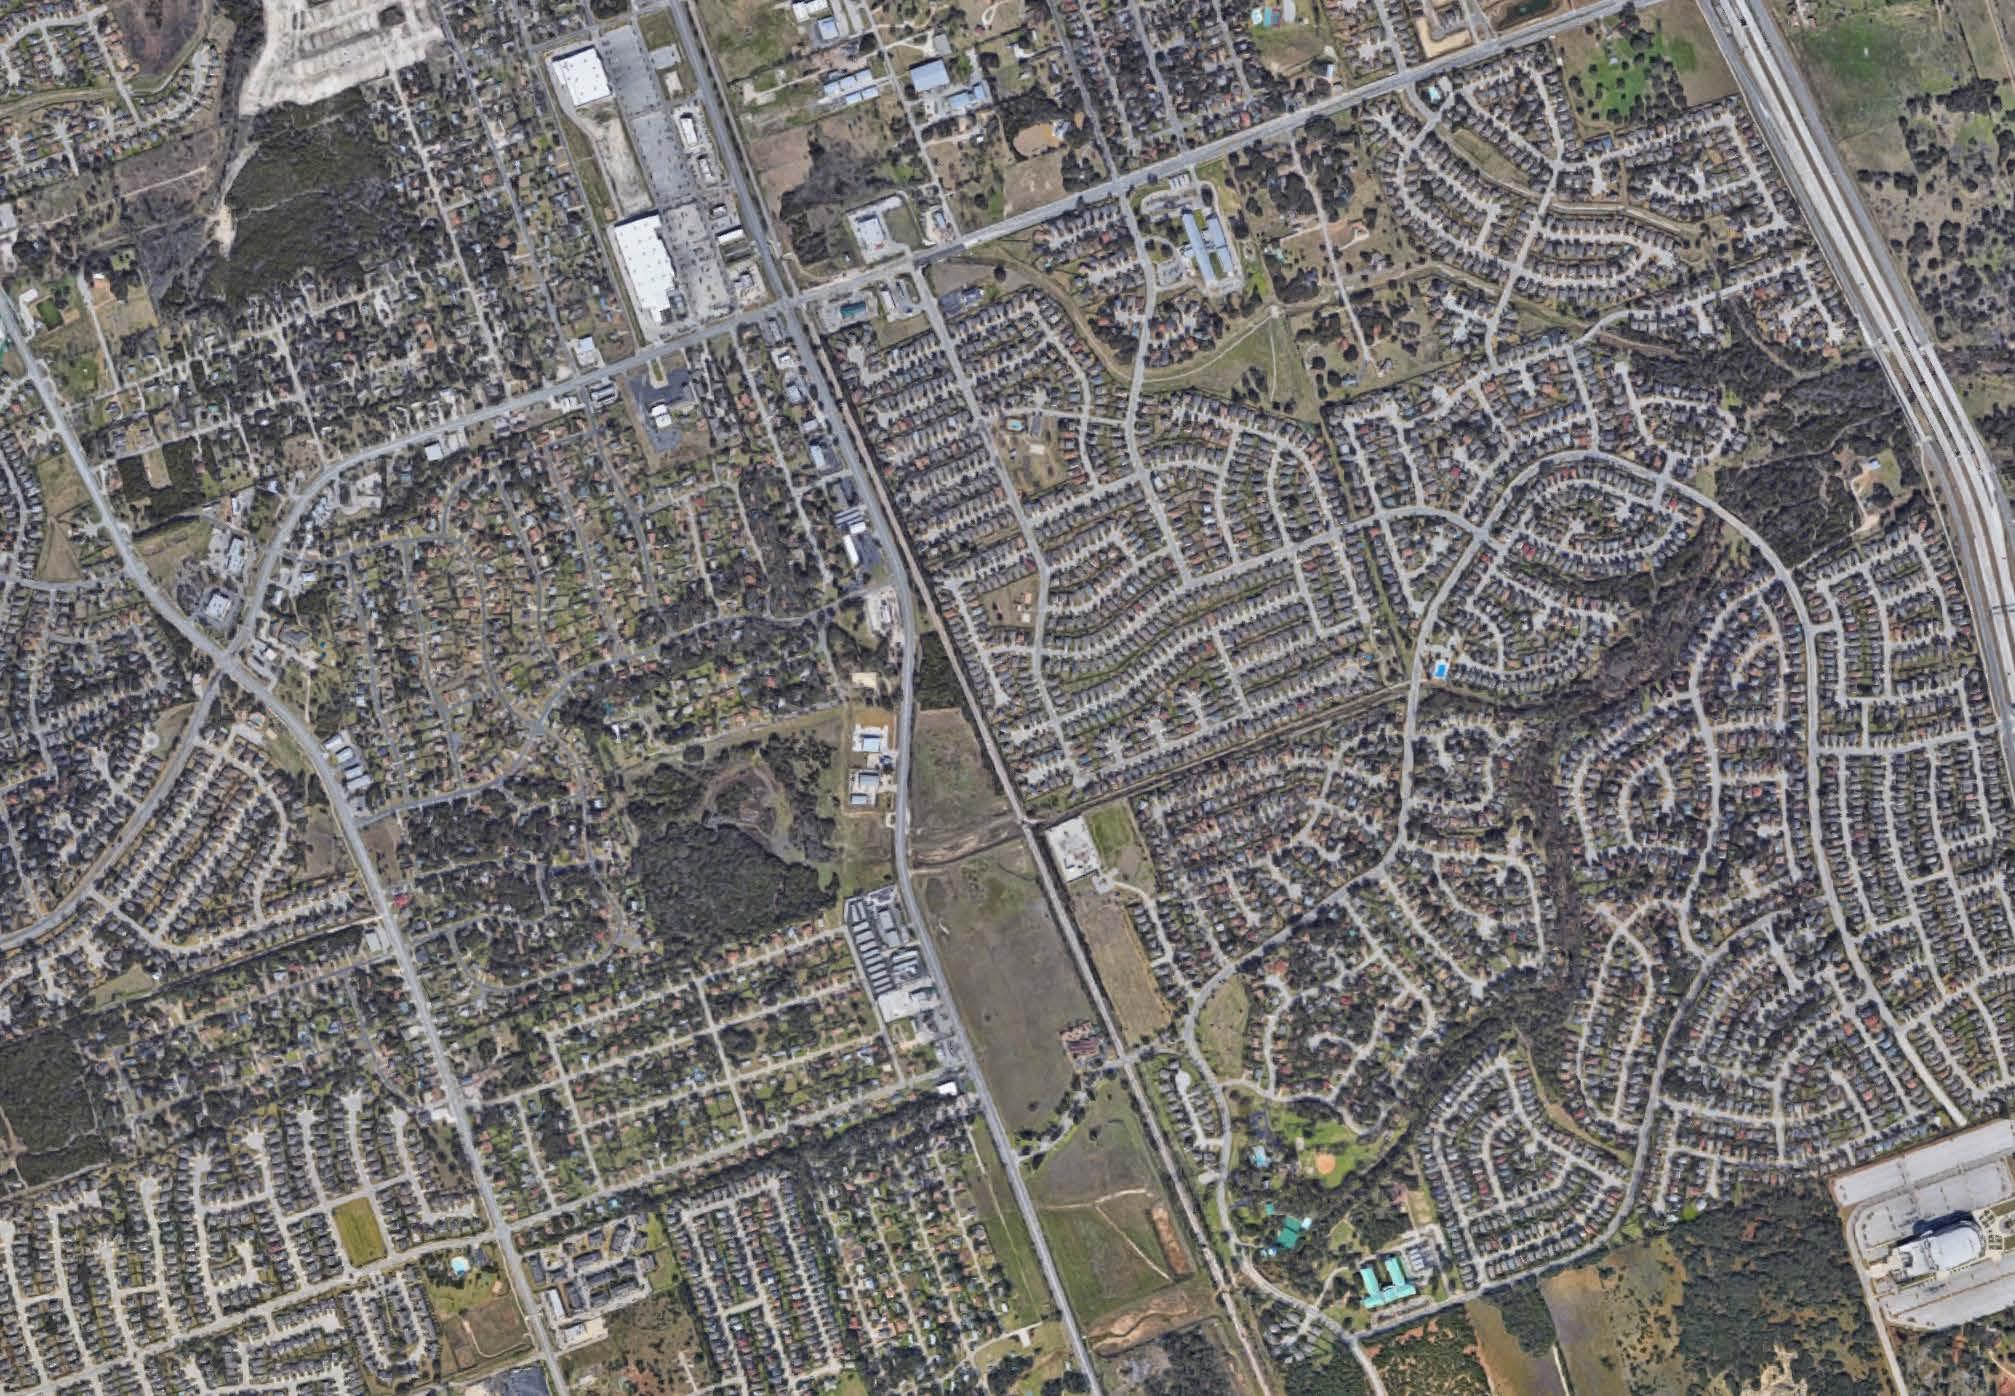
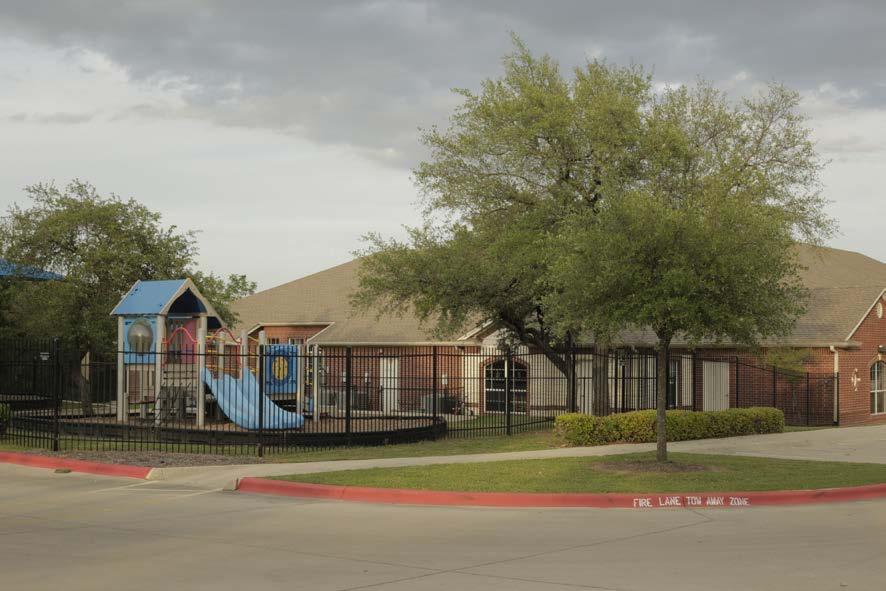
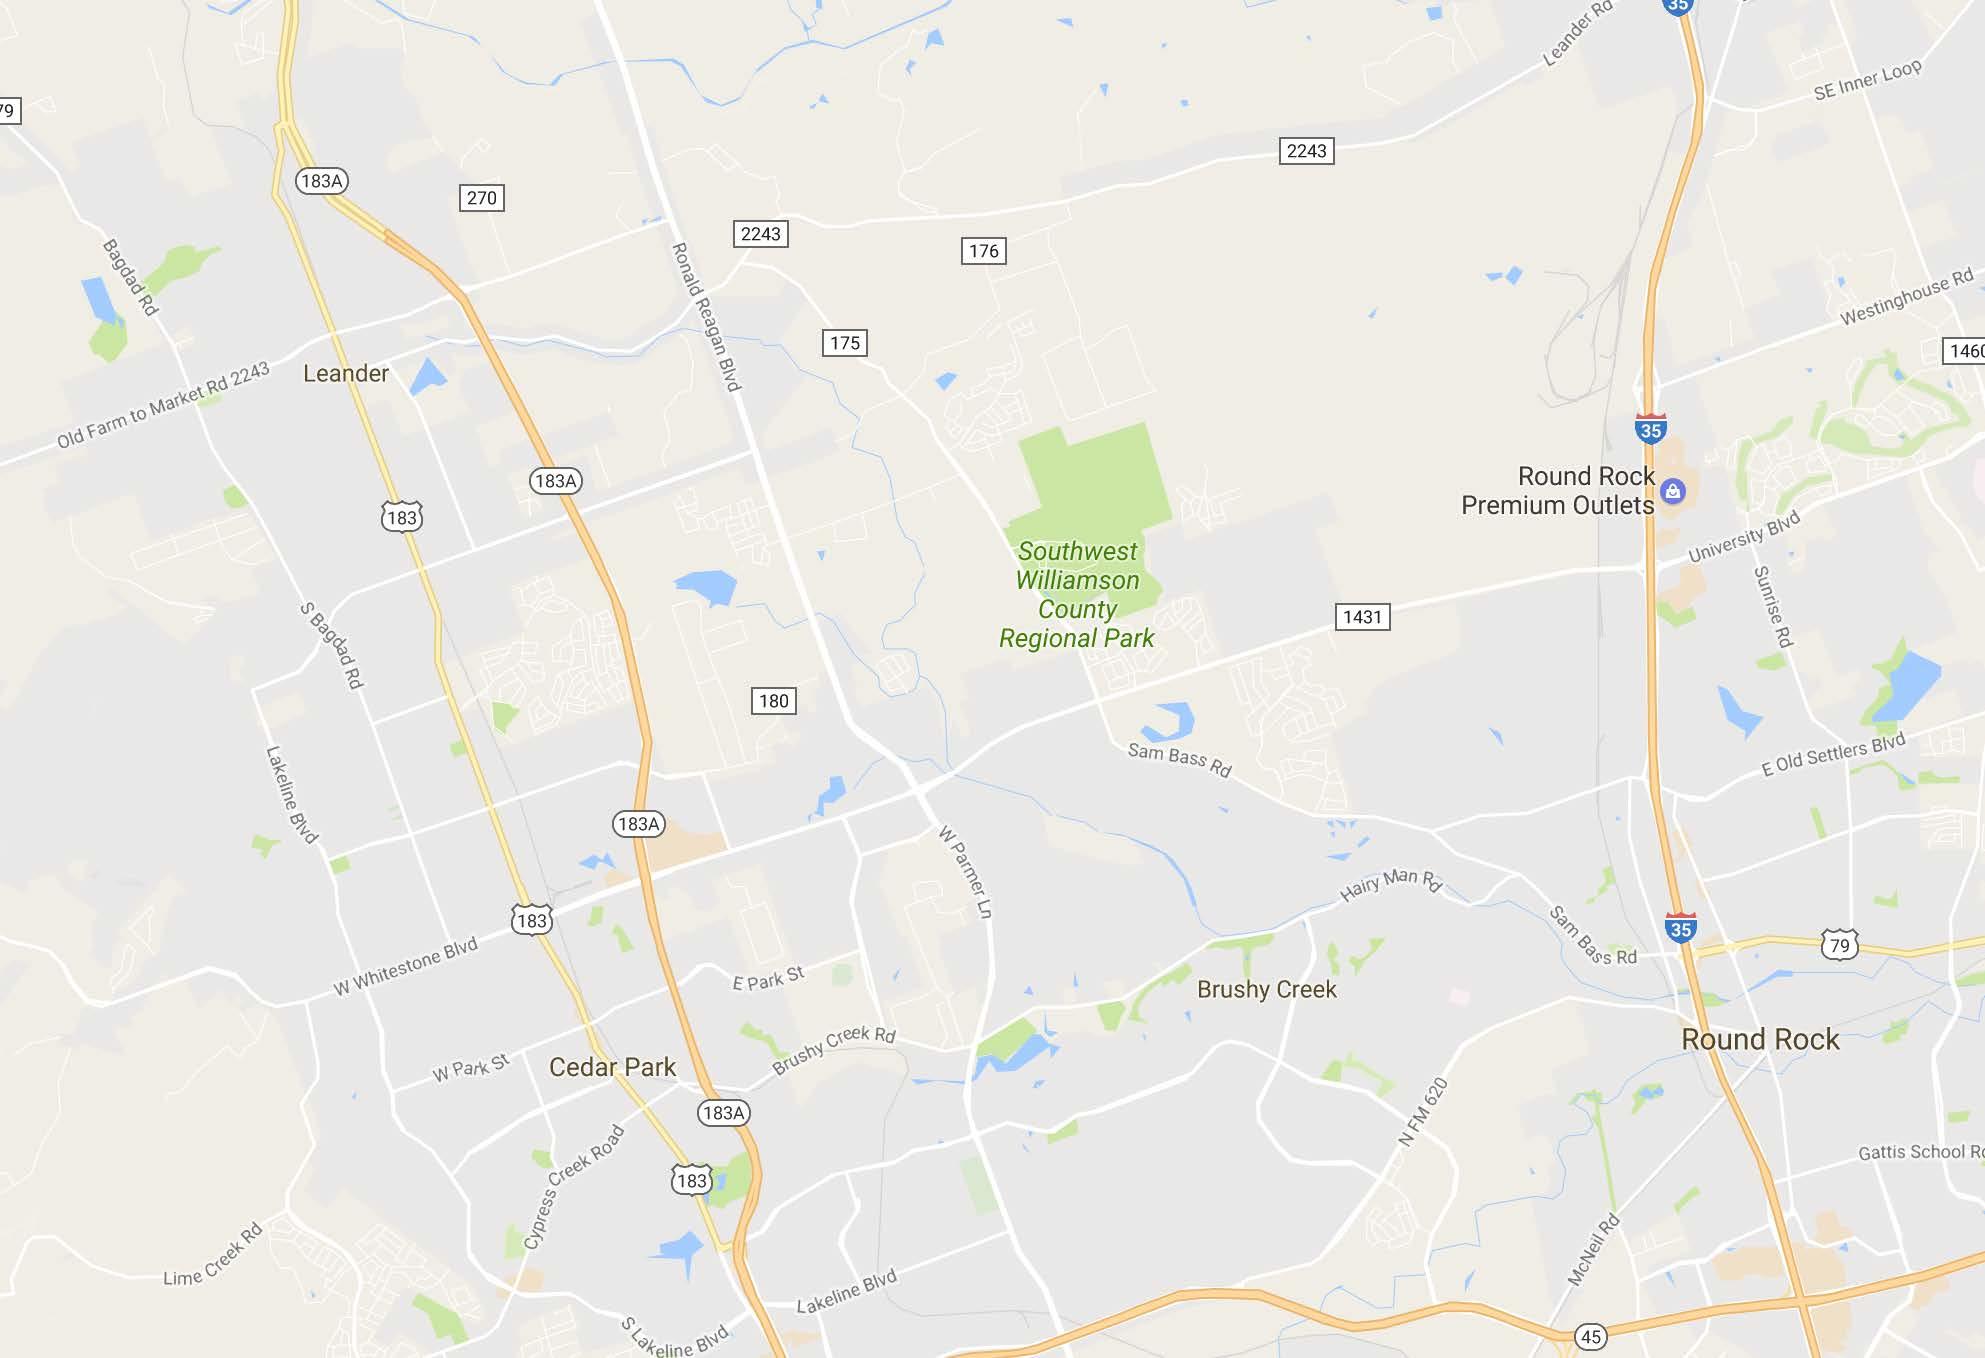
LEANDER, TX
Rent escalations every 5 years are based on the lesser of 10% or CPI







Recognizing the importance of giving every child the opportunity to discover their world, Xplor partners with families to create a caring educational community that enriches the childhood journey. Xplor operates 16 schools for children from birth to 12 years in the Austin, Ft. Worth, Dallas and Houston areas.

Nobel Learning Communities, is a network of more than 200 private schools in 19 states and the District of Columbia, with a commitment to outstanding preschools and K-12 schools. Nobel Learning Communities also operates Laurel Springs School, an accredited private online school, offering challenging programs for students in kindergarten through twelfth grade. Nobel Learning Communities is accredited by AdvancED™.
• Long-Term Absolute NNN Lease – Zero Landlord Responsibility
• Strong Corporate Guarantee
• 10% Rent Escalations Every 5 Years in Primary Term
• Preschools & Day Cares are a $48 billion Dollar Industry, Internet and Recession-Proof and Provide Essential Services to Working Families
• Highly Desirable Suburb of Austin - One of The Fastest Growing Metros in the Nation
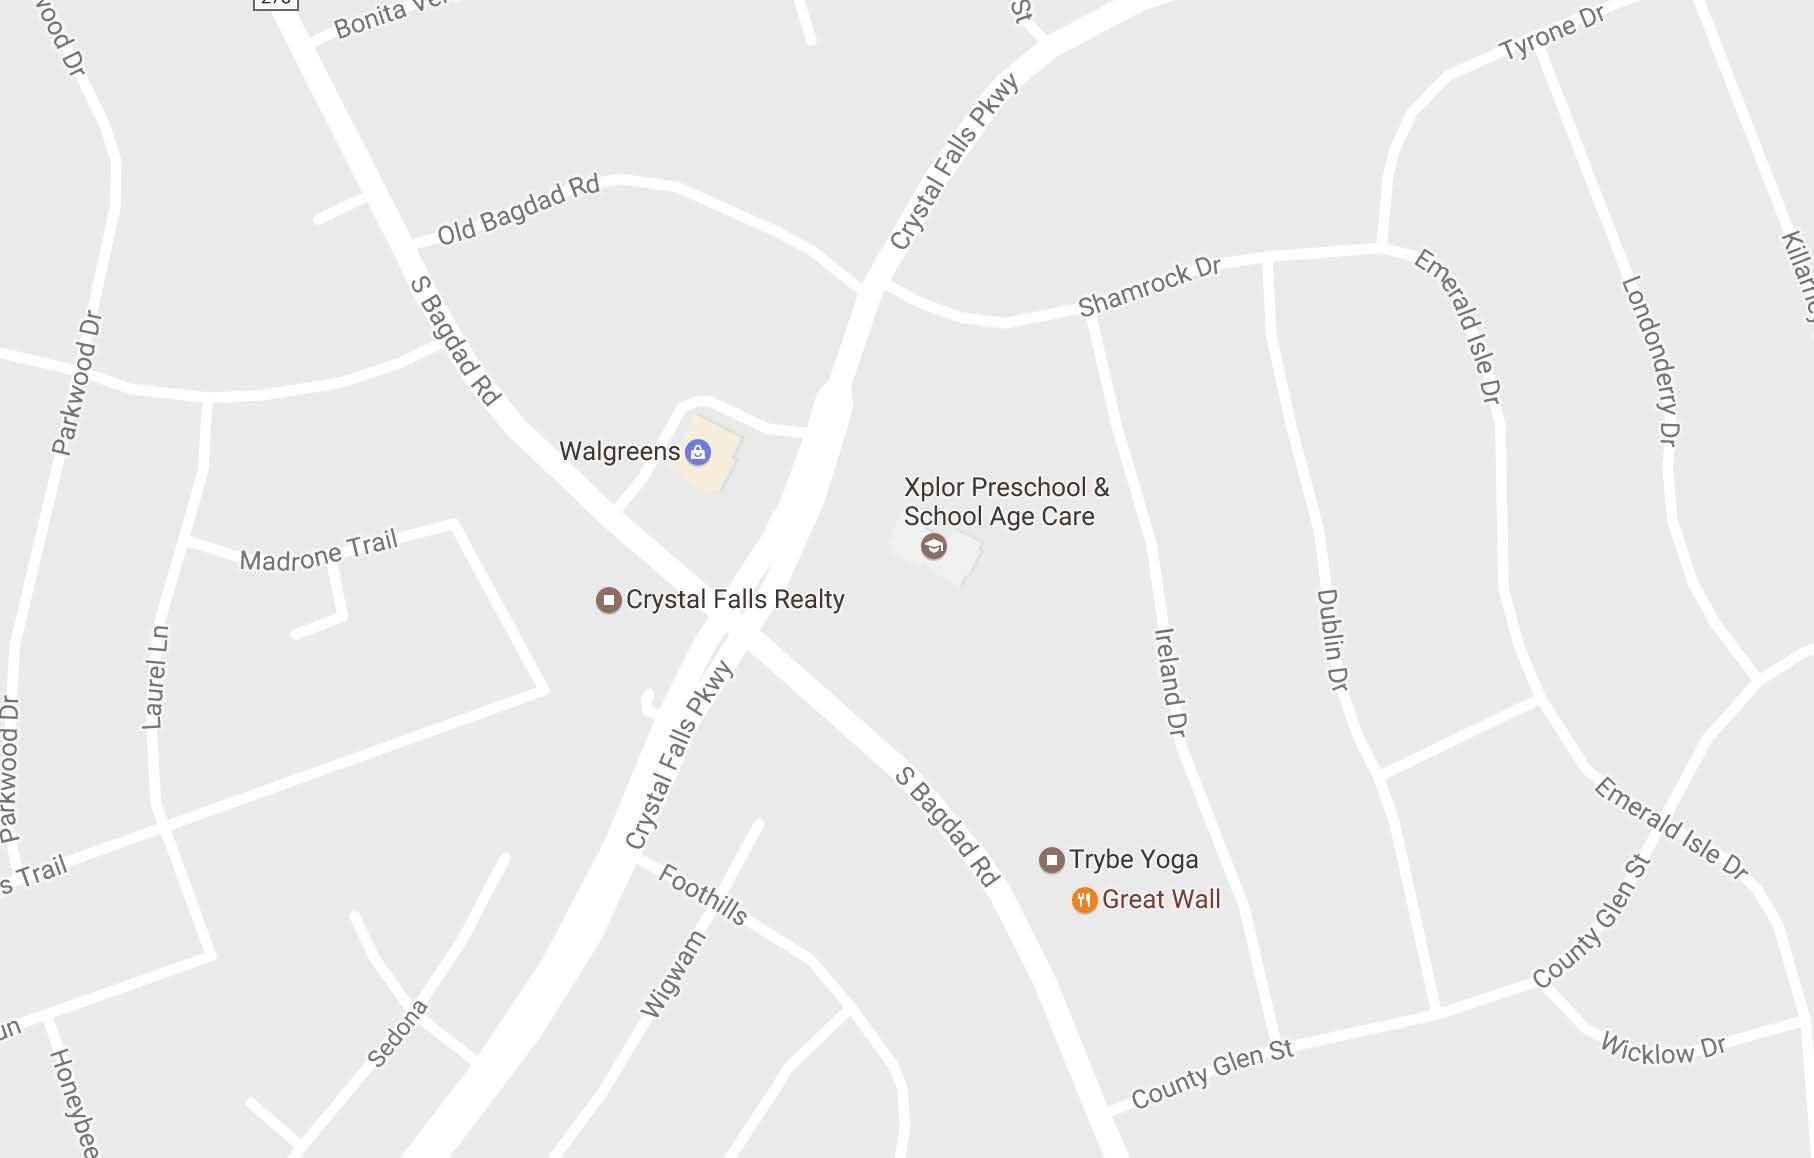
• Surrounding National Retailers Include 7-Eleven, Walmart, Lowes, McDonalds, Walgreens, and Many Others
• Population Expected to Increase by 17% from 2016 to 2021













Pleasant Hill Elementary School





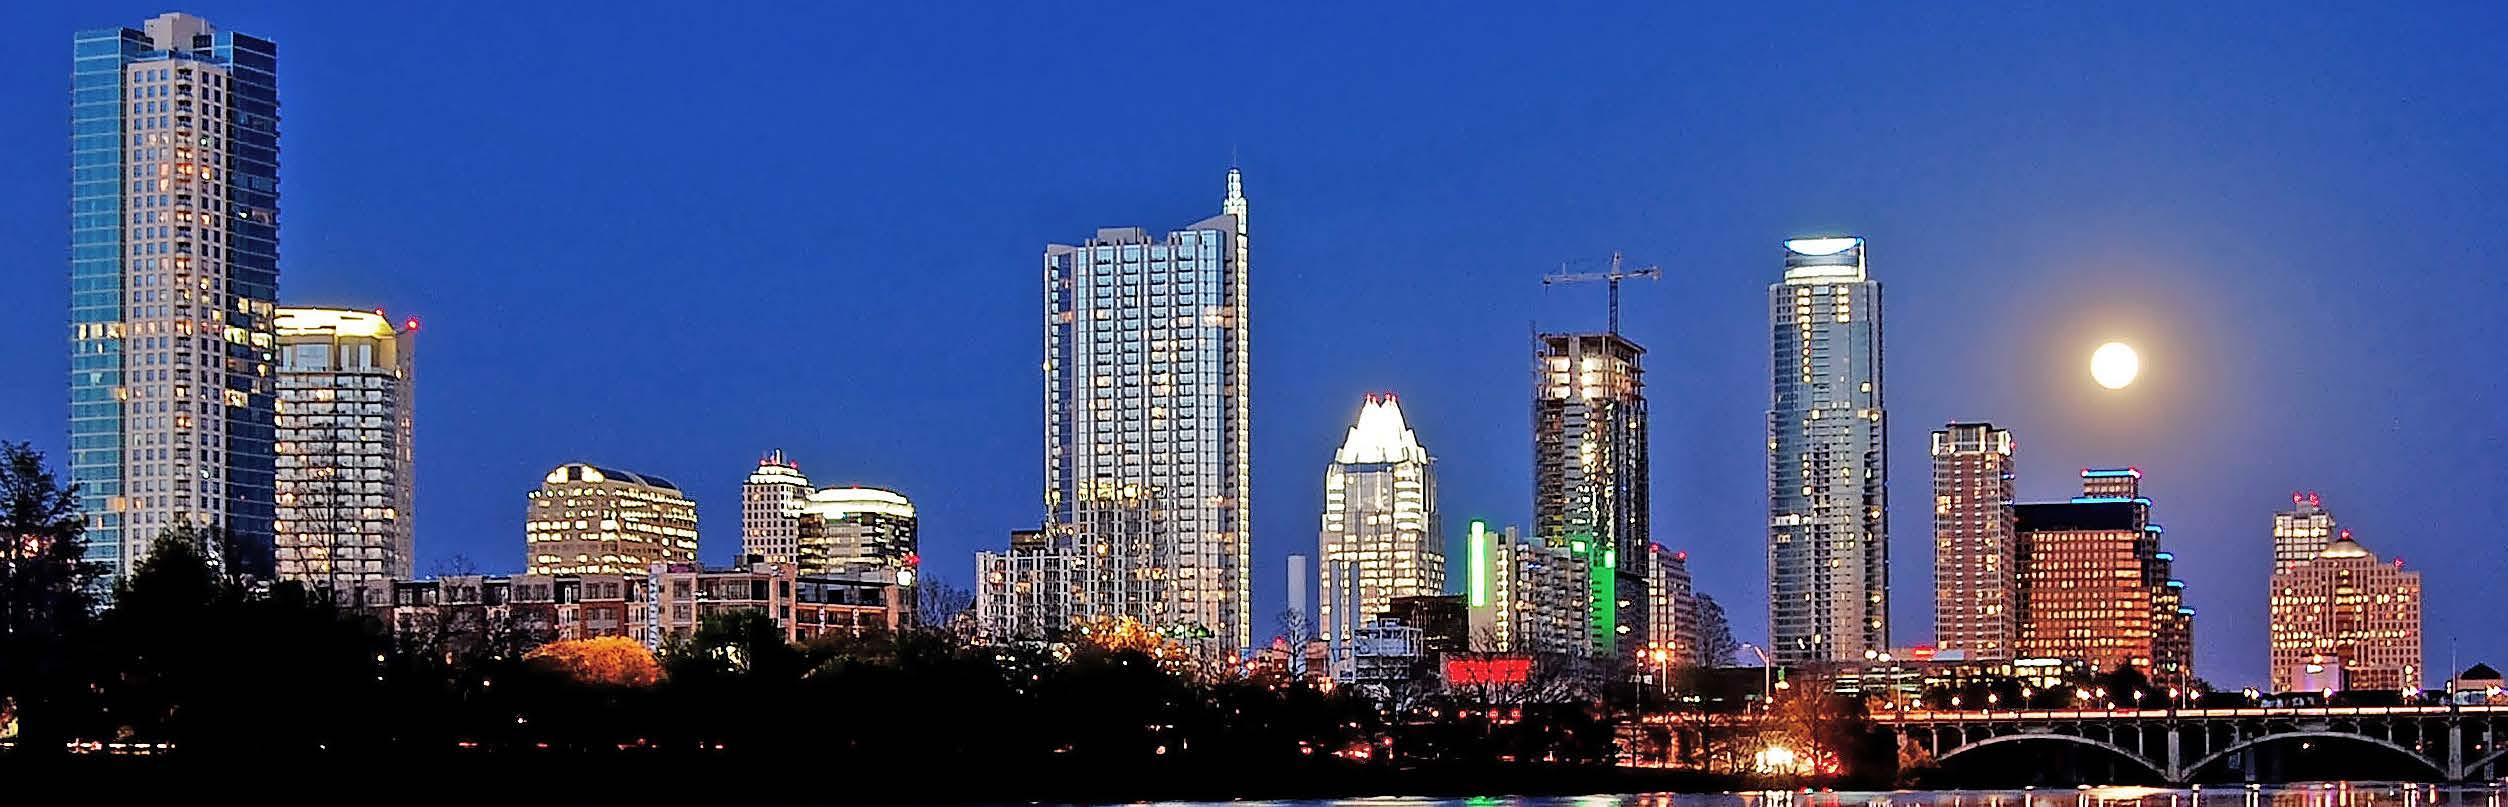

AUSTIN, TX
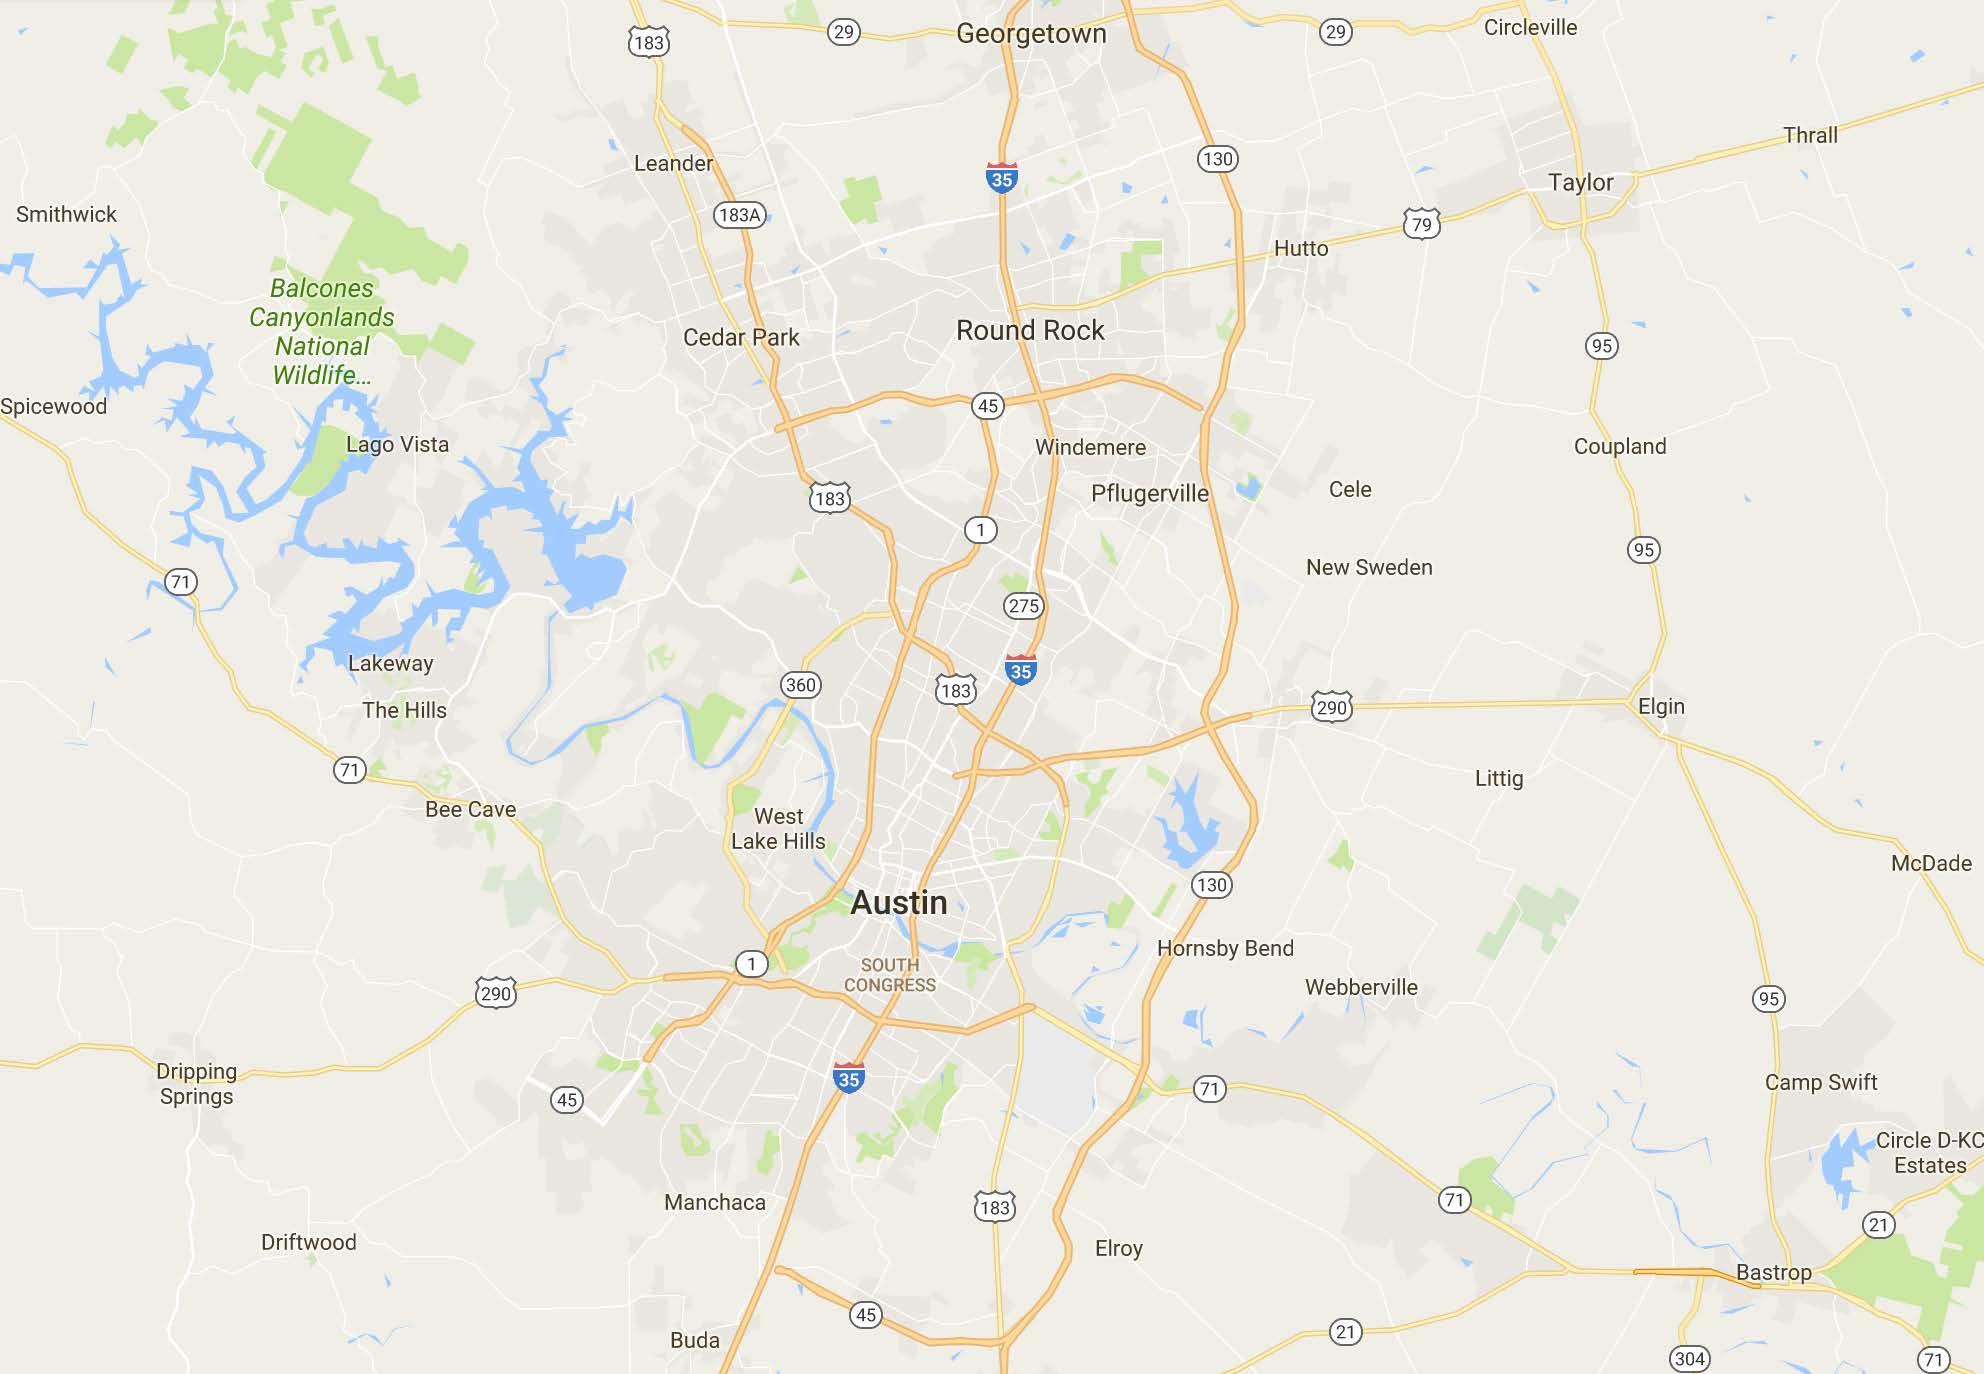
Austin, Texas is the capital of Texas and the seat of Travis County. Located in Central Texas, Austin is the 11th-most populous city in the United States and the fourth-most populous city in Texas. It was the third-fastest-growing large city in the nation from 2000 to 2006. Austin is also the second largest state capital in the United States. Austin had a July 1, 2013 population of 885,400 (U.S. Census Bureau estimate). The city is the cultural and economic center of the Austin–Round Rock metropolitan area, which had an estimated population of 1,883,051 as of July 1, 2013.
Austin is considered to be a major center for high tech. The region’s rapid growth has led Forbes to rank the Austin metropolitan area Number One among all big cities for jobs for 2012 in their annual survey. The Wall Street Journal Marketwatch ranked the area Number One for growing businesses. By 2013, Austin ranked No. 14 on Forbes’ list of the Best Places for Business and Careers (directly below Dallas, No. 13 on the list). As a result of the high concentration of high-tech companies in the region,
Austin was strongly affected by the dot-com boom in the late 1990s and subsequent bust.
Austin’s largest employers include the Austin Independent School District, the City of Austin, Dell, the U.S. Federal Government, Freescale Semiconductor (spun off from Motorola in 2004), IBM, St. David’s Healthcare Partnership, Seton Family of Hospitals, the State of Texas, the Texas State University, and the University of Texas at Austin. Other high-tech companies with operations in Austin include 3M, Apple, Hewlett-Packard, Google, Qualcomm, Inc., AMD, Applied Materials, Cirrus Logic, ARM Holdings, Cisco Systems, Electronic Arts, Flextronics, Facebook, eBay/PayPal, Bioware, Blizzard Entertainment, Hoover’s, Intel Corporation, National Instruments, Rackspace, RetailMeNot, Rooster Teeth, Spansion, Buffalo Technology, Silicon Laboratories, Xerox, Oracle, Hostgator, Samsung Group, HomeAway, and United Devices.
PoPulation
In the identified area, the current year population is 100,362. The rate of change since 2000 was 154.23%. The five-year projection for the population in the area is 118,347 representing a change of 17.92% from 2016 to 2021. In 2016, the population was 49.1% male and 50.9% female. The median age in this area was 34.1, compared to U.S. median age of 38.0.
HouseHolds
In 2016 there were 33,845 households in your selected geography. The number of households has changed by 159.95% since 2000. It is estimated that the number of households in your area will be 39,844 five years from 2016, which represents a change of 17.72% from the current year. The average household size in your area is 2.96 persons.
income
In 2016, the median household income for your selected geography is $78,137, compare this to the Entire US average which is currently $54,149. It is estimated that the median household income in your area will be $85,775 five years from 2016, which represents a change of 9.78% from the current year.
The current year per capita income in your area is $31,955, compare this to the Entire US average, which is $29,472. The current year average household income in your area is $94,535, compare this to the Entire US average which is $77,008.
Race and etHnicity
The current year racial makeup of your selected area is as follows: 79.4% White, 4.4% Black, 0.6% Native American and 4.6% Asian/Pacific Islander. Compare these to Entire US averages which are: 71.60% White, 12.70% Black, 0.18% Native American and 5.02% Asian/Pacific Islander. People of Hispanic origin are counted independently of race. People of Hispanic origin make up ##.#% of the current year population in your selected area. Compare this to the Entire US average of 17.9%.
Housing
In 2016, there were 25,449 owner occupied housing units in your area and there were 8,397 renter occupied housing units in your area. Median home value in the area is $192,418, compared to a median home value of $198,891 for the U.S.
emPloyment
In 2016, there were 49,426 employees in your selected area, this is also known as the daytime population. Currently 72.6% of employees are employed in white-collar occupations in this geography, and 12.7% are employed in blue-collar occupations. In 2016, unemployment in this area is 3.7%.
3,850
14,620
CONFIDENTIALITY AGREEMENT
The information contained in the following offering memorandum is proprietary and strictly confidential. It is intended to be reviewed only by the party receiving it from Vitorino Group and it should not be made available to any other person or entity without the written consent of Vitorino Group. By taking possession of and reviewing the information contained herein the recipient agrees to hold and treat all such information in the strictest confidence. The recipient further agrees that recipient will not photocopy or duplicate any part of the offering memorandum. If you have no interest in the subject property at this time, please return this offering memorandum to Vitorino Group.
This offering memorandum has been prepared to provide summary, unverified financial and physical information to prospective purchasers, and to establish only a preliminary level of interest in the subject property. The information contained herein is not a substitute for a thorough due diligence investigation. Vitorino Group has not made any investigation, and makes no warranty or representation with respect to the income or expenses for the subject property, the future projected financial performance of the property, the size and square footage of the property and improvements, the presence or absence of contaminating substances, PCBs or asbestos, the compliance with local, state and federal regulations, the physical condition of the improvements thereon, or the financial condition or business prospects of any tenant, or any tenant’s plans or intentions to continue its occupancy of the subject property. The information contained in this offering memorandum has been obtained from sources we believe to be reliable; however, Vitorino Group has not verified, and will not verify, any of the information contained herein, nor has Vitorino Group conducted any investigation regarding these matters and makes no warranty or representation whatsoever regarding the accuracy or completeness of the information provided. All potential buyers must take appropriate measures to verify all of the information set forth herein. Prospective buyers shall be responsible for their costs and expenses of investigating the subject property.
ALL PROPERTY SHOWINGS ARE BY APPOINTMENT ONLY. PLEASE CONTACT THE VITORINO GROUP AGENT FOR MORE DETAILS.