











Good
but Keep an Eye on the Clouds
Dr. Mark G. Dotzour
Current expansion began in June 2009
• Mar 1991 to Mar 2001 120 months
• Feb 1961 to Dec 1969 106 months
• Nov 1982 to Jul 1990 92 months
• Jun 1938 to Feb 1945 80 months
• Nov 2001 to Dec 2007 73 months
Current expansion as of January 2020 is 128 months
HOW LONG CAN IT LAST?

• Auto industry appears to have peaked
• Trucking and shipping industry has peaked
• Low oil and gas prices will pressure energy sector
• Trade negotiations with China cause uncertainty
• Businesses not using tax benefits to expand
• Congress won’t be interested in growth
• Federal budget deficits can’t get too much higher
• Presidential election uncertainty

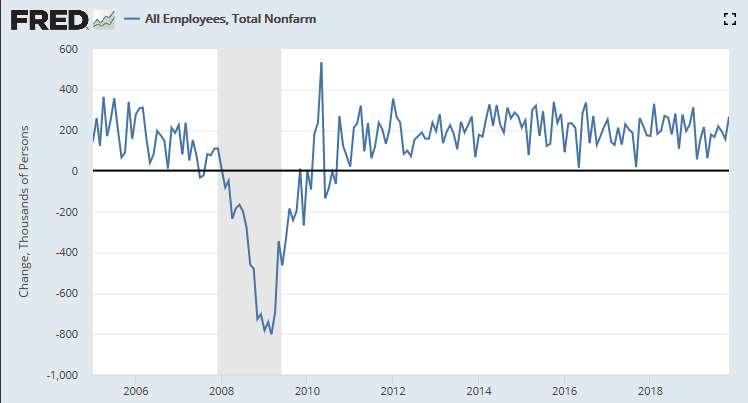
300K
Source: Bureau of Labor Statistics
266,000 in November

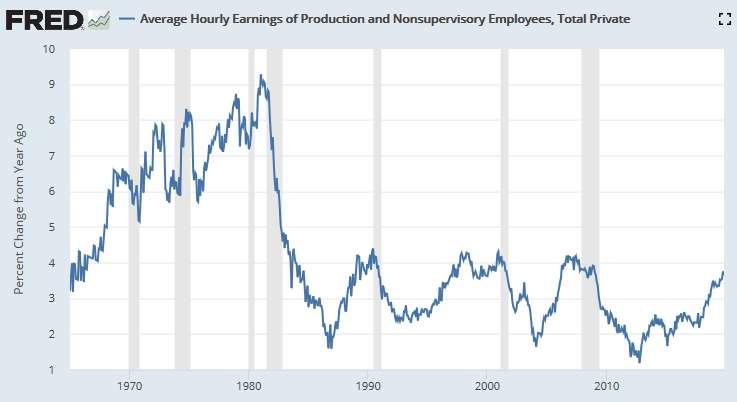
Source: Federal Reserve Bank of St. Louis 4%
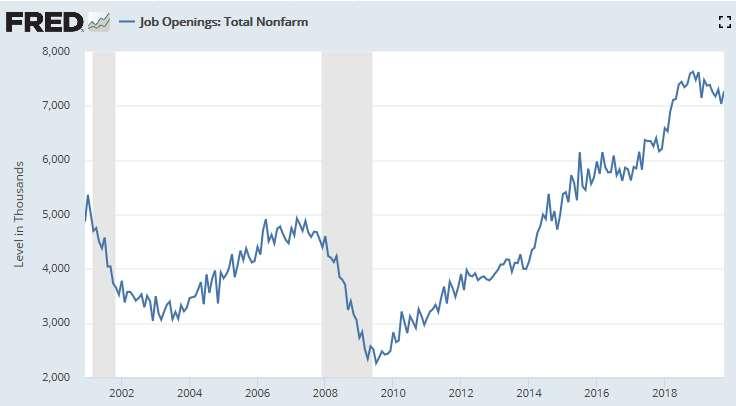
Source: Bureau of Labor Statistics
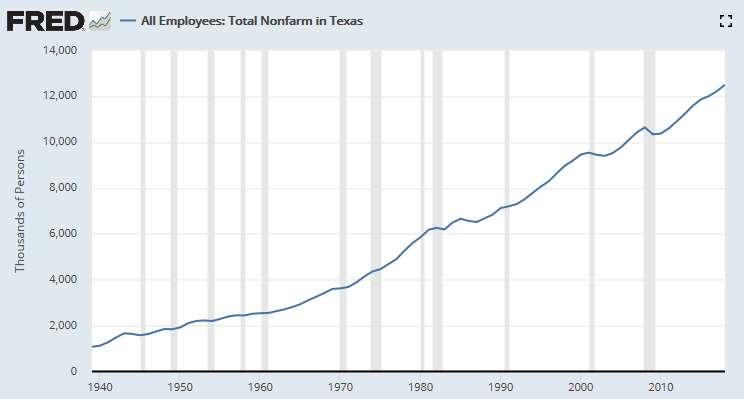
1940
13.6 million in Nov 19
Source: Bureau of Labor Statistics
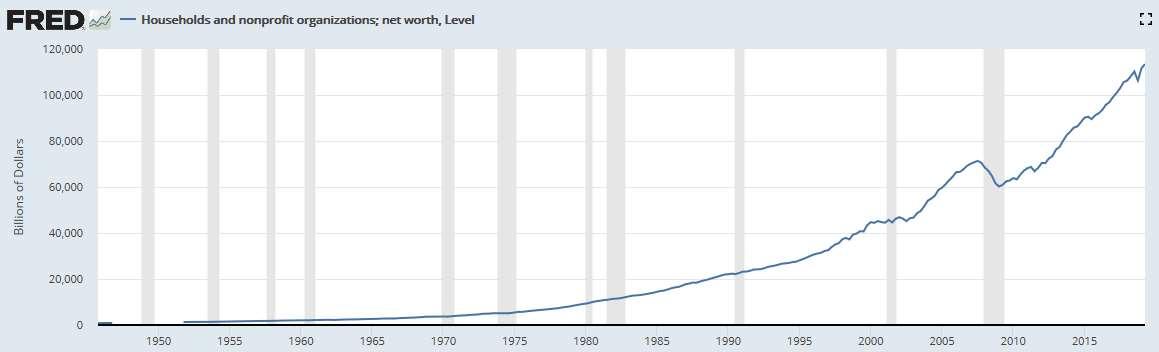
Source: Federal Reserve Bank of St. Louis
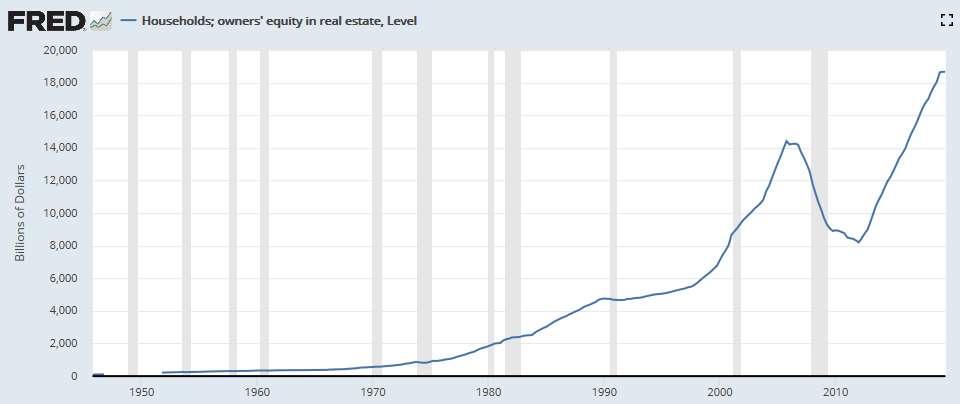
$18 trillion
Source: Federal Reserve Bank of St. Louis
Source: The Conference Board
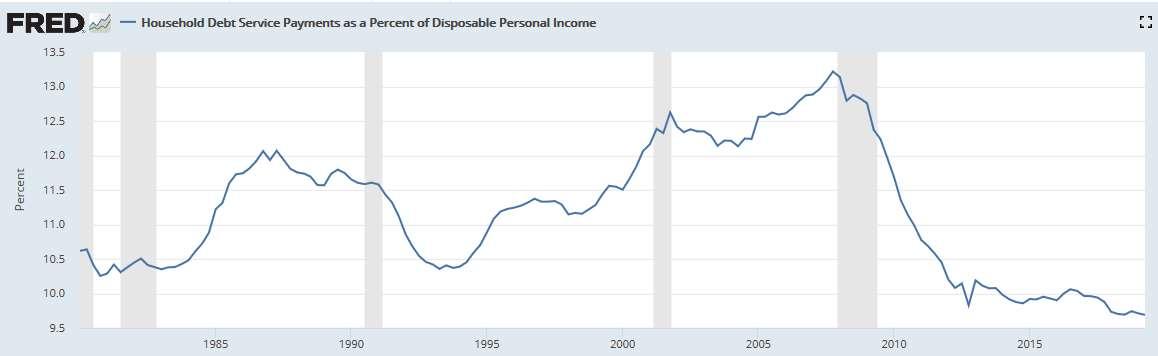
Source: Federal Reserve Bank of St. Louis
Source: National Federation of Independent Business
1963
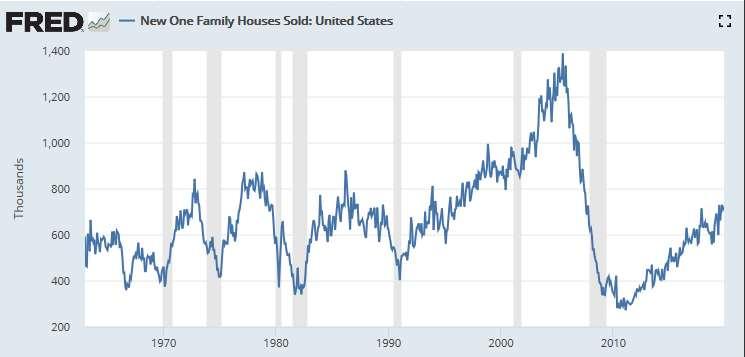
Source: Federal Reserve Bank of St. Louis
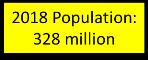
1965 Population:
194 million
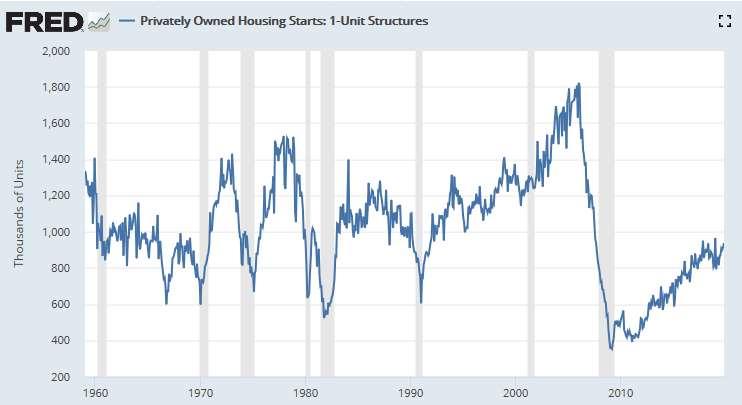
1 million units
Source: Federal Reserve Bank of St. Louis
Source: Federal Reserve Bank of St. Louis
Source: Federal Reserve Bank of Dallas
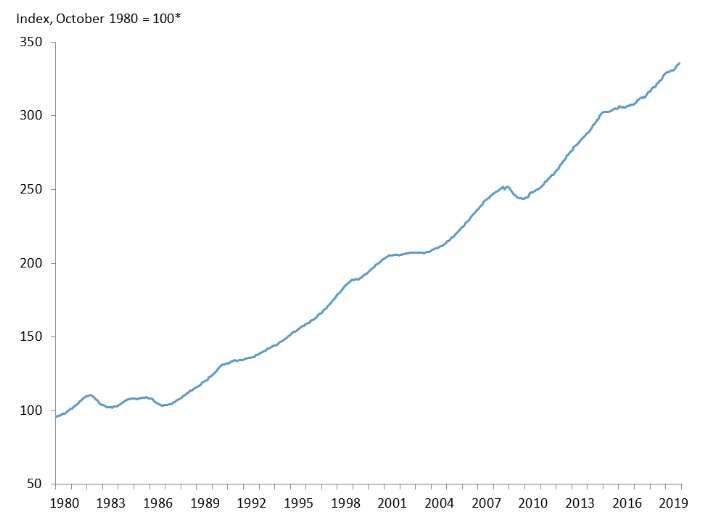
Source: Federal Reserve Bank of Dallas


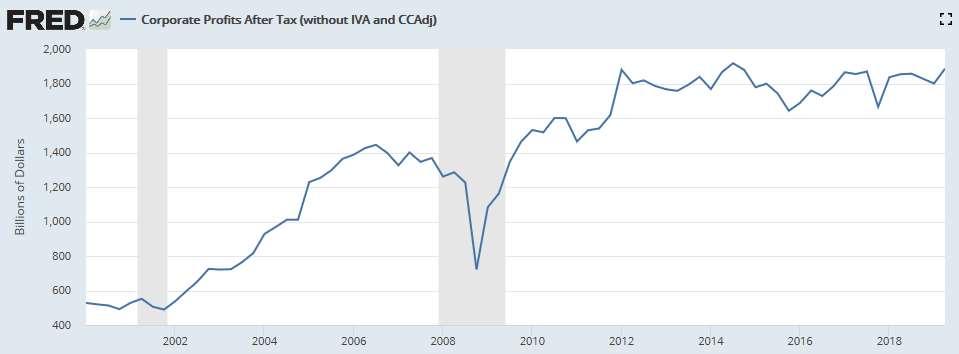
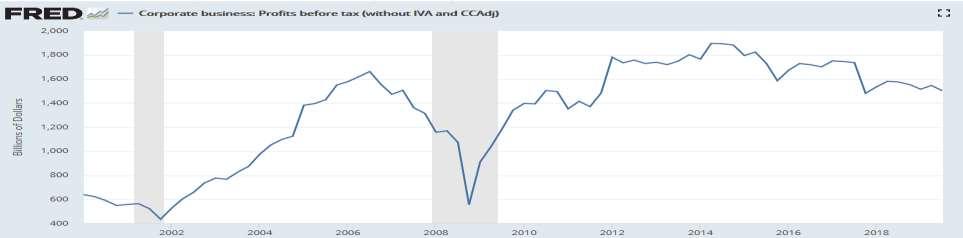
Source: Federal Reserve Bank of St. Louis

Q3-19 Q2-19 Q1-19 Q4-18
Source: Business Roundtable
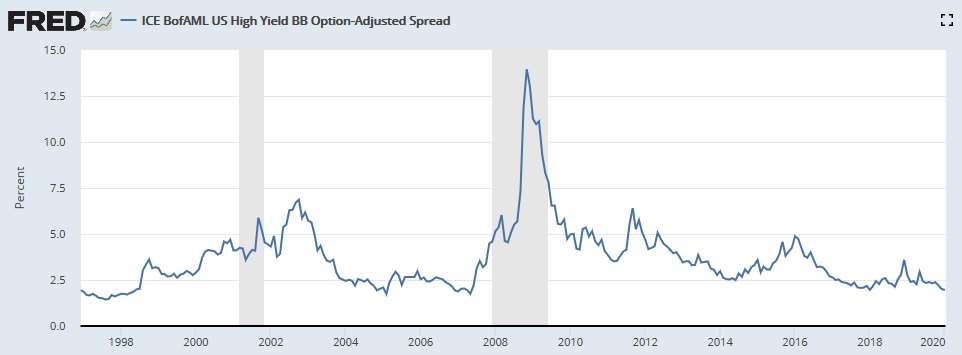
Source: Federal Reserve Bank of St. Louis
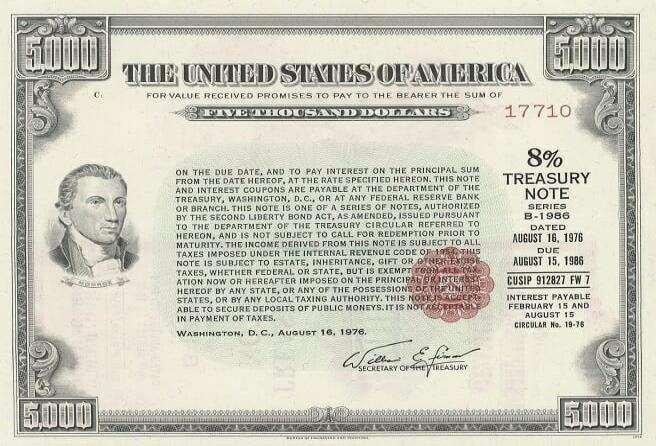
(unless the Fed intervenes)
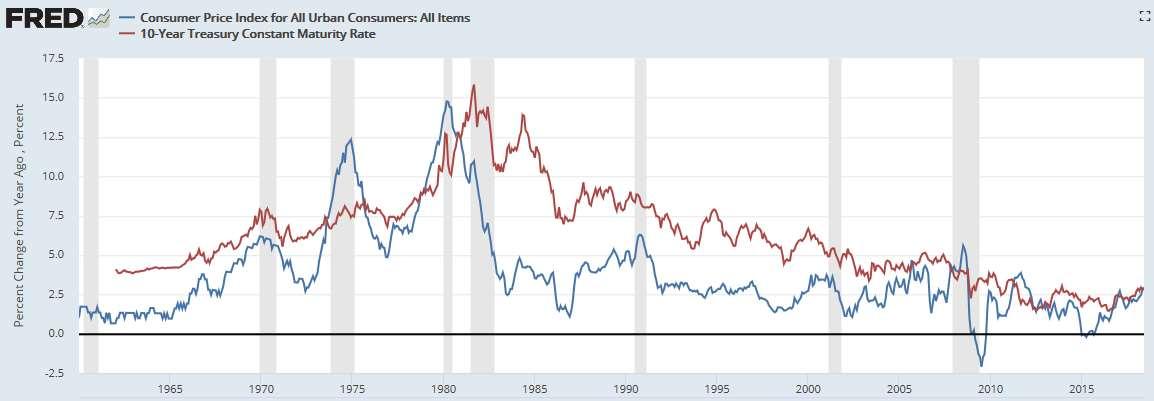
Inflation rate
10-Year Treasury rate
Source: Federal Reserve Bank of St. Louis
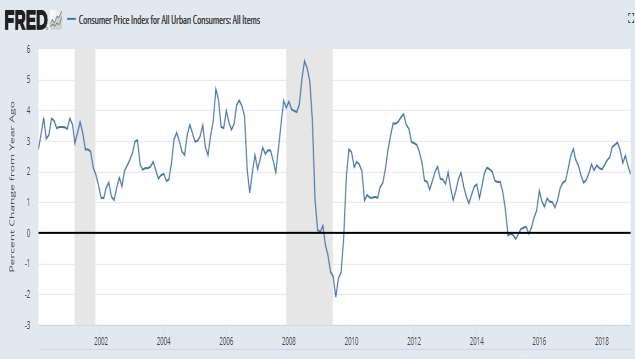
Source: Federal Reserve Bank of St. Louis
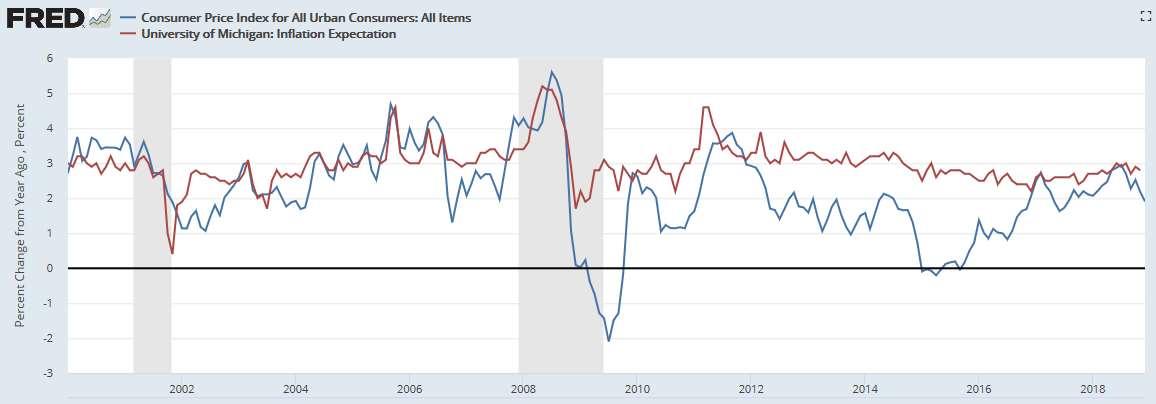
Predicted Inflation
Actual Inflation
Source: University of Michigan and Federal Reserve Bank of St. Louis
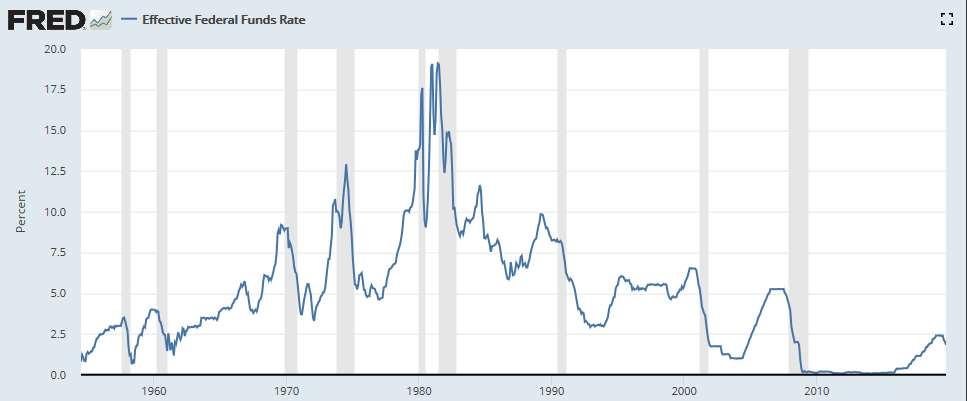
Source: Federal Reserve Bank of St. Louis
10-Year Government Bond Rates
January 9, 2020
United States 1.851% Canada 1.593% UK 0.812%
Germany - 0.225%
France 0.062%
Italy 1.393%
Japan - 0.005%
Source: CNBC.com
Average Interest Rate on:
March 1, 2000 6.555% 8.505%
March 1, 2007 5.055% 7.551% March 1, 2018 2.347% 4.162%
Source: U.S. Treasury
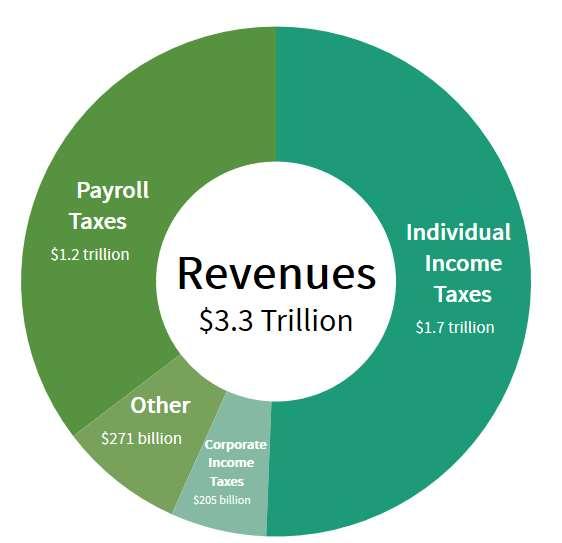
Source: Congressional Budge Office
If rates went up 2%, interest expense would Increase by $440 billion.
Just the increase of 2% would consume 13% of all federal income.
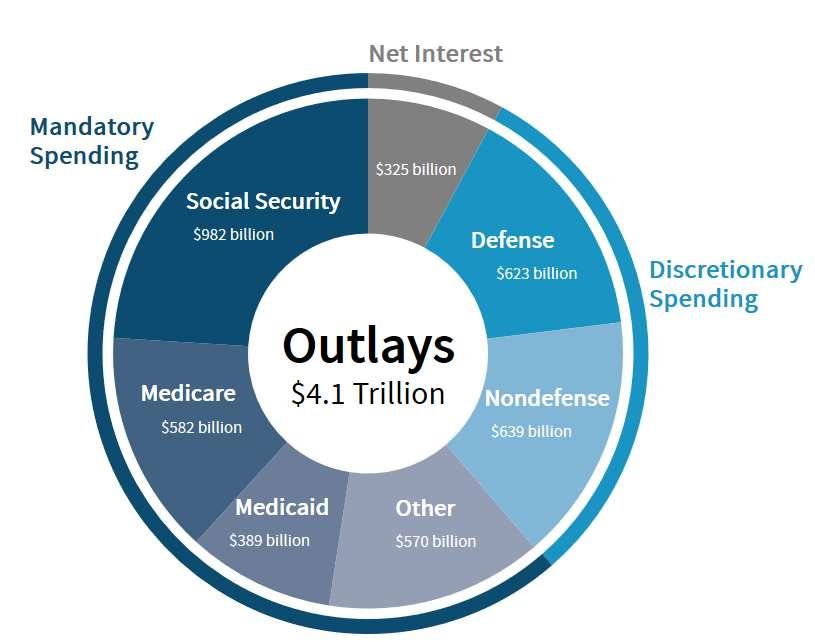
If rates went up 2%, interest expense would increase by $440 billion.
Source: Congressional Budge Office
Just the increase of 2% would consume 75% of all Medicare payments, or 45% of Soc Sec payments.
CoStar reported sales volume in 12 months ended November 2019 was 3.7% higher than a year earlier.
CoStar reported that sales that include secondary and tertiary markets were up 5.7% in the same period.
Sources: CoStar release 12/26/2019; NREI Online; Green Street Advisors Release 1/7/2020
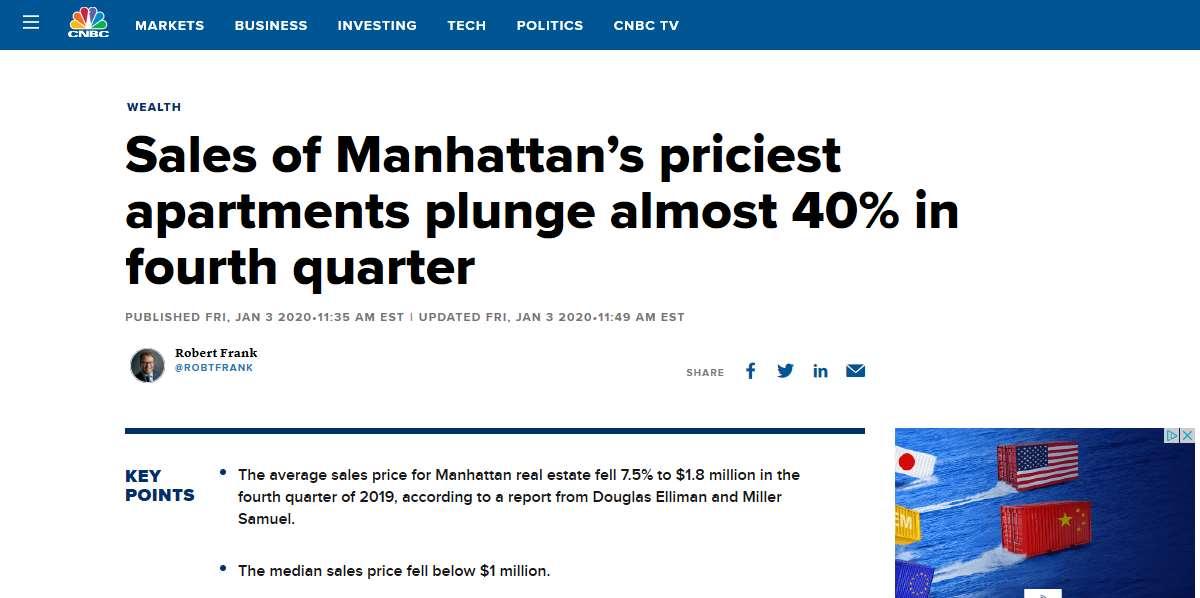
CoStar reported aggregate absorption of CRE space in 3Q2019 was much lower than previous years:
feet
3Q
3Q
3Q
3Q
Sources: CoStar release 12/26/2019; NREI Online; Green Street Advisors Release 1/7/2020
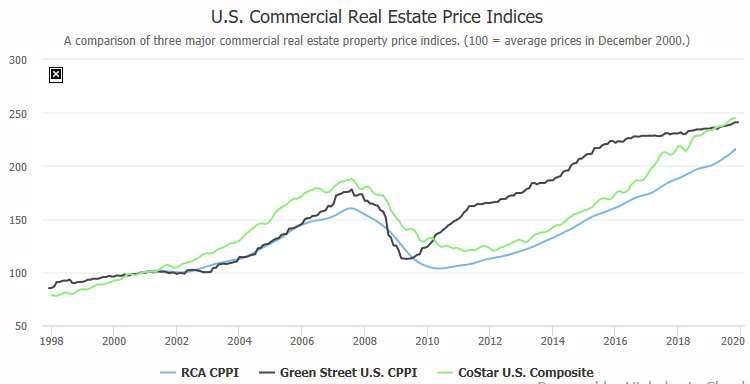
RCA reported Nov prices 8.7% higher YOY.
Green Street Advisors Index up 2.5% YOY.
Industrial up 13.6%
Apartments up 9.3%
CBD Office up 5%
Retail up 3.4%
Sources: CoStar release 12/26/2019; NREI Online; Green Street Advisors Release 1/7/2020