10 minute read
Improving the Clinical Pathways with Canon Medical's Liver Analysis Package


Jane Hanford, Ultrasound Clinical Product Specialist
What’s the hype around the Canon Liver Analysis Package? During my many years (well decades!) as a radiographer I have seen the introduction of a myriad of technologies that improve patient diagnostic capabilities across all modalities. Canon’s liver analysis package will make a real difference to the clinician’s day while fundamentally improving the patient journey.
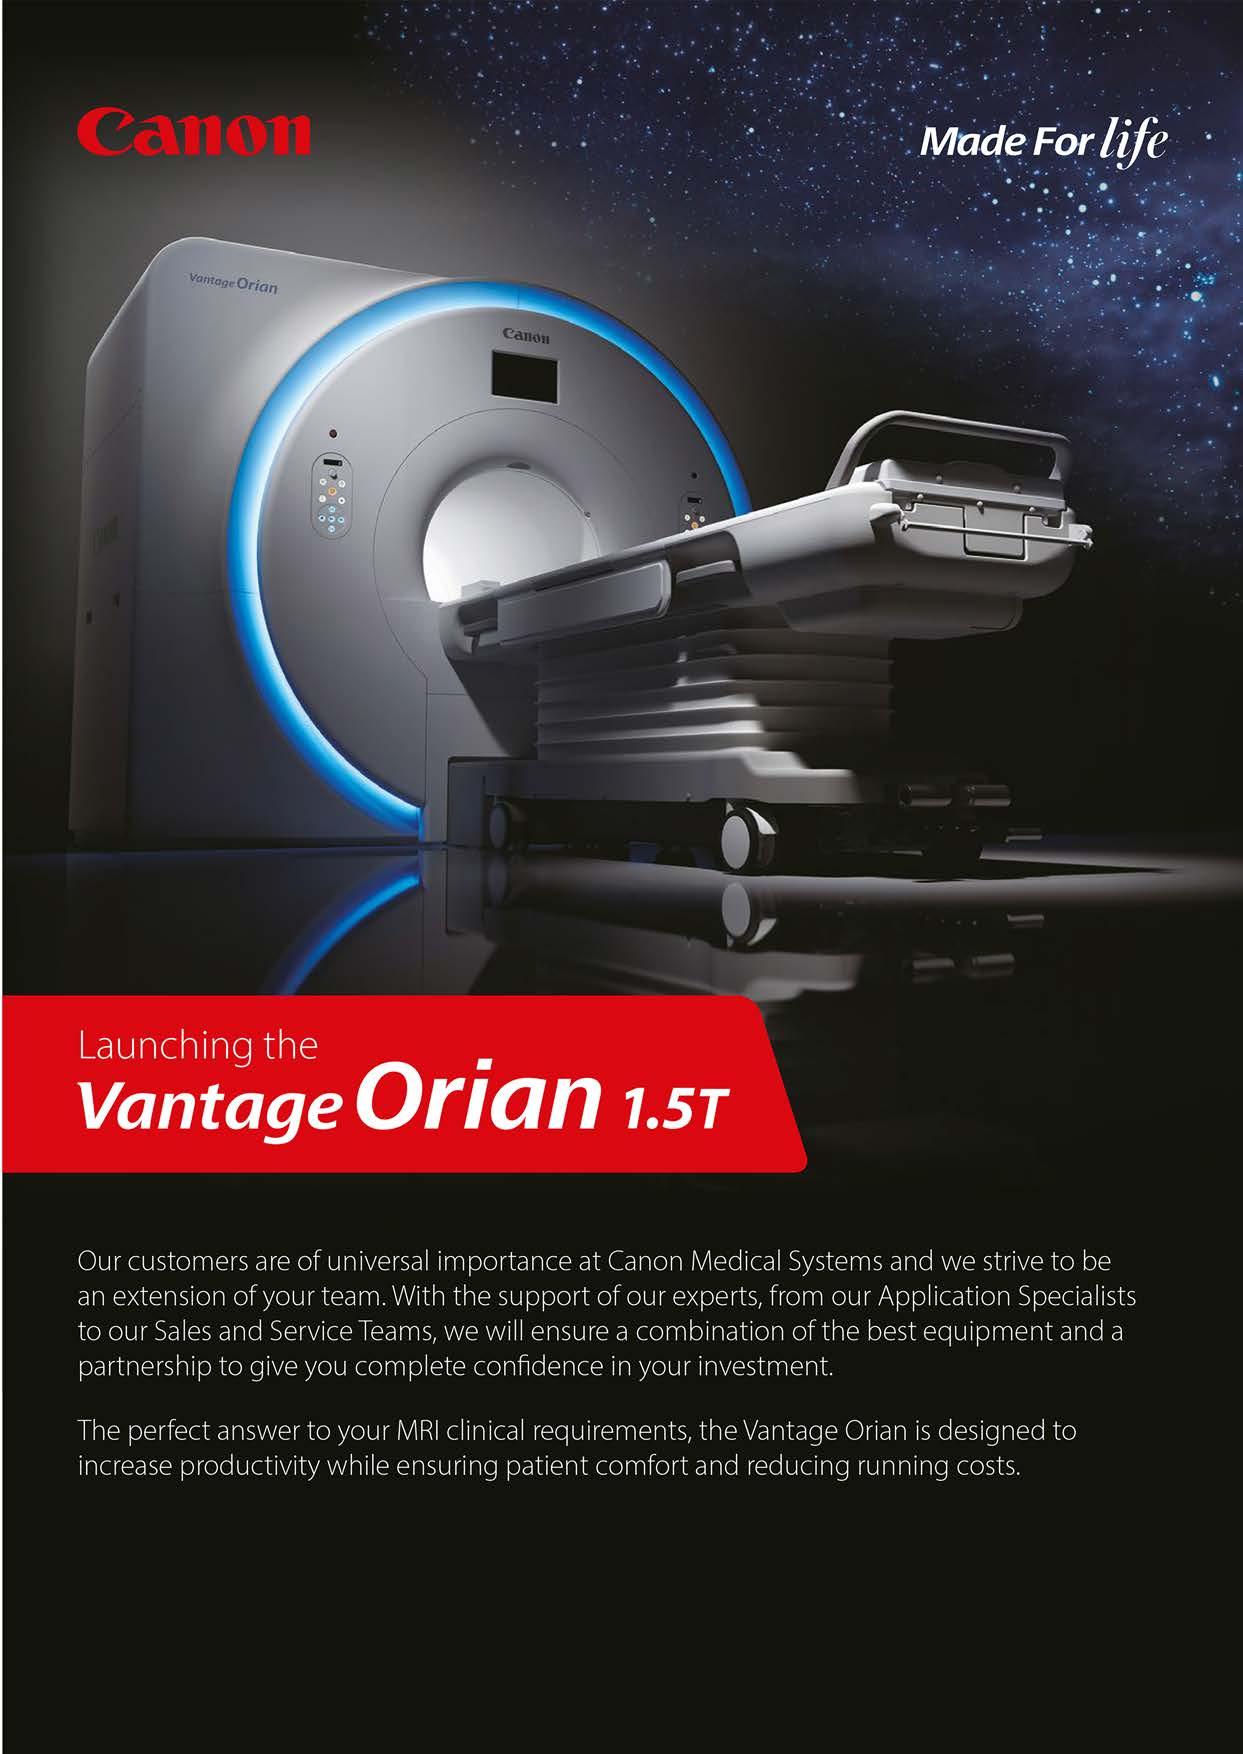
Advertisement
Current tools for assessing liver disease include the liver biopsy which has limitations i.e. it’s invasive and has no follow-up. MRI proton-density-fat-fraction is the gold standard of quantifying steatosis and of course we have histopathology. So, wouldn’t it be beneficial if ultrasound was able to assess and quantify steatosis, inflammation and fibrosis? The ongoing development and subsequent advancement of ultrasound, which is fully utilised within the Canon i and a series, provides not only exceptional 2D image quality, but also the essential liver analysis tools to assess and quantify liver disease. The Canon Medical Liver Analysis Package consists of: • Shearwave Elastography (quantifies the stiffness of the liver associated with Fibrosis – cirrhosis, alcoholic liver disease) • Attenuation Imaging (ATI) (quantifies the degree of fatty infiltration) • Dispersion Imaging (early stage of launch – quantifies the frequency dispersion, the liver viscosity).
Jane Hanford Ultrasound Clinical Product Specialist
Shearwave and attenuation imaging may be used in standalone mode, but more importantly, when all three are used together they provide both the radiologist, sonographer and the referring clinician, a deeper and better understanding of liver disease within minutes!
For this article, I am going to highlight Attenuation Imaging (ATI)
The success of implementing new technologies often goes hand in hand with questions like –
“What is it?” “How easy is it to use?” “Is this easily reproducible?” “Will it add to my scanning time?”
• Canon Medical’s Attenuation Imaging (ATI) was the first ultrasound imaging technique for steatosis quantification. • It consists of Real Time colour mapping and incorporates 4 quality factors • Takes less than 2 minutes for a full assessment • Strong and robust clinical evidences (vs biopsy and
MRI Proton Density Fat Fraction) • Better results than controlled attenuation parameter CAP
ATI is a non-invasive ultrasound technique that allows you to measure the change in the attenuation coefficient, by calculating the local slope of declining intensity.
The Attenuation coefficient should correlate with the degree of liver steatosis, as the higher the fat content, the higher the attenuation. As sonographers, we see the fatty liver quite frequently, as it occurs in approximately 30% of the population. There are varying degrees of steatosis such as non-alcoholic fatty liver disease (NAFLD), and non-alcoholic steatohepatitis (NASH), and if we could quantify this level of steatosis then maybe this would help influence clinical management resulting in less patients reaching the fibrosis stage – so let’s identify it earlier. The way we currently evaluate a fatty liver in a routine abdominal ultrasound examination, is by comparing the echogenicity of liver to kidney, however as we know this is a subjective assessment, that is where it ends… identifying the fatty infiltration with no quantification. ATI is probably the tool sonographers would want to use more often out of the Canon toolbox, is as easy as placing a colour Doppler region of interest box over the liver in your normal abdominal examination and allows you to put a value to that fatty liver, something we have not been able to do until now.
In brief – to perform attenuation imaging, you simply • Press the ATI subpreset button that is assigned on your system – the Attenuation Coefficient is then colour mapped onto the 2D B-mode image. • Press Freeze, not only does the image freeze, but a predefined measurement region of interest is displayed, in which the attenuation coefficient is measured in dB/cm/MHz • Move the measurement box into the light blue area and SET • Press your Report button and a colour coded report identifies if the measurement is in the normal, mild, moderate or significant level of steatosis. I think that answers the question.
Yes, it is, so let’s delve deeper. ATI can easily be incorporated into your normal abdominal examination procedure. Patient preparation is the same, as is patient positioning.
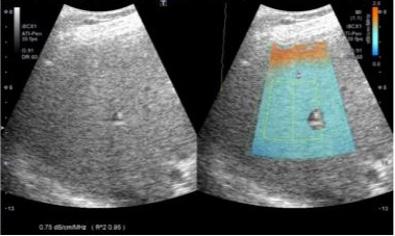
The ultrasound probe is placed perpendicular to the patient’s skin in an intercostal space over the right liver lobe. The box for the colour mapping of the attenuation coefficient is then placed over the liver parenchyma trying to avoid any large vessels, ducts and avoiding the artefacts from the capsule when measuring.
The colour mapped box consists of three colours:
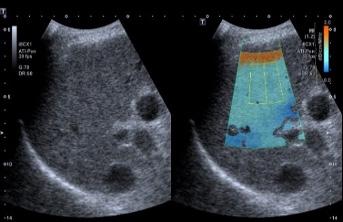
Orange Depicts the Liver Capsule Artifact Light Blue Depicts the best measurement area Dark Blue Avoid this deep area for measurement
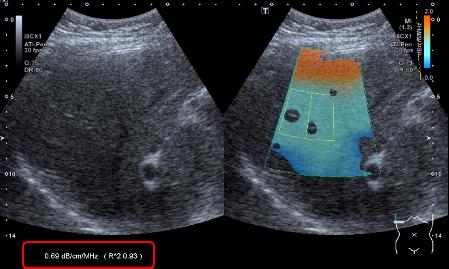
Once the Colour mapped box has been placed correctly, making sure the box includes the orange capsular artefact, and deeper darker blue highly attenuating areas, press Freeze. The measurement region of interest (ROI) populates immediately within the colour-mapped area – however, only measure in the light blue area of the colour map. The dark blue area indicates an area where the ultrasound beam has had a high degree of attenuation and the reading will be too weak to be accurate.
As a further quality indicator, and to ensure you only use accurate measurements, there is a profile uniformity index – R2, which has to be greater than 0.85 for each measurement to be statistically significant. If the measurement falls below the R2 value the measurement has to be disregarded. This is simplified further, as the figures appear in white indicating a good reading, yellow indicating the reading could be better, and red indicating that the reading is inaccurate. You can see in this image, that some vessels could not be avoided. In this instance, the system used an algorithm to suppress the vessel walls, as these behave differently with the fat cells, with fat infiltrating the liver tissue first.
So we have acquired an image, activated ATI, positioned the colour map away from vessels , performed the measurement in the light blue area, stayed away from the orange and dark blue areas, checked that the R2 number is above 0.85, and obtained a value. How do we assess the results?
Cut off values have been derived from research programmes, pilot studies, clinical evaluations and other assessments, that compare ATI with MRI PDFF, CAP and liver biopsies.
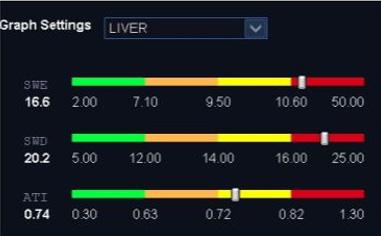
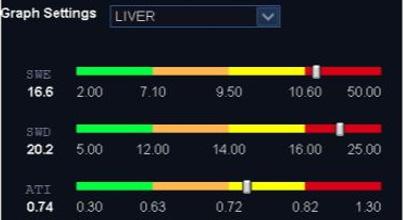
When your result is plotted on your report page, it is clearly depicted in a colour coded bar graph as seen below.
Normal range <0.63cm/Db/MHz which will lie in the green range Mild Steatosis >0.63 cm/Db/MHz and <0.72 cm/Db/ MHz which will lie in the amber range Significant Steaosis >0.72 cm/Db/MHz and <0.82 cm/Db/MHz which will lie in the yellow range Severe Steatosis >0.82 cm/Db/MHz which will lie in the red range
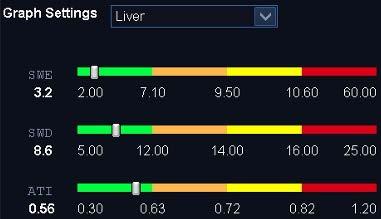
Normal Liver Parenchyma
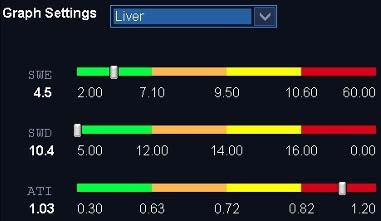
Severe Steatosis
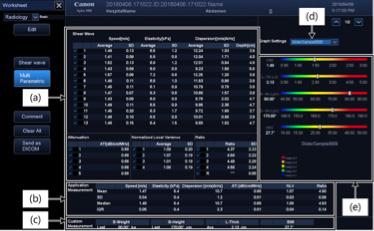
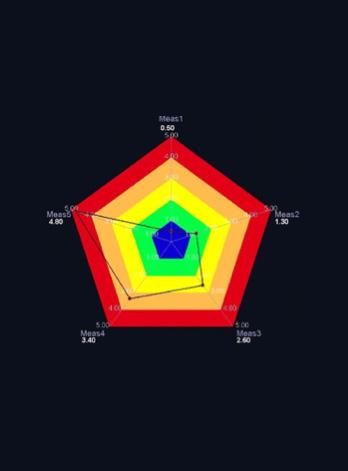
The multiparametric reporting functionality allows simultaneous comparison of all the available metrics from shearwave, dispersion imaging and attenuation imaging. It even allows the user to input ALT (alanine aminotransferase), AST (aspartate aminotransferase) blood results making it a very comprehensive report. All these results can be viewed in a bar graph, spider graph or tabular format.
The whole process is very efficient – no further preparation is needed for the patient, and ATI can be acquired very easily. By reading the above, you can see that this can be performed with just a few minutes more and as part of a routine ultrasound abdominal examination. So that’s the reading complete – now is the time to contact your application specialist or sales specialist to see if can be trialled on your current Canon i series, or possibly demo on a new system. //
References Recent clinical evidence is included for reference within this article.
1 Ferraioli G, Maiocchi L, Raciti MV, Tinelli C, De Silvestri A, Nichetti M, De Cata
P, Rondanelli M, Chiovato L, Calliada F, Filice C. Detection of liver steatosis with a novel ultrasound-based technique: a pilot study using MRI-derived proton density fat fraction as the gold standard. Clinical and translational gastroenterology. 2019 Oct;10(10). 2 Jeon SK , Lee JM , Joo I , Yoon JH , Lee DH , Lee JY , Han JK. Prospective Evaluation of Hepatic Steatosis Using Ultrasound Attenuation Imaging in Patients with
Chronic Liver Disease with Magnetic Resonance Imaging Proton Density Fat
Fraction as the Reference Standard 3 Ultrasound in Medicine & Biology. 2019 June 45 (6):1407-1416 4 Burgio MD, Ronot M, Reizine E, Rautou PE, Castera L, Paradis V, Garteiser P,
Van Beers B, Vilgrain V. Quantification of hepatic steatosis with ultrasound: promising role of attenuation imaging coefficient in a biopsy-proven cohort.
European radiology. 2020 Apr;30(4):2293-301. 5 Bae JS, Lee DH, Lee JY, Kim H, Yu SJ, Lee JH, Cho EJ, Lee YB, Han JK, Choi BI.
Assessment of hepatic steatosis by using attenuation imaging: a quantitative, easy-to-perform ultrasound technique. European radiology. 2019 Dec;29(12):6499-507
Upcoming Education Calendar 2021
From face-to-face courses and exhibitions, live webinars and educational events, we are dedicated to helping you expand your knowledge and gain CPD accreditation to demonstrate your professional development.
Tailored to your needs and evolving in tune with the imaging industry, our calendar of education, workshops and training courses is regularly updated and available at:
medicalimagingacademy.co.uk/ upcoming-education
Join a network of key opinion leaders, clinical luminaries and medical educators to help steer you on the journey to engaging and expansive education.
September
7th Wessex Diagnostic: Endovenous Laser Ablation Masterclass Location: Birmingham Duration: 1 day course with 6 CPD credits available Register here: wessexdiagnostic.com/training-courses/
October
19th and 20th Wessex Diagnostic: Vascular Ultrasound Imaging Course Location: To be announced Duration: 2 day course with CPD credits available Register here: wessexdiagnostic.com/courses/ vascular-ultrasound-imaging-course/
23rdCanon Medical Systems UK - Ultrasound Educational Event Location: Glasgow Duration: 1 day course with CPD credits available Register here:medicalimagingacademy.co.uk/ upcoming-education
November
4th and 5thBIR Annual Congress and Canon Mayneord Award Location: Virtual Online Webinar with up to 18 CPD credits available Duration:2 days (award: 2pm on the 5th) Register here:birorgukportal.force.com/CP Base__event_detail?id=a173Y00000Fokp1QAB
6thWessex Diagnostic: Venous Ultrasound Imaging course Location: Royal Society of Medicine, London, UK Duration:1 day course with 6 CPD credits available Register here: wessexdiagnostic.com/course s/venous-ultrasound-imaging-course/
11thCanon Medical Systems UK - Sports Medicine and MSK Solutions Location/format: The event will be hosted live from Old Trafford, Manchester and will also be available to access as a virtual webinar Duration: 1 day event with CPD credits available Register here: medicalimagingacademy.co.uk /courses/sports-medicine-and-msksolutions-2021/
NovemberCanon Medical Systems UK – Ultrasound Educational Events Location: Locations across the UK – further details to follow Duration: 1 day event per location with CPD credits available Register here: medicalimagingacademy. co.uk/upcoming-education
28th Nov - 2nd DecRSNA 2021 Location: McCormick Place, Chicago, USA Duration: 5 day event with CPD credits available Register here: rsna.org/annual-meeting
29th Nov - 10th DecBMUS 2021 Location: Virtual Online Conference Duration: 12 day event with CPD credits available Register here: bmus.org/ultrasound-2021/
The Medical Imaging Academy

Register to expand your knowledge
Registration and access to the Medical Imaging Academy is free and open to everyone in the medical imaging industry. Regular visitors can enjoy constantly evolving on-demand education videos, how-to guides and live webinars. Be the first to book online to specially designed, socially distanced training courses and hands-on practical workshops. Start your journey today Logon and register for 24/7 access. medicalimagingacademy.co.uk