
3 minute read
Trading systems for Deriv Synthetic Indecies

Chapter 6 Getting technical
There is no guarantee that analysing past market performance, whether on financial or Synthetic Indices, will lead to successfully predicting future market movements. Technical analysis tools are designed to help traders better understand market behaviour and analyse data for more informed decision-making.
Remember, trading always involves risk, and you should carefully consider this before engaging in any trades.
Technical analysis ignores the news and economic data, focusing purely on price trends and volume. It primarily involves studying chart patterns, which display the trading history and statistics of a market being analysed. You would start with a basic price chart which would show the indices trading price in the past and look for a trend or pattern that could help determine future pricing. Let’s look at a few tools for technical analysis in more detail.
As this guide focuses on Synthetic Indices, we will explore tools that are best suited to these products. However, if you have traded other markets such as Forex or Stocks, you will find that many of the tools and terms are familiar.
As mentioned earlier, Synthetic Indices are not affected by news, company earnings, or other factors that influence traditional markets.
For example, when the world went into lockdown in March 2020 due to the Covid-19 pandemic, many markets and industries—such as airlines and hospitality—suffered significant losses. However, Synthetic Indices continued to trade unaffected, and Deriv remained open 24/7.
Since Synthetic Indices are unaffected by news events, there is no need to consider fundamental analysis when analysing them.
Bar chart – Displays price data over a chosen time frame, from 1-minute bars to 1-month bars.
Candlestick chart – Similar to bar charts but visually clearer, making it a preferred choice for traders analysing price patterns over different time frames.

Line
Bar
Candlestick
Fig. 6.1. Comparison of line, bar, and candlestick charts used in market analysis
Charting packages like MT5 allow you to analyse a market, such as Volatility 10 Index, across different time frames.
Tip: In MT5, you can quickly switch chart styles by holding ALT and pressing 1, 2, 3, or 4.
Note: The same market can look very different depending on the time frame you choose. The same applies to indicators—for example, a 20-period moving average:
• On a 1-minute chart, it represents 20 minutes.
• On a 1-day chart, it represents 20 days.
• On a weekly chart, it represents 20 weeks.
Here, we see the top bar of MT5, displaying time frames ranging from 1-minute (M1) to monthly (MN) bars.
Trend following
The old saying “let the trend be your friend” applies here. With trend following, we can profit from both uptrends and downtrends.
Markets generally move in three states:
1. Uptrend – Higher highs and higher lows
2. Downtrend – Lower highs and lower lows
3. Sideways (range-bound) – Price moves within a defined range
Regardless of whether you’re trading Volatility 10 or Volatility 250, you will see similar patterns repeat over time. As you gain experience, you’ll learn to identify these trends and know how to react accordingly.
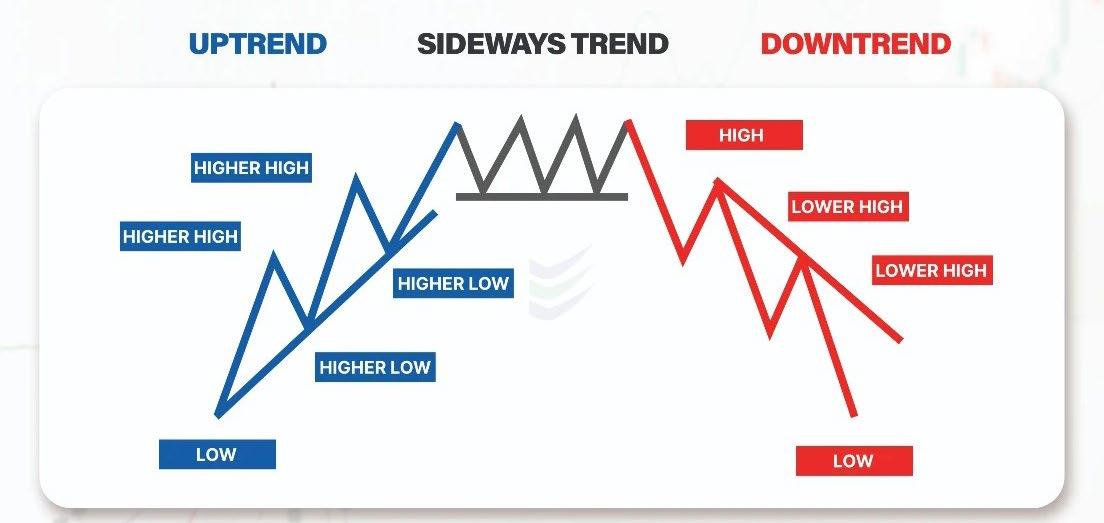
Fig. 6.2. MT5 top bar displaying time frames from 1-minute (M1) to monthly (MN) charts
Fig. 6.3. Uptrend, sideways trend, and downtrend patterns of market price movement