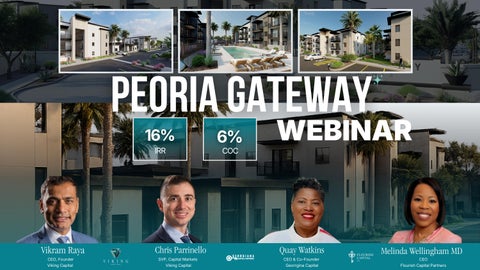
PEORIA GATEWAY 16% IRR
6% COC
WEBINAR
Vikram Raya
Chris Parrinello
Quay Watkins
Melinda Wellingham MD
CEO, Founder Viking Capital
SVP, Capital Markets Viking Capital
CEO & Co-Founder Georrgina Capital
CEO Flourish Capital Partners
SPEAKERS
Vikram Raya Co-Founder | Investment Strategist | Viking Capital 10+ years of experience in real estate investing, capital markets, and entrepreneurship Leads investment strategy, capital deployment, and strategic partnerships Specializes in identifying opportunities in high-growth, supply-constrained markets Georgetown University graduate with a disciplined, performance-driven investment approach Oversees the full investment lifecycle, from market selection and operator diligence to fund design and investor alignment Co-founded and helped scale Viking Capital into a nationally recognized multifamily investment platform $1B+ in real estate assets acquired 5,000+ multifamily units $250M+ in equity raised
Quay Watkins CEO & Founder, Georgiana Capital & Women Wealth Builders 20+ years of experience spanning entrepreneurship, business operations, strategic planning, and community leadership Founder and CEO of Georgiana Capital, focused on investment and wealth-building opportunities Founder and CEO of Women Wealth Builders, empowering women through financial education and wealth creation Former Executive Director of Boys & Girls Club of New Rochelle, where she led five youth development programs and spearheaded an expansion that doubled the organization's revenue and size Extensive experience in fundraising, partnership development, financial management, and strategic growth
Chris Parrinello SVP, Capital Markets & Head of Investor Relations $350M+ in private capital raised 1,100+ investors across Viking Capital’s investor platform Leads capital strategy, investor relations, and institutional capital formation Works closely with RIAs, family offices, and high-networth investors Focuses on portfolio construction, risk-adjusted returns, and capital stack structuring Emphasizes transparency and long-term investor alignment throughout the investment lifecycle Plays a key role in Viking Capital’s institutional growth and investor platform expansion Frequent speaker on alternative asset allocation, capital markets, and private real estate in modern portfolios
V I K I N G
C A P I T A L
2
ABOUT VIKING CAPITAL
2015 YEAR FOUNDED
6,522 TOTA L U N I T S AC Q U I R E D
$1.02B
Viking Capital is a multifamily real estate-focused investment firm. The original and institutional holding company for Viking Capital was established in 2015 and was created to serve the unique needs of institutional partners, family offices, high-net-worth investors, and advisory groups seeking access to high-performing multifamily investments. Viking Capital focuses on acquiring, developing, and optimizing highquality multifamily communities in growth markets throughout the United States. The firm’s strategy is rooted in disciplined market selection, operational precision, and a long-term commitment to quality—delivering consistent value to investors and an elevated standard of living for residents. By combining institutional rigor with community-forward thinking, Viking fosters sustainable, income-producing assets designed to outperform across market cycles.
A S S E T S AC Q U I R E D
V I K I N G
C A P I T A L
3
CYCLE-TESTED PERFORMANCE Viking Capital is a multifamily investment firm focused on disciplined execution, risk management, and long-term value creation across different market cycles.
6,522
Units
TOTA L U N I T S AC Q U I R E D
7,000 6,500 6,000 5,500 5,000 4,500 4,000 3,500 3,000 2,500 2,000 1,500 1,000 500 200 0
Rates & Supply
DFW SAN ANTONIO
Economic Downturns
PHOENIX
NASHVILLE
ATLANTA
COVID-19
HOUSTON SAN ANTONIO SOUTH BEND WASHINGTON, DC DALLAS AUSTIN ATLANTA
2015
2017
2018
2020
2021
2022
2023
2024
2025 V I K I N G
C A P I T A L
4
Viking Capital’s Track Record Disclaimer: This track record reflects all Viking Capital exits and corresponding performance metrics to date. While these results were achieved during a historically favorable period for multifamily dispositions, they demonstrate the firm’s disciplined execution, value creation, and successful realization strategies. Past performance was influenced by market conditions and is not necessarily indicative of results in the current or future economic environment. Please note that all properties marked with an asterisk () represent joint venture partnerships.*
Exit Date
Units
Projected Hold Period (Yrs)
Hold Purchase Period Price (Yrs)
Sale Price
Total Cap.
Deal Name
Location
Acq. Date
Reserve at Walnut Creek*
Austin, TX
2019
2022
284
4
3
$36.3M
Estates at Las Colinas*
Dallas, TX
2019
2022
415
4
3
$4M
$79.19M
$65.175M
$19M
$46.3M
The Avery*
Dallas, TX
2017
2022
304
4
5
$40.8M
$59.25M
$43.78M
$15M
Ascent at Riverdale I
Atlanta, GA
2017
2019
118
4
2
$4.125M
$6.732M
$5.9M
Wildcreek*
Atlanta, GA
2015
2018
242
4
3.25
$15.3M
$20.963M
Hills at East Cobb*
Atlanta, GA
2018
2021
268
4
3
$33.25M
Villas of South Cobb I*
Atlanta, GA
2016
2018
188
4
2.5
Villas of South Cobb II*
Atlanta, GA
2016
2019
152
4
2.5
Securities Offered by Patrick Capital Markets, Member FINRA/SIPC
Projected IRR
Realized IRR
Projected CoC
Realized CoC
Projected EM
Realized EM
15%
27.90%
8.27%
7.20%
2.37x
2.14x
19.61%
35.20%
75%
19.80%
22.20%
9%
6%
2.27x
1.73x
25.30%
25%
$30.6M
75%
18%
19.20%
8.70%
5.50%
2.1x
1.9x
22%
21.60%
$1.95M
$3.3M
80%
17.85%
34.70%
9.50%
9.50%
2.03x
1.76x
22.64%
38%
$16.6M
$5.75M
$11.475M
75%
20.67%
15.20%
9.16%
9.12%
2.03x
1.65x
20.70%
20%
$39M
$35.6M
$9.4M
$26.2M
79%
16.50%
4.80%
8.38%
7.83%
2.09x
1.1x
21.91%
3.30%
$12.4M
$15.32M
$14.22M
$4.3M
$9.92M
80%
17.80%
25.10%
8.80%
8.13%
2.01x
1.48x
20.20%
19%
$10.25M
$13.35M
$12M
$4.313M $7.687M
75%
17.20%
25.30%
8.90%
8.18%
2.03x
1.48x
20.73%
19%
Equity
Debt
LTV
$46.825M $40.615M $15.75M $24.865M 68.50%
Projected Realized AAR AAR
V I K I N G
C A P I T A L
5
CURRENT PROPERTIES
OPEN RAISE AVONDALE COMMONS
Property Details
A
Asset Class
Avondale, AZ
2025
Year Constructed
324
No. of Units
OPEN RAISE PEORIA GATEWAY
Property Details
B
Asset Class
Atlanta MSA, GA
1988
Year Constructed
188
No. of Units
ELEVATE ON MAIN
Property Details
B+
Asset Class
South Bend, IN
2000
Year Constructed
400
No. of Units
2026
A
Year Constructed
Asset Class
ELEVATE AT STEWARTS MILL
Property Details
Phoenix, AZ
200
No. of Units
PARK 33
Property Details
B+
Asset Class
2018
188
No. of Units
ELEVATE WOODSTOCK
Property Details
B
Asset Class
Atlanta, GA
1986
Year Constructed
Property Details
B
Asset Class
Nashville, TN
1985
Year Constructed
232
No. of Units
ELEVATE GREENE
South Bend, IN
Year Constructed
THE HAMILTON PREMIER APARTMENTS
120
No. of Units
Property Details
B
Asset Class
Atlanta, GA
2005
Year Constructed
252
No. of Units
AVONDALE HILLS
Property Details
A
Asset Class
B+
Asset Class
Stockbridge, GA
1999
Year Constructed
368
No. of Units
2022
Year Constructed
240
No. of Units
Property Details
A
Asset Class
ELEVATE EAGLE’S LANDING
Property Details
B+
Asset Class
MARBELLA PLACE
Property Details
Atlanta MSA, GA
THE TOWNHOMES AT BLUEBONNET TRAILS
Atlanta, GA
2006
Year Constructed
176
No. of Units
A
Asset Class
Washington, DC
2010
Year Constructed
2020-2021 Year Constructed
114
No. of Units
A
Asset Class
Houston, TX
2007
Year Constructed
49
No. of Units
Property Details
B
Asset Class
192
No. of Units
Marietta, GA
1980
Year Constructed
AUSTIN/ SAN ANTONIO TX
2012
A
Year Constructed
Asset Class
252
No. of Units
ELEVATE AT HUEBNER GROVE
KINGS COVE
Property Details
Property Details
Property Details
B
Asset Class
VERITAS AT EAST COBB
THE GRIFFIN
Property Details
Dallas-Fort Worth, TX
VILLAS AT SUNDANCE
192
No. of Units
1981
Property Details
B+
Asset Class
Atlanta MSA, GA
1998
Year Constructed
268
No. of Units
ELEVATE AT THE POINTE
San Antonio, TX
Year Constructed
ELEVATE AT DAWSON FOREST
Property Details
B
210
Asset Class
No. of Units
Atlanta, GA
1969
Year Constructed
181
No. of Units
THE HYPE
Property Details
B
Asset Class
Atlanta, GA
1960
Year Constructed
14
No. of Units
V I K I N G
C A P I T A L
6
PARTNERING WITH AN ESTABLISHED DEVELOPER Michael Holman
VP, Development and Finance at Overland Group, Inc.
Overland specializes in multifamily, mixed-use, hospitality, and storage projects, with a track record of approximately $750 million in total developments, earning multiple awards for their design and development capabilities.
Runs development and finance at Overland Group Overseeing current pipeline of ~$400M worth of development Arranged over $250M worth of financing on development projects Licensed Certified Public Accountant
V I K I N G
C A P I T A L
7
8 4 5 5 W G R A N D AV E N U E , P E O R I A , A R I Z O N A L O C AT E D I N A Q U A L I F I E D O P P O R T U N I T Y Z O N E
peoria gateway A P A R T M E N T S
200 UNITS
PHOENIX, AZ NEW CONSTRUCTION
$6.0M PREFERRED EQUITY
2026
CLASS A MULTIFAMILY
16% IRR
6% COC
V I K I N G CA P L LC .C O M F O R I N F O R M AT I O N A L P U R P O S E S O N LY – N O T A N O F F E R T O S E L L S E C U R I T I E S . O F F E R S C A N B E M A D E O N LY B Y T H E C O N F I D E N T I A L P R I VAT E P L A C E M E N T M E M O R A N D U M . V I K I N G
C A P I T A L
8
D I S C L O S U R E S This presentation is for informational purposes only and does not constitute an offer to sell or a solicitation to purchase any security. Any offering is made only through the applicable Private Placement Memorandum (PPM), subscription documents, and related offering materials. Investments involve risk, including the possible loss of principal. There is no guarantee of returns, distributions, or investment objectives. Any projected, targeted, or estimated returns are forward-looking statements and are not guarantees of future performance. Real estate investments are illiquid and may not be suitable for all investors. Preferred equity investments are subordinate to senior debt and involve additional risks. Past performance is not indicative of future results. Tax, legal, and retirement account information provided is for educational purposes only. Investors should consult their own professional advisors. Investing through a self-directed IRA involves specific rules and requirements. Investors should consult their custodian and advisors before investing. Please review all offering documents carefully and conduct your own due diligence prior to making any investment decision. The material contained in this Offering Memorandum is confidential, furnished solely for the purpose of considering an investment in the Property and is not to be used for any other purpose or made available to any other person without the written consent of Viking Capital LLC. The material has been obtained from sources Viking Capital deems to be reliable; however, Viking and its affiliates make no representations or warranties regarding the accuracy or completeness of this material. Among other considerations, prospective investors should recognize that this Offering Memorandum contains forward-looking statements (including projections as to construction schedules and costs, operating results, and economic trends), all of which are inherently speculative and many of which are based on future events not within the control.
V I K I N G
C A P I T A L
9
INVESTMENT HIGHLIGHTS
200 UNITS
PEORIA, AZ
2027 16% Year Built
IRR
6% COC
Up to
$6.0M PREFERRED EQUITY
V I K I N G
C A P I T A L
10
Peoria Gateway 8455 NW GRAND AVE, PEORIA, ARIZONA
200 Units 2027 Completion Date 3 Story + Townhomes 191, 488 Rentable Sq. Ft. 957 Average Unit SF
V I K I N G
C A P I T A L
11
DEVELOPMENT TIMELINE
2025
JAN-DEC 2025
2025-2026
PERMIT IN HANDS
EQUITY RAISE
CONSTRUCTION STARTS
All required permits secured, enabling construction to move forward and reducing development execution risk.
Capital commitments secured from investors, strengthening the capital stack and funding the project’s next phase.
Site work and vertical construction commenced, marking the transition from planning into active development.
2026-2027
Q1 2027
NOV. 2027-JUNE 2028
Q3 2028
LEASING STARTS
FIRST DELIVERY OF UNITS
STABILIZATION
SALE
Pre-leasing launched with marketing and tenant outreach underway, beginning the path toward occupancy stabilization.
Initial units delivered and available for occupancy, generating the project’s first operating revenue.
Occupancy and operations reached stabilized levels, supporting consistent cash flow and longterm asset performance.
Asset marketed for disposition following stabilization, with exit timing aligned to performance objectives and market conditions.
V I K I N G
C A P I T A L
12
SITE PLAN & PROGRESS
Started Going Vertical
V I K I N G
C A P I T A L
13
UNIT 1 Bedroom 120 Units - 60%
mix 2 Bedroom 56 Units - 28%
3 Bedroom 24 Units - 12%
V I K I N G
C A P I T A L
14
ACCOLADES
1
CITY TO LIVE, WORK, # AND PLAY Ranking Arizona
1
MASTERPLANNED # COMMUNITY IN ARIZONA Ranking Arizona
2
#
BEST PLACE TO LIVE IN ARIZONA Ranking Arizona
SUBMARKET OVERVIEW
PEORIA TOP BOOMTOWNS IN
20 AMERICA Smart Asset
V I K I N G
C A P I T A L
15
PROPERTY LOCATION
PEORIA GATEWAY 25 miles
2 miles
Glendale
15 miles
Scottsdale Phoenix
V I K I N G
C A P I T A L
16
SUBMARKET OVERVIEW
PEORIA MAJOR EMPLOYMENT INDUSTRY:
HEALTHCARE 12,550+ healthcare professionals employed in Peoria, making healthcare the city's largest employment sector. Home to nationally recognized healthcare systems, including Banner Health, Mayo Clinic, HonorHealth, Abrazo Health, Valleywise Health, Cigna, Select Medical, and City of Hope. Arizona's healthcare industry generates $78B in annual economic impact. Supports nearly 1 million jobs and $69B in personal income statewide. V I K I N G
C A P I T A L
17
FIRST HIGH-VOLUME ADVANCED-PACKAGING OSAT FACILITY IN THE U.S.
$12 BILLION
MULTI-PHASE INVESTMENT 3,500+ JOBS
Peoria Is Becoming a Major U.S. Semiconductor Hub $12B investment | 3,500+ jobs | Multiphase campus | Production begins 2028 Broke ground in 2025 First facility will be complete in 2027 Production begins early 2028 V I K I N G
C A P I T A L
18
WHY PEORIA, ARIZONA
PEORIA, AZ | LOCATION HIGHLIGHTS Diversified Economy: Strong employment base across healthcare, finance, education, technology, manufacturing, logistics, retail, and professional services. Strong Employment Growth: Employment has grown 130%+ over the past 20 years, supporting sustained housing demand. Major Employers Nearby: Close to Honeywell Aerospace, U-Haul International, and Amkor Technology, among other major employers. Connected Location: Convenient access to Arizona State University West, Grand Canyon University, Phoenix Sky Harbor Airport, and State Farm Stadium. Lifestyle & Amenities: Near major retail and entertainment destinations including P83 Entertainment District, Arrowhead Towne Center, Park West, and Peoria Gateway.
V I K I N G
C A P I T A L
19
PROXIMITY TO PROPERTY
1 Mile
3.1 Miles
3.7 Miles
4.1 Miles
West Valley Art Museum
Slick City Action Park
Outlet Mall
P83 Entertainment District
4.1 Miles
4.8 Miles
5.1 Miles
Peoria Sports Complex
Arrowhead Towne Center
Westgate Entertainment District
V I K I N G
C A P I T A L
20
PEORIA: A VALUE-ORIENTED SUBMARKET WITHIN A MAJOR GROWTH METRO
Market Snapshot METRIC Average / Advertised Rent Multifamily Cap Rates 2026 Absorption New Supply
What Makes Peoria Interesting PEORIA/ WEST VALLEY ~$1,575
PHOENIX MSA
01
Access to major West Valley corridors across semiconductor, manufacturing, healthcare and logistics.
~$1,529
02 ~5.5%–6.75%* Positive
~5.0% Class A
YTD <6,700 units
moderating
delivered H1 2026
Active suburban
Activity
market
ACTIVE INVESTMENT MARKET One of the more active suburban cities for recent Phoenix multifamily transactions.
12,400+ units
Elevated,
Investment
EMPLOYMENT GROWTH
Broad MSA market
03
DEMAND IS ABSORBING SUPPLY Phoenix absorption exceeded deliveries through H1 2026, helping vacancy improve.
04
SUPPLY PRESSURE IS MODERATING Fewer than 6,700 units delivered in H1 2026, with the construction pipeline declining. V I K I N G
C A P I T A L
21
SUPPLY PIPELINE
NEARBY PROJECTS ( WITHIN ~5 MILES OF 455 NW GRAND AVE, PEORIA AZ ) PROJECT NAME
DEVELOPER / OWNER
TYPE
STATUS
UNITS
MARLOWE PEORIA PLACE
GREYSTAR RE PARTNERS
3-STORY GARDEN
COMPLETE - MAY 2025
370
BELLA OLIVIA
BELLA FLOR COMMUNITIES
BTR
COMPLETE - JAN 2025
112
THE SOMERSET
RIDGEHOUSE CAPITAL
4-STORY GARDEN
COMPLETE - MAR 2025
234
GREENLIGHT COMMUNITIES
3-STORY GARDEN
COMPLETE - JUNE 2025
190
SUMMERWELL PEORIA PLACE
GREYSTAR RE PARTNERS
BTR
COMPLETE - NOV 24
255
PROPOSED - 5 MILE RADIUS
-
-
PROPOSED
456
STREAMLINER 87TH
WH AT
T H IS
M E ANS
P E O R I A GAT E WAY W I L L B E T H E O N LY N E W M U LT I FA M I LY P R O P E R T Y I N A 5 - M I L E R A D I U S TO C O M E TO M A R K E T OV E R T H E N E XT 4 Y E A R S
V I K I N G
C A P I T A L
22
PHOENIX TOP EMPLOYERS
BANNER HEALTH
AMAZON
HONEYWELL
AMERICAN EXPRESS
EMPLOYS 55,000
EMPLOYS 36,000
EMPLOYS 7,111
EMPLOYS 7,000
ST JOSEPH’S HOSPITAL
ASU
SROUTS
WELLS FARGO
EMPLOYS 5,000
EMPLOYS 18,500
EMPLOYS 13,526
EMPLOYS 15,000
V I K I N G
C A P I T A L
23
BOOMING growth 8Million
PHOENIX CONTINUES TO EXPAND
7Million
+1.95M PEOPLE
6Million
4Million 3Million 2Million 1Million
18 80 18 90 19 00 19 10 19 20 19 30 19 40 19 50 19 60 19 70 19 80 19 90 20 00 20 10 20 20 20 30 20 40 20 50
0Million
PROJECTED GROWTH
5Million
ADDED TO THE PHOENIX MSA SINCE 2000
And GROWING
~7.1 million projected by 2050 V I K I N G
C A P I T A L
24
PHOENIX MULTIFAMILY
From Supply Wave to Market Rebalancing Strong renter demand and slowing new supply are improving the market's supply-demand balance.
Why Phoenix DURABLE RENTER DEMAND Absorption has averaged more than 5,600 units per quarter since the beginning of 2025, even during a period of below-trend employment growth.
SUPPLY IS RESETTING After more than 65,000 units were delivered across Greater Phoenix over the prior three years, developers are bringing new construction closer to long-term averages. Northmarq expects roughly half as many units to deliver in 2H 2026 as did in 2H 2025.
EMPLOYMENT & CAPITAL INVESTMENT Large capital investments, including semiconductor and advanced manufacturing projects, are supporting the region's longer-term employment base. Northmarq expects employment growth to rebound and contribute to continued expansion.
12,400+ UNITS ABSORBED H1 2026
<6,700 UNITS DELIVERED H1 2026
7 of 8 QUARTERS OF PIPELINE DECLINE
Net absorption has outpaced new deliveries through the first half of 2026.
The lightest first-half delivery volume since 2022.
Units under construction declined in seven of the past eight quarters.
V I K I N G
C A P I T A L
25
PHOENIX MULTIFAMILY: SUPPLY IS REBALANCING
SUPPLY PRESSURE IS BEGINNING TO EASE Near-term pressure is cyclical, not structural. SUPPLY GROWTH TEMPORARILY OUTPACING DEMAND Annual change, Phoenix MSA — Illustrative
Supply Growth (%)
Demand Growth
3.5
3.0
2.5
2.0
1.5
1.0
0.5
0
1.0
2.0
3.0
4.0
5.0
6.0
7.0
Sources: Northmarq, Phoenix Multifamily Market Reports, Q4 2025 & Q1 2025; Cushman & Wakefield, Phoenix Multifamily MarketBeat Q1 2025.
V I K I N G
C A P I T A L
26
R E N T
V S
B U Y
Phoenix, Arizona
$19.6K
AFFORDABILTY GAP Source: Zillow, August 2026
AVERAGE MONTHLY MORTGAGE
$3,356
MORTGAGE + PROPERTY TAXES + HOMEOWNERS INSURANCE
AVERAGE MONTHLY RENT
$1,722
V I K I N G
C A P I T A L
27
Investment SUMMARY
P E O R I A
G A T E W A Y ,
P H O E N I X ,
V I K I N G
A Z
C A P I T A L
28
A
PREF EQUITY
H Y B R I D
B E T W E E N
D E B T
A N D
E Q U I T Y
PRIORITY POSITION Paid before common equity, subject to available cash flow.
DID YOU KNOW?
DOWNSIDE PROTECTION Common equity generally absorbs losses first. PREFERRED RETURN Receives a contractual preferred return before common equity participates. LAST IN. FIRST OUT. Priority for distributions and return of capital, subject to the deal structure. V I K I N G
C A P I T A L
29
INVESTMENT OFFERING
CAPITAL STRUCTURE $1.4M
GP: EQUITY
$9.0M
LP: CLASS B
$3.8M
LP: RESERVE
$6.0M
PREF EQUITY
$45.0M
DEBT
Project Cost Debt Pref Equity Common Equity
$65,205,426 $45,000,000 $6,000,000 $14,205,426
Reserved Class
Hold Period
~2 years
IRR
16.00%
Current Pay
6.00%
Accrued Return
10.00%
V I K I N G
C A P I T A L
30
Property COMPARIBLES
V I K I N G
C A P I T A L
31
ONE BEDROOM
PROPERTY
UNIT TYPE
YEAR BUILT
SF
UNITS
AVG. EFFECTIVE RENT
$ / PSF
MARLOWE PEORIA PLACE
1x1
2025
823
370
$1,800
$2.19
VILLAGE AT PIONEER PARK
1x1
2022
680
332
$1,745
$2.57
VLUX AT PEORIA HIEGHTS
1x1
2022
647
189
$1,694
$2.62
VILLAS ON OLIVE
1x1
2017
634
153
$1,699
$2.68
COMP WEIGHTED AVG.
1x1
718
1,044
$1,749
$2.44
PEORIA GATEWAY
1x1 - Junior
648
48
$1,570
$2.42
PEORIA GATEWAY
1x1
762
72
$1,735
$2.28
716
120
$1,669
$2.33
PEORIA WEIGHTED AVG.
V I K I N G
C A P I T A L
32
TWO BEDROOMS
UNIT TYPE
YEAR BUILT
SF
UNITS
AVG. EFFECTIVE RENT
$ / PSF
MARLOWE PEORIA PLACE
2x2
2025
1,176
370
$2,223
$1.89
SUMMERWELL PEORIA PLACE
2x2
2024
1,078
255
$2,188
$2.03
VILLAGE AT PIONEER PARK
2x2
2022
1,011
332
$2,195
$2.17
VLUX AT PEORIA HEIGHTS
2x2
2022
995
189
$2,104
$2.11
VILLAS ON OLIVE
2x2
2017
990
153
$1,799
$1.82
PEORIA GRAND APARTMENTS
2x2
1985
864
144
$1,550
$1.79
1,046
1,443
$2,083
$1.99
953
48
$1,945
$2.04
PROPERTY
WEIGHTED AVG. PEORIA GATEWAY
2x2
V I K I N G
C A P I T A L
33
THREE BEDROOMS
UNIT TYPE
YEAR BUILT
SF
UNITS
AVG. EFFECTIVE RENT
$ / PSF
SUMMERWELL PEORIA PLACE
TH
2025
1,921
15
$2,599
$1.35
VILLAGE AT PIONEER PARK
TH
2024
1,462
8
$2,099
$1.44
VILLAS ON OLIVE
TH
2023
1,467
26
$2,020
$1.38
1,605
49
$2,210
$1.38
PROPERTY
COMP WEIGHTED AVG. PEORIA GATEWAY
3x2 - TH
1,868
8
$2,724
$1.46
PEORIA GATEWAY
3x3 - TH
1,868
24
$2,842
$1.52
1,868
32
$2,813
$1.51
PEORIA WEIGHTED AVG.
V I K I N G
C A P I T A L
34
SALES COMPARIBLES
LOCATION
# OF UNITS
YEAR BUILT
SALE DATE
SALE PRICE
PRICE PER UNIT
PRICE PER SF
AVG UNIT SF
500 W CAMELBACK RD
PHOENIX
280
2024
4/15/2025
$87,000,000
$310,714
$246.64
841
SPIRE DEER VALLEY
24100 N 19 T H AVE
PHOENIX
388
2024
1/15/2025
$131,1000,000
$337,887
$241.86
1004
THE MCKINLEY
280 W MCKINLEY ST
PHOENIX
108
2019
5/30/3035
$30,600,000
$283,333
$230.52
775
SLATE SCOTTSDALE
18220 N 68 T H ST
PHOENIX
278
2016
7/18/2025
$97,375,000
$350,270
$272.79
920
ILUMINATE URBAN APARTMENT HOMES
290 E ROOSEVELT ST
PHOENIX
111
2016
5/30/2025
$30,6000,000
$275,676
$216.25
790
LINEAR APARTMENT HOMES
295 E ROOSEVELT ST
(PART OF A 3 PROPERTY PORTFOLIO)
PHOENIX
104
2016
5/30/2025
$28,800,000
$276,923
$250.43
873
MASON OLIVER
11 S 12 T H ST
PHOENIX
292
2015
7/28/2025
$62,300,000
$213,356
$294.73
826
MARQUIS AT DESERT RIDGE
2115 N 56 T H ST
PHOENIX
370
2014
1/23/2025
$126,000,000
$340,541
$337.74
911
LEVEL AT SIXTEENTH
1550 E CAMPBELL AVE
PHOENIX
240
2008
6/30/2025
$61,500,000
$256,250
$170.80
786
OBSIDIAN ON GLENADALE
7601 W GLENDALE AVE
PHOENIX
216
2023
7/18/2024
$52,000,000
$240,740
$254
920
GLEN 91
8991 W GLENDALE AVE
PHOENIX
296
2023
7/12/2024
$76,500,000
$258,445
$244
871
CUVEE AT WESTGATE
7200 N 91 S T AVE
PHOENIX
310
2022
11/16/2023
$86,000,000
$277,419
$554
886
PROPERTY NAME
PROPERTY ADDRESS
ONYX UPTOWN PHX
(PART OF A 3 PROPERTY PORTFOLIO)
(PART OF A 15 PROPERTY PORTFOLIO)
(PART OF A 3 PROPERTY PORTFOLIO)
V I K I N G
C A P I T A L
35
PEORIA GATEWAY
Q&A V I K I N G
C A P I T A L
36
INVESTMENT HIGHLIGHTS
200 UNITS
PEORIA, AZ
2027
16%
6%
Year Built
IRR
COC
$6M Preferred equity
Quay Wallace Watkins Georgina Capital
Melinda Willingham Flourish Capital LLC
INVEST IN PEORIA GATEWAY
Up to
A P A R T M E N T S
CONTACT US georgianacapital2@gmail.com mwillingham39@gmail.com
*Limited Shares Remaining. Scan the code & BOOK A CALL with Chris Parrinello to learn more about this investment opportunity in this booming Phoenix submarket.
In Partnership With
BOOK A CALL V I K I N G
C A P I T A L
37