WOMEN
WORK
& WAGES
WOMEN, WORK & WAGES 2026 REPORT: SPOTLIGHT ON OCCUPATIONAL SEGREGATION & PARENTHOOD
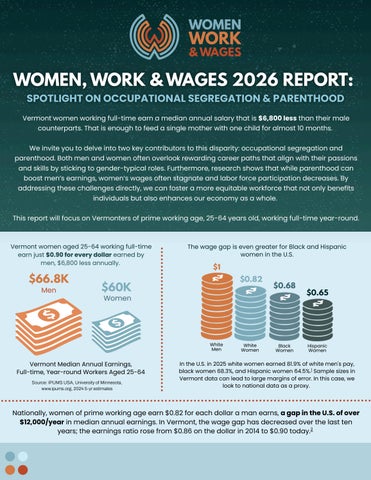
Vermont women working full-time earn a median annual salary that is $6,800 less than their male counterparts. That is enough to feed a single mother with one child for almost 10 months. We invite you to delve into two key contributors to this disparity: occupational segregation and parenthood. Both men and women often overlook rewarding career paths that align with their passions and skills by sticking to gender-typical roles. Furthermore, research shows that while parenthood can boost men’s earnings, women’s wages often stagnate and labor force participation decreases. By addressing these challenges directly, we can foster a more equitable workforce that not only benefits individuals but also enhances our economy as a whole. This report will focus on Vermonters of prime working age, 25-64 years old, working full-time year-round.
Vermont women aged 25-64 working full-time earn just $0.90 for every dollar earned by men, $6,800 less annually.
$66.8K Men
The wage gap is even greater for Black and Hispanic women in the U.S.
$1
$0.82
$60K
$0.68
Women
White Men
Vermont Median Annual Earnings, Full-time, Year-round Workers Aged 25-64 Source: IPUMS USA, University of Minnesota, www.ipums.org, 2024 5-yr estimates
White Women
Black Women
$0.65
Hispanic Women
In the U.S. in 2025 white women earned 81.9% of white men's pay, black women 68.3%, and Hispanic women 64.5%.1 Sample sizes in Vermont data can lead to large margins of error. In this case, we look to national data as a proxy.
Nationally, women of prime working age earn $0.82 for each dollar a man earns, a gap in the U.S. of over $12,000/year in median annual earnings. In Vermont, the wage gap has decreased over the last ten years; the earnings ratio rose from $0.86 on the dollar in 2014 to $0.90 today.2
Occupational segregation is common in Vermont.
WOMEN
WORK
37%
& WAGES
Men
OCCUPATIONAL SEGREGATION Occupational Segregation is the phenomenon where people tend to cluster into specific occupations by gender and/or race or ethnicity. Many of the most common occupations for both Vermont women and men have median earnings below the basic needs budget for a single parent with one child. However, three of the most common occupations for men earn considerably higher than than the threshold whereas only one of the top female occupations does.
About half of Vermont’s fulltime, prime-working-age adults work mainly with others of their own gender.
38%
Women 51%
49%
Only 15% of men work in female-dominated occupations and 11% of women work in maledominated occupations.
11%
15%
Maledominated occupations
Equally represented occupations
Femaledominated occupations
Source: IPUMS USA, University of Minnesota, www.ipums.org, 2024 5-yr estimates. Male- and female-dominated occupations are comprised of males and females respectively constituting 60% or more of workers in the occupation.
Female and male median income for most common occupations in Vermont, 2024 VT Basic Needs Budget, urban single person with one child $74,466 COMPUTER AND MATHEMATICAL
$96K
MANAGEMENT
$92K
BUSINESS AND FINANCIAL
M e n
$85K
SALES AND RELATED INSTALLATION, MAINTENANCE, & REPAIRS
Occupations employing 75% of Vermont Men
TRANSPORTATION CONSTRUCTION & EXTRACTION PRODUCTION OFFICE AND ADMIN SUPPORT
OFFICE AND ADMIN SUPPORT
W o m e n
SALES AND RELATED
Occupations employing 75% of Vermont Women
COMMUNITY AND SOCIAL SERVICES EDUCATION, TRAINING, & LIBRARY BUSINESS AND FINANCIAL MANAGEMENT HEALTH DIAGNOSING OR TREATING PRACTIONERS
$10,000
$20,000
$30,000
$40,000
$50,000
$87K
$60,000
$70,000
$80,000
$90,000
Source: IPUMS USA, University of Minnesota, www.ipums.org, 2024 5-yr estimates for full-time, year-round workers. The Vermont basic needs budget is calculated annually by the The Vermont Legislative Joint Fiscal Office3
Census occupational categories can hide segregation. About 16% of prime-working‑age, full‑time Vermont workers are in “management,” a category that overall shows a roughly even gender split. A closer look at specific jobs reveals more separation.
Men in management occupations have an annual median income about $17,000 higher than women. Data for Vermont suggests women are more likely to be social service, health, or education and childcare managers; while men are more likely to be construction managers or chief executives.
Median Annual Pay for Full-time Vermonters in Management Occupations
$92K Men
$75K
Women
WOMEN
WORK
& WAGES
WAGE GAP IS HIGHEST AMONG HIGHLY EDUCATED AND HIGHLY PAID
Wage Gap in Vermont by Income Quartile
$0.16
75TH PERCENTILE OF INCOME (HIGHER INCOMES)
ON EVERY $ $15,650/YEAR
$0.10
ON EVERY $ $6,800/YEAR
50TH PERCENTILE OF INCOME
$0.07
25TH PERCENTILE OF INCOME (LOWER INCOME)
ON EVERY $ $3,260/YEAR
The wage gap is highest at the highest income levels. As people move up the earning ladder, the wage gap actually increases. For the top 25% of earners in Vermont, men’s median earnings are $0.16 higher on every dollar than women’s. However, among the lowest 25% of income earners, men only make $0.07 more than women. Minimum wage creates a wage floor, whereas there is no wage ceiling. There are many low paid men and women, but fewer highly paid women than men. We saw this in the occupational segregation data on the previous page, where the highest paid common occupations for men earn significantly more than the highest paid common occupations for women. It also sheds light on the increasing earnings gap at the highest education levels.
Source: IPUMS USA, University of Minnesota, www.ipums.org, 2024 5-yr estimates
Women earn less than men at every level of education. Higher education raises pay, but widens the gender wage gap. Highest Level of Education for Vermonters of Prime Working Age 13%
22%
Graduate or Professional Degree
26% 29%
Bachelor’s Degree
24% 23% 31%
22%
Some College, Associate’s Degree High School Diploma Less than HS or Not Applicable
Male
Median Annual Earnings in 2024 by Educational Attainment for Vermonters Working Full-time of Prime Working Age Women’s Earnings
Men’s Earnings
$104.0 k
Graduate or Professional Degree
$77.2 k $75.3 k
Bachelor’s Degree Some College, Associate’s Degree HS Diploma
$62.6 k $61.8 k $53.3 k $55.0 k $47.4 k
Female Data source: IPUMS USA, University of Minnesota, www.ipums.org, 2024 5-yr estimates
Although the proportion of Vermont women and men with a bachelor's degree is comparable (29% and 26%, respectively), more Vermont women earn a graduate degree (22% vs 13%). A greater percentage of women pursue more education after high school (74% of women and 63% of men). The median income for women with higher levels of education is similar to men with less education. For example, the median income for women with a graduate degree is comparable to the income of men with a bachelor's degree.
WOMEN
WORK
& WAGES
PARENTHOOD Occupational segregation is not the only driver of the wage gap. The wage gap also exists within occupations driven by factors such as parenthood and discrimination.
Fathers earn more than men without children, widening the gender pay gap even as mothers’ wages rise over women without children.
Wage Gap Without Kids Under 18
91
CENTS
With Kids Under 18
88 CENTS
Fathers Mothers
$9,000 $6,300
$6300 in increase increase in wages for wages for mothers over nonmothers over mothers non-mothers
$9,000 increase in increase in wages for wages for fathers over nonfathers over fathers non-fathers
Source: IPUMS USA, University of Minnesota, www.ipums.org, 2024 5-yr estimates for full-time, year-round prime working age Vermonters with and without children under 18
Fathers generally earn more than mothers and men who are not fathers Mothers with children under 18 who work full-time earn about $0.88 for every $1 earned by fathers in Vermont. By comparison, women without children earn about $0.91 for every $1 earned by men without children. Although mothers in their prime working years earn more than women without children under 18, fathers see a larger wage increase, which widens the gap.
Fathers tend to earn more than men who are not fathers, a phenomenon known as the fatherhood premium.4 Women, even those working full-time after becoming parents, do not benefit from a similar boost. 53% of Vermont mothers with children at home work full-time. Wage-gap statistics that only examine full-time working parents hide some of the impacts of motherhood on women’s earnings. Women with young children are less likely to work full-time than men.
The fatherhood premium in Vermont is most visible among 35-44 year olds. Median Wage for Full-time, Year-Round Workers Aged 35-44 by Gender & Parenthood Status
Men, No child under 18
Fathers, Child under 18
Women, No child under 18 Mothers, Child under 18
Source: IPUMS USA, University of Minnesota, www.ipums.org, 2024 5-yr estimates
The fatherhood premium becomes pronounced for full-time workers aged 35– 44, during peak parenthood years. Fathers in that age group with children under 18 earn about 19% more than comparable men without children. Women’s pay does not change meaningfully due to parenthood. Interestingly, the fatherhood premium does not show up in this data for other age groups. This may be due to educational or other differences beyond the scope of this report.
WOMEN
WORK
Childcare availability and cost impact the ability of parents of young children to participate in the workforce. Parents with Children Under the Age of 6 in Vermont
& WAGES Men
CHILDCARE Vermont Act 76 continues to improve childcare affordability and access-- two factors which influence whether parents work fulltime, part-time, or leave the workforce altogether. Women with children under age six are more likely than similar men to work part-time or not participate in paid employment.
Subsidies through the Child Care Financial Assistance program, expanded through Act 76, are tapered so that families do not face a benefits cliff if a parent gets a raise or opportunity for increased hours. The benefits cliff is when a pay increase causes a loss of public benefits greater than the value of the pay increase. For families earning up to 175% of the federal poverty level (about $47,810 for a family of three in 2026), the subsidy covers the full cost of childcare. As family income increases, the subsidy gradually decreases, ending at 575% of the federal poverty level (around $157,090 for a family of three in 2026).
Full-time 70%
Part-time 3%
Not working or seasonal workers 27%
Women Full-time 46%
Part-time 13%
Not working or seasonal workers 41%
Source: IPUMS USA, University of Minnesota, www.ipums.org, 2024 5-yr estimates
Vermont still struggles with a shortage of childcare slots. In 2026 a statewide report found that of the children likely to need care, only an estimated 40% of infants, 70% of toddlers, and 69% of preschoolers have access to a full-day, fullyear slot from licensed childcare providers.5 Annual Childcare Costs for Sample Families with Median Vermont Income with Act 76 Subsidies & Universal Pre-K
SINGLE PARENT with children under 18
MARRIED COUPLE with children under 18
Median Annual Income:
Median Annual Income:
$3,900
$19,500
for family of 2 or 3 (or 7% of annual income)
for family of 3 (or 14% of annual income)
$3,900
$15,600
$57,910
Infant Only
Infant & Preschooler (family of 3-4)
Preschooler & Older child not in childcare
$137,525
for family of 3 (or 7% of annual income)
for a family of 4 (or 11% of annual income)
$1,275
$11,610
for a family of 3 (or 2% of annual income)
for a family of 4 (or 8% of annual income)
Actual costs may be higher depending on childcare center actual tuition. Preschool care assumes 35 weeks of Universal Pre-K subsidies, valued at $3,982/year. This analysis assumes families are not paying more or less than the listed CCFAP family share less universal pre-K support. CCFAP subsidies are per family with the benefit applied to youngest child in care first.6
WHO ARE VERMONTERS?
WOMEN
WORK
& WAGES
Due to small sample sizes, some disaggregated data, such as wage gap by race in Vermont, has a large margin of error. While race, gender, sexual orientation, and other characteristics impact the wage gap, we are not able to explore that in depth for Vermont in this report.
Vermont Population by Age & Gender Men
Racial Identity of Vermont Women
Women
Black
1% Blac…
91% White
White
Other
Other 1%
6%
Two or More…
Asian 2%
Two or More Races
Asian
Vermont men show a similar racial breakdown as women. Source: IPUMS USA, University of Minnesota, www.ipums.org, 2024 5-yr estimates
Gender Identity of Vermonters The limited survey data available for Vermonters outside of the gender binary suggest this group is under 5% of the overall population. Source: U.S. Census Bureau, Household Pulse Survey, Phase 4.0-4.2, January 2024-September 2024.
Family Type of Vermonters, by presence of own children under age 18 Single Dad 3.6% Single Mom 7.4%
Source: IPUMS USA, University of Minnesota, www.ipums.org, 2024 5-yr estimates
Disability Status of Vermonters, Age 25-64
While disability rates are identical for men and women of prime working age in Vermont, their workforce participation rates are not. 26% of prime working age men with a disability work full-time in Vermont and only 21% of women do.
88%
Without Disability
12%
With Disability
Two Parent Household 24.7%
Two Adult Household without Children 53.4%
Source: IPUMS USA, University of Minnesota, www.ipums.org, 2024 5-yr estimates
Single Man 4.1% Single Woman 6.8%
Source: US Census, American Community Survey, 2024 1-yr estimates table B11003
Disability is defined as a respondent identifying difficulty with one or more of the following areas: hearing, vision, cognition (concentrating, remembering, or making decisions), ambulation (walking or climbing stairs), self care (dressing or bathing), independent living (doing errands alone). The American Community Survey (ACS) asks a question about each of these areas independently, which this analysis uses to create a summary category identifying people with and without a disability.
WOMEN
A DEEPER DIVE
WORK
& WAGES
Why Focus on Vermonters of Prime Working Age Employed Full-time, Year-Round? Vermont Year-Round Workforce Participation by Age & Gender, Full & Part-time Status Part-time Men
Full-time Men
Part-time Women
Full-time Women
Younger and older workers display different employment characteristics as they start their careers, prioritize educational pursuits, and enter semiretirement. This report focuses on Vermonters aged 25–64 to capture prime working‑age experience. Wage data cover only full‑time, year‑round workers for consistent comparisons. Women, especially those ages 35–64, are more likely than men to work part‑time.
Source: IPUMS USA, University of Minnesota, www.ipums.org, 2024 5-yr estimates. Teachers are mainly included with year-round workers.
Additional Resources: “Working with Disability” Vermont Center for Independent Living 2020 report, https://vcil.org/wp-content/uploads/2021/04/Working-with-Disability.pdf. Vermont Futures Project (Economic Action Plan Data Visualizations), Public Assets Institute (State of Working Vermont 2025), and The J. Warren & Lois McClure Foundation’s “Most Promising Jobs” have data sections exploring employment and income issues in Vermont. For more on Act 76 and childcare issues, see Building Bright Futures’ “Report on Act 76 Monitoring” submitted to the Vermont Legislature 1/15/2026 (https://legislature.vermont.gov/assets/Legislative-Reports/Report-on-Act-76Monitoring-January-2026-Building-Bright-Futures.pdf) and First Children’s Finance “2026 Vermont Supply Demand Gap Analysis”. For more on how occupational segregation shows up in the pipeline, see Department of Labor “Vermont Registered Apprenticeship Annual Report submitted to the Vermont Legislature 12/19/2025 (https://legislature.vermont.gov/assets/LegislativeReports/2025-Registered-Apprenticeship-Program-Annual-Report.pdf). For more on living wages in Vermont, see The Vermont Legislative Joint Fiscal Office 2024 Vermont Basic Needs Budgets And Livable Wage Report. For more gender disaggregated data for Vermont, visit Institute for Women’s Policy Research State Policy Action Lab: https://statepolicyactionlab.org For a deeper dive on the Fatherhood Premium nationally, see Pew Research Center https://www.pewresearch.org/social-trends/2023/03/01/the-enduring-grip-of-thegender-pay-gap/
Follow this QR code to get to clickable links for these resources
THANKS & FOOTNOTES
WOMEN
WORK
& WAGES
REPORT PARTNERS Vermont Works for Women (VWW) promotes economic justice by advancing gender equity and supporting women and youth at every stage of their career journeys through programming for girls, women, gender-expansive folks and workplaces. Learn more at www.vtworksforwomen.org The Vermont Women’s Fund improves the lives of women and girls across Vermont through focused philanthropy, strategic partnerships, and research. This report reflects that commitment, supported by VWF’s investment in efforts to better understand the most pressing issues they face. Learn more at www.vermontwomensfund.org Vermont Commission on Women (VCW) is an independent non-partisan state government commission working to advance rights and opportunities for cisgender and transgender women and girls and gender expansive people in Vermont since 1964. Learn more at www.women.vermont.gov
DATA PARTNERS We want to extend our heartfelt thanks to all the contributors who made this report possible. By grounding our efforts in data, we aim to spark discussions, inspire action, and continue building a stronger, more inclusive Vermont for everyone. We would like to thank our data partner Public Assets Institute for compiling the data. This report was informed by many perspectives. We would especially like to recognize the contributions of: Mat Barewicz, Vermont Department of Labor Rhoni Basden, Vermont Works for Women Cary Brown, Vermont Commission on Women Emily Bush, Vermont Women’s Fund Cynthia Char, Char Associates Suzanne Eikenberry, Vermont Works for Women
FOOTNOTES 1
Kate Gluckman, Vermont Works for Women Vicki Hart, DLH Corporation Julie Lowell, Public Assets Institute Sujata Moorti, Middlebury College Jillian Scannell, Vermont Works for Women Ellen Tierney, Vermont Works for Women
Emma Cohn and Elise Gould. “The gender pay gap widened slightly in 2025" Economic Policy Institute Equal Pay Day, 3/19/26. https://www.epi.org/blog/the-gender-pay-gap-widened-slightly-in-2025-how-trumps-first-year-in-office-hurt-women-and-what-states-can-do-to-fix-it/ 2 IPUMS USA, University of Minnesota, www.ipums.org, 2024 5-yr estimates. The wage gap is the same for 25-64 year olds as for 16+ using 2024 5year estimates. For historical Vermont data, see Public Assets Institute 5/28/2026 Jobs Brief, https://publicassets.org/research-publications/progresstoward-gender-wage-equality-is-slowing. 3 The Vermont Joint Fiscal Office Basic Needs Budget is a market-based analysis of the income required for different household configurations to cover essential living expenses (housing, food, transportation, childcare, healthcare, and taxes) for both rural and urban Vermonters. 4 Pew Research Center https://www.pewresearch.org/social-trends/2023/03/01/the-enduring-grip-of-the-gender-pay-gap/ 5 First Children’s Finance “2026 Vermont Supply Demand Gap Analysis” (https://www.firstchildrensfinance.org/app/uploads/2025/12/2026-SDGBrief.pdf) 6 Median income from U.S. Census Bureau, American Community Survey, 2024, 1-yr estimates. Cost of childcare from State of Vermont, Department of Children and Families, Child Development Division “Child Care Financial Assistance Income Guidelines” effective 3/25/2025.