Market Research Report · Global Outlook 2026 –2035
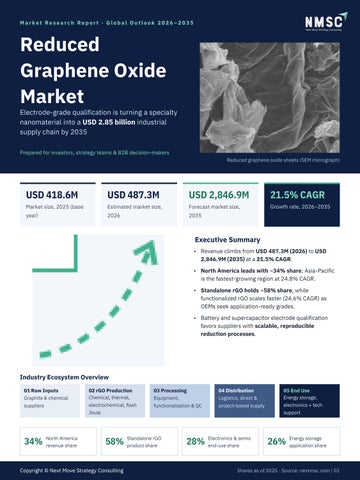
Reduced Graphene Oxide Market Electrode-grade qualification is turning a specialty nanomaterial into a USD 2.85 billion industrial supply chain by 2035 Prepared for investors, strategy teams & B2B decision-makers Reduced graphene oxide sheets (SEM micrograph)
USD 418.6M
USD 487.3M
USD 2,846.9M
21.5% CAGR
Market size, 2025 (base
Estimated market size,
Forecast market size,
Growth rate, 2026–2035
year)
2026
2035
Executive Summary • Revenue climbs from USD 487.3M (2026) to USD 2,846.9M (2035) at a 21.5% CAGR. • North America leads with ~34% share; Asia-Pacific is the fastest-growing region at 24.8% CAGR. • Standalone rGO holds ~58% share, while functionalized rGO scales faster (24.6% CAGR) as OEMs seek application-ready grades. • Battery and supercapacitor electrode qualification favors suppliers with scalable, reproducible reduction processes.
Industry Ecosystem Overview 01 Raw Inputs Graphite & chemical
02 rGO Production Chemical, thermal,
03 Processing Equipment,
04 Distribution Logistics, direct &
05 End Use Energy storage,
suppliers
electrochemical, flash
functionalization & QC
project-based supply
electronics + tech
Joule
America 34% North revenue share
support
rGO 58% Standalone product share
Copyright © Next Move Strategy Consulting
& semis 28% Electronics end-use share
storage 26% Energy application share
Shares as of 2025 · Source: nextmsc.com | 01
02 · Market Size & Segmentation
Where Value Concentrates: Regions, Products & Applications Regional Market, 2025 vs 2035 2025
Key Insights
2035 (USD M)
CAGR
Asia-Pacific
1,019.3
North America
Latin America Middle East & Africa
24.8%
• Functionalized rGO nearly closes the gap with standalone rGO: USD 1,374.3M vs 1,472.6M by 2035.
20.5%
866.4
Europe
• Asia-Pacific overtakes North America by 2035 (USD 1,019.3M vs 866.4M) on a 24.8% CAGR.
20.1%
677.8 141.8
22.3%
• Energy storage stays the largest application, scaling from USD 108.8M to 786.3M.
141.6
22.0%
• Sensors add USD 389.3M of new revenue at the fastest application CAGR (27.2%).
Product Split, 2025
Applications: 2035 Revenue & CAGR USD million, 2035 forecast
CAGR 26–35
Energy Storage
786.3
Conductive Coatings
498.7
22.6% 20.9%
Sensors ▲ fastest
441.6
27.2%
Composites
418.9
20.2%
Electronics
308.2
20.7%
Standalone rGO · 58% USD 242.4M · 20.1% CAGR
Biomedical
148.9
23.4%
Membranes
129.4
20.5%
Thermal Mgmt.
79.8
USD 418.6M
Functionalized rGO · 42% USD 176.2M · 24.6% CAGR
22.0%
Segment Leaders Across Report Axes Segmentation axis
Largest segment (2025 share)
Fastest-growing (CAGR 2026–35)
Production Route
Chemical Reduction · ~47% (USD 196.7M)
Flash Joule Heating · 29.3%
End Use Industry
Electronics & Semiconductors · ~28% (USD 117.6M)
Automotive & EV · 26.0%
Services
Custom Synthesis · ~34% (USD 49.8M)
Joint Development · 25.8%
Grade
Industrial Grade · ~41% (USD 171.6M)
Custom Grade · 25.1%
Channel
Direct · ~46% (USD 192.6M)
Project-Based · 24.9%
Customer Type
Industrial OEM · ~39% (USD 163.3M)
Research Lab · 23.4%
Copyright © Next Move Strategy Consulting
Source: nextmsc.com | 02
03 · Growth Drivers & High-Growth Segments
Electrode Demand and New Reduction Routes Power Growth Growth Catalyst & Risk Matrix
What Is Driving Demand
Impact on CAGR (+/− percentage points), 2026–2035 DRIVERS Battery & supercapacitor electrode demand
+5.8% +4.2%
Conductive coatings in electronics Lightweight composites (aero, auto)
• Electronics miniaturization favors thin, solution-processable rGO films for flexible circuits, EMI shielding and printed sensors.
+3.6%
Flash Joule heating economics
+3.1%
Government nanotech R&D funding
+2.9%
RESTRAINTS High industrial-grade production cost
• Lightweight composites in aerospace and automotive add +3.6 pts, led by North America and Europe. • Cost is the key hurdle: production cost runs 30–40% above conventional carbon black additives.
−3.4% −2.7%
Batch-to-batch quality variability Limited nanomaterial regulatory clarity Alternative conductive carbon additives
• Battery capacity build-out is lifting qualification volumes for conductive additives, including rGO — the single largest driver (+5.8 pts).
−2.2% −1.9%
High-Growth Segments vs. Market Average (CAGR 2026–2035)
Market 21.5%
Flash Joule Heating · route
29.3%
Sensors · application
27.2%
Automotive & EV · end use
26.0%
Joint Development · service
25.8%
Custom Grade · grade
25.1%
Project-Based · channel
24.9%
Functionalized rGO · product
24.6%
Emerging Trends Reshaping Supply
01
02
03
04
Flash Joule Heating
Functionalization
Electrode Qualification
Sensors & Biomedical
Millisecond, low-solvent
Amine, carboxyl and metal-
Graphenea and XFNANO
Wearable, gas and biosensor
reduction; CealTech is piloting
oxide groups create premium,
expanded dispersion capacity
substrates widen the
scaled reactors.
application-ready grades.
for battery demand.
addressable market.
Copyright © Next Move Strategy Consulting
Source: nextmsc.com | 03
04 · Regional Opportunities
Growth Opportunity Map: Asia-Pacific Sets the Pace Europe
Asia-Pacific
USD 108.9M → 677.8M
USD 130.2M → 1,019.3M
CAGR 20.1%
CAGR 24.8%
34% share Fastest
North America USD 139.6M → 866.4M CAGR 20.5%
Middle East & Africa USD 20.3M → 141.6M
Latin America
CAGR 22.0%
USD 19.6M → 141.8M
Bubble size = 2035 market
CAGR 22.3%
Values: 2025 → 2035
Country Hotspots · CAGR 2026–2035 (USD M, 2025 → 2035) China48.7 → 431.2
Brazil9.3 → 58.4
27.5%
India12.6 →
22.9%
UAE4.3 →
108.9
26.4
26.8% 22.6%
Regional Insights • Asia-Pacific becomes the largest region by 2035 (USD 1,019.3M), with China the fastest-growing country at 27.5% CAGR. • North America leads today with ~34% share; the U.S. alone was USD 102.4M in 2025.
South Korea16.4 → 118.7
Japan18.3 → 112.6
24.9%
Saudi Arabia5.1 →
23.0%
22.4%
U.S. (largest)102.
20.1%
33.6
4 → 582.6
Whitespace Opportunities USD 2,359.6M absolute opportunity, 2026–2035 Battery Electrode Qualification Long-term supply agreements with cell makers for consistent, scalable functionalized rGO.
Flexible & Printed Electronics
• Europe reaches USD 677.8M, anchored by Germany, the UK and France; composites and flash Joule heating drive demand.
Paste and ink formats for flexible circuits and printed sensors replacing metal films.
• MEA and Latin America start small (~USD 20M each) but outpace the global average at 22.0% and 22.3% CAGR.
Win research labs and formulators early, before they scale to industrial-grade procurement.
Copyright © Next Move Strategy Consulting
Custom Synthesis & Joint Development
Source: nextmsc.com | 04
05 · Competitive Scenario
A Moderately Fragmented Field Competing on Consistency Competitive Positioning Matrix Specialist Pure-Plays
Structure
Scale-Up Innovators
Moderately fragmented: 20 companies profiled; share data for top 10.
CealTech AS
Graphenea S.A. Technical depth & customization →
Market Positioning
Two dominant archetypes Pure-plays (Graphenea, XFNANO) win on customization; diversified makers (The Sixth Element) on scale and cost.
Carbon Waters SAS
XFNANO
How suppliers win qualification
Abalonyx AS
Research & Niche
• • • •
Volume Manufacturers
Ossila Ltd.
Batch-to-batch consistency Functionalization capability Application-specific dispersions at scale Documented sheet resistance & particlesize data
The Sixth Element Nanografi
Production scale & cost efficiency → Indicative qualitative positioning based on NMSC archetype analysis; not to scale.
Leading Companies Profiled The Sixth Element
Graphenea S.A.
Graphenano Group
Perpetuus Advanced Materials
Ossila Ltd.
LayerOne AS
CealTech AS Carbon Waters SAS
XFNANO
Nanografi Nano Technology
Advanced Graphene Products
Abalonyx AS
+ 8 more
Partnerships & JDAs
Capacity Expansion
M&A
The dominant strategy: joint development with battery and electronics OEMs creates more nearterm value than consolidation.
Selective build-outs: dispersion capacity (Graphenea, XFNANO) and scaled flash Joule reactors (CealTech).
Limited versus broader nanomaterials, reflecting early commercialization and still-differentiated production technologies.
Latest Developments NOV 2025 · Partnership
DEC 2025 · MOU
JUN 2026 · Product showcase
Graphenea Semiconductor and Melexis collaborate on GFET-on-CMOS biosensor platforms.
The Sixth Element and Graphene Square (South Korea) partner on mass-production commercialization.
Nanografi presents graphene-based conductive inks at TechBlick Electronics RESHAPED USA.
Copyright © Next Move Strategy Consulting
Source: nextmsc.com | 05
06 · Let's Connect
Thank You Connect with our analysts for in-depth insights on the reduced graphene oxide market, segment-level forecasts and strategic guidance tailored to your investment or growth agenda.
Global Reduced Graphene Oxide Market · Analysis period 2025–2035
Click here for the complete report →
Contact Us Official W ebsite
Contact Number
www.nextmsc.com
+1 857 758 5017
info@nextmsc.com
Inside the Full Report
20
33
8
2035
Companies profiled, with
Countries covered across
Segmentation axes, from
Forecast horizon; base
market share for 10
5 regions
production route to end
year 2025
use
Follow Us gen-dedup-3f2c492dbf239e3cca5fdf11dea0f333.png
YouTube
Follow Next Move Strategy Consulting for the latest market intelligence and research releases
Copyright © Next Move Strategy Consulting
www.nextmsc.com | 06