MONTHLY Sales & Pricing
MLS of Southern Arizona® Market Snapshot
All data is updated in realtime in accordance with content from MLSSAZ. Updated on: Jul 7, 2026
Region
City : Oro Valley
▼
County
$ Between
▼
▼
Enter a value
Enter a value
Average Sqft
2,509
Median Sale Price
$640,000
16.2% from previous year
6
4.5% from previous year
Average $/sqft
2
Median Days on Market
$274
4 2.5
$700,069
-26.2% from previous year
$800,000-$999,999 $1.2M+
Average Sale Price
$33,603,316
5
$700,000-$799,999
0
Download
Volume 11
$600,000-$699,999
▼
▼
-29.4% from previous year
3
$1M-$1.19M
AgeRstr.
48
12
$400,000-$499,999 $500,000-$599,999
Beds
▼
# of Sales
5
$300,000-$399,999
(1)
▼
and Enter a value
and Enter a value
June
Zip Code
▼
Type: Single Family Residence
▼
Sqft Between
(1)
5
7.5
10
12.5
40
-6.1% from previous year
4 from previous year
$300,000-$399,999
10.42%
25%
Keyboard shortcuts
$400,000-$499,999
Map data ©2026 Google, INEGI
Median Sale Price (last 365 days)
$500,000-$599,999
6.25%
$600,000-$699,999
$700,000-$799,999
22.92%
10.42%
Terms
Report a map error
$530,000
$800,000-$999,999
12.5%
$699,900 $1M-$1.19M
$1.2M+
4.17%
8.33%
Jan 1, 2024 - Jun 30, 2026 arrow_drop_down
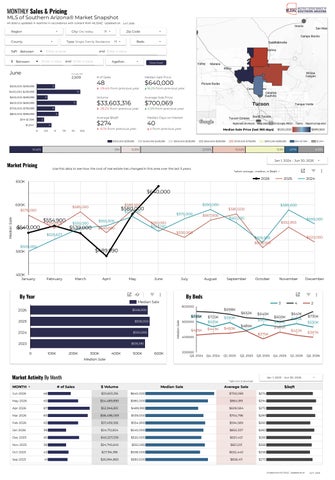
Market Pricing
Use this data to see how the cost of real estate has changed in this area over the last 3 years.
*select average , median, or $/sqft >
2026
650K
2025
2024
$640,000 600K $578,000 elaS naideM
$540,000 550K
$554,900 $550,000
$550,000
$539,000
$590,000
$589,500
$585,000
$580,000 $575,000 $555,000
$570,000 $551,000 $543,190
$540,000
450K January
$552,065
$559,000
$520,000
$519,000 $508,000
$489,990
February
March
April
May
By Year
June
$735K $605K
$558,000 $550,000
2023
$535,190
0
100K
200K
300K Median Sale
400K
500K
# of Sales
October
$698K
$443K
$450K
200000 Q3, 2024 Q4, 2024
Q1, 2025
600000
$425K
$652K
$640K $562K
$484K $479K
4
$600K $534K $464K
$375K
400000
600K
November
3 $590K
Market Activity By Month ▼
September
$725K $535K
elaS naideM
2024
August
800000
$548,000
2025
July
By Beds
Median Sale
2026
MONTH
$561,000
$530,000
$525,627 $500,000 500K
$567,000
$589,000
$580,500
Q2, 2025
Q3, 2025 Q4, 2025
$641K $575K $422K
Q1, 2026
Jan 1, 2023 - Jun 30, 2026
December
2 $735K $530K $397K
Q2, 2026
arrow_drop_down
*right-click to download
$ Volume
Median Sale
Average Sale
$/sqft
Jun 2026
48
$33,603,316
$640,000
$700,069
$274
May 2026
63
$54,489,890
$580,000
$864,919
$294
Apr 2026
87
$52,946,851
$489,990
$608,584
$272
Mar 2026
83
$58,498,059
$539,000
$704,796
$289
Feb 2026
63
$37,459,108
$554,900
$594,589
$260
Jan 2026
38
$24,712,824
$540,000
$650,337
$283
Dec 2025
65
$40,327,336
$520,000
$620,421
$265
Nov 2025
38
$24,745,645
$552,065
$651,201
$268
Oct 2025
43
$27,194,918
$508,000
$632,440
$258
Sep 2025
41
$26,994,860
$580,500
$658,411
$273
All data from MLSSAZ,.. Updated as of:
Jul 7, 2026
MONTHLY Buyer Demand
MLS of Southern Arizona® Market Snapshot
All data is updated in realtime in accordance with content from MLSSAZ. Updated on: Jul 7, 2026
Region
City : Oro Valley
▼
County
$ Between
Enter a value
▼
Enter a value
▼
June
and Enter a value
2,509
$400,000-$499,999
2 0
16 from previous year
Median Sale Price 2.5
5
7.5
10
Average % Over Asking
$640,000
4
$1.2M+
12.5
4 from previous year
65
-26.2% from previous year
6
40
Average Days on Market
$33,603,316
5
$1M-$1.19M
Median Days on Market
Volume
11
$800,000-$999,999
▼
Download
▼
-29.4% from previous year
3
$600,000-$699,999
AgeRstr.
48
12
$700,000-$799,999
Beds
▼
# of Sales
5
$500,000-$599,999
(1)
▼
and Enter a value
Average Sqft
$300,000-$399,999
Zip Code
▼
Type: Single Family Residence
▼
Sqft Between
(1)
-2.64%
16.2% from previous year
Keyboard shortcuts
0.13% from previous year
Map data ©2026 Google, INEGI
Median Sale Price (last 365 days)
Days on Market
Median
61
57 43
40
9 0
53
52
44 45
20
$699,900
*select median or average >
80
27
Report a map error
$530,000
This graphic will help to show how fast listings are going under contract now vs. in previous years.
60
Terms
40 33
31
34
24
14
14
15
12
13
32 24
19
36
35
28
25
41
36
33
27
50
46
39
39 32
20
32
46 39
20
71
70
48
65
59
59
57
55
45
40 32
29 22
16
12
36
42
76
64
49
68
Average
40 31
30
16
Oct 2023 Dec 2023 Feb 2024 Apr 2024 Jun 2024 Aug 2024 Oct 2024 Dec 2024 Feb 2025 Apr 2025 Jun 2025 Aug 2025 Oct 2025 Dec 2025 Feb 2026 Apr 2026 Jun 2026 Nov 2023 Jan 2024 Mar 2024 May 2024 Jul 2024 Sep 2024 Nov 2024 Jan 2025 Mar 2025 May 2025 Jul 2025 Sep 2025 Nov 2025 Jan 2026 Mar 2026 May 2026
Buyer Demand
Explore the seasonality of competitive bidding in this area and understand where closings are taking place now in comparison to their asking price.
0%
-0.8%
-1.5%
-1.1%
-1.7%
-1.5%
-0.7%
-0.7%
-1.4%
-2.0%
-2.1%
-1.4%
-2.0%
-2.5%
% Over or Under Asking Price -2.0%
-1.7%
-1.7%
-2.3%
-1.7%
-2.1%
-2.2%
-2.8%
-2.7%
-3.3%
-2.6%
-2.2%
-2.1%
-2.6%
-2.5%
-2.1%
-1.8%
# of Sales -2.1%
-1.7%
-2.6%
100
80
-1%
60 -2% 40 -3%
-4%
20
Oct 2023 Dec 2023 Feb 2024 Apr 2024 Jun 2024 Aug 2024 Oct 2024 Dec 2024 Feb 2025 Apr 2025 Jun 2025 Aug 2025 Oct 2025 Dec 2025 Feb 2026 Apr 2026 Jun 2026 Nov 2023 Jan 2024 Mar 2024 May 2024 Jul 2024 Sep 2024 Nov 2024 Jan 2025 Mar 2025 May 2025 Jul 2025 Sep 2025 Nov 2025 Jan 2026 Mar 2026 May 2026
Buyer Demand at Each Price Range Sold Price
Each price range typically attracts competing buyers differently. Use this data to see which price points are seeing the most competitive bidding. Comparing selected time period to previous year.
Days on Market (median)
Apr 8, 2026 - Jul 7, 2026
%Δ
$200,000-$299,999
4
33.3%
31
-37
-6.86%
6.07%
$300,000-$399,999
31
-13.9%
49
-2
-2.4%
0.31%
$400,000-$499,999
40
-18.4%
37
15
-0.9%
0.93%
$500,000-$599,999
26
-36.6%
39
18
-1.49%
-0.83%
$600,000-$699,999
32
18.5%
41
29
-2.67%
-1.19%
$700,000-$799,999
16
45.5%
6
-48
-1.48%
0.4%
$800,000-$999,999
18
63.6%
13
-19
-1.37%
0.06%
$1M-$1.19M
5
-50.0%
70
31
-7.26%
-0.68%
$1.2M+
16
-36.0%
40
-1
-4.02%
-0.03%
Grand total
188
-11.7%
33
% Over or Under Asking
arrow_drop_down
# of Sales
Δ
2
0
Δ
-2.19%
0.14% All data from MLSSAZ,.. Updated as of:
Jul 7, 2026
MONTHLY Inventory
MLS of Southern Arizona® Market Snapshot
All data is updated in realtime in accordance with content from MLSSAZ. Updated on: Jul 7, 2026
Region
City : Oro Valley
▼
County
$ Between
Enter a value
▼
▼
Enter a value
June
Zip Code
▼
Type: Single Family Residence
▼
Sqft Between
(1)
Average Sqft
2,509
# of New Listings (Supply)
(1)
▼
Beds
▼
▼
and Enter a value
and Enter a value
Today
AgeRstr.
Download
▼
Average List Price
7/7/26
#
Single Family Residence
$935,214
191
Median DOM (Active Now)
Average DOM (Active Now)
Months of Supply Now
73
3.96
4.3% from previous year
Active Now
# of New Pendings (Demand)
50
-30.6% from previous year
190
Pending Listings Now
19
64
105
Keyboard shortcuts
Median Sale Price (last 365 days)
Active Now $200,000-$299,999
Resi…
0.52%
Map data ©2026 Google, INEGI
$300,000-$399,999
$400,000-$499,999
7.85%
0%
$500,000-$599,999
$600,000-$699,999
18.32%
10%
$700,000-$799,999
17.8%
20%
30%
$800,000-$999,999
15.18%
40%
50%
10.47%
60%
Months of Supply By Price Asking Price
$1.2M-$1.39
7.33%
70%
Active Now
# of Sales Last Month
Median DOM (today)
$300,000-$399,999
3.00
15
5
67
$400,000-$499,999
2.92
35
12
56
$500,000-$599,999
11.33
34
3
50
$600,000-$699,999
2.90
29
10
53
$700,000-$799,999
3.33
20
6
60
$800,000-$999,999
2.33
14
6
81
$1M-$1.19M
5.00
10
2
54
$1.2M-$1.39
3.00
3
1
53
$1.4M+
10.00
30
3
119
190
48
$699,900
1.57%
15.71%
90%
100%
*select metrics >
Average Asking Price
Average $/sqft
340
Max 1.25M
320
1M
300
750K
280
500K
260
250K
240
0 Jul 2021
3.96
$530,000
80%
Median Asking Price
1.5M
Report a map error
$1.4M+
5.24%
Asking Prices
Months of Supply
Grand total
$1M-$1.19M
Terms
56
Feb 2022
Sep 2022
Apr 2023
Nov 2023
Jun 2024
Jan 2025
Aug 2025
Mar 2026
220
New Listings
Use this data to view new inventory delivered in this market over the past 3 years.
Single Family Residence
125 114
100 75
122
100
87 74
77
92
97
77
76
61
91
114
95
85
82
74
70 60
97
60
63
86 73
59
50 25 0 Jun 2024 Aug 2024 Oct 2024 Dec 2024 Feb 2025 Apr 2025 Jun 2025 Aug 2025 Oct 2025 Dec 2025 Feb 2026 Apr 2026 Jun 2026 Jul 2024 Sep 2024 Nov 2024 Jan 2025 Mar 2025 May 2025 Jul 2025 Sep 2025 Nov 2025 Jan 2026 Mar 2026 May 2026
New Pendings
Use this data to view newly pending properties each month over the past 3 years.
Single Family Residence
100
84
80
72 65 57
60 45
40
50
74
72
67
61 54
47 40 28
74
77
41
52 44
42
51
65 50
48
34
20 0 Jun 2024 Aug 2024 Oct 2024 Dec 2024 Feb 2025 Apr 2025 Jun 2025 Aug 2025 Oct 2025 Dec 2025 Feb 2026 Apr 2026 Jun 2026 Jul 2024 Sep 2024 Nov 2024 Jan 2025 Mar 2025 May 2025 Jul 2025 Sep 2025 Nov 2025 Jan 2026 Mar 2026 May 2026 All data from MLSSAZ,.. Updated as of:
Jul 7, 2026
MONTHLY Price Drops
MLS of Southern Arizona® Market Snapshot
All data is updated in realtime in accordance with content from MLSSAZ. Updated on: Jul 7, 2026
Region
City : Oro Valley
▼
County
$ Between
▼
Enter a value
Enter a value
▼
Active Now
Zip Code
▼
Type: Single Family Residence
▼
Sqft Between
(1)
(1)
▼
Beds
▼
▼
and Enter a value
and Enter a value
07/07/2026
AgeRstr.
Download
▼
On Closed Sales
Ave SQFT
2,669
Jun 1, 2026 - Jul 6, 2026
arrow_drop_down
Active Listings
Active w/ a Price Drop
# of Sales
# w/ a Price Drop
% Price Drop
Median Days Until Price Drop
% Orig $ to Close $ (Ave)
% Orig $ to Close $ (Med)
191
99
4.8%
57
52%
18
27
9.1%
57%
7.6%
Keyboard shortcuts
Map data ©2026 Google, INEGI
Median Sale Price (last 365 days)
Terms
Report a map error
$530,000
$699,900
Price Drops By Price Range Asking Price
Active
Active w/ Price Drop
$200,000-$299,999
1
1
100…
3%
$300,000-$399,999
15
9
60%
4%
$400,000-$499,999
35
17
49%
6%
$500,000-$599,999
34
15
44%
6%
$600,000-$699,999
29
19
66%
2%
$700,000-$799,999
20
16
80%
3%
$800,000-$999,999
14
8
57%
3%
$1M-$1.19M
10
4
40%
4%
$1.2M-$1.39
3
2
67%
6%
$1.4M+
30
8
27%
10%
Grand total
191
99
52%
5%
Price Drop Outcomes
% w/ a Price Drop
In the last 90 days, listings that dropped their price went pending after a median of Here is how that number has changed over time.
44
days in this market.
Days from Price Drop to Pending (median)
60
44
40
34
30 27
25
20
37
35
32 28
38 33
32
28 27
28
24
27
23
21
26 20
23
34 28
36
35
42
46
45
38
31
Jan 1, 2021 - Jun 30, 2026
40
37
42
44
42
46
40
38
41 33
32
26
24
30
45 38
30
31 32 31
30
23
43 42
35
34
40
47 43
34
33
arrow_drop_down
# of Price Drops that Went Pending
52
46
40
Average Price Drop
20
26 22
10
15
0
0
3 2 5 3 5 2 3 5 2 3 6 5 6 2 5 3 6 2 3 5 2 4 4 … 4 4 … 21 21 21 21 21 21 20 r 20 y 20 ul 20 p 20 v 20 n 202 r 202 y 202 l 202 p 202 v 202 n 202 r 202 y 202 l 202 p 202 v 202 202 r 202 ay 20 l 202 202 v 20 n 202 r 202 y 202 l 202 p 202 v 202 n 202 r 202 y 202 n p a n o a u u u u a a a a o a e a J J J J J J M S N M Ja Ja Ja Ja M Se No N Ja Se No Se No Se M M M M M Ma Ma Ma Ma
Price Drops Over Time
*use arrows to adjust quarterly /monthly >
% Price Drop (average)
80
# of Price Drops
12.0%
10.7%
60
10.0%
9.2%
sp orD ecirP f o #
7.5%
40
6.6% 6.1%
5.7%
20 4.3%
5.4% 4.6%
5.8% 5.3%
4.8% 4.6% 4.3% 4.5%
6.9%
5.7% 5.6% 4.9%
6.3%
7.1% 6.6% 6.5% 5.7%
5.1%
7.6%
6.4% 6.1% 6.1% 5.7% 5.7%
5.1% 4.9% 4.6%
6.2%
5.1% 4.2%
5.8% 5.3% 5.3% 5.2% 5.3% 5.2%
7.0%
6.2% 5.5%
6.4% 6.0%
6.8% 6.1% 6.0%
5.2% 5.1%
6.4%
8.0% 6.7%
6.3% 6.2%
5.7% 5.1%
6.0%
5.1%
4.3% 3.9%
4.0%
3.1% 0
3 2 5 3 2 5 3 2 5 5 2 2 5 2 6 3 6 6 3 3 5 4 4 4 4 4 4 21 21 21 21 21 21 2 0 b 2 0 n 2 0 g 2 0 p 2 0 t 2 0 r 2 02 b 2 02 n 2 02 g 2 02 p 2 02 t 2 02 r 2 02 n 2 02 n 2 02 l 2 02 p 2 02 t 2 02 r 2 02 2 02 2 02 2 02 2 02 v 2 02 n 2 02 r 2 02 r 2 02 g 2 02 l 2 02 c 2 02 r 2 02 n 2 02 y 2 02 n b n g p c Ju Se Ju De Ma Ja Ju Au Se O Fe Ja Ma Ja Ja Oc Ma Fe Ju Au Se Oc Ma Ju Ma Fe Ma Ap Au Ju Au Se No All data from MLSSAZ,.. Updated as of:
Jul 7, 2026
)egare va( p orD ecirP %
8.6% 8.1%
YEARLY Sales & Pricing
MLS of Southern Arizona® Market Snapshot
All data is updated in realtime in accordance with content from MLSSAZ. Updated on: Jul 7, 2026
Region
City : Oro Valley
▼
County
Enter a value
▼
$ Between
▼
Enter a value
74
$400,000-$499,999
79
$266.38M
59 28
$800,000-$999,999
-10.9% from previous year
36
Median Days on Market
13 29
$1.2M+ 0
-6.5% from previous year
Total Volume
65
$600,000-$699,999
20
▼
▼
Download
New Listings
391
$300,000-$399,999
$1M-$1.19M
AgeRstr.
# of Sales
$500,000-$599,999
Beds
▼
arrow_drop_down
8
$700,000-$799,999
(1)
▼
and Enter a value
and Enter a value
Jan 1, 2026 - Jul 6, 2026 $200,000-$299,999
Zip Code
▼
Type: Single Family Residence
▼
Sqft Between
(1)
40
60
80
39
13 from previous year
532
-12.5% from previous year
Median Sale Price
$548,000
-2.1% from previous year
% Over or Under Asking
Keyboard shortcuts
-2.1%
Map data ©2026 Google, INEGI
Median Sale Price (last 365 days)
0.1% from previous year
Terms
Report a map error
$530,000
$699,900
Jan 1, 2016 - Jul 7, 2026
Market Pricing By Type
arrow_drop_down
*select metric >
600,000
$535,000
Single Family Residence $548,000
$550,000
$535,190
$558,000
$467,115
500,000
$388,000
ecirP elaS naideM
400,000
$300,000
$285,000
300,000
$320,000
$340,000
200,000
100,000
0 2016
2017
2018
2019
2020
2021
2022
2023
2024
2025
Market Pricing Overall
*select metric >
Median Sale Price
800,000
600,000
$466,395 $351,586 $300,000
$285,000
$156
$148
$377,811 $320,000 $165
$400,764 $340,000 $172
$575,531 $231 $467,115
$535,000
Average Sale Price
$276 $670,352
$696,594 $285
$535,190
$550,000
Average $/sqft 300 $282 $278 $690,780 $681,279 $558,000
250 $548,000
$388,000 $189
200
200,000
150
0 2016
2017
2018
2019
2020
2021
2022
2023
2024
Market Activity By Year YEAR
# of Sales
▼
100 2026
2025
*right-click to download
$ Volume
Median Sale
Average Sale
$/sqft
2026
391
$266,380,198
$548,000
$681,279
$278
2025
702
$484,927,268
$558,000
$690,780
$282
2024
550
$383,126,525
$550,000
$696,594
$285
2023
645
$432,377,223
$535,190
$670,352
$276
2022
741
$476,879,624
$535,000
$643,562
$267
2021
950
$546,754,173
$467,115
$575,531
$231
2020
850
$396,435,376
$388,000
$466,395
$189
2019
823
$329,828,371
$340,000
$400,764
$172
2018
794
$299,982,138
$320,000
$377,811
$165
2017
815
$286,542,817
$300,000
$351,586
$156
2016
806
$277,814,901
$285,000
$344,683
$148 All data from MLSSAZ,.. Updated as of:
Jul 7, 2026
tfqs/$ egare vA
ecirP elaS egare vA | ecirP elaS naideM
$267 $643,562
400,000 $344,683
2026
YEARLY Buyer Demand
MLS of Southern Arizona® Market Snapshot
All data is updated in realtime in accordance with content from MLSSAZ. Updated on: Jul 7, 2026
Region
City : Oro Valley
▼
County
Enter a value
▼
$ Between
▼
Enter a value
$200,000-$299,999 $400,000-$499,999
79
$500,000-$599,999
-6.5% from previous year
Total Volume
65
$600,000-$699,999 28
-10.9% from previous year
36
Median Days on Market
13
39
29 0
20
40
▼
Download
▼
60
80
532
-12.5% from previous year
Median Sale Price
$266.38M
59
$800,000-$999,999
Beds
New Listings
391
74
$1.2M+
AgeRstr.
# of Sales
$300,000-$399,999
$1M-$1.19M
▼
arrow_drop_down
8
$700,000-$799,999
(1)
▼
and Enter a value
and Enter a value
Jan 1, 2026 - Jul 6, 2026
Zip Code
▼
Type: Single Family Residence
▼
Sqft Between
(1)
13 from previous year
$548,000
-2.1% from previous year
% Over or Under Asking
Keyboard shortcuts
-2.1%
Map data ©2026 Google, INEGI
Median Sale Price (last 365 days)
0.1% from previous year
Terms
Report a map error
$530,000
$699,900
Jan 1, 2016 - Jul 7, 2026
Buyer Demand
% Over or Under Asking
1%
33
0.3%
32
arrow_drop_down
Median Days on Market
40
39
0.8% 29
0%
30
25 22 -1.2%
-1%
-2.4%
-3%
2016
-2.2%
-2.2%
2017
2018
19
14
-1.6%
14
-1.8% -2%
-1.0%
6
2019
2020
2021
20
7
2022
-2.1%
-2.3%
2023
2024
2025
10
0
2026
4%
60
2%
40
0% 20
-2% -4%
5 2 5 2 5 2 5 2 6 3 6 3 6 3 3 4 4 0 0 0 0 4 4 21 18 21 18 21 18 19 16 19 16 19 16 19 16 17 17 17 17 21 18 20 r 20 l 20 t 20 n 20 r 20 l 20 t 20 n 20 r 20 l 20 t 20 n 20 r 20 l 20 t 20 202 r 202 l 202 t 202 n 20 r 20 l 20 t 20 202 r 202 l 202 t 202 202 r 202 l 202 t 202 202 r 202 l 202 t 202 202 r 202 l 202 t 202 202 r 202 l 202 Ju Oc Jan Ap Ju Oc Ja Ju Oc Jan Ap Ju Oc Ja Ju Oc Ja Ju Oc Jan Ap Ju Oc Jan Ap Ju Ju Oc Jan Ap Ap Ju Oc Jan Ap Ap Jan Ap Ap Ap Ju Oc Ja
New Listings Delivered Compare Price Ranges (up to 4)
▼
0-$199,999
$200,000-$299,999
$300,000-$399,999
$400,000-$499,999
500
429
428 386
400
300
289
300
310 304
264 257
263
243
223
222
184 183
200
122 100
308
137
145
160
153 118
67 33
0 2016
2017
222
90
93
117 82
34
11
10
2
1
21
2 0
01
81
3 0
2018
2019
2020
2021
2022
2023
2024
2025
2026
All data from MLSSAZ,.. Updated as of:
Jul 7, 2026
0
WEEKLY Sales
MLS of Southern Arizona® Market Snapshot
All data is updated in realtime in accordance with content from MLSSAZ. Updated on: Jul 7, 2026
Region
City : Oro Valley
▼
County
$ Between
Enter a value
▼
Enter a value
▼
Zip Code
▼
Type: Single Family Residence
▼
Sqft Between
(1)
(1)
▼
Beds
▼
▼
and Enter a value
and Enter a value
AgeRstr.
Download
▼
Year-to-Date Jul 7, 2026
Market Activity
Market Pricing
Buyer Demand
# of Sales
Median Sale
Median DOM
391
-6.5% from last year YTD
Total Volume
$548,000
-10.9% from last year YTD
# of New Listings
39
-2.1% from last year YTD
532
13 from last year YTD
$/sqft
$266.38M
Inventory
-12.5% from last year YTD
% Over
$278
# of Pendings
-2.09%
-5.3% from last year YTD
Keyboard shortcuts
394
0.05% from last year YTD
Map data ©2026 Google, INEGI
Median Sale Price (last 365 days)
-8.2% from last year YTD
Use date range filter to remove or add additional years for comparison. 5 Max
Sales By Week
2026
Terms
Report a map error
$530,000
$699,900
Jan 1, 2024 - Jul 5, 2026
arrow_drop_down
2025
2024
30
26
29
25
24
22 19
20
15
11 10
7
5
10
8
18 15
14
12
11
19
18
23
13
10
14
14
13 13 10
9
7
2
0 Week 1
Week 4
January
Week 7
Week 10
February
Week 13
March
Week 16
Week 19
April
Week 22
May
Week 25
Week 28
June
July
Week 31
Week 34
August
Week 37 September
Week 40
Week 43
October
Average % Over or Under Asking By Week
2026
Week 46
Week 49
Week 52
November
December
2025
2024
2.0%
0.0%
-0.8%
-1.1% -2.0% -2.6%
-2.2% -2.1% -2.4%
-2.2%
-2.6%
-2.9%
-3.0%
-1.2% -1.6% -1.6% -2.1% -2.4% -2.6% -2.7%
-1.3% -1.5% -1.6%
-1.3% -1.5%
-3.7%
Week 4
January
-2.4% -2.9%
-4.1%
-4.0%
-6.0% Week 1
-1.4%
Week 7
Week 10
February
Week 13
March
Week 16
Week 19
April
Week 22
May
Week 25
Week 28
June
July
Week 31
Week 34
August
Week 37 September
Week 40
Week 43
October
Days on Market By Week (median)
2026
Week 46
Week 49
Week 52
November
December
2025
2024
100
75
80
85
81
58
60
36
40
20
80
17
January
54
51
39
20
0 Week 1
62
35
38
43 29 31
46 45 37
31
17
Week 4
Week 7 February
41
48
54
31 17
Week 10 March
Week 13 April
Week 16
Week 19 May
Week 22
Week 25 June
Week 28 July
Week 31
Week 34
August
Week 37 September
Week 40
Week 43
October
Week 46
Week 49
November All data from MLSSAZ,.. Updated as of:
Week 52
December Jul 7, 2026
WEEKLY Inventory
MLS of Southern Arizona® Market Snapshot
All data is updated in realtime in accordance with content from MLSSAZ. Updated on: Jul 7, 2026
Region
City : Oro Valley
▼
County
$ Between
Enter a value
▼
▼
Zip Code
▼
Type: Single Family Residence
▼
Sqft Between
(1)
Enter a value
(1)
▼
Beds
▼
▼
and Enter a value
and Enter a value
AgeRstr.
Download
▼
Year-to-Date Jul 7, 2026
Market Activity
Market Pricing
Buyer Demand
# of Sales
Median Sale
Median DOM
391
-6.5% from last year YTD
Total Volume
$548,000
-10.9% from last year YTD
# of New Listings
39
-2.1% from last year YTD
532
13 from last year YTD
$/sqft
$266.38M
Inventory
-12.5% from last year YTD
% Over
$278
# of Pendings
-2.09%
-5.3% from last year YTD
Keyboard shortcuts
394
0.05% from last year YTD
Map data ©2026 Google, INEGI
Median Sale Price (last 365 days)
-8.2% from last year YTD
Use date range filter to remove or add additional years for comparison. 5 Max
New Listings By Week
2026
Terms
Report a map error
$530,000
$699,900
Jan 1, 2024 - Jul 5, 2026
arrow_drop_down
2025
2024
40
35 30 31 30
27 22 19
20
25
23 20
17
15
20
17 18 14
13
12
11
23 20 20
19
17
16
24
12 12
10
0 Week 1
Week 4
January
Week 7
Week 10
February
Week 13
March
Week 16
Week 19
April
Week 22
May
Week 25
Week 28
June
July
Week 31
Week 34
August
Week 37 September
Week 40
Week 43
October
New Pendings By Week
2026
Week 46
Week 49
Week 52
November
December
2025
2024
30
28
25
24
22 18
20
17 17
19
17
15
19
17
15
11 11 10
12
10
13
16
17
11
16
15
14
11
7
8
7
5
1 0 Week 1
Week 4
January
Week 7
Week 10
February
Week 13
March
Week 16
Week 19
April
Week 22
May
Week 25
Week 28
June
July
Week 31
Week 34
August
Week 37 September
Week 40
Week 43
October
Days Until Pending By Week (median)
2026
Week 46
Week 49
Week 52
November
December
2025
2024
200
146
150
100
82
77
76 58
36 39
50
19 0 Week 1 January
Week 4
89
77
Week 7 February
51
70 51
46 30
Week 10 March
18 20
31
25
Week 13 April
21
Week 16
45 42 44
31
56 40
16 Week 19 May
Week 22
Week 25 June
Week 28 July
Week 31
Week 34
August
Week 37 September
Week 40
Week 43
October
Week 46
Week 49
November All data from MLSSAZ,.. Updated as of:
Week 52
December
Jul 7, 2026
Listing Success Over Time and By Segment
MLS of Southern Arizona® Market Snapshot
All data is updated in realtime in accordance with content from MLSSAZ. Updated on: Jul 7, 2026
Region
City : Oro Valley
▼
County
$ Between
Enter a value
▼
▼
Zip Code
▼
Type: Single Family Residence
▼
Sqft Between
(1)
Enter a value
(1)
▼
Beds
▼
▼
and Enter a value
and Enter a value
Active Now By DOM
AgeRstr.
Download
▼
Success Rate
Jul 1, 2025 - May 8, 2026
arrow_drop_down
*List Date. w/ 60 buffer.
1-15
% Listing Success
46 29
16-30 ) yad ot( MOD
19
31-45 46-60
14 12
76-90
10
Days On Market (med)
Cancelled
Days On Market (med)
20
30
40
30
127
42
90-365 0
Closed/Pending
525
21
61-75
81%
* for best analysis select filters to maintain >100 Closed/Pending listings over a 12-month period.
50
Keyboard shortcuts
67
Map data ©2026 Google, INEGI
Median Sale Price (last 365 days)
Terms
Report a map error
$530,000
$699,900
Jan 1, 2021 - May 8, 2026
Listing Success Over Time 100%
92%
95%
The likelihood of listings successfully closing in your selected market changes over time. Use this data to see how this probability has changed in recent years.
*adjust time increment>
Listing Success Rate % 94%
94%
arrow_drop_down
# Resolved Listings
94% 89%
90%
85%
85%
84%
83%
82%
82%
80%
80%
77%
80%
85% 79%
85%300
79%
76%
73%
69%
70%
200
100
60%
50% Q1, 2021
Q2, 2021
Q3, 2021
Q4, 2021
Q1, 2022
Q2, 2022
Days On Market Success vs. Cancelled
Q3, 2022
Q4, 2022
Q1, 2023
Q3, 2023
Q1, 2024
Q2, 2023 Q4, 2023 Listed Date (by quarter)
Q2, 2024
Q3, 2024
Q4, 2024
Q1, 2025
DOM: Closed/Pending (Buyer Speed)
80
70
66
61
60
41
4
0 Q1, 2021
Q2, 2021
10 7
7 Q3, 2021
44
41
40
15 6
Q4, 2021
22
12 4 Q1, 2022
Q1, 2026
Q4, 2025
0 Q2, 2026
Q3, 2022
42
29 12
Q4, 2022
Q1, 2023
9
8
Q2, 2023
Q3, 2023
Q4, 2023
81
71
62 51
48 23
20
13
73
38
32
27
6 Q2, 2022
43
71
64
54
DOM: Cancelled (Seller Patience)
84
82
20
Q2, 2025
Q3, 2025
Although many listings require more time to successfully find a buyer, the data below shows when sellers have historically chosen to withdraw vs. when successful listings typically go under contract.
100
20
400
29
23
18 7
Q1, 2024
Q2, 2024
Q3, 2024
Q4, 2024
Q1, 2025
Q2, 2025
Q3, 2025
Q4, 2025
Q1, 2026
Q2, 2026
Listed Date (by quarter)
Listing Success By Price
Listing Success By Days On Market
The probability of successfully finding a buyer varies by price range. View those outcomes below in this market over the last 365 days.
Asking Price
% Listing Success
Cancelled
$200,000-$299,999
86%
6
1
$300,000-$399,999
86%
102
17
$400,000-$499,999
75%
114
38
$500,000-$599,999
83%
88
18
$600,000-$699,999
84%
79
15
$700,000-$799,999
74%
42
15
$800,000-$999,999
77%
47
14
$1M-$1.19M
90%
19
2
$1.2M-$1.39
70%
16
7
$1.4M+
77%
27
8
Grand total
80%
540
135
80%
Historical probability of listings finding a buyer changes with increased DOM. Here are the outcomes at various DOM looking at this market over 365 days. Closed/Pending
Cancelled
76.62%
100%
31-45 46-60
71.01%
100%
61-75
68.97%
100%
tekraM nO s yaD
Closed/Pending
% Success at Initial Listing
71.93%
76-90
100%
67.86%
90+ 0%
20%
40%
60%
100% 80%
All data from MLSSAZ,.. Updated as of:
100%
Jul 7, 2026
MARKET CYCLES Pricing & Market Temperature
MLS of Southern Arizona® Market Snapshot
All data is updated in realtime in accordance with content from MLSSAZ. Updated on: Jul 7, 2026
Region
City : Oro Valley
▼
County
$ Between
▼
▼
Enter a value
Enter a value
Zip Code
▼
Type: Single Family Residence
▼
Sqft Between
(1)
(1)
▼
Beds
▼
▼
and Enter a value
and Enter a value
AgeRstr.
▼
Download
Keyboard shortcuts
Map data ©2026 Google
Market Temperature
Terms
Report a map error
Jan 1, 2021 - Jun 30, 2026
Explore how the current market compares to previous cycles in terms of overall market temperature.
arrow_drop_down
*adjust time increment>
% Over/Under Median DOMReport a map error Keyboard shortcuts Asking Map data ©2026 Google, INEGI Terms 4.0%
70
Median Sale Price (last 365 days)
$530,000
$699,900
3.0%
60
2.0%
50
gniksA rednU/revO %
1.0% MOD naideM
40 0.0%
Buyer's Market 30
-1.0% 20
-2.0%
10
-3.0%
Seller's Market 0 Jan 2021
May 2021
Sep 2021
Jan 2022
May 2022
Sep 2022
Jan 2023
May 2023
Sep 2023
Jan 2024
May 2024
Sep 2024
Jan 2025
May 2025
Sep 2025
Jan 2026
-4.0% May 2026
Market Prices Use this data to understand how prices in this area have changed over the selected time period. *adjust time increment or metrics>
Median Sale
1M
Average Sale
$/sqft
Peak(ave) ($864,919)
340
320
800K 300 elaS egarevA | elaS naideM
600K
280 tfqs/$ 260
400K
240 200K 220
0
3 3 3 3 3 5 3 5 2 5 2 5 2 5 2 5 2 2 4 4 4 4 6 6 6 4 4 21 21 21 21 21 21 20 r 20 y 20 l 20 p 20 v 20 n 202 r 202 y 202 l 202p 202 v 202n 202 r 202 y 202 l 202p 202 v 202 202 r 202 y 202 l 202 202 v 202 n 202 r 202 y 202 l 202p 202 v 202 202 r 202 y 202 n Ja Ma Ma Ju Se No Ja Ma Ma Ju Se No Ja Ma Ma Ju Se No Jan Ma Ma Ju Sep No Ja Ma Ma Ju Se No Jan Ma Ma All data from MLSSAZ,.. Updated as of:
200
Jul 7, 2026
MONTHLY Data Tables
MLS of Southern Arizona® Market Snapshot
All data is updated in realtime in accordance with content from MLSSAZ. Updated on: Jul 7, 2026
Region County ▼
▼
Enter a value
Enter a value
Month-to-Date
(1)
Zip Code
▼
Type: Single Family Residence
▼
Sqft Between $ Between
City : Oro Valley
▼
(1)
▼
Beds
▼
▼
and Enter a value
and Enter a value
AgeRstr.
▼
Download
Use this report to gather monthly stats for these 6 top market indicators. Heatmapped zones will show whether your market is in a particularly hot or cool period compared to previous years.
Jul 7, 2026
Market Activity
Market Pricing
Buyer Demand
# of Sales
Median Sale
Median DOM
9
$485,000
0.0% from last year MTD
-0.2% from last year MTD
Total Volume
$/sqft
$4.67M
-21.2% from last year MTD
# of New Listings
56
-1 from last year MTD
% Over
$236
-18.8% from last year MTD
-2.09%
Inventory
8
-38.5% from last year MTD
# of Pendings
-0.29% from last year MTD
6
Keyboard shortcuts
Map data ©2026 Google, INEGI
Median Sale Price (last 365 days)
-25.0% from last year MTD
$530,000
# of Sales / Count 2023
2024
2025
2026
January
35
36
51
38
February
53
47
64
March
73
51
April
57
May
Terms
Report a map error
$699,900
Sale Price / Median 2023
2026
2024
2025
January
$515,000
$540,000
$500,000
$578,000
63
February
$517,500
$554,900
$525,627
$550,000
77
83
March
$550,000
$539,000
$550,000
$585,000
56
86
87
April
$525,000
$489,990
$555,000
$540,000
85
57
63
63
May
$545,000
$580,000
$575,000
$589,500
June
64
37
68
48
June
$550,000
$640,000
$543,190
$551,000
July
55
55
62
-
July
$534,500
-
$570,000
$530,000
August
58
41
44
-
August
$495,000
-
$590,000
$567,000
September
41
35
41
-
September
$571,136
-
$561,000
$580,500
October
44
50
43
-
October
$560,000
-
$519,000
$508,000
November
38
43
38
-
November
$540,500
-
$589,000
$552,065
December
42
42
65
-
December
$530,000
-
$559,000
$520,000
.
.
# of New Listings / Count 2023
2024
2025
2026
January
68
83
114
114
February
81
60
122
March
83
82
April
70
May
Days on Market / Median 2023
2024
2025
2026
January
23
24
33
32
74
February
13
14
32
59
100
95
March
11
15
16
45
68
92
82
April
19
12
32
30
63
71
97
86
May
16
13
22
31
June
64
61
70
73
June
13
19
36
40
July
64
74
60
-
July
7
24
20
-
August
53
77
63
-
August
6
25
39
-
September
58
76
91
-
September
21
12
55
-
October
67
87
97
-
October
9
28
29
-
November
53
77
85
-
November
14
27
16
-
December
37
60
59
-
December
27
20
48
-
.
.
# of New Pendings / Count 2023
2024
2025
2026
January
43
41
65
48
February
60
54
72
74
March
63
55
74
84
April
74
45
77
67
May
70
48
61
65
June
63
45
72
50
July
48
50
54
-
PendingDat…
August
58
47
42
-
September
46
28
34
-
October
33
57
44
-
November
39
40
52
-
December
39
41
51
-
% Over or Under Asking / Average 2023
2024
2025
2026
1.0%
0.0%
-1.0%
-2.0%
-2.5%
-2.1%
-1.8%
-2.1%
-1.7% -2.6%
-3.0%
-4.0% January March February
April
May
June
July
September November August October December All data from MLSSAZ,.. Updated as of:
Jul 7, 2026
HOUSING STOCK By Beds/Price Range
MLS of Southern Arizona® Market Snapshot
All data is updated in realtime in accordance with content from MLSSAZ. Updated on: Jul 7, 2026
Region
City : Oro Valley
▼
County
$ Between
Enter a value
▼
▼
Zip Code
▼
Type: Single Family Residence
▼
Sqft Between
(1)
Enter a value
(1)
▼
Beds
▼
▼
and Enter a value
and Enter a value
AgeRstr.
Download
▼
Jul 1, 2025 - Jul 6, 2026
Bedroom Comparison
arrow_drop_down
Average Square Footage # of Sales
Total Volume
684
$458.40M
Average SqFt
Median Year Built
2,362
1,999
1,639
2
2,245
3
2,834
4
3,223
5 0
1,000
2,000
3,000
4,000
Keyboard shortcuts
Median Sale Price (last 365 days)
Median Sale Price By Bedrooms # of Sales
300
233 183
200
Median Sale
$685,500
202 $649,950
$555,000
$409,000 100
61
0
2
Map data ©2026 Google, INEGI
3
4
800K
300
400K
200
200K
100
3
$699,900
4
2
5
24 119 14 14
0
1950-1959
1960-1969
49 102
6 9 40
21 4
31
1
0
5
Report a map error
$530,000
Sales By Year Built
600K
Terms
1970-1979
1980-1989
79
93 16 25
57 1990-1999
2000-2009
2010-2019
8 4 27 47 2020+
Data By Price Range Price Range
# of Sales
Average SqFt
0-2 Beds
3 Beds
4+ Beds
Median DOM
% Over or Under Asking
$200,000-$299,999
11
1,285
11
0
0
74
-5.44%
$300,000-$399,999
128
1,531
72
44
12
43
-2.51%
$400,000-$499,999
141
1,944
49
49
43
28
-1.84%
$500,000-$599,999
121
2,249
35
43
43
48
-1.88%
$600,000-$699,999
93
2,560
9
30
54
39
-2.15%
$700,000-$799,999
54
2,678
6
21
27
23
-2.23%
$800,000-$999,999
56
3,052
0
19
37
37
-2.1%
$1M-$1.19M
25
3,282
1
8
16
17
-4.84%
$1.2M+
55
4,066
0
19
36
20
-1.21%
684
2,362
183
233
268
36
-2.18%
Grand total
Clo
$5
Bedrooms Over Time Compare Beds (3 max)
Jan 1, 2016 - Jul 7, 2026
▼
arrow_drop_down
3
700K
$638,000
600K $526,000 500K elaS naideM
400K $337,500 $270,000 300K $233,000
$393,000
$445,100
$455,000
$362,000
$375,000
$363,000
$362,500
$289,000 $246,000
$300,000 $270,000
$315,000 $277,000
$315,000
2017
2018
2019
2020
$525,000 $429,900
$613,480 $540,000 $449,313
$650,690
4
$680,000 $565,000
$450,000
2 $675,000
$550,000
$560,000
$445,000 $405,000
200K 100K 0 2016
2021
2022
2023
2024
2025
All data from MLSSAZ,.. Updated as of:
2026
Jul 7, 2026