
5 minute read
Learning the Stats

The mention of statistics on a college campus may be responded to by a few groans and potentially a couple of eye rolls. Students who take the course often gripe that what they’re learning about has no relevance to the real world— such as the probability of drawing red and blue balls out of a bucket.
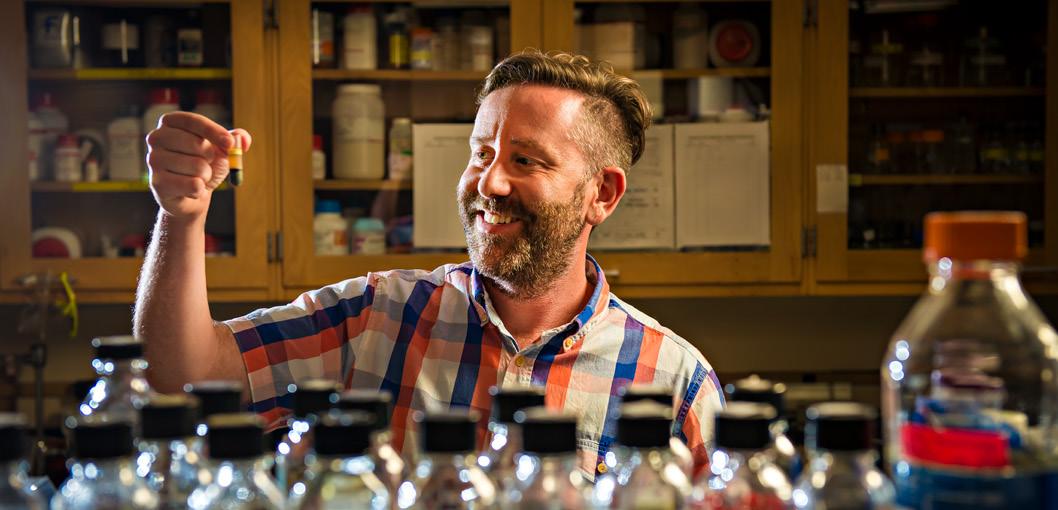
“Who does that? Who sits around and draws balls out of a bucket and wants to know the statistical probability of drawing a certain color?” said Tim Robinson, a University of Wyoming statistics professor.
Fortunately, for Robinson and his students, statistics often deals with real-life data. More recently, the COVID-19 pandemic has not only provided them with real data, but also a task that impacts epidemiologist and health care decision making.
Data can be confusing, especially if there is a lot of it or you’re not able to discern what it means for yourself. This was a common issue that arose during the COVID-19 pandemic. With tens of thousands of cases popping up all over the nation every day, the numbers became overwhelming for many epidemiologists and health care providers who were trying to control and monitor the virus’ spread.
This was true for the public health lab at the Wyoming Department of Health, too. Needing assistance, the lab reached out to Robinson, who at the time served as Wyoming’s WWAMI Regional Medical Education Program director and has a background in biostatistics.
WWAMI, an acronym for the five states it spans, Washington, Wyoming, Alaska, Montana and Idaho, is a medical program based at the University of Washington School of Medicine that provides medical education to schools without preexisting programs.
“We have data coming in from lots of different places,” Robinson said. “We are trying to stitch that data together so it can inform what epidemiologists and health policy makers do and communicate what they’re seeing as far as trends within the state.”
Robinson calls this type of work data science, which is using data to ultimately inform decision making. In this case, Robinson was tasked with cleaning and analyzing COVID-19 data, then implementing it so that health care providers and epidemiologists could make decisions on what to do about the spread.
Robinson partnered with Pavel Chernyavskiy, a former member of the mathematics and statistics department, and Colton Zier, a recent statistics graduate student, to brainstorm a tool that would provide important COVID-19 information to those who need it in an easy, digestible format.
Chernyavskiy, Zier and Robinson developed an interactive tool that allows for users to retrieve current COVID-19 information by clicking on areas of the map, which are organized by county. “We did this through a public-facing app that’s designed to visualize, track and quantify geographic disparities, COVID-19 incidence and mortality rates,” Robinson said.
While the tool was created specifically for the rural areas of Wyoming to combat some of the uncertainty that comes with virus spread in smaller populations, the map spreads across the entire United States where users can look at information surrounding incidence of new COVID-19 cases.
Tim Robinson, a statistics professor at the University of Wyoming
— Tim Robinson
Another feature of the tool, and arguably the most important one, is its ability to predict future outbreaks before they happen, Robinson said.
“I think that it’s important to think about prediction because it gives folks like hospitals and different health care providers an opportunity to be prepared if we do start to see spikes,” he said. “This tool hopefully can let folks know before the spikes occur instead of just reacting once high rates are starting to be observed.”
The map has proven to be an invaluable tool to the Wyoming Department of Health as the researchers want to continue to learn about and monitor COVID-19. As the virus has evolved, so has the need for new information. “Now there’s an interest in the variants that are occurring and
whether or not there are variant hotspots,” he said.
Robinson is continuing to improve and work on the tool alongside students, hoping to provide epidemiologists and health care providers with quick resources to provide answers to critical questions.
“Our goal is to take this very complicated data, talk with epidemiologists and find out what information they want to be able to have at the snap of a finger, and then create an app so that it can happen for them,” he said. “We’ll just continue figuring out what kinds of applications the Department of Health is interested in and how we can help them mobilize that data to help them make decisions and make their processes more efficient.”
Robinson has received $700,000 from the Wyoming Department of Health that will go toward continuing work on the tool and giving more people like Zier an opportunity to get real-world experience.
“It’s great to be able to have this partnership with the Department of Health because it’s terrific for students,” he said. “Working on this project, students have actually produced something. They haven’t just solved problems that were created in academia for them to check boxes off for their degree, but they’ve actually worked on something that’s useful to the public, and they have something to show for that.”
Garrett Catlin, a statistics master’s student, is one of the new students recruited to continue working on the project alongside Robinson.
“I’m really excited to be working on a project that has real-world applications that hopefully will be helpful to epidemiologists and even people in our community,” Catlin said. “It’s also been so helpful to have someone like Robinson who is looking out for students like me and the public health.”
Outside of the invaluable experience students have and will receive, Robinson ultimately has a great passion for giving back.
“I think that my love for teaching, my love for Wyoming and working with students are what make this project so special to me, because it just ties together all of those things while we’re serving the state,” he said.
While some statistics classes might be filled with questions about the probability of a drawing a certain colored ball, Robinson and his team will continue to utilize statistics as a tool to educate students and prepare them for the future while providing digestible information to those who are keeping our communities safe and healthy.
THE UNIVERSITY OF WYOMING FEATURES
6
INTERDISCIPLINARY
GRADUATE PROGRAMS
that allow graduate students to dive deeper into their education while exploring COURSE WORK and RESEARCH from multiple areas of study.
INTERDISCIPLINARY PROGRAMS:
• Biomedical Sciences • Science and Math Teaching Center • Neuroscience • Program in Ecology • Molecular and Cellular Life Sciences • Hydrology and Water Resources
UWYO.EDU/UWGRAD GradEd@uwyo.edu (307) 766-6478


