On behalf of the University of South Florida Muma College of Business, I am pleased to present the 2026 Tampa Bay State of the Region E-Insights report. This report continues a long-standing collaboration between the Muma College of Business and the Tampa Bay Partnership, reflecting our shared commitment to using data, analytics, and critical inquiry to better understand the conditions shaping our region.
Now in its ninth year, this State of the Region collaboration has examined Tampa Bay’s economic performance and evolution in relation to other metropolitan regions across the United States. Over time, this work has expanded beyond measures of competitiveness to consider how economic growth, opportunity, and quality of life are experienced by residents across the region. The 2026 report builds on that foundation by offering a comparative, people-centered view of regional conditions today.
This year’s E-Insights Report provides a more complete picture of how the regional economy is performing, how opportunity is created and accessed, and how economic and social conditions shape daily life for individuals and families. Rather than ranking regions or prescribing specific policy actions, the report emphasizes comparative context and descriptive insight, supporting informed discussion among policymakers, planners, educators, business leaders, and community organizations.
Understanding where Tampa Bay stands relative to comparable metropolitan regions is an essential step in navigating growth, affordability pressures, and evolving workforce needs. By grounding discussion in shared data and clear comparisons, the E-Insights Report provides a common factual foundation for considering the opportunities and challenges facing our region.
This program illustrates our college’s strategic priorities in action. This impactful research also supports student learning through the collaborative efforts of USF faculty and graduate students, who worked together to gather, analyze, and interpret data from established public sources. This applied research experience allows students to contribute meaningfully to region’s business ecosystem while developing the analytical skills needed to lead in business, policy, and community settings.
Please visit usf.to/sotr-2026 to view the report online and examine other facets of the data presented. Thanks for your commitment to elevating the Tampa Bay region, and I hope you have an insightful year!
Regards,
David W. Blackwell
Lynn Pippenger Dean
University of South Florida Muma College of Business
Regards, David W. Blackwell
Lynn Pippenger Dean
USF Muma College of Business
USF Muma College of Business
David Blackwell Lynn Pippenger Dean muma-deansoffice@usf.edu
E-Insights Report Faculty Researchers
Shivendu Shivendu Associate Professor shivendu@usf.edu
Manish Agrawal Professor magrawal@usf.edu
Master’s in Business Analytics and Information Systems Graduate Assistants
Shlok Nandkishor Goud shlokgoud@usf.edu
Venkata Satya Lokesh Adda av164@usf.edu
Jacqueline Lapacek jlapacek@usf.edu
Sohan Vasudeva sohanl@usf.edu
Alvaro Montaya Ruiz montoyaruiz@usf.edu
Aditi Malik aditimalik@usf.edu
About the USF Muma College of Business
The University of South Florida Muma College of Business empowers its scholars and graduates to achieve their dreams, generating knowledge and serving as a highly engaged hub of innovation for students, faculty, staff and business leaders.
Accredited by the Association to Advance Collegiate Schools of Business (AACSB International), the Muma College of Business works to drive student success, produce scholarship with impact, and generate innovation in partnership with our community.
The college comprises programs on all three USF campuses across Tampa Bay and seven schools. The Muma College of Business offers a variety of nationally ranked master’s and doctoral degree programs designed to meet the needs of working professionals as they elevate their careers. USF’s online MBA and executive MBA programs both rank among the top 10 of their kind in the nation.
USF business students enjoy dedicated programs for student success, talent development and studying abroad, as well as corporate mentoring for first-generation students. USF launched the first Business Honors Program in the state, and in the past three years, every business honors student has found full-time employment or enrolled in graduate school after graduation. The college awards over $1.5 million in business student scholarships annually.
The college’s Bellini Center for Talent Development and Center for Executive and Leadership Education provide services to employers and executives to hire and strengthen talent for their organizations.
Visit usf.to/state-of-the-region for additional information and the online copy of the report.
2026 Tampa Bay E-Insights Report
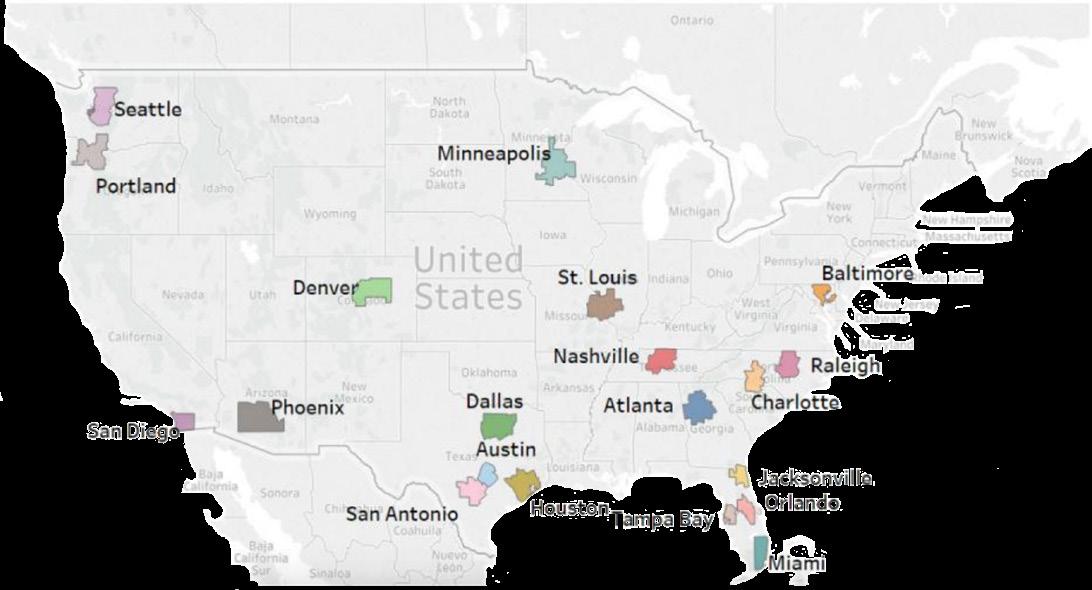
The E-Insights report benchmarks the Tampa Bay region against comparable U.S. metropolitan regions. While the comparison group may vary by indicator based on data availability, each analysis is grounded in consistent public data sources and focuses on contextual comparison rather than rankings alone. Each indicator usually compares a minimum of 10 peer metropolitan statistical areas to maintain consistency while using the most reliable data available.
The 2026 report examines three interconnected themes:
• Economic Outcomes – assessing how growth and prosperity are distributed across the region
• Education and Opportunity – exploring pathways between learning, workforce participation, and economic mobility
• Quality of Life – examining the conditions that shape daily living, stability, and community well-being
Together, these themes provide a holistic view of how regional systems interact — linking economic performance to opportunity and lived experience.
Each chapter provides a summary of findings within the theme. Within these themes, data visualizations are
provided for each indicator. Rather than prescribing specific policy actions, the E-Insights report offers descriptive insights and comparative context. By identifying where Tampa Bay aligns with or diverges from peer regions, the report provides a shared evidence base to support dialogue, planning, and long-term regional strategy.
About this Report
The State of the Region E-Insights report examines the performance of the Tampa Bay region relative to comparable metropolitan areas across the United States. Since 2017, researchers at the University of South Florida have produced a series of E-Insights reports exploring regional economic conditions, competitiveness, and quality-of-life trends. Over time, this work has expanded to address issues such as inclusive growth, the impacts of the COVID-19 pandemic, and disparities in opportunity and well-being.
The 2026 E-Insights report focuses on three interconnected dimensions of regional performance: Economic Outcomes, Education and Opportunity, and Quality of Life. Together, these themes provide a comprehensive view of how the regional economy is performing, how opportunity is created and accessed, and how economic and social conditions are experienced by residents in their daily lives.
This report places Tampa Bay in context through comparative analysis, rather than ranking. Comparisons are based on data availability, relevance, and indicator-specific considerations, rather than on a fixed set of peer metropolitan statistical areas (MSAs). For most indicators, Tampa Bay is evaluated alongside a minimum of 10 comparable MSAs. While the specific comparison group may vary across indicators, the analytical framework remains consistent, allowing readers to interpret results within a broader national context.
Indicators are presented descriptively, with an emphasis on identifying patterns, contrasts, and areas of relative strength or pressure. The report does not advance specific policy prescriptions or forecasts. Instead, it is intended to support informed discussion among policymakers, planners, educators, business leaders, and community organizations by providing a shared, evidence-based understanding of regional conditions.
Data for the E-Insights report are drawn primarily from established public sources, including the U.S. Census Bureau, U.S. Bureau of Labor Statistics, U.S. Bureau of Economic Analysis, and the National Center for Education Statistics. Indicators are generally reported at the metropolitan statistical area (MSA) level. For regions composed of multiple MSAs, including the Tampa Bay region, data is aggregated to the regional level using population-weighted averages. Definitions and data sources for each indicator are provided with the data visualizations.
By combining regional comparison with a people-centered analytical lens, the State of the Region E-Insights report clarifies how economic and social change is unfolding across Tampa Bay, and how those changes are shaping opportunity, stability, and quality of life across the region.
We hope this report serves as a valuable resource for those working to shape Tampa Bay’s future and contributes to thoughtful dialogue about how economic and social change is unfolding across our community.
Professor
Manish Agrawal Professor USF Muma College of Business
Shivendu Shivendu
Associate
USF Muma College of Business
EXECUTIVE SUMMARY
The State of the Region E-Insights report examines the performance of the Tampa Bay region in comparison with similar metropolitan statistical areas (MSAs) across the United States. The purpose of this report is to provide a clear, data-informed view of how regional economic conditions, opportunity structures, and quality-of-life factors compare with those of similar regions, and how these conditions are experienced by residents.
This year, the report is not limited to a small, fixed set of regions to compare to the Tampa MSA, as the project is expanding to include a data dashboard that will allow statistical analysis of any region in the U.S. However, all MSAs used in this report are comparable in size and similar regional roles in economic impact, education, industry, and employment. These areas also experience similar pressures in housing, migration, and infrastructure strain. Peer regions are selected based on data availability, relevance, and indicator-specific considerations. In most cases, comparisons include a minimum of 10 metropolitan areas, allowing the report to incorporate the most complete and reliable data available while maintaining a consistent analytical framework.
KEY INSIGHTS
Economic Outcomes
Economic outcome indicators show that Tampa Bay continues to experience growth in employment, income, and key industries, reflecting ongoing regional momentum. At the same time, measures related to inequality, labor force participation, and poverty indicate that economic gains are unevenly distributed. Relative to peer regions, Tampa Bay frequently appears in the middle of the pack, demonstrating areas of strength alongside persistent challenges in translating growth into broad-based economic security.
Education and Opportunity
Education and opportunity indicators highlight the role of human capital as a critical link between economic performance and quality of life. Patterns in educational attainment, postsecondary participation, and fields of study align closely with labor market outcomes and earnings potential. Comparisons with peer regions suggest that while Tampa Bay offers accessible educational pathways in some areas, gaps remain in aligning education with evolving labor market needs and in ensuring equitable access to opportunity across communities.
Quality of Life
Quality of life indicators provide a peoplecentered perspective on how regional conditions are experienced in daily life. Measures related to foundational stability, housing affordability, and daily functioning point to increasing pressures associated with cost of living, housing access, and essential supports, even as the region continues to attract population growth. These indicators underscore the importance of examining affordability, access, and stability alongside economic growth when assessing regional well-being.
Taken together, the findings in this report illustrate a region that continues to grow and evolve while facing familiar challenges related to affordability, inclusion, and uneven access to opportunity. By grounding discussion in shared data and comparative context, the State of the Region E-Insights report aims to support informed dialogue and provide a common factual foundation for understanding regional conditions and trends.
Section 1: Economic Outcomes
Economic outcomes reflect both the strength of a region’s economy and the extent to which that strength translates into broad-based opportunity. The indicators in this section examine the Tampa Bay region’s economic performance, focusing on productivity, income, industry composition, and the distribution of economic participation across residents. These indicators also measure how growth is distributed across the population.
Over the past decade, Tampa Bay has continued to expand its economic capacity and enjoy growth in gross regional product per capita. Rising personal income levels point to a region generating increasing economic value. The regional economy is supported by a diverse mix of industries, including finance and real estate, information, health care and social assistance, education, and hospitalityrelated sectors. Together, these industries shape the structure of employment opportunities and the types of earnings available across the region.
However, economic growth does not translate uniformly into shared outcomes. Measures of income inequality and cost-of-living adjustment indicate that gains in income and production are experienced differently across households. While rising productivity expands increases the region’s overall capacity economic output, variations in purchasing power and income distribution influence how residents experience economic growth in practice. Differences in wages and cost of living mean that residents experience those gains unequally.
Indicators examining labor participation, employment, and poverty across population groups further highlight differences in access to economic opportunity. Gaps in labor force participation, unemployment, transportation access, and digital connectivity underscore the importance of structural conditions that affect who is able to fully engage in the regional economy. Show that not all residents share the same access to jobs and economic opportunity. These disparities do not diminish the region’s economic progress, but they provide critical context for understanding how economic outcomes are distributed.
Taken together, these indicators present a picture of a growing and diversifying regional economy whose long-term strength depends not only on continued expansion, but on the extent to which economic participation and opportunity are broadly accessible. Evaluating economic outcomes through both growth and distribution offers a more complete view of the region’s economic performance and its capacity to support sustained prosperity.
Key Insights Economic Outcomes
Overall Takeaway:
The Tampa Bay region continues to demonstrate economic growth and diversification, but rising costs and uneven distribution shape how this growth is experienced across households. Highlights
• Sustained economic growth: Gross Regional Product per capita and per capita personal income show continued expansion, reflecting rising productivity and a broadening economic base.
• Growth differences between industry sectors: Growth in sectors such as health care, information, finance, and professional services supports higher-value economic activity, while hospitality and food services remain important employment anchors.
• Rising costs offset gains: Regional price parity and housing cost indicators show that increases in income are partially offset by higher living costs, affecting purchasing power.
• Uneven outcomes: Income inequality measures indicate that economic gains are not evenly shared, reinforcing differences in how residents experience growth.
• Equity context: Gaps in labor participation, unemployment, transportation access, and digital connectivity highlight differences in access to economic opportunity across population groups.
In 2023, Seattle ($99,339), Denver ($89,297), and Austin ($80,471) recorded the highest per capita incomes among peer metros, highlighting regions with strong high-wage industry concentrations and rapid economic expansion - By contrast, metros such as Orlando ($57,774) and San Antonio ($59,477) posted the lowest income levels in 2023 Tampa Bay’s position between these lower-income and mid-income metros underscores its moderate but improving economic profile
Per Capita Personal Income
Year 2019 2021 2023
• Areas like Seattle and Denver consistently report the highest personal incomes. Conversely, Orlando and Tampa Bay have relatively lower personal incomes.
• Tampa Bay’s personal income has shown slow growth over the past decade. Moreover, its competitive position remains low. Tampa Bay peaked at No. 17 place in 2017 while maintaining a No. 18 rank from 2019 to2023.
Per capita personal income represents the average income received by each resident in a metropolitan area, including wages, business earnings, dividends, interest, rent, and transfer payments. It is a broad measure of regional economic prosperity, living standards, and residents’ overall financial well-being. Source: U.S. Bureau of Economic Analysis (BEA), Regional Personal Income and Employment, 2013–2023.
- In 2023, Tampa Bay’s index (103 4) was higher than most Southeastern peers like Charlotte, Nashville, and Raleigh–Durham, indicating
Marginal Regional Price Parities
• Tampa Bay’s cost of living has risen steadily, moving from below the national average (95.3 in 2018) to above 100 by 2023, signaling a clear shift toward becoming a more expensive metro.
- High-cost metros such as Seattle, Miami, and San Diego continue
• In 2023, Tampa Bay’s index (103.4) was higher than most Southeastern peers like Charlotte, Nashville, and Raleigh–Durham, indicating increasing price pressures relative to similar regions.
Marginal Regional Price Parities (RPPs) measure how the cost of goods services and housing in a given metropolitan area compares with the U S average (set at 100) RPPs allow for meaningful comparisons of
Cost of Living Index
• High-cost metros such as Seattle, Miami, and San Diego continue to lead the comparison group, highlighting widening cost-of-living gaps between fast-growing coastal regions and the rest of the country.
Marginal Regional Price Parities (RPPs) measure how the cost of goods, services, and housing in a given metropolitan area compare with the U.S. average (set at 100).RPPs allow for meaningful comparisons of real income, affordability, and regional economic competitiveness across MSAs. Source: U.S. Bureau of Economic Analysis (BEA), Regional Price Parities (RPPs), 2013–2023.
The poverty rate among SSI-dependent residents in Tampa Bay declined steadily from 11 1%
to
in
Although this represents meaningful progress, Tampa Bay continues to rank in the middle of the comparison MSAs, reflecting moderate but
Poverty Rate Based on Social Security Income
• The poverty rate among SSI-dependent residents in Tampa Bay declined steadily from 11.1% in 2013 to 7.36% in 2024. Although this represents meaningful progress, Tampa Bay continues to rank in the middle of the comparison MSAs, reflecting moderate but improving economic conditions for vulnerable households.
• In 2024, Denver, Minneapolis, Seattle, and Portland recorded the lowest poverty rates, all near 5–6%, highlighting stronger economic stability and lower reliance on federal income support. In contrast, Houston, Miami, Orlando, Phoenix, and San Antonio reported some of the highest rates, remaining above 9–11% and indicating persistent economic vulnerability.
This table captures poverty status based on Social Security Income, Supplemental Security Income (SSI), and cash public assistance, allowing for a clearer understanding of economic vulnerability among households that rely on government income support. Lower values indicate greater financial stability and reduced dependence on public assistance programs. Sources: U.S. Census Bureau, American Community Survey (ACS), Table B17015: Poverty Status in the Past 12 Months of Families by Family Type by Social Security Income by Supplemental Security Income (SSI) and Cash Public Assistance Income, 2013–2024.
Gross Regional Product Per Capita
- Tampa Bay’s per-capita economic output has grown steadily rising from about $44 033 in 2013 to $53 753 in 2023 but it remains one of the lowest among comparison MSAs, signaling a regional economy that is expanding but still trailing higher-productivity metros - High-output economies such as Seattle ($120,592), Denver ($86,182), and Austin ($83,885) lead the comparison group in 2023, reflecting strong concentrations of advanced industries and high-value economic activity - Tampa Bay’s moderate GRP per capita places it closer to regions like Orlando and San Antonio, underscoring the metro’s continued dependence on service-oriented sectors with comparatively lower output per worker
Gross Regional Product Per Capita
2019 2021 2023
• Tampa Bay’s per capita economic output has grown steadily, rising from about $44,033 in 2013 to $53,753 in 2023, but it remains one of the lowest among comparison MSAs, signaling a regional economy that is expanding but still trailing higher-productivity metros.
• High-output economies such as Seattle ($120,592), Denver ($86,182), and Austin ($83,885) lead the comparison group in 2023, reflecting strong concentrations of advanced industries and high-value economic activity.
• Tampa Bay’s moderate GRP per capita places it closer to regions like Orlando and San Antonio, underscoring the metro’s continued dependence on service-oriented sectors with comparatively lower output per worker.
Gross Regional Product Per Capita
Gross Regional Product (GRP) per capita measures the total economic output of a region divided by its population. It reflects the average value of goods and services produced per resident and serves as a core indicator of regional economic productivity, competitiveness, and overall economic strength. Source: U.S. Bureau of Economic Analysis (BEA), Regional Economic Accounts, 2013–2023.Gross Domestic Product by Metropolitan Area, divided by population to calculate GRP per capita.
Real GDP Per Capita in Information Industry
- Tampa Bay’s Information GDP per capita has grown steadily rising from around $1 519 in 2013 to $2 261 in 2023 indicating gradual strengthening of the region’s digital and information-based economy though it still trails most comparison metros - Seattle remains in a league of its own, with Information GDP per capita increasing from about $9,943 in 2013 to over $33,000 in 2023, reflecting its status as one of the world’s most concentrated tech hubs - Tampa Bay continues to sit in the lower tier of comparison MSAs, but its post-2021 gains suggest improving productivity and growing contributions from tech, media, and data-driven industries
Real GDP Per Capita in Information Industry
• Tampa Bay’s Information GDP per capita has grown steadily, rising from around $1,519 in 2013 to $2,261 in 2023, indicating gradual strengthening of the region’s digital and information-based economy — though it still trails most comparison metros.
• Seattle remains in a league of its own, with Information GDP per capita increasing from about $9,943 in 2013 to over $33,000 in 2023, reflecting its status as one of the world’s most concentrated tech hubs.
• Tampa Bay continues to sit in the lower tier of comparison MSAs, but its post-2021 gains suggest improving productivity and growing contributions from tech, media, and datadriven industries.
This indicator measures Real Gross Domestic Product (GDP) per capita generated by the Information industry (NAICS 51) in each metropolitan area. Real GDP per capita reflects the inflation-adjusted output of the Information sector divided by the total population, capturing how much economic value this industry contributes for each resident. Source: U.S. Bureau of Economic Analysis (BEA), Real GDP by Metropolitan Area, Table CAGDP9 — Real GDP by Industry (NAICS 51: Information).
-
Real GDP Per Capita in Health Care and Social Assistance Industry
• Tampa Bay’s per capita output in health care and social assistance has steadily increased, rising from about $4,029 in 2013 to $5,010 in 2023, reflecting consistent expansion in regional healthcare services relative to population.
• Nashville stands out as a national leader, with exceptionally high per-capita values each year — driven by its large concentration of hospital systems, healthcare headquarters, and medical service firms — while Baltimore, Miami, and St. Louis also post strong levels.
• Most MSAs experienced a dip in 2020 followed by recovery, mirroring nationwide operational disruptions during COVID-19 and subsequent stabilization as healthcare systems returned to full capacity.
This indicator captures the inflation-adjusted real GDP generated per resident from the Health Care and Social Assistance sector (NAICS 62). Because the measure is per capita, it indicates how intensively the sector contributes to economic output relative to population size, rather than total industry size.
Source: U.S. Bureau of Economic Analysis (BEA), Real GDP by Metropolitan Area, Table CAGDP9 — Real GDP by Industry (NAICS 62).
Real GDP Per Capita
- Austin Denver Miami and Minneapolis record the fastest
financial services, and
- Seattle and Minneapolis remain among the highest-performing
but continues to trend upward
Year 2019 2021 2023
Rental
• Tampa Bay’s per capita GDP in the finance and real-estate sector has steadily strengthened, rising from about $11,100 in 2013 to $14,400 in 2023, showing consistent momentum in financial services and property-related activity.
• Austin, Denver, Miami, and Minneapolis record the fastest long-term gains, reflecting strong population-adjusted growth driven by expanding realestate markets, financial services, and investment activity.
• Seattle and Minneapolis remain among the highest-performing MSAs, with per capita values far above the national peer group, while Tampa Bay sits in the mid-range but continues to trend upward.
This indicator measures Real Gross Domestic Product (GDP) produced by the Finance, Insurance, Real Estate, Rental, and Leasing industries (NAICS sectors 52–53) within each metropolitan area. It captures the inflation-adjusted economic value generated by financial institutions, insurance providers, real-estate activities, leasing services, and related business operations. Source: U.S. Bureau of Economic Analysis (BEA), Real GDP by Metropolitan Area, Table CAGDP9 — Real GDP by Industry (NAICS 52–53) 2013–2023.
Income Inequality(Gini Index)
- Tampa Bay shows a relatively stable Gini Index between 0 46 and 0 48 over the past decade, indicating moderate income inequality with minimal year-to-year variation This stability suggests consistent income distribution trends, though disparities remain between higher- and lower-income households
- Miami and Houston record some of the highest Gini values among all MSAs, reflecting wider
- In contrast, Minneapolis, Denver, and Portland maintain lower Gini Index scores, suggesting more equitable
Income Inequality Gini
Index
2020 2022 2024
• Tampa Bay shows a relatively stable Gini Index between 0.46 and 0.48 over the past decade, indicating moderate income inequality with minimal year-to-year variation. This stability suggests consistent income distribution trends, though disparities remain between higher- and lowerincome households.
and
and
• Miami and Houston record some of the highest Gini values among all MSAs, reflecting wider income gaps driven by high-cost living and concentrated wealth sectors.
• In contrast, Minneapolis, Denver, and Portland maintain lower Gini Index scores, suggesting more equitable income distribution and relatively balanced regional economies.
The Gini Index measures income inequality within each MSA, with values ranging from 0 (perfect equality) to 1 (perfect inequality). It provides insight into how evenly income is distributed among residents and serves as an important indicator of economic balance and inclusiveness within a region.
Sources: U.S. Census Bureau, American Community Survey (ACS), Table B19083: Gini Index of Income Inequality, 2013–2024.
- The unemployment rate gap in Tampa Bay has steadily narrowed over the past
Tampa Bay now ranks among the lower-gap MSAs,
In contrast, St Louis, Minneapolis,
Black-White Unemployment Rate Gap
• The unemployment rate gap in Tampa Bay has steadily narrowed over the past decade, dropping from 6.6% in 2013 to 2.8% in 2024. Tampa Bay now ranks among the lower-gap MSAs, which reflects improving labor market equity between Black and White workers.
Denver, and Miami frequently exhibit the largest gaps, often between 4–10%, indicating persistent disparities in employment outcomes across racial groups
• Charlotte, Raleigh–Durham, Seattle, Orlando, Austin, and San Antonio consistently report the smallest unemployment rate gaps, many years falling below 3%, making them the top performers in racial employment equity.
• In contrast, St. Louis, Minneapolis, Baltimore, Denver, and Miami frequently exhibit the largest gaps, often between 4–10%, indicating persistent disparities in employment outcomes across racial groups.
Year 2020 2022 2024
The Black–White Unemployment Rate Gap measures the percentage-point difference between the unemployment rates of Black and White workers. This indicator reflects racial disparities in access to employment opportunities, labor market stability, and economic inclusion. Source: U.S. Census Bureau, American Community Survey (ACS), Table S2301: Employment Status, 2013–2024.
- The poverty rate gap in Tampa Bay has steadily improved over the decade, falling from 16
in
Tampa Bay now sits in the middle of the comparison MSAs, reflecting gradual reductions in racial disparities in economic hardship
- Austin, Dallas, Orlando, Houston, and Miami consistently report some of the lowest poverty rate gaps, generally between 4–10%, making them among the top-performing MSAs for racial equity in
- In contrast Minneapolis Portland St Louis Denver and Seattle show the highest and most persistent poverty gaps often exceeding 14–25% These MSAs rank at the bottom, indicating deeper structural disparities in income and economic security
Black-White Poverty Rate Gap
• The poverty rate gap in Tampa Bay has steadily improved over the decade, falling from 16.7% in 2013 to 9.7% in 2024. Tampa Bay now sits in the middle of the comparison MSAs, reflecting gradual reductions in racial disparities in economic hardship.
• Austin, Dallas, Orlando, Houston, and Miami consistently report some of the lowest poverty rate gaps, generally between 4–10%, making them among the top-performing MSAs for racial equity in poverty outcomes.
• In contrast, Minneapolis, Portland, St. Louis, Denver, and Seattle show the highest and most persistent poverty gaps, often exceeding 14–25%. These MSAs rank at the bottom, indicating deeper structural disparities in income and economic security.
Black-White Poverty Rate Gap
The Poverty Rate Gap measures the percentage-point difference between poverty rates of Black and White residents. Drawn from ACS data, this indicator highlights racial inequities in income, financial stability, and access to economic opportunity. Source: U.S. Census Bureau, American Community Survey (ACS), Table S1701: Poverty Status in the Past 12 Months, 2013–2024.
Black-White Labor Participation Rate Gap
- The Black–White labor force participation rate gap in Tampa Bay has increased over the decade, rising from 5 5% in 2013 to 7 3% in 2024 Tampa Bay now ranks among the higher-gap MSAs, indicating widening disparities in workforce engagement between Black and White residents
- Houston, Raleigh–Durham, San Antonio, San Diego, Denver, and Baltimore consistently report the smallest gaps, with many years below 2–4%, positioning them as the top-performing MSAs in labor force participation equity
- In contrast, Miami, Phoenix, Orlando, Tampa Bay, and Portland exhibit some of the largest and most volatile gaps, frequently exceeding 6–10%, reflecting persistent inequalities in workforce connection and economic opportunity
Black-White Labor Force Participation
• The Black–White labor force participation rate gap in Tampa Bay has increased over the decade, rising from 5.5% in 2013 to 7.3% in 2024. Tampa Bay now ranks among the higher-gap MSAs, indicating widening disparities in workforce engagement between Black and White residents.
About: The Black–White Labor Force Participation Rate Gap measures the percentage-point difference between Black and White adults who are either employed or actively seeking work This indicator highlights racial disparities in workforce engagement, access to job opportunities, and economic inclusion
• Houston, Raleigh–Durham, San Antonio, San Diego, Denver, and Baltimore consistently report the smallest gaps, with many years below 2–4%, positioning them as the top-performing MSAs in labor force participation equity.
Source: U S Census Bureau, American Community Survey (ACS), Table S2301: Employment Status, 2013–2024
Year 2020 2022 2024
• In contrast, Miami, Phoenix, Orlando, Tampa Bay, and Portland exhibit some of the largest and most volatile gaps, frequently exceeding 6–10%, reflecting persistent inequalities in workforce connection and economic opportunity.
Black-White Labor Participation Rate Gap
The Black–White Labor Force Participation Rate Gap measures the percentage-point difference between Black and White adults who are either employed or actively seeking work. This indicator highlights racial disparities in workforce engagement, access to job opportunities, and economic inclusion.
Source: U.S. Census Bureau, American Community Survey (ACS), Table S2301: Employment Status, 2013–2024.
- The Black–White educational attainment gap in Tampa Bay has fluctuated over the past decade, rising from 9 6% in 2015 to 11 2% in 2024 This places Tampa Bay in the mid-range among comparison MSAs, indicating persistent racial disparities in higher-education access and completion
Black-White Educational Attainment Rate Gap
- Houston, Phoenix, Dallas, and Charlotte consistently recorded some of the smallest gaps (often between 5%–13%), reflecting comparatively lower racial disparities in bachelor’s degree attainment In contrast, Denver, Miami, Minneapolis, San Diego, and Raleigh–Durham exhibited the largest gaps frequently exceeding 20% indicating substantial education inequity across racial groups
• The Black–White educational attainment gap in Tampa Bay has fluctuated over the past decade, rising from 9.6% in 2015 to 11.2% in 2024. This places Tampa Bay in the mid-range among comparison MSAs, indicating persistent racial disparities in higher-education access and completion.
About: The Black–White Educational Attainment Rate Gap measures the percentage-point difference between Black and White adults age 25 and over who hold a bachelor’s degree or higher This indicator highlights racial disparities in access to higher education a key driver of income employment opportunities and long-term economic mobility
Source: U S Census Bureau, American Community Survey (ACS), Table S1501: Educational Attainment, 2015–2024
• Houston, Phoenix, Dallas, and Charlotte consistently recorded some of the smallest gaps (often between 5–13%), reflecting comparatively lower racial disparities in bachelor’s degree attainment. In contrast, Denver, Miami, Minneapolis, San Diego, and Raleigh–Durham exhibited the largest gaps—frequently exceeding 20%— indicating substantial education inequity across racial groups.
The Black–White Educational Attainment Rate Gap measures the percentage-point difference between Black and White adults age 25 and over who hold a bachelor’s degree or higher. This indicator highlights racial disparities in access to higher education — a key driver of income, employment opportunities, and long-term economic mobility. Source: U.S. Census Bureau, American Community Survey (ACS), Table S1501: Educational Attainment, 2015–2024. Year 2020 2022 2024
Black-White Digital Access Gap
- The Black–White digital access gap in Tampa Bay has remained relatively stable over the past decade, fluctuating between 1 12M and 1 38M households In 2024, Tampa Bay recorded a gap of 1 16M placing it in the middle range among comparison MSAs indicating that racial disparities in internet access persist despite gradual improvements since 2021
Black-White Digital Access Gap
- Atlanta, Miami, Houston, Dallas, and Phoenix historically show the largest digital access gaps, each exceeding 1 5M–3M households in earlier years While these MSAs experienced sharp improvements after 2020, they continue to rank among the highest gaps in 2024, signaling enduring inequities in broadband availability and device access In contrast, Jacksonville, Raleigh–Durham, and San Antonio consistently have the smallest digital access gaps, often under 700k households, making them the top-performing MSAs for more equitable digital access across racial groups
• The Black–White digital access gap in Tampa Bay has remained relatively stable over the past decade, fluctuating between 1.12 million and 1.38 million households. In 2024, Tampa Bay recorded a gap of 1.16 million, placing it in the middle range among comparison MSAs indicating that racial disparities in internet access persist despite gradual improvements since 2021.
education employment healthcare and modern economic participation
Sources:U S Census Bureau, American Community Survey (ACS), Tables B28009A and B28009B: Presence and Type of Internet Subscription in Household (White Alone /
2013–2024
• Atlanta, Miami, Houston, Dallas, and Phoenix historically show the largest digital access gaps, each exceeding 1.5–3 million households in earlier years. While these MSAs experienced sharp improvements after 2020, they continue to rank among the highest gaps in 2024, signaling enduring inequities in broadband availability and device access. In contrast, Jacksonville, Raleigh–Durham, and San Antonio consistently have the smallest digital access gaps, often under $700,000 households, making them the top-performing MSAs for more equitable digital access across racial groups.
Sources: U.S. Census Bureau, American Community Survey (ACS), Tables B28009A and B28009B: Presence and Type of Internet Subscription in Household (White Alone / Black or African American Alone), 2013–2024. Year 2020 2022 2024
The Black–White Digital Access Gap measures the difference in the number of Black and White households with access to a computer and broadband internet. This metric highlights racial disparities in digital inclusion—an essential component for education, employment, healthcare, and modern economic participation.
Black-White Public Transportation Rate
- The Black–White public transportation rate gap in Tampa Bay has fluctuated significantly over the past decade, ranging from 3 8% in 2023 to 32 3% in 2015 In 2024, the gap stands at 24 1%, placing Tampa Bay in the mid-range of comparison MSAs, reflecting ongoing disparities in public transit use across racial groups - Portland, Denver, Minneapolis, San Diego, and Seattle consistently show some of the largest transportation rate gaps, frequently exceeding 40–70% in earlier years, indicating wide differences in transit reliance between Black and White residents
Black-White Public Transportation Rate Gap
- In contrast, Raleigh–Durham, Houston, Charlotte, and Dallas often record the smallest gaps, with several years below 10%, making them the top performers for more equitable public transportation utilization
• The Black–White public transportation rate gap in Tampa Bay has fluctuated significantly over the past decade, ranging from 32.3% in 2015 to 3.8% in 2023. In 2024, the gap stands at 24.1%, placing Tampa Bay in the mid-range of comparison MSAs, reflecting ongoing disparities in public transit use across racial groups.
• Portland, Denver, Minneapolis, San Diego, and Seattle consistently show some of the largest transportation rate gaps, frequently exceeding 40–70% in earlier years, indicating wide differences in transit reliance between Black and White residents.
• In contrast, Raleigh–Durham, Houston, Charlotte, and Dallas often record the smallest gaps, with several years below 10%, making them the top performers for more equitable public transportation utilization.
Black-White Public Transportation Rate Gap
The Black–White Public Transportation Rate Gap measures the difference in the percentage of Black and White workers who rely on public transportation for their daily commute. This indicator reflects disparities in mobility, access to reliable transportation options, and proximity to transit systems. Sources: U.S. Census Bureau, American Community Survey (ACS), Table S0802: Means of Transportation to Work, 2013–2024.
Black-White Car Transportation Rate Gap
- The Black–White car transportation rate gap in Tampa Bay has gradually narrowed from its peak of 72% in 2013 to 51 3% in 2024 Although improving, Tampa Bay still ranks among the higher-gap MSAs indicating substantial racial differences in car dependency and access to private vehicles
Black-White Car Transportation Rate
• The Black–White car transportation rate gap in Tampa Bay has gradually narrowed from its peak of 72% in 2013 to 51.3% in 2024. Although improving, Tampa Bay still ranks among the higher-gap MSAs, indicating substantial racial differences in car dependency and access to private vehicles.
- Minneapolis, Portland, Denver, Phoenix, and San Antonio consistently show the largest gaps, with values often between 60%–83% across the decade These MSAs demonstrate the widest racial disparities in access to car transportation - In contrast Atlanta Miami Houston Raleigh–Durham Dallas and Orlando record the smallest gaps many falling below 15–35% in recent years making them the top-performing MSAs with comparatively more equitable access to car use between Black and White workers
• Minneapolis, Portland, Denver, Phoenix, and San Antonio consistently show the largest gaps, with values often between 60%–83% across the decade. These MSAs demonstrate the widest racial disparities in access to car transportation.
to private vehicles mobility resources and transportation independence across racial groups
Sources: U S Census Bureau, American Community Survey (ACS), Table S0802: Means of Transportation to Work, 2013–2024
Year 2020 2022 2024
• In contrast, Atlanta, Miami, Houston, Raleigh–Durham, Dallas, and Orlando record the smallest gaps, many falling below 15–35% in recent years, making them the top-performing MSAs with comparatively more equitable access to car use between Black and White workers.
Black-White Car Transportation Rate Gap
The Black–White Car Transportation Rate Gap measures the percentage-point difference in the share of Black and White workers who commute by car — whether driving alone or carpooling. This indicator reflects disparities in access to private vehicles, mobility resources, and transportation independence across racial groups. Sources: U.S. Census Bureau, American Community Survey (ACS), Table S0802: Means of Transportation to Work, 2013–2024.
Section 2: Education and Opportunity
Education plays a central role in shaping opportunity across the Tampa Bay region, influencing workforce readiness, employment participation, and long-term economic mobility. Education serves as a critical pathway connecting economic conditions to community well-being. By shaping access to skills, credentials, and employment opportunities, education influences how individuals engage with the labor market and how economic growth translates into lived experience. The indicators in this section examine how residents move through the education pipeline — from postsecondary participation and degree attainment to labor force engagement and economic outcomes — and whether educational progress translates into meaningful opportunity.
Over the past decade, Tampa Bay has made steady gains in educational attainment. A growing share of adults hold a bachelor’s degree or higher, and participation in education beyond high school has increased among young adults. Degree production at the associate, bachelor’s, and master’s levels has stabilized in recent years, reflecting continued investment in postsecondary education and workforce preparation.
At the same time, the relationship between education and opportunity remains uneven. While higher levels of educational attainment are generally associated with stronger labor force participation and higher earnings, Tampa Bay continues to lag peer regions in fully converting educational gains into competitive economic outcomes. Indicators show that both labor market engagement and earnings vary substantially by education level, and that higher attainment does not uniformly shield residents from economic vulnerability.
These patterns point to a critical question for the region: whether educational pathways are sufficiently aligned with the demands and opportunities of the local labor market. As Tampa Bay continues to expand its educated workforce, the effectiveness of education as a driver of opportunity will depend not only on access and attainment, but on how well education connects to stable employment, competitive wages, and upward mobility.
Key Insights Education and Opportunity
Overall Takeaway:
Educational attainment and workforce participation are central drivers of opportunity in the region, but disparities in access and outcomes remain closely linked to poverty and employment stability.
Highlights
• Education increases opportunity: Poverty rates are substantially lower among adults with bachelor’s degrees or higher, underscoring the economic value of postsecondary attainment.
• Pipeline strength with variation: Degree production at the associate’s, bachelor’s, and master’s levels continues steadily, though participation and completion vary by age and education level.
• Workforce alignment: Employment–population ratios rise sharply with educational attainment, indicating stronger labor market attachment among higher-educated residents.
• STEM and information economy signals: Employment in information-related industries and reported AI adoption point to growing demand for digital and technical skills.
• Access gaps persist: Differences in educational attainment, digital access, and labor participation continue to shape who is positioned to benefit from emerging economic opportunities.
Number of Students Receiving Associate Degree
- Tampa Bay shows a gradual decline over the
with minor recovery in recent years (2023–2024), suggesting potential challenges in sustaining associate-level enrollments despite improving higher education participation statewide
Number of Students Receiving Associate Degree
- Orlando and Houston demonstrate relative stability with mild upward movement, indicating consistent student participation and access to associate programs
- Austin and Raleigh-Durham display steady improvements, pointing toward strong community college engagement and workforce-aligned education systems, while Baltimore and St Louis continue to decline, reflecting regional enrollment challenges
• Tampa Bay shows a gradual decline over the decade, with minor recovery in recent years (2023–2024), suggesting potential challenges in sustaining associate-level enrollments despite improving higher education participation statewide.
• Orlando and Houston demonstrate relative stability with mild upward movement, indicating consistent student participation and access to associate programs.
• Austin and Raleigh-Durham display steady improvements, pointing toward strong community college engagement and workforce-aligned education systems, while Baltimore and St. Louis continue to decline, reflecting regional enrollment challenges.
Year 2020 2022 2024
Number of Students Receiving Associate Degree
This indicator represents the change in the number of students receiving associate degrees across selected MSAs. It reflects regional patterns in postsecondary education and helps identify shifts in entry-level workforce readiness and educational accessibility. Sources: Integrated Postsecondary Education
(IPEDS).
Zillow Home Value Index
-San Diego and Seattle consistently recorded the highest home values among MSAs, driven by strong market demand and favorable economic factors, while St. Louis and Houston had the lowest rents, with minimal increases over the years.
-Tampa Bay’s ranking shifted from 4th in 2019 to 8th in 2022, and further to 4th in 2023, with home values peaking at $356K in 2023. This reflects steady growth in home values and increasing demand, highlighting its growing attractiveness in the real estate market.
Number of Students Receiving Bachelor’s Degree
• Tampa Bay exhibits a gradual decline in bachelor’s degree completions over the past decade, with stabilization in recent years (2023–2024). This trend may suggest challenges in sustaining enrollment or a shift in student interest toward other education pathways or regions.
• Austin and Atlanta show consistent growth, highlighting their position as educational and economic hubs that continue to attract and retain higher education students.
About: The Zillow Home Value Index (ZHVI) tracks typical home values and market changes across regions, focusing on the 35th to 65th percentile range. It includes top-tier, bottom-tier, single-family residences, condos/co-ops, and homes by bedroom count.
Source: Zillow Economic Research, Zillow Home Value Index (ZHVI). (Data downloaded from Zillow Research Data).
• Raleigh-Durham and Minneapolis demonstrate strong academic participation and growth, while Baltimore and St. Louis experience notable declines, indicating regional disparities in educational attainment.
This indicator represents the change in the number of students receiving bachelor’s degrees across selected MSAs. It reflects regional higher education performance and helps gauge the development of a skilled workforce essential for innovation and economic growth. Sources: Integrated Postsecondary Education Data System (IPEDS).
- Tampa Bay shows a moderate decline in master’s degree completions over the decade, with stabilization in recent years (2023–2024), suggesting efforts to recover graduate-level participation and strengthen advanced education pathways.
- Atlanta and Raleigh-Durham record steady increases in master’s completions, indicating strong growth in postgraduate education and alignment with industries requiring specialized expertise.
- Austin and Baltimore display stable to upward trends, reflecting consistent graduate engagement, whereas St. Louis and Phoenix experience noticeable decreases, signaling potential retention and enrollment challenges.
• Tampa Bay shows a moderate decline in master’s degree completions over the decade, with stabilization in recent years (2023–2024), suggesting efforts to recover graduatelevel participation and strengthen advanced education pathways.
About: This indicator represents the change in the number of students receiving master’s degrees across selected MSAs. It highlights trends in advanced educational attainment and serves as an indicator of regional investment in graduate-level education and workforce development.
Sources: Integrated Postsecondary Education Data System (IPEDS)
Number of Students Receiving Master’s Degree
• Atlanta and Raleigh-Durham record steady increases in master’s completions, indicating strong growth in postgraduate education and alignment with industries requiring specialized expertise.
• Austin and Baltimore display stable to upward trends, reflecting consistent graduate engagement, whereas St. Louis and Phoenix experience noticeable decreases, signaling potential retention and enrollment challenges.
This indicator represents the change in the number of students receiving master’s degrees across selected MSAs. It highlights trends in advanced educational attainment and serves as an indicator of regional investment in graduate-level education and workforce development. Sources: Integrated Postsecondary Education Data System (IPEDS). Year 2020 2022 2024
Educational Attainment After High School (Age 18–24)
- Tampa Bay’s share of young adults continuing education after high school climbed from about 35% in 2013 to nearly 49% in 2024, reflecting growing college enrollment and stronger retention into two- and four-year programs.
Educational Attainment After High School
- Raleigh Durham, San Diego, Minneapolis, and Austin lead the group, reaching roughly 52–57% in 2024; these metros benefit from dense university networks, higher household educational attainment, and strong local economies that attract students pursuing advanced education.
• Tampa Bay’s share of young adults continuing education after high school climbed from about 35% in 2013 to nearly 49% in 2024, reflecting growing college enrollment and stronger retention into two- and four-year programs.
- Phoenix, Houston, San Antonio, and Jacksonville consistently fall on the lower end, generally in the mid-40% range in 2024, driven by larger early-employment pathways, more trade-focused labor markets, and historically lower college progression among young adults.
• Raleigh-Durham, San Diego, Minneapolis, and Austin lead the group, reaching roughly 52–57% in 2024; these metros benefit from dense university networks, higher household educational attainment, and strong local economies that attract students pursuing advanced education.
About: This indicator measures the share of young adults aged 18–24 in each metropolitan area who continue their education beyond high school, including those enrolled in some college, associate degree programs, or pursuing a bachelor’s degree or higher.
• Phoenix, Houston, San Antonio, and Jacksonville consistently fall on the lower end, generally in the mid-40% range in 2024, driven by larger early-employment pathways, more tradefocused labor markets, and historically lower college progression among young adults.
Sources: U.S. Census Bureau, American Community Survey (ACS) 1-Year Estimates, Table S1501: Educational Attainment, 2013–2024.
This indicator measures the share of young adults aged 18–24 in each metropolitan area who continue their education beyond high school, including those enrolled in some college, associate degree programs, or pursuing a bachelor’s degree or higher. Sources: U.S. Census Bureau, American Community Survey (ACS) 1-Year Estimates, Table S1501: Educational Attainment, 2013–2024.
Percentage of Population (25+) with Bachelor s or Higher Degree
- Tampa Bay shows a steady upward trend in educational attainment Its share of adults with a bachelor’s degree or higher rises from roughly 31–32% in the early 2010s to around 37–38% by 2024 This positions Tampa Bay in the middle tier of all metros but shows consistent improvement over the decade, signaling ongoing gains in workforce qualification and talent retention - Raleigh–Durham, Austin, Seattle, Minneapolis, and Denver consistently lead the group, with 2024 levels ranging from approximately 48% to 54% These regions maintain a clear and persistent advantage across the entire 2013–2024 period - Jacksonville, Orlando, St Louis, and San Antonio remain in the lower tier, with 2024 rates generally between 32% and 36%, reflecting slower growth and a continued gap relative to the top-performing metros
Percentage of Population (25+) with Bachelor’s Degree or Higher
• Tampa Bay shows a steady upward trend in educational attainment. Its share of adults with a bachelor’s degree or higher rises from roughly 31–32% in the early 2010s to around 37–38% by 2024. This positions Tampa Bay in the middle tier of all metros but shows consistent improvement over the decade, signaling ongoing gains in workforce qualification and talent retention.
• Raleigh–Durham, Austin, Seattle, Minneapolis, and Denver consistently lead the group, with 2024 levels ranging from approximately 48% to 54%. These regions maintain a clear and persistent advantage across the entire 2013–2024 period.
About: This indicator represents the percentage of adults aged 25 years and older with a bachelor’s degree or higher across selected MSAs It highlights regional differences in educational attainment reflecting workforce preparedness human capital development and potential for innovation-driven economic growth
Source: U S Census Bureau American Community Survey (ACS) Table B15003: Educational Attainment for the Population 25 Years and Over (1-Year Estimates)
• Jacksonville, Orlando, St. Louis, and San Antonio remain in the lower tier, with 2024 rates generally between 32% and 36%, reflecting slower growth and a continued gap relative to the top-performing metros.
This indicator represents the percentage of adults aged 25 years and older with a bachelor’s degree or higher across selected MSAs. It highlights regional differences in educational attainment, reflecting workforce preparedness, human capital development, and potential for innovation-driven economic growth.
Source: U.S. Census Bureau, American Community Survey (ACS), Table B15003: Educational Attainment for the Population 25 Years and Over (1-Year Estimates).
Share of Bachelor's Degrees in STEM
Tampa Bay exhibits steady but slow growth amidst competitive volatility. The region’s share of STEM degrees increased marginally from approximately 43% in 2020 to nearly 45% in 2024. However, this internal stability has not secured a strong competitive foothold; Tampa Bay’s ranking has fluctuated wildly, dropping from a peak of Rank 11 in 2014 to a low of Rank 17 (2017–2018) before recovering to Rank 14 in 2024. This suggests the region is merely keeping pace with national trends rather than distinguishing itself as a rising tech talent hub.
Share of Bachelor’s Degrees in STEM
Seattle cemented its role as the premier STEM powerhouse, holding the Rank 1 position for the entire decade and reaching a dominant share of over 56% in 2024. In stark contrast, Nashville consistently anchored the bottom of the market (Rank 20), with STEM degree shares hovering near 40–42%, highlighting a massive structural gap in technical talent production compared to leaders like Seattle and San Diego.
• Tampa Bay exhibits steady but slow growth amidst competitive volatility. The region’s share of STEM degrees increased marginally from approximately 43% in 2020 to nearly 45% in 2024. However, this internal stability has not secured a strong competitive foothold; Tampa Bay’s ranking has fluctuated wildly, dropping from a peak of No. 11 in 2014 to a low of No. 17 (2017–2018) before recovering to No. 14 in 2024. This suggests the region is merely keeping pace with national trends rather than distinguishing itself as a rising tech talent hub.
About: Share of Bachelor’s Degrees in STEM measures the percentage of the population holding a degree in Science, Technology, Engineering, or Mathematics. Definition: STEM fields include computer and information sciences, engineering, mathematics, and natural sciences (biological and physical).Source: U.S. Census Bureau, American Community Survey (ACS), Table B15010: Detailed Field of Bachelor's Degree for First Major for the Population 25 Years and Over, 2013–2024
• Seattle cemented its role as the premier STEM powerhouse, holding the No. 1 position for the entire decade and reaching a dominant share of over 56% in 2024. In stark contrast, Nashville consistently anchored the bottom of the market (No. 20), with STEM degree shares hovering near 40–42%, highlighting a massive structural gap in technical talent production compared to leaders like Seattle and San Diego.
Share of Bachelor's Degrees in STEM
Share of Bachelor’s Degrees in STEM measures the percentage of the population holding a degree in Science, Technology, Engineering, or Mathematics. Definition: STEM fields include computer and information sciences, engineering, mathematics, and natural sciences (biological and physical). Source: U.S. Census Bureau, American Community Survey (ACS), Table B15010: Detailed Field of Bachelor’s Degree for First Major for the Population 25 Years and Over, 2013–2024. Year 2020 2022 2024
- Tampa Bay’s employment–population ratio has gradually increased since 2020, reflecting steady recovery and growth in local job participation.
- Austin, Denver, and Minneapolis maintain the highest ratios, showing sustained economic engagement across their working-age populations.
Employment–Population Ratio
- Baltimore and Portland remain below the benchmark median, indicating weaker overall labor market participation.
• Tampa Bay’s employment–population ratio has gradually increased since 2020, reflecting steady recovery and growth in local job participation.
• Austin, Denver, and Minneapolis maintain the highest ratios, showing sustained economic engagement across their working-age populations.
About: This indicator measures the percentage of the civilian noninstitutional population aged 16 and over that is currently employed. It reflects the overall level of employment utilization within a region and complements the unemployment rate by highlighting total engagement in the labor market.
• Baltimore and Portland remain below the benchmark median, indicating weaker overall labor market participation.
Sources: U.S. Census Bureau, American Community Survey (ACS), Table S2301 – Employment Status, 1-Year Estimates (2015–2024). Data aggregated at the Metropolitan Statistical Area (MSA) level for the 20 benchmark regions in the State of the Region framework.
Year 2019 2022 2024
Year of Year 2019 2022 2024
About: This indicator measures the percentage of the civilian noninstitutional population aged 16 and over that is currently employed. It reflects the overall level of employment utilization within a region and complements the unemployment rate by highlighting total engagement in the labor market. Sources: U.S. Census Bureau, AmericanCommunitySurvey(ACS), Table S2301 – Employment Status, 1-Year Estimates (2015–2024). Data aggregated at the Metropolitan Statistical Area (MSA) level for the 20 benchmark regions in the StateoftheRegionframework.
Labor Force Participation Rate
- Tampa Bay’s labor force participation rate has improved steadily since 2020, indicating increased reentry of working-age individuals into the job market.
- Austin, Denver, and Raleigh continue to lead with the highest participation rates, reflecting strong regional economies and workforce engagement.
• Tampa Bay’s labor force participation rate has improved steadily since 2020, indicating increased reentry of working-age individuals into the job market.
- Baltimore and Portland remain below the benchmark median, suggesting slower recovery and limited participation among available workers.
Labor Force Participation Rate
• Austin, Denver, and Raleigh continue to lead with the highest participation rates, reflecting strong regional economies and workforce engagement.
• Baltimore and Portland remain below the benchmark median, suggesting slower recovery and limited participation among available workers.
About: This indicator measures the percentage of the civilian noninstitutional population aged 16 and over that is either employed or actively seeking employment. It reflects the extent of engagement of the working-age population in the labor market and provides context to employment and unemployment trends.
Sources: U.S. Census Bureau, American Community Survey (ACS), Table S2301 – Employment Status, 1-Year Estimates (2015–2024). Data aggregated at the Metropolitan Statistical Area (MSA) level for the 20 benchmark regions in the State of the Region framework.
Year 2019 2022 2024
Labor Force Participation
About: This indicator measures the percentage of the civilian noninstitutional population aged 16 and over that is either employed or actively seeking employment. It reflects the extent of engagement of the working-age population in the labor market and provides context to employment and unemployment trends. Sources: U.S. Census Bureau, AmericanCommunitySurvey(ACS), Table S2301 – Employment Status, 1-Year Estimates (2015–2024). Data aggregated at the Metropolitan Statistical Area (MSA) level for the 20 benchmark regions in the StateoftheRegionframework.
Labor Force Participation Rate by MSA: High School Graduates
Tampa Bay shows a recovering but volatile labor market. While the labor force participation rate steadily climbed to 75.1% in 2024, its competitive standing remains unstable. After surging from a historical floor of Rank 20 to a peak of Rank 13 in 2023, the MSA corrected to Rank 17 in 2024, indicating that improved local engagement has not yet guaranteed a sustained mid-tier position against peer markets.
MSA: High School
Labor Force Participation Rate by
Graduates
Denver maintained undisputed leadership, consistently holding Rank 1 and boasting a superior ~79% participation rate. In contrast, San Antonio mirrored Tampa Bay’s historical lows (Rank 19–20), while Raleigh faced instability with significant dips in participation, highlighting the widening performance gap between established hubs and developing MSAs.
• Tampa Bay shows a recovering but volatile labor market. While the labor force participation rate steadily climbed to 75.1% in 2024, its competitive standing remains unstable. After surging from a historical floor of No. 20 to a peak of No. 13 in 2023, the MSA corrected to No. 17 in 2024, indicating that improved local engagement has not yet guaranteed a sustained midtier position against peer markets.
About: Labor Force Participation Rate measures the percentage of the population active in the workforce for only highschool graduates. Definition: The labor force includes the employed, the unemployed, and the Armed Forces.
Year 2020 2022 2024
Source: U.S. Census Bureau, American Community Survey (ACS), Table B23006: Educational Attainment by Employment Status for the Population 25 to 64 Years, 2013–2024
• Denver maintained undisputed leadership, consistently holding the No. 1 position and boasting a superior ~79% participation rate. In contrast, San Antonio mirrored Tampa Bay’s historical lows (Nos. 19–20), while Raleigh faced instability with significant dips in participation, highlighting the widening performance gap between established hubs and developing MSAs.
Labor Force Participation Rate by MSA: High School Graduates
Tampa Bay
About: Labor Force Participation Rate measures the percentage of the population active in the workforce for only high school graduates. Definition: The labor force includes the employed, the unemployed, and the Armed Forces. Source: U.S. Census Bureau, American Community Survey (ACS), Table B23006: Educational Attainment by Employment Status for the Population 25 to 64 Years, 2013–2024.
- Tampa Bay’s information industry employment has remained steady from 2019 to 2024, showing modest recovery after a slight dip in 2022. - Major metros such as Seattle, Dallas–Fort Worth, and Miami continue to lead the nation, reflecting their mature technology ecosystems.
- Tampa Bay ranks in the middle tier among peer MSAs, performing better than Orlando, St. Louis, and several southeastern metros, but still trailing fast-growing innovation hubs like Austin and Denver.
• Tampa Bay’s information industry employment has remained steady from 2019 to 2024, showing modest recovery after a slight dip in 2022.
- The overall regional trend suggests a slow but consistent stabilization in digital and information-driven employment sectors.
Information Industry
• Major metros such as Seattle, Dallas–Fort Worth, and Miami continue to lead the nation, reflecting their mature technology ecosystems.
• Tampa Bay ranks in the middle tier among peer MSAs, performing better than Orlando, St. Louis, and several southeastern metros, but still trailing fast-growing innovation hubs like Austin and Denver.
About: This indicator measures total civilian employment in the Information Industry, which includes publishing, telecommunications, broadcasting, data processing, and other technology-driven activities. The measure reflects the scale of a region’s technology and digital communications workforce—an important marker of innovation capacity and economic diversification.
• The overall regional trend suggests a slow but consistent stabilization in digital and information-driven employment sectors.
Sources: U.S. Census Bureau, American Community Survey (ACS), Table S2405 – Industry by Occupation, 1-Year Estimates (2015–2024). Data aggregated at the Metropolitan Statistical Area (MSA) level for the 20 benchmark regions in the State of the Region framework.
Year 2019 2022 2024
About: This indicator measures total civilian employment in the Information Industry, which includes publishing, telecommunications, broadcasting, data processing, and other technology-driven activities. The measure reflects the scale of a region’s technology and digital communications workforce — an important marker of innovation capacity and economic diversification. Sources: U.S. Census Bureau, American Community Survey (ACS) , Table S2405 – Industry by Occupation, 1-Year Estimates (2015–2024). Data aggregated at the Metropolitan Statistical Area (MSA) level for the 20 benchmark regions in the State of the Region framework.
Labor Force Participation Rate by MSA:
Labor Force Participation Rate by MSA: Bachelor's & Higher Degrees
Tampa Bay exhibits steady internal growth but remains structurally anchored at the bottom. While the labor force participation rate for residents with a bachelor’s degree or higher improved from roughly 84.2% in 2020 to 86.4% in 2024, this progress has not impacted its competitive standing. The region has been stagnant at Rank 20 (the absolute bottom) since 2016, indicating that while educated residents are increasingly joining the workforce, the region is not improving fast enough to close the gap with even the second-lowest performing markets.
Bachelor’s Degree or Higher
• Tampa Bay exhibits steady internal growth but remains structurally anchored at the bottom. While the labor force participation rate for residents with a bachelor’s degree or higher improved from roughly 84.2% in 2020 to 86.4% in 2024, this progress has not impacted its competitive standing. The region has been stagnant at No. 20 (the absolute bottom) since 2016, indicating that while educated residents are increasingly joining the workforce, the region is not improving fast enough to close the gap with even the second-lowest performing markets.
Denver continues to set the national standard, consistently holding the Rank 1 position for the vast majority of the decade and achieving a participation rate of over 91% in 2024. In contrast, Orlando sits just above Tampa Bay at Rank 19, highlighting a broader regional trend where Florida MSAs struggle to match the high engagement levels of premier talent hubs like Denver and Minneapolis.
About: This metric measures the percentage of the population holding a bachelor’s degree or higher that is active in the workforce.
Definition: The labor force includes individuals with advanced education who are either employed, unemployed, or in the Armed Forces. It serves as a key indicator of how effectively a region engages its most highly skilled talent.
Source: U.S. Census Bureau, American Community Survey (ACS), Table B23006: Educational Attainment by Employment Status for the Population 25 to 64 Years, 2013–2024..
• Denver continues to set the national standard, consistently holding the No. 1 position for the vast majority of the decade and achieving a participation rate of over 91% in 2024. In contrast, Orlando sits just above Tampa Bay at No. 19, highlighting a broader regional trend where Florida MSAs struggle to match the high engagement levels of premier talent hubs like Denver and Minneapolis. Year 2022 2023 2024
Labor Force Participation Rate by MSA: Bachelor's & Higher Degrees
About: This metric measures the percentage of the population holding a bachelor’s degree or higher that is active in the workforce. Definition: The labor force includes individuals with advanced education who are either employed, unemployed, or in the Armed Forces. It serves as a key indicator of how effectively a region engages its most highly skilled talent. Source: U.S. Census Bureau, American Community Survey (ACS), Table B23006: Educational Attainment by Employment Status for the Population 25 to 64 Years, 2013–2024.
Median Annual Earnings for High School
Median Annual Earnings for High School Graduates and non Degrees
Graduates without College Degrees
Tampa Bay wages are growing, but competitive positioning remains weak. Median annual earnings for high school graduates rose from approximately $31,600 in 2020 to roughly $36,500 in 2024. Despite this internal wage growth, the MSA has struggled to climb the competitive ladder, fluctuating between Rank 14 and Rank 18 over the last decade and settling at Rank 16 in 2024. This indicates that while local purchasing power may be improving slightly, the region continues to lag behind peer markets in offering competitive wages for its foundational workforce.
• Tampa Bay wages are growing, but competitive positioning remains weak. Median annual earnings for high school graduates rose from approximately $31,600 in 2020 to roughly $36,500 in 2024. Despite this internal wage growth, the MSA has struggled to climb the competitive ladder, fluctuating between No. 14 and No. 18 over the last decade and settling at No. 16 in 2024. This indicates that while local purchasing power may be improving slightly, the region continues to lag behind peer markets in offering competitive wages for its foundational workforce.
Seattle maintained its position as the market leader, holding the Rank 1 spot consistently and driving the upper bound of earnings potential. In contrast, San Antonio has anchored the bottom of the rankings (Rank 20) for nearly the entire decade, with 2024 earnings of approximately $34,000, highlighting the stark disparity in earning power for high school graduates between the most and least competitive metros.
Year 2020 2022 2024
About: This metric measures the median annual earnings for the population aged 25 and older whose highest level of education is a high school diploma (or equivalent) or who have some college experience but no degree. Definition: Earnings encompass all wages, salaries, and net self-employment income. This indicator reflects the economic vitality and standard of living affordable to the region's mid-skill workforce. Source:U.S. Census Bureau, American Community Survey (ACS), Table B20004: Earnings by Educational Attainment , 2013–2024...
• Seattle maintained its position as the market leader, holding the No. 1 spot consistently and driving the upper bound of earnings potential. In contrast, San Antonio has anchored the bottom of the rankings (No. 20) for nearly the entire decade, with 2024 earnings of approximately $34,000, highlighting the stark disparity in earning power for high school graduates between the most and least competitive metros.
Median Annual Earnings for High School Graduates and non Degrees Year 2020 2022 2024
About: This metric measures the median annual earnings for the population aged 25 and older whose highest level of education is a high school diploma (or equivalent) or who have some college experience but no degree. Definition: Earnings encompass all wages, salaries, and net self-employment income. This indicator reflects the economic vitality and standard of living affordable to the region’s mid-skill workforce. Source: U.S. Census Bureau, American Community Survey (ACS), Table B20004: Earnings by Educational Attainment.
Trend over Time
Median Annual Earnings for Higher Education Population
Median Annual Earnings for Higher Education Population
Tampa Bay sees earnings growth but remains competitively stagnant near the bottom. While median annual earnings for residents with higher education rose from approximately $49,000 in 2020 to roughly $60,000 in 2024, this internal growth has not improved the region's market standing. Tampa Bay has remained trapped between Rank 18 and Rank 19 for the entire decade (2013–2024), effectively hugging the bottom of the cohort alongside Orlando. This indicates that while local wages are rising, they are merely drifting upward with inflation rather than closing the gap with higher-paying competitor markets.
• Tampa Bay sees earnings growth but remains competitively stagnant near the bottom. While median annual earnings for residents with higher education rose from approximately $49,000 in 2020 to roughly $60,000 in 2024, this internal growth has not improved the region’s market standing. Tampa Bay has remained trapped between No. 18 and No. 19 for the entire decade (2013–2024), effectively hugging the bottom of the cohort alongside Orlando. This indicates that while local wages are rising, they are merely drifting upward with inflation rather than closing the gap with higher-paying competitor markets.
Seattle continues to dominate as the salary leader, maintaining the Rank 1 position consistently since 2013 and posting median earnings exceeding $91,000 in 2024. In contrast, Orlando anchored the absolute bottom (Rank 20) in 2024 with earnings dipping just below the $60k mark, highlighting a regional challenge for Florida markets in attracting and retaining top-tier talent with competitive compensation.
• Seattle continues to dominate as the salary leader, maintaining the No. 1 position consistently since 2013 and posting median earnings exceeding $91,000 in 2024. In contrast, Orlando anchored the absolute bottom (No. 20) in 2024 with earnings dipping just below the $60,000 mark, highlighting a regional challenge for Florida markets in attracting and retaining top-tier talent with competitive compensation.
About: This metric measures the median annual earnings for the population aged 25 and older who hold a bachelor's degree or higher.
Definition: Earnings include wages, salaries, and net self-employment income. This indicator serves as a proxy for the region's ability to offer competitive compensation to its most skilled workforce.
Source:U.S. Census Bureau, American Community Survey (ACS), Table B20004: Earnings by Educational Attainment , 2013–2024...
Trend Over Time
About: This metric measures the median annual earnings for the population aged 25 and older who hold a bachelor’s degree or higher. Definition: Earnings include wages, salaries, and net self-employment income. This indicator serves as a proxy for the region’s ability to offer competitive compensation to its most skilled workforce. Source: U.S. Census Bureau, American Community Survey (ACS), Table B20004: Earnings by Educational Attainment.
Real GDP Per Capita in Educational Services Industry
Bay’s per-capita output in Educational Services has remained modest but stable, increasing slightly from about $448 per resident in 2013 to $474 in 2023 a level that places it on the lower end compared with peer MSAs - Baltimore St Louis and Nashville consistently rank among the highest per-capita producers reflecting their strong concentration of universities, medical training programs, and institutional education infrastructure that drives above-average sector productivity - Many MSAs experienced a decline in 2020 followed by gradual recovery, mirroring nationwide pandemic disruptions that reduced in-person educational activity before stabilizing as institutions adapted to hybrid and digital service models About:
• Tampa Bay’s per capita output in Educational Services has remained modest but stable, increasing slightly from about $448 per resident in 2013 to $474 in 2023 — a level that places it on the lower end compared with peer MSAs.
• Baltimore, St. Louis, and Nashville consistently rank among the highest per capita producers, reflecting their strong concentration of universities, medical training programs, and institutional education infrastructure that drives above-average sector productivity.
• Many MSAs experienced a decline in 2020 followed by gradual recovery, mirroring nationwide pandemic disruptions that reduced in-person educational activity before stabilizing as institutions adapted to hybrid and digital service models.
About: This indicator measures the inflation-adjusted Real GDP per capita generated by the Educational Services sector (NAICS 61) across each metropolitan area. The values are per capita, the indicator reflects the relative scale and intensity of educational activity in each region, rather than total output alone.
Source: U.S. Bureau of Economic Analysis (BEA), Real GDP by Metropolitan Area, Table CAGDP9 — Real GDP by Industry (NAICS 61).
Recent Full-Time Workers Below the Poverty Line
(Currently Unemployed)
Year 2019 2021 2023
• Tampa Bay’s count of individuals who worked full-time year-round yet remained below the poverty line has shown a mild but consistent rise since 2019, suggesting limited wage resilience among the region’s recently unemployed.
• While Houston and Dallas–Fort Worth lead with substantially higher numbers, Tampa Bay’s values remain near the median among peer MSAs, close to Denver and Seattle.
• The competitive ranking shows Tampa Bay holding a mid-upper position over the past decade, improving slightly since 2021, which indicates a relatively stable but not improving economic security for full-time workers facing unemployment.
About: This indicator measures the number of unemployed individuals aged 16 and over who worked full-time, year-round during the past 12 months and whose income during that period fell below the federal poverty threshold. It reflects the persistence of working poverty within the labor market and highlights the vulnerability of full-time workers who, despite continuous employment, remain economically insecure when they lose their jobs. Sources: U.S. Census Bureau, American Community Survey (ACS) , Table B17009 – Poverty Status in the Past 12 Months by Work Experience of Unemployed Population 16 Years and Over, 1-Year Estimates (2013–2023). Data aggregated at the Metropolitan Statistical Area (MSA) level for the 20 benchmark regions in the State of the Region framework.
- The poverty rate among adults with less than a high school education in Tampa Bay has edged down from 26.0% in 2013 to 21.2% in 2024, its lowest level in the series. After a spike in 2022, Tampa Bay’s rate has moved back into the upper half of comparison MSAs, suggesting renewed progress for residents with lower educational attainment.
• The poverty rate among adults with less than a high school education in Tampa Bay has edged down from 26.0% in 2013 to 21.2% in 2024, its lowest level in the series. After a spike in 2022, Tampa Bay’s rate has moved back into the upper half of comparison MSAs, suggesting renewed progress for residents with lower educational attainment.
- In 2024, Dallas had the lowest poverty rate for adults with less than high school education at 18.0%, while St. Louis had the highest at 29.3%, meaning nearly three in ten adults in that group live in poverty. This wide spread across metros highlights how strongly location continues to shape economic outcomes for residents with limited education.
Percentage of Adults with Less Than High School Education
Below the Poverty Line
About: This indicator measures the share of adults age 25 and older who did not complete high school and live below the federal poverty level. Individuals with lower educational attainment typically face limited job opportunities and lower earnings.
A higher percentage signals greater economic vulnerability within this demographic, while a smaller percentage indicates better economic resilience and access to opportunity despite educational barriers.
Sources: U.S. Census Bureau, American Community Survey (ACS), Table S1701: Poverty Status in the Past 12 Months, 2013–2024.
Year 2020 2022 2024
Year 2020 2022 2024
• In 2024, Dallas had the lowest poverty rate for adults with less than high school education at 18.0%, while St. Louis had the highest at 29.3%, meaning nearly 3 in 10 adults in that group live in poverty. This wide spread across metros highlights how strongly location continues to shape economic outcomes for residents with limited education.
About: This indicator measures the share of adults age 25 and older who did not complete high school and live below the federal poverty level. Individuals with lower educational attainment typically face limited job opportunities and lower earnings. A higher percentage signals greater economic vulnerability within this demographic, while a smaller percentage indicates better economic resilience and access to opportunity despite educational barriers. Sources: U.S. Census Bureau, American Community Survey (ACS), Table S1701: Poverty Status in the Past 12 Months, 2013–2024.
Tampa Bay
Tampa Bay
- The poverty rate among adults with a bachelor’s degree or higher in Tampa Bay has stayed relatively flat, moving only slightly from 5 8%
Despite minor ups and downs, Tampa Bay remains on the higher end of the comparison MSAs, suggesting that even college-educated residents here experience more economic strain than in many peer regions - In 2024, Minneapolis had the lowest poverty rate for adults with a bachelor’s degree or higher at 3 2%, indicating strong economic outcomes for highly educated residents At the other end Miami recorded the highest rate at 6 8% with Orlando (5 9%) and Tampa Bay (5 5%) also among the higher-poverty metros for college-educated adults underscoring regional differences in how far a degree goes in protecting against poverty
Percentage of Adults with a Bachelor’s Degree Below the Poverty Level
• The poverty rate among adults with a bachelor’s degree or higher in Tampa Bay has stayed relatively flat, moving only slightly from 5.8% in 2013 to 5.5% in 2024. Despite minor ups and downs, Tampa Bay remains on the higher end of the comparison MSAs, suggesting that even college-educated residents here experience more economic strain than in many peer regions.
• In 2024, Minneapolis had the lowest poverty rate for adults with a bachelor’s degree or higher at 3.2%, indicating strong economic outcomes for highly educated residents. At the other end, Miami recorded the highest rate at 6.8%, with Orlando (5.9%) and Tampa Bay (5.5%) also among the higher-poverty metros for college-educated adults, underscoring regional differences in how far a degree goes in protecting against poverty.
About: This indicator measures the share of adults age 25 and older with a bachelor’s degree or higher who nevertheless live below the federal poverty level. Although higher education is generally associated with stronger earnings and employment stability, economic hardship can still persist for some highly educated residents. A higher percentage suggests that local labor market conditions or cost-of-living pressures may be limiting the economic returns of a college degree. A lower percentage indicates stronger economic outcomes and better alignment between educational attainment and financial well-being. Sources: U.S. Census Bureau, American Community Survey (ACS), Table S1701: Poverty Status in the Past 12 Months, 2013–2024.
Use of Artificial Intelligence (AI) in Business Operations
Use of Artificial Intelligence (AI)
in Business Operations
• MSAs with higher AI adoption rates include San Francisco, Boston, and Seattle, driven by their strong tech and innovation ecosystems.
• Tampa Bay’s AI adoption levels have steadily improved through 2024, reflecting growing awareness and technology investments among regional firms.
• Businesses in emerging metro areas are catching up, signaling a broadening use of AI tools across industries and markets.
• Continued monitoring of this indicator helps identify regions leading in digital transformation and innovation-driven competitiveness.
Share of Businesses
Currently Using Artificial Intelligence
MSA
Note: This is a new indicator introduced by the U.S. Census Bureau in 2023 under the BusinessTrendsandOutlookSurvey. While there may be inconsistencies in the early data collection, it remains a valuable metric to track emerging technology adoption patterns across metropolitan areas.
Planned Artificial Intelligence (AI) Adoption
• This indicator captures businesses expecting to implement AI tools in the next six months, reflecting anticipated digital readiness and innovation intent.
- This indicator captures businesses expecting to implement AI tools in the next six months, reflecting anticipated digital readiness and innovation intent
- Tech-focused MSAs such as San Jose, Austin, and Boston lead in planned adoption, followed by several Southeastern metros showing increasing interest
Planned Artificial Intelligence (AI)
• Tech-focused MSAs such as San Jose, Austin, and Boston lead in planned adoption, followed by several Southeastern metros showing increasing interest.
- Tampa Bay has seen steady expectations for future AI use, aligning with broader national momentum toward automation and data-driven decision-making
Adoption
• Tampa Bay has seen steady expectations for future AI use, aligning with broader national momentum toward automation and data-driven decision-making.
Note: This is a new indicator introduced by the U.S. Census Bureau in 2023 under the BusinessTrendsandOutlookSurvey. While there may be inconsistencies in the early data collection, it remains a valuable metric to track emerging technology adoption patterns across metropolitan areas.
Business Losses from Extreme Weather Events
- This indicator measures the proportion of businesses reporting monetary losses due to hurricanes, floods, droughts, or heat waves
• This indicator measures the proportion of businesses reporting monetary losses due to hurricanes, floods, droughts, or heat waves.
- Metro areas in coastal and southern regions such as Miami, New Orleans, and Houston tend to experience higher reported impacts
- Tampa Bay’s reported losses vary quarter-to-quarter, reflecting the localized nature of weather events and business exposure levels
• Metro areas in coastal and southern regions — such as Miami, New Orleans, and Houston — tend to experience higher reported impacts.
- The indicator provides insight into economic vulnerability and resilience to climate-related disruptions across regions
Business Losses from Extreme Weather Events
• Tampa Bay’s reported losses vary quarter to quarter, reflecting the localized nature of weather events and business exposure levels.
• The indicator provides insight into economic vulnerability and resilience to climaterelated disruptions across regions.
Note: This is a new indicator introduced by the U.S. Census Bureau in 2023 under the BusinessTrendsandOutlookSurvey. While there may be inconsistencies in the early data collection, it remains a valuable metric to track emerging technology adoption patterns across metropolitan areas.
Section 3: Quality of Life
Quality of life reflects how residents experience daily life within the region — how stable their households are, how affordable it is to live, and how easy it is to function, connect, and participate in their communities. Rather than focusing on systems or programs in isolation, this section takes a people-centered view, emphasizing the everyday conditions that shape well-being, opportunity, and a sense of belonging.
To capture these experiences, the Quality of Life theme is organized into three interrelated dimensions:
1. Housing affordability and stability considers the cost, availability, and tenure of housing, recognizing housing as a central driver of household security and displacement risk.
2. Community context looks at how easily residents can navigate everyday life, access services, and remain connected to their communities, including factors such as mobility, digital access, inclusion, and civic connection.
3. Foundational stability examines how well households meet basic needs and avoid crisis, focusing on economic security, health, safety, and access to essential supports.
These dimensions provide a holistic view of quality of life across the region. By examining both material conditions and the social context of daily life, this framework helps illuminate how regional growth and change are experienced by residents, and illustrates where pressures, constraints, or opportunities are most likely to shape lived outcomes.
Section 3.1: Housing Affordability and Stability
Housing affordability and stability are central components of quality of life, shaping household security, mobility, and long-term economic resilience — with a secondary impact on the sense of community membership. These indicators examine the cost, availability, and tenure of housing across the region, highlighting the extent to which residents can secure and maintain stable housing without excessive financial strain.
Rising home values and rental costs continue to exert pressure on households across all income levels. Trends in home value and rent indices indicate that housing costs have increased faster than many households’ ability to absorb them, particularly for renters. The share of renters spending 30% or more of their income on housing reflects a growing cost burden, limiting resources available for other essential needs such as healthcare, childcare, and transportation.
Measures of housing affordability further underscore these constraints. The proportion of households with monthly housing costs below $1,500 provides insight into the shrinking availability of lower-cost housing options, while owner-occupancy rates offer a perspective on housing tenure and long-term stability. Together, these indicators suggest that access to affordable housing is increasingly uneven, with implications for both financial security and community continuity.
Housing stability is also influenced by the availability and use of existing housing stock. The share of vacant housing units designated for recreational or seasonal use highlights structural factors that can reduce the supply of housing available to year-round residents, particularly in high-demand areas. While such units contribute to local economies in some contexts, they may also intensify affordability pressures by constraining the housing market for permanent residents.
These indicators point to housing as a key source of strain on quality of life across the region. Affordability challenges do not affect all households equally, but they shape patterns of stability, displacement, and economic vulnerability that ripple through other aspects of daily life.
Key Insights
Housing Affordability and Stability
Overall Takeaway:
Housing costs are a central pressure point for quality of life, affecting household stability and long-term economic security.
Highlights
• Affordability strain: Home values and rents in the region have risen faster than incomes for many households, contributing to a high share of renters who spend 30% or more of their income on housing.
• Limited lower-cost options: The region has a shrinking share of households with monthly housing costs below $1,500, indicating a tightening supply of lower-cost housing options.
• Ownership patterns: Homeownership rates, alongside patterns of vacant and recreational-use housing, suggest that housing availability and stability vary across communities within the region.
• Household tradeoffs: For many households in the region, high housing costs combined with childcare expenses and income constraints limit financial flexibility and increasing vulnerability to economic shocks.
- Tampa Bay’s home values rose sharply over the decade, outpacing many peer metros and approaching levels seen in high-growth markets like Miami and Seattle before a slight cooling in 2025 - Ranking trends show Tampa Bay improving consistently through the mid-2010s, holding a competitive mid-tier position before slipping after 2022 as price growth stabilized locally while other metros continued rising
Zillow Home Value Index
(2013-2025)
• Home values have increased substantially across all major MSAs since 2013, with the strongest surge occurring between 2020 and 2022 as housing demand spiked nationwide.
- Despite recent moderation, Tampa Bay remains one of the stronger long-term performers, reflecting sustained migration, affordability pressures, and robust demand About: This indicator measures the
Year 2021 2023 2025
• Tampa Bay’s home values rose sharply over the decade, outpacing many peer metros and approaching levels seen in high-growth markets like Miami and Seattle before a slight cooling in 2025.
• Ranking trends show Tampa Bay improving consistently through the mid-2010s, holding a competitive mid-tier position before slipping after 2022 as price growth stabilized locally while other metros continued rising.
• Despite recent moderation, Tampa Bay remains one of the stronger long-term performers, reflecting sustained migration, affordability pressures, and robust demand.
About: This indicator measures the typical home value for all homes within each Metropolitan Statistical Area (MSA), based on the Zillow Home Value Index (ZHVI). Values represent the middle price tier and track changes in overall housing market conditions. Data are monthly and aggregated to annual averages for comparison across the 20 benchmark regions in the State of the Region framework. Sources: Zillow, Zillow Home Value Index (ZHVI), 2013–2025. Data for the Metropolitan Statistical Area (MSA) level for the 20 benchmark regions.
spike
- In competitive ranking, Tampa Bay improved steadily through 2020 but lost rank position after 2021, as Sun Belt peers like Miami, Austin, Phoenix, and Orlando saw even stronger rent escalation
Zillow Observed Rent Index
• Rents increased across all 20 benchmark MSAs between 2015 and 2025, with the steepest gains occurring from 2020 to 2023 during the post-pandemic surge in housing demand.
About: This indicator measures median asking rents using the Zillow Observed Rent Index (ZORI) which reflects the typical market rate for new rental listings across U S metropolitan areas
• Florida MSAs — especially Miami, Tampa, Orlando, and Jacksonville — experienced some of the fastest rent appreciation in the country, driven by population inflows and heightened migration from higher-cost metros.
Values represent the rental price for the average housing unit and are updated monthly ZORI captures market dynamics more responsively than contract rent measures, making it useful for tracking shifts in affordability and competitive position across regions
Sources: Zillow Economic Data – Zillow ObservedRentIndex(ZORI), 2015–2025 Data for the Metropolitan Statistical Area (MSA) level for the 20 benchmark regions in the State of the Region project
• Tampa Bay saw strong rent growth from 2020 to 2023 but growth moderated by 2025 as the region’s rental market began normalizing after the pandemic-related spike.
• In competitive ranking, Tampa Bay improved steadily through 2020 but lost rank position after 2021, as Sun Belt peers like Miami, Austin, Phoenix, and Orlando saw even stronger rent escalation.
About: This indicator measures median asking rents using the Zillow Observed Rent Index (ZORI), which reflects the typical market rate for new rental listings across U.S. metropolitan areas. Values represent the rental price for the average housing unit and are updated monthly. ZORI captures market dynamics more responsively than contract rent measures, making it useful for tracking shifts in affordability and competitive position across regions. Sources: Zillow Economic Data – Zillow ObservedRentIndex(ZORI), 2015–2025. Data for the Metropolitan Statistical Area (MSA) level for the 20 benchmark regions in the State of the Region project.
Percentage
Units Occupied by Owner
• Tampa Bay demonstrates one of the highest homeownership rates among all MSAs, increasing from approximately 66% in 2013 to nearly 71% in 2024. This sustained upward trend suggests strong housing demand, favorable affordability, and stable long-term residency within the region.
higher rental markets and affordability challenges, while Baltimore and St Louis remain consistently
Percentage of Units Occupied by Owner
• Jacksonville, Atlanta, and Charlotte also show steady gains, indicating improving economic conditions and household purchasing power over time.
• In contrast, Austin and San Diego maintain relatively low and stagnant ownership rates, reflecting higher rental markets and affordability challenges, while Baltimore and St. Louis remain consistently strong in owner occupancy.
Percentage of Units Occupied by Owner
About: This indicator represents the percentage of occupied housing units that are owned by their occupants across selected MSAs. It reflects the level of housing stability and household investment in local real estate markets, serving as a key measure of long-term community attachment and financial security. Sources: U.S. Census Bureau, American Community Survey (ACS), Table B25003.
second-home ownership and
as a
- Miami and Orlando also record elevated shares of recreational vacancies, underscoring Florida’s reputation as a hub for seasonal residents and leisure-driven housing demand
• Tampa Bay shows consistently high levels of recreational-use vacancies, ranging between 46% and 56% over the past decade — among the highest across all MSAs. This trend reflects the area’s strong tourism economy, second-home ownership, and attractiveness as a retirement destination.
- In contrast, Baltimore, Dallas, and St Louis maintain some of the lowest rates, suggesting housing markets primarily driven by full-time residential demand rather than seasonal or investment activity The recent slight decline in Tampa Bay’s recreational vacancy rate (2022–2024) could signal tightening housing supply, rising demand for permanent residences, or increased conversion of seasonal units into primary housing
Percentage of Vacant Housing Units for Recreational Use
• Miami and Orlando also record elevated shares of recreational vacancies, underscoring Florida’s reputation as a hub for seasonal residents and leisure-driven housing demand.
• In contrast, Baltimore, Dallas, and St. Louis maintain some of the lowest rates, suggesting housing markets primarily driven by full-time residential demand rather than seasonal or investment activity. The recent slight decline in Tampa Bay’s recreational vacancy rate (2022–2024) could signal tightening housing supply, rising demand for permanent residences, or increased conversion of seasonal units into primary housing.
About: This indicator measures the share of vacant housing units that are classified as seasonal, recreational, or occasional-use properties across selected MSAs. It provides insight into the degree of investment or tourism-driven housing in each region, as well as the impact of seasonal residency patterns on local housing markets. Sources: U.S. Census Bureau, American Community Survey (ACS), Table B25004: Vacancy Status, 2013–2024.
- Tampa Bay experienced a sharp decline in affordable housing share, from nearly 79% in 2015 to about 48% in 2024, indicating significant housing cost inflation and growing affordability pressures in the region.
• Tampa Bay experienced a sharp decline in affordable housing share, from nearly 79% in 2015 to about 48% in 2024, indicating significant housing cost inflation and growing affordability pressures in the region.
- Similar downward trends are observed in Orlando, Miami, and Jacksonville, pointing to statewide increases in housing costs across Florida’s urban markets. - Austin, Denver, and Seattle report some of the steepest declines nationally, showing the effects of rapid population growth and limited housing supply. - Meanwhile, St. Louis and San Antonio maintain relatively higher affordability levels, suggesting more balanced housing markets compared to fast-growing metropolitan areas.
Percentage of Households with Monthly Housing Cost Less than $1,500
• Similar downward trends are observed in Orlando, Miami, and Jacksonville, pointing to statewide increases in housing costs across Florida’s urban markets.
• Austin, Denver, and Seattle report some of the steepest declines nationally, showing the effects of rapid population growth and limited housing supply.
About: This indicator represents the share of households whose combined monthly housing costs—including mortgage or rent, utilities, and insurance—are below $1,500. It reflects overall housing affordability across different MSAs and captures how rising housing prices and living costs affect residents’ ability to sustain affordable housing.
• Meanwhile, St. Louis and San Antonio maintain relatively higher affordability levels, suggesting more balanced housing markets compared to fast-growing metropolitan areas.
Sources: U.S. Census Bureau, American Community Survey (ACS), Table B25104: Monthly Housing Costs, 2015–2024
Year 2020 2022 2024
Year 2020 2022 2024
About: This indicator represents the share of households whose combined monthly housing costs—including mortgage or rent, utilities, and insurance — are below $1,500. It reflects overall housing affordability across different MSAs and captures how rising housing prices and living costs affect residents’ ability to sustain affordable housing. Sources: U.S. Census Bureau, American Community Survey (ACS), Table B25104: Monthly Housing Costs, 2015–2024.
Tampa Bay
Tampa Bay
Percentage of Renters Spending 30% or More of Income on Housing
- Tampa Bay’s renter cost burden has risen noticeably over the decade, moving from about 49% in 2013 to nearly 57% in 2024 The increase is especially sharp after 2020, reflecting rapid rent growth outpacing household incomes
Percentage of Renters Spending 30% or
• Tampa Bay’s renter cost burden has risen noticeably over the decade, moving from about 49% in 2013 to nearly 57% in 2024. The increase is especially sharp after 2020, reflecting rapid rent growth outpacing household incomes.
- Miami, Orlando, Tampa Bay, and San Diego show the highest levels of renter cost burden, with Miami topping the list at 62% in 2024 These metros increasingly face severe affordability pressures driven by fast population growth, tight rental markets, and escalating housing demand - St Louis, Minneapolis, Charlotte, and Austin consistently remain on the lower end of the renter burden spectrum, with St Louis recording the lowest share at about 43% in 2024 These regions typically maintain comparatively slower rent inflation and more
More of Income on Housing
• Miami, Orlando, Tampa Bay, and San Diego show the highest levels of renter cost burden, with Miami topping the list at 62% in 2024. These metros increasingly face severe affordability pressures driven by fast population growth, tight rental markets, and escalating housing demand.
• St. Louis, Minneapolis, Charlotte, and Austin consistently remain on the lower end of the renter burden spectrum, with St. Louis recording the lowest share at about 43% in 2024. These regions typically maintain comparatively slower rent inflation and more balanced rental supply.
Cost Burden Among Renters (30% or More of Income)
About: This indicator measures the percentage of renter households in each metropolitan area whose gross rent equals or exceeds 30 percent of their household income. Higher shares of cost-burdened renters can indicate tightening rental markets, rapid rent growth relative to income, limited affordable housing supply, and broader economic stress within a region. Sources: U.S. Census Bureau, American Community Survey (ACS) 1-Year Estimates, Table B25070: Gross Rent as a Percentage of Household Income in the Past 12 Months, 2013–2024.
Section 3.2: Community Context
Community context investigates how easily residents can navigate everyday life and participate as members of the community. Beyond income and housing, these indicators capture the practical and psychosocial conditions that shape whether daily life feels stable, constrained, or disconnected.
Access to essential services plays a central role in daily functioning. Reliable internet access, transportation, and childcare are foundational supports that enable residents to work, access healthcare, participate in education, and remain connected to community life. Gaps in access to these services can impose time, cost, and stress burdens that disproportionately affect households with limited flexibility, including those with young children, older adults, and individuals with disabilities.
Indicators related to mobility and inclusion further highlight constraints on participation. Geographic mobility among households living below the poverty line reflects patterns of instability and displacement that can disrupt employment, schooling, and social networks. Measures of employment among people with disabilities offer insight into functional inclusion, signaling whether residents are able to engage in daily economic life with adequate support and accessibility.
Community context is also shaped by household composition and social connection. The distribution of family and single-person households influences service needs, social support structures, and vulnerability to isolation. Civic engagement, framed here as a psychosocial indicator of connection and belonging, reflects the extent to which residents feel invested in their communities and perceive participation as meaningful.
Population change adds another layer to daily functioning. Inflows of higher-income residents can contribute to economic vitality, but may also place pressure on housing, infrastructure, and local services, shaping how long-term residents experience growth and change. These dynamics influence community continuity, affordability, and the overall ease of daily life.
Together, these indicators show that quality of life is further shaped by the accessibility, stability, and social fabric of everyday experience. Understanding how residents function within their communities provides essential context for interpreting broader economic and housing trends and for assessing the lived impact of regional change.
Key Insights Community Context
Overall Takeaway:
Differences in household makeup, mobility, and community engagement help explain why economic and social conditions are experienced differently across the region. Highlights
• Household structure: A sizable share of single-person and older-adult households highlights increased exposure to housing affordability and health-related risks.
• Mobility and stability: Higher residential mobility among lower-income households points to housing instability and inconsistent access to opportunity.
• Community engagement: Indicators of civic engagement and migration patterns provide context for how residents connect to and invest in their communities. Variation in these indicators reflects uneven levels of community connection and long-term stability for the region.
- Tampa Bay showed one of the highest rates of households without internet access in 2016, ranking among the bottom five MSAs nationwide. However, the region has shown remarkable progress since then, cutting the share of unconnected households from over 14% in 2016 to just around 3% by 2024.
• Tampa Bay showed one of the highest rates of households without internet access in 2016, ranking among the bottom five MSAs nationwide. However, the region has shown remarkable progress since then, cutting the share of unconnected households from over 14% in 2016 to just around 3% by 2024.
- Despite strong improvement, Tampa Bay’s digital inclusion rate still trails behind leading MSAs such as Austin, Denver, and Seattle, where internet access gaps have nearly closed.
- The steady decline across all MSAs highlights the nationwide expansion of broadband infrastructure and affordability programs, with Tampa Bay’s digital divide narrowing faster than in other Florida metros like Miami and Orlando.
• Despite strong improvement, Tampa Bay’s digital inclusion rate still trails behind leading MSAs such as Austin, Denver, and Seattle, where internet access gaps have nearly closed.
• The steady decline across all MSAs highlights the nationwide expansion of broadband infrastructure and affordability programs, with Tampa Bay’s digital divide narrowing faster than in other Florida metros like Miami and Orlando.
About: This indicator measures the percentage of households without any internet subscription, including broadband, cellular data, or satellite connections. It reflects disparities in digital access, which directly influence education, employment opportunities, and overall economic participation in a region.
Percentage of Households without Internet Subscription
Source: U.S. Census Bureau, American Community Survey (ACS), Table B28002: Presence and Types of Internet Subscriptions in Household
About: This indicator measures the percentage of households without any internet subscription, including broadband, cellular data, or satellite connections. It reflects disparities in digital access, which directly influence education, employment opportunities, and overall economic participation in a region.
Source: U.S. Census Bureau, American Community Survey (ACS), Table B28002: Presence and Types of Internet Subscriptions in Household
Tampa Bay
Tampa Bay
Geographic Mobility Among Households Below the Poverty Line
- Tampa Bay’s mobility rate among residents below the poverty line has steadily declined over the past decade, falling from around 23% in 2013 to roughly 16 8% by 2024 This points to gradually improving residential stability for low-income households
- Baltimore, Miami, St Louis, and San Diego show the lowest mobility under poverty levels in 2024, all clustering between 15 6–17% These metros appear to have comparatively stronger residential stability among low-income populations
• Tampa Bay’s mobility rate among residents below the poverty line has steadily declined over the past decade, falling from around 23% in 2013 to roughly 16.8% by 2024. This points to gradually improving residential stability for low-income households.
- Austin, San Antonio, Raleigh-Durham, Orlando, and Seattle show the highest mobility under poverty rates, each exceeding 23–26% in 2024 These regions reflect greater residential churn among low-income residents, which may relate to faster rent growth, rapi d in-migration pressures, or structural housing affordability challenges
Geographic Mobility Among Households Below the Poverty Line
• Baltimore, Miami, St. Louis, and San Diego show the lowest mobility under poverty levels in 2024, all clustering between 15.6–17%. These metros appear to have comparatively stronger residential stability among low-income populations.
• Austin, San Antonio, Raleigh-Durham, Orlando, and Seattle show the highest mobility under poverty rates, each exceeding 23–26% in 2024. These regions reflect greater residential churn among low-income residents, which may relate to faster rent growth, rapid in-migration pressures, or structural housing affordability challenges.
About: This indicator measures the percentage of residents living below the federal poverty line who changed their residence within the past year. Mobility among low-income households can reflect housing instability, displacement pressures, affordability challenges, and broader socioeconomic vulnerability. Sources: U.S. Census Bureau, American Community Survey (ACS) 1-Year Estimates, Table B07012: Geographical Mobility in the Past Year by Poverty Status in the Past 12 Months.
- Migration of individuals earning $75,000 or more rose sharply between 2019 and 2022 before slightly stabilizing in 2023, reflecting post-pandemic relocations of
- Tampa Bay’s competitive rank improved significantly from the lower-middle tier to the upper half of all benchmark regions, nearing Austin and Phoenix by 2023
High-Income Migrants to
• Tampa Bay continues to attract a growing share of high-income movers, with steady gains since 2013 and a notable acceleration after 2020.
• Migration of individuals earning $75,000 or more rose sharply between 2019 and 2022 before slightly stabilizing in 2023, reflecting post-pandemic relocations of affluent households into Florida metros.
About: This indicator measures the number of individuals with annual incomes of $75 000 or more who moved into a Metropolitan Statistical Area (MSA) within the past year It includes moves from other counties within the same state from other U S states and from abroad providing a measure of a region’s ability to attract affluent and skilled residents
Tampa Bay (Annual Income
Sources: U S Census Bureau, American Community Survey(ACS), Table B07010 – Geographical Mobility in the Past Year by Individual Income in the Past 12 Months (for Population 15 Years and Over), 1-Year Estimates (2013–2023)
• Tampa Bay’s competitive rank improved significantly from the lower-middle tier to the upper half of all benchmark regions, nearing Austin and Phoenix by 2023.
Data aggregated at the Metropolitan Statistical Area (MSA) level for the 20 benchmark regions in the State ofthe Region framework
$75,000 and Above)
Year 2019 2022 2023
About: This indicator measures the number of individuals with annual incomes of $75,000 or more who moved into a Metropolitan Statistical Area (MSA) within the past year. It includes moves from other counties within the same state, from other U.S. states, and from abroad, providing a measure of a region’s ability to attract affluent and skilled residents. Sources: U.S. Census Bureau, AmericanCommunitySurvey(ACS), Table B07010 – Geographical Mobility in the Past Year by Individual Income in the Past 12 Months (for Population 15 Years and Over), 1-Year Estimates (2013–2023). Data aggregated at the Metropolitan Statistical Area (MSA) level for the 20 benchmark regions in the StateoftheRegionframework.
Disability Employment Rate
- The disability employment rate in Tampa Bay improved from 0 79 in 2013 to 0 90 in 2024 marking steady progress in integrating residents with disabilities into the workforce Tampa Bay has generally remained in the middle tier of comparison MSAs over time
- In 2024, Austin (0 93) and San Antonio (0 91) recorded the highest disability employment rates, while Tampa Bay’s 0 90 places it just below the top-performing metros and close to peers like Jacksonville (0 89) and Miami (0 91)
• The disability employment rate in Tampa Bay improved from 0.79 in 2013 to 0.90 in 2024, marking steady progress in integrating residents with disabilities into the workforce. Tampa Bay has generally remained in the middle tier of comparison MSAs over time.
- The clustering of rates between 0 89 and 0 93 across MSAs highlights relatively strong labor force participation among people with disabilities nationally, though differences still point to varying levels of accessibility, employer support, and inclusive hiring practices
Disability Employment Rate
• In 2024, Austin (0.93) and San Antonio (0.91) recorded the highest disability employment rates, while Tampa Bay’s 0.90 places it just below the top-performing metros and close to peers like Jacksonville (0.89) and Miami (0.91).
About: This indicator measures the share of working-age individuals with a disability who are employed Employment outcomes for people with disabilities often reflect a community’s
• The clustering of rates between 0.89 and 0.93 across MSAs highlights relatively strong labor force participation among people with disabilities nationally, though differences still point to varying levels of accessibility, employer support, and inclusive hiring practices.
About: This indicator measures the share of working-age individuals with a disability who are employed. Employment outcomes for people with disabilities often reflect a community’s level of accessibility, availability of supportive services, employer accommodations, and overall labor market inclusivity. Higher values indicate stronger integration of residents with disabilities into the workforce, while lower values point to barriers such as discrimination, transportation challenges, lack of workplace adjustments, or limited access to training and job placement services. Sources: U.S. Census Bureau, American Community Survey (ACS), Table C18120: Employment Status by Disability Status, 2013–2024.
Percentage of Single Person Households
- Tampa Bay’s share of single-person households has remained relatively stable over the decade, shifting only slightly from about 28–29% in the early 2010s to about 30% by 2024
- St Louis, Minneapolis, Denver, and Seattle display the highest and most persistent levels of single-person households, often exceeding 32–36% These metros typically reflect older urban cores more renters living alone and higher concentrations of single-resident housing patterns
• Tampa Bay’s share of single-person households has remained relatively stable over the decade, shifting only slightly from about 28–29% in the early 2010s to about 30% by 2024.
- Austin, Raleigh, Dallas, and Houston consistently show some of the lowest single-person household rates, generally ranging between 23–27% These regions tend to have younger family-oriented demographics, strong job-driven in-migration, and higher proportions of multi-person households
Percentage of Single Person Households
• St. Louis, Minneapolis, Denver, and Seattle display the highest and most persistent levels of singleperson households, often exceeding 32–36%. These metros typically reflect older urban cores, more renters living alone, and higher concentrations of single-resident housing patterns.
• Austin, Raleigh, Dallas, and Houston consistently show some of the lowest single-person household rates, generally ranging between 23–27%. These regions tend to have younger family-oriented demographics, strong job-driven in-migration, and higher proportions of multi-person households.
About: This indicator measures the percentage of all households in each metropolitan area that consist of one person living alone. Single-person households can reflect a range of social and economic dynamics, including housing affordability, demographic composition, aging populations, and migration patterns.
Sources: U.S. Census Bureau, American Community Survey (ACS), Table B11016: Household Type by Size, 2013–2024.
Percentage of Family Households
- Tampa Bay’s family household share remains steady at about 62% in 2024, placing the region in the lower-middle of the comparison MSAs The decade-long trend shows only small movements between 61 and 63% with a mild uptick in recent years
- Houston, Orlando, and Dallas consistently record some of the highest family household shares, typically ranging between 66 and 72% These MSAs consistently rank at the top throughout the entire period
- Seattle, Austin, and Minneapolis record the lowest shares in 2024: Seattle at 59 2%, Austin at 58 7%, and Minneapolis at 60 1% These MSAs remain near the bottom of the rankings across most years
Percentage of Family Households
• Tampa Bay’s family household share remains steady at about 62% in 2024, placing the region in the lowermiddle of the comparison MSAs. The decade-long trend shows only small movements between 61-63%, with a mild uptick in recent years.
• Houston, Orlando, and Dallas consistently record some of the highest family household shares, typically ranging between 66-72%. These MSAs consistently rank at the top throughout the entire period.
• Seattle, Austin, and Minneapolis record the lowest shares in 2024: Seattle at 59.2%, Austin at 58.7%, and Minneapolis at 60.1%. These MSAs remain near the bottom of the rankings across most years.
About: The Family Household Share measures the percentage of occupied housing units that are classified as family households, including married-couple families and other related-family arrangements. This indicator helps illustrate the household composition and living patterns across metropolitan areas.
Sources: U.S. Census Bureau, American Community Survey (ACS), Table B11016: Household Type by Size, 2013–2024.
Civic Engagement Rates (Voter Turnout)
Civic Engagement Rates (Voter Turnout)
Tampa Bay civic engagement follows a "peak and correct" pattern. Voter turnout rose from approximately 64% in 2016 to a peak of 70% in 2020, driven by the high-engagement election cycle, before correcting to roughly 67% in 2024. Consequently, the region’s competitive position slightly eroded; after holding steady at Rank 9 from 2016 to 2020, Tampa Bay slipped to Rank 11 in 2024, suggesting that while local engagement is healthy, other metros are mobilizing voters at a faster rate.
Raleigh emerged as the new market leader in 2024, surging to Rank 1 with a turnout rate approaching 80%, overtaking traditional strongholds like Minneapolis (which peaked in 2020). Conversely, San Antonio consistently anchored the bottom of the cohort (Rank 20), with participation struggling to break 60% (approx. 58% in 2024), highlighting a persistent engagement gap compared to the most active metros.
• Tampa Bay civic engagement follows a “peak and correct” pattern. Voter turnout rose from approximately 64% in 2016 to a peak of 70% in 2020, driven by the highengagement election cycle, before correcting to roughly 67% in 2024. Consequently, the region’s competitive position slightly eroded; after holding steady at No. 9 from 2016 to 2020, Tampa Bay slipped to No. 11 in 2024, suggesting that while local engagement is healthy, other metros are mobilizing voters at a faster rate.
About: This metric measures the percentage of the voting-eligible population that participated in recent general elections. Definition: Turnout is calculated as the total number of ballots cast divided by the estimated population eligible to vote. It serves as a primary indicator of social capital, political participation, and community involvement.
• Raleigh emerged as the new market leader in 2024, surging to No. 1 with a turnout rate approaching 80%, overtaking traditional strongholds like Minneapolis (which peaked in 2020). Conversely, San Antonio consistently anchored the bottom of the cohort (No. 20), with participation struggling to break 60% (approx. 58% in 2024), highlighting a persistent engagement gap compared to the most active metros.
Civic Engagement Rates (Voter Turnout)
About: This metric measures the percentage of the voting-eligible population that participated in recent general elections. Definition: Turnout is calculated as the total number of ballots cast divided by the estimated population eligible to vote. It serves as a primary indicator of social capital, political participation, and community involvement. Source: Voter Turnout Rates Among Metropolitan Statistical Areas, UFElectionLab
Premature Death
• Premature death is rising across almost all MSAs. From 2015 to 2024, average premature death generally trends upward, indicating worsening early mortality over time rather than improvement.
- Premature death is rising across almost all MSAs From 2015 to 2024, average premature death generally trends upward, indicating worsening early mortality over time rather than improvement
Premature Death
- Tampa Bay is consistently a high-mortality MSA Tampa Bay’s premature death rate is in the mid-7,000s in 2015 and rises to the high-8,000s by 2024, placing it regularly among the 3–5 worst MSAs in this peer group (alongside Jacksonville, St Louis and Baltimore) - Large gaps between best and worst performers Healthier metros like Austin, San Diego, Minneapolis and Seattle have substantially lower premature death (around the 4 700–5 700 range) while higher-mortality metros like Jacksonville and St Louis are well above 9 000 in recent years highlighting big regional disparities in early mortality risk
• Tampa Bay is consistently a high-mortality MSA. Tampa Bay’s premature death rate was in the mid-7,000s in 2015 and rose to the high-8,000s by 2024, placing it regularly among the three to five worst MSAs in this peer group (alongside Jacksonville, St. Louis and Baltimore).
• Large gaps exist between best and worst performers. Healthier metros like Austin, San Diego, Minneapolis and Seattle have substantially lower premature death (around the 4,700–5,700 range), while higher-mortality metros like Jacksonville and St. Louis are well above 9,000 in recent years, highlighting big regional disparities in early mortality risk.
About: Premature Death measures early mortality as the average years of potential life lost (YPLL) before age 75 per 100,000 population (age-adjusted). Higher values mean that, on average, people in that MSA are losing more years of life due to deaths occurring before age 75, so lower is better. The value for 2023 is an estimate, because County Health Rankings data for that year are not yet available; it has been approximated based on recent trends. Source: County Health Rankings & Roadmaps (CHR) – Indicator: “Premature Death (Years of Potential Life Lost before age 75 per 100,000 population, age-adjusted)”.
Students Under the Free and ReducedPrice Lunch Program
(2017–2024)
• Free and Reduced Price Lunch (FRLP) participation varies substantially across benchmark MSAs, with larger metros such as Houston, Dallas, and Atlanta consistently reporting the highest number of eligible students, reflecting both population size and underlying economic conditions.
• Tampa Bay remains a mid-tier region in absolute FRPL counts, tracking closely with peers such as Phoenix and San Antonio across most years, without extreme spikes or collapses.
• Time-series trends show gradual increases in FRPL participation for many MSAs over the long run, with noticeable disruptions around 2020–2021, consistent with pandemic-era economic shocks and reporting changes.
• Competitive ranking trends indicate that Tampa Bay’s relative position among benchmark regions has remained broadly stable over time, suggesting that changes in FRPL participation have largely mirrored national and peer-region dynamics rather than reflecting uniquely local shifts.
About: This indicator measures the total number of students eligible for the Free and Reduced-Price Lunch (FRPL) program within each Metropolitan Statistical Area (MSA). FRPL eligibility is commonly used as a proxy for economic disadvantage among school-aged populations. Data are reported at the school level and aggregated to counties, then translated to MSAs for regional comparison across benchmark regions. Sources: National Center for Education Statistics (NCES), Common Core of Data (CCD), Free and Reduced-Price Lunch Program files. Data were sourced directly from NCES CCD school-level datasets and aggregated using NCES Geographic Relationship Files (GFR), county-to-MSA crosswalks, and internal data processing workflows.
Year
Cumulative Yearly Growth: Taxpaying Population
Cumulative yearly Growth: Taxpaying Population
• Tampa Bay demonstrates a remarkable “acceleration and sustain” migration pattern. Starting from a mid-tier position (No. 13) in 2014, the region rapidly gained momentum, surging to No. 2 by 2022. Unlike markets that experienced volatile fluctuations, Tampa Bay’s taxpaying population growth has been consistent and robust, achieving a cumulative growth index of approximately 117.5 (relative to the baseline). This trajectory indicates that the region has successfully transitioned from a secondary migration target to a primary destination, outpacing traditionally strong magnets like Austin and Nashville in the most recent rankings.
Tampa Bay demonstrates a remarkable "acceleration and sustain" migration pattern. Starting from a mid-tier position (Rank 13) in 2014, the region rapidly gained momentum, surging to Rank 2 by 2022. Unlike markets that experienced volatile fluctuations, Tampa Bay’s taxpaying population growth has been consistent and robust, achieving a cumulative growth index of approximately 117.5 (relative to the baseline). This trajectory indicates that the region has successfully transitioned from a secondary migration target to a primary destination, outpacing traditionally strong magnets like Austin and Nashville in the most recent rankings. Orlando maintains the cohort dominance while legacy metros stagnate. Orlando consistently anchored the top spot (Rank 1), setting the benchmark for the cohort with cumulative growth approaching 120 index points. In sharp contrast, St. Louis, Baltimore, and Chicago have consistently anchored the bottom of the rankings (Ranks 18–20). These metros show cumulative indices near or below 100, indicating net stagnation or contraction in their taxpaying base over the decade.
• Orlando maintains the cohort dominance while legacy metros stagnate. Orlando consistently anchored the top spot (No. 1), setting the benchmark for the cohort with cumulative growth approaching 120 index points. In sharp contrast, St. Louis, Baltimore, and Chicago have consistently anchored the bottom of the rankings (Nos. 18–20). These metros show cumulative indices near or below 100, indicating net stagnation or contraction in their taxpaying base over the decade.
About: This metric measures the cumulative growth of the taxpaying population within the metropolitan area. Definition: The index is calculated using the total number of individuals (tax filers and dependents) reported on federal income tax returns, normalized to a base year to track relative momentum. It serves as a robust proxy for economic migration, regional attractiveness, and household retention. Source: Internal Revenue Service (IRS), Statistics of Income (SOI) Division.
About: This metric measures the cumulative growth of the taxpaying population within the metropolitan area. Definition: The index is calculated using the total number of individuals (tax filers and dependents) reported on federal income tax returns, normalized to a base year to track relative momentum. It serves as a robust proxy for economic migration, regional attractiveness, and household retention. Source: Internal Revenue Service (IRS), Statistics of Income (SOI) Division.
Tampa Bay’s per-capita
Real GDP Per Capita in Accommodation &
Services Industry
2023, with a sharp pandemic decline in 2020 followed by partial recovery through 2023 - Orlando and Miami consistently lead all comparison MSAs reflecting their strong tourism-driven economies large
spending producing per-capita values that are more than double those of many peers
- Every metro experienced a significant drop in 2020 mirroring national
Real GDP Per Capita in Accommodation and
Food Services Industry
• Tampa Bay’s per capita output in accommodation and food services has remained relatively stable over the decade, moving from about $1,747 in 2013 to $1,645 in 2023, with a sharp pandemic decline in 2020 followed by partial recovery through 2023.
and
• Orlando and Miami consistently lead all comparison MSAs, reflecting their strong tourism-driven economies, large hospitality workforces, and high visitor spending — producing per capita values that are more than double those of many peers.
• Every metro experienced a significant drop in 2020, mirroring national shutdowns in travel, restaurants, and lodging; however, most regions have rebounded, though few have returned fully to pre-pandemic productivity levels.
About: This indicator measures the inflation-adjusted Real GDP per capita generated by the Accommodation and Food Services sector (NAICS 72) in each metropolitan area. Because the measure is per capita, it reflects the intensityof hospitality-sector economic activity relative to the local population, not the total size of the tourism industry. Source: U.S. Bureau of Economic Analysis (BEA), Real GDP by Metropolitan Area, Table CAGDP9 — Real GDP by Industry (NAICS 72).
Real GDP Per Capita in Arts, Entertainment
- Tampa Bay’s per-capita GDP in arts and entertainment has steadily recovered after the sharp 2020 downturn, rising from $479 in 2020 to $668 in 2023, marking its strongest performance in the past decade but still below top-performing metros - Orlando consistently leads all MSAs by a wide margin, with per-capita values above $2,300 in 2023 more than triple most other metros reflecting its unique concentration of theme parks, attractions, and large-scale entertainment industries - Most MSAs show a similar trend of pandemic-driven contraction in 2020, followed by progressive rebounds through 2023, though recovery levels vary depending on the region’s dependence on tourism and leisure activity
and Recreation Industry
• Tampa Bay’s per capita GDP in arts and entertainment has steadily recovered after the sharp 2020 downturn, rising from $479 in 2020 to $668 in 2023, marking its strongest performance in the past decade but still below top-performing metros.
• Orlando consistently leads all MSAs by a wide margin, with per capita values above $2,300 in 2023 — more than triple most other metros — reflecting its unique concentration of theme parks, attractions, and large-scale entertainment industries.
• Most MSAs show a similar trend of pandemic-driven contraction in 2020, followed by progressive rebounds through 2023, though recovery levels vary depending on the region’s dependence on tourism and leisure activity.
About: This indicator measures the inflation-adjusted Real GDP per capita generated by the Arts, Entertainment, and Recreation sector (NAICS 71) in each metropolitan area. Because values are per capita, the indicator reflects the relativeintensityof arts and recreation economic activity compared to population size rather than the sheer scale of the regional entertainment industry. Source: U.S. Bureau of Economic Analysis (BEA), Real GDP by Metropolitan Area, Table CAGDP9 — Real GDP by Industry (NAICS 71).
Section 3.3: Foundational Stability
Foundational stability reflects the conditions that allow households to meet basic needs and avoid crisis. It encompasses economic security, health, and safety, factors that shape whether individuals and families can sustain daily life without persistent vulnerability. These indicators focus on how economic growth is experienced at the household level, particularly among populations most sensitive to shifts in cost, coverage, and access. Metrics are framed as measures of community well-being, as in fulfillment of needs.
Across the region, a substantial share of residents continue to live near or below key economic thresholds. Measures such as the percentage of the population living below 200 percent of the poverty level, the presence of full-time workers earning incomes insufficient to escape poverty, and poverty rates among children and older adults point to ongoing financial precarity even among those connected to the labor market. Reliance on public assistance and Social Security income further underscores the extent to which household stability depends on formal safety nets rather than earned income alone.
Health and coverage indicators reinforce these patterns. Rates of uninsured adults age 65 and older, access constraints reflected in HRSA designations, and measures of premature death suggest that economic vulnerability is closely tied to health outcomes and longevity. These indicators do not assess the performance of healthcare systems directly, but rather, they highlight whether residents are able to access care and maintain health as a basic condition of stability, particularly as they age.
Safety conditions also play a role in shaping foundational stability. Road safety indicators capture everyday risks that affect mobility, employment, and quality of life, especially for households with limited flexibility or access to alternative transportation. While often overlooked, these risks compound other forms of vulnerability by increasing the likelihood of injury, financial strain, or long-term disruption.
These indicators illustrate that foundational stability in the region is unevenly distributed. Economic participation alone does not guarantee security, and gains in aggregate performance do not automatically translate into improved living conditions for all residents. Understanding these baseline conditions is fundamental for interpreting downstream outcomes related to housing, opportunity, and overall quality of life.
Key Insights Foundational Stability
Overall Takeaway:
Economic security, health, and access to basic services remain critical foundations of quality of life, with notable variation across age and income groups.
Highlights
• Poverty remains a concern: Poverty affects multiple life stages in the region, including children, working-age adults, and some individuals who worked full-time during the year, indicating persistent economic vulnerability despite labor force attachment.
• Age-related risk: Older adults face elevated economic risk, with higher poverty rates and a greater reliance on Social Security income, reflecting financial pressure among fixedincome households.
• Health and access: Health outcomes and access to care vary across the region, as reflected in differences in premature death rates, disability employment, insurance coverage, and the availability of health resources.
• Digital access as a necessity: A meaningful share of households lack internet subscriptions, creating barriers to employment, education, health services, and access to public resources.
- Since 2013, Tampa Bay has remained in the middle tier among all MSAs, showing moderate improvement in reducing income vulnerability but continued affordability challenges for low- and moderate-income households
• Since 2013, Tampa Bay has remained in the middle tier among all MSAs, showing moderate improvement in reducing income vulnerability but continued affordability challenges for low- and moderate-income households.
- The share of the population below 200% of the poverty level declined steadily through 2024, suggesting gradual economic recovery and job market strengthening - However, Tampa Bay lags behind high-performing metros such as Austin, Denver, and Seattle, which consistently rank among the lowest in poverty exposure, indicating stronger wage growth and affordability balance in those regions
• The share of the population below 200% of the poverty level declined steadily through 2024, suggesting gradual economic recovery and job market strengthening.
- Despite progress Tampa Bay’s ranking position remains below average pointing to persistent gaps in wage equity and cost-of-living alignment compared to peer MSAs
Percentage of Population Below 200% of the Poverty Level
• However, Tampa Bay lags behind high-performing metros such as Austin, Denver, and Seattle, which consistently rank among the lowest in poverty exposure, indicating stronger wage growth and affordability balance in those regions.
• Despite progress, Tampa Bay’s ranking position remains below average, pointing to persistent gaps in wage equity and cost-of-living alignment compared to peer MSAs.
About: This indicator measures the proportion of individuals whose income is below 200% of the federal poverty threshold, offering a broader view of households at risk of financial instability. It reflects both income distribution and the cost-of-living burden within each MSA. Source: U.S. Census Bureau, American Community Survey (ACS), Table B17002: Ratio of Income to Poverty Level in the Past 12 Months.
Poverty Rate Among Children (Ages 0–17)
- Tampa Bay has made steady progress in reducing child poverty, declining from roughly 18% in 2013 to about 12% in 2024
• Tampa Bay has made steady progress in reducing child poverty, declining from roughly 18% in 2013 to about 12% in 2024.
- Houston, San Antonio, and Miami continue to report the highest levels of child poverty among the comparison metros, generally ranging from 15 to 19% over the past decade These sustained mid- to upper-teen levels highlight persistent affordability challenges and deeper income disparities that place greater strain on families with children
- Minneapolis, Denver, Seattle, and Austin consistently maintain the lowest child poverty rates, typically falling between 8 and 14% These metros operate in the high-single-digit to low-double-digit range, supported by stronger labor markets, higher household incomes, and expanded access to economic and social resources that reduce hardship among families with children
Poverty Rate Among Children (Ages
0–17)
• Houston, San Antonio, and Miami continue to report the highest levels of child poverty among the comparison metros, generally ranging from 15 to 19% over the past decade. These sustained mid- to upper-teen levels highlight persistent affordability challenges and deeper income disparities that place greater strain on families with children.
• Minneapolis, Denver, Seattle, and Austin consistently maintain the lowest child poverty rates, typically falling between 8 and 14%. These metros operate in the high-single-digit to low-double-digit range, supported by stronger labor markets, higher household incomes, and expanded access to economic and social resources that reduce hardship among families with children.
About: This indicator measures the percentage of children under age 18 living in households with incomes below the federal poverty line. Higher child poverty rates can reflect limited household earnings, rising living costs that outpace family income, and broader economic pressures affecting access to stable housing, childcare, healthcare, and educational opportunities. Sources: U.S. Census Bureau, American Community Survey (ACS) 1-Year Estimates, Table B17020: Poverty Status in the Past 12 Months by Age, 2013–2024.
Poverty Rate Among Older Adults (Ages 60 and Over)
- Tampa Bay’s older adult poverty rate has steadily improved over the decade, falling from about 14 0% in 2013 to 10 5% in 2024 Much of this progress occurs after 2017 reflecting stronger retirement security rising household incomes and a gradually improving economic environment for older residents
• Tampa Bay’s older adult poverty rate has steadily improved over the decade, falling from about 14.0% in 2013 to 10.5% in 2024. Much of this progress occurs after 2017, reflecting stronger retirement security, rising household incomes, and a gradually improving economic environment for older residents.
- Houston, Miami, and San Antonio report the highest older adult poverty levels in 2024, with rates of 11 8%, 11 7%, and 11 5%, respectively These metros tend to experience higher living costs larger low-income retiree populations and greater exposure to economic pressures that disproportionately affect fixed-income households
- Denver, Minneapolis, Seattle, and Dallas consistently remain at the lower end of older adult poverty, recording 7 5%, 7 8%, 8 1%, and 8 2% in 2024 These regions generally benefit from stronger local economies, higher retirement savings, and broader access to supportive services that help reduce economic vulnerability among older adults
Poverty Rate Among Older Adults (Ages
60 and Over)
• Houston, Miami, and San Antonio report the highest older adult poverty levels in 2024, with rates of 11.8%, 11.7%, and 11.5%, respectively. These metros tend to experience higher living costs, larger low-income retiree populations, and greater exposure to economic pressures that disproportionately affect fixed-income households.
• Denver, Minneapolis, Seattle, and Dallas consistently remain at the lower end of older adult poverty, recording 7.5%, 7.8%, 8.1%, and 8.2% in 2024. These regions generally benefit from stronger local economies, higher retirement savings, and broader access to supportive services that help reduce economic vulnerability among older adults.
About: This indicator measures the percentage of adults age 60 and older whose household incomes fall below the federal poverty line. Elevated older-adult poverty rates may indicate limited retirement savings, high medical or housing costs, gaps in social support systems, and greater financial vulnerability among residents living on fixed or declining incomes. Sources: U.S. Census Bureau, American Community Survey (ACS) 1-Year Estimates, Table B17020: Poverty Status in the Past 12 Months by Age, 2013–2024.
Percentage of Households Receiving Social Security Income
- Tampa Bay consistently reports one of the highest percentages of households with Social Security income among
the decade This reflects the area’s large retiree population and its continued role as a preferred destination for older adults - Miami and Jacksonville also show relatively high proportions of households with Social Security income, indicating similar demographic structures with a
• Tampa Bay consistently reports one of the highest percentages of households with Social Security income among all MSAs, maintaining levels around 38–40% over the decade. This reflects the area’s large retiree population and its continued role as a preferred destination for older adults.
- In contrast, Austin, Dallas, and Raleigh-Durham record the lowest percentages, reflecting younger, more workforce-oriented populations and rapidly growing economies driven by employment rather than retirement income
Percentage of Households Receiving Social Security Income
• Miami and Jacksonville also show relatively high proportions of households with Social Security income, indicating similar demographic structures with a significant aging population.
• In contrast, Austin, Dallas, and Raleigh-Durham record the lowest percentages, reflecting younger, more workforce-oriented populations and rapidly growing economies driven by employment rather than retirement income.
Security Income
Competitve Position Trend
About: This indicator represents the percentage of households receiving Social Security income across selected MSAs. It reflects the demographic and economic composition of each region, particularly the proportion of older residents and retirees who rely on federal benefits as part of their household income. Sources: U.S. Census Bureau, American Community Survey (ACS), Table B19055.
Percentage of Households Receiving Public Assistance Income
• Tampa Bay shows a gradual decline in households receiving public assistance, from roughly 15% in 2013 to just over 10% in 2024. This suggests moderate improvement in economic stability and reduced dependency on public aid across the region.
• Miami and Orlando report slightly higher levels of public assistance participation compared to other Florida MSAs, likely reflecting regional cost-of-living pressures and demographic differences.
• Austin, Raleigh-Durham, and Dallas maintain the lowest percentages, indicating stronger economic growth and lower reliance on income assistance programs, whereas Baltimore and Portland show fluctuating trends with temporary increases during economic disruptions.
About: This indicator represents the percentage of households receiving public assistance income across selected MSAs. It reflects the economic vulnerability within communities and provides insight into the extent of income support reliance among households, particularly in regions facing higher living costs or limited access to stable employment. Source: U.S. Census Bureau, American Community Survey (ACS), Table B19058: Public Assistance Income in the Past 12 Months for Households.
improvements by 2024
Percentage of Adults Age 65+ without Health Insurance
Percentage of Uninsured Adults Age 65+
• The uninsured rate for adults age 65+ in Tampa Bay has remained consistently low, dropping from 1.05% in 2013 to 0.78% in 2024. Tampa Bay’s ranking improved steadily over the decade, placing it among the top-performing MSAs in recent years, highlighting strong Medicare coverage and access to care for seniors.
• Minneapolis and St. Louis recorded the lowest uninsured rates across most years, often below 0.5%, ranking them consistently at the top for senior health insurance coverage.
• In contrast, Miami and Houston demonstrated the highest uninsured rates — above 3% in early years — placing them at the bottom of the rankings despite notable improvements by 2024.
Percentage of Uninsured Adults Age 65+
About: The Uninsured Adults Age 65+ indicator measures the share of seniors who lack health insurance coverage within each MSA. Because most adults age 65 and older qualify for Medicare, this metric typically remains low and reflects the effectiveness of healthcare access, enrollment support, and regional senior services. Lower values indicate better access to care and stronger coverage stability. Sources: U.S. Census Bureau, American Community Survey (ACS),
Table S2701: Selected Characteristics of Health Insurance Coverage in the United States, 2013–2024.
HRSA Financial Assistance (2015–2025)
- Total HRSA assistance varies widely across the 20 benchmark MSAs, with major hubs like Atlanta, Austin, Miami, and Dallas consistently receiving the largest allocations throughout the decade
- Tampa Bay’s assistance levels remain mid-tier relative to peer metros, following a steady long-term trajectory with a noticeable peak around 2021 before moderating in subsequent years
• Total HRSA assistance varies widely across the 20 benchmark MSAs, with major hubs like Atlanta, Austin, Miami, and Dallas consistently receiving the largest allocations throughout the decade.
- Rankings highlight Tampa Bay’s stable competitive position; the region improved gradually through the late 2010s, experienced a temporary boost in 2021, and then settled into a consistent mid-range ranking as other metros saw larger year-over-year gains
- Overall, federal financial assistance into major MSAs shows a clear surge during 2020–2021 followed by normalization, reflecting national patterns tied to pandemic-era funding and subsequent stabilization
HRSA Financial Assistance (2015–2025)
2021 2023 2025
• Tampa Bay’s assistance levels remain mid-tier relative to peer metros, following a steady longterm trajectory with a noticeable peak around 2021 before moderating in subsequent years.
• Rankings highlight Tampa Bay’s stable competitive position; the region improved gradually through the late 2010s, experienced a temporary boost in 2021, and then settled into a consistent mid-range ranking as other metros saw larger year-over-year gains.
• Overall, federal financial assistance into major MSAs shows a clear surge during 2020–2021 followed by normalization, reflecting national patterns tied to pandemic-era funding and subsequent stabilization.
HRSA awards and SOTR’s 20-MSA county mapping
About: This indicator reflects total annual federal financial assistance awarded through the Health Resources and Services Administration (HRSA). Values represent aggregated funding amounts at the Metropolitan Statistical Area (MSA) level for the 20 benchmark regions used in the State of the Region framework. Sources: HRSA, Federal Assistance Awards Database (2015–2025). Data aggregated to the MSA level based on county-level HRSA awards and SOTR’s 20-MSA county mapping.
Deaths/Injury Due to Road Accidents
Deaths/Injury due to road accidents
Tampa Bay faces an entrenched road safety crisis, effectively "locking in" a position at the bottom of the competitive cohort (Rank 19). The region forms a distinct high-risk cluster alongside Jacksonville and Orlando, suggesting a systemic infrastructure vulnerability unique to these Florida metros. While the mortality rate surged from a baseline of ~12 per 100k in 2013 to a peak of nearly 18 in 2016, the subsequent leveling off at ~16.5 (2020) represents a dangerous new normal rather than a recovery. This stagnation leaves Tampa Bay residents facing more than double the statistical risk of those in best-in-class metros like Minneapolis and Seattle (~4–6 per 100k). Ultimately, the region’s inability to break this "bottom-tier" ceiling—even as other markets fluctuate—highlights a critical disconnect between regional growth and infrastructure safety resilience.
About: This metric measures the crude rate of fatal transport accidents within the metropolitan area. Definition: The rate is calculated as the number of deaths resulting from motor vehicle and transport accidents per 100,000 population, serving as a key indicator of infrastructure safety and public health. Source: Centers for Disease Control and Prevention (CDC), Wide-ranging Online Data for Epidemiologic Research (WONDER) – Underlying Cause of Death.
• Tampa Bay faces an entrenched road safety crisis, effectively “locking in” a position at the bottom among peers (No. 19). The region forms a distinct high-risk cluster alongside Jacksonville and Orlando, suggesting a systemic infrastructure vulnerability unique to these Florida metros. While the mortality rate surged from a baseline of ~12 per 100,000 in 2013 to a peak of nearly 18 in 2016, the subsequent leveling off at ~16.5 (2020) represents a dangerous new normal rather than a recovery. This stagnation leaves Tampa Bay residents facing more than double the statistical risk of those in best-in-class metros like Minneapolis and Seattle (~4–6 per 100,000). Ultimately, the region’s inability to break this “bottom-tier” ceiling — even as other markets fluctuate — highlights a critical disconnect between regional growth and infrastructure safety resilience.
Deaths/Injury due to road accidents
About: This metric measures the crude rate of fatal transport accidents within the metropolitan area. Definition: The rate is calculated as the number of deaths resulting from motor vehicle and transport accidents per 100,000 population, serving as a key indicator of infrastructure safety and public health. Source: Centers for Disease Control and Prevention (CDC), Wide-ranging Online Data for Epidemiologic Research (WONDER) – Underlying Cause of Death.