4 minute read
U Researchers Help Create the Largest 3D Map of the Universe


Jordan Raddick, SDSS public information officer
“We know both the ancient history of
the universe and the recent expansion history fairly well, but there’s been a troublesome gap in the middle 11 billion years,” said cosmologist Kyle Dawson of the University of Utah. “For five years, we have worked to fill in that gap, and we are using that information to provide some of the most substantial advances in cosmology in the last decade.”
Dawson has led a team from multiple universities associated with the Sloan Digital Sky Survey (SDSS), a decades long project that uses multi-spectral imaging and spectroscopic techniques to chart the skies. (The survey is named for the Alfred P. Sloan Foundation, which has been a major source of funding.) SDSS has a number of component surveys, including the extended Baryon Oscillation Spectroscopic Survey (eBOSS) to which Dawson has contributed. An international collaboration of more than 100 astrophysicists, eBOSS, together with SDSS as a whole, recently announced the creation of the largest, most detailed 3D map of the universe so far.
We know what the universe looked like in its infancy thanks to thousands of scientists from around the world who have measured the relative amounts of
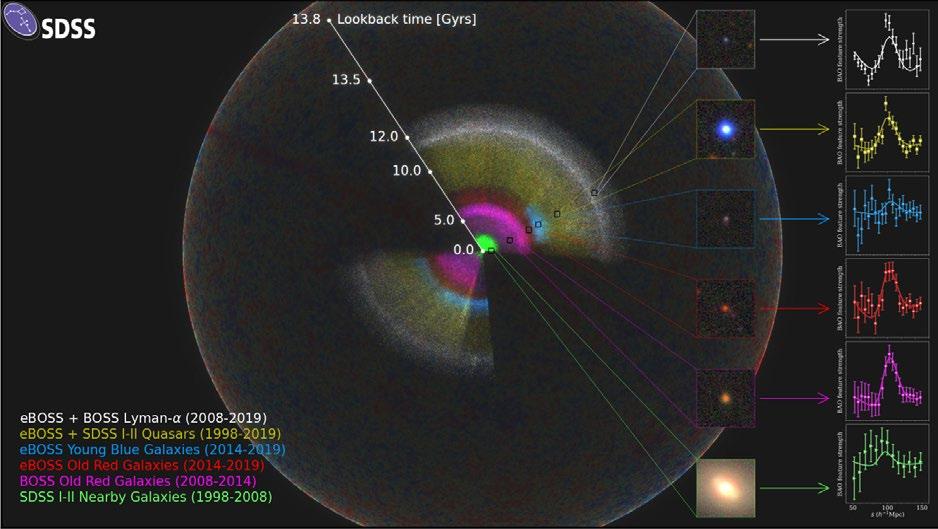
PHOTO CREDIT: Anand Raichoor (EPFL), Ashley Ross (Ohio State University) and SDSS
The SDSS map is shown as a rainbow of colors, located within the observable universe (the outer sphere, showing fluctuations in the Cosmic Microwave Background). We are located at the center of this map. The inset for each color-coded section of the map includes an image of a typical galaxy or quasar from that section, and also the signal of the pattern that the eBOSS team measures there. The bump visible in each panel is at the characteristic scale of about 500 million lightyears. As we look out in distance, we look back in time. So, the location of these signals reveals the expansion rate of the universe at different times in cosmic history.
elements created soon after the Big Bang and who have studied the Cosmic Microwave Background. We also know its expansion history over the last few billion years from galaxy maps and distance measurements, including those from previous phases of the SDSS.
“The analyses have also provided measurements on how the diverse structures in the universe grow over time,” says Zheng Zheng, professor of physics and astronomy at the University of Utah. “The story underneath the structure growth is amazingly consistent with what we learn from the expansion history.”
The final map is shown in the image on page 2. A close look reveals the filaments and voids that define the structure in the universe, starting from the time when it was only about 300,000 years old. From this map, researchers measured patterns in the distribution of galaxies, which gave several key parameters of the universe to better than 1% accuracy. The signals of these patterns are shown in the insets in the accompanying image.
The map represents the combined effort of hundreds of scientists mapping the universe using the Sloan Foundation telescope for nearly twenty years. The cosmic history showed that about six billion years ago, the expansion of the universe began to accelerate, and has continued to get faster and faster ever since. This accelerated expansion seems to be due to a mysterious invisible component of the universe called “dark energy,” consistent with Einstein’s General Theory of Relativity, but extremely difficult to reconcile with our current understanding of particle physics.
Combining observations from eBOSS with studies of the universe in its infancy revealed cracks in this picture of the universe. In particular, the eBOSS team’s measurement of the current rate of expansion of the universe (the “Hubble Constant”) was about 10% lower than the value found from distances to nearby galaxies. The high precision of the eBOSS data means that it is highly unlikely that this mismatch was due to chance, and the rich variety of eBOSS data gave us multiple independent ways to draw the same conclusion.
“Imprinted in the galaxy or quasar distribution is a particular pattern that serves as a ruler,” said Zheng. “With eBOSS maps, such a ruler has achieved its best-ever performance and enabled us to measure distances with unprecedented precision, which makes it possible to most clearly reveal the mismatch in the Hubble Constant.”
There is no broadly accepted explanation for this discrepancy in measured expansion rates, but one exciting possibility is that a previously unknown form of matter or energy from the early universe might have left a trace on our history.
In total, the eBOSS team made the results from more than 20 scientific papers public today. Those papers describe, in more than 500 pages, the team’s analyses of the latest eBOSS data, marking the completion of the key goals of the survey.
The University of Utah has been a key contributor to SDSS over the last decade. The massive samples of spectroscopic data that went into the final eBOSS cosmological result were processed and located at the U, within the Science Archive Server hosted by the U’s Center for High-Performance Computing.
“We have made a series of developments in the data analysis, leading to greater precision in the cosmological map. This team effort was made possible by our cutting-edge science archive system. The final eBOSS data products will remain a legacy, helpful to a broad range of users, from young students to amateur and professional astronomers,” says SDSS-IV science archive scientist Joel Brownstein, research associate professor at the U.
Within the eBOSS team, individual groups at universities around the world focused on different
Continued on page 5


